Content:
Presentation type:
HS – Hydrological Sciences

EGU23-1844 | Orals | MAL15 | Henry Darcy Medal Lecture

Global Water Resources and the Limits to Groundwater Use 

Marc Bierkens

Humans have impacted the hydrological cycle since the invention of agriculture, but these impacts have grown to global proportions over the last 60 years. The indirect effects of anthropogenic climate change may be the largest, but the direct impacts by dam building, water withdrawals and the emission of pollutants is still formidable, even by comparison. In the first part of this lecture, I will briefly go over the impacts of human water use on global hydrology and water resources and how these impacts have been assessed by observational evidence and global hydrological models. This will also provide the opportunity to highlight some recent advancements in global hydrological modelling. The second part of the lecture will focus on the impacts of human water use on groundwater resources. After reviewing past assessments of global groundwater depletion rates, I will show results of ongoing research in our group on the limits to global groundwater use. These include: physical limits, related to groundwater-surface water interaction, permeability constraints and salinity; economic limits, related to the costs of groundwater extraction when wells become deeper; and ecological limits, related to the impacts of groundwater extraction on groundwater dependent ecosystems.

How to cite: Bierkens, M.: Global Water Resources and the Limits to Groundwater Use, EGU General Assembly 2023, Vienna, Austria, 23–28 Apr 2023, EGU23-1844, https://doi.org/10.5194/egusphere-egu23-1844, 2023.

EGU23-4076 | Orals | MAL17 | John Dalton Medal Lecture

Evolution of Global Hydrology in the Anthropocene 

Taikan Oki

Until the 1970s, global hydrology had to rely on the collection of in-situ observational data and aggregation under condition when electronic computers were not sufficiently available. In the 1980s, earth observation data from artificial satellites began to observe clouds, precipitation, and later surface soil moisture content, and from the beginning of the 21st century, total terrestrial water storage, including groundwater and ice sheets. Along with this, data assimilation systems merging simulated forecasts by numerical models of the atmosphere and in-situ and satellite observations have been developed, and the information on global hydrologic cycles, at least regarding the atmosphere, has become available.

When we applied the atmospheric water balance method to the four-dimensional data assimilation (4DDA) data and compared it with the discharge of major rivers around the world, we found that the seasonal variation was captured well, although the quantitative accuracy was not sufficient. Seasonal variations in total terrestrial water storage are very large in the Amazon Basin and cannot be explained by changes in soil moisture alone. It was suggested that the changes in river water stored in the river channel contributed greatly, but it was necessary to wait until later GRACE observation data were available to obtain conclusive evidence.

In addition, when the atmospheric water balance method is applied, negative runoff is calculated in some regions and seasons, and at first it was thought to be an error in data and the data processing, and an ad hoc correction method was attempted. However, even from the composite of in-situ discharge data, some areas were found where the downstream river discharge was smaller than the upstream, and negative runoff should be estimated. Then, it became apparent that the negative runoff should be mainly due to anthropogenic water withdrawals and consumption, it is necessary to consider human activities in research targeting the actual water cycle, and such interventions can be detected even on a global scale.

Then, starting with storing in and releasing from reservoirs, an integrated water cycle and water resources model that considers human activities such as water withdrawals from rivers and groundwater, irrigation for farmlands, and long-distance water transport through canals has been developed and used. Although such a model was initially for a global scale, it can be applied for local simulation of hydrologic cycles in the Anthropocene considering water supply and sewerage systems and contribute to supporting scientific evidence-based decision makings.

Improvements in observational and computational capabilities alone did not support the development of global hydrology. In addition to the numerical model itself, it should be acknowledged to the development and sharing of critical global data such as topography, land use and land cover, and cropland distribution equipped for irrigation that are essential for proper simulation of the model. Global hydrology is a community-supported discipline and the gift of grassroots solidarity among researchers around the world.

How to cite: Oki, T.: Evolution of Global Hydrology in the Anthropocene, EGU General Assembly 2023, Vienna, Austria, 23–28 Apr 2023, EGU23-4076, https://doi.org/10.5194/egusphere-egu23-4076, 2023.

EGU23-11454 | Orals | HS5.16 | HS Division Outstanding Early Career Scientist Award Lecture

Groundwater availability and sustainability 

Inge de Graaf

Groundwater is het largest available freshwater resource on earth and is critical to humans and the environment. Groundwater is especially important for irrigated agriculture, and thus for global crop production and food security; approximately 40% of the today’s irrigated agriculture depends on groundwater. In many regions around the world, unsustainable groundwater pumping exceeds recharge from precipitation and rivers. This leads to substantial drops in groundwater levels and losses of groundwater from its storage, especially in intensively irrigated regions, as well as reduction of river flows with possible devastating impacts on freshwater ecosystems.

In my research I simulate groundwater flows and groundwater surface water interactions globally, using a high resolution coupled groundwater and surface water model, and study the impacts of groundwater pumping from the recent past until the far future. In this talk I will present recent findings on current and projected impacts of groundwater pumping on river flows, including an estimate where and when environmentally critical thresholds for groundwater discharge are reached. Second, I will present novel developments and future research steps me and my team will take towards estimating global groundwater availability that can be sustainably exploited and the trade-off between sustainable groundwater use and crop production.

How to cite: de Graaf, I.: Groundwater availability and sustainability, EGU General Assembly 2023, Vienna, Austria, 23–28 Apr 2023, EGU23-11454, https://doi.org/10.5194/egusphere-egu23-11454, 2023.

HS1.1 – Hydrological Sciences for Policy and Society

Accelerated climate, environmental and societal change and its dynamics challenge the resilience of complex socio-ecological systems and require constant adaptation. It also requires to better integrate uncertainties into the decision-making process. By comparing two case studies in Tanzania and Germany with different foci in human-water interaction and socio-political backgrounds, patterns of decision-making under uncertainty are identified. Using a (semi)participatory qualitative system analysis approach helps identifying the heterogeneity of actors and their specific ways of reasoning. For example, in the case studies the perception of change and uncertainty differed between the stakeholders and were identified as important drivers for different decision rationales and hence different preferred adaptation strategies. While research in reducing environmental uncertainty through e.g. improved physical understanding and models is important, it is only on side of the equation in complex socio-ecological systems. Especially, the interplay of environmental and socio-economic uncertainty and how this uncertainty loop creates different rooms of action and agency is worth considering. The comparison shows that acknowledging heterogeneity is important across regions and water management issues and supports in developing tailor-made adaptation strategies targeting the environmental issue. Additionally, the approach empowers and enables actors to increase their room of action and adaptation capacity by acknowledging their uncertainty perception.

How to cite: Höllermann, B.: Impact of interplay of perceived environmental and socio-political uncertainties on adaptation decisions, EGU General Assembly 2023, Vienna, Austria, 23–28 Apr 2023, EGU23-206, https://doi.org/10.5194/egusphere-egu23-206, 2023.

EGU23-409 | ECS | PICO | HS1.1.3

Simulating the effects of sea level rise and soil salinization on migration and adaptation in coastal Mozambique 

Kushagra Pandey, Jens de Bruijn, Hans de Moel, and Jeroen Aerts

Sea level rise (SLR) causes increasing salt deposition in the soil and groundwater of coastal regions. This will affect coastal farmers, since salinity levels will reduce crop yield, which leads to loss in net annual income of farmer communities. To minimize the impacts and income loss, farmers often adopt adaptation measures, such as irrigation, adding manure and gypsum, switching to salt tolerant crops, or buying less saline lands. When these options are not feasible,  farmers may migrate to inland areas to minimize future impacts and damages.

We adopt an agent-based model (ABM) to simulate adaptation and migration decisions by farmers in Mozambique under sea level rise. . The ABM is coupled to a salinization module for simulating the relation between soil salinity and sea level rise. The decision rules in the model (DYNAMO-M) are grounded in economic theory of subjected expected utility where household maximize their welfare by deciding 1) to stay and face loss from salinization and flooding, 2) stay and adapt (irrigation or buy land) or 3) migrate to safer inland areas. The model runs with a yearly timestep (2020-2100) for simulating salinity levels, but accounts for dynamics in the growing season. (Future-) soil salinity levels are derived from ISRIC (2012) and Hassani et al. (2020). Projections in salinity levels are converted into (reduced-) yield levels following Maas and Hoffman (1977). Country statistics and census data are then used to estimate farmers income from expected yields. The model finally simulates adaptation decisions based on the cost (expected yield loss + adaptation investments) against the benefit (expected yield). Results show how many farming households have stayed with the damage, adapted with a measure, and migrated to inland areas over time and space.  


Keywords: sea level rise, soil salinization, coastal farmers, agent-based model, migration

How to cite: Pandey, K., de Bruijn, J., de Moel, H., and Aerts, J.: Simulating the effects of sea level rise and soil salinization on migration and adaptation in coastal Mozambique, EGU General Assembly 2023, Vienna, Austria, 23–28 Apr 2023, EGU23-409, https://doi.org/10.5194/egusphere-egu23-409, 2023.

The understanding of floods has become more complex as the changing climate has made the floods more unpredictable, recurrent, and intensified. The present study focuses on the analysis of behavior of the sub-basins under the extreme rainfall events. For this purpose, an extreme flood event of 2019 in Koyna River Basin located in the Upper Krishna River Basin, Maharashtra was considered. The hydrological responses of the sub-basins of Koyna River basin during this flood event were obtained using a Process-based Soil and Water Assessment (SWAT) hydrological model. The model was configured using the topographical, land use, soil and metrological parameters, respectively. Fathom FABDEM hydrologically corrected DEM were used to delineate the watershed with an outlet near Karad City, just downstream of the Warunji gauging station. The Indian Metrological Department (IMD) 0.250 * 0.250 daily gridded rainfall data and minimum and maximum temperature were used to set up the model. The simulation runs were taken to obtain the responses of the sub-basins for the period of 2016 to 2020.  The study reveals high value of Coefficient of Correlation (R2) being equal to 0.72 indicating that the simulated runoff is closely related with the observed runoff at Warunji Gauging station. The configured hydrological model would be useful in predicting the sub-basin responses under climate change so that the proper planning and preparedness can be made to evolve the robust policies for handling severe floods in the future.

Keywords: Climate Change, Extreme events, SWAT, FABDEM, Koyna River.

How to cite: Ranjan, R. and Keshari, A. K.: Process-based Hydrological Modeling to Analyse Sub-basin Response Under Extreme Rainfall Events in Koyna River Basin, Maharashtra, EGU General Assembly 2023, Vienna, Austria, 23–28 Apr 2023, EGU23-1663, https://doi.org/10.5194/egusphere-egu23-1663, 2023.

Climate change and human activities may cause change points in hydrological processes, which have serious impacts on the stability of watershed hydrological ecosystems. The Pettitt test method was used to identify the change point of discharge in the Yangtze River basin, and ecological water demand was estimated based on generalized extreme value distribution. The results show that: (1) the ecological water demand guarantee rate of the Yangtze River basin increased from a viewpoint of the whole basin during the past decades, especially in dry seasons. Due to the regulation of reservoirs and dams in the Yangtze River Basin, the ecological surplus (ecological deficit) tends to increase (decrease) in the dry season of the Yangtze River Basin, while it tends to reverse in the wet season. (2) The degree of hydrological alterations in the trunk stream of the Yangtze River Basin is the highest (D0 reaches 50% or more), and the river hydrological situation and ecosystem are under high risks (the total DHRAM score is more than 10 points), and the biodiversity shows a significant downward trend. (3) Climate change and human activities have the opposite impact on ecological streamflow of the Yangtze River Basin, that is, climate change increases ecological surplus and decreases ecological surplus. Overall, climate change is the leading factor affecting ecological surplus (the contribution is more than 50%).

How to cite: he, Y. and gu, X.: Ecological Instream Flow in the Yangtze River Basin under the Hydrological Change: Changes, Impacts, and Attributions, EGU General Assembly 2023, Vienna, Austria, 23–28 Apr 2023, EGU23-2070, https://doi.org/10.5194/egusphere-egu23-2070, 2023.

EGU23-2256 | ECS | PICO | HS1.1.3 | Highlight

Influence of urbanization on flood extent changes at the global level 

Maurizio Mazzoleni, Francesco Dottori, Hannah L. Cloke, and Giuliano Di Baldassarre

Anthropogenic actions are progressively affecting most river basins worldwide, resulting in changes in hydrological processes and thus influencing water availability. Despite previous studies aimed at quantifying the relationship between urbanization and extreme flooding events at local to regional scales, it is still unclear how human presence has influenced the occurrence of seasonal surface water. As a result, global patterns remain largely unknown.

In this study, we perform a global analysis of large river basins and uncover global trends of annual maximum flood extent and impervious area, as well as their relationships with rainfall and snowmelt, over the past three decades. Hydrological and urban dynamics are computed by using multiple earth observation datasets.

We find that hydroclimatic variability alone cannot explain changes in annual maximum flood extent for 75% of the analyzed river basins worldwide. We also observe increasing trends in both annual maximum flood extent and the urbanized area within floodplains, especially in Asian and African river basins. Our findings reveal an emerging global reciprocal relationship between urbanization processes and maximum flood extent changes. Both rainfall and urbanized area can explain changes in the annual maximum flood extent in 57% of the analyzed basins.

Our findings highlight the need for a better understanding of the influence of human presence on changes in seasonal water dynamics at the global scale. In view of the worldwide rapid development of urban areas, these findings can inform the process of flood risk management and help improve targeted policy and land use interventions

How to cite: Mazzoleni, M., Dottori, F., Cloke, H. L., and Di Baldassarre, G.: Influence of urbanization on flood extent changes at the global level, EGU General Assembly 2023, Vienna, Austria, 23–28 Apr 2023, EGU23-2256, https://doi.org/10.5194/egusphere-egu23-2256, 2023.

For governing river basin systems, social-ecological systems (SES) structures can be reshaped by institutions, such as policies, laws, and norms. Effective (“matched” or “fit”) institutions operate at appropriate spatial, temporal, and functional scales to manage and balance different relationships and interactions between human and water systems, supporting (but not guaranteeing) the sustainability of SES. To better understand how water governance institutions match/mismatch their social-ecological context, we take the Yellow River Basin (YRB), China, as an example to dive into causal links between institutional changes and outcomes. An agent-based model was developed around the Yellow River's most far-reaching water quota institution during the past half century, considering how factors such as human behaviour and environmental change have combined with the institutional shifts to lead to changes in the Yellow River's water use. Our results show regional differences in the impact of the system, with some areas tending to ignore the constraints of the quota system when other provinces embarked on a water-saving transition. Our model demonstrates the dramatic impact of institutional change on socio-hydrological processes and has guidness for the sustainable use of water resources at a time when non-engineered measures of water governance are becoming increasingly common.

How to cite: Song, S., Wang, S., and Fu, B.: Institutional impacts on the evolution of the Yellow River, China: a perspective from socio-hydrological modelling, EGU General Assembly 2023, Vienna, Austria, 23–28 Apr 2023, EGU23-4221, https://doi.org/10.5194/egusphere-egu23-4221, 2023.

EGU23-4575 | PICO | HS1.1.3

Management and restoration of the mining maquis ecosystem in New Caledonia (South West Pacific) 

Michel Allenbach, Agnes Semper, and Claire Cote

New Caledonia is a French overseas territory located in the southwest Pacific, 2000 km east of Australia. Geologically, the Antarctic and Australian plates broke up 250 Ma ago as a result of the break-up of Gondwana land. Ocean basins opened up and remnants of the former supercontinent separated and drifted eastwards. The eastern ridge, known as Norfolk ridge, substratum of New-Caledonia sank under the water. The New Caledonian Great Land emerged 34 million years ago after obduction phase. A new terrestrial environment was created. Freshly emerged, it was gradually recolonized by animals and plants from more or less nearby land masses.

New Caledonia’s Island isolation and the particularity of its soils forced the biotope to adapt and develop original, even unique, characteristics, thus contributing to making it one of the world's champions of biodiversity. With 76% plant endemism, this tiny territory (<20,000 km2) ranks third in the world (behind Hawaii and NZ).

The peridotites brought to the surface by obduction developed a thick alteration profile. Nickel and Cobalt, issued from the primary minerals of the peridotites, got concentrated in the saprolite horizon. The exploitation of these ores, was accelerated after the Second World War with the mechanization of extraction. Carried out without precaution, this time-period resulted in very significant environmental damage: deforestation and soil exposure, accelerated erosion, watercourse siltation and hypersedimentation, and flooded low-lying valleys. 

Environmental awareness was finally raised in the 1970s and increasingly triggered the introduction of responsible regulations. The mining and metallurgy companies working in the area, which are among the world's major players, have significantly improved their operational procedures, the quality of their environmental monitoring and remediation methods

On steep slopes and in a climate where rainfall can be very heavy, water management is one of the challenges to be overcome, as well as the revegetation of workings and slopes. This paper will present the results of the audit carried out by the GEME (mine water management and environment) program of the CNRT "Nickel and Environment" (National Technological Research Centre) on these issues and their comparison, based on the benchmark carried out with those of other major mining countries. The results concern the hydro-sedimentary models used, the acquisition of the parameters introduced, the adequacy with the rules of good practice and the evolution of these rules with global changes as well as the effectiveness of water management and revegetation methods.

The increasing involvement of local populations in the environmental management of the sites affected by mining will be discussed. Most of the mines are located on customary land whose inhabitants are now severely impacted by the mistakes of the past and want to become key players of the mine of the future. In a sensitive political context (end of the Nouméa Accord) where the institutional future of the country has not yet been determined, the topic of nickel mining and its environment is one of the levers for a hoped-for end to the crisis. Our communication will mention this in its conclusion.

How to cite: Allenbach, M., Semper, A., and Cote, C.: Management and restoration of the mining maquis ecosystem in New Caledonia (South West Pacific), EGU General Assembly 2023, Vienna, Austria, 23–28 Apr 2023, EGU23-4575, https://doi.org/10.5194/egusphere-egu23-4575, 2023.

EGU23-4932 | PICO | HS1.1.3

Panta Rhei benchmark dataset: socio-hydrological data of paired events of floods and droughts 

Heidi Kreibich and the Flood and drought paired event community

Damage due to hydrological extremes increase in many regions of the world. A better understanding of the drivers of increasing damage trends is essential for effective flood and drought risk management. However, empirical data is lacking about the processes in complex human-water systems that result in flood and drought damage. We present a benchmark dataset containing socio-hydrological data of paired events, i.e., two floods or two droughts that occurred in the same area. The 45 paired events cover a wide range of socio-economic and hydro-climatic conditions. The dataset is unique in covering both floods and droughts, in the number of cases assessed, and in the quantity of qualitative and quantitative socio-hydrological data. The core of the benchmark dataset comprises: 1) detailed review style reports about the events and key processes and changes between the two events of a pair; 2) an overview table of key data about management, hazard, exposure, vulnerability and impacts of all events; 3) a table of indicators of change between first and second event of each pair. The advantages of the dataset are that it enables comparative analyses across all the paired events and allows for detailed context- and location-specific assessments based on the extensive data and reports of the individual study areas. A first analysis of the dataset revealed the general pattern that risk management normally reduces the impacts of floods and droughts, but faces difficulties in reducing the impacts of unprecedented events of a magnitude not experienced before (Kreibich et al. 2022a). The dataset can be used by the scientific community for exploratory data analyses and for the development of socio-hydrological models. As such, the dataset can support solving one of the twenty-three unsolved problems in hydrology (Blöschl et al. 2019), namely “How can we extract information from available data on human and water systems in order to inform the building process of socio-hydrological models and conceptualisations?”. The dataset is available to the public through the GFZ Data Services (Kreibich et al. 2022b).


References

Blöschl, G., Bierkens, M. F., Chambel, A., et al. (2019): Twenty-three unsolved problems in hydrology (UPH) – a community perspective. - Hydrological Sciences Journal - Journal des Sciences Hydrologiques, 64, 10, 1141-1158. https://doi.org/10.1080/02626667.2019.1620507

Kreibich, H., Loon, A. F. V., Schröter, K., et al. (2022a): The challenge of unprecedented floods and droughts in risk management. - Nature, 608, 80-86. https://doi.org/10.1038/s41586-022-04917-5

Kreibich, H., Schröter, K., Di Baldassarre, G., et al. (2022b): Panta Rhei benchmark dataset: socio-hydrological data of paired events of floods and droughts. https://doi.org/10.5880/GFZ.4.4.2022.002

How to cite: Kreibich, H. and the Flood and drought paired event community: Panta Rhei benchmark dataset: socio-hydrological data of paired events of floods and droughts, EGU General Assembly 2023, Vienna, Austria, 23–28 Apr 2023, EGU23-4932, https://doi.org/10.5194/egusphere-egu23-4932, 2023.

EGU23-4956 * | ECS | PICO | HS1.1.3 | Highlight

Key drivers and pressures of water scarcity at global hotspots 

Myrthe Leijnse, Bram Droppers, Marc Bierkens, and Niko Wanders

Although global freshwater resources are vital to the livelihood of humanity and all other life on Earth, 10% of the global population lives in regions with high to critical levels of water stress. In many of these regions the freshwater resources risk depletion of surface water or groundwater resources due to unsustainable use. Such regions are considered as the “hotspots of water scarcity”. Understanding how these hotspots have evolved over time towards their current state of water scarcity, provides important insights for decision-making and implementation of mitigation and water regulation policies.

We present a global intercomparison of the key drivers and pressures causing water scarcity at these hotspots around the world. For our analysis we have applied a Driver-Pressure-State-Impact-Response (DPSIR) framework to a literature search of >175 case studies of the hotspot regions. In this framework natural, social and economic information is combined to identify driving forces and resulting pressures that have deteriorated the state (quality or quantity) of the water resources. The DPSIR literature analysis is supported by observational data analysis to study the temporal evaluation for each hotspot.

We identify the key drivers and pressures to be: hydroclimatic changes (78%), population growth (28%) and agricultural (93%), municipal (54%), and industrial water demand (37%). Subsequent impacts on society are less homogeneous between the hotspots, with damage to ecosystems (25%) and reduced agricultural production (16%) as main impacts. Responses also vary greatly. While some have a positive impact on alleviating water scarcity (e.g. increased storage capacity (25%) or water treatment (23%)), others are ineffective in attempting to alleviate water scarcity or even worsen water scarcity problems (e.g. lack of groundwater regulation policies (12%) or unfair distribution of water rights (12%)).

These outcomes of the DPSIR analysis provide valuable information for constructing causal networks representative to water scarcity problems at the hotspots. Such a causal network will serve as the basis of a conceptual model that represents human-water interactions at the hotspots, thereby providing a better understanding of trade-offs and synergies in different human-water systems around the world.

How to cite: Leijnse, M., Droppers, B., Bierkens, M., and Wanders, N.: Key drivers and pressures of water scarcity at global hotspots, EGU General Assembly 2023, Vienna, Austria, 23–28 Apr 2023, EGU23-4956, https://doi.org/10.5194/egusphere-egu23-4956, 2023.

EGU23-5319 | ECS | PICO | HS1.1.3 | Highlight

Humans, Water, and Climate change – Global analysis of Conflicts and Cooperation and their Potential Drivers 

Elisie Kåresdotter, Siyuan Li, Haozhi Pan, and Zahra Kalantari

Despite agreement that climate change is increasingly recognized as a threat multiplier in conflict pathways, connections between water flows and conflicts remain unclear. This is affected by incomplete datasets on water-related conflict-cooperation events and poor understanding of socioeconomic and biophysical causes of such conflicts. Disentangling various drivers of water-related cooperation and conflict pathways, with more complete datasets on water-related conflict-cooperation events and a detailed understanding of socio-economic and biophysical causes of such conflicts, is necessary for resolving conflicts and building peace As part of this study we have complied a new global dataset on water-related conflict-cooperation events that extends to 2019, updating previous datasets that covered only up to 2008, yielding important new insights on cooperation-conflict trends. Correlations between events and aspects such as changes in precipitation and socioeconomic variables were then calculated for different change scenarios. Analysis of events shows that cooperation can significantly reduce future conflicts in all tested change scenarios. In addition, cooperation positively affects countries’ socioeconomic development, further reducing the risk of conflict. The new dataset revealed a worrying trend with a shift in the cooperation-conflict balance in the 2000s, with conflict events increasing and outnumbering cooperation events in 2017. Regional analysis shows that changes towards more conflict and fewer cooperation events in Africa could be related to long periods of drought, while changes in Asia are related to irrigation and dam construction. This study shows that water cooperation can be effective for peacekeeping while simultaneously creating positive socio-economic development. The trend towards less cooperation and more conflict in current years highlights the need for effective water management adapted to local and regional drivers of change (climate or anthropogenic) focusing on forming collaborations based on current and projected water availability. Utilizing our newly created and openly available water-related conflict and cooperation database can provide a good opportunity for further research into actions required to change this trend and promote future water cooperation.

Keywords: conflict; cooperation; peacekeeping; climate change; hydrology;

How to cite: Kåresdotter, E., Li, S., Pan, H., and Kalantari, Z.: Humans, Water, and Climate change – Global analysis of Conflicts and Cooperation and their Potential Drivers, EGU General Assembly 2023, Vienna, Austria, 23–28 Apr 2023, EGU23-5319, https://doi.org/10.5194/egusphere-egu23-5319, 2023.

EGU23-5799 | ECS | PICO | HS1.1.3

A novel way of identifying agricultural water drainage systems and their impact on catchment hydrology 

Estifanos Addisu Yimer, Fatima-Ezzahra Riakhi, Shahla Yadollahi, Imeshi Weerasinghe, Charlotte Wirion, Ryan T. Bailey, Jiri Nossent, and Ann van Griensven

Water drained from agricultural lands is getting more attention as its valuable water is lost from groundwater storage. The historical location of buried agricultural water drainage systems is not known very well. Hence, first, finding the location of those infrastructures is critical. Several methods have been applied in the past, including decision tree classification (DTC), remote sensing based, using radar, etc. However, all the methods neglect the primary cause of the drain application, which is groundwater. Hence, a novel approach is introduced that considers groundwater in the identification procedure. We used two case studies for drain identification, one from Ontario, Canada, and another from Belgium. Furthermore, a physically based and fully distributed modeling approach (SWAT+gwflow) is conducted to investigate the impact of these drainage systems in the catchment hydrology of the Kleine Nete watershed, Belgium.

The result of the drainage system identification has indicated the pitfalls of the already existing methods where accuracy as low as 17% was recorded. On the other hand, the additional filtering based on groundwater head enables us to find an additional 19.4 km2 area. Therefore, the use of groundwater level as an additional filtering technique is vital for increasing the accuracy of tile drain/ditch network identification. Next, drains have been shown to affect hydrology, where a 15% decrease in groundwater evapotranspiration, a 50% reduction in groundwater saturation excess flow, and a 39% decline in groundwater discharge to streams are observed.

How to cite: Yimer, E. A., Riakhi, F.-E., Yadollahi, S., Weerasinghe, I., Wirion, C., T. Bailey, R., Nossent, J., and van Griensven, A.: A novel way of identifying agricultural water drainage systems and their impact on catchment hydrology, EGU General Assembly 2023, Vienna, Austria, 23–28 Apr 2023, EGU23-5799, https://doi.org/10.5194/egusphere-egu23-5799, 2023.

The water cycle is highly interconnected; water fluxes in one part depend on physical and human processes throughout. For example, rivers are a water supply, a receiver of wastewater, and an aggregate of many hydrological, biological, and chemical processes. Thus, simulations of the water cycle that have highly constrained boundaries may miss key interactions that create unanticipated impacts or unexpected opportunities. Integrated environmental models aim to resolve the issue of boundary conditions, however they have some key limitations, and we find a significant need for a parsimonious, self-contained suite that is accessible and easy to setup. With this in mind, we have developed the WSIMOD – a Python package that allows for the representation of the water system’s demands and impacts of multiple sectors and actors’ decisions within a single tool, which is considered beneficial to increasing a shared understanding of system performance and for more collaborative and coherent decisions on integrated water resources, water quality and flood management. The WSIMOD is a self-contained software package that includes modelled representations of key physical and infrastructure elements of the water cycle (urban and rural), with each type of modelled element generically described as a component. Components are written in such a way that any component can interact with any other component. This enables a flexible representation of a water system that is needed to accommodate the wide variety of different built/natural infrastructure configurations and scales. We will showcase how the WSIMOD tool has been developed and successfully tested through a range of applications in the UK, including integrated analysis of urban water systems, catchment water management and urban water neutrality.  

How to cite: Mijic, A., Liu, L., and Dobson, B.: Water Systems Integrated Modelling framework (WSIMOD): A Python package for simulating human-impacted water quality and quantity, EGU General Assembly 2023, Vienna, Austria, 23–28 Apr 2023, EGU23-6399, https://doi.org/10.5194/egusphere-egu23-6399, 2023.

EGU23-7949 | ECS | PICO | HS1.1.3 | Highlight

Quantifying lifetime water scarcity 

Inne Vanderkelen, Édouard Davin, Jessica Keune, Diego G. Miralles, Yoshihide Wada, Hannes Müller-Schmied, Simon Gosling, Yadu Pokhrel, Yusuke Satoh, Naota Hanasaki, Peter Burek, Sebastian Ostberg, Luke Grant, Sabin Taranu, Matthias Mengel, Jan Volkholz, and Wim Thiery

Water scarcity is a growing concern in many regions worldwide, as demand for clean water increases and supply becomes increasingly uncertain under climate change. Already today, more than 4 billion people experience water scarcity at least one month per year (Mekonnen and Hoekstra, 2016). Developing socio-economic conditions and growing population increase water demands, while climate change leads to changes in freshwater availability. Most studies quantify water scarcity in discrete time windows, with fixed population and climate change signals (e.g., 30 years or long-term averages). Recently, however, Thiery et al. (2021) proposed a novel approach, in which climate change impacts are integrated over a person's lifetime. In this cohort perspective, lifetime impact values are comparable across generations and regions. Evaluating this perspective for natural hazards, they showed, for example, that a newborn will experience a sixfold increase in drought exposure compared to a 60-year-old (Thiery et al., 2021). 

In this study, we use this cohort perspective to study how much water scarcity a person experiences during their lifetime. Based on monthly fluctuations in water demand and availability, we estimate the total amount of water demand not met and refer to it as 'lifetime water deficit'. To this end, we use an ensemble of four global hydrological models (MATSIRO, CWatM, LPJmL and H08), each forced by four GCMs and two RCP scenarios from the InterSectoral Impact Model Intercomparison Project (ISIMIP2b). The simulations account for varying population and socio-economic conditions in the historical and future period, following the SSP2 scenario. Combined with country-based population, cohort distribution and life expectancies, lifetime water deficits are quantified for different generations on a country level. 

Our findings reveal high water lifetime deficit values for regions that are already water scarce today, such as the Mediterranean, North Africa and the Middle East. In these regions, more than 70% of the lifetime water demand is not met when needed. Further comparison reveals differences in spatial, intergenerational and climate change scenarios, and provides information on different scenarios. Overall, this study provides a new perspective on quantifying water scarcity and the climate and population impacts. 

References:

Mekonnen, M. M., & Hoekstra, A. Y. (2016). Four billion people facing severe water scarcity. Science Advances, 2(2). https://doi.org/10.1126/sciadv.1500323

Thiery, W., Lange, S., Rogelj, J., Schleussner, C. F., Gudmundsson, L., Seneviratne, S. I., Andrijevic, M., Frieler, K., Emanuel, K., Geiger, T., Bresch, D. N., Zhao, F., Willner, S. N., Büchner, M., Volkholz, J., Bauer, N., Chang, J., Ciais, P., Dury, M., … Wada, Y. (2021). Intergenerational inequities in exposure to climate extremes. Science, 374(6564), 158–160. https://doi.org/10.1126/science.abi7339

How to cite: Vanderkelen, I., Davin, É., Keune, J., Miralles, D. G., Wada, Y., Müller-Schmied, H., Gosling, S., Pokhrel, Y., Satoh, Y., Hanasaki, N., Burek, P., Ostberg, S., Grant, L., Taranu, S., Mengel, M., Volkholz, J., and Thiery, W.: Quantifying lifetime water scarcity, EGU General Assembly 2023, Vienna, Austria, 23–28 Apr 2023, EGU23-7949, https://doi.org/10.5194/egusphere-egu23-7949, 2023.

EGU23-7977 | PICO | HS1.1.3

Managing complex social-hydrological systems for water security: the case of the mountain cryosphere 

Fabian Drenkhan, Wouter Buytaert, Jonathan D. Mackay, Nicholas E. Barrand, David M. Hannah, and Christian Huggel

In many mountain regions, the cryosphere is a crucial component of water provision to downstream societies, as it contributes to dry-season flows and sustains diverse ecosystems. However, many of the world’s glacierized watersheds experience far-reaching changes at accelerated pace due to declining glaciers and snowpack, climate change impacts and socioeconomic development in the non-cryospheric parts of the catchment. The implications for downstream water supply are therefore manifold and complex. Coupled effects of reduced and less reliable water availability, changes in water quality, and growing water demand exert increasing pressure on water resources and threaten future water security and management.

We argue that the limited understanding of interactions between the cryosphere, glacial and non-glacial water stores, river runoff and people hamper climate change adaptation and long-term water security. Meaningful assessments of mountain water security require therefore a holistic social-ecological perspective that interlinks the wider catchment hydrology considering both, surface and subsurface stores, and people including human water demand with improved data and process understanding. Water security assessments can then be guided by a fully coupled hydrological risk framework. This approach needs to integrate multiple social-ecological vulnerabilities as well as the degree of exposure to water shortage under a variety of possible future scenarios of glacier shrinkage, catchment alteration and socioeconomic development. Essentially, this requires a thorough understanding of interrelated upstream-downstream systems and the spatiotemporal propagation of meltwater through the terrestrial water cycle.

Improved data and more diverse knowledge collection that point to the missing links in the terrestrial water cycle are a priority. Multiple sources of knowledge should be co-produced and integrated into a collaborative science-policy-community framework, ideally from the early stages of research planning with attention to local practices and governance. This approach can support a wide set of incremental and transformational strategies that guide robust, locally tailored and effective adaptation pathways. These may include, among other, exploring catchment-specific benefits of nature-based solutions to increase the buffer function of wider catchment hydrology against water loss from glacier shrinkage to enhance long-term water security.

How to cite: Drenkhan, F., Buytaert, W., Mackay, J. D., Barrand, N. E., Hannah, D. M., and Huggel, C.: Managing complex social-hydrological systems for water security: the case of the mountain cryosphere, EGU General Assembly 2023, Vienna, Austria, 23–28 Apr 2023, EGU23-7977, https://doi.org/10.5194/egusphere-egu23-7977, 2023.

Panta Rhei was launched in 2013 with the purpose of reaching “an improved interpretation of the processes governing the water cycle by focusing on their changing dynamics in connection with rapidly changing human systems.” When the idea of Panta Rhei was conceived socio-hydrology was still in its infancy and global warming was about 0.3 degree centigrade lower than today. The subsequent evolution of the research agenda and environmental change proved that Panta Rhei was a brilliant intuition. By building on the IAHS history and legacy, the idea of Panta Rhei catalysed the feeling that change in hydrology and society was an emerging reason of concern and therefore a fascinating field of research. Panta Rhei achieved a major target: by putting together an interdisciplinary community of researchers – mostly early career ones – it set the theoretical basis for an improved understanding of the complex interaction between water and humans. On the other hand, challenging research questions are still unresolved. I had the fortune of chairing the scientific consultation that led to shaping Panta Rhei. I also had the privilege of attending several phases of the Panta Rhei adventure. With this presentation I would like to offer my perspective on the fascinating interplay between water and humans and the achievements and future evolution of Panta Rhei.

How to cite: Montanari, A.: Everything still flows: achievements and future evolution of Panta Rhei, EGU General Assembly 2023, Vienna, Austria, 23–28 Apr 2023, EGU23-8104, https://doi.org/10.5194/egusphere-egu23-8104, 2023.

EGU23-8612 | ECS | PICO | HS1.1.3

Drought and flood risk in Kitui, Kenya: are they increasing and why? 

Marlies H. Barendrecht, Ruben V. Weesie, Tim S. Busker, Alessia Matanó, Maurizio Mazzoleni, and Anne F. van Loon

During the past years, the county of Kitui in Kenya, has experienced severe droughts. Both the short rain season, in March, April and May and the long rain season, in October, November and December have failed for several years in a row. This has had devastating impacts, leading to widespread water and food insecurity. According to local people, the rain seasons have changed over the past years, thereby increasing drought risk. At the same time, flash floods, destroying farmland and water infrastructure are reported to have increased as well. We investigate whether drought and flood risk in Kitui, Kenya, have increased over the past years and what the role of climate, hydrology and humans is in this increase. In addition, we investigate whether droughts are influencing flood risk and vice versa.

How to cite: Barendrecht, M. H., Weesie, R. V., Busker, T. S., Matanó, A., Mazzoleni, M., and van Loon, A. F.: Drought and flood risk in Kitui, Kenya: are they increasing and why?, EGU General Assembly 2023, Vienna, Austria, 23–28 Apr 2023, EGU23-8612, https://doi.org/10.5194/egusphere-egu23-8612, 2023.

EGU23-9040 | PICO | HS1.1.3 | Highlight

The World Water Map of water scarcity hotspots 

Niko Wanders, Myrthe Leijnse, Bram Droppers, Barry van Jaarsveld, Jannis Hoch, Jonas Götte, and Marc Bierkens

The World’s water resources are under severe pressure as a result of unsustainable exploitation and rapidly changing hydroclimatic conditions. In the National Geographic World Water Map project, we combine state of the art hydrological modelling expertise, with storytelling expertise from National Geographic. The World Water Map aims to shed new light on water problems in the world.

In this project we identify 17 hotspots of water scarcity based on state-of-the-art large-scale hydrological modelling results. For the so called “hotspots” we analyze which policies, regulations and climatic changes have resulted in the development of these areas under pressure. We do this by using a literature study of over 175 scientific publications, which helps to identify the drivers and pressure as well as their impact and response for each hotspot. This information is then all included in the online Water Map that provides the general public, policy makers and peers in science with this information. The map consists of an interactive web portal where we tell the untold stories of water scarcity, support water scarcity literacy so that people understand the problems surrounding water scarcity, and provide an interactive platform where people can identify the vulnerability of their local neighbourhoods.

By combining science and storytelling we can shed light on “hotspots” as well as provide the untold stories in these regions. Together with the local and national policymakers we aim to provide much needed open information on pathways forward and future outlooks for “hotspots” around the world.

How to cite: Wanders, N., Leijnse, M., Droppers, B., van Jaarsveld, B., Hoch, J., Götte, J., and Bierkens, M.: The World Water Map of water scarcity hotspots, EGU General Assembly 2023, Vienna, Austria, 23–28 Apr 2023, EGU23-9040, https://doi.org/10.5194/egusphere-egu23-9040, 2023.

The analysis of the factors driving the exploitation of drinking-water sources is fundamental in the modelling and planning of water supply systems. To this end, it is important to assess the impacts of water scarcity, related to periods of hydrological drought, on the use of the available sources. This is of particular interest in touristic regions, where resource management must necessarily take into account also the significant seasonal fluctuation of urban demand.

As part of the European project SIMTWIST (Simulating Tourism Water Consumption with Stakeholders), the study analyses the factors influencing both the demand for drinking-water supply of the city of Rimini and the apportionment of the supply among the different sources available to the water manager (RomagnaAcque-Società delle Fonti SpA). In fact, the city is supplied with both surface water, from the Ridracoli reservoir in the Apennines, and groundwater from well fields on the alluvial fans of the Marecchia and Conca rivers.

The drivers include socio-economic variables (tourist attendance), climatic variables and hydrological availability. In particular, it is analysed how the exploitation of the groundwater source varies as a function of water availability at the Ridracoli reservoir, characterizing such availability through meteorological and hydrological drought indices computed on the upstream catchments.

The analysis, in addition to confirming how the management of the resource cannot, in Mediterranean regions, disregard tourism factors, helps to understand the link between hydrological droughts, governing the availability of river-fed reservoir supply, and the choices made by water managers in the exploitation of the groundwater sources.

How to cite: Toth, E. and Neri, M.: Drinking-water supply sources and hydrological droughts: influence of tourism demand and reservoir availability on groundwater exploitation for the Rimini case study, EGU General Assembly 2023, Vienna, Austria, 23–28 Apr 2023, EGU23-9402, https://doi.org/10.5194/egusphere-egu23-9402, 2023.

EGU23-11579 | ECS | PICO | HS1.1.3

The dynamics of floodplain urbanization and hydraulic engineering development 

Peirong Lin, Shang Gao, Zhenzhong Zeng, Jida Wang, Kaihao Zheng, Ziyun Yin, Zimin Yuan, Zhou Huang, Xudong Zhou, and Xiangyong Lei

Floodplain urbanization is accelerating at an alarming rate in recent decades, which has posed grand challenges to flood risk management. Hydraulic engineering infrastructure is often co-developed alongside this acceleration to mitigate flood risks, but to what extent this co-development matches up with the floodplain urbanization rate needs to be better quantified. In this study, we leverage a range of multi-source geospatial datasets including high-resolution floodplain maps, urban impervious area maps, global dam/reservoir datasets, and flood fatality data from the Emergency Events Database (EM-DAT) to assess the dynamics of floodplain urbanization (1985–2015) and its interplay with hydraulic engineering development at the global scale. We will report our assessments at both the basin level and the country level to promote the understanding of the hydroclimatic and socioeconomic contexts of floodplain urbanization. Ultimately, results from this study are expected to inform the prioritized regions for flood risk mitigation.

How to cite: Lin, P., Gao, S., Zeng, Z., Wang, J., Zheng, K., Yin, Z., Yuan, Z., Huang, Z., Zhou, X., and Lei, X.: The dynamics of floodplain urbanization and hydraulic engineering development, EGU General Assembly 2023, Vienna, Austria, 23–28 Apr 2023, EGU23-11579, https://doi.org/10.5194/egusphere-egu23-11579, 2023.

EGU23-11797 | PICO | HS1.1.3

Potential applications of the Benford’s Law for the investigation of hydrological time series alteration 

Alessio Domeneghetti, Letizia Caroscio, and Serena Ceola

The Benford’s Law, outlined in 1938, estimates the expected frequency of the significant first or first two digits of a time series of a generic variable based on a logarithmic pattern. Lower digits (i.e., 1, 2…) are expected to occur with frequencies higher than those associated to numbers with higher first digits (i.e., 8, 9). According to this law digit 1 typically occurs about 30% of the time, while 9 appears as significant first digit in less than 5% of the cases. The validity of Benford’s Law has been proven for a wide variety of data sets and in different contexts (e.g., public elections, false accounting detection, street addresses, stock and house prices, population numbers), among which few of hydrological relevance: lengths of rivers, river flow series, lake and wetlands extents. Nonconformity of hydrologic data sets to Benford’s Law could be a consequence of time series alteration and thus a signal of the presence of biases or errors, data modification, as well as of the fact that the sample is not fully representative of the variable or the series is affected by external drivers (e.g. anthropic alteration of the natural dynamics).

In this work we referred to more than 1200 GRDC sites to test the Benford’s Law validity over stream flow series longer than 40 years, as well as on the longest stream flow series (more than 12 million of data). Streamflow records have been investigated in parallel to other hydrological relevant datasets that serve as proxy for quantifying the potential human impact (e.g., GRanD-Global Reservoir and Dam Database, FFRs-Free Flowing Rivers). Results of this study, together with those of previous investigations (Nigrini and Miller, 2007) advocate that large hydrological data set should conform the Benford’s Law. On the contrary, the nonconformity to it might highlight data integrity and authenticity issue, or reveal alterations of the natural variability due to human activities or other driving factors (perhaps climate change).

How to cite: Domeneghetti, A., Caroscio, L., and Ceola, S.: Potential applications of the Benford’s Law for the investigation of hydrological time series alteration, EGU General Assembly 2023, Vienna, Austria, 23–28 Apr 2023, EGU23-11797, https://doi.org/10.5194/egusphere-egu23-11797, 2023.

EGU23-12379 | PICO | HS1.1.3

Study on long-term variation of river water quality in Japan 

Koji Kodera, Masato Oda, Yoshihiro Igari, and Yoichi Morimoto

1.introduction

During Japan's period of rapid economic growth, water pollution became a problem throughout the country, but water quality has improved rapidly thanks to the enactment of laws and the heightened environmental awareness of society as a whole. However, even now, not only is the concentration concentrated in Tokyo, but urbanization is also progressing in rural areas, and there are still areas with severe water pollution in the suburbs. What used to be point source pollution has spread to non-point source pollution. Due to problems with wastewater treatment facilities in mountainous areas, many large river basins are more polluted upstream than downstream. The results of the ``Survey of the Water Environment in Public Water Areas,'' which has been continued by the government since 1971, and the ``National Simultaneous Survey of Familiar Water Environments,'' which was started in 2004 by citizens' groups, are available on a nationwide scale. I have mainly studied long-term changes in river water quality in Japan. We will also consider the results of measurements by Hosei University in 2020 and 2021.

2.Results and considerations

1)Water quality survey results for public water areas

There were about 1,000 observation points in 1971, but 15 years later, in 1986, the number exceeded 5,000, and since then observations have continued at just under 6,000 points. In 1971, half of the BOD values were 3 or more, but in 1976 half were 2 or less, and recently, 2 or less accounted for about 80% (2018). The number of points with 1 to 4 remained unchanged, but 4 or more decreased, and 1 or less increased to about half of the total.

2)Nationwide Simultaneous Survey of Familiar Water Environment

In 2004, when the survey began, there were about 2,500 sites, but in 2005 there were about 5,000 sites, and after that, although it remained around 6,000 sites, it reached about 7,000 sites in 2018. COD4 or less is about half.

3.conclusion

In addition to the nationwide long-term observation results, data from before 1971 were collected and organized in an attempt to reconstruct past water quality. With regard to recent water quality, we independently conduct observations at more than 1,500 points nationwide every year to clarify the current situation. In addition to the coastal area in 2020, we were able to investigate the inland area in 2021 and the municipality unit in 2022. We would like to improve the accuracy while continuing the wide-area survey.

How to cite: Kodera, K., Oda, M., Igari, Y., and Morimoto, Y.: Study on long-term variation of river water quality in Japan, EGU General Assembly 2023, Vienna, Austria, 23–28 Apr 2023, EGU23-12379, https://doi.org/10.5194/egusphere-egu23-12379, 2023.

EGU23-12572 | ECS | PICO | HS1.1.3

Reaching SDGs 6.1 and 6.2 in Kazakhstan: State - society relations 

Kamshat Tussupova and Aibek Zhupankhan

Science - policy - society Nexus is important in achieving Sustainable Development Goals (SDG). The current scientific knowledge is sufficient to allow us to implement the best of knowledge to cover the basic needs such as access to safe water and sanitation; however, the implementation rate is slow. Thus, this work looks at state-society relations in reaching SDGs 6.1. and 6.2. in Kazakhstan.

The survey asssessed available 176 water-related functions in the Government of Kazakhstan using the Integrated water resources  management tool-box. Additionaly, the questionnaire of about 1300 villagers was conducted in all the villages (which are 153 in total) of Atyrau region, Kazakhstan during September-November 2022, to assess the access to drinking water and sanitation services and the needs for improvement.

The findings show that in the “Policy” area the functions for adaptation to climate change are poorly expressed, especially climate resilient WASH systems; the role of customary law in the field of both the use of water resources and access to drinking water and sanitation is barely reflected in the legislation. In the "Organization" area there is a lack of functions in operation and monitoring of decentralized water supply and sanitation services; the organization of civil society is not formally expressed; training of water management specialists is not reflected as a responsibility.  In the field of using various tools of Integrated Water Resources Management, the weakest function of the government is communication with society and their reflection in public policy, in particular, the introduction of the concept of virtual water, water footprint, public awareness and education; economic instruments and effective demand management are little reflected in the functions of the state.

More than half of rural citizens use water from decentralized sources and mainly use pit latrines. The field survey has showed the high level of responsibility of the local villagers for decentralized sanitation and drinking water supply services, with high request to be educated on how to maintain those systems in a more sustainable way. It might be concluded that people do have relatively high rate of responsibility to maintain the water supply and sanitation systems. However, the policy and the govenmental functions do lack meeting these societal needs for education and, in a broder context, integrating people into water projects. "The science" or Reserchers could play an important role bridging State and Society to increase the feasibility of water and sanitation state-run programs. 


How to cite: Tussupova, K. and Zhupankhan, A.: Reaching SDGs 6.1 and 6.2 in Kazakhstan: State - society relations, EGU General Assembly 2023, Vienna, Austria, 23–28 Apr 2023, EGU23-12572, https://doi.org/10.5194/egusphere-egu23-12572, 2023.

EGU23-12680 | ECS | PICO | HS1.1.3

GEB: A large-scale agent-based socio-hydrological model – simulating 10 million individual farming households in a fully distributed hydrological model 

Jens de Bruijn, Mikhail Smilovic, Peter Burek, Luca Guillaumot, Yoshihide Wada, and Jeroen Aerts

Humans play a key role in the hydrological system, and their decisions influence the entire water system from tributary to river mouth. To fully comprehend how the human-natural water system evolves over space and time, and to investigate the systemic effects of climate change and human interventions, it is important to consider human behaviour and feedbacks to the hydrological system simultaneously at the local household- and large basin scales.

Therefore, we present GEB (Geographical, Environmental and Behavioural model); an agent-based model coupled to a fully distributed hydrological model that can simulate the behaviour and daily bi-directional interaction of more than 10 million individual farm households and reservoir operators with the hydrological system. Through this coupling, each individual farmer with unique characteristics and location can make daily decisions, such as irrigating their crops from surface-, reservoir-, or groundwater, planting and harvesting crops, investing in adaptation options (e.g., irrigation wells and sprinkler irrigation). All these decisions can be based on the available water in their environment, the status of their crops, their risk perception, crop price, water price, and weather conditions etc. Similarly, reservoir operators can regulate the availability of water for irrigation, and downstream releases of water based on the state of the hydrological system as well as communication with farmer agents.

GEB is dynamically linked with the spatially distributed hydrological model CWatM at 30’’ grid resolution (< 1km at the equator). Because many small-holder crop fields are much smaller, CWatM was specifically adapted to implement dynamically sized hydrological response units at field scale / sub-grid level, providing each agent with an independently operated hydrological environment.

While the model could be applied anywhere, we show an implementation with local and basin-wide feedbacks in the heavily managed Krishna basin in India, encompassing ~8% of India’s land area and ~12.1 million farmers. Here, we quantify bi-directional feedbacks such as the reservoir paradox and test various policies, such as providing subsidies for adaptation options (e.g., irrigation wells, sprinkler irrigation), and quantify effects on the hydrological system as well as downstream farmers.

In this implementation, GEB uses approximately 15 GB of RAM memory and can thus be used on an above average personal laptop. Computational requirements scale linearly with basin size, assuming similar farm-size distribution.

How to cite: de Bruijn, J., Smilovic, M., Burek, P., Guillaumot, L., Wada, Y., and Aerts, J.: GEB: A large-scale agent-based socio-hydrological model – simulating 10 million individual farming households in a fully distributed hydrological model, EGU General Assembly 2023, Vienna, Austria, 23–28 Apr 2023, EGU23-12680, https://doi.org/10.5194/egusphere-egu23-12680, 2023.

EGU23-13384 | ECS | PICO | HS1.1.3

Monitoring flood risk evolution: A systematic review of flood risk evolution assessments 

Nele Rindsfüser, Andreas Paul Zischg, and Margreth Keiler

Flood risk is changing over time. Climate change, land-use change, human interventions and socio-economic developments have an influence on the evolution of flood risk. Thus, the future dynamics of drivers influencing hazard, exposure and vulnerability and consequently flood risk evolution is uncertain. Therefore, flood risk management is confronted with deep uncertainties and need to continuously adapt to future circumstances. New management strategies are required to ensure the safety level of humans and their assets and reduce losses from floods. Adaptive flood risk management is a way to cope with such uncertainties. However, the implementation of adaptive flood risk management requires a flood risk monitoring system that screens critical developments of hazard, exposure, or vulnerability and warns the user when a critical point in flood risk evolution is approached. In order to develop a conceptual framework for a flood risk monitoring system, we conducted a systematic review of flood risk evolution assessments. We analysed how flood risk is conceptualised, which factors are assessed to analyse evolutions in one or more risk component, which methods are used to assess flood risk evolution and which risk outcomes are identified. We discuss the main concepts of monitoring the spatiotemporal changes of the components of risks and how the changes of these components contribute to the evolution of risk. We furthermore discuss the data sources, issues of spatial and temporal scales, and how the components of risk coevolve.

How to cite: Rindsfüser, N., Zischg, A. P., and Keiler, M.: Monitoring flood risk evolution: A systematic review of flood risk evolution assessments, EGU General Assembly 2023, Vienna, Austria, 23–28 Apr 2023, EGU23-13384, https://doi.org/10.5194/egusphere-egu23-13384, 2023.

EGU23-14419 | ECS | PICO | HS1.1.3

Geopolitical risk induced by terrestrial moisture supply to agricultural hotspots 

Jose Andrés Posada-Marín, Juan Fernando Salazar, Lan Wang-Erlandsson, Maria Cristina Rulli, and Fernando Jaramillo

Water availability can be linked to a country's stability, internal security, and the occurrence of violence and governability, in the environmental change context. For instance, lack of access to water resources can trigger political conflicts, be used as a tool for political negotiation or attacks on water infrastructure can be used as a source of intimidation. The potential political risks associated with water availability take particular relevance at the scale of international and transboundary hydrological basins and under conditions of water-food scarcity or political instability. To date, although water risks occurring within the boundaries of the hydrological basin have been studied across several case studies in the literature, the issue of risks arising from water upwind-downwind dependency has been overlooked. For instance, precipitation in a hydrological basin or agricultural centre regions with a high dependency on terrestrial moisture recycling may originate in upwind terrestrial areas outside of the basin boundaries. Here we study geopolitical risk related to this water dependency by analizing terrestrial moisture recycling. Our analysis shows that some hydrological basins in Africa, Asia and South America present a high risk of experiencing geopolitical conflicts when there is a large extension of croplands, high moisture recycling dependency and their precipitationsheds extend over warmongering countries. Hence, our results indicate that addressing transboundary water security from a surface perspective can underlook potential geopolitical conflicts that may threaten regional water-food security and peace. These risks need special international attention to guarantee global peace and agricultural production.

How to cite: Posada-Marín, J. A., Salazar, J. F., Wang-Erlandsson, L., Rulli, M. C., and Jaramillo, F.: Geopolitical risk induced by terrestrial moisture supply to agricultural hotspots, EGU General Assembly 2023, Vienna, Austria, 23–28 Apr 2023, EGU23-14419, https://doi.org/10.5194/egusphere-egu23-14419, 2023.

EGU23-15219 | PICO | HS1.1.3

Assessment of change in drought risk influenced by water management 

Elena Ridolfi, Laura Soncin, Alessia Matano, Fabio Russo, Francesco Napolitano, Giuliano Di Baldassarre, and Anne Van Loon

Disaster risks are the results of complex spatiotemporal interactions between risk components, impacts and societal response. In the context of the water supply chain, human processes have altered hydrological processes through the construction of reservoirs to dispose of the water resources with higher predictability and productivity. While reservoirs may attenuate flood events and help to bridge through period of water scarcity, they may also aggravate drought events in terms of duration and severity. The long-term effect associated to the presence of reservoirs is an over-reliance on the water supply hypothesized as constant and abundant as provided by the hydraulic structure, which in turn increases the vulnerability and the economic damage in case of a drought event occurrence. In addition, socio-economic and political changes should not be underestimated, as the social, economic, and political context can influence the impact and response to extreme events. Indeed, it has been observed that during long periods of drought, variations in exposure and in vulnerability have occurred, due to social dynamics taking place as a result of the extreme event, e.g. the natural migration of the population to water sources.
Here we aim at understanding the changes in risk components and the resulting impacts of structural measures, such as reservoirs, and also of nature based solutions in relation to consecutive extreme events. Different case studies around the world are considered to untangle the complexity of the dynamic relationship between human and hydrological processes.

How to cite: Ridolfi, E., Soncin, L., Matano, A., Russo, F., Napolitano, F., Di Baldassarre, G., and Van Loon, A.: Assessment of change in drought risk influenced by water management, EGU General Assembly 2023, Vienna, Austria, 23–28 Apr 2023, EGU23-15219, https://doi.org/10.5194/egusphere-egu23-15219, 2023.

EGU23-15238 | ECS | PICO | HS1.1.3

Dynamic risk modelling of a coupled human-drought system under multi-drought conditions 

Maurice Kalthof, Jens De Bruijn, Hans De Moel, Heidi Kreibich, and Jeroen Aerts

Drought risk is modified through hazard, vulnerability and exposure, and exacerbated by management shortcomings. A quantitative understanding of the combined effects of these drivers is required to effectively lower risk. Yet, knowledge about the dynamics and effects of risk drivers over time and space and the human-natural feedbacks that steer them is largely lacking. In this study, we propose using GEB, the first large-scale coupled-agent based hydrological model that simulates all individual farmers at field scale, to systemically quantify the relations between dynamic hazard, vulnerability, exposure, management and drought risk over a multi-drought period in the Bhima basin, India. First, we parametrized the coupled hydrological model with meteorological and hydrological data to capture hydrological drought  conditions of different paired drought events. Next, we develop the agent based model part to simulate the drought management behavior of two million farmers and how they respond to drought events. To simulate this behavior, we applied the protection motivation theory, supplemented by theory of planned behavior, to describe farmer agent behavior. The parameters of these theories were parametrized with survey data of Indian farmers fitted to the statistical distribution of the two million Bhima basin farmers. To study the dynamic attribution of the three risk drivers, a Global Sensitivity Analysis of all factors was performed at consecutive time intervals, showing the interaction of drivers before and after each drought event, as well as between the two events. The results are expected to further the understanding of drought risk dynamics and what disaster risk reduction measures can optimally reduce impacts in the long term.

How to cite: Kalthof, M., De Bruijn, J., De Moel, H., Kreibich, H., and Aerts, J.: Dynamic risk modelling of a coupled human-drought system under multi-drought conditions, EGU General Assembly 2023, Vienna, Austria, 23–28 Apr 2023, EGU23-15238, https://doi.org/10.5194/egusphere-egu23-15238, 2023.

EGU23-16540 | PICO | HS1.1.3

Examining the contribution of human induced climate change on global drought characteristics 

Aristeidis Koutroulis, Manolis Grillakis, and Konstantinos Seiradakis

Drought is generally considered a slow process natural hazard. However, the faster onset and strength of recent events have received great attention. Climate change and human activities can both play a role in altering the characteristics of droughts, including their speed of development and intensity. Climate change can, for example, indirectly impact droughts by changing the amount and distribution of precipitation, while human activities, such as land management, can directly alter the water content of the soil. In this study, we run the JULES-W2 land surface model with the counterfactual stationary ISIMIP3a climate dataset, a hypothetical climate without climate change [1], and transient land use changes based on observations. We use soil moisture as a water deficit indicator and a framework for calculating the hydrological drought propagation speed [2] to define drought characteristics. We compare results against those calculated from historical runs with climate-related forcing based on observations (factual) to examine historical imposed long-term changes attributed to human-induced climate change. Our results show that climate change could significantly impact the speed of development and intensity of droughts. Some regions like Congo rainforest, Europe and the western US are simulated as hot spots of more fierce droughts, while others (e.g. East African mountains) may have faced milder droughts as a result of climate change. These changes can have important consequences for the productivity of agricultural lands, the health of ecosystems, and the availability of water for human use. Future climate change highlights the implications of faster droughts on risk management and challenges the research of drought hazard prediction.


[1] Mengel, M., et al. “ATTRICI v1.1 – counterfactual climate for impact attribution.” Geosci. Model Dev., 14, 5269–5284.

[2] WU, Jiefeng, et al. Hydrological drought instantaneous propagation speed based on the variable motion relationship of speed‐time process. Water Resources Research, 2018, 54.11: 9549-9565.


Acknowledgements: “Co-funded by the ERASMUS+ Programme of the European Union” (Contract number: 101004049 — EURECA-PRO — EAC-A02-2019 / EAC-A02-2019-1).

How to cite: Koutroulis, A., Grillakis, M., and Seiradakis, K.: Examining the contribution of human induced climate change on global drought characteristics, EGU General Assembly 2023, Vienna, Austria, 23–28 Apr 2023, EGU23-16540, https://doi.org/10.5194/egusphere-egu23-16540, 2023.

EGU23-16655 | PICO | HS1.1.3

Land subsidence and coastal retreat as observed using Sentinel-1, tide dynamics, and socio-cultural survey of Sayung, Demak, Indonesia 

Yus Budiyono, Qoriatu Zahro, Aulia Oktaviani, Bondan Fiqi Riyalda, and Rapti Siriwardane-de Zoysa

The coastal zone of northern Java experiences rapid land subsidence. Satellite-derived InSAR data and GPS had provided evidence  displaying the spatio-temporal rates of the subsidence. Interestingly, inhabitants do not always recognize this phenomenon. However, they do recognize that flooding from the sea (called ‘rob’) has changed from gift to disaster, viz. from shallow infrequent flooding that carry inshore fishes, to regular deep and widespread disastrous floods. In the Demak regency, more than 300 families have moved to locations further inland. In some locations rob flooding has caused a coastline retreat of up to 5kms.

Our initial Sentinel-2 analysis comparing 2016 and 2022 images have showed the change of ecosystem in the area. In addition to that, social surveys revealed timely change of the ecosystem and point places where coastlines have moved.

For this study, we use Sentinel-1 imagery for SAR coupled with tide data to determine the behavior of coastline change from 2018-2022. Sentinel-1 is selected due to the temporal resolution and performance in  all-weather. Ground Range Detected (GRD) of Sentinel-1, is single look complex data projected using an earth ellipsoid, will be used as main input in spatial analysis to observe shoreline condition. There are 4 types of polarization of GRD data: HH,VV, HH+HV and VV+HV. Polarization type will be tested and determined to get less noise images result. Image masking and pixel analysis will sequentially be conducted to segregate the land and the sea. The analysis will be managed in Sentinel Application Platform (SNAP).

Tide data plot from nearby station is used to assign at what phase Sentinel-1 imagery is acquired. Additional analysis from tide data plot is applied to predict land/inundation at important sites and when imagery is not available. 

The social research component of the study through preliminary survey data , our initial survey showed residents relocation had been started before the period covered by the SAR data sets. Hence, random purposive sampling will be used for a follow-up mixed-methods survey to gather more data on social and economic dynamics arising from the geomorphological shifts in coastline. 

Ultimately, we hope  our study will help unravel land subsidence and the resulting coastline retreat to provide a strong basis for mitigation and adaptation options by the people and the government.

How to cite: Budiyono, Y., Zahro, Q., Oktaviani, A., Riyalda, B. F., and Siriwardane-de Zoysa, R.: Land subsidence and coastal retreat as observed using Sentinel-1, tide dynamics, and socio-cultural survey of Sayung, Demak, Indonesia, EGU General Assembly 2023, Vienna, Austria, 23–28 Apr 2023, EGU23-16655, https://doi.org/10.5194/egusphere-egu23-16655, 2023.

EGU23-17019 | ECS | PICO | HS1.1.3

Drought intensity and successiveness together displace populations in Somalia 

Woi Sok Oh, Juan Rocha, and Simon Levin

In recent years, a great number of Somalis are involuntarily displaced within the country. However, we do not fully understand what and how climatic, environmental, and socio-political drivers push internally displaced persons (IDPs). Among several climatic drivers, what is statistically significant to internal displacement? Is the drought intensity alone a key driver of displacement? Are social network structures important in displacement decisions? To provide quantitative evidence, we developed a bootstrapping temporal exponential random graph model (bTERGM) for internal displacement decisions in Somalia. We used the Protection and Return Monitoring Network dataset with drought indices based on precipitation, temperature, and vegetation from the Somali Water and Land Information Management. We found that IDPs tend to consider both the intensity and successiveness of droughts based on precipitation, temperature, or vegetation. The Intensity of each component alone was not a significant driver for Somali IDPs. Local network structures were not very significant in the temporal model at the monthly scale, while previous displacement experience played a critical role in IDP movements. Our results help us better understand the displacement decision-making process so that policymakers can predict IDP movements and establish adequate policies.

How to cite: Oh, W. S., Rocha, J., and Levin, S.: Drought intensity and successiveness together displace populations in Somalia, EGU General Assembly 2023, Vienna, Austria, 23–28 Apr 2023, EGU23-17019, https://doi.org/10.5194/egusphere-egu23-17019, 2023.

EGU23-1853 | PICO | HS1.1.4

Tool to assess the effectiveness of restoring physical conditions in riparian wetlands 

Gabriela Ioana-Toroimac, Gabriela-Adina Moroșanu, Ionuț-Andrei Șandor, Cătălina Stoica, and Dana-Maria Constantin

The success of river restoration is a controversy subject depending on chosen reference conditions and stakeholder perspective. Therefore, the tool to assess the effectiveness of restoring physical conditions in riparian wetlands aims to be a comprehensible piece of evidence to policy-makers. The assessment is based on three hypotheses: (i) the restoration should have standard-based results; (ii) the restoration should respect principle-based results; (iii) the nature is more valuable without human pressures. Therefore, the multi-criteria methodology includes three categories of indicators: (i) to detect results compared to pre-restoration conditions as well as to historical conditions; (ii) to estimate the functionality of physical conditions compared to expert opinion; (iii) to analyze the naturalness of a river site. Each indicator is given a score compared to hypothetically successful effects of the restoration based on an earth scientist approach. The overall score allows to classify the effectiveness of river restoration on a five-class scale from very good to poor. The tool is validated for the Comana Marsh on a second order tributary of the Danube River in Romania. A small-size dam and a system of concrete dykes was built to recreate a marsh upstream, in the floodplain. According to the tool: (i) the effects (e.g., surface-water area, depth) were a success compared to pre-restoration conditions, yet they could not recreate the historical conditions; (ii) new processes (e.g., anastomosing river pattern) appear to be functional when compared to scientific expectations; (iii) the river site gained hybrid features (i.e., rewilding in the context of human pressures). The effectiveness of restoring the Comana Marsh was estimated as being good. The tool could be further developed by integrating other groups of indicators based on stakeholders’ perspective. Understanding the theoretical results of river restoration could help policy-makers to gain confidence and further finance this domain underdeveloped in Romania.    

This work was supported by a grant of the Ministry of Research, Innovation and Digitization, CNCS - UEFISCDI, project number PN-III-P1-1.1-TE-2021-0600, within PNCDI III.

How to cite: Ioana-Toroimac, G., Moroșanu, G.-A., Șandor, I.-A., Stoica, C., and Constantin, D.-M.: Tool to assess the effectiveness of restoring physical conditions in riparian wetlands, EGU General Assembly 2023, Vienna, Austria, 23–28 Apr 2023, EGU23-1853, https://doi.org/10.5194/egusphere-egu23-1853, 2023.

Climate change alters the water cycle, which makes adaptation in water management necessary. The interdisciplinarily coordinated transdisciplinary project KlimaRhön aimed at developing adaptation strategies in water management in the UNESCO biosphere reserve Rhön in Central Germany. Experts agree that scientific and stakeholders’ knowledge should be involved to develop adaptation strategies, which requires good integration tools.

To identify adaptation strategies in the participatory process of the project KlimaRhön, we integrated the knowledge of hydrologists, sociologists and stakeholders while embracing uncertainty with a Bayesian Belief Network. For this, sociologists introduced that the acceptance of relevant actors is needed to implement adaptation measures and hydrologists introduced a range of potential future changes in groundwater recharge. In the first workshops of the participatory process, the stakeholders jointly identified possible adaptation measures. In the last workshops, we focused on two adaptation measures, which are 1) the protection of springs taking into account pasture water supply and 2) the fusion of small water suppliers in a region, and planned to find strategies to stimulate their implementation. For this, the stakeholders identified the relevant actors whose acceptance to implement those adaptation measures is needed. Then, the stakeholders identified and weighted factors that influence the acceptance of the relevant actors to implement the respective adaptation measure. This knowledge was then integrated in two Bayesian Belief Networks (for two adaptation measures) and a suitable communication of the Bayesian Belief Networks, which also focused on the communication of the embraced uncertainty, was developed. In the last workshop in the participatory process, the Bayesian Belief Networks were presented to the stakeholders and discussed. In the presentation, the stakeholders could explore which combinations of factors can enhance the acceptance of the relevant actors for the adaptation measure and thus the probability that they implement it for different degrees of climate change impacts.

The conditional probability tables for the Bayesian Networks were derived directly from the stakeholder weightings. Thus, stakeholders did not need to fill out conditional probability tables, which would have been difficult for most of them, and time-consuming. Bayesian Belief Networks show the uncertainty of possible future conditions through the many possible combinations of factors, which might have enhanced the understanding of stakeholders for the need of flexible adaptation strategies. The stakeholders appreciated the good overview of the many interdependencies and their influence on the acceptance of the relevant actors to implement the adaptation measure. In this contribution, we present our integration approach, the Bayesian Belief Networks, its communication as well as its evaluation by the stakeholders. 

How to cite: Müller, L. and Döll, P.: Transdisciplinary knowledge integration and embracing of uncertainty with Bayesian Belief Networks in water management, EGU General Assembly 2023, Vienna, Austria, 23–28 Apr 2023, EGU23-2094, https://doi.org/10.5194/egusphere-egu23-2094, 2023.

EGU23-4485 | PICO | HS1.1.4 | Highlight

Translating hydrology research into practice: A Canadian Perspective 

Alain Pietroniro, Prabin Rokaya, Corinne Schuster-Wallace, and John W Pomeroy

Hydrology research is regarded as vital for advancing human development and environmental conservation through improved hydrological process understanding and by devising solutions to address water management challenges. This is particularly acute in a time of global change and the need to find pathways to water sustainability.  Success for research in hydrology is often measured through quantitative research outputs, such as the number of journal publications, citation indices, number of students trained, patents, and external research funding. User involvement in the research and development process is rarely considered a metric for success in hydrology. Despite successful scientific or engineering advancements, a greater scientific understanding of hydrology and ever-increasing publications, much of the research has limited uptake by practitioners and implementation into practice, leading to a growing gap between research and practice.  This lack of utilisation is not due to a lack of need by users, but rather is a symptom of the disconnect between these advances and research that would most add value to practitioners and their application needs. We explore some outstanding challenges in translating academic research into practice and make some recommendations to bridge the increasing gaps between research and practice through a transdisciplinary approach, user engagement metrics in funded research and strong knowledge mobilization. We also discuss the success and challenges of these approaches in the Global Water Futures program along with lessons learned.  

How to cite: Pietroniro, A., Rokaya, P., Schuster-Wallace, C., and Pomeroy, J. W.: Translating hydrology research into practice: A Canadian Perspective, EGU General Assembly 2023, Vienna, Austria, 23–28 Apr 2023, EGU23-4485, https://doi.org/10.5194/egusphere-egu23-4485, 2023.

As the longest river in Asia, the Yangtze River has shown its impact on human societies with floods recorded since 12th century. In 1931, the Yangtze River has manifested its force again with one of the deadliest floods ever recorded in Chinese history, causing 422,499 deaths, damages to more than 25.2 million people and 58.7 billion m2 farmland. Similar flood occurred again in 1954, resulting in 31,762 deaths, damages to 18.9 million people and 31.7 billion m2 farmland. Researches have shown that 1954 flood being larger and higher compared to 1931 flood. However, it is still unclear for what reason that a more severe flood leading to less damage. Was it because of the change of policy and what can we learn from it? To answer this question, first, we constructed a conceptual framework of 1930s and 1950s agricultural society. Then, the flood inundation process of 1931 and 1954 floods was reconstructed with gauged rainfall dataset. After referring to the investigation report, the inundation information was applied to re-estimate the flood damage on farmland, houses, and residents under different scenarios. Furthermore, apart from traditional countermeasures, the effect of society transformation with floods were estimated using the potential crop production (PCP). Finally, an agent-based model (Farmer Landlord Inundation Production, FLIP) was constructed to simulate the agricultural transformation and its impact on residents’ response. The results have shown that traditional countermeasures were of certain effect. For example, the reinforcement of levees in 1950s was more effective in reducing inundation area of 8% compared to 1931, while the construction of detention basins accounted for 2%. However, with only traditional countermeasures failed to explain the relative success of agricultural product in 1954. Which, according to PCP result, the observed rice production was 12% higher than potential in 1954, while it was 29% lower in 1931. Here we assumed such difference could be ascribed to drastic society transformation in 1930s and 1950s (e.g., increase of absentee landlords in 1930s, land reform movement in 1950s). The effect of which was partially demonstrated with FLIP model, indicating an increase of crop production after eliminating landlords during floods. Our results demonstrate how society transformation are likely to affect the damage of and response to floods in a different (sometimes more important) way from traditional countermeasures in modern Chinese history. We anticipate our research to be a starting point towards deeper understanding of human and hazard, and the knowledge of which is likely to be applicable to many other regions and times.

How to cite: Liu, C., Kawasaki, A., and Shiroyama, T.: Flood protection in a changing society: a perspective from historical agriculture transformation during 1931 and 1954 floods in Yangtze River Basin, China, EGU General Assembly 2023, Vienna, Austria, 23–28 Apr 2023, EGU23-6794, https://doi.org/10.5194/egusphere-egu23-6794, 2023.

EGU23-8725 | PICO | HS1.1.4

RadClim BSR - Towards a Radar-based Precipitation Climatology for the Baltic Sea Region 

Blaine Lowry, Andreas Hoy, and Hossein Hashemi

Project Background: The RadClim BSR project aims to establish the feasibility of developing a radar-based precipitation climatology in the Baltic Sea Region (BSR). The project involves partners in countries across the BSR including Sweden, Estonia and Poland. The status of radar data archiving, utility of the data, and any data harmonisation requirements across the partner countries and the BSR in general are being investigated. Partners in Sweden, Estonia and Poland are acting as country coordinators, reaching out to a large range of actors to thoroughly explore their needs pertaining to radar climatology, utilising a user needs survey (ongoing from early February-March 2023). Consultations with the national weather services in Germany and Finland, who have already undertaken steps in radar climatology development, are aiding in ensuring best practices are adhered to. This seed project has the intention of laying the framework for the full development of a radar-based precipitation climatology (datasets and visualisations) spanning the BSR, relevant for a large range of actors in the near future.

EGU poster: At EGU 2023, we will present the results of the user needs survey that was distributed to a wide range of relevant actors in the project partner countries of Sweden, Estonia and Poland. The surveys were translated into each countries official language before being distributed, to maximise participation and ensure all representatives who should offer their perspective could, regardless of English language capacity. Through to the end of the project in early 2024, the results from this survey will be analysed and summarised, to form the user needs assessment for a radar-based precipitation climatology across the BSR.

How to cite: Lowry, B., Hoy, A., and Hashemi, H.: RadClim BSR - Towards a Radar-based Precipitation Climatology for the Baltic Sea Region, EGU General Assembly 2023, Vienna, Austria, 23–28 Apr 2023, EGU23-8725, https://doi.org/10.5194/egusphere-egu23-8725, 2023.

EGU23-11221 | PICO | HS1.1.4

Progress and perspectives in hydrological modelling and forecasting across scales 

Antara Dasgupta and the Joint Virtual Workshop ECMWF-CEMS-C3S-HEPEX-GFP Team

The last decades have seen unprecedented progress in ensemble hydro-meteorological modelling and forecasting on a range of temporal and spatial scales. Such progress also raises new challenges, especially with regards to connecting hydrology from global to local scales, as well as hydrological sciences research to operations. To discuss these challenges, the Joint Virtual Workshop "Connecting global to local hydrological modelling and forecasting: challenges and scientific advances” (29 June - 1 July 2021) was recently organized [*]. It brought together over one thousand people from around the world, including scientists, disaster managers and stakeholders operating at the local, national, continental and global scales. In this study, we summarise the state-of-the-art presented and discussed at the workshop. In particular, we provide an early career perspective on the insights and experiences shared during the workshop, highlighting recent advances and ongoing challenges in hydrological modelling and forecasting, as well as on the use of forecasts for decision-making from global to local scales. From the many topics covered during the workshop, which included hydrological model development (including Earth System modelling, machine learning applications and hybrid dynamic-statistical forecasting), skill assessment, uncertainty communication, forecasts for early action, co-production of services and incorporation of local knowledge, Earth Observations, and data assimilation, we focus on the contributions to science and operations from the hydrological forecasting community. Our analysis highlights the critical need to better connect hydrological services and impact models to societal needs and local decision-making through effective communication, capacity building and co-production. The core work of creating new methods and products and the move towards Earth System modelling need to be balanced by multidisciplinary collaborations that effectively bring tools to practice. We expect that research tackling these challenges will increase further in the next decade.

[*] Workshop organizers: European Centre for Medium-Range Weather Forecasts (ECMWF), the Copernicus Emergency Management (CEMS) and Climate Change (C3S) Services, the Hydrological Ensemble Prediction EXperiment (HEPEX), and the Global Flood Partnership (GFP)

How to cite: Dasgupta, A. and the Joint Virtual Workshop ECMWF-CEMS-C3S-HEPEX-GFP Team: Progress and perspectives in hydrological modelling and forecasting across scales, EGU General Assembly 2023, Vienna, Austria, 23–28 Apr 2023, EGU23-11221, https://doi.org/10.5194/egusphere-egu23-11221, 2023.

EGU23-11305 | PICO | HS1.1.4

Decision-support system for water availability estimation 

Sašo Šantl, Maja Sevšek, and Katarina Zabret

The management of water resources, their allocation and use is mainly directed by the policy at the strategic scale. In that way, the different sector interests can be coordinated, as well as principles of sustainable water use and goals of environmental conservation can be ensured. However, even the decision making at the strategic scale (i.e. at the level of the entire country) requires reliable information that provides sufficient support for decision makers in planning the further use of water resources. Accordingly, at the initiative of the decision maker (Ministry of the Environment and Spatial Planning of the Republic of Slovenia) the researchers at the Institute for Water of the Republic of Slovenia have developed a decision support system for water availability estimation in Slovenia. A multi-criteria approach was used, combining scientific approach in estimating the available water amounts (discharge in ungauged locations) and coordinated approach in setting the criteria, indicating the vulnerability of the environment according to specific locations and the attractiveness of that locations in terms of water use. The scientific aspect was used for the establishment of the methodology for the estimation of discharge in ungauged locations. Different machine learning and data mining techniques were tested, however Top kriging (Skøien et al., 2006) method was selected as the most accurate for assessment of the discharge across the country’s catchments, larger than 10 km2. Estimated characteristic discharges were then revised according to the environmental needs to evaluate the amounts of water available for further use. However, the selection of the criteria was performed through interdisciplinary collaboration with experts and decision makers from various fields. During settling of the selected criteria, the importance of cooperation was shown. Our initial list of the criteria was not sufficient, as some of the aspects were addressed differently or overlooked. It should also be taken into account that representatives of different fields determined the different importance of the included criteria.

Acknowledgement: The development of the decision-support system was financed by the Ministry of the Environment and Spatial Planning of the Republic of Slovenia through the Institute’s annual work programme for years 2020 – 2023.

How to cite: Šantl, S., Sevšek, M., and Zabret, K.: Decision-support system for water availability estimation, EGU General Assembly 2023, Vienna, Austria, 23–28 Apr 2023, EGU23-11305, https://doi.org/10.5194/egusphere-egu23-11305, 2023.

EGU23-11755 | PICO | HS1.1.4 | Highlight

OUTLAST - Development of an operational, multi-sectoral global drought hazard forecasting system 

Stefan Siebert, Neda Abbasi, Johannes Cullmann, Petra Döll, Tina Trautmann, Harald Köthe, Harald Kunstmann, and Jan Weber

Climate change and drought have imposed tremendous pressure on water resources in most parts of the world. Therefore, addressing drought impacts on water resources and socioeconomic conditions has gained attention to develop mitigation and adaptation strategies. Many innovative and cutting-edge modeling systems set up by academic institutions are exclusively available to academics and are not accessible or used by practitioners or policymakers. These constraints are in particular relevant in data poor regions where decision making and drought management are hampered by a lack of drought information. Therefore, within OUTLAST project (Development of an Operational, mUlTi-sectoral globaL drought hAzard forecasting SysTem), we aim to develop and implement the first worldwide, multi-sectoral, and operational drought forecasting system for quantifying drought hazard in water supply, riverine and non-agricultural land ecosystems, rainfed and irrigated agriculture. The forecasts provided by OUTLAST can also support better drought management and therefore contribute to the achievement of several Sustainable Development Goals (SDGs) of the United Nations, particularly SDG1(no poverty), SDG2 (zero hunger), SDG6 (clean water and sanitation), SDG13 (climate action) and SDG15 (life on land). In cooperation with pilot users in the project regions of Lake Victoria (Burundi, Kenya, Rwanda, Tanzania, and Uganda) and West and Central Asia (e.g. Afghanistan, Armenia, Azerbaijan, Iran, Iraq, Lebanon, Oman, Syria, Tajikistan, Turkey, Uzbekistan), the value of global-scale forecasts released for the subsequent six months for data-poor and transboundary basins will be tested. Through co-design, relevant drought indicators will be defined and the web portal and pilot applications of these global forecasts for drought management and water governance will be developed. We also systematically investigate the predictive ability of global-scale drought forecasts based on bias-corrected seasonal ensemble weather forecasts, as well as the factors influencing the predictive skill in terms of (i) the type of drought (soil moisture and hydrological droughts) and the affected sector, (ii) the length of the forecast period, (iii) seasonal and regional differences in predictive quality. Two global-scale models (WaterGAP and GCWM) will be further developed to provide operational and monthly drought forecasts globally at 0.5-degree spatial resolution and for a six-month forecast period. The applicability of the data and models for drought forecasting will be rigorously examined for different locations, sectors, and periods using historical reanalysis data and historical ensemble forecasts. This will entail using historical meteorological "forecasts" to generate drought forecasts for historical drought events reported for these regions and validating them regionally. Finally, an automated operational modeling system will be created to download and process the necessary meteorological input data, calculate the drought indicators, visualize them appropriately, and transfer them to the Global Hydrological Status and Outlook System (HydroSOS) at World Meteorological Organization (WMO). Through a flexible implementation (cloud-based), we will enable a potential transfer of the forecast system to different users. The use of the HydroSOS-portal of WMO to visualize project results and as an outlet of the drought forecast products will make optimal use of synergies and ensure high visibility and impact of the research performed in OUTLAST.

How to cite: Siebert, S., Abbasi, N., Cullmann, J., Döll, P., Trautmann, T., Köthe, H., Kunstmann, H., and Weber, J.: OUTLAST - Development of an operational, multi-sectoral global drought hazard forecasting system, EGU General Assembly 2023, Vienna, Austria, 23–28 Apr 2023, EGU23-11755, https://doi.org/10.5194/egusphere-egu23-11755, 2023.

EGU23-11975 | PICO | HS1.1.4 | Highlight

Open Methods in Operational Flood Hydrology – Considerations for researchers and practitioners 

Christopher Skinner and Duncan Faulkner

The merits of open science for hydrology are firmly established, widely embedded into research culture, and increasingly adopted within operational agencies. In the UK, it is common practice now for data collected by, and/or funded by, public bodies to be made available openly, licensed for both commercial and non-commercial use, and accessible via data portals and APIs. However, these same standards are not routinely applied to the methods and models used to evaluate flood risk.

This work, part of the UK’s community-led 25-year Flood Hydrology Roadmap, considered the potential role of open methods within UK operational practice. A review of the relevant literature was used to establish a definition and framework for open methods, which was refined based on consultation with practitioners. The framework was used to assess the current levels of ‘openness’ across UK practice, placing this in the context of challenges including governance, funding, and development histories. The study also considered international case studies of where open methods have been successfully implemented for hydrology and in other fields.

The review was used to develop an aspirational vision for the future operational use of open methods in UK flood hydrology, identifying key barriers and recommendations to manage and overcome them. Working with artists, creative provocations have been created to further the conversation, both within hydrology and along the subsequent links in the flood risk modelling chain. The review recommendations will be summarised as considerations relevant to both researchers and practitioners.

How to cite: Skinner, C. and Faulkner, D.: Open Methods in Operational Flood Hydrology – Considerations for researchers and practitioners, EGU General Assembly 2023, Vienna, Austria, 23–28 Apr 2023, EGU23-11975, https://doi.org/10.5194/egusphere-egu23-11975, 2023.

EGU23-11980 | PICO | HS1.1.4

Pro-active flood risk managment using a transdisciplinary multi-method-approach 

Mariele Evers, Adrian Almoradie, Joshua Ntajal, Britta Höllermann, Georg Johann, Helene Meyer, Annika Schüttrumpf, Sylvia Kruse, Fafali Ziga-Abortta, Daniel Bachmann, Roman Schotten, Mawuli Lumor, Charlotte Norman, and Kwaku Adjei

Water related extreme events are causing most of the disasters worldwide. Between 2001 and 2018 around 74% disasters were water-related and during the past 20 years, the total number of deaths caused only by floods and droughts exceeded 166,000, while floods and droughts affected over three billion people, and caused total economic damage of almost US$700 billion (EM-DAT, 2019). The number of events with water related extremes are expected to increase due to climatic and land use changes.

Thus, it is of utmost importance to identify ways to reduce water related risks. Potential hazards, exposure and vulnerability have to be identified, published and communicated. This is done for example in the European Union in a coordinated way, based on the European Flood Risk Management Directive. However, identifying risk only is not leading to actual actions and is not  sufficient to reduce risks. This became again obvious in 2021 when extreme floods caused more than 180 deaths in Germany and caused around 46 billion Euro damage. This and other events are revealing the need for closing the gap between theory and practise to establish proactive and preventive strategies and implementation of measures.

Ghana is one of the countries most prone to floods in West Africa. Its annual occurrence often leads to disasters that are mostly felt by the urban poor. Despite the existence of salient activities conducted in order to reduce the flood risk in Ghana, there are still persisting challenges (Almoradie et al. 2020).

In order to overcome the implementation gap from science to practice a participatory and transdisciplinary mixed-method approach for Ghana is pursuied. Transdisciplinary research integrates knowledge from various scientific disciplines and non-academic actors.In this way, results can be developed for challenges that are of use to society and science.In the long term, transdisciplinary research strengthens knowledge about the human-water/flood system, the desired state of this system and the way to achieve this state by transformative adaptation.

A participatory mixed-method approach comprising hydrological and hydrodynamic modelling, participatory mapping, questionnaires, workshops, focus group discussion, system dynamic modelling and the analysis of vulnerability including failure of critical infrastrcuture were employed (Evers et al. 2021) for three case study areas in Ghana. The dynamics of human-flood-interaction are identified together with practioneers and adaptation measures were identified in a participatory way. By this approach we are aiming to make our research actionable and to design and implement knowledge translation mechanisms.


Almoradie, A.*, de Brito, M.M.*Evers, M., Bossa, A., Lumor, M., Norman, C., Yacouba, Y., Hounkpe, J. (2020) Current flood risk management practices in Ghana: gaps and opportunities for improving resilience. International Journal of Flood Risk Management, doi:10.1111/jfr3.12664.

Evers, M., Almoradie, A., de Brito, M. M., Höllermann, B., Ntajal, J., Lumor, M., Bossa, A., Norman, C., Yira Yacouba, Y. Y.,J. H. Jean Hounkpe (2021): Flood risk management in Ghana: gaps, opportunities, and socio-technical tools for improving resilience, EGU General Assembly 2021, online, 19–30 Apr 2021, EGU21-12683, doi:/10.5194/egusphere-egu21-12683


How to cite: Evers, M., Almoradie, A., Ntajal, J., Höllermann, B., Johann, G., Meyer, H., Schüttrumpf, A., Kruse, S., Ziga-Abortta, F., Bachmann, D., Schotten, R., Lumor, M., Norman, C., and Adjei, K.: Pro-active flood risk managment using a transdisciplinary multi-method-approach, EGU General Assembly 2023, Vienna, Austria, 23–28 Apr 2023, EGU23-11980, https://doi.org/10.5194/egusphere-egu23-11980, 2023.

Most existing climate impact assessments in Nepal only consider a limited number of generic climate indices such as means. Few studies have explored climate extremes and their sectoral implications, which in turn are key for informing policy and practice. This study evaluates future scenarios of extreme climate indices from the list of the Expert Team on Sector-specific Climate Indices (ET-SCI) and their sectoral implications in the Karnali Basin in western Nepal. First, future projections of 26 climate indices relevant to six climate-sensitive sectors in Karnali are made for the near (2021–2045), mid (2046–2070), and far (2071–2095) future for low- and high-emission scenarios (RCP4.5 and RCP8.5, respectively) using bias-corrected ensembles of 19 regional climate models from the COordinated Regional Downscaling EXperiment for South Asia (CORDEX-SA). Second, a qualitative analysis based on expert interviews and a literature review on the impact of the projected climate extremes on the climate-sensitive sectors is undertaken. We also used widely available global data sets such as DesInventar and national census data and disaster-specific mixed-effects regression models to assess the impact of precipitation extremes on landslide and flood mortality.  Both the temperature and precipitation patterns are projected to deviate significantly from the historical reference already from the near future with increased occurrences of extreme events. Results show winter in the highlands is expected to become warmer and dryer. The hot and wet tropical summer in the lowlands will become hotter with longer warm spells and fewer cold days. Low-intensity precipitation events will decline, but the magnitude and frequency of extreme precipitation events will increase. Furthermore, an increase in one standardized unit in maximum one-day precipitation increases flood mortality by 33%, and heavy rain days increase landslide mortality by 45%.

How to cite: Bharati, L. and Chapagain, D.: Policy and practice relevant climate change impact assessments: Case study, Western Nepal, EGU General Assembly 2023, Vienna, Austria, 23–28 Apr 2023, EGU23-13241, https://doi.org/10.5194/egusphere-egu23-13241, 2023.

EGU23-13956 | PICO | HS1.1.4

Optimisation of the water and climate science, policy and practice nexus: Insights from the AfriAlliance knowledge brokerage events. 

Jean-Marie Kileshye Onema, Uta wehn, Mamohloding Tlhagale, Seyram Sossou, and Tarryn Quayle

Over a five year period, a systemic approach to water and climate solutions refer to as social innovation was developed in the framework of the AfriAlliance project. The approach recognised the need to combine five aspects for increased relevance and synergies for the water and climate science, policy and practices. The above mentioned aspects included technological solutions, governance structures, capacity development, a business roadmap and knowledge brokerage events. This manuscript documents lessons learned from the fifteen knowledge brokerage events held across the African Continent.  These events provided a platform to 1060 participants who came across 125 innovations. Policy makers, funders, utility operators, scientists, non-governmental organisations, river’s authorities and organisations, entrepreneurs and practioners were represented. The AfriAlliance knowledge brokerage events covered all the 5 African sub-regions. These events were designed and implemented in an innovative way providing participants ample opportunity to network and engage with innovators after their pitch presentations. Specialised and high-level panels provided policy makers, funders and international cooperating partners an opportunity to share their perspectives with innovators and the audience. Policy makers recurrently indicated the need to align water and climate innovations and solutions to existing priorities and frameworks. Funders and international cooperating partners highlighted the limited capacity from innovators in terms of scalability and access to funding. These events also brought up the difficulty of always getting the right audience especially when the knowledge brokerage event took place in the framework of specialized conferences. The Covid-19 pandemic introduced also an additional layer of complexity and required some adaptation to the face to face set-up that was initially designed. Hence two out of the fifteen events took place online. The virtual setup appeared to reach a broader geographical audience but the interactions were not as effective as those organised in person.  These events have shown a considerable potential to bring together scientists, policy makers and practioners in order to match topical solution providers and the users. On the other hand, these kind of knowledge brokerage events remain project dependent and adhoc in nature for one to expect some long-term impact.

How to cite: Kileshye Onema, J.-M., wehn, U., Tlhagale, M., Sossou, S., and Quayle, T.: Optimisation of the water and climate science, policy and practice nexus: Insights from the AfriAlliance knowledge brokerage events., EGU General Assembly 2023, Vienna, Austria, 23–28 Apr 2023, EGU23-13956, https://doi.org/10.5194/egusphere-egu23-13956, 2023.

EGU23-16702 | PICO | HS1.1.4

Advancing community water resources modeling in the Cooperative Institute for Research to Operations in Hydrology (CIROH) 

Steve Burian, Martyn Clark, Chaopeng Shen, Ray Spiteri, James Halgren, Arpita Patel, Ashley van Beusekom, Sagy Cohen, and Fred Ogden

The Cooperative Institute for Research to Operations in Hydrology (CIROH) is a consortium of 28 institutions to advance the National Oceanic and Atmospheric Administration’s (NOAA) science and services capabilities to provide actionable water resources intelligence. CIROH’s research aims to improve water prediction and supports four broad themes: (1) water resources prediction capabilities; (2) community water resources modeling; (3) hydroinformatics; and (4) application of social, economic and behavioral science to water resources prediction. CIROH outcomes will inform hydrological process understanding, operational forecasting techniques and workflows, community engagement in water modeling, open-source software development, translation of forecasts to actionable products, and use of predictions in decision making.


This presentation will focus on CIROH’s research in community water modelling. In this theme, CIROH research focuses on advancing the predictive capabilities of the next-generation National Water Resources Modeling framework (NextGen framework) that is being developed for operational large-domain water prediction at NOAA’s National Water Center (NWC). The presentation will give examples of ongoing CIROH model development efforts to (1) integrate physical process representations into the NextGen framework across multiple levels of process granularity; (2) assess accuracy-efficiency trade-offs in the numerical solution of model equations across large spatial domains; (3) coupling process components that have hitherto been neglected in large-domain terrestrial system models (e.g., glacier hydrology, snow redistribution, connectivity of wetlands, land-atmosphere interactions over sparse forests, tile drainage, etc.); and (4) use hybrid machine learning methods to advance large-domain parameter estimation capabilities. The presentation will also highlight the establishment of research enabling infrastructure to support CIROH’s ongoing modeling advancement efforts. In summary, we will identify major challenges encountered and the high-priority research that is needed to advance capabilities in large-domain hydrologic prediction.

How to cite: Burian, S., Clark, M., Shen, C., Spiteri, R., Halgren, J., Patel, A., van Beusekom, A., Cohen, S., and Ogden, F.: Advancing community water resources modeling in the Cooperative Institute for Research to Operations in Hydrology (CIROH), EGU General Assembly 2023, Vienna, Austria, 23–28 Apr 2023, EGU23-16702, https://doi.org/10.5194/egusphere-egu23-16702, 2023.

EGU23-17248 | PICO | HS1.1.4

Enhancing the science-policy-practice nexus for effective and sustainable wetland Management in Southern Africa 

Dzikamayi Tanaka Nyatoro, Jean-Marie Kileshye Onema, Budzanani Tacheba, and Jane Olwoch

Effective natural resources management, especially of wetlands, are vital for the sustainability of livelihoods. This is further buttressed in Southern Africa where competing uses and users are increasingly putting pressure on these finite resources. The Southern African Science Service Centre for Climate Change and Adaptive Land Management (SASSCAL) with financial support from the African Union and the European Commission in the framework of the GMES programme endeavoured to develop a geoportal tool for effective wetland Management through a project called Wetland Monitoring and Assessment Service for Transboundary Basins in Southern Africa (WeMAST). WeMAST has an emphasis on capacity building and awareness raising for wetland assessment and monitoring in the following four transboundary river basins (Cuvelai, Okavango, Limpopo and Zambezi) across the SADC region. The WeMAST geoportal, developed during phase one, provides hydro-meteorological and physiographic attributes assessment and monitoring of wetlands. These include the spatial and temporal extent and status of wetlands, land cover and uses dynamics, flooding, vulnerability and fire indices. For the second phase, WeMAST puts emphasis on developmental impact on the ground hence some deliberate efforts are in place in order to enhance synergies between the scientists behind the concepts, the users, private sector and local communities on the ground as well as policy makers with the overall responsibilities of guiding the implementations of developmental pathways. In Phase II, policy and decision makers in the target countries (Angola, Botswana, Namibia, South Africa, Zambia and Zimbabwe) need to support upscaling and operationalization of the WeMAST geoportal.  As a result, the project consortium has now been designed in order to foster more interactions between stakeholders involved in wetland management through knowledge brokerage events where the geoportal tool, its products and services are disseminated, tested and validated to a great extent. Similarly an interface with policy makers has been established within the consortium through WaterNet via the Water Resources Technical Committee (WRTC) in order to appraise and involve SADC ministers in charge of water and natural resources management twice annually. The innovative and well-crafted approach of the WeMAST project under GMES offers a considerable room for enhanced synergies between policy makers, Scientists, the private sector and practioners for sustainable and effective wetland Management in the SADC region.

How to cite: Nyatoro, D. T., Onema, J.-M. K., Tacheba, B., and Olwoch, J.: Enhancing the science-policy-practice nexus for effective and sustainable wetland Management in Southern Africa, EGU General Assembly 2023, Vienna, Austria, 23–28 Apr 2023, EGU23-17248, https://doi.org/10.5194/egusphere-egu23-17248, 2023.

Recent developments in hydrologic science include a strong focus on open-source data sets and modeling tools. These developments can easily be leveraged into hydrologic education in the form of classroom exercises and term projects. Here we present a computational exercise designed to teach the concept of model structure uncertainty to students, using a specific selection of two catchments and two simple conceptual models from open-source data and tools.

The exercise first familiarizes the students with the modeling tool they will use and then has them calibrate and evaluate model performance on each combination of model and catchment. For these specific catchment and models, model structure uncertainty is the dominant source of uncertainty (compared to data, parameter and objective function uncertainties). The exercise includes guiding questions that help the students reach the defined learning goals. Trials at the Technische Universität Dresden show that the exercises are effective in doing so. This introduction to open-source models and data yields the benefit of being easily expanded on during further exercises and term projects.

How to cite: Knoben, W. and Spieler, D.: An example of using open-source data and hydrology models for classroom exercises and term projects, EGU General Assembly 2023, Vienna, Austria, 23–28 Apr 2023, EGU23-2675, https://doi.org/10.5194/egusphere-egu23-2675, 2023.

EGU23-2741 | Posters virtual | EOS2.4

Introducing the use of Open Data into the secondary education: A study on inland water quality 

Chrysanthi Tziortzioti, Elias Dimitriou, and Irene Mavrommati

Public and private organizations and institutions distribute a large volume of Open Data on a continuous basis with aim of increasing efficiency, saving time or reducing costs. Technological advancement offers easy access to open datasets that have potentially added value as educational resources in teaching and learning processes. Open Data provides the educational community with learning experiences related to real world problems and allows students to engage with activities normally undertaken by professionals, without increasing the level of difficulty. In this study, we designed an educational intervention that uses open data from the Institute of Marine Biological Resources and Inland Waters, and we investigated how it can be integrated into the Greek secondary school curriculum. The results suggest that this open data-based practice has increased students’ motivation and has had an impact on selfbeliefs on topics of aquatic environments as well as an impact on students’ perception of the importance of aquatic environmental problems in rivers and lakes. 

How to cite: Tziortzioti, C., Dimitriou, E., and Mavrommati, I.: Introducing the use of Open Data into the secondary education: A study on inland water quality, EGU General Assembly 2023, Vienna, Austria, 23–28 Apr 2023, EGU23-2741, https://doi.org/10.5194/egusphere-egu23-2741, 2023.

EGU23-5020 | ECS | Posters on site | EOS2.4

Design and construction of a rainfall simulator: an interdisciplinary student project towards sustainable development goals achievement 

Mateja Klun, Klaudija Lebar, Katarina Zabret, and Andrej Zdešar

Precipitation is one of the essential parts of the hydrological cycle. Regardless of the important role that precipitation plays for life on Earth, in extreme conditions, such as high intensities and amounts, it can negatively affect various ecosystem services (e.g., flood protection, agriculture). Precipitation is spatially highly variable. Traditionally, precipitation, with rain as the most common type, is measured over very small surface areas (of a few square decimetres) by rain gauges or sensors. However, reliable and representative rainfall data are crucial for understanding the interconnection of different parts of the hydrological cycle (e.g., rainfall interception by vegetation, rainfall erosivity) and quantification of flood, drought, water quality, and other water-related problems. Reducing the negative consequences of the mentioned problems is part of the 2030 Agenda sustainable development goals. Therefore, an interdisciplinary student project on the design and construction of a rainfall simulator was submitted to the University of Ljubljana's call for sustainable development student projects. Rainfall simulators are recognized as important tools for studying the effects of rain on soil. Rainfall simulators can be used in controlled conditions in the laboratory or with additional settings also in the field. The design and construction of the simulator is entirely within the domain of the project team of six students of environmental civil engineering and electrical engineering. This includes the choice of pipe materials, pump capacity, size and type of spray nozzles, development of a control system for monitoring and recording of results, and, last but not least, the determination of rain properties we would like to simulate (e.g., intensity). Three pedagogical mentors and one mentor outside the academia supervise the project. With such a project, group work and co-creation are encouraged among students, theoretical knowledge acquired within the curriculum is transferred into practice and knowledge is exchanged between different disciplines. Skills such as communication, critical thinking, organization of tasks and time management, interdisciplinary problem solving, analytical reasoning, information and technology literacy, are developed in the project. Additionally, such equipment will be used for teaching and research purposes in the future, which is another sustainable feature of this project.

How to cite: Klun, M., Lebar, K., Zabret, K., and Zdešar, A.: Design and construction of a rainfall simulator: an interdisciplinary student project towards sustainable development goals achievement, EGU General Assembly 2023, Vienna, Austria, 23–28 Apr 2023, EGU23-5020, https://doi.org/10.5194/egusphere-egu23-5020, 2023.

EGU23-8427 | Posters on site | EOS2.4

Web-apps as active learning tools in hydrology classrooms 

John Gannon

Active learning strategies such as simulations or problem sets have been shown again and again to be critically useful for helping students understand complex concepts. Students develop a more thorough understanding of processes or problem solving strategies when they are able to practice or explore them with hands-on activities. In hydrology, however, there are several concepts taught, even in introductory classes, where developing suitable activities for this type of learning is difficult. For example, even a simple water balance activity often requires a relatively thorough understanding of spreadsheets or a lot of tedious hand-calculations if students are going to explore relationships between multiple inputs and outputs. Similarly, even the most basic discussion of how a simple box model works is difficult to supplement with an activity that doesn’t involve spreadsheets or writing computer code. Furthermore, it is often beyond the scope of introductory level hydrology classes to teach programming or spreadsheet skills, and hand calculations often take a prohibitive amount of time. Web applications offer a tool to address some of these issues. With the development of tools like Shiny apps for R or Python, instructors with programming experience can relatively easily create interactive learning tools for their classes. Many studies in fields such as statistics and mathematics have shown that these web-apps aid in student learning. Furthermore, hosting and sharing these apps is becoming more accessible, with organizations like CUAHSI running shiny servers. In this presentation, I will show two examples of implementations of a web app to aid in student learning, one on the concept of a water balance, and one on running and parameterizing a basic catchment hydrology model. I will also discuss tools and strategies for building and hosting your own shiny app to address the learning goals for your classes.

How to cite: Gannon, J.: Web-apps as active learning tools in hydrology classrooms, EGU General Assembly 2023, Vienna, Austria, 23–28 Apr 2023, EGU23-8427, https://doi.org/10.5194/egusphere-egu23-8427, 2023.

EGU23-10592 | Posters on site | EOS2.4

Lessons from Adapting Applied Hydrology Instruction to Open Source Software Tools 

Daniel Kovacek and Steven Weijs

Resource use decisions in the extractive resource industry in Canada are supported in various ways by collection and analysis of water resources data.  Data quality assurance and analysis are influenced by the methods taught in academic training, the tools used to teach and practice, and industry standards and culture.  The growth in popularity of computer programming languages such as Matlab, Python, and R, and new web-based collaboration and publishing tools from Project Jupyter (Notebook, Book) have created opportunities for teaching applied hydrology in new ways that can support the evolving nature of data in hydrology practice, namely in treating open-ended problems more typical to industry practice.

The abrupt shift to web-based instruction at the undergraduate level in 2019 spurred development of interactive instructional content in an applied hydrology course at the University of British Columbia, in Vancouver, Canada.  Using the open-source Jupyter Book software framework, we developed open-access course material to complement the hydrology theory curriculum.  The new course content consists of a set of tutorials designed to give students a practical introduction to important components of engineering practice such as data quality assurance, and uncertainty in hydrological models.  The content is provided as an open-access online textbook with an embedded Python code interpreter.   With each successive cohort, the material has adapted to student feedback, namely in treating the types of open problems common in industry, and in the amount of programming experience required. 

How to cite: Kovacek, D. and Weijs, S.: Lessons from Adapting Applied Hydrology Instruction to Open Source Software Tools, EGU General Assembly 2023, Vienna, Austria, 23–28 Apr 2023, EGU23-10592, https://doi.org/10.5194/egusphere-egu23-10592, 2023.

EGU23-12489 | Posters on site | EOS2.4

The benefits of Open Science approaches when teaching hydrology 

Stan Schymanski

Open science is commonly associated with open access publications, and FAIR (findable, accessible, interoperable and reusable) data. Open source code is progressively being considered an essential component of open science, too. However, even if all these ingredients are available and openly accessible, it is often impossible to reproduce the graphs in a paper from the data and code provided. Which script was used on what part of the data to generate a given plot? Which version of a cited database was used, and what query to extract the presented data points? Moreover, even the basic steps of a scientific analysis, i.e. the derivation of mathematical equations, are often not traceable. Ever came across the famous “it follows that”, where, what follows, contains variables that were not present in the preceding equations?

Here I present part of a hydrology course based on a framework designed to address many of the above challenges. It is based on the open-source RENKU platform and deployed in a Jupyterhub instance at https://renkulab.io. RENKU enables the tracking of datasets and their versions, and records executions of code with their respective input and output files, producing a knowledge graph of the entire project and enabling the user to easily re-do all necessary steps to update relevant results whenever a data or code file is updated. RENKULAB uses the docker system to help reproduce the computational environment needed to re-execute the analysis. This greatly facilitates collaborative research and learning, as it removes the need for collaborators and students to recreate the computational environment in their local systems. Integration of GITLAB in RENKULAB facilitates student feedback and collaborative problem solving through issue tracking, where students can gain points by submitting meaningful issues and helping others.

The course also uses an open source package for mathematical derivations (ESSM, https://essm.readthedocs.org), which is based on the Python package Sympy, and facilitates clear definitions of variables including their dimensions and units, and dimensionally consistent fundamental equations. These can then be used to deduce derived equations by automatic solving of systems of equations for unknown variables, derivatives, integrations, and many other mathematical operations contained in Sympy. The package combines graphical depiction of equations, as seen in papers, with computational reproducibility of derivations and transparent re-use of equations in numerical code.

By employing Open Science approaches from the start, students become naturally accustomed to reproducible research and can use the skills they learn in any professional environments, as they are not bound to proprietary software that their future employers and collaborators may or may not have purchased licenses for.

How to cite: Schymanski, S.: The benefits of Open Science approaches when teaching hydrology, EGU General Assembly 2023, Vienna, Austria, 23–28 Apr 2023, EGU23-12489, https://doi.org/10.5194/egusphere-egu23-12489, 2023.

EGU23-12552 | Posters virtual | EOS2.4

The UK Hydrology Skills and Satisfaction Survey 

Christopher Skinner, Annie Ockelford, Andy King, Esther Goodship, and Helen Harfoot

The UK’s 25-year Flood Hydrology Roadmap was published in 2022. The Roadmap was developed by the UK hydrology community to identify the areas of greatest need and to deliver actions across four themes: Ways of Working, Data, Methods, and Scientific Understanding. Ways of Working Action W5 aims to build the ‘skills, esteem and value’ of flood hydrology but this is currently not possible as there is no baseline available. To provide a baseline, a UK-wide survey of hydrologists and the users of hydrology was conducted.

The survey was designed after consultation with hydrologists working in academia, consultancies, and other authoritative bodies in the UK. The objective of the survey was to baseline the current number, skills, satisfaction, backgrounds, and diversity of hydrologists practicing in the UK. A further consideration was to understand how prepared hydrology is as a discipline for anticipated changes in methods and skill requirements. The survey covered both low and high flow hydrology, not just flood hydrology.

In this presentation, we will summarise the key results of the survey and highlight the implications for hydrology training, education, and teaching. Finally, we will share our recommendations, from the perspective of operational users of hydrology, for the future skills needs in hydrology.

How to cite: Skinner, C., Ockelford, A., King, A., Goodship, E., and Harfoot, H.: The UK Hydrology Skills and Satisfaction Survey, EGU General Assembly 2023, Vienna, Austria, 23–28 Apr 2023, EGU23-12552, https://doi.org/10.5194/egusphere-egu23-12552, 2023.

EGU23-13006 | ECS | Posters on site | EOS2.4

Teaching by doing or a field course in our backyard: the first geosensing of the environment course in this geography institute 

Natalie Ceperley, Linus Fässler, Peter Leiser, and Bettina Schaefli

The ubiquitous "field trips in geography" type courses often exclude students on the basis of mobility and flexibility, have a high travel footprint, and rely primarily on passive knowledge.  In the summer of 2022, we taught a master level geography course, Geosensing of the Environment for the first time at the Geography Institute at the University of Bern. The course was team taught by the institute field technician, the assistant and master student, and a researcher in hydrology. This course is unlike anything currently or previously taught at our institute. It put the students in charge of their own scientific trajectories, taking them on a full scientific cycle "journey" from idea and question, to device development and measurement, to analysis and communication. The main goal of the course was for all students to use raspberry pi micro controllers or similar devices and a variety of sensors however they wish to build a scientific measuring device, while maintaining this course's relevance and connection to all physical geography subjects.

The pedagogical framework of the course was innovative in a number of ways, namely bringing together a self-learning module teaching the basics of programming microelectronic boards, a hands-on workshop where they got to build their own sensor device based on their own scientific questions, and a follow-up phase where they got to propose a bigger project using their progress in the workshop as a pilot. Students particularly appreciated the open-ended nature of the course that could be adapted to their interests. Although the students' backgrounds were not technical, by the end of the course, we had one group measuring CO2 over a freeway, one group analyzing temperature variation caused by balcony vegetation, and one group measuring water temperature profiles around Bern. In the end, one device was based on raspberry-pi pico and a second based on the sparkfun thing plus RP2040. In the future, we hope to put more emphasis on energy management and communication of sensor networks.  Improvements to this course must balance the goal to empower each student to "start from scratch" or to provide ready-to-go kits, leaving students to mainly choose which sensors they use.  Our main lessons learned concern teaching technical subjects in non-technical disciplines, focusing on instrumentation to transcend disciplines, transforming field courses to more accessible and lower-impact formats, and empowering students to build sensing devices starting with a blank sheet of paper (and a raspberry pi).

How to cite: Ceperley, N., Fässler, L., Leiser, P., and Schaefli, B.: Teaching by doing or a field course in our backyard: the first geosensing of the environment course in this geography institute, EGU General Assembly 2023, Vienna, Austria, 23–28 Apr 2023, EGU23-13006, https://doi.org/10.5194/egusphere-egu23-13006, 2023.

EGU23-13088 | Posters on site | EOS2.4

Making MacGyvers: lessons from a decade of maker education 

Rolf Hut, Miriam Coenders, and Gijs Vis

Regular visitors of the EGU General Assembly are familiar with the ‘MacGyver’ sessions where hydrologists present measuring solution they have designed, build and tinkered (often ducttaped) themselves. We often get asked how we convey the MacGyver mentality to our students: how to teach them the skills and attitude to tackle their own problems hands on?

We teach this in the undergraduate course ‘measuring water’. In this course the learning goals include teaching hydrology students how to measure the different states and fluxes in the water cycle. We approach this by having teams of students design, make and demonstrate their own sensor. This ‘maker-education’ approach is known for stimulating intrinsic motivation in students to work on their projects, but it also comes with its own challenges: how to make sure that all students learn about all different types of sensors and not only about the one they choose? How to steer students towards choosing a project topic that is both challenging enough and not too challenging, without giving them the idea you are curbing their freedom to choose their own topic?

In this presentation we will reflect on lessons learned from a decade of teaching ‘Measuring Water’ and provide take-aways applicable for all geoscientific teaching.

How to cite: Hut, R., Coenders, M., and Vis, G.: Making MacGyvers: lessons from a decade of maker education, EGU General Assembly 2023, Vienna, Austria, 23–28 Apr 2023, EGU23-13088, https://doi.org/10.5194/egusphere-egu23-13088, 2023.

EGU23-14794 | Posters on site | EOS2.4

Interactive understanding of groundwater hydrology and hydrogeology – the iNUX project 

Thomas Reimann, Roland Barthel, Steffen Birk, Daniel Fernandez-Garcia, and Zhao Chen

Groundwater represents more than 97% of the globally available freshwater resources. Groundwater is situated in geological structures in the subsurface and is therefore not visible, difficult to characterize, and manage. As a consequence, it is often not adequately considered by authorities, the general public – and in education. However, teaching and learning Hydrogeology and Groundwater Management at universities, but also as a part of continuing education training for professionals, is essential to deal with future challenges. For this reason, it is important to use suitable teaching material to improve the understanding of the complex topic of groundwater among these target groups. The recent challenge of the COVID-19 pandemic has increased the demand for digital and remote teaching. An ongoing Erasmus+ cooperation project named iNUX – interactive understanding of groundwater hydrogeology aims to address the need for digital teaching material. The project aims to achieve an interactive and digital learning environment in hydrogeology and groundwater management with a European but also global target of teachers and students.

Existing experience in teaching relevant groundwater subjects from highly reputable European universities will be used to develop interactive and digital teaching material focusing on basic and applied hydrogeology. The teaching material will cover basic theory in combination with field and laboratory applications in different European environments (Northern Europe, Central Europe, and the Mediterranean). The teaching material will comprise (1) various types of videos (e.g., field experiments, lab experiments, screencasts of calculations and software use), (2) interactive Jupyter notebooks that combine explanation with live code (e.g., based on Python), (3) various types of questions and problems that allow different assessments to enhance self-controlled learning of students. All materials are intended as open source and publicly available. The iNUX activities also comprise initiatives to establish interest groups to combine efforts towards larger pools of commonly developed digital teaching material (e.g., question pools) and to link with other activities like the 'Groundwater project' (https://gw-project.org/).

How to cite: Reimann, T., Barthel, R., Birk, S., Fernandez-Garcia, D., and Chen, Z.: Interactive understanding of groundwater hydrology and hydrogeology – the iNUX project, EGU General Assembly 2023, Vienna, Austria, 23–28 Apr 2023, EGU23-14794, https://doi.org/10.5194/egusphere-egu23-14794, 2023.

HS1.2 – Innovative sensors and monitoring in hydrology

EGU23-515 | ECS | Posters on site | HS1.2.1

Estimating sheet flow velocities using quinine as a fluorescent tracer in low luminosity conditions: laboratory and field experiments 

Soheil Zehsaz, João L. M. P. de Lima, M. Isabel P. de Lima, Jorge M. G. P. Isidoro, and Ricardo Martins

This study presents a technique based on the use of quinine as a fluorescent tracer, to estimate sheet flow velocities over various surface coverings (e.g., bare; mulched; vegetated; paved) in low luminosity conditions (e.g., night; twilight; shielded environments). Quinine glows when exposed to UVA light and in the concentrations used is not harmful to the environment. Experimental work was conducted for studying sheet flows in the i) laboratory (using a soil flume), over bare and mulched surfaces, and ii) field, over vegetated and paved surfaces. Flow velocities were estimated based on the injection of a quinine solution into the water flow.  In these experiments, dye and thermal tracer techniques were used as a benchmark for assessing the performance of the quinine tracer. Optical and infrared cameras were used to record the movement of the tracers’ plumes in the flow. The surface velocity of the flow was estimated by tracking the tracers’ plumes leading-edge and calculating their travel distance over a certain time lapse. Overall, the visibility of the quinine tracer was better in comparison to the dye tracer. However, under some circumstances, lower than the visibility of the thermal tracer. Nonetheless, the results show that all three tracers yielded similar estimations of the flow velocities. Therefore, when exposed to UVA light the quinine tracer can be useful to estimate sheet flow velocities over a wide variety of soil and urban surfaces in low luminosity conditions. Despite some inherent limitations of this technique (e.g., invisible under bright light conditions or heavy mulched/vegetated cover; need of a UVA lamp), its main advantage is the high visibility of the quinine fluorescent tracer under UVA light for fade light conditions (e.g., night; twilight; shielded environments such as close conduits), which creates new opportunities for tracer-based surface flow velocity measurements in surface hydrology studies.

How to cite: Zehsaz, S., de Lima, J. L. M. P., de Lima, M. I. P., Isidoro, J. M. G. P., and Martins, R.: Estimating sheet flow velocities using quinine as a fluorescent tracer in low luminosity conditions: laboratory and field experiments, EGU General Assembly 2023, Vienna, Austria, 23–28 Apr 2023, EGU23-515, https://doi.org/10.5194/egusphere-egu23-515, 2023.

EGU23-649 | ECS | Posters on site | HS1.2.1

Near Real-Time Depth Change Monitoring on Inland Water Bodies Using Sentinel-1 and Dynamic World Data 

Utku Berkalp Ünalan, Onur Yüzügüllü, and Ayşegül Aksoy

Monitoring the depth changes in lakes is crucial to understanding hydrological dynamics and water quality changes. In developed countries, the authorities monitor the lake depths regularly; however, it might be different in developing and underdeveloped countries. In this study, we aim to develop a near-real-time SAR-based depth change monitoring system for lakes by focusing on shoreline pixels. For this purpose, we developed a framework using the Sentinel-1 GRD and Sentinel-2 Dynamic World land cover datasets available on the Google Earth Engine. Sentinel-1 data provides us with the necessary temporal resolution for frequent monitoring. For the initial development phase, we consider five ground monitoring stations in Sweden and one in Turkey. The approach starts by detecting water bodies within a selected area of interest using Sentinel-1. Then it extracts shoreline pixels to calculate the change in the VV and VH sigma naught and VV-VH and VV+VH Pauli vectors. Extracted differences are further classified according to the temporally closest Dynamic World data to handle the temporal difference for each land cover type. Next, we eliminate outlier values based on the percentiles, and from the remaining data, we sample each landcover class for modeling. From many of the tested frameworks, we obtained an R2 of 0.79 with Gaussian Process Regression. Currently, in this framework, we observed an underestimation of higher values and an overestimation of lower values within a range of ±0.4 cm. Furthermore, considering the chosen six lakes, we observed a negative correlation between depth change and polarimetric features obtained from samples taken from land covers of grass and flooded vegetation, which is typical for natural lakes. In the second step of the development, we will increase the number of samples by including lakes from Switzerland and further develop the model.

How to cite: Ünalan, U. B., Yüzügüllü, O., and Aksoy, A.: Near Real-Time Depth Change Monitoring on Inland Water Bodies Using Sentinel-1 and Dynamic World Data, EGU General Assembly 2023, Vienna, Austria, 23–28 Apr 2023, EGU23-649, https://doi.org/10.5194/egusphere-egu23-649, 2023.

Monitoring dissolved methane in aquatic ecosystems contributes significantly to advancing our understanding of the carbon cycle in these habitats and capturing their impact on methane emissions. Low-cost metal oxide semiconductors (MOS) gas sensors are becoming an increasingly attractive tool to perform such measurements, especially at the air-water interface. However, the performance of MOS sensors in aquatic environmental sciences has come under scrutiny because of their cross-sensitivity to temperature, moisture, and sulfide interference. In this study, we evaluated the performance and limitations of a MOS methane sensor when measuring dissolved methane in waters. A MOS sensor was encapsulated in a hydrophobic ePTFE membrane to impede contact with water but allow gas perfusion. Therefore, the membrane enabled us to submerge the sensor in water and overcome cross-sensitivity to humidity. A simple portable, low-energy, flow-through cell system was assembled that included an encapsulated MOS sensor and a temperature sensor. Waters (with or without methane) were injected into the flow cell at a constant rate by a peristaltic pump. The signals from the two sensors were recorded continuously with a cost-efficient Arduino UNO microcontroller.. Our experiments revealed that the lower limit of the sensor was in the range of 0.1-0.2 uM and that it provided a stable response at water temperatures in the range of 18.5-28oC. More information at Butturini, A., & Fonollosa, J. (2022). Use of metal oxide semiconductor sensors to measure methane in aquatic ecosystems in the presence of cross‐interfering compounds. Limnology and Oceanography: Methods20(11), 710-720.

How to cite: Butturini, A. and Fonollosa, J.: Metal oxide semiconductor (MOS) sensors to measure methane in aquatic ecosystems. An eficient DIY low  cost application., EGU General Assembly 2023, Vienna, Austria, 23–28 Apr 2023, EGU23-1221, https://doi.org/10.5194/egusphere-egu23-1221, 2023.

EGU23-1636 | Posters virtual | HS1.2.1

Using the hydrological model for filling the missing discharge data by using multi-site calibration 

Ankit Singh, Hemant Kumar Dhaka, Pragati Prajapati, and Sanjeev Kumar Jha

The river discharge data is one of the most important pieces of information to regulate various water resources, including flood frequency analysis, drought and flood prediction, etc. The missing observer discharge data, even a short gap, influences the whole analysis and gives a totally different result. Filling data gaps in streamflow data is thus a critical step in any hydrological study. Interpolation, regression-based analysis, artificial neural networks, and modeling are all methods for generating missing data. While using the hydrological model to generate the data, we first need to calibrate the hydrological model. The single-site calibration of the hydrological model has its own limitations, due to which it does not correctly predict the streamflow at intermediate gauge locations. This is because, while calibrating the model for the final outlet, we tune the parameters that affect the results for the final outlet only and neglect the intermediate sites' output. In this study, we demonstrate the importance of multi-site calibration and use the calibrated hydrological model to generate the missing data at intermediate sites.

For this study, we selected the Godavari River basin and calibrated it at the final outlet (single-site calibration) and at 18 + 1 outlets (multi-site calibration). The whole basin is divided into 103 subbasins, and the Soil and Water Assessment Tool (SWAT) hydrological model is used for this study. After the successful multi-site calibration, we generated the missing data at 25 different gauging locations. The initial results from single-site calibration (NSE (0.57) and R2 (0.61)) show good agreement between observed and simulated discharge for the final outlet. The multi-site calibration analysis is in progress, and full results will be presented at the conference.

How to cite: Singh, A., Dhaka, H. K., Prajapati, P., and Jha, S. K.: Using the hydrological model for filling the missing discharge data by using multi-site calibration, EGU General Assembly 2023, Vienna, Austria, 23–28 Apr 2023, EGU23-1636, https://doi.org/10.5194/egusphere-egu23-1636, 2023.

EGU23-2681 | Posters on site | HS1.2.1

A low cost real-time kinematic dGPS system for measuring glacier movement 

Kirk Martinez, Jane Hart, Sherif Attia, Graeme Bragg, Marcus Corbin, Michael Jones, Christian Kuhlmann, Elliot Weaver, Richard Wells, Ioannis Christou, and Emily James

Glacier movement has been measured over the years using commercial units such as those from Leica. The aim is to measure point movements on the glacier surface in order to capture fine-grained data about its movement. This can also help to calibrate satellite-based approaches which have much lower resolution. Commercial dGPS recorders cost thousands of Euros so our project is creating a solution using new lower cost dGPS boards which could enable their use by more earth scientists.

The u-blox Zed-F9P based boards from Sparkfun can be used as a base station to send dGPS corrections to “rover” units on the glacier via a radio link. Each measurement is accurate to about 2cm depending on conditions. In our design the radio is used by the rovers to forward good fixes back to the base station, which then uses off-site communications to send the data home. Two types of internet link have been enabled: using a nano-satellite board (by SWARM) and a more traditional GSM mobile phone board (for locations with coverage). Both these boards are also available from Sparkfun – making most of the modules off-the-shelf. However our power supply is optimised to save power and charge the lithium ion battery from a solar panel. A real-time clock chip is used to wake up the system to take readings and transmit data, so the sleep power is only 0.03 mW enabling a year-long lifetime. The whole system is controlled by a Sparkfun Thing Plus SAMD51 which provides the required four serial connections and a circuitpython  environment. The full system will be installed in Iceland in the summer of 2023 and replace the previous prototype based on Swift Piksi Multi units which had shown the measurement principle to be sound.

How to cite: Martinez, K., Hart, J., Attia, S., Bragg, G., Corbin, M., Jones, M., Kuhlmann, C., Weaver, E., Wells, R., Christou, I., and James, E.: A low cost real-time kinematic dGPS system for measuring glacier movement, EGU General Assembly 2023, Vienna, Austria, 23–28 Apr 2023, EGU23-2681, https://doi.org/10.5194/egusphere-egu23-2681, 2023.

EGU23-4844 | Posters on site | HS1.2.1

Quality control of stream water-stage using Hilbert-Huang Transform 

Yen- Chang Chen and Wu-Hsien Hsiao

Hydrological data, especially water stage and discharge, is very important for water resources planning and development, hydraulic structure design, and water resources management. Thus the hydrological data has to be observed and collected regularly and continuously. The hydrological data can be affected by many factors such as people, instruments, and climate. Therefore, the collected hydrological data still need to be subject to quality control and inspection to eliminate unreasonable data to ensure the accuracy and reliability. Traditionally, the quality control and inspection of stream water-stage is mainly manual. The verification of water stage data needs experienced hydrologists to judge the correctness of the data, and cannot be processed automatically. It is time consumed, costly, and labor intensive to process the quality control of stream water stage. Therefore, it is necessary to develop a feasible model to automatically check stream water-stage for providing reliable and accurate hydrological data.

This study applies Hilbert-Huang Transform (HHT) to process stream water-stage. The HHT is composed of Empirical Mode Decomposition (EEMD) and Hilbert transform (HT). The EEMD decomposes stream water-stage into many intrinsic mode functions (IMFs) and a residual. The first IMF component is used for Hilbert transform conversion to obtain the time amplitude energy relationship diagram. The amplitude fluctuation of the corresponding component of the stream water-stage, the amplitude value of the outliers can be revealed. When the amplitude value is larger than usual, there may be outliers, and vice versa. It depends on the threshold that is established in this study as the basis for filtering the incorrect water-stage. Therefore automatically inspecting the water-stage data can be achieved. The model for automatic inspecting procedure developed by this study will greatly reduce the manual quality control, not only shorten the checking time, save manpower, but also provide reliable and correct river water stage data.

How to cite: Chen, Y.-C. and Hsiao, W.-H.: Quality control of stream water-stage using Hilbert-Huang Transform, EGU General Assembly 2023, Vienna, Austria, 23–28 Apr 2023, EGU23-4844, https://doi.org/10.5194/egusphere-egu23-4844, 2023.

EGU23-4878 | Posters on site | HS1.2.1

Trials and design iterations experienced developing a low-cost depth trawl to sample macroplastic through the water column of a tidal river. 

David Higgins, Renata Correia, Hooi Siang Kang, Lee Kee Quen, Tan Lit Ken, Andre Vollering, Stijn Pinson, Thaine H. Assumpção, and Thomas Mani

Understanding the transport behaviour of mismanaged plastic waste in riverine and estuarine environments is growing. However, many studies to date focus on the surface layer transport while a limited number look to measure the vertical distribution of plastic waste within these systems. Factors such as density, shape, the influence of wind and flow velocity can determine the vertical distribution of the plastic waste in a river, but many knowledge gaps remain. With this, and as technology developers move to create innovative river surface focused interception solutions to extract plastic waste, a greater understanding of the transport behaviour of sub-surface plastic debris is required. Here, we present a comprehensive overview of the development stages required to build and deploy a low-cost depth trawl tool designed to sample plastic waste at a depth of up to 5m in a heavily polluted river in Malaysia. Topics covered include tool design concepts, manufacturing methods, onsite testing, river deployment learnings and sampling results. Field data is compiled from over 60 sampling surveys conducted over 14 days in several locations along the Klang River, Malaysia. The depth trawl is mounted to a locally available fishing boat (sampan) and consists of two steel horizontal arms, a steel frame, two winches, cables, weights, five nets, and is operated manually with the assistance of a solar-powered motor. The dimensions of each net are 30cm (W) x 50cm (H) x 100cm (L) with a mesh size of 30mm x 30mm. To ensure that the nets remain aligned vertically during deployment, a weight of 15kg is tied to the bottom of the net system on both sides. Samples were collected every 1 metre to a depth of 5 metres. Each sampling was conducted for 15 minutes, six times per day with an interval of 1 hour between samples to allow for changes in the tide and river flow direction. An ADCP was deployed in parallel to the depth trawl to provide measurements of flow velocity variation at the river surface and with depth. In addition, this paper reviews the depth trawl system’s capabilities and recommendations for further studies and applications in the field.

How to cite: Higgins, D., Correia, R., Kang, H. S., Quen, L. K., Ken, T. L., Vollering, A., Pinson, S., H. Assumpção, T., and Mani, T.: Trials and design iterations experienced developing a low-cost depth trawl to sample macroplastic through the water column of a tidal river., EGU General Assembly 2023, Vienna, Austria, 23–28 Apr 2023, EGU23-4878, https://doi.org/10.5194/egusphere-egu23-4878, 2023.

EGU23-5922 | Posters on site | HS1.2.1

Effectiveness-assessment of nature-based flood mitigation using networked, low cost DIY environmental monitoring from FreeStation 

Sophia Burke, Arnout van Soesbergen, and Mark Mulligan

FreeStations are mature low-cost, networked, DIY environmental sensors and data loggers, developed since 2014  and now deployed around the world.  Build instructions are open source at www.freestation.org and based on high availability, low cost but accurate and robust components (with builds typically 3% the parts-cost of an equivalent proprietary monitoring systems).  This allows investment in a network of environmental loggers at the cost of a single, proprietary logger.  

FreeStations have been widely deployed in the DEFRA Natural Flood Management (NFM) national trials in the UK, and analytical methods developed to examine the performance of leaky dams, retention ponds, regenerative agricultural practices and other nature based solutions in mitigating flood risk at downstream assets.

These deployments usually consist of FreeStation weather stations: recording rainfall volume, rainfall intensity, air temperature, humidity and pressure as well as solar radiation, wind speed and direction.  The rainfall volume and instantaneous intensity are the most important for NFM studies.  Alongside weather stations, FreeStation sonar-based stage sensors are used, alongside river profile scan from a FreeStation LIDAR, to monitor change in river discharge due to an NFM intervention, relative to discharge at a downstream asset at risk.  Readings are taken at 10-minute intervals over multiple years.

A series of web based methods have been built as part of the FreeStation //Smart: platform to monitor and manage data from deployments and to analyse data to better understand flood mitigation by the key types of intervention.  In testing at more than 10 sites in the UK over a period of 2-3 years per site, large volumes of data have been collected at low cost and in support of local stakeholders during the H2020NAIAD and H2020ReSET projects.  

The data indicate the importance of careful design in leaky debris dams, the limited impact of inline retention ponds and the significant capacity of low-till farming methods to mitigate downstream flooding.  The effectiveness of NFM depends upon the number and scale of interventions, the proportion of the discharge at the downstream asset at risk which they affect (i.e. the downstream proximity of the asset at risk) and the capital and maintenance costs of the interventions. 

Low-cost approaches to environmental monitoring will be critical for developing the evidence base needed to better understand what nature based solutions work, where for water.  Low cost, internet-connected devices are easy to monitor and maintain, low risk and capable of extensive deployment to address the challenge of geographical variability which means that the impacts of specific NFM interventions are highly site specific. 

How to cite: Burke, S., van Soesbergen, A., and Mulligan, M.: Effectiveness-assessment of nature-based flood mitigation using networked, low cost DIY environmental monitoring from FreeStation, EGU General Assembly 2023, Vienna, Austria, 23–28 Apr 2023, EGU23-5922, https://doi.org/10.5194/egusphere-egu23-5922, 2023.

EGU23-8165 | Posters on site | HS1.2.1

Developing a smart sensor network for soil moisture monitoring in forests 

Nikita Aigner, Christine Moos, and Estelle Noyer

Forests play a crucial role in regulating the water content of soils and thus influence runoff formation, but also the susceptibility to drought or forest fires. However, the extent to which forests influence soil moisture is difficult to quantify and depends on several parameters, such as precipitation intensity and duration, and terrain or soil properties. To capture the temporal and spatial variability of soil moisture in forests, large-scale and long-term measurements are necessary. Currently, such measurements are relatively expensive and complex and thus generally lacking or restricted to agricultural areas.  

Our current work focuses on the development of a low-cost soil moisture sensor that uses off the shelf parts and can be deployed at scale to provide continuous long-term measurements. To increase adoption and ensure the digital sustainability of our concept, the project will be released open source to the general public.  

The sensor design is based around an ESP32 microcontroller to manage measurements with capacitive soil moisture sensors. For communication, we leverage the LoRa protocol and use infrastructure provided by the Things Network (TTN). Herein, we present the soft- and hardware architecture of a sensor prototype and results obtained from a proof-of-concept deployment. In addition, we discuss the calibration procedure and evaluation of capacitive soil moisture sensors (in comparison to time-domain reflectometry (TDR) sensors). Finally, we provide an outlook on future developments of our measurement system. The final goal of this project is to deploy sensors in several areas of interest that will allow for gathering data for a better understanding of the interaction of forests and soil moisture content.  

How to cite: Aigner, N., Moos, C., and Noyer, E.: Developing a smart sensor network for soil moisture monitoring in forests, EGU General Assembly 2023, Vienna, Austria, 23–28 Apr 2023, EGU23-8165, https://doi.org/10.5194/egusphere-egu23-8165, 2023.

EGU23-10497 | ECS | Posters virtual | HS1.2.1

Synchronized mapping of water quantity and quality of a reservoir through an unmanned surface vehicle: A case study of the Daljeon reservoir, South Korea 

Kwang-Hun Lee, Shahid Ali, Yena Kim, Ki-Taek Lee, Sae Yun Kwon, and Jonghun Kam

This study developed a synchronized mapping technique for water quantity and quality via an unmanned surface vehicle (USV). The USV with the acoustic doppler current profiler (ADCP) and the multiparameter sonde of water quality sensors (YSI EXO2) was used for identifying spatial and seasonal patterns of the Daljeon reservoir in South Korea. With this technique, we measured bathymetry and nitrate concentration from August 2021 through July 2022 at the high resolution spatial resolution and tested the sensitivity of estimated nitrate loads to spatial variations of input variables (water volumes and nitrate concentrations). Results showed that measured bathymetry and nitrate concentration varies over the water surface of the reservoir and time, which are associated with seasonal variations of temperature and precipitation. Despite weak spatial variations of the nitrate concentration, the water level of the reservoirs showed strong spatiotemporal variations depending on the topography of the reservoir and the  rainfall occurrence. Furthermore, we figured out using the mean for nitrate load was underestimated by -20% of the nitrate load estimates by considering spatial variation. High-resolution bathymetry measurement play a role in estimating nitrate loads with a minor impact of spatial variations of measured nitrate concentrations. We found that rainfall occurrences more likely increase estimated nitrate loads when it accounts for spatially variations of input variables, particularly water volumes. This study proved the potential utility of USV in simultaneously monitoring water quantity and quality for integrative water resource management for sustainably development of our communities.

How to cite: Lee, K.-H., Ali, S., Kim, Y., Lee, K.-T., Kwon, S. Y., and Kam, J.: Synchronized mapping of water quantity and quality of a reservoir through an unmanned surface vehicle: A case study of the Daljeon reservoir, South Korea, EGU General Assembly 2023, Vienna, Austria, 23–28 Apr 2023, EGU23-10497, https://doi.org/10.5194/egusphere-egu23-10497, 2023.

EGU23-11411 | Posters on site | HS1.2.1

Automated ablation stakes to constrain temperature-index melt models 

Andrew D. Wickert, Katherine R. Barnhart, William H. Armstrong, Matías Romero, Bobby Schulz, Gene-Hua Crystal Ng, Chad T. Sandell, Jeff D. La Frenierre, Shanti B. Penprase, Maximillian Van Wyk de Vries, and Kelly R. MacGregor

We developed automated ablation stakes to measure colocated in-situ changes in ice-surface elevation and climatological drivers of ablation. The designs implement open-source hardware, including the Margay data logger, which records information from a MaxBotix ultrasonic rangefinder as well as a sensor to detect atmospheric temperature and relative humidity. The stakes and sensor mounts are assembled using commonly available building materials, including electrical conduit and plastic pipe. The frequent (typically 1–15 minute) measurement intervals permit an integral approach to estimating temperature-index melt factors for ablation. Regressions of ablation vs. climatological drivers improve when relative humidity is included alongside temperature. We present all materials required to construct an automated ablation stake, alongside examples of their deployment and use in Alaska (USA), Ecuador, Patagonia (Argentina), and the Antarctic archipelago.


a: Alaska, 2012
b: Alaska, 2013
c: Ecuador, 2016
d: Argentina, 2020
e: Antarctica, 2021

How to cite: Wickert, A. D., Barnhart, K. R., Armstrong, W. H., Romero, M., Schulz, B., Ng, G.-H. C., Sandell, C. T., La Frenierre, J. D., Penprase, S. B., Van Wyk de Vries, M., and MacGregor, K. R.: Automated ablation stakes to constrain temperature-index melt models, EGU General Assembly 2023, Vienna, Austria, 23–28 Apr 2023, EGU23-11411, https://doi.org/10.5194/egusphere-egu23-11411, 2023.

EGU23-11777 | Posters on site | HS1.2.1

A low cost multi-chamber system (“Greenhouse Coffins”) to monitor CO2 and ET fluxes under semi-controlled conditions: Design and first results 

Mathias Hoffmann, Wael Al Hamwi, Matthias Lück, Marten Schmidt, and Maren Dubbert

Determining greenhouse gas (GHG) fluxes, water (ET) fluxes and their interconnectivity within the soil-plant-atmosphere-intersphere is crucial, not only when aiming to find solutions for current agricultural systems to mitigate the global climate crises but also to adapt them to related challenges ahead, such as more frequent and severe droughts. In a first attempt for a better understanding, often laboratory and/or greenhouse pot experiments are performed, during which gas exchange is predominately measured using especially manual closed chamber systems. Commercially available systems to determine gas exchange in terms of CO2 and ET are, however, costly and measurements itself labour-intensive. This limits the amounts of variables to be studied as well as possible repetitions during a study. Additionally, it resulted in the long-term focus on agroecosystems of the northern hemisphere while agroecosystems of sub-Saharan Africa as well as Southeast Asia are still being underrepresented.

We present an inexpensive (<1.000 Euro), Arduino based, multi-chamber system to semi-automatically measure 1) CO2 and 2.) ET fluxes. The systems consists of multiple, self-sufficient, closet-shaped PVC “coffins”. The “coffins” a closed by a frontal door and periodically ventilated through a sliding window. Relays connected to the microcontroller are used to steer closure/opening (linear actuator) and ventilation (axial fans). CO2 and ET fluxes are determined through the respective concentration increase during closure by a low-cost NDIR CO­2 (K30FR; 0-10,000 ppm, ± 30 ppm accuracy) and rH sensor (SHT-41). Parallel measurements of relevant environmental parameters inside and outside the “coffins” are conducted by DS18B20 (temperature) and BMP280 (air pressure) sensors. Sensor control, data visualization and storage, as well as steering closure/opening and ventilation is implemented in terms of a wifi and bluetooth enabled, socket powered (9V), compact microcontroller (D1 RS32) based logger unit. Here, we present the design, and first results of the developed, low-cost multi-chamber system. Results were validated against results of customized CO2 and ET measurement systems using regular scientific sensors (LI-COR 850) and data logger components (CR1000), connected to each “coffin” by a multiplexer.  Flow-meter were used for measurement synchronization.

How to cite: Hoffmann, M., Al Hamwi, W., Lück, M., Schmidt, M., and Dubbert, M.: A low cost multi-chamber system (“Greenhouse Coffins”) to monitor CO2 and ET fluxes under semi-controlled conditions: Design and first results, EGU General Assembly 2023, Vienna, Austria, 23–28 Apr 2023, EGU23-11777, https://doi.org/10.5194/egusphere-egu23-11777, 2023.

EGU23-12622 | ECS | Posters on site | HS1.2.1

Water user Fab Labs: co-design of low-tech sensors for irrigated systems 

Paul Vandôme, Crystele Leauthaud, Simon Moinard, Insaf Mekki, Abdelaziz Zairi, and Gilles Belaud

Mediterranean agriculture is facing the challenge to produce sustainably with a water resource under pressure. As irrigated areas expand in response to increasing vulnerability to drought, it is essential to support water users towards better agricultural water management. We set up two Fab Labs on the shores of the Mediterranean (France and Tunisia) to bring together water users around a collective project: co-constructing innovations to address local water management issues. A range of low-tech, low-cost and open source IoT-based sensors emerged from this process. The technologies were tested with users during the 2022 irrigation season. The aim of this study is to provide feedback on this participatory method as a facilitator for creating and sharing innovation in rural territories and to discuss the opportunities, benefits and limitations related to the use of these new technologies. We believe that this work contributes to make the measurement of water flows - and thus their understanding and better management - more accessible to the agricultural sector.     

How to cite: Vandôme, P., Leauthaud, C., Moinard, S., Mekki, I., Zairi, A., and Belaud, G.: Water user Fab Labs: co-design of low-tech sensors for irrigated systems, EGU General Assembly 2023, Vienna, Austria, 23–28 Apr 2023, EGU23-12622, https://doi.org/10.5194/egusphere-egu23-12622, 2023.

EGU23-13072 | ECS | Posters on site | HS1.2.1

Precipitation Measurement from Raindrops’ Sound and Touch Signals 

Seunghyun Hwang, Jinwook Lee, Jeemi Sung, Hyochan Kim, Beomseo Kim, and Changhyun Jun

This study proposes a novel method for rainfall intensity estimation from acoustic and vibration data with low-cost sensors. At first, a precipitation measurement device was developed to collect sound and touch signals from raindrops, composed of Raspberry Pi, a condenser microphone, and an accelerometer with 6 degrees of freedom. To figure out whether rainfall occurred or not, a binary classification model with the XGBoost algorithm was considered to analyze long-term time series of vibration data. Then, high-resolution acoustic data was used to investigate the main characteristics of rainfall patterns at a frequency domain for the period when it was determined that rainfall occurred. As a result of the Short Time Fourier Transform (STFT), the highest frequency, mean and standard deviation of amplitudes were selected as representative values for minute data. Finally, different types of regression models were applied to develop the method for rainfall intensity estimation from comparative analysis with other precipitation measurement devices (e.g., PARSIVEL, etc.). It should be noted that the new device with the proposed method functions reliably under extreme environmental conditions when the estimated rainfall intensity was compared with measured data from ground-based precipitation devices. It shows that low-cost sensors with sound and touch signals from raindrops can be effectively used for rainfall intensity estimation with easy installation and maintenance, indicating a strong possibility of being considered in a wide range of areas for precipitation measurement with high resolution and accuracy

Acknowledgement

This work was supported by the National Research Foundation of Korea(NRF) grant funded by the Korea government(MSIT) (No. NRF-2022R1A4A3032838).

How to cite: Hwang, S., Lee, J., Sung, J., Kim, H., Kim, B., and Jun, C.: Precipitation Measurement from Raindrops’ Sound and Touch Signals, EGU General Assembly 2023, Vienna, Austria, 23–28 Apr 2023, EGU23-13072, https://doi.org/10.5194/egusphere-egu23-13072, 2023.

EGU23-14370 | Posters on site | HS1.2.1

Monitoring an ephemeral stream with a Teensy 3.2 + audio shield to determine water level only from the noise of a stream 

Linus Fässler, Natalie Ceperley, Peter Leiser, and Bettina Schaefli

River networks in the Alps are very complex and hold many unanswered research questions. For example, various assumptions must be made to when studying tributaries and small rivers. Namely, there is not a widely accepted tool to measure streamflow in small, mountain streams that can overcome their specific challenges affordably without large installations. For example, alteration between extremely high and no discharge volume is characteristic of intermittent rivers and ephemeral streams (IRES). Conventional measuring devices all require streambed installation, which exposes them to displacement or destruction by abruptly rising water levels. One solution, thus, is to remove the sensor from the streambed and measure from a distance. We have experimented with an acoustic sound recorder mounted above the stream as an alternative tool to assess water level. We designed a low-cost audio sensor powered by a microcontroller with an audio shield specifically for recording IRES. To ensure reproducibility, we used Arduino for programming the Teensy 3.2. Images of the water level in an IRES were simultaneously captured when possible (daylight) and used for calibration. The water level visible in the images correlated well with that determined from the audio recordings from our self-developed audio sensor (R2 = 95%). Based exclusively on the audio recording of an IRES, we can obtain a time series of the water level, at least when water was present. We are currently unable to determine consistently whether water is present nor state with certainty when the streambed is dry based solely on acoustic data. Nevertheless, this new sensor allows us to measure an alpine channel network at more locations and over longer time periods than previously feasible.

How to cite: Fässler, L., Ceperley, N., Leiser, P., and Schaefli, B.: Monitoring an ephemeral stream with a Teensy 3.2 + audio shield to determine water level only from the noise of a stream, EGU General Assembly 2023, Vienna, Austria, 23–28 Apr 2023, EGU23-14370, https://doi.org/10.5194/egusphere-egu23-14370, 2023.

The development of artificial reservoirs plays a considerable role in regulating the spatial and temporal distribution of irrigated rainfall and guaranteeing sustainable agricultural development. Many studies have used the area-storage relationship to obtain the storage capacity of on-farm reservoirs (OFRs), but it does not work for OFRs with persistent water surface area. In this study, we proposed an effective method to estimate the water storage of irrigated OFRs by combining multi-source remote sensing data and ground observation. We quickly derived the location of irrigated OFRs by using seasonal characteristics of irrigated OFRs and obtained high-precision water surface area using an object-oriented segmentation. We estimated water storage of irrigated OFRs by combining three different ways (i.e., Lidar-based, ground observation-based (photos), and surface area-based). The method performs well in three aspects, i.e., identifying on-farm reservoirs, extracting water surface area, and calculating water storage. The accuracy of identification reaches 94.1%, and the derived water area agrees well with the surveyed results, i.e., an overall accuracy of 97.8%, the root mean square error (RMSE) and the mean absolute errors (MAE) are 962 m2 and 766 m2, respectively. The obtained water storage is reliable using three different ways (i.e., the area-storage, Lidar-based, and photo observations-based methods), with accuracy of 98.8%, 95.2%, and 94.1%, respectively. The proposed method enables monitoring of the storage of multiple types of irrigated OFRs, particularly the photo observation-based method can deal with the storage of OFRs with persistent water areas, showing huge potential to promote irrigated water resource utilization efficiency.

How to cite: wang, Y.: Monitoring water storage of on-farm reservoirs using remote sensing and ground observation, EGU General Assembly 2023, Vienna, Austria, 23–28 Apr 2023, EGU23-15372, https://doi.org/10.5194/egusphere-egu23-15372, 2023.

Hydrology is still one of the most data scarce natural sciences. The large number of variables to measure, their extreme spatiotemporal gradients, and the often harsh and hostile environmental conditions all contribute to this issue. This challenge is even more pronounced in remote and extreme environments such as the tropics, and mountain regions, where the need for robust data is most acute.

Many new and emergent technologies can help with building more cost-effective, robust, and versatile hydrological monitoring systems. However, the speed at which these new technologies are being incorporated in commercially available systems is slow and dictated by commercial interests and bottlenecks.

An alternative solution is for scientists to build their own systems using off the shelf components. Open-source hardware and software, such as the Arduino and Raspberry Pi ecosystems, make this increasingly feasible. As a result, a plethora of global initiatives for open-source sensing and logging solutions have emerged.

But despite these new technologies, it remains a major challenge to build open-source solutions that equal the reliability and robustness of the high-end commercial systems that are available on the market. Sharing experiences, best practices, and evidence on the real-world performance of different designs may help with overcoming this bottleneck.

In this contribution, I summarize the experience gained from developing and operating over 300 open-source data loggers, built around the Riverlabs platform. This platform is mostly a compilation of existing open-source hardware and software components and solutions, which were refined further and tweaked for robustness and reliability in extreme environments. Our loggers have been installed in locations as diverse as Arctic Norway, the high Andes of Peru and Chile, the Nepalese and Indian Himalayas, the Somali desert, and the Malaysian rainforest, providing a wide range of real-world test-cases and performances.

How to cite: Buytaert, W.: Towards a robust, open-source logging platform for environmental monitoring in challenging environments: the Riverlabs toolbox, EGU General Assembly 2023, Vienna, Austria, 23–28 Apr 2023, EGU23-15989, https://doi.org/10.5194/egusphere-egu23-15989, 2023.

EGU23-17527 | ECS | Posters on site | HS1.2.1

Design of an affordable and highly flexible IoT station for multiple gas concentration monitoring 

Francesco Renzi, Flavio Cammillozzi, Giancarlo Cecchini, Alessandro Filippi, and Riccardo Valentini

The air quality monitoring is a core topic for European environmental policies and worldwide. At the same time technologies such as electrochemical or NDIR gas sensors became affordable and easy to implement in a customized design. A highly flexible monitoring station has been designed and build in order to obtain a customizable and affordable device. It is composed of two boards, one in charge of connectivity and processing while the other allows to insert up to 11 gas sensors. Such number is achieved through the use of three multiplexers that allow to spare input pins of the processor. Moreover the flexibility at the moment is achieved using sensors with the same form factor but adapters are under development to increase the adaptability of the system, both hardware and software. An Arduino MKR zero runs the application that can be run in three different modes: single measurement, time driven or position driven. The last feature is obtained through an optional on-board U-blox GNSS module that allows to georeference the performed measurements. This mode is mainly used when the measurement cell is applied on moving object, such as drones. The system is able to send the data collected and receive commands using MQTT protocol (HiveMQ broker) through a NB-IoT connection and interact with the user from an online dashboard created using Thingsboard. The use of the MQTT protocol allows to send the data to multiple endpoints if the data should be provided also to third parties. Moreover, the data and some parameters are also saved on a sd card. All the system is built on stand alone boards to achieve easy maintaince of the system and to allow a rapid change in the used technology (a plug and play LoRaWan module is under development). Being a multi-application platform, price of the device is of course highly dependent on the chosen set of sensors thus, in the end, on the application itself (i.e. Air pollution or gas emission in barns). To sum up, the device described is a possible solution for an affordable gas concentration measurement system that can be adapted to fit a large variety of use cases combining software and hardware solutions.

How to cite: Renzi, F., Cammillozzi, F., Cecchini, G., Filippi, A., and Valentini, R.: Design of an affordable and highly flexible IoT station for multiple gas concentration monitoring, EGU General Assembly 2023, Vienna, Austria, 23–28 Apr 2023, EGU23-17527, https://doi.org/10.5194/egusphere-egu23-17527, 2023.

EGU23-1088 | Orals | HS1.2.2

Lessons learned from catchment observatory and network design in the UK, rest of Europe and North-America 

Gemma Coxon, John P Bloomfield, Wouter Buytaert, Matt Fry, Gareth Old, and Thorsten Wagener

Many countries fund catchment observatories and networks to provide observational data, test models and hypotheses, discover new insights, catalyse the development of new technologies and enhance interdisciplinary collaboration. These catchment networks provide a wealth of observational data, yet synthesising information across catchment observatories to produce process-based understanding is challenging. To generalise findings from place-based studies, we need greater synthesis across catchment networks and thus careful consideration of the design and topology of catchment observatories and monitoring networks.

In this paper, we collate information from 80 catchment observatories/networks and conduct 21 questionnaires with project leads with the aim of reviewing the strengths and weaknesses of catchment observatories to provide recommendations that can inform future catchment observatory and network design. The catchment observatories encompass a wide range of flow regimes, science questions and spatial/temporal scales with 25, 33 and 22 observatories from the UK, Europe, and North America respectively. Most catchment observatories in the monitoring catalogue are concentrated in upland catchment systems monitoring flashy flow regimes, with very few focused on lowland systems and no catchment observatories focused on urban catchments. The choice of catchment observatory location was focused upon logistics and catchment characteristics, with logistics and the day-to-day running of the observatory highlighted as the aspect catchment observatory programme managers found most difficult. Many interviewees noted that the design of the observatory was a key phase in planning and an aspect they would have done differently.

Finally, we recommend key design guidelines for future catchment observatory and networks. This includes the need for a scoping and planning phase, community co-designed, digital infrastructure that enables FAIR data provision, and flexible and extensible catchment topology. Critically, knowledge transfer needs to be built in from the beginning of catchment observatories to enable transferability of new insights and understanding across linked catchment networks to tackle grand challenges within hydrology.


How to cite: Coxon, G., Bloomfield, J. P., Buytaert, W., Fry, M., Old, G., and Wagener, T.: Lessons learned from catchment observatory and network design in the UK, rest of Europe and North-America, EGU General Assembly 2023, Vienna, Austria, 23–28 Apr 2023, EGU23-1088, https://doi.org/10.5194/egusphere-egu23-1088, 2023.

EGU23-4589 | Orals | HS1.2.2

Digital Twin Water Management Platform - Innovative approach for optimal water management 

Jingon Kim, Kichul Kim, Junghwan Lee, Mookhyunk Kwon, Hyunjin Kim, and Youngsik Jo

Recently, digitalization has impacted drought and flood forecasting systems, and makes the application of technologies and advanced data processing techniques in the water management field possible. Especially, digital twin in the field of water management aims to effectively diminish unprecedented water-related issues such as floods and droughts using 3D objects and high-resolution spatial data. Climate change effects are expected to increase flood and drought risk through more frequent heavy precipitation and global temperature rise, and the water disaster sector is so complex, dynamic, and unpredictable that requires sophisticated management systems. The digital approaches showed effective prediction and decision-making support. This paper presents the state-of-the-art of digital twin concepts along with different digital technologies and techniques in water management contexts. The digital twin platform developed by K-water is a virtual representation of water management for dam operation and urban flood warning with water-related data. It presents a general framework of the digital twin in risk management, optimal operation, and decision-making in the water management and disaster forecasting field. This review also described the water data management, modeling including artificial intelligence, Radar, CCTV, rainfall-runoff module, analysis, prediction, and communication aspects of a digital twin. Digital twin platforms can support decision-makers as the next generation of digitalization paradigm by continuous and real-time water management of the cyber world and simulating the various events in the cyber world.

Keywords: Digital Twin, Dam Operation, River, Spatial Data, AI, Urban Flood

How to cite: Kim, J., Kim, K., Lee, J., Kwon, M., Kim, H., and Jo, Y.: Digital Twin Water Management Platform - Innovative approach for optimal water management, EGU General Assembly 2023, Vienna, Austria, 23–28 Apr 2023, EGU23-4589, https://doi.org/10.5194/egusphere-egu23-4589, 2023.

EGU23-4765 | ECS | Posters virtual | HS1.2.2

Non-contact Entropy-based flow Estimation in Himalayan Rivers 

Abhishek Kumar and Manoj Kumar Jain

Rapidly collected river discharge data can be used for flood forecasts, hydraulic structure design, and impromptu response during floods. This calls for the monitoring of both water level and velocity at the same time, which is not feasible using conventional invasive methods. Non-contact techniques like doppler radar and satellite remote sensing techniques are the sole options. Doppler radar sensors are gaining popularity in the recent decade due to their accuracy and user-friendly operation. The study was conducted using data collected at two gauging sites at Devprayag on Bhagirathi and Ganga, two significant Himalayan Rivers. This study compares the observed discharge measured using a current meter and ADCP with the entropy-based discharge estimated using radar telemetry data for water level and surface velocity. Radar-derived water level and one-point surface velocity observations were used to estimate the discharge using probability-based Shannon and Tsallis Entropy laws. The discharge varied from 77.09 to 4265.4 cumec, while the surface velocities ranged from 0.283 to 8.35 m/s. The estimated discharges using radars were compared with observed discharges using Goodness-of -fit statistics which showed a good agreement between observed and estimated discharges as well as velocities, suggesting that radars can be effectively used to estimate real-time discharge for its improved applications in Himalayan mountainous rivers.

How to cite: Kumar, A. and Jain, M. K.: Non-contact Entropy-based flow Estimation in Himalayan Rivers, EGU General Assembly 2023, Vienna, Austria, 23–28 Apr 2023, EGU23-4765, https://doi.org/10.5194/egusphere-egu23-4765, 2023.

EGU23-5779 | ECS | Posters on site | HS1.2.2

Reducing the operator effect in LSPIV image-based discharge measurements 

Guillaume Bodart, Jérôme Le Coz, Magali Jodeau, and Alexandre Hauet

The operator effect is a prominent error source in image-based velocimetry methods. The LSPIV method is known to be sensitive to the parameters and choices of the user, as shown in the literature and emphasized by the results of a video gauging intercomparison, the Video Globe Challenge 2020 (VGC2020) (Le Coz et al., 2021). The intercomparison was carried out during the COVID-19 lockdown of spring 2020 and involved 15 to 23 participants using the LSPIV method among other techniques on 8 videos representative of the diversity of river gauging conditions and imaging viewpoints. Each video came with a discharge reference and associated uncertainty.

An in depth investigation of the intercomparison results has been carried out to identify the most sensitive parameter(s) for each video and also to review the common setting mistakes (cf. Bodart et al., 2022). The investigation highlighted the strong impact of the image temporal sampling (extraction framerate) and of the velocity filtering on the discharge errors. The ortho-rectification and the surface coefficient were also found to be impacting in given cases.

Based on these observations, several assistance tools and automated filters are proposed to reduce the operator effect. They are evaluated on the intercomparison dataset. The assistance tools use available information (e.g. transect data) or basic user inputs (e.g. manual spotting of some velocities) to determine the optimal extraction framerate, grid points and searching area (SA) for LSPIV computation. The sequence of automated filters is built for the specific context of discharge measurement: spatial coherency of the velocities in a local neighborhood and temporal coherency of the velocities computed at a point. These velocity filters are systematic and do not require any input from the user.

The application of the assistance tools and automated filters to the intercomparison dataset leads to a significant improvement of the results. On the eight videos, the mean interquartile range of the percent error initially at 17% is reduced to 2% and the mean median of the percent error initially at -9% is reduced to 0.6% with the assistance tools and filters. The results are encouraging and can be implemented in software tools for the operational deployment of the LSPIV method for discharge measurement.

Le Coz, J., Hauet, A., and Despax, A. (2021). The Video Globe Challenge 2020, a video streamgauging race during the Covid-19 lockdown, EGU General Assembly 2021, online, 19–30 Apr 2021, EGU21-2116, https://doi.org/10.5194/egusphere-egu21-2116, 2021

Bodart, G., Le Coz, J., Jodeau, M., and Hauet, A.: Quantifying the operator effect in LSPIV image-based velocity and discharge measurements, EGU General Assembly 2022, Vienna, Austria, 23–27 May 2022, EGU22-4457, https://doi.org/10.5194/egusphere-egu22-4457, 2022.

How to cite: Bodart, G., Le Coz, J., Jodeau, M., and Hauet, A.: Reducing the operator effect in LSPIV image-based discharge measurements, EGU General Assembly 2023, Vienna, Austria, 23–28 Apr 2023, EGU23-5779, https://doi.org/10.5194/egusphere-egu23-5779, 2023.

EGU23-6587 | Posters on site | HS1.2.2

Bayesian calibration of a 1D hydrodynamic model used as a rating curve in a tidal river: Application to the Lower Seine River, France 

Felipe Mendez Rios, Jérôme Le Coz, Benjamin Renard, and Theophile Terraz

Hydrometric stations may be influenced by the sea tide, disrupting the stage-discharge relation and making it difficult to estimate discharge through a traditional rating curve. Twin-gauge stage-fall-discharge (SFD) rating curves, based on a flow friction equation and stage and water slope measurements, are a possible alternative, but they were found to perform poorly when the tide effect is strong. To capture the complex flow dynamics, including flow reversal, an approach via a 1D hydrodynamic model is proposed.

To set up the model, the cross-sectional geometry, friction coefficient, upstream discharge and downstream water level are required. In hydrodynamic modelling, the friction coefficients are the main calibration parameters and spatial changes of roughness combined with unsteady flow make their manual calibration difficult. Moreover, the understanding and quantification of uncertainties associated with data and model is an important step of the calibration process. Therefore, an automatic calibration of friction coefficients is proposed via Bayesian inference. In terms of numerical tools, the selected 1D hydrodynamic code is Mage, developed by INRAE, solving the 1D Saint-Venant equations for subcritical, transient flows. Likewise, the Bayesian Modeling (BaM) framework (https://github.com/BaM-tools) is used to specify prior information and estimate friction coefficients and their uncertainty, using stage and discharge observations.

The case study is the Lower Seine River in France, because it comes as a simple hydraulic model with a strong tidal effect with gauging campaigns and stage records available. Discharge time series of the Seine at Poses and of the Eure, the only significant tributary, are specified as upstream boundary conditions.  The downstream boundary condition is the stage time series of the Seine at Saint-Léonard, reflecting the tidal signal. Calibration data include stage records at different stations and times, and ADCP discharge measurements at Rouen during several tidal cycles.

For all reaches, a lognormal distribution with 95% probability interval [33; 49] is used as a prior for the Strickler coefficient. Bayesian estimation then provides their posterior distributions, represented by a large number of samples generated by means of a Markov Chain Monte Carlo (MCMC) algorithm. These samples can be used to identify optimal “maxpost” coefficients (maximizing the posterior density), but also to quantify and propagate their uncertainty. Thereafter, a propagation is performed to estimate the stage and discharge series of all cross-sections along with their uncertainty.

This study aims to provide an alternative solution for the continuous monitoring of discharge from stage records and upstream discharges in tidal rivers in order to improve flood forecasting, warning systems and the understanding of tidal-influence on hydrometric stations.

How to cite: Mendez Rios, F., Le Coz, J., Renard, B., and Terraz, T.: Bayesian calibration of a 1D hydrodynamic model used as a rating curve in a tidal river: Application to the Lower Seine River, France, EGU General Assembly 2023, Vienna, Austria, 23–28 Apr 2023, EGU23-6587, https://doi.org/10.5194/egusphere-egu23-6587, 2023.

EGU23-6745 | Posters on site | HS1.2.2

Image-based methods for real-time water level estimation 

Anette Eltner, Pedro Zamboni, Ralf Hedel, Jens Grundmann, and Xabier Blanch

Obtaining real-time water level estimations is crucial for effective monitoring and response during emergencies caused by heavy rainfall and rapid flooding. Typically, this type of monitoring can be a difficult task, requiring river reach preparations and specialized equipment. Moreover, in extreme flood events, standard observation methods may become ineffective. This is why the possibility of developing low-cost, automatic monitoring systems represents a significant advancement in our ability to monitor river courses and allow emergency teams to respond appropriately.

Image-based methods for water level estimation facilitate the development of a low-cost river monitoring strategy in a quick and remote approach. These techniques are faster and more convenient regarding the setup than traditional water stage monitoring methods, allowing us to efficiently monitor the river from different locations with a cost-effective approach. By increasing the density of the observation network, we can improve flood warning and management.

The approach presented involves placing cameras in secure locations to capture images of the river, for which we have previously modelled the terrain in 3D using Structure from Motion (SfM) algorithms supported by GNSS data. With the images obtained every 15 minutes, we perform a Convolutional Neural Network (CNN) segmentation based on artificial intelligence algorithms that allow us to automatically extract the contours of the water surface area. In this study, two different neural network approaches are presented to segment water in the images.

Using a photogrammetric strategy, we reproject the water line extracted by the AI on the 3D model of the scene. This reprojection is also supported by the use of a keypoint detection neural network that allows us to accurately identify the ground control points (GCPs) observed in the images captured by the surveillance camera. This approach allows us to automatically assign to each image the real coordinates of the GCPs and subsequently estimate the camera pose.

This AI segmentation and automatic reprojection into the 3D model has allowed us to generate a robust centimetre-accurate workflow, capable of estimating the water level in near-real time for daylight conditions. In addition, the automatic detection of the GCP has permitted to obtain automatic water level measurements over a longer period of time (one year). This approach represents the basis for obtaining other river monitoring parameters, such as velocity or discharge, which allow a better understanding of river floods and represent key steps for the development of early warning systems for flood events.

How to cite: Eltner, A., Zamboni, P., Hedel, R., Grundmann, J., and Blanch, X.: Image-based methods for real-time water level estimation, EGU General Assembly 2023, Vienna, Austria, 23–28 Apr 2023, EGU23-6745, https://doi.org/10.5194/egusphere-egu23-6745, 2023.

EGU23-6936 | Posters on site | HS1.2.2

Image-based velocity estimations under different seeded and unseeded river flows 

Silvano F. Dal Sasso, Robert Ljubicic, Alonso Pizarro, Sophie Pearce, Ian Maddock, and Salvatore Manfreda

The use of image velocimetry techniques for river monitoring has been increasing in the last few years, but there are some limitations to be solved related mainly to natural environmental conditions and operative framework (Dal Sasso et al., 2021). Along with these issues, the need for surface tracking features or homogeneously distributed materials across the cross-section represents one of the challenges for outdoor applications. In a natural environment, flows can present low seeding densities or locally distributed tracer clusters. These conditions can introduce a high variance and underestimate the flow velocity field, especially near the riverbanks.

In this work, the Farnebäck dense optical flow method (Farnebäck 2003) implemented in SSIMS-Flow software (Ljubicic, 2022) was tested and compared with LSPIV technique (Thielicke et al., 2021) to estimate surface flow velocities under different seeding conditions. The application was carried out on the Arrow River (UK) along two meandering river reaches during low-flow conditions. Four different seeding conditions were experimented from low (natural) to high (artificial) seeding density of tracers . Tracers were manually distributed onto the water surface and videos were acquired from DJI Phantom 4 Pro. Seeding metrics were used to estimate seeding conditions including: mean tracer area, seeding density, spatial tracer distribution, and the SDI index (Pizarro et al., 2020). Conventional velocity measurements were used as benchmark purposes along various transects.

This study highlighted the good performances of the two tested image velocimetry methods, with results comparable to traditional techniques. On the one hand, the Farnebäck optical flow method proved to be more sensitive to changing setting parameters (e.g., feature extraction rate) with respect to LSPIV. On the other hand, optical flow showed low sensitivity to seeding density (error reduction 30-40%). This is due to the capacity of the Farnebäck method integrated with an ad-hoc pooling technique for spatial velocity averaging to represent surface velocity under sporadic and uneven seeding (e.g., near the convex bank).

References

Dal Sasso, S. F., Pizarro, A., Manfreda S. (2021). Recent Advancements and Perspectives in UAS-Based Image Velocimetry. Drones 5, 3: 81.

Farnebäck, G. (2003). Two-frame motion estimation based on polynomial expansion, Scandinavian conference on Image analysis. Springer, Berlin, Heidelberg.

Ljubicic, R. (2022). SSIMS-Flow: UAV image velocimetry workbench, https://github.com/ljubicicrobert/SSIMS-Flow

Pizarro, A., Dal Sasso, S.F., Manfreda, S. (2020). Refining image-velocimetry performances for streamflow monitoring: Seeding metrics to errors minimization. Hydrol. Process. 2020, 34, 5167–5175.

Thielicke, W., Sonntag, R. (2021). Particle Image Velocimetry for MATLAB: Accuracy and Enhanced Algorithms in PIVlab. Journal of Open Research Software, 9, Ubiquity Press, 2021.

How to cite: Dal Sasso, S. F., Ljubicic, R., Pizarro, A., Pearce, S., Maddock, I., and Manfreda, S.: Image-based velocity estimations under different seeded and unseeded river flows, EGU General Assembly 2023, Vienna, Austria, 23–28 Apr 2023, EGU23-6936, https://doi.org/10.5194/egusphere-egu23-6936, 2023.

EGU23-6984 | Orals | HS1.2.2

Quantifying high-flow rating shifts due to unusual floodplain roughness during the July 2021 European flood 

Jérôme Le Coz, Michel Lang, Stéphanie Poligot-Pitsch, and Bruno Janet

In July 2021, several western European countries were stricken by extreme floods due to exceptional rainfall events. In North-Eastern France overbank flows started to occur in several rivers on July 14th. The local field hydrologists of the national hydrological service (Vigicrues) managed to conduct mobile-boat ADCP discharge measurements during the floods at many hydrometric stations. They often observed dramatic high-flow rating shifts, typically with measured discharges being 20% to 60% smaller than the discharges computed from the stage-discharge rating curves. Such unusual rating shifts are substantially larger than the uncertainty of the ADCP discharge measurements (5%-10%). To avoid biases in flood forecast, the rating curves had to be recalibrated with limited information on the fly, which was uncomfortable. The local field hydrologists reported that the rating shifts may be due to the floodplain vegetation being very different from the winter conditions of the flood discharge measurements used to build the high-flow ends of the rating curves. In July 2021 indeed, floodplains were covered with high summer crops that had not been harvested due to the unusually cold and rainy weather.

To test this assumption on a hydraulic basis, the rating curves of seven stations on the rivers Aisne, Oise, Helpe Majeure, Chiers and Loison in North-Eastern France were re-analysed using the Bayesian method BaRatin implemented in the BaRatinAGE open-source software. At all of these stations, the identified controls include the main channel (and possibly other low-flow controls) and a relatively wide, rural floodplain. For each station, two rating curves and their uncertainty envelopes are computed: the “normal” rating curve using all valid discharge measurements except those of the July 2021 flood, and the “July 2021” rating curve using no flood discharge measurements but those of the July 2021 flood. For the “July 2021” rating curve, the prior height (offset) of the floodplain is usually taken as the posterior (calibrated results) of the “normal” rating curve, but the coefficient of the floodplain control is calibrated using the July 2021 ADCP discharge measurements. The obtained rating curves are consistent with the rating curves estimated manually by the local field hydrologists. The floodplain friction factors  estimated by BaRatin for the “July 2021” rating curve are decreased by a factor of 1.6 to 14, typically (i.e. Strickler coefficients from 15-20 m1/3/s to 2-10 m1/3/s), which is spectacular but consistent with available look-up tables for friction factors in bare or vegetated fields.

The proposed Bayesian analysis appears useful for field hydrologists to evaluate the possible extent of rating shifts due to unusual floodplain roughness at their stations, and to be prepared for the recalibration of their rating curves would an overbank flood occur outside the winter season again. It is also a convenient way for them to inform and prepare the flood forecasters on the causes and occurrence of such rating shifts, and on the related discharge uncertainty they would have to take into account.

How to cite: Le Coz, J., Lang, M., Poligot-Pitsch, S., and Janet, B.: Quantifying high-flow rating shifts due to unusual floodplain roughness during the July 2021 European flood, EGU General Assembly 2023, Vienna, Austria, 23–28 Apr 2023, EGU23-6984, https://doi.org/10.5194/egusphere-egu23-6984, 2023.

EGU23-7073 | Posters on site | HS1.2.2

Comparing ADCP inter-comparison results using an automated post-processing tool 

Blaise Calmel, Jerôme Le Coz, Hauet Alexandre, Despax Aurélien, and David Mueller

The moving-boat Acoustic Doppler Current Profiler (ADCP) gauging method is extensively used to measure the discharge of rivers and canals. Inter-comparison of ADCP measurements are necessary not only to validate the instruments and their deployment, but also to study the discharge measurement uncertainty. Uncertainty estimates provided by the propagation methods cannot be validated for in situ conditions because of the complexity of the ADCP data workflow and the uncertainty of discharge references in rivers and canals. To solve this issue, a complementary approach to uncertainty propagation methods is the repeated measures experiments, also known as inter-laboratory comparisons. ADCP inter-comparisons have been done for decades and with very different conditions. These data sets are precious in order to test and validate uncertainty propagation methods.

The OURSIN ADCP uncertainty analysis is validated using empirical uncertainty estimates on inter-comparison experiment. This propagation method has been implemented in the QRevInt software which provides an ADCP data quality review. QRevInt is developed by Genesis HydroTech LLC (Mueller, 2021) with the guidance and contributions from an international board of hydrological agencies. QRevInt helps to clean ADCP measurements from avoidable errors and to homogenize the discharge computations irrespective of the instrument manufacturer and model.

However, post-processing inter-comparison results is a long and complicated process particularly if users want to determine and quantify uncertainty sources. There are as many practices as there are hydrometric services. Uncertainty is an indispensable component of discharge measurement and should be estimated for as many measurements as possible. To popularize these practices and homogenize them, a user-friendly tool has been developed.

From raw ADCP measurements, it applies QRevInt post-process quality analysis, the OURSIN uncertainty propagation method, and the empirical uncertainty computation based on the repeated-measures experiment. The tool applies Grubbs and Cochran statistical tests to validate the measurement selection. It returns tables with a row for each measurement with information, such as, discharge and uncertainty decomposition from QRevInt. It also returns an overview of the inter-comparison with graphs of the discharge and its uncertainty among measurements, computed uncertainty, and empirical uncertainty. The tool allows replaying data with homogeneous parameters and users can manually exclude a measurement if it does not seem consistent. The tool will be open source and freely available.

Beyond the operational application, it could be used to replay historical inter-comparisons. With an inter-comparison database, it will be possible to study diverse types of rivers to improve and validate uncertainty estimation in various conditions. A first synthesis is proposed from one inter-comparison data set and will be extended to as much data as possible in the future.

How to cite: Calmel, B., Le Coz, J., Alexandre, H., Aurélien, D., and Mueller, D.: Comparing ADCP inter-comparison results using an automated post-processing tool, EGU General Assembly 2023, Vienna, Austria, 23–28 Apr 2023, EGU23-7073, https://doi.org/10.5194/egusphere-egu23-7073, 2023.

EGU23-9946 | ECS | Posters on site | HS1.2.2

Application of optical Particle Tracking Velocimetry (PTV) to determine continuous discharge time series 

André Kutscher, Jens Grundmann, Anette Eltner, Xabier Blanch, and Ralf Hedel

The measuring of flood events is associated with many challenges. Among them is the determination of flow velocities for the derivation of discharge. Most of the applied methods for velocity determination the disadvantage that they work in direct contact with water. This often makes measuring under critical flow conditions dangerous. Optical measurement methods have a great advantage because they can work remotely, i.e., without water contact.

For representative discharge measurements, flow velocity measurements over the entire width of the river cross-section are required. This is a major challenge in the application of PTV, because visible particles must be present across the entire cross-section, which is not always the case. The potential measurement gaps in the surface velocity distribution have a negative effect on the quality of the discharge determination. Because optical measurement methods are relatively new in hydrology, there is not yet a standardised procedure with which the discharge can be determined. 

The "OptiQ" method presented here is an approach for determining discharge using PTV. This method is based on the continuity equation, which is dependent on two variables, the flow area and the mean flow velocity. The challenge here is to determine the depth-averaged flow velocity, because PTV is used to determine the surface velocity. To get the depth-averaged flow velocities, the PTV results are averaged over a transect and converted using a velocity coefficient. The arithmetic mean, the velocity area method (DIN EN ISO 748:2008-02) and the moving average are considered as averaging methods. A statistical approach was chosen for closing measurement gaps that occurred in the velocity distribution. In this approach, the measurement results with similar discharge conditions in the entire time series, i.e. PTV results for the same water levels, are statistically analysed, filtered and summarised in a lookup table. The gaps in the measurements due to missing particles are filled with the data from the lookup table.

For the data collection, three camera gauges were installed at regular gauging stations of the Saxon State Agency for Environmental and Agricultural Monitoring (BfUL). The camera gauges recorded short video sequences at regular time intervals, which were used to determine the velocity distributions using the FlowVelo tool (Eltner et al., 2020). This resulted in three time series covering a period of 10-15 months. For the validation of the optical discharge time series, the regular water level and discharge measurements of the BfUL are used. 

The application of "OptiQ" shows a significant adjustment of the optically determined discharge data to the reference measurement at all three gauging stations. While acceptable results were determined with the arithmetic mean only at higher discharge, the results with the velocity area method and the moving average are similarly good at all discharges. At the gauging station in Elbersdorf, the average difference from the reference value could be reduced from 29% to 15% with "OptiQ". In the next step, it is planned to further develop the statistical model "OptiQ" by using Deep Learning.

How to cite: Kutscher, A., Grundmann, J., Eltner, A., Blanch, X., and Hedel, R.: Application of optical Particle Tracking Velocimetry (PTV) to determine continuous discharge time series, EGU General Assembly 2023, Vienna, Austria, 23–28 Apr 2023, EGU23-9946, https://doi.org/10.5194/egusphere-egu23-9946, 2023.

In November 2021, an atmospheric river swept the Pacific Northwest region, causing one of the costliest natural disasters in Canadian history. Among others, the Coldwater River in Merritt, British Columbia caused widespread flooding on November 15th, 2021, resulting in extensive damage to the infrastructure and total evacuation of the residents.

Estimating the magnitude of this flood is difficult, as it damaged the local flow monitoring station and altered the surrounding landscape. However, parts of this flooding event, including the flow close to its peak, were filmed by local residents using mobile devices or drones. Though with significant perspective distortion and imprecision, they still provide valuable information on the extreme flow event, which would have otherwise been lost or neglected. The objective of this study is to apply image velocimetry techniques to these videos, with limited resources and geodata, for reconstructing surface velocities and discharges during the flood.

The analysis method consists of using LSPIV and Farneback optical flow on the original clips where possible. Objects are identified in the videos, then geolocated or surveyed after the flood, for rectification of raw velocities. This allows multiple iterations, accounting for uncertainties in the rectification parameters. Discharges are then calculated using surveyed or reconstructed transects, and water surface elevations estimated from the video frames.

Preliminary results of both methods will be presented and compared on the use of lens distortion correction, different contrast enhancement block sizes, and interrogation area or filter sizes. Validations of the calculated discharges against flow observations from the Water Survey of Canada will also be included.

How to cite: Yang, J. J. S. and Weijs, S. V.: Use of image velocimetry techniques on citizen videos of the November 2021 flooding event flows in Merritt, British Columbia, EGU General Assembly 2023, Vienna, Austria, 23–28 Apr 2023, EGU23-10094, https://doi.org/10.5194/egusphere-egu23-10094, 2023.

EGU23-10348 | Orals | HS1.2.2

Reproducibility and uncertainty for national Canadian hydrometric stations 

Shervan Gharari, Hongli Liu, Jim Freer, Paul Whitfield, Tricia Stadnyk, Alain Pietroniro, and Martyn Clark

Reliable and accurate river streamflow or discharge measurement and reporting are essential for engineering, economic, and social decision-making. Discharge values are often perceived as true and deterministic by users, modelers, and decision-makers. In this study, the processes of discharge estimation by the Water Survey of Canada, WSC, are presented. The process of inferring the discharge (water volume over time) based on stage (water level) through stage-discharge relationships or “rating curves” including related terminologies is described. Multiple practices of rating curve construction and discharge estimation across WSC hydrometric stations are explored. Major processes of "override" and "temporary shift" which significantly affect the discharge estimation are elaborated. The reproducibility of the published discharge data using data from the production process for approximately 1750 active hydrometric stations operated by WSC is examined. Other impacts of temporary shift and override have been evaluated on the properties such as discharge residuals or performance metrics. Recommendations are made for wider access to metadata and measurements that are essential to quantify the reproducibility and uncertainty of reported discharge values. Open science, particularly Earth system modeling, demands clear communication of reproducibility, and uncertainty of published discharge.

How to cite: Gharari, S., Liu, H., Freer, J., Whitfield, P., Stadnyk, T., Pietroniro, A., and Clark, M.: Reproducibility and uncertainty for national Canadian hydrometric stations, EGU General Assembly 2023, Vienna, Austria, 23–28 Apr 2023, EGU23-10348, https://doi.org/10.5194/egusphere-egu23-10348, 2023.

EGU23-11248 | ECS | Orals | HS1.2.2

Hydrodynamic modelling to assess habitat suitability of the Ganga River 

Gaurav Kailash Sonkar and Kumar Gaurav

We perform hydrodynamic modelling using a 2D HEC-RAS model to assess the hydraulic habitat suitability in a data-constrained reach (7 km) of the Ganga River. This reach of the Ganga River is located within two structural barriers of the upper Ganga plain, namely the Bijnor barrage in upstream and the Narora barrage in downstream. It is an active river dolphin and gharial habitat. To setup and run the 2D flow simulation in HEC-RAS, we used topographic data from a LiDAR drone survey, channel bathymetry from field campaigns, time-series river stage (to define the boundary conditions of the model domain), and water surface slope from using the real-time kinematic GPS. We use water level time series data from a satellite altimeter (downstream) and discharge measured in the field using an ADCP for model calibration and validation, respectively.

We found that the study reach has poor habitat suitability at low flow, which improves at median flow. The use of altimeter datasets for model calibration is quite handy when the in-situ data is not readily available. This study provides a methodological framework to assess the hydraulic habitat suitability in rivers near structural interventions.

How to cite: Sonkar, G. K. and Gaurav, K.: Hydrodynamic modelling to assess habitat suitability of the Ganga River, EGU General Assembly 2023, Vienna, Austria, 23–28 Apr 2023, EGU23-11248, https://doi.org/10.5194/egusphere-egu23-11248, 2023.

EGU23-12058 | Orals | HS1.2.2 | Highlight

Rapid streamflow monitoring with drones 

Ida Westerberg, Valentin Mansanarez, Steve Lyon, and Norris Lam

Accurate and reliable streamflow monitoring data are urgently needed for many new locations to tackle the on-going climate emergency, where we now see increasingly severe impacts on society from extreme flows. Yet, traditional river monitoring methods depend on empirical rating-curve methods for which it typically takes many years or decades to obtain reliable data, in particular for extreme flows. This gap between increasing needs and current monitoring capabilities calls for new methods to be developed.

Drones provide an unprecedented ability to measure both the physical and hydraulic characteristics of a river in an efficient manner. Topography, water surface slope, surface water velocity and even bathymetry can be derived from drone images and drone lidar data. We exploited this potential by incorporating drone data into the framework for Rating curve Uncertainty estimation using Hydraulic Modelling (RUHM). The RUHM framework combines a one-dimensional hydraulic model with Bayesian inference and together with drone data it allows us to efficiently estimate a reliable rating curve and its associated uncertainty based on as few as three gaugings.

We present our results from applying RUHM to Swedish gauging stations where we model rating curves and streamflow based on drone data. We primarily used low-cost camera drones to collect both the input (DEM, vegetation, bathymetry) and calibration data (water surface slope, surface velocity) for the hydraulic model, but also tested the capabilities of drone lidar data. Our aim was to estimate reliable rating curves with RUHM based only on data from the drone flights. We assessed the uncertainty in the drone-derived model input and calibration data compared to traditional fieldwork techniques, as well as their impact on the RUHM-modelled rating curves and streamflow results.

We find that careful planning of when to fly the drone is important for obtaining good-quality model input and calibration data. Using a combination of drone camera and drone lidar data we were able to obtain all the data needed for RUHM from the drone flights. Extreme low and high flows were reliably modelled with RUHM with constrained uncertainty based on as few as three low and middle flow gaugings, without the need for gauging extreme flows. We conclude that using RUHM with drone data is an efficient and promising alternative to traditional streamflow monitoring methods, being much less time-consuming and costly, as well as involving fewer risks to field staff.

How to cite: Westerberg, I., Mansanarez, V., Lyon, S., and Lam, N.: Rapid streamflow monitoring with drones, EGU General Assembly 2023, Vienna, Austria, 23–28 Apr 2023, EGU23-12058, https://doi.org/10.5194/egusphere-egu23-12058, 2023.

EGU23-13332 | Orals | HS1.2.2

Measuring bedload motion time at sub-second scale using Benford's law from long-term acoustic recordings 

Ci-Jian Yang, Jens.M Turowski, Qi Zhou, Hui Tang, Ron Nativ, and Wen-Sheng Chen

Bedload transport is a natural process that strongly affects the Earth’s surface system. An important component of quantifying bedload transport and establishing early warning systems is obtaining the parameters at the onset of bedload motion. Bedload transport can be monitored with passive acoustic methods, e.g., hydrophones. Yet, an efficient method for identifying the onset of bedload transport from long-term continuous acoustic data is still lacking. Benford’s Law defines the specific frequency distribution of the first digits of datasets that have been used to distinguish stochastic from chaotic processes in nature when this process causes higher energy events than baseline. Here, we apply Benford’s law to continuous acoustic recordings from Baiyang hydrometric station, a tributary of Liwu River, Taiwan at the frequency of 32 kHz from stationary hydrophones deployed for three years since 2019. We construct a workflow to parse sound combinations of bedload transportation and analyze them in the context of hydrometric sensing constraining the onset, and recession of bedload transportation. We identify two bedload transportation events that lasted 17 and 45 hours, respectively, covering about 0.35% of the time per year. Our workflow allows filtering 99% of background signal and focuses on two events including bedload motions. Given that fluvial seismology has successfully monitored fluvial processes, continuous monitoring in three directions (N-S, W-E, vertical) brings board discussion orientations, e.g., the direction of source or migration of mass movement. Therefore, we suggest that the application of Benford’s law on seismic data of Earth's surface processes has great potential.

How to cite: Yang, C.-J., Turowski, J. M., Zhou, Q., Tang, H., Nativ, R., and Chen, W.-S.: Measuring bedload motion time at sub-second scale using Benford's law from long-term acoustic recordings, EGU General Assembly 2023, Vienna, Austria, 23–28 Apr 2023, EGU23-13332, https://doi.org/10.5194/egusphere-egu23-13332, 2023.

EGU23-14020 | ECS | Orals | HS1.2.2

Adaptive real-time forecasting using model-driven monitoring of catchment inflows and water supply reservoir dynamics 

Nicholas Hutley, Nathaniel Deering, Daniel Wagenaar, Ryan Beecroft, Josh Soutar, Alistair Grinham, Badin Gibbes, and Simon Albert

Real-time monitoring networks are increasingly prevalent in supporting the management of environmental systems as the technology for live data collection becomes more accessible. Additionally, ecosystem and water resource pressures have persisted and intensified under climate pressures and an expanding anthropogenic footprint. The way in which models and data are fused in the day-to-day management of water resources operations, as well as for long-term planning and investment, has been a critical field of research. An adaptive real-time monitoring-integrated learning modelling approach was developed and applied to improve the understanding of the mixing dynamics in a water supply reservoir in Queensland, Australia. This was accomplished through the combination of sequentially linked catchment and reservoir models with in situ real-time measurements of temperature and flow along with meteorological forecasts from an Australian numerical weather model, to produce short-term water quality forecasts. An adaptive learning catchment model was developed and linked for each inflow arm of the reservoir using the Australian Water Balance Model. This framework enabled automated online communication to researchers and managers around the current performance of the inflow predictions and the confidence expected in the current forecasts. Moreover, this live learning catchment model was coupled with a real-time adaptive three-dimensional hydrodynamic model of the reservoir iteratively training using data from the deployed real-time temperature monitoring system. A prototype internet-connected remotely operable autonomous surface vessel was deployed with a winching system for conducting dynamic water quality profiling operations under the guidance of waypoints guidance generated from the real-time adaptive modelling forecasts. Data collected by ASV was subsequently provided back to the modelling system in real-time. The complete system facilitated the online adaptive forecasting of mixing dynamics in the reservoir and the automated identification of features of interest for water quality profiling, as well as dynamically monitoring the areas potentially most valuable for model learning development to improve system-wide understanding and forecast certainty through addition into the live dataset for ongoing training and evaluation. Evidence was found in support of a rolling iterative calibration procedure for increasing model skill sensitivity to different processes occurring over temporal and spatial scales across both catchment and receiving water models. Dynamically guided spatial monitoring generated from maximum predicted areas of variation and parameter sensitivity in the real-time adaptive receiving water model demonstrated that monitoring of the receiving water inflow arms during inflow events was necessary during inflow events to train the model on the strongest signal of the driving force of changes in the receiving water environment. Overall, the uncertainty in rainfall events from both forecasted and observed sources cascading with the uncertainty in catchment simulations with only static indirect monitoring of flow (ungauged at any of the inflow arms to the reservoir) was found to be the most significant hindrance to the utility of the applied real-time adaptive modelling framework. The application of an adaptive computer vision-based stream gauging approach was then trialled on one of the ungauged inflow arms in order to supplement this gap.

How to cite: Hutley, N., Deering, N., Wagenaar, D., Beecroft, R., Soutar, J., Grinham, A., Gibbes, B., and Albert, S.: Adaptive real-time forecasting using model-driven monitoring of catchment inflows and water supply reservoir dynamics, EGU General Assembly 2023, Vienna, Austria, 23–28 Apr 2023, EGU23-14020, https://doi.org/10.5194/egusphere-egu23-14020, 2023.

EGU23-14234 | Posters on site | HS1.2.2

Sources of uncertainty in video-based flow observations, revealed by co-location experiment 

Hessel Winsemius, Salvador Peña-Haro, Frank Annor, Rick Hagenaars, Wim Luxemburg, Gijs Van den Munckhof, Felix Grimmeisen, and Nick Van de Giesen

In the last years, several methods to establish surface flow velocities and river flow from camera videos have been developed and codified into software. Together with a hardware setup, these may be used to establish near real-time observations of river flow. The hardware setup used and associated quality of the camera, methods to pre-process, process and post-process the videos may all result in errors, and uncertainties. In this contribution we assess what the main sources of uncertainty are, and under what conditions these may appear, focusing on both hardware and processing methods. We do this by co-locating two different camera setups, and using two different software processing methods. For camera setups we use a very simple and low cost FOSCAM FI9900EP running at its maximum of 4Mbps and a much better quality Vivotek IB9367-EHT running at 20Mbps. As systems we use the DischargeKeeper and pyOpenRiverCam.

The cameras were co-located over a significantly long period at a site in Limburg in The Netherlands, and footage analyzed with 15-minute intervals. Videos were treated with as much as possible the same settings, reprojection resolution and window. Results were compared in terms of the ability to resolve velocities (amount and quality) and the impact of post-processing. Integrated flow over a cross-section is also compared. We assess under what conditions flow and velocity estimates are robust and similar and under what conditions these diverge focusing on the platform used, light conditions, and flow conditions.

Keywords: River flow monitoring, stage-discharge relationships, OpenRiverCam, DischargeKeeper, computer vision

The work leading to these results has received funding from the German Federal Ministry of Education and Research (BMBF) and the CLIENT II program (Drought-ADAPT, FKZ: 01LZ2002B) and the European Horizon Europe Programme (2021-2027) under grant agreement no. 101086209 (TEMBO Africa). The opinions expressed in the document are of the authors only and no way reflect the European Commission’s opinions. The European Union is not liable for any use that may be made of the information.

How to cite: Winsemius, H., Peña-Haro, S., Annor, F., Hagenaars, R., Luxemburg, W., Van den Munckhof, G., Grimmeisen, F., and Van de Giesen, N.: Sources of uncertainty in video-based flow observations, revealed by co-location experiment, EGU General Assembly 2023, Vienna, Austria, 23–28 Apr 2023, EGU23-14234, https://doi.org/10.5194/egusphere-egu23-14234, 2023.

EGU23-14752 | Posters on site | HS1.2.2

Machine learning for water detection in ephemeral streams 

Salvador Peña-Haro, Daniel Hernandez, and José M. Cecilia

Measuring the volumetric water flow in ephemeral streams, typical of semi-arid climates, in which water rarely flows, is challenging since water only flows some days per year and some times it is in the form of flash floods. In this type of conditions it is important to detect when there is water in the stream. For this, we have implemented a machine learning algorithm for water detection and for stream gauge measurement.

Machine learning was used to differentiate pixels of the image that contains water from those those that do not via image segmentation. Different segmentation models have been proposed, but in our case we used an encoder-decoder DNN architecture based on DeepLabV3. To train the model, we used the ArtificiaL And Natural waTer-bodIes dataSet (ATLANTIS) data-set. However not all the images were used since these data-set includes classes that are not representative for our application, hence the total number of images used for training was 685. Additionally the original defined classes were merged to reduce the problem to a semantic binary segmentation problem, since our objective is to simply detect the presence of water on the stream. In addition to those images, we have used other images recorded by fix cameras looking at some ephemeral streams to improve the training.

The trained network was used to analyze 50 images with different water levels or no water. To evaluate its performance and indicator was defined which considered the number of pixels classified as water inside the image area covered by the stream over the total number of potential pixels having water, and a 60% threshold was used to determine if there is water in the stream. From the 50 images analyzed, only 3 were wrongly classified giving promising results.

This work has been supported by the European Union’s Horizon 2020 research and innovation programme under grant agreement No 101017861 and also by projects RTC2019-007159-5 and Ramon y Cajal Grant RYC2018-025580-I, funded by MCIN/AEI/10.13039/501100011033, “FSE invest in your future” and “ERDF A way of making Europe”

How to cite: Peña-Haro, S., Hernandez, D., and Cecilia, J. M.: Machine learning for water detection in ephemeral streams, EGU General Assembly 2023, Vienna, Austria, 23–28 Apr 2023, EGU23-14752, https://doi.org/10.5194/egusphere-egu23-14752, 2023.

EGU23-16552 | Orals | HS1.2.2 | Highlight

Quantitative and Qualitative River Monitoring Using an Innovative UAV-USV Tandem System 

Issa Hansen, Salvador Peña-Haro, Beat Lüthi, Frank-Andreas Weber, Juan Ramirez, Benjamin Eberhardt, Thomas Gattung, Julian Teege, Enrico Neumann, Ralf Becker, and Jörg Blankenbach

The use of modern digital technologies in water management is an important driver for obtaining better data for assessing the status of water bodies and their development. These data can be beneficially implemented for the monitoring and management of rivers and especially waterways.

In the BMDV-funded project RiverCloud, an autonomous tandem system consisting of an Unmanned Aerial Vehicle (UAV) and an Unmanned Surface Vehicle (USV) is being developed under the coordination of the gia of RWTH Aachen University, which will provide spatially and temporally high-resolution data for the development and maintenance of waterways as well as for river management. The contribution introduces the developed coupled UAV/USV tandem system with its mounted sensors for high resolution data acquisition and continuously accurate georeferencing and presents some significant results using the example of a study area on the Rhine River (Tomateninsel).

The data presented are, among others, camera-based flow measurements using an image processing method, discharge data of a precise ADCP (Acoustic Doppler Current Profiler) with 2000 kHz frequency and ten water quality parameters using a multi-parameter probe. All data mentioned were simultaneously collected in two locations of the study area on the Rhine River in September 2022. The 4 seconds videos collected by the UAV-camera were processed using an image processing method based on the surface velocity after implementing a new developed stabilisation tool. The cross-section data collected by ADCP were used for the configuration of the two sites. The agreement between ADCP and camera-based flow and discharge data was very good on both sites with less than 5% deviation for a discharge value of approx. 600 m3/s and 1.63 m/s mean velocity. The water quality parameters collected during the measuring campaign were temperature, conductivity, salinity, pH value, oxygen concentration, oxygen saturation, ammonium, turbidity, Total suspended solids (TSS) and total dissolved solids (TDS). The water quality data were in the expected ranges for river water (e.g. average values: pH 7.8, T 21.8°C, EC 0.35 mS/cm, Sal 0.71%, O2 7.5 mg/l, NH4+ 0.3 mg/l).

The results, specific requirements of the developed solution and challenges under the measuring conditions of the study area are presented in this paper. The data collected are used as the input of an overview report for river or waterway water flow and quality monitoring.

How to cite: Hansen, I., Peña-Haro, S., Lüthi, B., Weber, F.-A., Ramirez, J., Eberhardt, B., Gattung, T., Teege, J., Neumann, E., Becker, R., and Blankenbach, J.: Quantitative and Qualitative River Monitoring Using an Innovative UAV-USV Tandem System, EGU General Assembly 2023, Vienna, Austria, 23–28 Apr 2023, EGU23-16552, https://doi.org/10.5194/egusphere-egu23-16552, 2023.

In recent years the changing climate has resulted in an increased prevalence of extreme weather, with corresponding extreme precipitation and surface flow events. Adapting management of water and other natural resources to these conditions requires accurate and robust tools to measure water flow, and in particular the development of non-contact measurement methods.

Once such method is Infrared quantitative image velocimetry (IR-QIV), which is a large scale surface velocimetry method that uses infrared imagery to calculate the mean and instantaneous velocity at high resolution in space and time, over large spatial areas (Schweitzer & Cowen, WRR 2021). IR-QIV can operate continuously for extended periods (days, weeks, etc.) without requiring artificial illumination or particle seeding of the flow. The high resolution, continuous, measurement capabilities of IR-QIV make it particularly well suited to applications where the spatial and temporal variance of the flow must be resolved, such as fishery management, air-water heat and gas exchange, and flow-structure interaction studies.

We present metrics of turbulence, estimates of gas transfer rates, and other hydrodynamic properties calculated from velocity measurements conducted by IR-QIV at the surface of several rivers in California, and Michigan, USA. The measurements were made as part of fishery management projects, motivated by efforts to better understand and manage the interaction of migrating fish and the hydrodynamic environment. Results are validated by comparison with acoustic velocity measurements. 

How to cite: Schweitzer, S. and Cowen, E. A.: Turbulence metrics at the surface of rivers, measured by Infrared Quantitative Image Velocimetry (IR-QIV), EGU General Assembly 2023, Vienna, Austria, 23–28 Apr 2023, EGU23-16919, https://doi.org/10.5194/egusphere-egu23-16919, 2023.

EGU23-17240 | ECS | Posters on site | HS1.2.2

Generating risk maps for river migration using probabilistic modeling 

Omar Wani, Brayden Noh, Kieran Dunne, and Michael Lamb

Human settlements and infrastructure in alluvial floodplains face erosional risk due to the lateral migration of meandering rivers. There is a large body of scientific literature on the dominant mechanisms driving river migration. However, it is challenging to make accurate forecasts of river meander evolution over multiple years. This is in part because deterministic mathematical models are not equipped to account for stochasticity in the system. Besides, uncertainty due to model deficits and unknown parameter values remains. For a more reliable assessment of risks, we therefore need probabilistic forecasts. In this work, we suggest a workflow to generate river-migration risk maps using probabilistic modeling. Forecasts for river channel position over time are generated by Monte Carlo runs, using a distribution of model parameter values inferred from satellite data, enabling us to make risk maps for river migration. We demonstrate that such risk maps are more informative in avoiding false negatives, which can be both detrimental and costly, in the context of assessing erosional hazards due to river migration. 

How to cite: Wani, O., Noh, B., Dunne, K., and Lamb, M.: Generating risk maps for river migration using probabilistic modeling, EGU General Assembly 2023, Vienna, Austria, 23–28 Apr 2023, EGU23-17240, https://doi.org/10.5194/egusphere-egu23-17240, 2023.

HS1.3 – Cross-cutting hydrological sessions

EGU23-556 | ECS | Orals | HS1.3.1

A Modeller’s Compass: How Modellers Navigate Dozens of Decisions 

Janneke Remmers, Rozemarijn ter Horst, Ryan Teuling, and Lieke Melsen

The usage of hydrological models is diverse and omnipresent. For practical purposes, these models are applied to, for example, flood forecasting, water allocation, and climate change impacts. Numerous methods exist to execute any modelling study. Choosing a method creates a narrative behind each model result. This implies that models are not neutral. So, how do modellers make these decisions? We conducted fourteen semi-structured interviews between September and December 2021 with nine modellers from six different water authorities and five modellers from four different consultancy companies in the Netherlands. The interviews were all recorded and transcribed. We executed an inductive content analysis on the transcriptions. We will discuss the motivation modellers have to make choices during the modelling process. With these insights, we aim to contribute to a discussion on how models, despite their unavoidable non-neutrality, can be robust and dependable to support decision making. Standardisation, e.g. automation, can be a way to achieve this. Understanding the social aspects behind the modelling process is necessary to move forward in modelling and modelling workflows, as well as being able to share and reflect on the model results including the narrative behind it.

How to cite: Remmers, J., ter Horst, R., Teuling, R., and Melsen, L.: A Modeller’s Compass: How Modellers Navigate Dozens of Decisions, EGU General Assembly 2023, Vienna, Austria, 23–28 Apr 2023, EGU23-556, https://doi.org/10.5194/egusphere-egu23-556, 2023.

Most systematic bias correction approaches which are developed based on the bias of the statistical properties of interest perform well to bias correct the current climate simulations with respect to observations. However, the significance of the application of systematic bias correction approaches on the raw output of climate model simulations remains a debate due to the unavailability of future climate observation to validate the approach.

The output of a recent ultra-high resolution climate model simulation, UHR-CESM, demonstrates the best performance to simulate variability of sea surface temperature (SST) in the tropical Pacific with an exception of a small bias in mean. This knowledge encouraged us to use the outputs of the model to represent the truth both in current and future climates. We use the output of the model in response to the current climate CO2 concentration as the representative of the current climate. While the outputs of model simulation in response to doubling and quadrupling CO2 concentrations are used as the representative of the truth of future climates.

We bias correct monthly SST simulations for 8 (eight) Coupled Model Intercomparison Project 6 (CMIP6) over the Niño 3.4 region having the same CO2 concentration as our reference model using a novel time-frequency continuous wavelet-based bias correction (CWBC). The results show a nearly perfect correction of distributional, trend, and spectral attributes biases in the 8 (eight) climate model simulations in the current climate and a consistent reduction of the biases in the model simulation in response to doubled CO2 concentration. Although the overall quality of the statistical attributes is improved after the application of bias correction in response to the more extreme change of quadrupled CO2 concentration, a degradation in the spectral attributes is observed. It shows that a systematic bias correction approach has its upper limit. Therefore, while the application of bias correction approaches is recommended prior to the further use of raw climate model simulations, up to what extent future climate simulations are reliably bias corrected should be handled carefully.

How to cite: Kusumastuti, C., Mehrotra, R., and Sharma, A.: Is there an upper extent to systematic bias correction of climate model simulations? Application to low-frequency variability within the Niño3.4 region, EGU General Assembly 2023, Vienna, Austria, 23–28 Apr 2023, EGU23-579, https://doi.org/10.5194/egusphere-egu23-579, 2023.

Hydrological models play a key role in contemporary hydrological scientific research. For this study, 400+ scientific hydrological vacancies were analyzed, to evaluate whether the job description already prescribed which model must be used, and whether experience with a specific model was an asset. Of the analysed job positions, 76%  involved at least some modelling. Of the PhD positions that involved any modelling, the model is already prescribed in the vacancy text in 17%  of the cases, for postdoc positions this was 30%. A small questionnaire revealed that also beyond the vacancies where the model is already prescribed, in many Early-Career Scientist (ECS) projects the model to be used is pre-determined and, actually, also often used without further discussion. There are valid reasons to pre-determine the model in these projects, but at the same time, this can have long-term consequences for the ECS: experience with the model will influence the research identity the ECS is developing, and might influence future opportunities of the ECS - it might be strategic to gain experience with popular, broadly used models, or to become part of an efficient modelling team. This serves an instrumental vision on modelling. Seeing models as hypotheses calls for a more critical evaluation. We can educate ECS the current rules of the game, while at the same time actively stimulate critically questioning these rules.

How to cite: Melsen, L.: Recruitment of early career scientists for hydrological modelling positions: implications for model progress, EGU General Assembly 2023, Vienna, Austria, 23–28 Apr 2023, EGU23-904, https://doi.org/10.5194/egusphere-egu23-904, 2023.

EGU23-968 | Posters on site | HS1.3.1

The Great Lakes Runoff Intercomparison Project (GRIP-GL) 

Juliane Mai, Hongren Shen, Bryan Tolson, Étienne Gaborit, Richard Arsenault, James Craig, Vincent Fortin, Lauren Fry, Martin Gauch, Daniel Klotz, Frederik Kratzert, Nicole O'Brien, Daniel Princz, Sinan Rasiya Koya, Tirthankar Roy, Frank Seglenieks, Narayan Shretha, Andre Guy Temgoua, Vincent Vionnet, and Jonathan Waddell

Model intercomparison studies are carried out to test and compare the simulated outputs of various model setups over the same study domain. The Great Lakes region is such a domain of high public interest as it not only resembles a challenging region to model with its trans-boundary location, strong lake effects, and regions of strong human impact but is also one of the most densely populated areas in the United States and Canada. This study brought together a wide range of researchers setting up their models of choice in a highly standardized experimental setup using the same geophysical datasets, forcings, common routing product, and locations of performance evaluation across the 1x10⁶ km2 study domain. The study comprises 13 models covering a wide range of model types from Machine Learning based, basin-wise, subbasin-based, and gridded models that are either locally or globally calibrated or calibrated for one of each of six predefined regions of the watershed. This study not only compares models regarding their capability to simulated streamflow (Q) but also evaluates the quality of simulated actual evapotranspiration (AET), surface soil moisture (SSM), and snow water equivalent (SWE).

The main results of this study are:

  • The comparison of models regarding streamflow reveals the superior quality of the Machine Learning based model in all experiments performed.
  • While the locally calibrated models lead to good performance in calibration and temporal, they lose performance when they are transferred to locations the model has not been calibrated on.
  • The regionally calibrated models exhibit low performances in highly regulated and urban areas as well as agricultural regions in the US.
  • Comparisons of additional model outputs against gridded reference datasets show that aggregating model outputs and the reference dataset to basin scale can lead to different conclusions than a comparison at the native grid scale.
  • A multi-objective-based analysis of the model performances across all variables reveals overall excellent performing locally calibrated models as well as regionally calibrated models.
  • Model outputs and observations produced and used in this study are available on an interactive website (www.hydrohub.org/mips_introduction.html#grip-gl) and on FRDR (http://www.frdr-dfdr.ca).

How to cite: Mai, J., Shen, H., Tolson, B., Gaborit, É., Arsenault, R., Craig, J., Fortin, V., Fry, L., Gauch, M., Klotz, D., Kratzert, F., O'Brien, N., Princz, D., Rasiya Koya, S., Roy, T., Seglenieks, F., Shretha, N., Temgoua, A. G., Vionnet, V., and Waddell, J.: The Great Lakes Runoff Intercomparison Project (GRIP-GL), EGU General Assembly 2023, Vienna, Austria, 23–28 Apr 2023, EGU23-968, https://doi.org/10.5194/egusphere-egu23-968, 2023.

EGU23-2008 | Orals | HS1.3.1

More Complex is Not Necessarily Better in Large-Scale Hydrological Modeling 

Ralf Merz, Arianna Miniussi, Stefano Basso, and Larisa Tarasova

Conceptual hydrological models are irreplaceable tools for large-scale (i.e., from regional to global) hydrological predictions. Large-scale modeling studies typically strive to employ one single model structure regardless of the diversity of catchments under study. However, little is known on the optimal model complexity for large-scale applications. In a modeling experiment across 700 catchments in the contiguous United States, we analyze the performance of a conceptual (bucket style) distributed hydrological model with varying complexity (5 model versions with 11–45 parameters) but with exactly the same inputs and spatial and temporal resolution and implementing the same regional parameterization approach. The performance of all model versions compares well with those of contemporary large-scale models tested in the United States, suggesting that the applied model structures reasonably account for the dominant hydrological processes. Remarkably, our results favor a simpler model structure where the main hydrological processes of runoff generation and routing through soil, groundwater, and the river network are conceptualized in distinct but parsimonious ways. As long as only observed runoff is used for model validation, including additional soil layers in the model structure to better represent vertical soil heterogeneity seems not to improve model performance. More complex models tend to have lower model performance and may result in rather large uncertainties in simulating states and fluxes (soil moisture and groundwater recharge) in model ensemble applications. Overall, our results indicate that simpler model structures tend to be a more reliable choice, given the limited validation data available at large scale.

How to cite: Merz, R., Miniussi, A., Basso, S., and Tarasova, L.: More Complex is Not Necessarily Better in Large-Scale Hydrological Modeling, EGU General Assembly 2023, Vienna, Austria, 23–28 Apr 2023, EGU23-2008, https://doi.org/10.5194/egusphere-egu23-2008, 2023.

EGU23-5702 | Posters on site | HS1.3.1

The eWaterCycle platform for open and FAIR hydrological collaboration 

Rolf Hut, Jerom Aerts, Pau Wiersma, Vincent Hoogelander, Nick van de Giesen, Niels Drost, Peter Kalverla, Ben van Werkhoven, Stefan Verhoeven, Fakhereh (Sarah) Alidoost, Barbara Vreede, and Yang Liu

The eWaterCycle platform introduced in 2022 (https://doi.org/10.5194/gmd-15-5371-2022) provides hydrologists with an online platform to conduct numerical studies involving hydrological models. It allows hydrologists to work with each other's data and datasets directly from a webbrowser. The workflow of the experiment done is clearly visible, reproducible and easily adaptable because of how eWaterCycle separates the model (the algorithm) used from the experiment done with the model. eWaterCycle is designed such that research conducted on the platform is ‘FAIR by design’. Using eWaterCycle, studies can be done in less time, more transparently and by more junior members of the hydrological community than was possible a few years ago. 

In this presentation, we will explain the capabilities of the eWaterCycle platform and show them by describing recently (published) works of MSc and PhD members of our team, including a model coupling study, a large sample hydrology study and a climate impact assessment study.

How to cite: Hut, R., Aerts, J., Wiersma, P., Hoogelander, V., van de Giesen, N., Drost, N., Kalverla, P., van Werkhoven, B., Verhoeven, S., Alidoost, F. (., Vreede, B., and Liu, Y.: The eWaterCycle platform for open and FAIR hydrological collaboration, EGU General Assembly 2023, Vienna, Austria, 23–28 Apr 2023, EGU23-5702, https://doi.org/10.5194/egusphere-egu23-5702, 2023.

EGU23-7800 | Orals | HS1.3.1

What motivates model developments? A multi-perspective case study from snow physics models. 

Cécile Ménard, Sirpa Rasmus, and Ioanna Merkouriadi

Historically, snow physics models were developed to forecast avalanches. Over the years, their application has broadened to hydrological, climatological, ecological and permafrost studies to cite but a few. However, the structure of mid-latitude mountain snowpacks upon which snow physics models are based (generally deep snowpack with snow denser at the bottom than at the top because of compaction) differs considerably from the structure of high latitude snowpacks (generally shallow snowpack with dense wind-compacted snow at the top and large snow crystals at the bottom). This difference has been known for decades to be a potentially large source of uncertainty when simulating heat exchanges in the Arctic and Antarctic. Therefore, with Arctic warming having consequences on the global climate, why have snow physics modellers not developed a model with a high latitude or “arctic snowpack” yet? Taking this question as a case-study to understand the role that subjective decisions play at every phase of model developments, we interviewed more than twenty snow physics model users (e.g. ecologists, anthropologists, remote sensing and climate scientists) and developers to understand the following: what motivates model developments? What or who determines which parametrization, which process is to be prioritised over others? What role does the research question play? What about funding or staff availability? We will show that positionality, anchoring bias and interpersonal relationships play far more prominent roles in the physical sciences that commonly acknowledged and will draw lessons from the social sciences to increase transparency in our modelling practice.

How to cite: Ménard, C., Rasmus, S., and Merkouriadi, I.: What motivates model developments? A multi-perspective case study from snow physics models., EGU General Assembly 2023, Vienna, Austria, 23–28 Apr 2023, EGU23-7800, https://doi.org/10.5194/egusphere-egu23-7800, 2023.

The reliability of rainfall-runoff models in reproducing hydrological drought events is of primary importance for multiple applications (e.g. water resource management or agricultural risk assessment), especially in a context of expected future water scarcity. Typical model performance metrics are often not enough to assess the accuracy in the simulation of droughts. In fact, it is necessary to consider drought-specific indices taking into account, e.g., low flow characteristics, duration and deficit volumes as well as their seasonality and timing. Understanding which hydrological processes are (or are not) adequately modeled and why, in respect to such drought-specific performances, allows to assess the strengths and weaknesses of each model and may provide guidance on how to improve model set-up and its reliability.

Through the application of a conceptual semi-distributed model on a set of Alpine basins, the aim of this preliminary work is to analyse the relationship between drought-specific performance metrics, basin characteristics and model parameters. In particular, the specific influence of the different model state variables (e.g. snow water equivalent, evapotranspiration and soil moisture) on the reproduction of drought events is investigated.

The model used is a semi-distributed modelling framework based on the airGR rainfall-runoff models (Coron et al. 2017), applied through the R package airGRiwr (Dorchies 2022). The case study is a set of Alpine catchments, characterised by a high degree of “nestdness” which allows to fully implement the semi-distributed model structure and to perform its diagnosis.

The major advantage of a semi-distributed model, if properly set-up, is its ability to differentiate hydrological dynamics between the sub-catchments. In mountainous basins, for instance, simulating in a separate way the upstream headwater sub-catchments may substantially improve the accuracy in the simulation of snow storage and melting, which strongly affect the occurrence and timing of drought events. For this reason, the work will also analyse the benefits of an increasing spatial resolution of the semi-distributed set-up of the model, comparing the outcomes obtained when sequentially calibrating the model in a semi-distributed fashion on the upstream sub-catchments in respect to the baseline of a lumped configuration.


References

Coron, L., Thirel, G., Delaigue, O., Perrin, C. and Andréassian, V. (2017). The Suite of Lumped GR Hydrological Models in an R package. Environmental Modelling and Software, 94, 166-171, doi: 10.1016/j.envsoft.2017.05.002.

David Dorchies (2022). airGRiwrm: 'airGR' Integrated Water Resource Management. R package version 0.6.1. https://CRAN.R-project.org/package=airGRiwrm

How to cite: Neri, M. and Toth, E.: On the accurate simulation of hydrological droughts in Alpine regions: investigating the multiple role of rainfall-runoff model dynamics and basin characteristics, EGU General Assembly 2023, Vienna, Austria, 23–28 Apr 2023, EGU23-8153, https://doi.org/10.5194/egusphere-egu23-8153, 2023.

EGU23-8553 | ECS | Posters on site | HS1.3.1

Using Docker in environmental research 

Alexander Dolich, Mirko Mälicke, Ashish Manoj J, Jan Wienhöfer, and Erwin Zehe

The virtual research environment V-FOR-WaTer provides functionalities to store and access hydrological and other environmental data from various sources and disciplines. We propose a framework to run containerized tools within the V-FOR-WaTer toolbox, that is intended to solve the problem of combining software or scripts developed in different programming languages.

The framework is used to manage Docker containers, which can contain software like tools for data analysis or environmental modeling. Alongside the well-known advantages of containerization, such as development speed and efficiency, isolation from the local system, dependency management and portability, the usage of containers also ensures a high degree of reproducibility.

Given a scientific context, containers are especially useful to combine scripts in different languages following different development paradigms. To do so, we developed a framework-agnostic container specification which standardizes inputs and outputs from and to containers to ease the development of new tools. As of now we also provide templates for tools developed in Python, R, Octave and NodeJS.

We present an exemplary workflow for the CATFLOW hydrological model. Data from the V-FOR-WaTer environment is loaded using a Python tool and preprocessed with an existing R tool. After running the FORTRAN model, existing tools in Python, R and MATLAB are used for analysis and presentation of results. When executing the workflow, the user does not need to be familiar with the different programming languages of individual tools, since the containerized tools are self-contained by definition.

How to cite: Dolich, A., Mälicke, M., Manoj J, A., Wienhöfer, J., and Zehe, E.: Using Docker in environmental research, EGU General Assembly 2023, Vienna, Austria, 23–28 Apr 2023, EGU23-8553, https://doi.org/10.5194/egusphere-egu23-8553, 2023.

For scientific products to be considered actionable for stakeholder purposes they must meet certain epistemic and contextual conditions of adequacy. In evaluating the adequacy of a scientific product derived from Earth system models for actionable purposes—such as adaptation or resilience planning— there is a tendency to engage in the evaluation of raw model output and subject it to postprocessing to gain desired reliability and fitness. However, this reductive approach and focus on data ignores questions of whether the simulations, model configurations, and representational features of the models are themselves adequate and reliable for the actionable applications. This talk will lay out the reasons why we need to shift our practices to evaluating models and their products in a more holistic manner and provides insight into a framework for doing so. Scientific models—in this case Earth system models—are constructed with certain purposes and research questions in mind. These purposes, and more detailed research questions, engender representational values, which are reflections of what we want to know and why we want to know it. When model development is informed by these representational values underlying our questions and purposes, they are determinants of the decisions made during model construction about what we choose to represent and how we choose to represent it. The consequence is that the models constructed reflect these representational values and occupy a representational perspective, one that is fit for answering the questions and purposes that governed its development, but not those questions and applications that lie outside that perspective. To avoid increasing epistemic risk when using models for actionable purposes, which can result in downstream social harms, we need to assess the adequacy and reliability of our instruments and their products further upstream, in terms of consistency between the representational values that are embedded in the model in virtue of its development pathway and those that are implied in the actionable science questions the model could be applied to answer. More holistic, tailored assessments will allow us to avoid increases in epistemic risk due to how stakeholder representational values and conditions of adequacy can be inconsistent with those values being reflected in the representational content of the model being employed.

How to cite: Morrison, M.: Adequacy and Reliability of Earth System Models: Actionable Purposes, Model Inadequacy and Epistemic Risk, EGU General Assembly 2023, Vienna, Austria, 23–28 Apr 2023, EGU23-8858, https://doi.org/10.5194/egusphere-egu23-8858, 2023.

The COVID-19 pandemic has shown the importance of modeling in guiding decision-making for governments and society, and the significant influence that modelers hold, especially during times of crisis. Water modelers may also encounter similar situations where their models are caught up in political debates, shaping people's everyday lives. 

This paper discusses the cultural and professional norms around water modeling practice that need to be established or revisited in order to make modeling work more responsible, through a review of models developed for COVID-19. It introduces six areas of study for "responsible water modeling" that can advance future theoretical and practical discussions on the topic: (1) building a common appreciation of the concept of responsibility, (2) interactions between science and policy, (3) the influence of boundary judgments on the model's outcome, (4) the politics of uncertainty, (5) stakeholder involvement, and (6) integration and coordination

The paper suggests that by focusing on these subjects, the fundamental principles and characteristics of responsible modeling can be established in order to address and respond to water challenges while also serving the public good.

How to cite: Nabavi, E.: Navigating Responsible Water Modeling in the Wake of COVID-19, EGU General Assembly 2023, Vienna, Austria, 23–28 Apr 2023, EGU23-9710, https://doi.org/10.5194/egusphere-egu23-9710, 2023.

EGU23-10230 | Orals | HS1.3.1

Instrumenting good modelling practice as common practice 

Anthony Jakeman, Sondoss Elsawah, and Serena Hamilton

Good modelling practice has many requirements. Above all, the process should be complete and transparent enough so that the credibility of its conclusions can be comprehended, or even assessed, by its intended audience. And the more complex, uncertain and cross-sectoral the problem being modelled, or potentially devastating its consequences may be, the more the need for good practice. Consequently, good modelling practice is essential in addressing not just climate change issues, but also cross-sectoral issues such as occurs with water, energy, agriculture and the socio-economy. Yet despite widespread acknowledgment of the grand socio-environmental challenges facing the planet, practices as seen in the major literature largely remain meagre, and most often are pathetically inadequate.

The presentation begins with a list of specific technical complaints around poor practice, ones that could be easily remedied by modellers, to concede this unnecessary state of affairs. We argue for a suitable ontology around concepts for anchoring good modelling practice, including trustworthiness, assurance, robustness, reproducibility and credibility, along with fitness-for-purpose notions of usability, reliability and feasibility. We also emphasize the often-overlooked role of human factors in the modelling process, including assumptions and choices made by the modeller, and consider how consequent biases or uncertainties can be reduced. We then synthesize the steps in the modelling process as recognized in the scientific and grey literature, and provide examples of checklists of questions that merit addressing for each step. Many of these questions prompt consideration of methodological choices, especially around uncertainty and scale. Good modelling practice warrants greater transparency in documenting, justifying and, wherever possible, comparing methodological choices and related assumptions. We argue that the level of robustness to choices be made clearer.

The modelling community must however address how to advance modelling so that good practice becomes not just well-known but common practice. Instruments for achieving this are posited around: regulation by journals in terms of standards that they require for relevant papers published; developing incentives for following good practice; promoting an institutional/community culture around it, and expanding education and capacity building in modelling that focusses from the start on good practice as being fundamental.

How to cite: Jakeman, A., Elsawah, S., and Hamilton, S.: Instrumenting good modelling practice as common practice, EGU General Assembly 2023, Vienna, Austria, 23–28 Apr 2023, EGU23-10230, https://doi.org/10.5194/egusphere-egu23-10230, 2023.

EGU23-10527 | Orals | HS1.3.1

Improving the science and practice of hydrological modelling 

Martyn Clark, Wouter Knoben, Guoqiang Tang, Ashley van Beusekom, Louise Arnal, and Ray Spiteri

Many hydrological modelling groups face similar challenges, with untapped opportunities to share code and concepts across different model development groups. An active community of practice is emerging, where the focus is not so much on developing a community hydrological model, and more on advancing the science and practice of community hydrological modelling. This presentation will summarize our recent efforts to develop open-source models, methods, and datasets to enable process-based hydrological prediction across large geographical domains. This presentation summarizes our recent efforts to advance the science and practice of hydrological modelling, focusing on recent work to (1) develop multi-source probabilistic hydrometeorological forcing datasets on continental and global domains; (2) advance a flexible approach to represent a myriad of physical processes in a unified modelling framework; (3) improve the numerical robustness and efficiency of large-domain terrestrial system model simulations; and (4) develop extensible and reproducible modeling workflows. The presentation will highlight major scientific challenges, future research needs, and some key opportunities for community collaboration.

How to cite: Clark, M., Knoben, W., Tang, G., van Beusekom, A., Arnal, L., and Spiteri, R.: Improving the science and practice of hydrological modelling, EGU General Assembly 2023, Vienna, Austria, 23–28 Apr 2023, EGU23-10527, https://doi.org/10.5194/egusphere-egu23-10527, 2023.

EGU23-11062 | Posters on site | HS1.3.1

A guideline for consistent water quality modeling in rural areas 

Jens Kiesel, Nicola Fohrer, Paul D. Wagner, Marcelo Haas, and Björn Guse

In several hydrological studies the need for consistency in hydrological modeling was highlighted. To achieve model consistency, it is required that all relevant hydrological processes are evaluated for accuracy in their spatio-temporal representation under consideration of available observations. In this study, we transfer the idea of hydrological consistency to water quality modeling. We focus on water quality modelling in rural mesoscale catchments and the interaction with agricultural production systems and their management. Based on several studies, we have developed a guideline which includes the following six challenges:

  • Representation of rural landscape: Spatial and temporal patterns of land use and land management are critical to adequately represent water quality in models. Remote sensing and land use models are very useful resources to be exploited.
  • Accuracy in model structure and model parameters: The transfer of a model diagnostic analysis to water quality leads to a better understanding of how water quality variables are controlled by model structures and corresponding model parameters.
  • Check of multiple model output for consistency: Assessing multiple model outputs regarding their temporal, spatial and process performance using observed time series, remotely sensed spatial patterns, knowledge about transport pathways and even soft data can significantly enhance model consistency.
  • Joint multi-metric calibration of discharge and water quality for all magnitudes: Multi-metric calibration using performance metrics and signature measures both for discharge and water quality, such as flow and nitrate duration curve, leads to more balanced model simulations that represent all magnitudes of discharge and water quality accurately.
  • Scenarios and storylines for reliable land management: Scenarios and storylines should be co-developed with stakeholders in the river basin to increase realism and the acceptance of model results. They should be coherent in space and time, and provide a mix of available management options.
  • Consistent interpretation of impacts on water quality: The interpretation of scenarios can be supported by diagnostic tools to show the effectiveness of measures and their combinations while considering their costs and impacts on ecosystem services.

In our contribution, we give examples and further details regarding each challenge to give insights how to achieve consistency in water quality modelling.

How to cite: Kiesel, J., Fohrer, N., Wagner, P. D., Haas, M., and Guse, B.: A guideline for consistent water quality modeling in rural areas, EGU General Assembly 2023, Vienna, Austria, 23–28 Apr 2023, EGU23-11062, https://doi.org/10.5194/egusphere-egu23-11062, 2023.

EGU23-12261 | ECS | Orals | HS1.3.1

Peeking Inside Hydrologists' Minds: Comparing Human Judgment and Quantitative Metrics of Hydrographs 

Martin Gauch, Frederik Kratzert, Oren Gilon, Hoshin Gupta, Juliane Mai, Grey Nearing, Bryan Tolson, Sepp Hochreiter, and Daniel Klotz

Everyone wants their hydrologic models to be as good as possible. But how do we know if a model is accurate or not? In the spirit of rigorous and reproducible science, the answer should be: we calculate metrics. Yet, as humans, we sometimes follow a scheme of "I know a good model when I see it" and manually inspect hydrographs to assess their quality. This is certainly a valid method for sanity checks, but it is unclear whether these subjective visual ratings agree with metric-based rankings. Moreover, the consistency of such inspections is unclear, as different observers might come to different conclusions about the same hydrographs.

In this presentation, we report a large-scale study where we collected responses from 622 experts, who compared and judged more than 14,000 pairs of hydrographs from 13 different models. Our results show that overall, human ratings broadly agree with quantitative metrics in a clear preference for a Machine Learning model. At the level of individuals, however, there is a large amount of inconsistency between ratings from different participants. Still, in cases where experts agree, we can predict their most likely rating purely from qualitative metrics. This indicates that we can encode intersubjective human preferences with a small set of objective, quantitative metrics. To us, these results make a compelling case for the community to put more trust into existing metrics—for example, by conducting more rigorous benchmarking efforts.

How to cite: Gauch, M., Kratzert, F., Gilon, O., Gupta, H., Mai, J., Nearing, G., Tolson, B., Hochreiter, S., and Klotz, D.: Peeking Inside Hydrologists' Minds: Comparing Human Judgment and Quantitative Metrics of Hydrographs, EGU General Assembly 2023, Vienna, Austria, 23–28 Apr 2023, EGU23-12261, https://doi.org/10.5194/egusphere-egu23-12261, 2023.

EGU23-13770 | Posters on site | HS1.3.1

Towards FAIR hydrological modeling with HydroMT 

Hélène Boisgontier, Dirk Eilander, Laurène Bouaziz, Joost Buitink, Anaïs Couasnon, Roel de Goede, Mark Hegnauer, Tim Leijnse, and Willem van Verseveld

Hydrological models are crucial to understand water systems and perform impact assessment studies. However, these models require a lot of accurate data, especially if the model is spatially distributed. However, sufficiently accurate datasets while available, for example from earth-observations, need to be converted into model-specific, sometimes idiosyncratic, file formats. Therefore, hydrological models require various steps to process raw input data to model data which, if done manually, makes the process time consuming and hard to reproduce. Hence, there is a clear need for automated model instance setup for increased transparency and reproducibility in hydrological modeling.


HydroMT (Hydro Model Tools) is an open-source Python package (https://github.com/Deltares/hydromt) that aims to make the process of building hydrological model instances and analyzing their results automated and reproducible. Compared to many other packages for automated model instance setup, HydroMT is data- and model-agnostic, meaning that data sources can easily be interchanged without additional coding and the generic model interface can be used for different model software. This makes it possible to reuse workflows to prepare input from different datasets or for different model software that require the same parameter (e.g. Manning roughness derived from land use maps) and thereby supporting controlled model intercomparison and sensitivity experiments. 


In this contribution we show the application of HydroMT for flood hazard modeling using the distributed hydrological Wflow model and the reduced-physics hydrodynamic SFINCS model, both open-source models. We use HydroMT to setup a controlled and reproducible model experiment. We test the sensitivity of both models to various data sources used- and assumptions taken in the model instance building process and compare the skill to simulate peak discharge. Using this application, we discuss the merits and limitations of HydroMT and next steps toward FAIR hydrological modeling.

How to cite: Boisgontier, H., Eilander, D., Bouaziz, L., Buitink, J., Couasnon, A., de Goede, R., Hegnauer, M., Leijnse, T., and van Verseveld, W.: Towards FAIR hydrological modeling with HydroMT, EGU General Assembly 2023, Vienna, Austria, 23–28 Apr 2023, EGU23-13770, https://doi.org/10.5194/egusphere-egu23-13770, 2023.

EGU23-15221 | Orals | HS1.3.1

The persistence of errors: How evaluating models over data partitions relates to a global evaluation 

Daniel Klotz, Martin Gauch, Grey Nearing, Sepp Hochreiter, and Frederik Kratzert

Skillful today, inept tomorrow. Today's hydrological models have pronounced and complex error dynamics (e.g., small, highly correlated errors for low flows and large, random errors for high flows). Modellers generally accept that simple, variance based evaluation criteria — like the Nash-Sutcliffe Efficiency (NSE) — are not fully able to capture these intricacies. The (implied) consequences of this are however seldom discussed.

This contribution examines how evaluating the model over two data partitions (above and below a chosen threshold) relates to a global model evaluation of both partitions combined (i.e., the usual way of computing the NSE). For our experiments we manipulate dummy simulations with gradient descent to approximate specific NSE values for each partition individually. Specifically, we set the NSE for runoff values that fall below the threshold, and vary the NSE of the simulations above the threshold as well as the threshold itself. This enables us to study how the global NSE relates to the partition NSEs and the threshold. Intuitively, one would wish that the global NSE somehow reflects the performance on the partitions in a comprehensible manner. We do however show that this relation is not trivial.

Our results also show that subdividing the data and evaluating over the resulting partitions yields different information regarding model deficiencies than an overall evaluation. The downside is that we have less data to estimate the NSE. In the future we can use this for model selection and diagnostic purposes.

How to cite: Klotz, D., Gauch, M., Nearing, G., Hochreiter, S., and Kratzert, F.: The persistence of errors: How evaluating models over data partitions relates to a global evaluation, EGU General Assembly 2023, Vienna, Austria, 23–28 Apr 2023, EGU23-15221, https://doi.org/10.5194/egusphere-egu23-15221, 2023.

EGU23-15300 | Orals | HS1.3.1

Consistency in Model Performance as a Criterion for Trustworthy Hydrological Modelling 

Andrijana Todorović and Claudia Teutschbein

Various models are available to hydrologists, including models of different structures, spatial and temporal discretisation, or multiple parameter sets of a single model. But the "trustworthiness" of these models is called into doubt when they reproduce runoff equally well in the calibration period (equifinality), but diverge in their simulation outputs outside this period. A common way to account for modelling uncertainty is to use so-called ensembles that combine several model members. However, it has been debated/discussed that models that do not provide “the right answers for the right reasons” and, consequently, yield poor performance in a prediction or forecasting mode, should be omitted from such ensembles. Various evaluation protocols aimed at detecting such models have emerged over the years, however, this remains an open research question, and more research is needed especially in the context of shifting hydrologic regimes in a changing climate.


Adopting the consistency in model performance in reproducing runoff as an additional criterion to select among multiple models emerges as a plausible way to identify the most “trustworthy” ones. We propose an approach that relies on detailed analyses of model performance across subperiods of increasing length contained within the calibration period. A good performance in both short and longer subperiods is crucial as the former can be quite extreme (e.g., extremely dry or wet), while the latter “expose” a model to various hydroclimatic conditions. To analyse the consistency in model performance, an efficiency measure (e.g., the Kling-Gupta coefficient, KGE) can be computed in each subperiod, and each model can be ranked in each subperiod according to the measure. Models yielding the most consistent and the highest performance can then be selected either (1) as a certain percentage of models with the highest rank averaged across all subperiods, or (2) by imposing a rank threshold that has to be reached in every subperiod. We here further propose to additionally evaluate the selected subset of consistent and high-performing models over an independent period using various other performance indicators (e.g., Nash-Sutcliffe coefficient or volumetric efficiency) as well as model ability to reproduce hydrological signatures (e.g., mean, high and low flows, or runoff dynamics). The evaluation performance of the selected models can then be compared to the best (reference) model obtained from the calibration over the full calibration period with the selected efficiency measure (here KGE) as the objective function.


To showcase the advantages of the proposed approach, it is here applied to two different models (3DNet-Catch and GR4J) each with 20,000 randomly sampled parameter sets in three unimpaired catchments. In addition to the promising results, the proposed approach is characterised by its ease-of-use and flexibility, i.e., it can be implemented with any ensemble of models (e.g., randomly selected parameter sets of a single model, or different models created e.g., from a modular framework), or with any other aspect of model performance.

How to cite: Todorović, A. and Teutschbein, C.: Consistency in Model Performance as a Criterion for Trustworthy Hydrological Modelling, EGU General Assembly 2023, Vienna, Austria, 23–28 Apr 2023, EGU23-15300, https://doi.org/10.5194/egusphere-egu23-15300, 2023.

EGU23-16869 | Posters virtual | HS1.3.1

Open, Quick and Reproducible Hydrological Model Deployment Cloud Platform 

Lele Shu, Yan Chang, Xianhong Meng, Paul Ullrich, Christopher Duffy, Hao Chen, Shihua Lyu, Yaonan Zhang, and Zhaoguo Li

Model and data are essential for current geoscientific research. Too many hydrological models are available for potential modelers, plus too much spatial terrestrial data related to modeling is accessible to users. More importantly, reproducibility is one of the key features in science,  which is barely discussed in hydrological models. Two significant reasons are that (1) the various hydrological models are incompatible since they require different variables, even if some of them share the same terminology, and (2) the complexity of model structure makes it impossible to deploy a model swiftly in any new research area. 
Our project is to establish a Global Hydrological Data Cloud (GHDC, https://shuddata.com) providing essential terrestrial variables for generic hydrological modeling, as modelers provide the watershed boundary and model requests. The data retrieved from the GHDC covers terrain, topology, soil/geology, landuse, hydraulic parameters and meteorological time-series data. The demonstration of three watershed examples with the Simulator of Hydrologic Unstructured Domains (SHUD),  can be a standard paradigm for physically-based hydrological modeling and instructive for other modeling processes, as the procedures are transferable to other hydrological models and regions. 

How to cite: Shu, L., Chang, Y., Meng, X., Ullrich, P., Duffy, C., Chen, H., Lyu, S., Zhang, Y., and Li, Z.: Open, Quick and Reproducible Hydrological Model Deployment Cloud Platform, EGU General Assembly 2023, Vienna, Austria, 23–28 Apr 2023, EGU23-16869, https://doi.org/10.5194/egusphere-egu23-16869, 2023.

EGU23-5 | ECS | PICO | HS1.3.2

Probabilistic analysis of river levees under consideration of time-dependent loads 

Marco Albert Öttl, Jens Bender, and Jürgen Stamm

In the analysis regarding the stability of river dikes, the interactions between the load magnitude of the flood level and the resulting percolation are found to be a highly relevant process. After all, the seepage line separates the cross-sectional area into the water-saturated and the unsaturated crosssectional parts. For homogeneous levees, the position of the seepage line in the stationary case is imprinted in the system by the outer cubature and is well on the safe side for real flood events. In the non-stationary case, the position of the seepage line depends primarily on the changing water level of a flood hydrograph, the resulting water content and suction stresses in the dike, as well as the saturated permeability of the dike construction materials. In the current dimensioning practice according to DIN 19712 and the German DWA-M-507, the characteristic of the hydrograph is not directly applied. So far, for example, the resulting damming duration of a flood hydrograph is only considered indirectly.
This paper presents a methodology, which quantifies natural dependency structures for a selected dike section by synthetically generated dimensioning hydrographs in a probabilistic design. These results are then integrated directly into the geohydraulic process of water penetration. Based on selected water level and discharge time series at a dike section, flood waves can be described in five parameters using the extended flood characteristic simulation according to MUNLV1. After successfully adapting suitable distribution functions, dependencies in the load structure are quantified in the next step using Copula function. Subsequently, any number of synthetic flood hydrographs can be generated by combining these parameters. In keeping with the principle of the Monte Carlo simulation, a sufficiently high number of synthetic events results in extreme conditions with a low probability of occurrence being reliably represented.
Using a developed routine, the process of moisture penetration for the individual flood hydrographs can be simulated and visualized in a transient, geohydraulically numerical model at different points in times. Finally, statements regarding the behavior patterns of the resulting seepage lines, based on the loading situation can be derived and predicted. Based on these results, a reliability analysis then shows the stability of the dike section under the given extreme conditions.

1Ministerium für Umwelt, Landwirtschaft, Natur und Verbraucherschutz des Landes Nordrhein-Westfalen

How to cite: Öttl, M. A., Bender, J., and Stamm, J.: Probabilistic analysis of river levees under consideration of time-dependent loads, EGU General Assembly 2023, Vienna, Austria, 23–28 Apr 2023, EGU23-5, https://doi.org/10.5194/egusphere-egu23-5, 2023.

EGU23-487 | ECS | PICO | HS1.3.2

A physics-informed machine learning approach to estimate surface soil moisture 

Abhilash Singh and Kumar Gaurav

We propose Physics Informed Machine Learning (PIML) algorithms to estimate surface soil moisture from Sentinel-1/2 satellite images based on Artificial Neural Networks (ANN). We have used Improved Integral Equation Model (I2EM) to simulate the radar images backscatter in VV polarisation. In addition, we selected a set of different polarisations, i.e.; (VH, VH/VV, VH-VV), incidence angle, Normalised Difference Vegetation Index (NDVI), and topography as input features to map surface soil moisture. We have used two different approaches to predict soil moisture using PIML. In the first approach, we developed an observation bias in which we selected the difference of backscatter value at each pixel in VV polarisation from satellite and derived from theoretical model derived as one of the input features. Our second approach is based on learning bias, in which we modified the loss function with the help of the I2EM model. Our result shows the learning bias PIML outperforms the observation bias PIML with R = 0.94, RMSE = 0.019 m3/m3, and bias = -0.03. We have also compared the performance with the standalone benchmark algorithms. We observed the learning bias PIML emerged as the most accurate model to estimate the surface soil moisture. The proposed approach is a step forward in estimating accurate surface soil moisture at high spatial resolution from remote sensing images.

How to cite: Singh, A. and Gaurav, K.: A physics-informed machine learning approach to estimate surface soil moisture, EGU General Assembly 2023, Vienna, Austria, 23–28 Apr 2023, EGU23-487, https://doi.org/10.5194/egusphere-egu23-487, 2023.

EGU23-4039 | ECS | PICO | HS1.3.2

UNITE: A toolbox for unified diagnostic evaluation of physics-based, data-driven and hybrid models based on information theory 

Manuel Álvarez Chaves, Anneli Guthke, Uwe Ehret, and Hoshin Gupta

The use of “hybrid” models that combine elements from physics-based and data-driven modelling approaches has grown in popularity and acceptance in recent years, but these models also present a number of challenges that must be addressed in order to ensure their effectiveness and reliability. In this project, we propose a toolbox of methods based on information theory as a step towards a unified framework for the diagnostic evaluation of “hybrid" models. Information theory provides a set of mathematical tools that can be used to study input data, model architecture and predictions, which can be helpful in understanding the performance and limitations of “hybrid” models.

Through a comprehensive case study of rainfall-runoff hydrological modelling, we show how a very simple physics-based model can be coupled in different ways with neural networks to develop “hybrid” models. The proposed toolbox is then applied to these “hybrid” models to extract insights which guide towards model improvement and refinement. Diagnostic scores based on the entropy (H) of individual predictions and the Kullback-Leibler divergence (KLD) between predictions and observations are introduced. Mutual information (I) is also used as a more all-encompassing metric which informs on the aleatory and epistemic uncertainties of a particular model. In order to address the challenge of calculating quantities from information theory on continuous variables (such as streamflow), the toolbox takes advantage of different estimators of differential entropy, namely: binning, kernel density estimation (KDE) and k-nearest neighbors (k-NN).

How to cite: Álvarez Chaves, M., Guthke, A., Ehret, U., and Gupta, H.: UNITE: A toolbox for unified diagnostic evaluation of physics-based, data-driven and hybrid models based on information theory, EGU General Assembly 2023, Vienna, Austria, 23–28 Apr 2023, EGU23-4039, https://doi.org/10.5194/egusphere-egu23-4039, 2023.

We introduce and illustrate our recently developed Augmented Information Physical Systems Intelligence (AIPSI), leveraging and enhancing our proprietary Information Physical Artificial Intelligence (IPAI) and Earth System Dynamical Intelligence (ESDI) to further the mathematically robust, physically consistent and computationally efficient holistic articulation and integration across the latest advances in fundamental physics, geophysical sciences and information technologies.

In theoretical terms, AIPSI brings out a more general principled lingua franca and formal construct to complex system dynamics and analytics beyond traditional hybridisation among stochastic-dynamic, information-theoretic, artificial intelligence and mechanistic techniques.

In practical terms, it empowers improved high-resolution spatiotemporal early detection, robust attribution, high-performance forecasting and decision support across multissectorial theatres of operation pertaining multiple interacting hazards, natural, social and hybrid.

With operational applications in mind, AIPSI methodologically improves the sharp trade-off between speed and accuracy of multi-hazard phenomena sensing, analysis and simulation techniques, along with the quantification and management of the associated uncertainties and predictability with sharper spatio-temporal resolution, robustness and lead.

This is further supported by the advanced Meteoceanics QITES constellation providing coordinated volumetric dynamic sensing and processing of gravitational and electrodynamic fluctuations, thereby providing an instrumentation ecosystem for anticipatory early detection of extreme events such as flash floods, explosive cyclogenesis and imminent disruptive structural critical transitions across built and natural environments.

With the methodological developments at hand, a diverse set of applications to critical theatres of operation are presented, ranging from early detection, advance modelling and decision support to environmental and security agencies entrusted with the protection and nurturing of our society and the environment. Contributing to empowering a more robust early detection, preparedness, response, mitigation and recovery across complex socio-environmental hazards such as those involving massive wildfires, floods and their nonlinear compound interplay, their underlying mechanisms and consequences.

The presentation concludes with an overview of a new large-scale international initiative on multi-hazard risk intelligence networks, where an eclectic diversity of actors ranging from academia and industry to institutions and the civil society come together to co-create emerging pathways for taking this challenging quest even further, in a fundamental coevolution between cutting-edge science, groundbreaking technology and socio-environmental insights to further enrich the ever-learning system dynamic framework at the core of our multi-hazard research and service.

Acknowledgement: This contribution is funded by the Εuropean Union under the Horizon Europe grant 101074004 (C2IMPRESS).


How to cite: Perdigão, R. A. P. and Hall, J.: Augmented Information Physical Systems Intelligence (AIPSI) for enhanced spatiotemporal early detection, attribution, prediction and decision support on multi-hazards, EGU General Assembly 2023, Vienna, Austria, 23–28 Apr 2023, EGU23-6617, https://doi.org/10.5194/egusphere-egu23-6617, 2023.

EGU23-8388 | ECS | PICO | HS1.3.2 | Highlight

An ML-based Probabilistic Approach for Irrigation Scheduling 

Shivendra Srivastava, Nishant Kumar, Arindam Malakar, Sruti Das Choudhury, Chittaranjan Ray, and Tirthankar Roy

Globally, agriculture irrigation accounts for 70% of water use and is facing extensive and increasing water constraints. Well-designed irrigation scheduling can help determine the appropriate timing and water requirement for crop development and consequently improve water use efficiency. This research aims to assess the probability of irrigation needed for agricultural operations, considering soil moisture, evaporation, and leaf area index as indicators of crop water requirement. The decision on irrigation scheduling is taken based on a three-step methodology. First, relevant variables for each indicator are identified using a Random Forest regressor, followed by the development of a Long Short-Term Memory (LSTM) model to predict the three indicators. Second, errors in the simulation of each indicator are calculated by comparing the predicted values against the actual values, which are then used to calculate the error weights (normalized) of the three indicators for each month (to capture the seasonal variations). Third, the empirical distribution of each indicator is obtained for each month using the estimated error values, which are then adjusted based on the error weights calculated in the previous step. The probabilities of three threshold values (for each indicator) are considered, which correspond to three levels of irrigation requirement, i.e., low, medium, and high. The proposed approach provides a probabilistic framework for irrigation scheduling, which can significantly benefit farmers and policymakers in more informed decision-making related to irrigation scheduling.

How to cite: Srivastava, S., Kumar, N., Malakar, A., Choudhury, S. D., Ray, C., and Roy, T.: An ML-based Probabilistic Approach for Irrigation Scheduling, EGU General Assembly 2023, Vienna, Austria, 23–28 Apr 2023, EGU23-8388, https://doi.org/10.5194/egusphere-egu23-8388, 2023.

Inference of causality and understanding of extreme events are two intensively developing multidisciplinary areas highly relevant for the Earth sciences. Surprisingly, there is only a limited interaction of the two research areas.

Quantification of causality in terms of improved predictability was proposed by the father of cybernetics N. Wiener [1] and formulated for time series by C.W.J. Granger [2]. The Granger causality evaluates predictability in bivariate autoregressive models. This concept has been generalized for nonlinear systems using methods rooted in information theory [3]. The information theory of Shannon, however, usually ignores two important properties of Earth system dynamics: the evolution on multiple time scales and heavy-tailed probability distributions. While the multiscale character of complex dynamics, such as the air temperature variability, can be studied within the Shannonian framework in combination with the wavelet transform [4], the entropy concepts of Rényi and Tsallis have been proposed to cope with variables with heavy-tailed probability distributions. We will discuss how such non-Shannonian entropy concepts can be applied in inference of causality in systems with heavy-tailed probability distributions and extreme events. Using examples from the climate system, we will focus on causal effects of the North Atlantic Oscillation, blocking events and the Siberian high on winter and spring cold waves in Europe, including the April 2021 frosts endangering French vineyards. Using the non-Shannonian information-theoretic concepts we bridge the inference of causality and understanding of the occurrence of extreme events.

Supported by the Czech Academy of Sciences, Praemium Academiae awarded to M. Paluš.

[1] N. Wiener, in: E. F. Beckenbach (Editor), Modern Mathematics for Engineers (McGraw-Hill, New York, 1956)

[2] C.W.J. Granger, Econometrica 37 (1969) 424

[3] K. Hlaváčková-Schindler  et al., Phys. Rep. 441 (2007)  1; M. Paluš, M. Vejmelka, Phys. Rev. E 75 (2007) 056211; J. Runge et al., Nature Communications 6 (2015) 8502

[4] M. Paluš, Phys. Rev. Lett. 112 (2014) 078702; N. Jajcay, J. Hlinka, S. Kravtsov, A. A. Tsonis, M. Paluš, Geophys. Res. Lett. 43(2) (2016) 902–909

How to cite: Paluš, M.: Non-Shannonian information theory connects inference of causality and understanding of extreme events, EGU General Assembly 2023, Vienna, Austria, 23–28 Apr 2023, EGU23-10707, https://doi.org/10.5194/egusphere-egu23-10707, 2023.

This research investigated the applicability of a probabilistic physics-informed Deep Learning (DL) algorithm, i.e.,deep autoregressive network (DeepAR), for rainfall-runoff modeling across the continental United States (CONUS). Various catchment physical parameters were incorporated into the probabilistic DeepAR algorithm with various spatiotemporal variabilities to simulate rainfall-runoff processes across Hydrologic Unit Code 8 (HUC8). We benchmarked our proposed model against several physics-based hydrologic approaches such as Sacramento Soil Moisture Accounting Model (SAC-SMA), Variable Infiltration Capacity (VIC), Framework for Understanding Structural Errors (FUSE), Hydrologiska Byråns Vattenbalansavdelning (HBV), and the mesoscale hydrologic model (mHM). These approaches were implemented using Catchment Attributes and Meteorology for Large-sample Studies (CAMELS), Maurer datasets. Analysis suggested that catchment physical attributes such as drainage area have significant impacts on rainfall-runoff generation mechanisms while catchment fraction of carbonate sedimentary rocks parameter’s contribution were insignificant. The results of the proposed physics-informed DeepAR simulation were comparable and somewhat superior to the well-known conceptual hydrologic models across CONUS.  

How to cite: Sadeghi Tabas, S. and Samadi, V.: A Probabilistic Physics-informed Deep Learning Model for Rainfall-runoff Prediction across Continental United States, EGU General Assembly 2023, Vienna, Austria, 23–28 Apr 2023, EGU23-11222, https://doi.org/10.5194/egusphere-egu23-11222, 2023.

EGU23-13068 | ECS | PICO | HS1.3.2

Identifying the drivers of lake level dynamics using a data-driven modeling approach 

Márk Somogyvári, Ute Fehrenbach, Dieter Scherer, and Tobias Krueger

The standard approach of modeling lake level dynamics today is via process-based modeling. The development of such models requires an extensive knowledge about the investigated system, especially the different hydrological flow processes. When some of this information is missing, these models could provide distorted results and could miss important system characteristics.

In this study, we show how data-driven modeling can help the identification of the key drivers of lake level changes. We are using the example of the Groß Glienicker Lake, a glacial, groundwater fed lake near Berlin. This lake has been experiencing a drastic loss of water in recent decades, whose trend became even faster in the last few years. There is a local controversy whether these changes are mainly weather driven, or caused by water use; and what mitigation measures could be used to counteract them. Due to the strong anthropogenic influence from multiple water-related facilities near the lake, and the lack of geological information from the catchment, there are many unknows about the properties of the hydrological processes, hence the development of a process-based model in the area is challenging. To understand the system better we combine data-driven models with water balance approaches and use this methodology as an alternative to classic hydrological modeling.

The climatic model input (catchment-average precipitation and actual evapotranspiration) is generated by the Central European Refinement dataset (CER), which is a meteorological dataset generated by dynamically downscaling the Weather Research and Forecasting model (Jänicke et al., 2017). First, a data-driven model is constructed to predict the changes in lake levels one day ahead by using precipitation and evapotranspiration values from the last two months, a time interval that was selected after an extensive parameter analysis. This model is then further extended by additional inputs, such as water abstraction rates, river and groundwater levels. The fits of the different simulated lake levels are evaluated to identify the effects of the relevant drivers of the lake level dynamics. For a more mechanistic interpretation, a monthly water balance model was created using the same dataset. By calculating the different fluxes within the system, we were able to estimate the magnitudes of unobserved hydrological components.

With the help of our modeling approach, we could rule out the influence of one of the nearby waterworks and a river. We have also found that the lake level dynamics over the last two decades was mainly weather-driven, and the lake level fluctuations could be explained with changes in precipitation and evapotranspiration. With the water balance modeling, we have shown that the long-term net outflux from the lake catchment has increased in the last few years. These findings are used to support the development of a local high-resolution hydrogeological model, which could be used to further analyze these processes.

References

Jänicke, B., Meier, F., Fenner, D., Fehrenbach, U., Holtmann, A., Scherer, D. (2017): Urban-rural differences in near-surface air temperature as resolved by the Central Europe Refined analysis (CER): sensitivity to planetary boundary layer schemes and urban canopy models. Int. J. Climatol. 37 (4), 2063-2079. DOI: 10.1002/joc.4835

How to cite: Somogyvári, M., Fehrenbach, U., Scherer, D., and Krueger, T.: Identifying the drivers of lake level dynamics using a data-driven modeling approach, EGU General Assembly 2023, Vienna, Austria, 23–28 Apr 2023, EGU23-13068, https://doi.org/10.5194/egusphere-egu23-13068, 2023.

Streamflow monitoring is a key input to water resource management, as it is an important source of information for understanding hydrological processes and prediction catchment behaviour and resulting flows. Both the monitored and the predicted flows support important decisions in areas such as infrastructure design, flood forecasting and resource allocation. It is therefore essential that the predictive information we have about our water resources serves these various needs.

Since observations are from the past and our decisions affect the future, models are needed to extrapolate measurements in time. Similarly, streamflow is not always measured at places where the information is needed, so interpolation or extrapolation is needed in space or across catchment properties and climates. Recent advances in publicly available large datasets of streamflow records and corresponding catchment characteristics have enabled succesful applications of machine learning to this prediction problem, leading to increased predictability in ungauged basins.

Since information content is related to surprise, we could see the objective of monitoring networks as manufacturing surprising data. This is formalized in approaches for monitoring network design based on information theory, where often the information content of the sources, i.e. the existing monitoring stations, has been investigated, including the effects of redundancy due to shared information between stations.

In this research, we argue that information content is related to unpredictability, but is inevitably filtered through several layers, which should be considered for monitoring network design. Examples of such filters are the models used for extrapolation to ungauged sites of interest, the target statistics of interest to be predicted, and the decision making purpose of those predictions. This means that the optimal monitoring strategy (where to measure, with how much precision and resolution, and for how long) depend on evolving modeling capabilities and representation of societal needs. Also, biases in the current neworks may exist as a function of how they are funded.

In this presentation, these theoretical aspects are investigated with examples from an ongoing project to investigate the streamflow monitoring network in British Columbia, Canada, which recently experienced record-breaking floods. 

How to cite: Weijs, S., Werenka, A., and Kovacek, D.: Manufacturing surprise: How information content, modeling capabilities and decision making purpose influence optimal streamflow monitoring, EGU General Assembly 2023, Vienna, Austria, 23–28 Apr 2023, EGU23-14704, https://doi.org/10.5194/egusphere-egu23-14704, 2023.

EGU23-15968 | PICO | HS1.3.2

Differentiable modeling to unify machine learning and physical models and advance Geosciences 

Chaopeng Shen, Alison Appling, Pierre Gentine, Toshiyuki Bandai, Hoshin Gupta, Alexandre Tartakovsky, Marco Baity-Jesi, Fabrizio Fenicia, Daniel Kifer, Xiaofeng Liu, Li Li, Dapeng Feng, Wei Ren, Yi Zheng, Ciaran Harman, Martyn Clark, Matthew Farthing, and Praveen Kumar

Process-Based Modeling (PBM) and Machine Learning (ML) are often perceived as distinct paradigms in the geosciences. Here we present differentiable geoscientific modeling as a powerful pathway toward dissolving the perceived barrier between them and ushering in a paradigm shift. For decades, PBM offered benefits in interpretability and physical consistency but struggled to efficiently leverage large datasets. ML methods, especially deep networks, presented strong predictive skills yet lacked the ability to answer specific scientific questions. While various methods have been proposed for ML-physics integration, an important underlying theme  — differentiable modeling — is not sufficiently recognized. Here we outline the concepts, applicability, and significance of differentiable geoscientific modeling (DG). “Differentiable” refers to accurately and efficiently calculating gradients with respect to model variables, critically enabling the learning of high-dimensional unknown relationships. DG refers to a range of methods connecting varying amounts of prior knowledge to neural networks and training them together, capturing a different scope than physics-guided machine learning and emphasizing first principles. In this talk we provide examples of DG in global hydrology, ecosystem modeling, water quality simulations, etc. Preliminary evidence suggests DG offers better interpretability and causality than ML, improved generalizability and extrapolation capability, and strong potential for knowledge discovery, while approaching the performance of purely data-driven ML. DG models require less training data while scaling favorably in performance and efficiency with increasing amounts of data. With DG, geoscientists may be better able to frame and investigate questions, test hypotheses, and discover unrecognized linkages. 

How to cite: Shen, C., Appling, A., Gentine, P., Bandai, T., Gupta, H., Tartakovsky, A., Baity-Jesi, M., Fenicia, F., Kifer, D., Liu, X., Li, L., Feng, D., Ren, W., Zheng, Y., Harman, C., Clark, M., Farthing, M., and Kumar, P.: Differentiable modeling to unify machine learning and physical models and advance Geosciences, EGU General Assembly 2023, Vienna, Austria, 23–28 Apr 2023, EGU23-15968, https://doi.org/10.5194/egusphere-egu23-15968, 2023.

EGU23-16510 | PICO | HS1.3.2 | Highlight

Evolution of Causal Structure of Interactions in Turbulence at the Biosphere-Atmosphere interface 

Praveen Kumar and Leila Hernandez Rodriguez

Turbulence at the biosphere-atmosphere interface refers to the presence of chaotic and chaotic-like fluctuations or patterns in the exchange of energy, matter, or information between the biosphere and atmosphere. These fluctuations can occur at various scales. Turbulence at the biosphere-atmosphere interface can affect the transfer of heat, moisture, and gases. In this study, we use causal discovery to explore how high-frequency data (i.e., 10 Hz) of different variables at a flux tower, such as wind speed, air temperature, and water vapor, exhibit interdependencies. We use Directed Acyclic Graphs (DAGs) to identify how these variables influence each other at a high frequency. We tested the hypothesis that there are different types of DAGs present during the daytime at the land-atmosphere interface, and we developed an approach to identify patterns of DAGs that have similar behavior. To do this, we use distance-based classification to characterize the differences between DAGs and a k-means clustering approach to identify the number of clusters. We look at sequences of DAGs from 3-minute periods of high-frequency data to study how the causal relationships between the variables change over time. We compare our results from a clear sky day to a solar eclipse to see how changes in the environment affect the relationships between the variables. We found that during periods of high primary productivity, the causal relationship between water vapor and carbon dioxide shows a strong coupling between photosynthesis and transpiration. At high frequencies, we found that thermodynamics influences the dynamics of water vapor and carbon dioxide. Our framework makes possible the study of how dependence in turbulence is manifested at high frequencies at the land-atmosphere interface.

How to cite: Kumar, P. and Rodriguez, L. H.: Evolution of Causal Structure of Interactions in Turbulence at the Biosphere-Atmosphere interface, EGU General Assembly 2023, Vienna, Austria, 23–28 Apr 2023, EGU23-16510, https://doi.org/10.5194/egusphere-egu23-16510, 2023.

Recent years have seen an uptick in the frequency of flood records occurring in the United States, with South Carolina (SC) being particularly hard hit. This study developed various deep recurrent neural networks (DRNNs) such as Vanilla RNN, long short-term memory (LSTM), and Gated Recurrent Unit (GRU) for flood event simulation. Precipitation and the USGS gaging data were preprocessed and fed into the DRNNs to predict flood events across several catchments in SC. The DRNNs are trained and evaluated using hourly datasets, and the outcomes were then compared with the observed data and the National Water Model (NWM) simulations. Analysis suggested that LSTM and GRU networks skillfully predicted the shape of flood hydrographs, including rising/falling limb, peak rates, flood volume, and time to peak, while the NWM vastly overestimated flood hydrographs. Among different climatic variables that were forced into the DRNNs, rainfall amount and spatial distribution were the most dominant input variables for flood prediction in SC.

How to cite: Heidari, E. and Samadi, V.: Application of Deep Recurrent Neural Networks for Flood Prediction and Assessment, EGU General Assembly 2023, Vienna, Austria, 23–28 Apr 2023, EGU23-16678, https://doi.org/10.5194/egusphere-egu23-16678, 2023.

HS2 – Catchment hydrology

HS2.1 – Catchment hydrology in diverse climates and environments

EGU23-451 | ECS | Posters on site | HS2.1.1

How often did Mediterranean regions transition to different hydroclimatic regimes in the last millennium? 

Arnau Sanz i Gil, Akbar Rahmati Ziveh, Hossein Abbasizadeh, Vishal Thakur, Martin Hanel, Petr Maca, Oldrich Rakovec, and Yannis Markonis

The Mediterranean has been characterized as a region of enhanced climatic variability. Transitions between dry and wet conditions have repeatedly occurred over the last millennium in various spatial and temporal scales. However, the frequency of these shifts is poorly assessed due to the low amount of paleoclimatic reconstructions and the substantial heterogeneity of the Mediterranean. Here, we examine how often Mediterranean regions have transitioned between different hydroclimatic regimes over the last millennium. For this purpose, we use the Paleo Hydrodynamics Data Assimilation (PHYDA) simulation results to identify transitional changes based on Köppen-Geiger climate types. Our results indicate which regions are more likely to experience transitions between hydroclimatic regimes and their duration distribution. We also examine how the intensity of the shifts have fluctuated during the study period and quantify the uncertainties involved. Our findings contribute to a better understanding of the past hydroclimatic variability, which is crucial for further determining the current state and future aridification in the Mediterranean region.  

How to cite: Sanz i Gil, A., Rahmati Ziveh, A., Abbasizadeh, H., Thakur, V., Hanel, M., Maca, P., Rakovec, O., and Markonis, Y.: How often did Mediterranean regions transition to different hydroclimatic regimes in the last millennium?, EGU General Assembly 2023, Vienna, Austria, 23–28 Apr 2023, EGU23-451, https://doi.org/10.5194/egusphere-egu23-451, 2023.

EGU23-3345 | ECS | Posters on site | HS2.1.1

Evaluating the Impact of Topography on Satellite-Derived Evapotranspiration Estimates in the High Atlas Mountains of Morocco 

Badr-eddine Sebbar, Olivier Merlin, Saïd Khabba, Victor Pénot, Vincent Simonneaux, Marine Bouchet, and Abdelghani Chehbouni

Accurate evapotranspiration (ET) estimates in mountainous regions are needed for better understanding the hydrological cycle and managing water resources within watersheds. However, the complex topography of these areas can have significant effects on ET, making it challenging to monitor at all scales. In this study, we sought to improve the accuracy of thermal remote sensing-based ET estimates in the High Atlas region of Morocco by taking into account the effect of topography. To do this, we used two ET models, both driven by LANDSAT optical/thermal data: the Two-Source Energy Balance (TSEB) model and the contextual Water Deficit Index (WDI) model. The meteorological data (such as air temperature, wind speed, and humidity) used to force the models were taken from ERA5-Land reanalysis products and specifically disaggregated at 30 meters to account for elevation effects, while the solar radiation data were obtained using the Samani et al. method to consider sun exposure effects. We compared the ET estimates produced by both models to measurements taken at two Eddy covariance towers in the mountains at different elevations (900 and 3850 m.a.s.l). Our results showed that the TSEB model was able to accurately estimate ET in the region, with a high level of consistency (r² = 0.72, rmse = 43 Wm-2). The relative performance of both TSEB and WDI models was assessed. We also found that topography significantly influences ET in the High Atlas Mountains, emphasizing the importance of considering it when estimating ET at the watershed scale. This outcome can be used to better understand the hydrological cycle and manage water resources in mountainous areas.

How to cite: Sebbar, B., Merlin, O., Khabba, S., Pénot, V., Simonneaux, V., Bouchet, M., and Chehbouni, A.: Evaluating the Impact of Topography on Satellite-Derived Evapotranspiration Estimates in the High Atlas Mountains of Morocco, EGU General Assembly 2023, Vienna, Austria, 23–28 Apr 2023, EGU23-3345, https://doi.org/10.5194/egusphere-egu23-3345, 2023.

EGU23-3584 | Orals | HS2.1.1

Assessing urban water supply from karstic groundwater reservoirs through two hydrological models and the Exploitation Index in the southeast of Spain 

Teresa Alejandra Palacios Cabrera, Antonio Jodar Abellan, Damaris Núñez Gómez, Pablo Melgarejo, Derdour Abdessamed, Ryan Bailey, and Seyed Babak Haiji Seyed

Assessing urban water supply from karstic groundwater reservoirs through two hydrological models and the Exploitation Index in the southeast of Spain

Teresa Palacios-Cabrera1, Antonio Jodar-Abellan2, Ryan T. Bailey3, Dámaris Núñez-Gómez2, Derdour Abdessamed4, Seyed Babak Haji Seyed Asadollah5, Pablo Melgarejo2

1Faculty of Geology, Mines, Petroleum and Environmental Engineering. Central University of Ecuador. teresaalejandrap3@gmail.com

2Centro de Investigación e Innovación Agroalimentario y Agroambiental (CIAGRO), Miguel Hernández University (UMH). Orihuela, Spain.

3Dept. of Civil and Environmental Engineering, Colorado State University, Fort Collins, CO, USA.

4Laboratory for the Sustainable Management of Natural Resources in Arid and Semi‑arid Zones. University Center Salhi Ahmed Naama (Ctr Univ Naama). P.O. Box 66, Naama 45000. Algeria.

5Department of Civil Engineering, Science and Research Branch, Islamic Azad University, Tehran, Iran.

Abstract:

Nowadays, numerous urban settlements in arid and semiarid areas are supplied by groundwater from adjacent small aquifers. Climate change with expected decreases in averages precipitation values jointly with increases in the frequency of heavy rainfall events does not show a clear pattner to how water resources in karstic aquifers are going to evolve. This work, focused in the Guadalest watershed (province of Alicante, southeast of Spain) assesses the behaviour of four karstic aquifers (the Mela, Beniardá-Polop, Benimantell and Serralla-Aixorta aquifers), whose resources supply urban water consumption for close municipalities. In these aquifers, we estimate groundwater recharge, extractions and their relation within the Exploitation Index (EI) by using the SWAT and SIMPA models, previously calibrated and validated in this watershed, during the period 1980-2016. These groundwater estimations were tested (validated) with field measurements performed by local authorities during the above mentioned period. Thus, in the Mela aquifer an EI of 0.19 was estimated with SWAT and SIMPA while an EI of 0.13 was obtained by local authorities; in the Beniardá-Polop aquifer an EI of 1.43 was estimated while an EI of 1.26 was obtained in the fieldwork; in Benimantell an EI of 0.25 and an EI of 0.22 were estimated and obtained respectively; and finally in the Serralla-Aixorta aquifer an EI of 0.19 and an EI of 0.2 were estimated and obtained respectively. Our results denote that: i) both models simulate correctly groundwater abstractions; ii) assessed aquifers depict a clear reduction of their reserves during the study period which represent an important issue considering that currently groundwater extractions are the unique water source of these populations. Therefore, it will be necessary to design supply strategies for these inhabitants and to carry out them, meeting budget restrictions and avoiding potential water shortages.

Keywords: groundwater; SWAT; SIMPA; Exploitation Index; urban water supply; southeast of Spain.

How to cite: Palacios Cabrera, T. A., Jodar Abellan, A., Núñez Gómez, D., Melgarejo, P., Abdessamed, D., Bailey, R., and Haiji Seyed, S. B.: Assessing urban water supply from karstic groundwater reservoirs through two hydrological models and the Exploitation Index in the southeast of Spain, EGU General Assembly 2023, Vienna, Austria, 23–28 Apr 2023, EGU23-3584, https://doi.org/10.5194/egusphere-egu23-3584, 2023.

EGU23-6360 | ECS | Orals | HS2.1.1

Trend analysis on eco-hydrological indicators as management tools in Mediterranean Environmental Protected Areas: The case study of Sierras Subbéticas Natural Park (Spain) 

Ana Calbet, Ana Andreu, Javier Aparicio, María José Polo, Pedro Torralbo, and Rafael PImentel

Mountain areas constitute the headwaters of river basins, biodiversity hot-spots, and have a high value as ecosystem resources provision zones. Within the context of climate change, their meteorological trends and projections of future climate scenarios show a high resource vulnerability, highlighting the need to reduce the uncertainty associated with the dynamics of ecological-hydrological-meteorological processes. In these semiarid regions, there is a generalised increase in temperature, especially in summer, a decrease in average annual precipitation with an increase in torrentiality, and a decrease in snow's frequency and persistence. These can change the vegetation's phenological cycle, behaviour, and distribution. In addition, the socio-economic activities linked to these rural Mediterranean systems would be affected.


This study aims to establish a bridge between the different sources of available ecological-hydrological-meteorological information  and the local information that the final user needs, defining eco-hydrological indicators. Our long-term goal is to improve the management and conservation of Mediterranean mountains in the framework of climate change adaptation. 


For this purpose, we carried out a spatiotemporal analysis of precipitation and temperature historical trends (1960-2022, with nonparametric Mann-Kendall (MK) statistical test) as basic eco-hydrological indicators in the pilot area of the Sierras Subbéticas Natural Park (1570 m.a.s.l.) a  representative Mediterranean Mountain Range (Southern, Spain). This analysis constitutes the basis for the definition of targeted eco-hydrological management indicators. Among the different management challenges identified (e.g., sustainable olive tree production, preservation of autochthonous forest formations, water availability in groundwater reservoirs), we focus on the conservation of natural holm oak forest. Therefore, we selected as a targeted eco-hydrological indicator the occurrence of extreme drought periods in spring (3-months SPI in June), which is considered a primary meteorological factor influencing leaf development.


The trends analysis’ results reflect a significant increase in average annual mean temperatures, especially in the central and lowest areas of the mountain range. Regarding annual precipitation, there is great variability between dry and wet years, with a decreasing trend (-0,821 mm/year) without statistical significance. In the same way, the selected eco-hydrological indicator shows a non statistically significant trend.  This index directly influences the maintenance and regeneration of the Natural Park forest masses, which are of particular interest for managing its ecosystem services. In addition, this indicator constitutes an example of how these specific indicators allow us to use climatic-hydrological data sources in a practical application, with the future goal of integrating meteorological forecasts into the pipeline.

Acknowledgment: This work has been funded by project MONADA - "Hydrometeorological trends in mountainous protected areas in Andalusia: examples of co-development of climatic services for strategies of adaptation to climatic change", with the economic collaboration of the European Funding for Rural Development (FEDER) and the Andalusian Office of Economic Transformation, Industry, Knowledge and Universities. R+D+i project 2020.

How to cite: Calbet, A., Andreu, A., Aparicio, J., Polo, M. J., Torralbo, P., and PImentel, R.: Trend analysis on eco-hydrological indicators as management tools in Mediterranean Environmental Protected Areas: The case study of Sierras Subbéticas Natural Park (Spain), EGU General Assembly 2023, Vienna, Austria, 23–28 Apr 2023, EGU23-6360, https://doi.org/10.5194/egusphere-egu23-6360, 2023.

EGU23-6597 | Posters virtual | HS2.1.1

Irrigation timing retrieval at the plot scale using Surface Soil Moisture derived from Sentinel time series in Europe 

Michel Le Page, Thang Nguyen, Mehrez Zribi, Aaron Boone, Jacopo Dari, Sara Modanesi, Luca Zappa, Nadia Ouaadi, and Lionel Jarlan

The computation of the water budget of irrigated fields is generally difficult because of unknown irrigation amounts and timing. Automatic detection of irrigation events could greatly simplify the water balance of irrigated fields. The combination of high spatial resolution and high-frequency SAR (Sentinel-1) and optical satellite observations (Sentinel-2) makes the detection of irrigation events potentially feasible. Indeed, optical observation allows following the crop development while SAR observation can provide an estimation of the Surface Soil Moisture (SSM). However, uncertainties due to acquisition configuration or crop geometry and density might affect the retrieval of SSM. Here, an algorithm for irrigation events detection is assessed considering several aspects that could affect SSM retrieval (incidence angle, crop type, crop development) and specific characteristics of irrigation events (irrigation frequency, frequency of observations). Additionally, an alternative soil water budget model, the force-restore approach, is compared with the original bucket soil water budget algorithm. A European dataset of irrigation events collected during the ESA Irrigation+ project (5 sites in France, Germany, and Italy over three years) is used. The performances are analyzed in terms of the F‑score and the seasonal sum of irrigation. Overall, the analysis corroborated that the scores decrease with SSM observation frequency. The impact of the Sentinel-1 configuration (ascending/descending, close to 39°/far from 39°) on the retrieval results is low. The lower scores obtained with small NDVI compared to large NDVI were almost systematic, which is counter-intuitive, but might have been due to the larger number of irrigation events during high vegetation periods. The scores decreased as irrigation frequency increased, which was substantiated by the fact that the scores were better in France (more sprinkler irrigation) than in Germany (more localized irrigation). The strategy of merging different runs versus the strategy of interpolating all SSM data for one run has produced comparable results. The estimated cumulative sum of irrigation was around -20% lower compared to the reference dataset in the best cases. Finally, the replacement of the original SSM model by the Force-restore provided an improvement of about 6% on the F‑score, and also narrowed the error on cumulative seasonal irrigation. This study opens new perspectives for the advancement of irrigation retrieval at large scale based on SSM data sets through an in-depth analysis of results as a function of satellite configuration, irrigation techniques, and crops.

How to cite: Le Page, M., Nguyen, T., Zribi, M., Boone, A., Dari, J., Modanesi, S., Zappa, L., Ouaadi, N., and Jarlan, L.: Irrigation timing retrieval at the plot scale using Surface Soil Moisture derived from Sentinel time series in Europe, EGU General Assembly 2023, Vienna, Austria, 23–28 Apr 2023, EGU23-6597, https://doi.org/10.5194/egusphere-egu23-6597, 2023.

EGU23-6661 | ECS | Posters on site | HS2.1.1

Assessment of factors controlling the runoff coefficient in the Mediterranean context: a case study in central Italy 

Arash Rahi, Mehdi Rahmati, Jacopo Dari, Carla saltalippi, and Renato Morbidelli

Global warming is affecting hydroclimatic parameters determining changes in temperature and precipitation patterns. In addition, human-induced activities act on the land use and land cover (LULC) features of catchments. Runoff generation can be affected by these factors in both natural and anthropogenic basins. The aim of the current study is to investigate the relationship between the runoff coefficient (Rc), computed by exploiting long-term rainfall and streamflow records, and several features that can potentially affect it, namely meteorological parameters, soil water storage (SWS), and LULC changes through the wavelet coherence analysis. The method has been applied over the Upper Tiber basin at Ponte Nuovo outlet, in central Italy. To facilitate the understanding of the current catchment conditions in terms of surface water availability, a trend analysis has been performed using the Mann-Kendall (MK) test. For the long-term period of 1927-2020, the results reveal a decreasing trend of Rc. In addition, the MK test for seasonal temperature and SWS shows increasing and decreasing trends, respectively. Based on the wavelet analysis, a significant positive correlation is observed between Rc and SWS in the annual cycle with a phase shift of less than one month, while a strong negative correlation is observed between Rc and temperature in the annual period with a phase shift of 3-6 months. The study of the relationship between Rc and LULC changes shows a weak correlation. The lower phase shift between Rc and SWS indicate that Rc is susceptible to SWS in a faster way than other components. These results allows a better understanding of the main factors influencing the Rc over the pilot area; moreover, an extension to other Mediterranean basins is foreseen as a follow-up of this work.

How to cite: Rahi, A., Rahmati, M., Dari, J., saltalippi, C., and Morbidelli, R.: Assessment of factors controlling the runoff coefficient in the Mediterranean context: a case study in central Italy, EGU General Assembly 2023, Vienna, Austria, 23–28 Apr 2023, EGU23-6661, https://doi.org/10.5194/egusphere-egu23-6661, 2023.

EGU23-6734 | ECS | Orals | HS2.1.1

Importance of baseflow contribution in mountainous Mediterranean watersheds highlighted by geochemical and isotope tracers 

Pierre-Alain Guisiano, Sébastien Santoni, Frédéric Huneau, Émilie Garel, and Alexandra Mattei

Most of the Mediterranean basin coasts are bordered by high mountain ranges (Atlas e.g.). As a result, most of the coastal socio-economic activities are highly dependent on the availability of water from mountainous catchment areas. However, these resources are increasingly vulnerable to climate change, population growth and agricultural development. Given the seasonality of rainfall with high water deficit during summer, groundwater covers a large part of the water supply and appears to be also essential to maintain river flows as well as their ecological continuity. However, one of the most important knowledge gap remains in the characterization and quantification of the watershed contributors supplying river flow through time and space. And this is especially the case for groundwater and delayed subsurface flow. Therefore, the aim of our research consisted in characterizing the baseflow component, as the contribution coming from groundwater and delayed subsurface flow, over two full hydrological years for selected representative mountainous watersheds: The Tavignanu and Fium’Altu basins (Corsica, France). Due to its location in the western Mediterranean basin as well as its diversity in catchment morphologies and lithologies, Corsica is an excellent observatory of any mountainous hydrological processes. In this purpose, different promising tools scarcely used in the Mediterranean context are available to perform baseflow analysis:

- On the one hand, the non-tracer-based methods, including several technics ranging from an empirical to an analytical basis

- On the other hand, the tracer-based methods including the use of water stable isotopes and hydrogeochemical tracers in a mass balance procedure

It allowed to test and highlight the high potential of hydrogeochemical tools in the Mediterranean mountainous context in many ways:

- By correlating, calibrating and validating some of the non-tracer-based methods with monthly tracer data for a Mediterranean use

- By using the validated non-tracer-based methods to perform continuous baseflow separation on a daily basis in order to assess baseflow seasonal patterns and trends over the last twenty years on both catchments

Thus, we clearly highlighted that baseflow, over the years, constitute the main contributor to river flow during dry periods (with a mean Baseflow Index up to 93% for both catchments) and still remains as an important part during high flow periods (with a mean contribution of 67% for the Tavignanu and 73% for the Fium’Altu basin). Therefore, we showed the importance of groundwater and delayed subsurface flow contributions to sustain river flow and its ecological continuity in a mountainous Mediterranean context. Geological features may explain differences in the Baseflow Index distribution between the two basins, implying that some components in the baseflow (groundwater or subsurface flow) are more or less present depending on the period considered. Our next steps consist in going further using environmental tracers to provide conceptual models describing all components of the hydrological cycle which contribute to baseflow. At the end, this will serve as indicators for stakeholders in order to perform sustainable management and to assess the resilience of water resources facing global climate change, not only in Corsica, but for any similar region.

How to cite: Guisiano, P.-A., Santoni, S., Huneau, F., Garel, É., and Mattei, A.: Importance of baseflow contribution in mountainous Mediterranean watersheds highlighted by geochemical and isotope tracers, EGU General Assembly 2023, Vienna, Austria, 23–28 Apr 2023, EGU23-6734, https://doi.org/10.5194/egusphere-egu23-6734, 2023.

EGU23-7444 | ECS | Posters virtual | HS2.1.1

Hydrological modeling using an improved algorithm for a better evaluation of the snow water equivalent (SWE) during spring floods in the Moroccan High Atlas Mountains. 

Myriam Benkirane, simon Gascoin, Abdelhakim Amazirh, Laura Sourp, Nour-Eddine Laftouhi, and Said Khabba

The present study aims to evaluate the performance of a hydrological model to simulate spring runoff processes, analyze the effect of snowmelt on seasonal flow, and identify the snowmelt contribution rate based on the snow water equivalent (SWE) in the Moroccan High Atlas watersheds.

The main objective of this study is to evaluate the daily SWE in a poorly instrumented mountainous watershed using an improved hydrological model. The model algorithm improvement is considered an essential approach for better understanding the initial basin conditions that influence these hydrogeological behaviors. For this purpose, a seasonal analysis was performed to select flood events that reproduce this phenomenon.

To this end, the calibration has been done by forcing the model with rainfall, runoff, temperature, and snow water equivalent (SWE), with an amelioration of the model algorithm. Interestingly enough, this improvement achieved 13% based on the Nash-Sutcliffe efficiency coefficients. Hence, the spring event flows were influenced by the snowmelt process, these results will have direct implications for flood event replication modeling and flood forecasting in these regions.

The study demonstrates that this region is sensitive to the seasonal effect of snowmelt. Therefore, it is essential to take into account the contribution of snow in hydrological studies developed at the level of the Moroccan High Atlas mountainous watersheds. This approach is a great challenge that will improve the reproduction of seasonal flood events and allow a better forecast of flood events to reduce the uncertainties and risks of flooding in mountainous basin areas facing the same climate conditions.

Keywords: Precipitation, SWE, Hydrological modeling, Calibration, Mediterranean climate, flood events, Zat basin.

How to cite: Benkirane, M., Gascoin, S., Amazirh, A., Sourp, L., Laftouhi, N.-E., and Khabba, S.: Hydrological modeling using an improved algorithm for a better evaluation of the snow water equivalent (SWE) during spring floods in the Moroccan High Atlas Mountains., EGU General Assembly 2023, Vienna, Austria, 23–28 Apr 2023, EGU23-7444, https://doi.org/10.5194/egusphere-egu23-7444, 2023.

EGU23-7854 | ECS | Posters virtual | HS2.1.1

Modeling the Impact of Global Warming on the Phenology of the Olive Tree in the Mediterranean region 

Aicha Moumni, Iman Abouseir, and Abderrahman Lahrouni

Nowadays, there is observable evidence from all continents and most oceans that many natural systems have been affected by regional climate changes, particularly by the increase in temperature. This increase has also influenced the phenology of plants. As the olive tree is a plant characterizing the Mediterranean area, it is obvious that its phenology could serve as an indicator of the impact of global warming on this area. In this study, we will use the PMP model and observations of the tree phenology to predict its flowering date, which is the most remarkable and easiest to observe development phase. On the other hand, we will study by simulation the impact of climate change on the flowering of the olive tree under the conditions of Haouz of Marrakech according to three contrasting scenarios of a possible climate change. The PMP software is a tool that facilitates the development of mechanistic phenological models. It is based on thermal time calculations. In the present work, we chose to test three thermal time models: the ForcTT model, the TT model and the UniForc unified forcing model. The first two models are two versions of Growing Degree Days (GDD) which corresponds to a linear relationship of forcing rate from the initial date t0 and a threshold temperature Tb. The third UniForc model is a sigmoidal function of temperature with the initial time t0 as an unknown. The tests were carried out using two databases, the first recorded in the meteorological stations of the Haouz region covering the period 1985 - 2012 and the second observed on the phenology of the olive tree in the Tassaout area for the periods 1986 - 1991 and 1997 - 2012. The first result obtained shows that the UniForc is the most robust model, it is therefore retained for the study of the impact of global warming on the olive tree.In the second part of this work we have chosen three scenarios of greenhouse gas emissions, SRES (Special Report on Emissions Scenarios), which explore future development paths (demographic, economic and technological). Each of the three scenarios chosen is based on a degree of temperature increase according to the imagined development pathway: the more optimistic B1 scenario (increase of 1.1°C), the medium degree A1B scenario (increase of 2.8°C) and the more pessimistic A1F1 scenario (increase of 6.4°C). All the simulations carried out according to the chosen SRES scenarios confirm that the increase in temperature leads to the advancement (earliness) of the flowering date, this advancement varies between 0.3 and 27.3 days. The higher the temperature increase, the earlier the flowering date. Thus, the flowering date of the olive tree is univocally linked to the type of greenhouse gas emission scenario chosen. Our results therefore confirm that this agronomic variable is a good indicator of the severity of global warming that could occur in the region.

How to cite: Moumni, A., Abouseir, I., and Lahrouni, A.: Modeling the Impact of Global Warming on the Phenology of the Olive Tree in the Mediterranean region, EGU General Assembly 2023, Vienna, Austria, 23–28 Apr 2023, EGU23-7854, https://doi.org/10.5194/egusphere-egu23-7854, 2023.

EGU23-7926 | ECS | Orals | HS2.1.1

Interactions between meteorological and agricultural droughts at different temporal and spatial scales 

kaoutar oukaddour, Younes Fakir, and Michel Le Page

The Tensift basin is prone to drought and, with the increasing frequency of extreme events, their forecasting and monitoring are becoming more complex. The present work aims to shed light on the interactions between meteorological and agricultural droughts while using multiple drought indices, and analyzing its temporal and spatial patterns over the Tensift basin in Morocco. To this purpose, we initially performed a trend analysis of the main parameters used in this study namely precipitation, temperature, NDVI, and soil moisture using the Mann-Kendall test. Moreover, a data-driven approach was adopted here to reveal the impact of lack of precipitation on the soil and vegetation cycles. Remote sensing data of precipitation from ERA5Land and soil moisture data from ESA-CCI as well as land surface temperature and NDVI from MODIS are used to calculate the standardized precipitation index (SPI), the vegetation condition index (VCI), the temperature condition index (TCI), and the soil moisture condition index (SMCI) for the period 2001–2021. A comparison analysis was conducted to test the performance and concordance of the indices. Then, to analyze the propagation of meteorological drought to the other components we conducted a cross-correlation study between drought indices.  The results reveal an upward trend of NDVI which is noticeable from the first decade (2009) and is attributed to the development of irrigated areas in this period. In contrast, the basin has shown a significant decline in monthly soil moisture for the period extending from 2001 to 2021, which could be explained by the way how soil moisture is retrieved in the ESA CCI product, and the trend in vegetation. On the other hand, the monthly precipitation and land surface temperature time series show no significant trend. The comparison between the indices showed moderate to low agreement. Correlations between TCI and SPI were eventually negative and significant at small time scales. A moderate correlation was observed between SPI1, SPI3, and TCI (0.45). The strongest correlations between SMCI and SPI were found at the 3 and 6-month time scales. Furthermore, the concordance between VCI and SPI is stronger at larger SPI time scales, the best correlation was observed between the indices VCI and SPI at 12 months with a correlation coefficient of 0.44. The correlations in the Tensift basin reflect spatial heterogeneities where some indices are more prevailing than others. Lag analysis results demonstrate valuable insights into the leading and preceding behavior of different variables regarding SPI. Relevant responses were identified at short, mid, and long-term influence of precipitation deficits on soil moisture, vegetation, and temperature. The results of this study highlight the interest in analyzing drought with different indices dedicated to each type of drought in order to improve early warning systems and risk management strategies for semi-arid areas.

How to cite: oukaddour, K., Fakir, Y., and Le Page, M.: Interactions between meteorological and agricultural droughts at different temporal and spatial scales, EGU General Assembly 2023, Vienna, Austria, 23–28 Apr 2023, EGU23-7926, https://doi.org/10.5194/egusphere-egu23-7926, 2023.

EGU23-8147 | ECS | Posters virtual | HS2.1.1

Evaluation of two climate production satellites over the region of Marrakesh Safi Morocco 

el houcine el moussaoui, Aicha Moumni, Said Khabba, and Abderrahmane Lahrouni

Although weather stations provide accurate measurements of ground climate conditions in close proximity to the station, they are expensive and require periodic recording of measurements. In addition, weather stations are therefore distributed sparsely, especially in developing countries. Conversely, satellites see entire landscapes and are therefore able to offer precise measurements at each location. This paper compares the performance of satellite products with weather station observations at three sites characterized by different climates Ounagha, Chichawa, and R3 in Morocco.

Precipitation and temperature data over the period of 2 years (2018 - 2019) at the three sites were collected. Data based on satellite imagery were collected for two satellite products, namely ERA5 and POWER over a similar period. The data were compared and analyzed through inferential statistics such as the root-mean-square error (RMSE), and the coefficient of determination (R2  ). The results showed that the temperature minimum daily simulated using the ERA5 satellite reached the highest coefficient of determination R2 = 0.92, with RMSE=1.34 (daily for Ounagha), R2 = 0.94, and with RMSE=1.27 (daily for Chichawa), R2 = 0.96, and with RMSE=1.13 (daily for R3). The temperature maximum daily simulated through the POWER satellite showed the best coefficient of determination R2 =0.924 with RMSE=2.174 (Ounagha daily). In contrast, the ERA5 satellite presents a better coefficient of determination R2 =0.97 in Chichawa and R3 stations. The results of comparing the observed weather stations and the satellite data in terms of precipitation show that the acceptable performance was attributed to the ERA5 data for cumulative, decadaire, and monthly precipitation in the three sites.


The use of satellite products is a good way to solve the lack of weather stations and to make data available to the scientific community for further investigation. Furthermore, since our interest in monitoring drought in the Smimou region and our need for climate data in this area, which lacks a meteorological station, the results of this study encourage us to use the ERA5 satellite to collect climate data for the region.

How to cite: el moussaoui, E. H., Moumni, A., Khabba, S., and Lahrouni, A.: Evaluation of two climate production satellites over the region of Marrakesh Safi Morocco, EGU General Assembly 2023, Vienna, Austria, 23–28 Apr 2023, EGU23-8147, https://doi.org/10.5194/egusphere-egu23-8147, 2023.

EGU23-8268 | ECS | Posters virtual | HS2.1.1

Multi-Soil-Layering, the Emerging Technology for Wastewater Treatment: Review, Bibliometric Analysis, and Future Directions 

Sofyan Sbahi, Laila Mandi, Tsugiyuki Masunaga, Naaila Ouazzani, Abdessamad Hejja, and Abderrahman Lahrouni

Due to its unique structure and excellent purification efficiency (e.g., 98% for organic matter and between 94 and 100% for nutrients), multi-soil-layering (MSL) has emerged as an efficient eco-friendly solution for wastewater treatment and environmental protection. Through infiltration-percolation, this soil-based technology allows pollutants to move from the MSL upper layers to the outlet while maintaining direct contact with its media, which helps in their removal via a variety of physical and biochemical mechanisms. This paper attempts to comprehensively evaluate the application of MSL technology and investigate its progress and efficacy since its emergence. Thus, it will attempt via a bibliometric analysis using the Web of Science database (from 1993 to 01/06/2022) related to MSL technology, to give a clear picture of the number of publications (70 studies), the most active academics, and countries (China with 27 studies), as well as collaborations and related topics. Furthermore, through hybrid combinations, pollutant removal processes, MSL effective media, and the key efficiency parameters, this paper review will seek to provide an overview of research that has developed and examined MSL since its inception. On the other hand, the current review will evaluate the modeling approaches used to explore MSL behavior in terms of pollutant removal and simulation of its performance (R2 > 90%). However, despite the increase in MSL publications in the past years (e.g., 13 studies in 2021), many studies are still needed to fill the knowledge gaps and urging challenges regarding this emerging technology. Thus, recommendations on improving the stability and sustainability of MSLs are highlighted.

How to cite: Sbahi, S., Mandi, L., Masunaga, T., Ouazzani, N., Hejja, A., and Lahrouni, A.: Multi-Soil-Layering, the Emerging Technology for Wastewater Treatment: Review, Bibliometric Analysis, and Future Directions, EGU General Assembly 2023, Vienna, Austria, 23–28 Apr 2023, EGU23-8268, https://doi.org/10.5194/egusphere-egu23-8268, 2023.

EGU23-11935 | ECS | Posters virtual | HS2.1.1

Performance assessment of the DSSAT-CERES-Wheat model under different irrigation strategies in the semi-arid region of Marrakesh 

Lahoucine Ech-chatir, Salah Er-Raki, Abdelilah Meddich, Julio Cesar Rodriguez, and Said Khabba

Water scarcity is a major problem in the arid and semi-arid areas of Morocco, where irrigation is essential for agriculture. Crop growth models can enhance water use efficiency, thus providing an economic benefit while reducing pressure on water resources. In this study, we evaluated the modeling performance of the DSSAT-CERES-Wheat model in estimating Evapotranspiration (ETa), Total soil water (TSW), Grain yield, Tops weight and phenological stages of winter wheat in the semi-arid region of Tensift Al Haouz, Marrakech. The simulation was performed at a daily time step during two successive growing seasons 2002/2003 and 2003/2004. The model calibration was done firstly on two fields and ETa, TSW phenological stages, and productive variables were calibrated after the comparison of the simulated and observed data. Afterward, the validation was performed on four fields during the two growing seasons. The results showed that the model simulates reasonably good Grain yield, Tops weight and phenological stages. Moreover, The average values of  RMSE  between observed and measured ETa, TSW, Grain yield and Tops weight were respectively, 0.70mm/day, 25mm, 0.6 t/ha and 2 t/ha for the validation fields. Statistical parameters like R2, d, and NRMSE were additionally used and showed that the model simulates acceptably the above-mentioned parameters. Furthermore, The Penman-Monteith FAO56 and Priestley and Taylor Evapotranspiration simulation methods were compared, the average values of d  and R2 were respectively 0.85, 0.70 for the Penman-Monteith method, and 0.80, 0.65 for the Priestley and Taylor method. Thus, the DSSAT model can be considered a useful tool for monitoring the management of wheat in arid and semi-arid regions.

Keywords: DSSAT, wheat, irrigation, water scarcity, crop model

How to cite: Ech-chatir, L., Er-Raki, S., Meddich, A., Rodriguez, J. C., and Khabba, S.: Performance assessment of the DSSAT-CERES-Wheat model under different irrigation strategies in the semi-arid region of Marrakesh, EGU General Assembly 2023, Vienna, Austria, 23–28 Apr 2023, EGU23-11935, https://doi.org/10.5194/egusphere-egu23-11935, 2023.

EGU23-12908 | ECS | Posters virtual | HS2.1.1

Remote Sensing Monitoring of Flood hazard in Arid Environments. A Case Study of Saquia El Hamra Watershed Morocco 

Nafia El-alaouy, Aicha Moumni, Nour-Eddine Laftouhi, and Abderrahman Lahrouni

Floods are the most visible and destructive hydrologic phenomenon in terms of human and economic loss. Typically, flash floods are caused by large amounts of runoff due to short duration and high-intensity rainfall. Floods also lead to environmental and social problems, such as damage to roads, farms, and infrastructures and sometimes pollute surface water resources via the transfer of industrial waste, creating many health problems. In late October 2016, a flash flood severely damaged the surroundings of the city of Laayoune in the Saquia El Hamra basin in southern Morocco. The country’s climate is arid and semi-arid and is prone to destructive floods. The purpose of this study is to evaluate this flash flood and monitor wetland areas after this event using a technique that relies on remote sensing technology. This work was accomplished using Sentinel 2 satellite images, from the European Space Agency, based on classification methods and change detection techniques. Before and after the occurrence, the SVM classifier was employed to map land cover and land use. The overall accuracy (Kappa coefficient) was 94.41 % (0.91), and 87.33 % (0.81), respectively for both dates, when compared to the ground-truth data. The decision tree was built with the maps produced by the SVM classification for both dates as inputs, producing a change detection map with increased detail. The remote sensing technology has enabled us to monitor the damage that has been done to the area following the catastrophe with details on the buildings affected, farms flooded, and the extent of the river.

How to cite: El-alaouy, N., Moumni, A., Laftouhi, N.-E., and Lahrouni, A.: Remote Sensing Monitoring of Flood hazard in Arid Environments. A Case Study of Saquia El Hamra Watershed Morocco, EGU General Assembly 2023, Vienna, Austria, 23–28 Apr 2023, EGU23-12908, https://doi.org/10.5194/egusphere-egu23-12908, 2023.

EGU23-13882 | Orals | HS2.1.1 | Highlight

The impacts of future climate change on water security in the Mediterranean Basin 

Joris Eekhout and Joris de Vente

The Mediterranean Basin is classified as one of the hot-spots for climate change, where a significant decrease of precipitation and an increase of temperature are expected. This will most likely lead to a redistribution of water within Mediterranean catchments. However, the scale and magnitude and spatial differences of the impact of climate change on water security across the Mediterranean is still uncertain. Here we present the preliminary results of a systematic review on the impact of climate change on water security in the Mediterranean Basin. In this systematic review we focused on studies performed in the Mediterranean Basin that apply a hydrological model forced by climate model output and report changes in blue and/or green water, i.e. water stored in rivers and reservoirs (e.g. runoff or reservoir storage) and water stored in soils (e.g. groundwater recharge). The variables obtained from the studies include variables related to study area, climate and hydrological models, and model output. Our preliminary results show that the general tendency is a decrease of precipitation and an increase of temperature, which will cause a decrease of projected blue and green water. This will have serious consequences for the potential of irrigated agriculture, industry and household water use in the Mediterranean Basin, which heavily rely on the availability of blue water. But also for rainfed agriculture, where a decrease of green water may force farmers to abandon their land or transform to irrigated agriculture.

We acknowledge funding from the Spanish Ministry of Science and Innovation (AEI) (PID2019-109381RB-I00/AEI/10.13039/501100011033).

How to cite: Eekhout, J. and de Vente, J.: The impacts of future climate change on water security in the Mediterranean Basin, EGU General Assembly 2023, Vienna, Austria, 23–28 Apr 2023, EGU23-13882, https://doi.org/10.5194/egusphere-egu23-13882, 2023.

EGU23-14819 | ECS | Orals | HS2.1.1

C-band Sentinel-1 data for estimating the basal crop coefficient and evapotranspiration of winter wheat  

Nadia Ouaadi, Lionel Jarlan, Saïd Khabba, Michel Le Page, Adnane Chakir, Salah Er-Raki, and Pierre-Louis Frison

Estimating crop evapotranspiration (ETc) is of primary importance for irrigation management. The model commonly used for this purpose is the FAO-56 approach which consists of accurately estimating the basal crop coefficient Kcb. Historically, Kcb is derived from optical indices such as NDVI giving its sensitivity to vegetation cover fraction and to the Leaf Area Index. Nevertheless, optical data are disturbed by the presence of clouds. In this context, the objective of this work is to investigate the potential use of all-weather radar data as a substitute of NDVI to derive Kcb. The study is conducted over two winter wheat fields (Field 1 and Field 2) in Morocco, monitored during two agricultural seasons 2016-2017 and 2017-2018. Each field is equipped with an eddy covariance station allowing the estimation of ETc every 30 minutes. In addition, a weather station was installed over an alfalfa plot near the study fields. First, the backscattering coefficient and the interferometric coherence ( ρ at VV polarization) are derived from Sentinel-1 data with a 6-day revisit time and a spatial resolution of 10 m. Second, empirical relationships have between established between Kcb, on one hand, and the interferometric coherence and the polarization ratio, on the other hand and the results are also compared to the classical Kcb-NDVI (derived from Sentinel-2) method. The results show that good statistical metrics are obtained between Kcb and NDVI (R=0.77 and RMSE=0.14 for Field 1). Similar results are obtained also using ρ (R=0.76, RMSE=0.18). Finally, the Kcb is estimated from the calibrated relationships on one season and then used to estimate ETc. The results demonstrate reasonable estimates of ETc on Field 1 (R=0.70, RMSE=0.75 mm/day and bias=-0.18 mm/days) using Kcb-ρ. By contrast, a significant overestimations is highlighted both with  (bias=0.73 mm/day) and NDVI (bias=1.46 mm/day) over Field 2. Interestingly, the Kcb-ρ relationship is more consistent in the estimation of ETc when changing from one field to another. These outcomes open new perspectives for the estimation of ETc from radar data as a potential substitute of NDVI in case of persistent cloud cover.

How to cite: Ouaadi, N., Jarlan, L., Khabba, S., Le Page, M., Chakir, A., Er-Raki, S., and Frison, P.-L.: C-band Sentinel-1 data for estimating the basal crop coefficient and evapotranspiration of winter wheat , EGU General Assembly 2023, Vienna, Austria, 23–28 Apr 2023, EGU23-14819, https://doi.org/10.5194/egusphere-egu23-14819, 2023.

EGU23-15504 | Orals | HS2.1.1

The summer 2022 drought in the Po valley (Italy): a glimpse of the future climate? 

Davide Bonaldo, Debora Bellafiore, Christian Ferrarin, Rossella Ferretti, Antonio Ricchi, Lorenzo Sangelantoni, and Maria Letizia Vitelletti

The Po valley (northern Italy) hosts important economic activities and contributes to a significant fraction of the national agricultural production. On its coastal region (the Po Delta) reclaimed agricultural lands coexist, largely below the mean sea level, with natural areas of outstanding environmental relevance. Besides affecting the socio-economic and ecological dynamics within its basin, the modulation of the hydrological regime of the Po river also plays a major role in controlling the oceanographic processes occurring in the northern Adriatic Sea, from coastal circulation to deep ventilation and thermohaline circulation at the Mediterranean scale. In this framework, the severe drought that affected large areas of Europe in Spring and Summer 2022 hit the Po river system with particular intensity, with heavy impacts on productive activities and extensive saltwater intrusion in the coastal areas.

By means of observed discharge records and precipitation data from reanalysis and climate models, this contribution presents an analysis of the 2022 drought event, investigating its exceptionality in the recent past climate and exploring its possible recurrence in future conditions. Ensemble projections of rainfall regimes on the Po River basin in two climate change scenarios (RCP4.5 and RCP8.5) show that persistent negative rainfall anomalies like the one that characterised the 2022 event will unlikely become typical features of the future climate, but could remarkably increase their frequency. Furthermore, the impacts of these events will be magnified by rising temperatures, enhancing evapotranspiration rates in agriculture and water demand. Particularly in severe climate change scenarios, heavier and more frequent episodes of water shortage, combined with a rising sea level, are expected to intensify the pressure of saltwater intrusion in the coastal areas of the Po Delta, increasing the risk for environmental impoverishment and for loss of agricultural lands.

Besides investigating in a climate change perspective a recent severe event that struck an important economic and ecological region, the present contribution aims at stimulating the development of advanced climate change adaptation strategies in riverine, deltaic and estuarine systems, emphasizing the importance of an integrated source-to-sea approach to this process. 

How to cite: Bonaldo, D., Bellafiore, D., Ferrarin, C., Ferretti, R., Ricchi, A., Sangelantoni, L., and Vitelletti, M. L.: The summer 2022 drought in the Po valley (Italy): a glimpse of the future climate?, EGU General Assembly 2023, Vienna, Austria, 23–28 Apr 2023, EGU23-15504, https://doi.org/10.5194/egusphere-egu23-15504, 2023.

The Versilia coastal plain hosts an important and strategic aquifer for water supply. Like all coastal aquifers, it is particularly vulnerable to the saltwater intrusion, which can be amplified not only by fresh water over-exploitation, but also by the effects of climate change, including the increase of extreme events that are deeply altering the hydrology of the Mediterranean regions. In order to protect this precious resource, both in quantitative and qualitative terms, an adequate knowledge of the aquifer system is necessary through the development of conceptual and mathematical hydrogeological models. Based on integrated multidisciplinary approach the conceptual hydrogeological model was defined using stratigraphic, hydrogeological and geochemical data elaboration. Subsequently, groundwater flow mathematical models were created using the ModFlow code and Groundwater Vistas like graphical interface. The models allowed to better understand this aquifer system and to identify and, where possible to quantify, the main processes and groundwater components involved. The most important feeding groundwater component, both in terms of water quantity and quality, is the fan of the Versilia River, mainly fed by the river itself in the foothill zone. Even if, in the summer season some piezometric depressions, tied to groundwater exploitation, tend to expand and move towards the coast, thus favouring the seawater intrusion process, in general, the Versilia fan component seems at present to be able to guarantee relative protection against marine ingression. However, this precarious balance could be disrupted by the extreme rainy events that frequently occur in the Apuan Alps region. The huge quantity of water that quickly flows by the river up to the sea during extreme events represents a lack of feeding respect to the aquifer, and consequently the mitigation role of the fan component towards seawater intrusion can be significantly weakened. Thanks to the water budget achieved by numerical model and considering real extreme events occurred in the Apuan-Versilian region it was possible to make considerations about possible effects of these climate regimes on the aquifer system. These extreme events as those occurred in the area in the past, and awaited more frequently in the future, represent a concrete threat for the coastal aquifer system that over next decades could suffer more and more seawater intrusion. Given the reliance of local human activities on groundwater, far-sighted actions of water management (e.g. managed aquifer recharge) are recommended for mitigating such as climate effects.

How to cite: Menichini, M. and Doveri, M.: Conceptual and numerical modelling of the Versilia coastal aquifer (NW-Tuscany, Italy) for quantitative evaluations on groundwater components and possible effects of climate extreme events, EGU General Assembly 2023, Vienna, Austria, 23–28 Apr 2023, EGU23-15981, https://doi.org/10.5194/egusphere-egu23-15981, 2023.

EGU23-16445 | ECS | Orals | HS2.1.1

Analysis of the radar temporal coherence at C band over an olive orchard in semi-arid region 

Adnane Chakir, Pierre-louis Frison, Said Khabba, ludovic Villard, Valerie Le-dantec, Nadia Ouaadi, Pascal Fanise, and Lionel Jarlan

In recent decades, climate change has led to a sharp increase in water demand. Particularly in agriculture, this has put a great strain on already scarce water resources, increased the need for irrigation water, and led to overuse of groundwater. Therefore, sustainable management of water resources while maintaining good agricultural yield by monitoring crop water status is necessary for sustainable and rational management of these resources, especially in arid and semi-arid regions. For this purpose, a detailed knowledge of the different processes describing the diurnal water cycle of plants in a large area is essential. However, micrometeorological or physiological experimental measurements and their partitioning are laborious to perform and not very representative of large areas.

In this regard, remote sensing is a particularly suitable tool for monitoring agricultural areas because of its global and repeated observation. Several studies have highlighted the sensitivity of radar data to vegetation water content especially over the rainforest with spatial scatterometers that observe differences between morning and evening acquisitions. On the other hand, in situ radar experiments with high temporal frequency have made it possible to analyze radar responses over tropical and boreal forests.

This study relates to a similar experiment conducted on an olive orchard located in the semi-arid Mediterranean region of Chichaoua in central Morocco. It allows the acquisition of in situ C-band radar measurements in crop fields, which are acquired continuously, from a tower-based radar system, with a time step of 15 minutes.

The temporal evolution of the interferometric coherence r is analyzed on different baselines Dt, ranging from 15 minutes to 30 days, for the main physiological stages of the olive tree. Four different two-month periods, from December 2020 to November 2022, are chosen as the main physiological stages based on field observations.

The obtained results of r, especially at 15-min min-steps, show a global behavior similar to that observed in tropical and boreal forests: high values (r ≈1) are observed during the night (weak wind, vegetation resting), then a decrease/increase during the day mainly anti-symetric to the wind cycle. As over boreal and tropical forest, a decrease in r is observed before the wind picks up, with is time coincident with sap flows and ETR variations, traducing its sensitivity to water plant content.

Results show that over olive orchard, the r diurnal cycle is less marked than over boreal and tropical forests, due to lower ETR rates and certainly due to a significant soil contribution over this less dense vegetation layer. Furthermore, r values decrease when temporal baselines increase, but values are still meaningful for Dt = 6 days (r = 0.3 compared to 0.6 for Dt = 15 min. for the summer period), available with Sentinel-1 missions.

The present study provides particularly interesting results confirming the sensitivity of C-band coherence to vegetation water status, especially in the early morning. Further work needs to be pursued to verify if we are able to detect the water stress of these plants in semi-arid areas such as Chichaoua through coherence.

How to cite: Chakir, A., Frison, P., Khabba, S., Villard, L., Le-dantec, V., Ouaadi, N., Fanise, P., and Jarlan, L.: Analysis of the radar temporal coherence at C band over an olive orchard in semi-arid region, EGU General Assembly 2023, Vienna, Austria, 23–28 Apr 2023, EGU23-16445, https://doi.org/10.5194/egusphere-egu23-16445, 2023.

EGU23-17188 | Orals | HS2.1.1

Water demand versus supply in a Mediterranean Arid Region : current and future challenges 

Hadri Abdessamad, Mohamed Elmehdi Saidi, El Mahdi El Khalki, Brahim Aachrine, Tarik Saouabe, and Abdeslam Ait Elmaki

This research aims at establishing an integrated modelling framework to assess the impact of climate change on water supply and demand across an arid area in the western Haouz plain in Morocco. Five General Circulation Models (GCM) are used to evaluate future water resources availability under Representative Concentration Pathways (RCP4.5 and RCP8.5 emission scenarios). The projected crop water demand and irrigation water demand were analysed using Aquacrop software, taking into account the impact of climate change on both reference evapotranspiration and crop cycle lengths. The future water balance is simulated by means of Water Evaluation And Planning (WEAP) Tool, including several socioeconomic and land use scenarios under RCP4.5 and RCP8.5. The results reveal an important decrease in net precipitation with an average of -36.2% and -50.5% under RCP4.5 and RCP8.5, respectively. In terms of water balance, the “business as usual” scenario would lead to an increasing of unmet water demand of about +22% in the 2050 horizon and to an increased depletion of the water table that could reach 2m/year. Changing water management and use practices remains the only solution to ensure sustainable water use and deal with the projected water scarcity.

How to cite: Abdessamad, H., Elmehdi Saidi, M., El Khalki, E. M., Aachrine, B., Saouabe, T., and Ait Elmaki, A.: Water demand versus supply in a Mediterranean Arid Region : current and future challenges, EGU General Assembly 2023, Vienna, Austria, 23–28 Apr 2023, EGU23-17188, https://doi.org/10.5194/egusphere-egu23-17188, 2023.

EGU23-601 | ECS | PICO | HS2.1.2

Hydrological performance evaluation of temperature reanalysis products for the Ouémé River Basin in West Africa 

Ishita Jalan, Fabian Merk, Ye Tuo, and Markus Disse

West Africa has a complex climate regime. It affects hydrological predictivity in the region where the majority population depends on agriculture. With a warming planet, the challenge is further exacerbated by frequent hydroclimatic extremes. To achieve secured livelihoods and resilience, hydrological understanding is a key. However, there is an elemental challenge of missing measured weather data. Weather variables that are drivers of the water and energy balance are necessary for the setup of robust hydrological models. We focus on the Ouémé River Basin in Benin, which lacks spatially representative in-situ temperature observations. To fill this gap, the study evaluates global earth datasets in the form of reanalysis products that are emerging useful for hydrological modeling. We perform an intercomparison of five temperature reanalysis datasets for the basin using the hydrological model Soil and Water Assessment Tool (SWAT). These datasets are CFSR, CPC, ERA5, EWEMBI, and PGFv3, available at a daily temporal resolution. We test their performance on the simulation of hydrological processes in the Ouémé basin.

To evaluate each temperature data, a multi-site calibration is performed in SWAT using daily discharge time series. Validation is carried out as a two-fold process. The first is point validation performed using discharge data at five gauge sites and the second is spatial validation on the sub-catchment level conducted using satellite-derived actual evapotranspiration (AET) data from GLEAM v3.5b. This multi-gauge and multi-variable approach is used to minimize uncertainties associated with the application of SWAT.

This study is one of a kind for the basin, testing the datasets for their hydrological performance and overcoming a major gap toward achieving robust models. Temperature reanalysis products provide high temporal resolution, long time series, and spatially representative datasets. However, the response to input data errors can vary significantly given the non-linear interaction of parameters in a hydrological model. Therefore, hydrological evaluation is an important step before reanalysis data can be used for modeling and decision-making. We also demonstrate the significance of testing multiple water fluxes to assess the performance of climate datasets. A higher variation in performance for temperature datasets is observed for AET than for the streamflow component. It is an important outcome to determine the most suitable temperature product for the Ouémé basin.

How to cite: Jalan, I., Merk, F., Tuo, Y., and Disse, M.: Hydrological performance evaluation of temperature reanalysis products for the Ouémé River Basin in West Africa, EGU General Assembly 2023, Vienna, Austria, 23–28 Apr 2023, EGU23-601, https://doi.org/10.5194/egusphere-egu23-601, 2023.

EGU23-1113 | ECS | PICO | HS2.1.2

Application of Advanced Wflow_sbm Model with the CMIP6 climate projection for flood prediction in the data-scarce: Lake-Tana Basin, Ethiopia 

Addis Alaminie, Giriraj Amarnath, Suman Padhee, Surajit Ghosh, Seifu Tilahun, Muluneh Mekonnen, Getachew Assefa, Abdulkarim Seid, Fasikaw Zimale, and Mark Jury

Abstract:  Flood-attributed damages to infrastructure and public safety are expected to escalate in the future due to climate change, land use change, and associated hydrologic changes. In recent years, the reliability of flood forecasts has increased due to the availability of meteorological and hydrological data and advancements in flood prediction science. However, there is limited effort to apply emerging advanced hydrological models for flood prediction in poorly gauged watersheds. The overall objective of this study is to demonstrate applicability of climate model products to generate reliable flood predictions for data-limited and flood-prone areas. In this study, the most recent high-resolution climate models of the Coupled Model Intercomparison Project Phase 6 (CMIP6) were evaluated to assess the impacts of projected climate change on the flood-prone areas of the Lake Tana basin, Ethiopia. The ensemble means of the top five CMIP6 climate model forcing data were used to calibrate and validate a free open-source, spatially distributed hydrological model known as Wflow_sbm. Model-independent multi-algorithm optimization and parameter estimation tool is implemented for calibration and validation of Wflow. In terms of simulating runoff and flood events, application of Wflow_sbm to the Lake Tana basin provided promising results. This study serves as a major step towards the development and implementation of climate model product-driven hydrological model to assess flooding damages of future climate projections within the poorly gauged Lake Tana basin.

How to cite: Alaminie, A., Amarnath, G., Padhee, S., Ghosh, S., Tilahun, S., Mekonnen, M., Assefa, G., Seid, A., Zimale, F., and Jury, M.: Application of Advanced Wflow_sbm Model with the CMIP6 climate projection for flood prediction in the data-scarce: Lake-Tana Basin, Ethiopia, EGU General Assembly 2023, Vienna, Austria, 23–28 Apr 2023, EGU23-1113, https://doi.org/10.5194/egusphere-egu23-1113, 2023.

The filling of the Grand Ethiopian Renaissance Dam (GERD) started in 2020, posing additional challenges for downstream water management in Sudan, which is already struggling to cope with the effects of climate change. This is also the case for many transboundary rivers that observe a lack of cooperation and transparency during the filling and operation of new dams. Without information about water supply from neighbouring countries, it is risky to manage downstream dams as usual and operation information is needed to apply modifications. This study aims to test the applicability of using lumped hydrological modelling coupled with remote sensing data in retrieving reservoir filling strategies in regions with limited data availability. Firstly, five rainfall products (namely; ARC2, CHIRPS, ERA5, GPCC, and PERSIANN-CDR) were evaluated against historical measured rainfall at ten stations. Secondly, to account for input uncertainty, the best three performing rainfall products were forced in the conceptual hydrological model HBV-light with potential evapotranspiration and temperature data from ERA5. The model was calibrated during the period 2006 - 2019 and validated during the period 1991 - 1996. Thirdly, the parameter sets that obtained very good performance (NSE > 0.75) were utilized to predict the inflow of GERD during the operation period (2020 - 2022). Then, from the water balance of GERD, the daily storage was estimated and compared with the storage derived from Landsat observations to evaluate the performance of the selected rainfall products. Finally, three years of GERD filling strategies were retrieved using the best-performing simulation of CHIRPS with RMSE of 1.7 billion cubic meters (BCM) and NSE of 0.77 when compared with Landsat-derived reservoir storage. It was found that GERD stored 14% of the monthly inflow of July 2020, 41% of July 2021, and 37% and 32% of July and August 2022, respectively. Annually, GERD retained 5.2% and 7.4% of the annual inflow in the first two filling phases and between 12.9% and 13.7% in the third phase. The results also revealed that the retrieval of filling strategies is more influenced by input uncertainty than parameter uncertainty. The retrieved daily change in GERD storage with the measured outflow to Sudan allowed further interpretation of the downstream impacts of GERD. The findings of this study provide systematic steps to retrieve filling strategies for data-scarce regions, which can serve as a base for future development in the field. Locally, the analysis contributes significantly to the future water management of the Roseires and Sennar dams in Sudan. 

How to cite: Mohammed Ali, A., Melsen, L., and Teuling, R.: Inferring reservoir filling strategies under limited data availability using hydrological modelling and Earth observation: the case of the Grand Ethiopian Renaissance Dam (GERD), EGU General Assembly 2023, Vienna, Austria, 23–28 Apr 2023, EGU23-2056, https://doi.org/10.5194/egusphere-egu23-2056, 2023.

EGU23-2819 | ECS | PICO | HS2.1.2

Climate change impacts on rainwater productivity across agricultural landscapes of Ethiopia 

Mosisa Tujuba Wakjira, Nadav Peleg, Johan Six, and Peter Molnar

In this study, the spatio-temporal changes in Rainwater Productivity (RP) and its sensitivity to the changes in precipitation and temperature predicted by climate models in various climatic zones across the rainfed agricultural areas of Ethiopia were analyzed. First, the future precipitation, air temperature, and shortwave radiation from multiple GCM projections were downscaled to a 0.05°x0.05° grid resolution, considering three shared socioeconomic pathways (SSP1-2.6, SSP2-4.5, and SSP5-8.5) and three future periods: 2020-2049, 2045-2074, and 2070-2099 using the present climate (1981-2010) as a reference. Next, the reference potential evapotranspiration was computed using the FAO Penman-Monteith and the actual evapotranspiration was simulated using a daily soil water balance model. Then, the relative crop yield (i.e., the ratio of the actual and water-limited potential yield) was determined as a function of the evaporative stress index and crop yield response factor (Ky) for the two growing seasons -- the main (meher) growing season (May-Sep) and the shorter (belg) growing season (Feb-May) for the present and future climates. The computed relative yield was used as a proxy for RP, under the assumption that effective rainfall is the limiting factor for crop yield. Finally, the sensitivity of RP to projected changes in precipitation and temperature was analyzed based on the one-at-a-time (OAT) approach for warmer and drier versus warmer and wetter climate scenarios.

The results show that under the present climate, the median RP (percent of the potential RP) during the Meher and Belg seasons ranges from about 52% and 34% in semi-arid climates to 93% and 45% in humid climates. The projected Meher RP in the future shows either a slight change or a decrease by up to 10% across the majority of the RFA regions under all SSPs and future periods. Conversely, the Belg season RP is likely to increase by up to 15% across the major Belg-producing regions by the end of the century. The observed changes are the combined effects of the nearly consistent but spatially variable increase in precipitation (for example up to 30% under SSP5-8.5 in the 2080s) and rising temperature (up to 5°C under SSP5-8.5 in the 2080s) over the RFA region. The OAT sensitivity analysis reveals that RP under warmer and drier climates is strongly sensitive to precipitation. However, under warmer and wetter conditions the climate sensitivity of RP is determined by the rainfall regime, i.e, in the areas with unimodal rainfall regimes, changes in RP are dominated by the changes in precipitation while in areas with strongly erratic or bimodal rainfall distribution, temperature, or both precipitation and temperature control the changes in RP. Such analyses are useful for assessing the future climate risks to crop yield due to water stress associated with the expected increases in atmospheric evaporative demand, identifying vulnerable areas across the RFA region as well as possibilities for agricultural expansion.      

How to cite: Wakjira, M. T., Peleg, N., Six, J., and Molnar, P.: Climate change impacts on rainwater productivity across agricultural landscapes of Ethiopia, EGU General Assembly 2023, Vienna, Austria, 23–28 Apr 2023, EGU23-2819, https://doi.org/10.5194/egusphere-egu23-2819, 2023.

EGU23-4000 | ECS | PICO | HS2.1.2

Sensitivity of African Easterly Waves to Dust Direct Radiative Forcing 

Hamza Kunhu Bangalath, Jerry Raj, and Georgiy Stenchikov

African Easterly Waves (AEWs) are the most important precipitation-producing dynamic systems in tropical Africa and Atlantic, where dust in the atmosphere is abundant. But the past studies lack consensus on the sign and magnitude of the dust radiative forcing impact on AEWs primarily because of the disagreement in calculating dust solar radiation absorption. The incapability of coarse-resolution models to represent various dust-AEW interactions is another source of uncertainty. The present study uses a high-resolution atmospheric general circulation model, HiRAM, to investigate the sensitivity of AEWs to the dust direct radiative forcing when dust shortwave absorption varies within the observed limits. Global simulations are conducted with the 25 km grid spacing to adequately simulate AEWs and associated circulation features. Four 10-year experiments are conducted: One control experiment without dust and three others with dust assuming dust is an inefficient, standard, and very efficient shortwave absorber. The results show that AEWs are highly sensitive to dust shortwave absorption. As dust shortwave absorption increases, AEW activity intensifies and broadens the wave track shifting it southward. The 6-9 day waves are more sensitive to dust shortwave absorption than the 3-5 day waves, where the response in the former has a stark land-sea contrast. The sensitivity of AEW to dust solar radiation absorption arises from a combination of energy conversion mechanisms. Although baroclinic energy conversion dominates the energy cycle, the responses to dust shortwave heating in barotropic and generation terms are comparable to that in baroclinic conversion.


How to cite: Bangalath, H. K., Raj, J., and Stenchikov, G.: Sensitivity of African Easterly Waves to Dust Direct Radiative Forcing, EGU General Assembly 2023, Vienna, Austria, 23–28 Apr 2023, EGU23-4000, https://doi.org/10.5194/egusphere-egu23-4000, 2023.

EGU23-6608 | PICO | HS2.1.2

Drought monitoring over the Kruger National Park (2000-2020) integrating remote sensing data. 

Timothy Dube, Abel Ramoelo, Cletah Shoko, Mazvimavi Dominic, Maria P. Gonzalez-Dugo, Hector Nieto, and Ana Andreu

Semiarid regions shaped as a mosaic of savanna-type rangelands, croplands, and other uses such as livelihoods, or natural reserves, cover large areas in Southern Africa. They constitute an essential example of multiple uses of natural resources, combining a high environmental value with great importance in the rural economy and development. These systems are water-limited and highly sensitive to changes in climate, environmental conditions, and land management practices. Although the vegetation of these areas is adapted to variable climatic conditions and dry periods, the increase in drought intensity, duration, and frequency precipitate their degradation. 


In Southern Africa, recurrent droughts have strained rainfed agriculture and pasture production, decimating livestock and wildlife. During 2015 and 2016, South African savannas were subjected to a severe drought associated with a strong El Niño event. Open-source satellite time series provide vital information to assess water availability and long-term drought, to help design early warning and conservation strategies. 


In this work, we applied the TSEB (Two Source Energy Balance) model integrating MODIS-derived products (1 km) from 2000 to 2021 over the Kruger National Park (KNP) in South Africa. The model was previously validated over the Skukuza experimental site with good agreement. ET followed precipitation rates, although some years with low precipitation maintained average ET values. This may be caused by the ability of the trees to reach groundwater (deep fractured aquifers and alluvial aquifers can be found in the KNP). During some years (e.g., 2004, 2009), annual total ET was much higher than mean annual values. This may be caused by an extreme annual evaporative atmospheric demand and relatively high precipitation. The anomalies of the ratio of ET to reference ET were used as an indicator of agricultural drought on annual scales, and 2002/2003, 2007/2008 and 2015/2016 years stood out for their negative values. The approach helped to model drought over Kruger Park in the long term, providing an insight into the characteristics of the events.

Acknowledgment: This work has been carried out through the project "DroughT impACt on the vegeTation of South African semIarid mosaiC landscapes: Implications on grass-crop-lands primary production" funded by the European Space Agency in the framework of the "EO AFRICA R&D Facility".

How to cite: Dube, T., Ramoelo, A., Shoko, C., Dominic, M., Gonzalez-Dugo, M. P., Nieto, H., and Andreu, A.: Drought monitoring over the Kruger National Park (2000-2020) integrating remote sensing data., EGU General Assembly 2023, Vienna, Austria, 23–28 Apr 2023, EGU23-6608, https://doi.org/10.5194/egusphere-egu23-6608, 2023.

EGU23-8955 | ECS | PICO | HS2.1.2

Multiscale water accounting under climate change in a transboundary West African basin 

Moctar Dembélé, Elga Salvadore, Sander Zwart, Natalie Ceperley, Grégoire Mariéthoz, and Bettina Schaefli

Water accounting frameworks assess water availability and consumption of various users and are key tools to inform decision and policy making for integrated water resources management. This study presents a modelling framework that integrates a spatially explicit hydrological model and climate change scenarios with the Water Accounting Plus (WA+) tool to anticipate future water resource challenges and provide mitigation measures. The fully distributed mesoscale Hydrologic Model (mHM), spatially calibrated with multiple satellite remote sensing products, is used to predict water fluxes, stocks and flows in the transboundary Volta River basin (VRB) in West Africa. The mHM model is forced with a large ensemble of climate change projection data from eleven general circulation models (GCMs) downscaled by four regional climate models (RCMs) under the representative concentration pathway RCP8.5, obtained from CORDEX-Africa. Outputs from mHM are used as inputs to the WA+ framework to report on the state and trends of water resources over the historical baseline period 1991-2020 and the near-term future 2021-2050. The basin-scale WA+ reporting is reinforced with a multi-scale summary of water accounts across spatial domains including four climatic zones, four sub-basins and the six riparian countries.

The long-term multi-model ensemble mean of the net inflow to the basin is found to be 419 km3/year with an inter-annual variability of 11%, and is projected to slightly increase in the near-term future (2021-2050), due to the increase in rainfall, thereby highlighting the need for adaptation strategies to optimize the water-energy-food-ecosystem nexus in the VRB.

How to cite: Dembélé, M., Salvadore, E., Zwart, S., Ceperley, N., Mariéthoz, G., and Schaefli, B.: Multiscale water accounting under climate change in a transboundary West African basin, EGU General Assembly 2023, Vienna, Austria, 23–28 Apr 2023, EGU23-8955, https://doi.org/10.5194/egusphere-egu23-8955, 2023.

EGU23-11856 | PICO | HS2.1.2 | Highlight

Droughts influence patterns of human settlements in Africa 

Serena Ceola, Johanna Mård, and Giuliano Di Baldassarre

Droughts are increasing in frequency and intensity in many African countries. Their occurrences severely affect agricultural production and thus potentially contribute to human displacement. Yet, the way in which droughts influence patterns of human settlements remain poorly understood. Here we show that drought occurrences across Africa are often associated with (other things being equal) human displacements towards rivers and cities. Our results show that 73-81% of African countries exhibit larger human mobility towards water bodies and urban areas during drought conditions, as compared to non-drought periods. This may result into increasing floodplain population, and thus into potentially larger flood losses, or overcrowding urban areas. As such, our results shed light on the interplay between hydrologic extremes and society, bolstering the analysis on the spatiotemporal dynamics of drought risks in a warming world.

How to cite: Ceola, S., Mård, J., and Di Baldassarre, G.: Droughts influence patterns of human settlements in Africa, EGU General Assembly 2023, Vienna, Austria, 23–28 Apr 2023, EGU23-11856, https://doi.org/10.5194/egusphere-egu23-11856, 2023.

The study investigates the sensitivity of water resources, droughts and hydropower generation to climate change in the Lake Malawi and Shire River basins, covering three different aspects:

  • Analysis of the variability and trends of meteorological and hydrological droughts based on observational data from 1970 to 2013;
  • Drought analysis for future conditions and investigation of potential changes in water balance and various drought indicators;
  • Hydrological simulation and sensitivity analysis of the Lake Malawi water balance and water level, as well as its discharge and associated hydropower generation in the Shire River.

The key findings of these analyses are:

  • Between 1970 and 2013, meteorological droughts have increased in intensity and duration. This can be attributed to a decrease in precipitation and an increase in temperatures and evaporation.
  • The hydrological system of Lake Malawi reacts to meteorological droughts with a time lag (up to 24 months), so that hydrological droughts can be predicted up to 10 months in advance by meteorological drought parameters. Hydrological droughts are characterized by water levels below 474.1 m asl in Lake Malawi.
  • Despite all the differences and uncertainties in climate projections, they agree that meteorological droughts will continue to increase in the future, in the form of increasing drought intensities DI (+25% to +50% for 2021-2050 and +131% to +388% for 2071-2100) and increasing drought months DM (3-5 and 7-8 more drought months per year, respectively).
  • The water level in Lake Malawi, as a residual of the catchment water balance, is very sensitive to changes in precipitation and evaporation. Outflow from the lake is a direct function of lake water level, and the combination of projected precipitation decline and temperature increase ultimately leads to significantly reduced flow in the Shire River and a decline in annual hydropower production of between 1% and 2.5% (2021-2050) and 5% and 24% (2071-2100). Sometimes, individual projections even suggest that the outflow from Lake Malawi would temporarily dry up and the power supply in the country would be interrupted.

It is shown that failure to meet the 1.5°C global temperature increase target will have a severe impact on droughts and water resources in Malawi. This in turn has implications for hydropower production, as a result of which the achievement of most of the Sustainable Development Goals (SDGs) will be at risk.

How to cite: Bronstert, A., Mtilatila, L., and Vormoor, K.: Impacts of climate change on hydrological extremes and hydropower production in tropical Africa: catchments of Lake Malawi and the Shire River in Malawi, EGU General Assembly 2023, Vienna, Austria, 23–28 Apr 2023, EGU23-12047, https://doi.org/10.5194/egusphere-egu23-12047, 2023.

EGU23-16309 | PICO | HS2.1.2

Approaches to community–scale drought and flood early warning 

Justin Sheffield, John Kimball, Jinyang Du, and Koen Verbist

The African Flood and Drought Monitor (AFDM) is a satellite-model based system for monitoring and forecasting flood and drought conditions for the African continent. It has been running operationally since 2008 in various forms, providing useful information on flood and drought risks to a variety of end-users, as well as information for a wide range of water-related applications, including food and energy security, health risks, and migration. This paper provides an overview of the latest version of the system, which incorporates updated versions of hydrological models and meteorological data at high resolution, as well as the state-of-the-art short-term and seasonal forecast models. We also describe the tailoring of the AFDM to national systems across southern Africa and the process of co-design of these systems with national agencies and end-users. The system has been evaluated on several time scales, historically and for short-term (flood) and seasonal (drought) forecasts. Predictability is discussed with respect to end-users needs, especially at the community scale, and how more recent approaches to predict at the community scale are being incorporated into these monitoring systems, using high-performance computing, machine learning and data assimilation.

How to cite: Sheffield, J., Kimball, J., Du, J., and Verbist, K.: Approaches to community–scale drought and flood early warning, EGU General Assembly 2023, Vienna, Austria, 23–28 Apr 2023, EGU23-16309, https://doi.org/10.5194/egusphere-egu23-16309, 2023.

EGU23-16989 | PICO | HS2.1.2 | Highlight

A new global reference evapotranspiration reanalysis: global opportunities in operational drought monitoring and famine early warning 

Mike Hobbins, Olena Boiko, Candida Dewes, Andrew Hoell, Greg Husak, Harikishan Jayanthi, Tamuka Magadzire, Amy McNally, Daniel Sarmiento, Gabriel Senay, and Will Turner

Data-sparse hydroclimates across the globe are often the most vulnerable to climate shocks and their populations to food insecurity. Drought monitoring and famine early warning in these regions have for too long relied on poor parameterizations of atmospheric evaporative demand (E0)—no less than the demand side of drought and of consumptive use by agriculture—either relying on physically poor process representations of E0 or on climatological mean estimates. However, by exploiting the advent of long-term, spatially distributed, and accurate reanalyses of the land-atmosphere system and its drivers we can put new data to use to save livelihoods and lives by improving drought monitoring, famine early warning, and multi-scale agricultural risk assessment.

Here we describe one such effort—to create a daily, long-term, accurate, global operational dataset of E0. Funded by the Famine Early Warning Systems Network (FEWS NET) and its partners, we have developed a nearly 42-year long, daily, 0.125-degree, global dataset of Penman-Monteith reference evapotranspiration as a fully physical metric of E0. This new E0 dataset is driven by the Modern-Era Retrospective analysis for Research and Applications, Version 2 (MERRA-2)—an accurate, fine-resolution land-surface/atmosphere reanalysis. We verified the accuracy of the dataset against (i) point-estimates of E0 derived by Southern African Science Service Centre for Climate Change and Adaptive Land Management (SASSCAL) initiative in Southern Africa, a region with sparse ground-truth data and significant humanitarian need, and (ii) on a spatially distributed basis against E0 derived from other reanalyses (Global Data Assimilation System and Princeton Global Forcing) that, although global, are otherwise unsuitable for operational food-security decision-making.

We summarize the various uses to which the new E0 dataset is already being put in support of food-security monitoring and decision-making in food-insecure countries within the FEWS NET framework: to provide input data for a global implementation of the Evaporative Demand Drought Index (EDDI), which examines anomalies in E0 to permit early warning and ongoing monitoring of agricultural flash drought and hydrologic drought, both crucial drivers of food insecurity; and to diagnose the anomalies in E0 that lead to or signal drought into the relative contributions from its drivers, examining canonical droughts across Africa (e.g., the 2015 drought in Malawi, and the 2016 Horn of Africa drought, and the current multi-year East African drought). We also present use-cases that verify the operational applicability of the new E0 dataset in long-established drought, famine, crop- and pastoral-stress metrics, and in predictability assessments of drought forecasts. Driven by this new dataset, these analyses should significantly contribute to a more holistic understanding of drought and food-security across the African continent and the rest of the world.

How to cite: Hobbins, M., Boiko, O., Dewes, C., Hoell, A., Husak, G., Jayanthi, H., Magadzire, T., McNally, A., Sarmiento, D., Senay, G., and Turner, W.: A new global reference evapotranspiration reanalysis: global opportunities in operational drought monitoring and famine early warning, EGU General Assembly 2023, Vienna, Austria, 23–28 Apr 2023, EGU23-16989, https://doi.org/10.5194/egusphere-egu23-16989, 2023.

EGU23-17140 | PICO | HS2.1.2

In Situ and Earth Observation-Based Monitoring of Water Availability in Rangeland Areas of the Sahel and East Africa 

Kimberly Slinski, Gabriel Senay, James Rowland, Mike Budde, Shrad Shukla, Amy McNally, Alkhalil Adoum, Erwann Fillol, Bamba Ndiaye, and Cherif Assane Diallo

Rangeland water is critical to food security early warning systems in Africa.  Rangelands feed more than half of Africa’s livestock, providing a source of income to 268 million pastoralists and agropastoralists. Rangeland ponds are a vital source of water for pastoral livestock, directly contributing to household food security and health.  However, rangeland areas of the Sahel and East Africa are water-limited, drought prone, and very food insecure.  In December 2022, the United States Agency for International Development’s (USAID) Famine Early Warning Systems Network (FEWS NET) identified >35 million extremely food insecure people in the countries located in the Sahel and East Africa. 


The NASA-funded “Earth Observation-Based Monitoring and Forecasting of Rangeland Water Resources” (Rangelands Monitoring and Forecasting System) project partners with FEWS NET to develop new capabilities for monitoring and forecasting water availability in African rangeland ponds.  FEWS NET partner, the U.S. Geological Survey, maintains the Water Point Viewer (https://earlywarning.usgs.gov/fews/software-tools/25), an interactive map that monitors the relative depth and area of 338 water points across arid and semi-arid regions of the Sahel and East Africa, from Senegal to Somalia.  The Rangelands Monitoring and Forecasting System project aims to significantly expand and improve the existing FEWS NET Water Point Viewer by increasing the locations monitored, developing new time series of water point surface area using high-resolution satellite data, improving overall model physics, and developing new forecasting capabilities.  These advanced data streams aim to improve pastoral resilience to climate shocks by increasing the capacity of stakeholders to plan for and respond to drought emergencies.


In this presentation, we introduce the Rangelands Monitoring and Forecasting System project and present first results from the 2022 field season.  During the 2022 West African rainy season, Action Contre la Faim collected water level observations from staff gauges installed in twelve ephemeral ponds located along transhumance corridors in Senegal.  Over the same period, the surface water extent of each pond was estimated using Sentinel 1 synthetic aperture radar, Sentinel 2 multispectral data, and Landsat multispectral data.  Additionally, the FEWS NET Water Point Viewer simulated water levels in nearby ponds.  The observed water levels were compared to the modeled surface water levels and the satellite data-based surface water extents to understand how well the FEWS NET Water Point Viewer and remotely sensed data streams capture the seasonal variation of water availability in the ponds.


This presentation: 1) presents the comparison results and discusses the accuracy of the model- and satellite-based estimates of water availability; 2) discusses the limitations of using remotely sensed estimates of water availability in the West Africa Sahelian region; and 3) presents lessons learned from conducting a field campaign in rural areas of West Africa.  The results from the first year of the project will inform the development of the next generation of the FEWS NET Water Point Viewer and new satellite-based remote sensing data streams for monitoring water availability in pastoral regions.

How to cite: Slinski, K., Senay, G., Rowland, J., Budde, M., Shukla, S., McNally, A., Adoum, A., Fillol, E., Ndiaye, B., and Assane Diallo, C.: In Situ and Earth Observation-Based Monitoring of Water Availability in Rangeland Areas of the Sahel and East Africa, EGU General Assembly 2023, Vienna, Austria, 23–28 Apr 2023, EGU23-17140, https://doi.org/10.5194/egusphere-egu23-17140, 2023.

EGU23-583 | ECS | Orals | HS2.1.4 | Highlight

An increase in domestic tap water consumption led to a decline in the groundwater reserves of Delhi 

Ajay Ajay and Prasanta Sanyal

Despite the riparian state of river Yamuna and local groundwater reserves, Delhi depends on other rivers to fulfil the rising demand for drinking water.  In the last ten years, the water demand has increased by 39% (2006-2016). In this study, we have tried to understand the domestic water supply system by studying the spatiotemporal variation in the stable isotopic composition of tap water. The stable water isotopes are powerful tracers of hydrological processes in natural and human-managed systems. There are three primary sources with distinct stable water isotopic composition River Yamuna, Upper Ganga canal, Munak canal and local groundwater reserves; the glacial-fed Himalayan rivers and canals fulfil around 90% of the water demand. Numerous government-operated treatment plants in Delhi purify the water from one of the above sources and supply it to consumers. We collected the water sample at every stage of the water supply, from the primary source to the sink, such as samples of canal or river water, raw water before treatment, filtered water after treatment, storage reservoirs, groundwater samples and finally, the household tap waters. 

Contrary to the river, canal water’s isotopic composition shows no spatial variation. Also, the isotopic composition of raw water is similar to the filtered water, indicating no significant loss due to evaporation or any other hydrological process. However, the isotopic composition of tap water shows considerable variation and deviation from its source value. In most regions, tap water’s isotopic composition is higher than that of source water. In Delhi, among all the other sources, the isotopic composition of surface water is lower than that of groundwater. Thus, only the mixing of groundwater with surface water before supplying it to households can explain the observed large variation in the isotopic composition of tap water. Furthermore, our observation suggests groundwater extraction for domestic purposes has increased from 2019 to 2021. The demand for domestic water per capita is rising with the increase in the population. However, the production of treated water is almost constant and depends upon the raw water availability. The excess extraction of groundwater fulfils the gap between supply and demand. Our study suggests that the surface water (river and canal water), or the number of treatment plants, is insufficient to meet the rising water demand in Delhi, which has led to the overexploitation of limited groundwater reserves in the past few years. Therefore, besides irrigation, the excessive groundwater extraction for domestic purposes results in a drop in the North-west India groundwater table. 


How to cite: Ajay, A. and Sanyal, P.: An increase in domestic tap water consumption led to a decline in the groundwater reserves of Delhi, EGU General Assembly 2023, Vienna, Austria, 23–28 Apr 2023, EGU23-583, https://doi.org/10.5194/egusphere-egu23-583, 2023.

EGU23-775 | ECS | Posters on site | HS2.1.4

Predicting un-impacted flow regime in a Mediterranean catchment with SWAT+ for setting an Environmental Flow 

Marianna Leone, Francesco Gentile, Antonio Lo Porto, Giovanni Francesco Ricci, and Anna Maria De Girolamo

The general aim of this work was to define a methodology for setting the environmental flows (E-Flows) in a temporary river with limited data availability through a case study. In the literature, there are many methods to set up an E-Flow, however, the issue is still an emerging discipline in non-perennial rivers due to the lack of specific guidelines at the European and national level and the limited availability of data (i.e., hydrological/biological).

The study area is the Locone river basin (219 km2) located in southern Italy. The climate is typically Mediterranean. The flow regime shows a pattern of low flow and zero flow in summer. The Locone is classified by the River Basin Authority as a temporary river. Upstream of the dam, streamflow was measured from 1971 to 1983. The main land use is winter wheat (64% of the total area), followed by broad-leaved woods (6.6%) and broad beans (5.4%). The main hydrological pressure in the basin is represented by the Locone dam. It was built in 1986 for agricultural purposes (approximately 5,000 hectares are irrigated) and for a hydroelectric power station (1,693,000 kWh / year).

To compensate for the lack of hydrological and ecological data, which characterizes these types of rivers, the open-source Soil and Water Assessment Tool Plus (SWAT +) model was applied. SWAT + is a completely revised version of the SWAT model, which is a physical scale and watershed model, which operates on a daily time step (Arnold et al., 1998). The model was calibrated (NSE = 0.720; Pbias = -11.514 and R2 = 0.84) and validated (NSE = 0.42; R2 = 0.45; Pbias = -12.5). The flow regime has been characterized under un-impacted conditions over a long period (1971-2020) using hydrological alteration indicators (IHAs) based on modeled daily flows. The E-Flow was set by fixing the variability range of each IHA within the interquartile (25th-75th percentile) by applying the Range of Variability Approach. For the Locone reservoir, the mean monthly flow of water releases, the magnitude, and duration of high and low flows, as well as the timing and frequency of floods and drought conditions were defined.

This work made it possible to test the SWAT+ model in a Mediterranean environment, confirming its potential. The applied method represents a first useful evaluation analysis that should be revised following ecological data monitoring actions to corroborate the eco-hydrological relationships.

How to cite: Leone, M., Gentile, F., Lo Porto, A., Ricci, G. F., and De Girolamo, A. M.: Predicting un-impacted flow regime in a Mediterranean catchment with SWAT+ for setting an Environmental Flow, EGU General Assembly 2023, Vienna, Austria, 23–28 Apr 2023, EGU23-775, https://doi.org/10.5194/egusphere-egu23-775, 2023.

EGU23-778 | ECS | Posters on site | HS2.1.4

Different approaches to model temporary hydrological regimes in a Mediterranean karst basin using the SWAT model. 

Marco Centanni, Giovanni Francesco Ricci, Anna Maria De Girolamo, and Francesco Gentile

In the Mediterranean Region basins are characterized by a specific hydrological regime that generally includes periods of absence of flow and flash flood events. Lithological and geological features are factors that greatly affect the flow regime. In this work, the Soil and Water Assessment Tool (SWAT) model was applied to simulate the Canale d'Aiedda (Apulia, Italy) flow regime, a Mediterranean temporary karst river basin with limited data availability. Different basin delineations and model parameterizations were adopted that include: (i) cut-off of karst areas in GIS (Configuration A); (ii) setting up the basin including the karst areas (Configuration B) and (iii) parameterizing, in the calibration process, the Crack Flow function in the karst sub-basins (Configuration C). The model performed satisfactorily for daily streamflow for configurations B and C and good for A. A better simulated large floods. C was the best solution for monthly flow from May to July. Regarding the water balance, C showed higher surface runoff values and lower total water yield values than A and B. The Crack flow function proved to be a valid option to improve the simulation of hydrological processes in karst areas. Several factors, such as the final aim of the study, data availability, and basin characteristics should be considered in selecting the best model configuration.

How to cite: Centanni, M., Ricci, G. F., De Girolamo, A. M., and Gentile, F.: Different approaches to model temporary hydrological regimes in a Mediterranean karst basin using the SWAT model., EGU General Assembly 2023, Vienna, Austria, 23–28 Apr 2023, EGU23-778, https://doi.org/10.5194/egusphere-egu23-778, 2023.

EGU23-780 | ECS | Orals | HS2.1.4 | Highlight

The Impact of Meteorological Drought on Vegetation Health in the Middle Euphrates River Basin (Syria) 

Hiba Mohammad, Marco peli, and Stefano Barontini

Syria is now witnessing the dramatic effects of a multiyear drought that has been afflicting the country since 2006. The drought has impacted several regions, but the north-eastern Al Jazira region, corresponding to the Middle Euphrates River basin and considered the Syrian “breadbasket”, has been hammered particularly severely.

With this paper we aim at contributing to the knowledge on the consequences of multiyear meteorological drought on food security in the basin of the middle range of the Euphrates River in Syria.

Annual precipitation data were collected from 11 ground meteorological stations for the period 1983–2020 covering an area of 96800km2. Data were provided by the Syrian Ministry of Agriculture. In addition, the series of two satellite-based indices, namely Vegetation Condition Index (VCI) and Vegetation Health Index (VHI) were collected to analyse the vegetation responses to the meteorological drivers. These indices were downloaded at a resolution of 4-km for the time range 1983-2020, from the Centre for Satellite Applications and Research (STAR) of the National Oceanic and Atmospheric Administration (NOAA). The crop production data, including yields of cotton, wheat, and maize, were collected at provincial level over the period of 1983–2020 from Syria Statistical Yearbook.

Recent changes in meteorological drought features (e.g., frequency and intensity) throughout Syria for the years 1983–2020 were assessed by means of the Standard Precipitation Index (SPI), to characterize the meteorological draughtiness for the Al-Jazira region.

SPI was computed on a 12-month timeline to account for the delayed effect of rainfall deficiency on crop output. Commonly, agricultural droughts are evaluated using drought indices at these long timeframes (e.g., 18 and 24 months) because these longer timescales reflect the accumulated influence of meteorological drought that might alter soil water content and stream flow. The correlation matrices of the series of SPI, averaged at different time scales to focus on the effect of multiyear drought events, with the series of VCI and VHI, will be presented.

This work is preliminary to the GIS application of simplified Benfratello’s water balance method (Barontini et al., 2021) to assess the proneness to water scarcity and the irrigation deficit of different areas of the basin.

References

Barontini, S., Rapuzzi, C., Peli, M., and Ranzi, R.: A GIS based application of Benfratello's method to estimate the irrigation deficit in a semiarid climate, EGU General Assembly 2021, online, 19–30 Apr 2021, EGU21-12936, https://doi.org/10.5194/egusphere-egu21-12936, 2021.

How to cite: Mohammad, H., peli, M., and Barontini, S.: The Impact of Meteorological Drought on Vegetation Health in the Middle Euphrates River Basin (Syria), EGU General Assembly 2023, Vienna, Austria, 23–28 Apr 2023, EGU23-780, https://doi.org/10.5194/egusphere-egu23-780, 2023.

EGU23-975 | ECS | Posters on site | HS2.1.4

Evaluation of baseflow processes in the Yellow River Basin, China 

Shixuan Lyu and Junlong Zhang

Yellow River is the mother river of the Chinese nation. It has provided available water resources for more than 5000 years and makes the Yellow River Basin (YRB) a significant grain-producing in China. Recently, promoting the high-quality development of the YRB has been proposed as a Chinese national strategy, highlighting the high status of the YRB in China. However, covering a large area of the arid and semi-arid region, hydrometeorological extremes such as droughts have often occurred in historical periods in the YRB, with prolonged effects on agricultural production. In addition, water conflicts (i.e., water shortage) between human beings’ needs and water resource availability have been much more severe due to population growth and global warming, affecting the ecological health of basins and challenging the lives of riparian residents. Baseflow is a stable flow during the drought season to discharge total streamflow from the groundwater and other delayed sources, which is significant for maintaining the ecological health of river basins and promoting sustainable economic development in arid and semi-arid catchments. Therefore, it is urgent to investigate baseflow characteristics and their determinants for understanding the hydrological processes better and provide scientific foundations for mitigating water shortage problems in the YRB.

Based on that, we collected the daily streamflow records from the main catchments in the YRB. The daily ensembled mean baseflow records derived from Lyne-Hollick, Chapman-Maxwell, Eckhardt and United Kingdom of Institute Hydrology (UKIH) separation algorithms were obtained after the 21st century to reduce simulation uncertainties. Dynamics hydrological signatures were extracted to investigate baseflow spatiotemporal variations and their determinants. Catchments’ physical properties, including topography, vegetation, soil and human activities, were selected. The stepwise model was conducted to see how these catchments’ properties influence the hydrological signatures variability and the ranking of their importance. Our findings showed significant spatial distribution patterns of hydrological signatures in the YRB. Most of them had higher values in upstream and downstream reaches, while low values were in the middle reaches. The magnitude of temporal variation of hydrological signatures was strongly correlated with the catchment topography, vegetation conditions and cropland coverage. It is challenging to discover one single controlling property influencing hydrological signatures for all catchments across the YRB. For most of the hydrological signatures, soil textures, precipitation and vegetation conditions are the most significant influencing factors, indicating the baseflow processes are influenced by a synergistic effect in the YRB.

This study comprehensively investigated the baseflow characteristics in the whole YRB. It can not only provide scientific foundations for water resources management in the YRB but also take an example of how to quantitively evaluate the baseflow characteristics in large semi-arid and arid catchments.

How to cite: Lyu, S. and Zhang, J.: Evaluation of baseflow processes in the Yellow River Basin, China, EGU General Assembly 2023, Vienna, Austria, 23–28 Apr 2023, EGU23-975, https://doi.org/10.5194/egusphere-egu23-975, 2023.

EGU23-1745 | Posters on site | HS2.1.4 | Highlight

Impact of Forestation and Land-use Changes on Desert Climate 

Ambroise Dufour, Suleiman Mostamandi, Kasper Johansen, Oliver Lopez Valencia, and Georgiy Stenchikov

Growing forests is an effective way of removing CO2 from the atmosphere. Forestation projects were started in China, Germany, and the Middle East. Saudi Arabia announced its ambitious “Saudi Green Initiative,” intending to plant ten billion trees. Given the insufficient rainfall to support the initiative, vegetated areas will require irrigation, effectively increasing evaporation. In addition, those areas have a lower albedo than bare land, absorbing more solar radiation. Enhancing precipitation due to the recycling of evaporated water is important as it reduces the amount of freshwater required for irrigation.

In this study, we focus on the regional climate impact of irrigated forested or vegetated areas on temperature and precipitation over the Arabian Peninsula to quantify their effect on livability and evaluate the water recycling potential. First, we studied the climate effect of irrigated farming developing over vast areas in Saudi Arabia since the 1980s. The agricultural areas were mapped using available satellite-based observations from the Landsat platforms, which capture optical and thermal data every 16 days at a resolution of 30 m to 100 m. Second, we projected the climate impact of widespread forestation over the Arabian Peninsula.

The analysis of the long-term precipitation changes caused by irrigated farming is hindered by the lack of in situ observations and the limitations of global-scale observation data sets. Most reanalysis products have contradictory evaporation trends and indicate an overall reduction in rainfall since the 1980s. The recycled precipitation cannot be estimated reliably because of reanalysis increments and background rainfall variability. Presumably, the local increase in rains occurs downstream of the irrigated areas rather than over them. Along with the analysis of observations, we conducted numerical experiments mimicking the effect of irrigated agricultural fields using a non-hydrostatic regional meteorological model (WRF), covering the whole Arabian Peninsula by a 9x9 km2 grid, with 3x3 km2 nesting over the irrigated areas. Irrigation water is accounted for by tagging moisture evaporated from agricultural regions. The amount of tagged water vapor falling as rain represents recycled precipitation. The simulated evaporation and local temperature response strongly depends on the level of irrigation. Large-scale subsidence suppresses the local deep convection over most parts of the Arabian Peninsula. Strong turbulence quickly mixes evaporated water vapor within a six km thick atmospheric boundary layer, preventing precipitation in shallow convection so that the fraction of recycled rainfall appears to be low.

How to cite: Dufour, A., Mostamandi, S., Johansen, K., Lopez Valencia, O., and Stenchikov, G.: Impact of Forestation and Land-use Changes on Desert Climate, EGU General Assembly 2023, Vienna, Austria, 23–28 Apr 2023, EGU23-1745, https://doi.org/10.5194/egusphere-egu23-1745, 2023.

EGU23-1808 | ECS | Posters virtual | HS2.1.4

Assessment of six satellite precipitation products in a Moroccan arid area 

Mariame Rachdane, El Mahdi El Khalki, Mohamed Elmehdi Saidi, Mohamed Nehmadou, Abdellatif Ahbari, and Yves Tramblay

Precipitation is the main component of the hydrological cycle; it is a crucial source of data in hydroclimate applications for water resources management. However, several regions, especially mountainous and arid regions, suffer from limited data from a ground measurement network. Remotely sensed data may provide a viable alternative for these regions. This study aims to evaluate six high spatio-temporal resolution satellite products (GPM-F, GPM-L, GPM-E, CHIRPS, PERSIANN-CCS-CDR and PDIR-Now) in the sub-Saharan regions of Morocco during the period September 2000-August 2020. The record data from 33 rain-gauge stations was used to evaluate these products on two spatial scales (pixel and basin scales) and three temporal scales (daily, monthly and annually), adopting a quantitative and qualitative evaluation. For all examined timescales, the results showed that the GPM-F product performed the best quantitatively, while at the detection capability tested for different threshold and at daily time scale, the GPM near real-time products (GPM-E and GPM-L) were better at detecting more intense rainfall events higher than 40 mm/day. At the daily time scale, GPM-E and GPM-L and, on monthly and annual scales, CHIRPS and PERSIANN-CCS-CDR, provided satisfactory precipitation estimates. Moreover, the evaluation based on the altitudes of rain gauges revealed a bias increasing from low to high altitudes. The findings also highlight that the continental and mountainous basins showed the lowest performance compared to the other locations closer to the Atlantic Ocean. The latitude-based analysis showed a decrease of bias and increase of correlation towards the most arid zones. These results provide valuable information for a scarcely gauged and arid regions, showing that GPM-F could be a valuable alternative to rain gauges.

How to cite: Rachdane, M., El Khalki, E. M., Saidi, M. E., Nehmadou, M., Ahbari, A., and Tramblay, Y.: Assessment of six satellite precipitation products in a Moroccan arid area, EGU General Assembly 2023, Vienna, Austria, 23–28 Apr 2023, EGU23-1808, https://doi.org/10.5194/egusphere-egu23-1808, 2023.

EGU23-2519 | Posters virtual | HS2.1.4

Mean, variance, and trends of Levant precipitation over the past 4500 years from reconstructed Dead Sea levels and stochastic modeling 

Efrat Morin, Tamar Ryb, Ittai Gavriely, and Yehouda Enzel

A novel quantitative assessment of late Holocene precipitation in the Levant is presented, including mean and variance of annual precipitation and their trends. A stochastic framework was utilized and allowed, possibly for the first time, linking high-quality, reconstructed rises/declines in Dead Sea levels with precipitation trends in its watershed. We determined the change in mean annual precipitation for 12 specific intervals over the past 4500 yr, concluding that: (1) the twentieth century was substantially wetter than most of the late Holocene; (2) a representative reference value of mean annual precipitation is 75% of the present-day parameter; (3) during the late Holocene, mean annual precipitation ranged between −17 and +66% of the reference value (−37 to +25% of present-day conditions); (4) the driest intervals were 1500–1200 BC and AD 755–890, and the wettest intervals were 2500–2460 BC, 130–40 BC, AD 350–490, and AD 1770–1940; (5) lake-level rises and declines probably occurred in response to trends in precipitation means and are less likely to occur when precipitation mean is constant; (6) average trends in mean annual precipitation during intervals of ≥200 yr did not exceed 15mm per decade. The precipitation trends probably reflect shifts in eastern Mediterranean cyclone tracks.

How to cite: Morin, E., Ryb, T., Gavriely, I., and Enzel, Y.: Mean, variance, and trends of Levant precipitation over the past 4500 years from reconstructed Dead Sea levels and stochastic modeling, EGU General Assembly 2023, Vienna, Austria, 23–28 Apr 2023, EGU23-2519, https://doi.org/10.5194/egusphere-egu23-2519, 2023.

EGU23-3315 | Orals | HS2.1.4 | Highlight

Is there a turning-point towards improved water and ecological security at the arid Tarim River Basin? 

Weihong Li, Zhi Li, Yaning Chen, and Gonghuan Fang

The arid Tarim River Basin, situated in the Eurasia hinterland, serves as the heart of China’s Silk Road Economic Belt. It covers an area of 1.02 million km2 and is surrounded by the Tienshan Mountains to the north, the Kunlun Mountains to the south and the Pamir to the west. During the past few decades, the contradiction between economic growth and environmental protection is particularly evident. For example, the desert riparian forest vegetation has declined along the lower reaches of the Tarim River.

Under global warming, the climate has experienced significant warming and moistening trend during 1961–2018, and the most dramatic increase has occurred since the mid-1980s. The increased precipitation and temperature and the resulted hydrological and ecological changes lead to a hot debate about the “warm–wet” trend. This study systematically investigated the climate change and their impact on hydrological and ecological processes. The temperature increased at a rate of 0.224 ℃ per decade and an evident jump was detected in 1998. For precipitation, about 72.3% meteorological stations experienced significant increase, with an average increasing rate of 7.47 mm per decade. The changes in climatic factors contribute to the changes in the accumulation and ablation of snow and glaciers, which resulted in changes in hydrological processes. The total lake area in the Tarim River has expanded at a rate of 23.79 km2 per year during 2012–2021. More specially, the lake area of Ayakum Lake (located near the northern boundary of the Tibetan Plateau) has increased by 50% since 1990, with an increment of 111.61 km2 during 1990–2000 and 401.4 km2 during2000–2020. The runoffs of the headwaters (i.e., Kaidu River, Aksu River, Yarkant River and Hotan River) of the Tarim River have also increased by a rate of 2.06×10⁸m3, 2.11×10⁸m3, 1.12×10⁸m3 and 2.56×10⁸m3 per decade, respectively.

However, the changes in ecological systems don’t reflect the wetter trend in the Tarim Basin. The negative effects of climate change on the region’s vulnerable ecology have intensified. The snowfall fraction experienced an overall declining trend, increasing at a rate of 0.6% per decade prior to the mid-1990s, followed by a downward trend at a rate of 0.5% per decade. Potential evaporation decreased at a rate of 41.66mm/10a per decade prior to the mid-1990s, and inversed to increase at a rate of 56.68 mm per decade. Prior to 1998, the normalized difference vegetation index (NDVI) of natural vegetation exhibited an increasing trend at a rate of 0.012 per decade, but from 1999 onwards, the NDVI started decreasing at a rate of 0.005 per decade. The bare soil areas of the Taklamakan Desert boundaries expanded by 7.8 % since 1990. Excessive water use, including unrestrained overpumping of groundwater, causes the loss of groundwater.

This study sheds light on the debate of changes in climate and ecological security under global warming in the endoreic Tarim River Basin. However, more efforts should be made on the continuity of these changes, which is crucial for local development and water and ecological security along the Silk Road.

How to cite: Li, W., Li, Z., Chen, Y., and Fang, G.: Is there a turning-point towards improved water and ecological security at the arid Tarim River Basin?, EGU General Assembly 2023, Vienna, Austria, 23–28 Apr 2023, EGU23-3315, https://doi.org/10.5194/egusphere-egu23-3315, 2023.

EGU23-4167 | ECS | Posters on site | HS2.1.4

Heavy precipitation events where there’s no rain: Saharan rainfall climatology and its relationship with cyclones 

Moshe Armon, Andries Jan de Vries, Francesco Marra, Nadav Peleg, and Heini Wernli

The Sahara is the largest and perhaps the driest desert in the world. This desert however, has not always been this dry. In fact, it is presumed that a few thousand years ago it was much wetter. Moreover, it is projected that, by the end of the 21st century, the Sahara will exhibit the strongest relative increase in precipitation outside the polar regions. To better grasp this information, however, we need to answer some questions: wetter than what? What is the present-day rainfall climatology of the Sahara and what are the synoptic conditions during rainstorms in the desert?

Currently, rainstorms in the Sahara are considered a rare phenomenon. However, rain-bearing cyclones intruding from wetter neighboring regions are possible, and can lead to heavy precipitation events (HPEs) which cause hazardous desert floods. When rainfall occurs, the chances for it to be observed and measured at the ground are close to zero due to the scarcity of rain gauges and the small scale of the precipitation systems. Consequently, the characteristics of rainfall during Saharan rainstorms were seldom analyzed, especially at the scale of the whole desert. In this study, we use high-resolution satellite precipitation estimates (IMERG) and meteorological reanalysis (ERA5) to (a) identify thousands of HPEs that occurred over the Sahara in the past 21 years, (b) characterize rainfall properties during these events, and (c) identify the governing atmospheric conditions on HPE-days, with a focus on surface cyclones.

Our results show that HPEs may occur throughout the entire Sahara. Summer events happen mainly in the southern Sahara. They tend to be short-lived (on average ~12 h) and small in size (~8000 km2), with high-intensity convective rainfall. Conversely, winter HPEs occur primarily in the northern and western parts of the desert, they are longer (~16 h) and larger (15,000 km2) and produce higher rainfall volumes with lower rainfall intensities. When associated with cyclones (29% of events), HPEs exhibit 15% lower rainfall intensities, and 46% higher volumes. This is likely due to a much greater (+64%) areal extent. Our analysis compensates the small number of events at each location with the huge area of the desert, so that a HPE is observed on average every second day. The high-resolution datasets we use enable us to characterize small-size events, with substantial implications for the local scales. Hopefully, such an analysis can serve as a starting point to cope with natural hazards and better understand the future of HPEs in the Sahara.

How to cite: Armon, M., de Vries, A. J., Marra, F., Peleg, N., and Wernli, H.: Heavy precipitation events where there’s no rain: Saharan rainfall climatology and its relationship with cyclones, EGU General Assembly 2023, Vienna, Austria, 23–28 Apr 2023, EGU23-4167, https://doi.org/10.5194/egusphere-egu23-4167, 2023.

EGU23-5987 | ECS | Posters on site | HS2.1.4

Testing hydrological model for Mars using Negev desert based field observations on the Earth. 

Vilmos Steinmann and Ákos Kereszturi

There are many hydrological models for normal terrestrial environments based on precipitation related erosion, but few of them work well in arid and hyper-arid conditions. These extreme arid regions can be good Mars analogue sites to test and model the conditions and laws of precipitation fed runoff and produced erosion on the Red Planet and infer to past periods. The hydrological model we have developed is primarily designed for Martian conditions and has been tested and validated in the Zafit subbasin of the Zin basin of the Negev desert, the eastern part of Israel. The calculated model data were also compared with data from hydrological models and field measurements in the area. Our applied hydrological model without precipitation data is able to estimate the main hydrographic characteristics of the sample area, such as flow discharge, flow velocity, flow depth, and the model is also able to estimate the Formation Timescale (FTS) of some surface features, as well as vertical erosion rates. The model was developed in the open source QGIS software using SAGA and GRASS GIS modules. It uses input variables that can be measured not only under terrestrial conditions but also measured or estimated under Martian conditions, and there are good quality datasets of them. Examples of such variables are the aridity index, which plays an important role in determining the flow discharge, or the density of the rock that makes up the grains, water density, gravity, and grain size classes. The model can be run on any DTM (Digital Terrain Model), the most important constraint being that the linear unit of projection used is defined in SI metres. The hydrological part of the model is complete however under continuous development, and the final model will be complemented by a further developed erosion model to simulate long term surface evolution and change, thus facilitating the understanding of not only terrestrial but also fluvial erosion produced Martian surface changes.

How to cite: Steinmann, V. and Kereszturi, Á.: Testing hydrological model for Mars using Negev desert based field observations on the Earth., EGU General Assembly 2023, Vienna, Austria, 23–28 Apr 2023, EGU23-5987, https://doi.org/10.5194/egusphere-egu23-5987, 2023.

EGU23-6074 | Orals | HS2.1.4

Atmospheric water capture by desert soils: can we measure it? 

Dilia Kool and Nurit Agam

Atmospheric water, or non-rainfall water inputs (NRWIs) are a critical, albeit largely overlooked, component of the global hydrological cycle. Water vapor adsorption specifically, is not only the least studied form of NRWI but likely the most common one in arid areas.

Lysimeter measurements in the Negev desert during the summers of 2019-2022 indicate that water vapor adsorption in loess soil amounts to at least 33 mm when looked at cumulatively over the summer (0.3-0.5 mm night-1): about ~30% of annual rainfall (116 mm). Given the challenges using lysimeter measurements, attempts to quantify NRWI amounts and duration have generally been limited to short time periods at point or local scales. Determining the true importance of NRWIs in arid and extremely arid environments, which comprise 20% of the terrestrial surface, requires new approaches to measure water content in the 0.5-5% range.

Using weighing lysimeters as a reference, we tested of-the-shelf temperature and relative humidity sensors to assess changes in water content with high temporal resolution over longer periods of time for sand and loess soils. Relative humidity was converted to water potential (Kelvin equation). The water content was then determined using a water retention curve measured with a vapor sorption analyzer. Results showed diurnal patterns in water content consistent with lysimeter measurements. Maximum increase in water content correlated well with lysimeter measured NRWIs. While not all issues are yet resolved, this direction opens possibilities to expand our measurement capacity over longer periods of time and increase the number of measurement locations at relatively low cost. This provides one step forward in trying to understand the magnitude of NRWIs in arid environments across the globe.

How to cite: Kool, D. and Agam, N.: Atmospheric water capture by desert soils: can we measure it?, EGU General Assembly 2023, Vienna, Austria, 23–28 Apr 2023, EGU23-6074, https://doi.org/10.5194/egusphere-egu23-6074, 2023.

EGU23-7066 | ECS | Posters on site | HS2.1.4

Spatial distribution of intermittency in a Brazilian Semiarid river 

Nazaré Suziane Soares, Carlos Alexandre Gomes Costa, Till Francke, Pedro Henrique Augusto Medeiros, Christian Mohr, Wolfgang Schwanghart, and José Carlos De Araújo

Intermittent and ephemeral rivers are characterized by periods of drying and rewetting which occur along different reaches of the channel. Where the channel dries or develops into ponds related to factors such as discharge, topography, geology and riparian vegetation. The aim of this work is to evaluate the spatial patterns and dynamics of intermittency in reaches of a Brazilian semiarid river. Using repeated surveys with unmanned aerial vehicles (UAVs), we characterize its connectivity by identifying locations with different water condition. The Umbuzeiro River (approximately 80 km long; 6.65°S, 40.41°W) is the main river in the Benguê catchment (~1000 km²) that is controlled by the Benguê reservoir, with a storage capacity of 18 hm³. Umbuzeiro is an intermittent/ephemeral river and spatially coherent streamflow occurs mainly in the wettest months of the rain season. We conducted UAV surveys each month from March to June 2022, allowing us to produce detailed hydrological characterizations along different sections of the river. The imagery sets from different UAVs, i.e. DJI Phantom 4 pro and eBee SQ, provided relatable characteristics for a same reach. Visually analysing the reaches, their water condition was determined for smaller subsets, i.e. ponds or dry spots. Observing the temporal and spatial patterns of the presence of water on the riverbed in the different reaches for each survey, we conclude that the patterns are not only dependent on the contributing area of each section, but also on the river’s natural sinuosity, riffle-pool sequences and riparian vegetation. Our results highlight and provide an explanation for the hydrological diversity of semiarid rivers which is important to understand their ecological role and habitat.

How to cite: Soares, N. S., Costa, C. A. G., Francke, T., Medeiros, P. H. A., Mohr, C., Schwanghart, W., and De Araújo, J. C.: Spatial distribution of intermittency in a Brazilian Semiarid river, EGU General Assembly 2023, Vienna, Austria, 23–28 Apr 2023, EGU23-7066, https://doi.org/10.5194/egusphere-egu23-7066, 2023.

EGU23-9376 | ECS | Orals | HS2.1.4

The usage of fog and dew in solar power plants of the Atacama Desert 

Felipe Lobos Roco, Francisco Suarez, Rodrigo Escobar, Pablo Osses, Carla Ramirez, Klaus Keim, Ignacio Aguirre, Francisca Aguirre, Constanza Vargas, Francisco Abarca, and Camilo del Rio

The Atacama desert is one of the most promising places on Earth for developing solar power energy due to its aridity, irradiation, and market conditions. However, the high levels of dust attenuate solar power production. This problem is solved by frequent cleaning of the solar panels, which requires a significant amount of water in one of the driest places in the world. Despite the drought condition, the fog and dew formed at the coastal zone of the desert arise as a complementary water source that can potentially be tapped. In this study, we assess the potential of atmospheric water for usage in four solar power plants. We conduct this assessment by combining a satellite-spatial analysis of fog and low cloud frequency, a thermodynamic vertical characterization of the marine boundary layer, and an observational analysis of fog and dew collection using different instruments. Our results reveal that fog and dew are a regular phenomenon in the solar power plants analyzed, being present between 3% and 20% of the year. Oceanic conditions control such phenomena through the inland advection of the marine boundary layer. This layer interacts with a complex topography characterized by natural corridors that allow fog and low clouds to penetrate farther inland. Our observations show that fog and dew are collected mainly during the night, with average rates between 0.1 and 0.2 L m-2 day-1. Our research confirms that atmospheric water potential vastly exceeds the solar power plant water demand, demonstrating that atmospheric water is a reliable source for the industry.

How to cite: Lobos Roco, F., Suarez, F., Escobar, R., Osses, P., Ramirez, C., Keim, K., Aguirre, I., Aguirre, F., Vargas, C., Abarca, F., and del Rio, C.: The usage of fog and dew in solar power plants of the Atacama Desert, EGU General Assembly 2023, Vienna, Austria, 23–28 Apr 2023, EGU23-9376, https://doi.org/10.5194/egusphere-egu23-9376, 2023.

The Gravity Recovery and Climate Experiment (GRACE) and GRACE-Follow On (GRACE-FO) when combined with traditional data sources (geochronology, geochemistry, hydrology, modelling) can enhance our understanding and monitoring of elements of hydrologic systems including recharge of reservoirs, groundwater flow direction and rates, and the impacts of climate change on watersheds worldwide.  We cite a few examples. Large seasonal fluctuations (peak: Nov./Dec.; trough: July/Aug.) in Lake Nasser's surface water levels are accompanied by an increase in GRACETWS (average: 50 ± 13 mm/yr, up to 77 ± 18 mm/yr) over Lake Nasser in Upper Egypt and by a progression of a front of increasing GRACETWS values (> 50 ± 13 mm) away from the lake reaching distances of up to 700 km some 3 to 5 months following peak lake level periods. Those patterns are consistent with rapid turbulent groundwater flow from Lake Nasser along preferred flow directions (networks of faults and karst topography). The Tigris Euphrates watershed (30 dams) showed an impressive recovery following a prolonged drought (2007–2018; Average Annual Precipitation [AAP]: ~400 km3) by an extreme precipitation event in 2019 (726 km3) with no parallels in the past 100 years. This recovery (113±11 km3) compensated for 50% of the losses endured during drought by impounding a large portion of the runoff within the reservoirs (capacity: 250 km3). The Aswan High Dam, with its storage capacity of 150 km3 represents one of the best-engineered systems that enabled Egypt to ride out droughts and avoid extreme flooding events that affected neighboring Sudan. Additional engineering structures are recommended to take advantage of the excess Lake Nasser waters (35 km3), now residing in the Tushka lakes. In basins lacking artificial reservoirs, a different response to extreme precipitation events is observed from temporal GRACE solutions. Extreme precipitation events (2011-2022) over northern Arabia (PPT: Hail: 8.43 km3; Ad-Dahna: 2.22 km3 and Medina: 3.71 km3) and central Arabia (PPT: Riyadh: 4.66 km3 and Mecca: 0.21 km3) produced an increase in GRACETWS that lasted for a few months only. Cyclones over Oman (2011and 2015; PPT: 6 and 6.6 km3, respectively) had a similar effect. Findings demonstrate that highly engineered watersheds are better prepared to deal with the projected increase in the frequency and intensity of extreme rainfall and drought events in the 21st century.

How to cite: Sultan, M., Abdelmohsen, K., Saleh, H., and Karimi, H.: Recharge from Reservoirs, Groundwater Flow, and Response to Climate Variability in Arid Basins: Revelations from GRACE Observations, EGU General Assembly 2023, Vienna, Austria, 23–28 Apr 2023, EGU23-9959, https://doi.org/10.5194/egusphere-egu23-9959, 2023.

In Mongolia, overuse and degradation of groundwater is a serious issue. The authors have recently applied a process-based eco-hydrology model, NICE (National Integrated Catchment-based Eco-hydrology) to urban and mining hubs to explicitly quantify spatio-temporal variations in water availability (Nakayama et al., 2021a, 2021b). In this study, NICE was scaled up to the total of 29 river basins in the entire country (Ministry of Nature, Environment and Tourism, 2013). The model simulated the effect of past climatic change and human activity on water resources during 1980-2018 there. The model reasonably reproduced observed river discharge with a maximal value during summer rainfall seasons. The simulation also revealed heterogeneous distributions of hydrologic budget and its response to climatic and anthropogenic disturbances. In addition, the authors detected hot spots of groundwater degradation by anthropogenic activity in the national scale. Analysis of relative contribution of environmental factors further clarified the characteristics in these areas and quantified spatio-temporal trends in groundwater level due to the effects of changes in precipitation and various water uses. Generally, the result showed changes in precipitation had a large effect on changes in groundwater levels until 2000. In contrast, the model clarified human activities have recently had a large impact on groundwater level changes (Banerjee et al., 2014). This trend was particularly conspicuous in river basins with urbanization and mining development such as Orkhon, Kharaa, Tuul, Galba, Ongi, Altain Uvur Govi, and Taats River Basins. This methodology is powerful to resolve future competition for water resources in areas with fewer inventory data that could potentially trigger conflicts between urban, mining, industry, herders and local communities.


References;

Banerjee, R., et al. 2014. 2030 Mongolia: Targeted Analysis on Water Resources Management Issues, https://www.2030wrg.org/mongolia-targeted-analysis-wrm-issues/.

Ministry of Nature, Environment and Tourism. 2013. Basin Boundary Data in Mongolia, Ulaanbaatar.

Nakayama, T., et al. 2021a. Ecological Modelling, doi:10.1016/j.ecolmodel.2020.109404.

Nakayama, T., et al. 2021b. Ecohydrology & Hydrobiology, doi:10.1016/j.ecohyd.2021.07.006.

How to cite: Nakayama, T.: Impacts of anthropogenic activity and climate change on water resources for the whole of Mongolia by using process-based eco-hydrology model, EGU General Assembly 2023, Vienna, Austria, 23–28 Apr 2023, EGU23-10173, https://doi.org/10.5194/egusphere-egu23-10173, 2023.

EGU23-12017 | ECS | Orals | HS2.1.4

The GW-SW dynamics of a perennial dryland river in the semi-arid region, India 

Anukritika Raj, Vikrant Jain, Vivek Kumar Bind, Virendra Padhya, and Rajendrakumar Dattatraya Deshpande

The Groundwater-Surface water (GW-SW) interaction governed by vertical connectivity, drainage pattern, subsurface lithology, vegetation cover, and land use determines the water availability in semi-arid dryland regions. It plays a crucial role in eco-hydrology, effective water resource management and overall socio-economic development in these marginal environments. Furthermore, the perennial dryland rivers flowing through these semi-arid dryland regions undergo substantial precipitation and flow variability, thus making sustainable water management challenging. Nevertheless, an understanding of the GW-SW dynamics, its spatial variability and the processes influencing the water supply in the semi-arid perennial dryland rivers are still lacking. For this purpose, the stable isotopes of oxygen and hydrogen, in terms of δ18O, δ2H and d-excess parameters of water samples, have been used to assess the GW-SW interaction in the semi-arid perennial Mahi River basin, India. The Mahi River has a length of ~560 km and a drainage basin area of ~34k km2. In total, 53 samples of groundwater and 14 samples of river water were collected during the dry season. In a given river transect, GW samples were collected from both river banks at a distance of around 1 km and 2km, respectively. The result shows changes in GW-SW connectivity at the reach scale. The SW in the downstream and middle reaches (36 to 208km from the river mouth) is characterised by a progressive decrease in δ18O from -1.3 ‰ to -2.6‰. The decrease in the δ18O value in the middle and downstream reaches indicates the mixing of depleted GW into the river. The trend changes in the upstream reaches (208 to 491km), where the SW becomes progressively enriched in δ18O from about -2.1‰ to 0.08‰, with reach scale variability. The upstream reaches also show a decrease in d-excess value from -3.2‰ to -7.2‰, along with the increasing δ18O values suggesting enhanced evaporation of SW during the low flow conditions. The average δ18O of SW in the middle and downstream reach is -1.9 ‰, whereas the average δ18O of the upstream reach is -0.5 ‰. The slope of the GW δ18O-δ2H regression line is lower than that of the Global Meteoric Water Line (GMWL), suggesting that the GW undergoes substantial evaporation. The variability of isotopic values and mixing of GW with SW demonstrates that the river channel shows enhanced vertical connectivity for middle and downstream reaches even during the dry season. However, there is vertical disconnectivity in the upstream reaches. This study highlights the need for different management strategies for various reaches of the spatially variable and dynamic perennial dryland rivers in a semi-arid region.

How to cite: Raj, A., Jain, V., Bind, V. K., Padhya, V., and Deshpande, R. D.: The GW-SW dynamics of a perennial dryland river in the semi-arid region, India, EGU General Assembly 2023, Vienna, Austria, 23–28 Apr 2023, EGU23-12017, https://doi.org/10.5194/egusphere-egu23-12017, 2023.

EGU23-13957 | Posters on site | HS2.1.4

On the Evapotranspiration estimates of two contrasting and Heterogenous Ecosystems in Sardinia 

Roberto Corona, Serena Sirigu, Nicola Montaldo, and Gabriel G. Katul

Sardinia island is a reference for ecohydrological studies on past and future climate change effects, representing typical conditions of the western Mediterranean Sea basin. Ecosystems are heterogenous, and trees optimize the use of water through the root systems, uptaking water from the deep layers.

Two micrometeorological towers have been installed in two different sites under different precipitation conditions. The first is installed in Orroli (annual precipitation of about 600 mm), in a patchy mixture of wild olive trees and C3 herbaceous that grow in a shallow under a rocky layer of basalt, partially fractured (soil depth 15 40 cm), with a tree cover percentage of 33% in the footprint. Instead, the second is in a mountainous forest site of Quercus ilex characterized by steeper slopes and rocky outcrops (mean annual precipitation of about 800 mm), and tree cover percentage of 68% in the footprint. In both sites land surface fluxes and CO2 fluxes are estimated using the eddy correlation technique while soil moisture was estimated with water content reflectometers, and periodically leaf area index (LAI) were estimated.

The following objectives are addressed:1) pointing out the dynamics of land surface fluxes, soil moisture and CO2 for two contrasting sites; 2) assess the impact of vegetation dynamics and type on the CO2 and water balance dynamics; 3) evaluate the soil effect on water and energy budgets.

The Orroli site is more controlled by rainfall seasonality, and vegetation species use the source of water stored in the deep rocky layer to sustain their physiological activity. In the Orroli site we found seasonal dynamics in the CO2 flux and in the evapotranspiration (ET) terms, which are higher when grass and woody vegetation species are present and lower when the grass component dies. Instead, we found a constant flux of ET in the Marganai highlighting the high efficiency of tree species in extract the deep sources of water. ET is higher in the Orroli site if the grass species are present in live form, and then LE is higher in the Marganai forest. The ET of Quercus ilex in the Marganai forest seems being not controlled by surface soil moisture, because the annual precipitation is enough for sustain the transpiration needs of that fraction of tree cover. The results confirm a threshold of 700 mm/year of rain, below which rain can restrict tree cover growth.

How to cite: Corona, R., Sirigu, S., Montaldo, N., and Katul, G. G.: On the Evapotranspiration estimates of two contrasting and Heterogenous Ecosystems in Sardinia, EGU General Assembly 2023, Vienna, Austria, 23–28 Apr 2023, EGU23-13957, https://doi.org/10.5194/egusphere-egu23-13957, 2023.

EGU23-14719 | ECS | Posters on site | HS2.1.4

Water level and stable Isotope based river aquifer interaction in different river styles of a semi-arid river 

Yash Duggad, Vikrant Jain, Virendra Padhya, and Rajendra Deshpande

Understanding the groundwater-surface water (GW-SW) interaction is critical for river management, especially in water-stressed regions such as semi-arid and arid areas. The pattern of GW-SW interaction may vary across variable valley settings, floodplain width and river planform.

This study aims to analyse the pattern of GW-SW interaction in different River Styles reaches. The study is carried out in the Sabarmati River basin in using stable isotopes. Sabarmati River is an intermittent River of 419 km in length that drains a 21,085 km2 area in the semi-arid region of Western India. Representative sites of each River Styles were selected for water level measurement and stable isotope samples. The study was conducted in the post-monsoon period of 2021-22, which represents groundwater contribution to river system after major runoff seasons. Samples at each River Styles reach were collected along a cross-section. 1 river water and up to 4 groundwater samples (2 from each bank) were collected along the transect. A total of 48 samples were collected along 11 such transects. The depth of groundwater and stage of river water at each sample site was also measured.


The GW depth and river stage data indicate GW-SW connection for 9 sites (all except 1 are from the upstream region), while was inconclusive for 2 (all in the middle and lower reaches). Stable isotope-based analysis suggests a similar scenario. The upper reaches, which are gaining, have enriched δO18 composition and lower d-excess than the groundwater. The depleted isotopic composition of groundwater indicates faster groundwater recharge from the meteoric water. Such reaches are characterized by boulders and gravel beds. The reach-scale variability of the river from the losing-gaining stream also collaborates with the reach-scale variation of δO18 isotopic values. The losing reach has a depleted δO18 isotopic composition than the groundwater, thus indicating recharge of groundwater from the river water and the impact of evaporation. The integration of the River Styles map and GW interaction study suggests the following – (a) Generally, River Styles that were showing connected and gaining reaches were found to have low sinuosity  (b) River Styles with occasional and discontinuous flood-plains showed an inconclusive result about river aquifer connectivity by both methods (c) For all confined or partly unconfined reaches with bedrock margin-controlled settings, a connected river aquifer system was noted. The study highlights geomorphic control on the important process of GW-SW interaction in a semi-arid river channel.  

Keywords: River style, stable isotope, river-aquifer interaction

How to cite: Duggad, Y., Jain, V., Padhya, V., and Deshpande, R.: Water level and stable Isotope based river aquifer interaction in different river styles of a semi-arid river, EGU General Assembly 2023, Vienna, Austria, 23–28 Apr 2023, EGU23-14719, https://doi.org/10.5194/egusphere-egu23-14719, 2023.

EGU23-15835 | Orals | HS2.1.4 | Highlight

Hydrological processes in the semi-arid small island of Pianosa: a multidisciplinary approach to increase knowledge, awareness and education on a highly climate-sensitive environment (HYDRO-ISLAND project UNESCO’s program) 

Marco Doveri, Matia Menichini, Luca Foresi, Andrea Berton, Letizia Costanza, Ilaria Baneschi, Simone Da Prato, Lorenzo Milaneschi, Brunella Raco, Alessandro Santilano, Sandra Trifirò, Roberto Giannecchini, and Maurizio Burlando

Understanding and quantifying hydrology processes represent a mandatory step in semi-arid and arid regions for defining the vulnerability of these environments to climate change and human pressure, as well as for providing useful data to steer mitigation and resilience strategies. This generally valid concept becomes even more stringent for highly sensitive ecosystems, such as small islands.

It is the case of Pianosa Island (Tuscan Archipelago) that extends a few more than 10 km2 within the Tyrrhenian Sea and it is characterised by a flat morphology (maximum altitude 29 m a.s.l.) and semi-arid climate conditions (550 mm and 17 °C as mean annual precipitation and temperature).

Because of the morphology and the medium-high permeability of superficial bio-calcarenite rocks, superficial water are absent. Nevertheless, the peculiar geological-hydrogeological setting guarantee a storage of groundwater in a phreatic aquifer and semi-confined/confined system, hitherto able to satisfy the local human water demand, mainly tied to seasonal tourism (thousands of visitors/year) and domestic exigencies (less than 30 permanent people). Evapotranspiration represents the most important voice of the water budget, given the windy and relative high temperature conditions.

In the precarious hydro-equilibrium for biosphere and human communities, and considering sea-level rise and climate regime trends that the Mediterranean is experiencing, HYDRO-ISLAND project (UNESCO’s program) intends to deploy a multi-disciplinary approach (geology, hydrogeology, geochemistry, geophysics, remote sensing-smart technology) for better understanding and quantifying the hydrological processes affecting the water availability and for sharing data and transfer knowledge to the community and younger generations, possibly suggesting best practices for water sustainability.

First results pointed out as over the last decade the annual rainfall weakly tended to increase, but at the same time such increasing resulted concentrated in summer and autumn seasons, whereas during winter and spring a decreasing tendency is even observed. This precipitation regime has led to a major rate of evapotranspiration and minor effective infiltration that caused a decreasing of piezometric level over several years. Quantity and chemical-isotopic features of rainfall and effective infiltration water measured/collected by a raingauge and a high precision lysimeter describe the hydrological processes at soil level and characterize the rate and seasonality of groundwater recharge in an experimental site. Using multispectral data by drone, we are trying to extend the experimental site information to a wider area in order to understand the general behaviour at island scale. Measurements, water sampling and analyses for shallow and deep wells, together with the study of geological constraints, are highlighting the distribution and relationship among different groundwater components, including the seawater that intrudes the aquifer from the SE side of the island. Furthermore, the comparative analyses of continuative data monitoring in wells and weather station showed the presence of possible concentrated water infiltration processes during rainfall extreme events that induce a quick response of groundwater systems in terms of water level rise and decrease of electrical conductivity. Thus, elements of vulnerability of the aquifer to pollution are pointed out, as well as the possibility to provide technical solutions for enhancing water infiltration and groundwater availability.             

How to cite: Doveri, M., Menichini, M., Foresi, L., Berton, A., Costanza, L., Baneschi, I., Da Prato, S., Milaneschi, L., Raco, B., Santilano, A., Trifirò, S., Giannecchini, R., and Burlando, M.: Hydrological processes in the semi-arid small island of Pianosa: a multidisciplinary approach to increase knowledge, awareness and education on a highly climate-sensitive environment (HYDRO-ISLAND project UNESCO’s program), EGU General Assembly 2023, Vienna, Austria, 23–28 Apr 2023, EGU23-15835, https://doi.org/10.5194/egusphere-egu23-15835, 2023.

EGU23-16423 | Posters on site | HS2.1.4

Enhancing Urban Resilience to flooding using Afforestation: the case of Nouakchott city, Mauritania 

Paolo Perona, Emmanuel Dubois, Montana Marshall, Fatimetou Boukhreiss, Saleck Moulaye Ahmed Cherif, Jerôme Chenal, and Charlotte Grossiord

Despite a warm and dry climate, the city of Nouakchott has been facing constant flooding for almost a decade, making part of the city inhabitable and posing long-term health threats. Groundwater levels are relatively constant over the year, except for October, when the groundwater table rises at the end of the rainy season, resulting in an almost doubled flooded area in the city compared to drier periods. Saltwater intrusion maintains a constant level in the water table beneath the city. However, the infiltration of most of Nouakchott’s used water acts as systematic artificial aquifer recharge, thus increasing the risk of groundwater saturation excess and flooding. Hence, in comparison to the driest decade (1971-1980), flooding in the city today cannot only be attributed to the slight increase in precipitation over the last decade. This project hypothesizes that increasing the resilience to urban flooding in the city of Nouakchott can be achieved by using salt-tolerant plants to lower the water table level. This work presents a joined interdisciplinary ecohydrology and plant physiology approach for monitoring and modeling the transpiration and dewatering capacity of different local tree species. The project aims to provide scenarios for an integrated and sustainable afforestation strategy for Nouakchott. In addition to increasing the city’s resilience to flooding, the role that afforestation could play to enhance the provision of sustainable services for the people and the economy (e.g., shade in the streets, potential fruit harvesting and wood market, etc.) will also be discussed. The first field campaign of the project allowed to monitor five observation wells with automatic water depth measurements and 12 sap flow sensors on three tree species. Eventually, to reinforce the relatively scarce groundwater data, a spatiotemporal time series of the city's flooded areas was also reconstructed using remote sensing data, and its reliability to calibrate an eco-hydrogeological model will be discussed.

How to cite: Perona, P., Dubois, E., Marshall, M., Boukhreiss, F., Ahmed Cherif, S. M., Chenal, J., and Grossiord, C.: Enhancing Urban Resilience to flooding using Afforestation: the case of Nouakchott city, Mauritania, EGU General Assembly 2023, Vienna, Austria, 23–28 Apr 2023, EGU23-16423, https://doi.org/10.5194/egusphere-egu23-16423, 2023.

EGU23-17048 | ECS | Orals | HS2.1.4 | Highlight

Response of ecological restoration to rainfall in arid zones 

Yiben Cheng, Xuying Bai, Xiaoxu Ma, Zhiming Xin, Wei Feng, Wenbin Yang, and Jinxin Zhou

Rainfall in arid and semi-arid areas converts faster in the local SPAC system. Deluge in drylands may be an important source of groundwater recharge. We have been conducting a thirty-year observational in the Mu Us sandy land at the northwest China, we use remote sensing imagery to observe changes in the water body area and in situ observations to monitor rainfall infiltration. A total of 30 periods of Landsat remote sensing images were processed using the Google Earth platform to obtain the characteristics of surface water body changes. The results show that there are strong seasonal characteristics in the changes of water bodies area in the Mu Us sandy land, with two peaks in April and August, and the inter-monthly area increases of 44.867 km2 (28.60%) and 47.832 km2 (28.31%) respectively. 379.770 km2 to 275.492 km2, a total reduction of 104.278 km2 (27.46%). Deep soil as a percentage of annual precipitation of woodland, shrubland, grassland, farmland and bare land were 2.88%, 17.36%, 3.64%, 1.21% and 44.30%, respectively. The change in the water body area in the Mu Us sandy land is mainly influenced by three factors, rainfall, vegetation coverage, and human activities, with a correlation coefficient of 0.57 (α=0.05) between rainfall and water body area. The correlation coefficients were 0.79, 0.79 and 0.86 (α=0.05) for the years 1991-1997, 1998-2005 and 2006-2017, respectively; vegetation coverage and water body area were negatively correlated overall in 30 years. The correlation coefficient was 0.57 (α=0.05), indicating that human activities in the Mu Us sandy land have a greater impact and human activities in the sands should be reduced in order to manage the sands.

How to cite: Cheng, Y., Bai, X., Ma, X., Xin, Z., Feng, W., Yang, W., and Zhou, J.: Response of ecological restoration to rainfall in arid zones, EGU General Assembly 2023, Vienna, Austria, 23–28 Apr 2023, EGU23-17048, https://doi.org/10.5194/egusphere-egu23-17048, 2023.

EGU23-496 | ECS | Orals | HS2.1.5

Influence of forest cover on the spatio-temporal heterogeneity of the isotopic composition of precipitation at the small catchment scale 

Pauline Saurat, Pilar Llorens, Loujain Alharfouch, and Jérôme Latron

Forest cover influence the isotopic composition of precipitation before it eventually reaches the ground, especially through rainfall interception processes. Many plot scale recent studies focusing on throughfall and stemflow fluxes have demonstrated the role of forest canopy cover in (mostly) enriching their isotopic signature. However, the common approach in small catchments (even forested ones) remains to sample rainfall only at one single location (generally in an open area), assuming that the spatial variability of the isotopic composition of precipitation is small. Only a handful of studies have focused on the spatial variability of the isotopic composition of precipitation, and very few have included the role of forest cover. Nonetheless, a correct characterization of the isotopic composition of the incoming precipitation is essential in isotope-based catchment hydrology, for example to proceed hydrograph separation, as well as for process understanding or models development.

The aim of this study is to investigate the spatio-temporal variability of the isotopic composition of precipitation in a small Mediterranean catchment (0.6 km²) where forest cover roughly 2/3 of the catchment. Precipitation was sampled at the event scale in 31 locations across the catchment with bulk collectors consisting of plastic funnels (130mm diameter) connected to a 0.5-L plastic bin positioned 100cm above ground before each rain event and collected the day after. The sampling locations were distributed ±80m along 5 elevation lines every 50m (from 1150 to 1350m), 15 in open areas and 16 under forest (i.e., collecting throughfall). The percentage of canopy cover above each sampling location was determined using hemispherical photographs. For all events, rainfall was also measured every 5min at 3 locations with tipping bucket rain gauges and meteorological variables at 2 locations (at the ground level and above the forest canopy). Sampled events were analysed both altogether and separating open areas and under forest locations to determine the factors affecting the spatio-temporal variability of the isotopic composition of precipitation at the catchment scale and their relative influence.

Results show that mean δ18O of the events for the whole catchment varied from -11.96 to -3.6‰ along the year, with a mean coefficient of variation of 39%. Locations under forest were always more enriched than in open areas at the same elevation (+0.67‰ on average). Data analysis using the time stability approach (Vachaud et al., 1985) showed that forest locations had lower persistence of δ18O spatial patterns than open areas, indicating that spatial variability of isotopic composition was less predictable in forest locations compared to open areas. The elevation effect on δ18O, often observed in open area locations, was much less apparent in forest locations, confirming that forest introduced additional complexity on the spatial variability of the isotopic signal. Our findings highlight the actual need of taking into account the effect of both elevation and forest cover to assess a catchment scale representative isotopic composition of precipitation.

How to cite: Saurat, P., Llorens, P., Alharfouch, L., and Latron, J.: Influence of forest cover on the spatio-temporal heterogeneity of the isotopic composition of precipitation at the small catchment scale, EGU General Assembly 2023, Vienna, Austria, 23–28 Apr 2023, EGU23-496, https://doi.org/10.5194/egusphere-egu23-496, 2023.

EGU23-1457 | Posters on site | HS2.1.5

Changes in saturated hydraulic conductivity during forest regrowth over 10 years in the humid tropics 

Sibylle K. Hassler, Jefferson S. Hall, Michiel van Breugel, and Helmut Elsenbeer

Landscapes in the humid tropics are undergoing change in land cover. Besides ongoing deforestation of old-growth forest there is also natural regrowth and active reforestation. These changes in land cover affect soil hydrological properties, eg. saturated hydraulic conductivity (Ks), and thus influence hydrological flow paths. While it has been well documented that removing forest in favour of pasture establishment frequently leads to soil compaction and hence increased occurrence of overland flow and erosion, the effect of reforestation on soil hydraulic properties is less studied, especially not in terms of longer time series of forest regrowth.

We monitored the development of Ks in three reforested catchments in the Panama Canal Watershed, two reforestation trials with native species and teak and a secondary succession, over the course of 10 years. We measured Ks on undisturbed soil cores from the depths of 0-6 and 6-12 cm, applying the constant-head method. We compare the results to a previous study based on a space-for-time substitution in the same area.

Our results show a marked increase in Ks variability in both depths after the first five years of measurement. This points to a non-uniform influence of vegetation development across the catchments. Median Ks values in the topsoil increased at all three reforestation sites over the course of the monitoring period and reached values that considerably exceeded those previously measured in 100 year-old forests in the region, which appears at odds with an assumed continuous increase of Ks with increasing forest age. Further comparisons with soil and vegetation characteristics will be used to explain this apparent contrast.

How to cite: Hassler, S. K., Hall, J. S., van Breugel, M., and Elsenbeer, H.: Changes in saturated hydraulic conductivity during forest regrowth over 10 years in the humid tropics, EGU General Assembly 2023, Vienna, Austria, 23–28 Apr 2023, EGU23-1457, https://doi.org/10.5194/egusphere-egu23-1457, 2023.

EGU23-2052 | Posters virtual | HS2.1.5

The climate-vegetation interactions and subsequent hydrological effect of a subtropical forested watershed, central Taiwan 

Chung-Te Chang, Jun-Yi Lee, Jyh-Min Chiang, Hsueh-Ching Wang, and Jr-Chuan Huang

Vegetation growth is sensitive to climatic variations which has a critical implication for hydrological regimes. However, the intertwined associations of climate-phenology-hydrology have rarely been explored in tropical/subtropical regions particularly. In this study, we synthesize hydroclimate records in forested watershed, central Taiwan for last five decades (1975-2020), and the results indicate that the incidences of meteorological and hydrological droughts are becoming prominent after 2001. We further examine the influences of temperature and precipitation on vegetation growth of watershed scale using EVI (enhanced vegetation index) derived from MODIS (Moderate Resolution Imaging Spectroradiometer) at monthly scale, and explore the effects of seasonal precipitation on the variations of landscape phenology and following watershed streamflow between 2001 and 2020. The EVI and temperature shows a linear relationship (R2 = 0.50, p < 0.001) without time-lag effect, whereas EVI and precipitation exhibits a log-linear relationship with two months lag (R2 = 0.40, p < 0.001), showing the accumulative rainfall during relatively dry period (winter-spring) is crucial for vegetation growth. Structural equation modeling reveals that earlier start of growing season (SOS) caused by relatively high spring rainfall (February-March) leads to longer growing season (LOS) and higher P-Q deficit (precipitation minus runoff) during the growing season. Nevertheless, the large amount of precipitation during growing season has no effect on the end of growing season (EOS), LOS and P-Q deficit. Realizing the vegetation growth responding to climatic variations is necessary for current and future hydrologic regime, especially under changing climate.

How to cite: Chang, C.-T., Lee, J.-Y., Chiang, J.-M., Wang, H.-C., and Huang, J.-C.: The climate-vegetation interactions and subsequent hydrological effect of a subtropical forested watershed, central Taiwan, EGU General Assembly 2023, Vienna, Austria, 23–28 Apr 2023, EGU23-2052, https://doi.org/10.5194/egusphere-egu23-2052, 2023.

EGU23-2852 | Orals | HS2.1.5

Early greenup impact on seasonal streamflow and soil moisture dynamics in humid, temperate forests 

Taehee Hwang, Lawrence Band, Christopher Oishi, and Hojeong Kang

Ongoing warming due to climate change has generally led to lengthened growing seasons and subsequent changes in evapotranspiration (ET) and streamflow seasonality. This has been well studied in seasonally dry, snowmelt dominated watersheds, but not in humid, temperate forested watersheds without significant seasonal snowmelt. In this study, we investigate how seasonal streamflow patterns have responded to variability in vegetation phenology in the southern Appalachians over the last four decades. We characterize seasonal shifts in low-frequency streamflow peaks using 50th percentiles of cumulative daily precipitation, streamflow, and soil moisture measurements, and investigate interactions with remotely sensed, long-term greenup anomalies in the deciduous-dominated forested watersheds. After removing a dominant precipitation control, one-day earlier greenup is associated with about one-day early spring flow peak at the low-elevation deciduous catchment. This indicates that the strong dependency of seasonal flow regimes on precipitation is mediated by warming-induced extended growing season, especially by early greenup. In contrast, we find less significant correlations of the greenup anomalies on flow percentiles of an adjacent evergreen and a high-elevation deciduous catchment. At a plot scale, similar correlations of cumulative soil moisture days were found only at an upslope topographic position, where precipitation also showed tighter coupling with soil moisture patterns than downslope. This indicates that early greenup in deciduous forests leading to early ET increase, in turn results in early soil moisture dry-down patterned by hillslope positions, and earlier seasonal streamflow peaks and subsequent declines. Our study suggests that spring flow peaks are likely to shift earlier by warming-induced early greenup even in snow-free regions, which has great implications for future freshwater availability in the southeastern US.

How to cite: Hwang, T., Band, L., Oishi, C., and Kang, H.: Early greenup impact on seasonal streamflow and soil moisture dynamics in humid, temperate forests, EGU General Assembly 2023, Vienna, Austria, 23–28 Apr 2023, EGU23-2852, https://doi.org/10.5194/egusphere-egu23-2852, 2023.

EGU23-2853 | ECS | Posters on site | HS2.1.5

Deforestation alters dissolved organic carbon and sulfate dynamics in a mountainous head water catchment—A wavelet analysis 

Qiqi Wang, Yuquan Qu, Kerri-Leigh Robinson, Heye Bogena, Alexander Graf, Harry Vereecken, Albert Tietema, and Roland Bol

Deforestation has a wide range of effects on hydrological and geochemical processes. Dissolved organic carbon (DOC) dynamics, a sensitive environmental change indicator, is expected to be affected by deforestation, with changes in atmospheric sulfur (S) deposition compounding this. However, how precisely anthropogenic disturbance (deforestation) under a declining atmospheric S input scenario affects the underlying spatiotemporal dynamics and relationships of river DOC and sulfate with hydro-climatological variables e.g., stream water temperature, runoff, pH, total dissolved iron (Fetot), and calcium (Ca2+) remains unclear. We, therefore, examined this issue within the TERENO Wüstebach catchment (Eifel, Germany), where partial deforestation had taken place in 2013. Wavelet transform coherence (WTC) analysis was applied based on a 10-year time series (2010–2020) from three sampling stations, whose (sub) catchment areas have different proportions of deforested area (W10: 31%, W14: 25%, W17: 3%). We found that water temperature and DOC, sulfate, and Fetot concentrations showed distinct seasonal patterns, with DOC averaging concentrations ranging from 2.23 (W17) to 4.56 (W10) mg L-1 and sulfate concentration ranging from 8.04 (W10) to 10.58 (W17) mg L-1. After clear-cut, DOC significantly increased by 59, 58% in the mainstream (W10, W14), but only 26% in the reference stream. WTC results indicated that DOC was negatively correlated with runoff and sulfate, but positively correlated with temperature, Ca2+, and Fetot. The negative correlation between DOC with runoff and sulfate was apparent over the whole examined 10-year period in W17 but did end in W10 and W14 after the deforestation. Sulfate was highly correlated with stream water temperature, runoff, and Fetot in W10 and W14 and with a longer lag time than W17. Additionally, pH was stronger correlated (higher R2) with sulfate and DOC in W17 than in W10 and W14. In conclusion, WTC analysis indicates that within this low mountainous forest catchment deforestation levels over 25% (W10 and W14) affected the coupling of S and C cycling substantially more strongly than “natural” environmental changes as observed in W17.

How to cite: Wang, Q., Qu, Y., Robinson, K.-L., Bogena, H., Graf, A., Vereecken, H., Tietema, A., and Bol, R.: Deforestation alters dissolved organic carbon and sulfate dynamics in a mountainous head water catchment—A wavelet analysis, EGU General Assembly 2023, Vienna, Austria, 23–28 Apr 2023, EGU23-2853, https://doi.org/10.5194/egusphere-egu23-2853, 2023.

EGU23-3830 | ECS | Posters on site | HS2.1.5

Soil moisture and temperature dynamics in juvenile and mature forest as a result of tree growth, hydrometeorological forcings, and drought. 

Andrea Rabbai, Doris E. Wendt, Giulio Curioni, Susan E. Quick, A. Robert MacKenzie, David M. Hannah, Nicholas Kettridge, Sami Ullah, Kris M. Hart, and Stefan Krause

Afforestation, as one of the major drivers of land cover change, has the potential to provide a wide range of ecosystem services (ES). Aside from carbon sequestration, it can improve hydrological regulation by increasing soil water storage capacity and reducing surface water runoff.  However, afforested areas are rarely studied at the appropriate time scale to determine when changes in soil hydrological processes occur as the forest grows. This study investigates the seasonal soil moisture and temperature dynamics, as well as the event-based responses to precipitation events and dry periods between a mature and juvenile forest ecosystem over a 5-year time period. Generally, soil moisture was higher in the juvenile forest than in the mature forest, indicating less physiological water demand. However, following the 2018 drought, soil moisture dynamics in the growing juvenile plantation began to match those of the mature forest, owing to canopy development and possibly also to internal resilience mechanisms of the young forest to external perturbations. On the other hand, soil temperature dynamics in the juvenile plantation followed air temperature patterns closely, indicating lower thermal regulation capacity compared to the mature forest. While our findings reveal that an aggrading juvenile plantation achieves mature forest soil moisture dynamics at an early stage, well before maturity, this was not the case for soil temperature. Our results shed light on long-term trends of seasonal and event-based responses of soil moisture and temperatures in different-aged forest systems, which can be used to inform future assessments of hydrological and ecosystem responses to disturbances and forest management.

How to cite: Rabbai, A., Wendt, D. E., Curioni, G., Quick, S. E., MacKenzie, A. R., Hannah, D. M., Kettridge, N., Ullah, S., Hart, K. M., and Krause, S.: Soil moisture and temperature dynamics in juvenile and mature forest as a result of tree growth, hydrometeorological forcings, and drought., EGU General Assembly 2023, Vienna, Austria, 23–28 Apr 2023, EGU23-3830, https://doi.org/10.5194/egusphere-egu23-3830, 2023.

EGU23-4325 | ECS | Posters on site | HS2.1.5 | Highlight

Estimation of rainfall interception from merged drone and terrestrial LiDAR data by modeling 3D canopy structure in plantation forest 

Yupan Zhang, Yuichi Onda, Yiliu Tan, Hangkai You, Thuy Linh Pham, Asahi Hashimoto, Chenwei Chiu, Takashi Gomi, and Shiori Takamura

The multidimensional arrangement of upper canopy features is a physical driver of energy and water balance under various canopies, and standard modeling approaches integrate leaf area index (LAI) and canopy closure (CC) to describe canopies. However, it is unclear how the canopy affects the component and interception of rainfall within the forest system. We generated multi-layered forest point clouds from trunk to canopy using fusion of drone and terrestrial LiDAR data then classified wood and foliage elements using a clustering algorithm to build a high precision physical model for describing throughfall, stemflow and interception. The experiment was conducted in the thinning plantation forest located in Tochigi prefecture, Japan. Rainfall observation for the three components is important for model development. Throughfall was computed from 20 rain gauges distributed on a grid under the forest canopy, 3 stemflow collectors was set up around the tree trunks connected to a bucket with water level sensor. We developed a capacity model to describe canopy saturation with foliage points, a voxel-based method was used to create 3D representations of forest canopies, and an analysis of these point-derived canopy structures and volume were performed to assess the canopy's capacity to contain rainfall. For stemflow modeling, we use a runoff model to simulate the additional rainfall accumulates to the tree trunk through branches when the tree canopy is saturated. Preliminary simulation results show that: (1) fusion and registration of drone and terrestrial LiDAR data can greatly improve the point cloud accuracy and enrich the information contents such as coordinate geo-reference and filling of missing structures; (2) a strong correlation between the rainfall observed canopy interception results and the estimated canopy volume, and the volume-based interception prediction model has a high accuracy, with an R2 from 0.84 to 0.91 compared to past observations. (3) stemflow is related to the projected volume of the canopy and the proportion of wooden structure point clouds, and as the runoff path increases, there is a greater probability that oversaturated precipitation will concentrate on the trunk rather than drip off. High accuracy physical model of tree canopy can well describe the interactions between the rainfall to canopy and illustrate the mechanism.


How to cite: Zhang, Y., Onda, Y., Tan, Y., You, H., Pham, T. L., Hashimoto, A., Chiu, C., Gomi, T., and Takamura, S.: Estimation of rainfall interception from merged drone and terrestrial LiDAR data by modeling 3D canopy structure in plantation forest, EGU General Assembly 2023, Vienna, Austria, 23–28 Apr 2023, EGU23-4325, https://doi.org/10.5194/egusphere-egu23-4325, 2023.

EGU23-6746 | Orals | HS2.1.5

Modeling interactions of water fluxes with species and structural diversity in temperate forests 

Friedrich J. Bohn, Sabine Attinger, Charlotte Kihm, and Anke Hildebradt

Ecosystem functions of temperate forests are expected to be severely impacted by future climate change - particularly hydro-meteorological extremes (heavy precipitation events, droughts, and heat waves) that will increase in frequency, duration, magnitude, and extent. Previous studies have shown that both structural and tree species diversity may act as buffers against the impacts of climate extremes.

To better understand the influence of structural and tree species diversity, we use two models to analyze the influence of species and structural diversity on hydrologic dynamics during recent drought events. The well-equipped test sites are located in central Germany and represent typical forests in this area. One model is the individual forest gap model FORMIND. Using a newly developed technique, it allows us to analyze local heterogeneous patterns on a 2 meter scale of carbon and water cycling, flow, and water stress, and their relationship to structural and species diversity. The second model is mHM, a mesoscale hydrological model. We parameterize mHM for two catchments in central Germany (Nägelstedt and Upper Saale). We further analyze the relevance of local heterogeneity in structural and species diversity and the resulting local heterogeneity in water fluxes on the fluxes at the mesoscale.

This two-model and interdisciplinary workflow allows us to consider various soil-plant-atmosphere interactions in drought disturbed ecohydrological systems

How to cite: Bohn, F. J., Attinger, S., Kihm, C., and Hildebradt, A.: Modeling interactions of water fluxes with species and structural diversity in temperate forests, EGU General Assembly 2023, Vienna, Austria, 23–28 Apr 2023, EGU23-6746, https://doi.org/10.5194/egusphere-egu23-6746, 2023.

EGU23-8182 | Posters on site | HS2.1.5

Climate and land use induced changes in evapotranspiration - experimental evidence from a forested catchment in Germany 

Thomas Pluntke, Christian Bernhofer, Thomas Grünwald, Maik Renner, and Heiko Prasse

Climate changes are expected to trigger changes in all water budget components at any scale. For Central Europe, higher evapotranspiration (ET) rates are already observed, other factors like land use or land cover characteristics change in parallel, but experimental evidence of the interdcations is limited, as it requires challenging long-term measurements. We take advantage of the well-documented hydro-meteorological dataset from the forested research catchment Wernersbach in Saxony, Germany, covering 52 years between 1968 and 2019 (Pluntke & Bernhofer et al., 2023).

We analyzed hydro-climatological time-series for linear trends and for breakpoints. Significant positive trends were found for global radiation, mean air temperature and grass-reference evaporation, as well as for the difference between catchment precipitation and runoff (P-R; hydrological estimate of ET). Precipitation increased and runoff decreased over the 52 years, but not significantly.

Air temperature and global radiation show significant breakpoints around 1988 and 1996, respectively, with below average conditions before and above average conditions after the breakpoints. Temperature change is associated with global warming, and possibly with the independent regional effect of air pollution. Since the 1960s, large sulphur dioxide emissions from fossil fuel burning led to a high aerosol density in the troposphere reducing solar radiation over most of Europe and North America. While this effect was reduced by filtering the emissions elsewhere in the early 1980s, it continued in neighboring parts of today’s Germany, Poland, and Czech Republic until the early 1990s. Breakpoint of grass reference evaporation coincides with air temperature (1988), and the breakpoint of P-R is a few years later.

We attributed changes in ET to changes in land use and climate by applying an adapted Budyko framework and enabled insights into their interactions. The sulphur dioxide emissions triggered widespread forest dieback in regions over 600 m in Saxony. Consequences were decreasing ET in the 1970s/1980s. The Wernersbach catchment (390 m) shows a similar tendency (not significant). Since the 1990s, both climate (increasing atmospheric demand) and land use (healthier forest stands and improved management practices) led to an increase of ET. In 2010s, climate induced damages of forest stands (due to droughts, storms, snow load, and bark beetle infestations) led to a drastic decrease of ET in Wernersbach despite favorable climatic conditions for ET. Since the intensity and frequency of such extreme events are likely part of climate change, they may cause greater regional changes in the water balance than direct effects of climate change, and may cause lasting damage to Ecosystem Services of forests, like flood mitigation, or carbon sequestration.

Our results show the need for climate adaptation measures in forests, such as the establishment of a more site-specific mixed forest, and a sustainable  forest management.


References

Pluntke T. & Bernhofer C., Grünwald T., Renner M., Prasse H.: Long-term climatological and ecohydrological analysis of a paired catchment – flux tower observatory near Dresden (Germany). Is there evidence of climate change in local evapotranspiration? J Hydrol 617 (2023), https://doi.org/10.1016/j.jhydrol.2022.128873

How to cite: Pluntke, T., Bernhofer, C., Grünwald, T., Renner, M., and Prasse, H.: Climate and land use induced changes in evapotranspiration - experimental evidence from a forested catchment in Germany, EGU General Assembly 2023, Vienna, Austria, 23–28 Apr 2023, EGU23-8182, https://doi.org/10.5194/egusphere-egu23-8182, 2023.

Throughout the Caribbean, hillside quarrying has become a common practice. While these activities remove large sections of the critical soil zone, very little work has been done on how hillside quarrying impacts rainfall runoff response and catchment water storage. We hypothesised that the removal of the critical soil zone during hillside quarrying will increase the timing and magnitude of streamflow response to storm events due to its close proximity to the river, while also reducing the overall storage of the watershed. The aim of this study is to understand the landuse impacts on rainfall runoff response and catchment storage. A paired catchment study between the 3.6 km2 Acono (forested) and the adjacent 3.6 km2 Don Juan (quarried) watersheds in Trinidad and Tobago was conducted using a hydrometric and geochemical approach. Direct measurements of rainfall and streamflow and bi-weekly water sample collections for geochemistry and stable isotopes of 18O and 2H from rainfall, baseflow, soils, springs and groundwater were done. Fraction of young water (Fyw) an inverse transit time proxy was computed along with the mean transit time distributions (MTTDs) by sine wave fitting were used as important descriptors of runoff generation and the catchment storage. The quarried watershed had higher streamflow levels during the wet season than the forested watershed. However, during the dry season there is a reversal.. The quarried watershed responded faster to rainfall events with a lag time between 1–3 hours with a higher peak rate of streamflow versus a lag time of 2-4 hours in the forested watershed with a lower peak rate of flow. In the upper quarried watershed 18.4 % of the stream water were younger than 0.46 years and 20.3% were younger than 0.55 years in the lower portion of the catchment. In the upper forested catchment 5.2 % of the stream water was younger than 2.71 years whereas 4.7% of the stream water was younger than 3.04 years in the lower catchment. The data suggest that the quarry leads to the faster delivery of water during storm events while also reducing the overall storage in the catchment. With an anticipated increase in hillside quarrying, this study provides important information for land use and water resource managers.

How to cite: Farrick, K. and Mathura, N.: Hillside Quarry Impacts on Streamflow and Stormflow response in a Tropical Watershed:  A Geochemical and Hydrometric Investigation, EGU General Assembly 2023, Vienna, Austria, 23–28 Apr 2023, EGU23-9930, https://doi.org/10.5194/egusphere-egu23-9930, 2023.

EGU23-10827 | ECS | Orals | HS2.1.5

Dynamic processes require appropriate methods to capture them: Why in-situ water stable isotope monitoring needs to become a standard method in forest hydrological research 

Matthias Beyer, Kathrin Kuehnhammer, Joost van Haren, Angelika Kuebert, Christian Birkel, Ricardo Sanchez-Murillo, and John Marshall

As a consequence of global change, forests worldwide are undergoing a restructuring process. The expectations for forests of the future are ambitious: Providing resilient forest ecosystems that capture large amounts of carbon but also provide stable groundwater recharge rates. To balance the interests of both forestry and water management authorities, scientists and practitioners need to be able to investigate and predict which forest types and combinations of tree species are most likely to fulfill these needs.

Methods based on the analysis water stable isotopes have been used extensively for studying water uptake depths of vegetation, groundwater recharge, transit times, and water sources in general. Despite being arguably the superior tool when not only amounts but also knowledge of the sources of an (eco-)hydrological flux are needed, the highly dynamic nature of water transport processes within the soil-plant-atmosphere continuum (SPAC) could hardly be captured in the past. With the advent of  laser spectroscopy in the last decade, we are now able to measure water stable isotopes continuously and in all compartments of the SPAC.

In this keynote, we present and review the most recent advances (2016-now) of combined soil and plant in-situ water isotope measurements carried out in different ecosystems worldwide. We then critically discuss the gain in process-understanding of in-situ monitoring approaches and demonstrate how in-situ methods could be integrated with traditional and novel methods to advance forest hydrology.

In-situ and semi-in-situ (i.e., sampling of water vapor) water stable isotope methods have been greatly improved within the last five years. Initial disadvantages (e.g., comparability to traditional methods, complicated & laborious setup & maintenance, expensive) have been carefully addressed, and improvements have been implemented. Recent research has proven that i.) highly dynamic and heterogenous processes (e.g., stem flow, groundwater recharge through preferential pathways, change of uptake depths in response to rainfall/drought, disentangling water use of different tree species in mixed forests) can be captured exceptionally well using in-situ isotope methods; ii.) water-vapor equilibration methods represent the isotope composition of mobile water better compared to destructive methods, and iii.) using continuous water isotope data reduces parameter uncertainties in SPAC modeling.

In summary, we state that the benefits of using in-situ or semi in-situ techniques outweigh the disadvantages by far and strongly encourage the water stable isotope community to integrate them regularly into studies of dynamic soil-plant-atmosphere feedbacks.

How to cite: Beyer, M., Kuehnhammer, K., van Haren, J., Kuebert, A., Birkel, C., Sanchez-Murillo, R., and Marshall, J.: Dynamic processes require appropriate methods to capture them: Why in-situ water stable isotope monitoring needs to become a standard method in forest hydrological research, EGU General Assembly 2023, Vienna, Austria, 23–28 Apr 2023, EGU23-10827, https://doi.org/10.5194/egusphere-egu23-10827, 2023.

EGU23-12766 | ECS | Posters on site | HS2.1.5

DOC mobilisation from forest soils governed by intermittent hydrological connectivity of subsurface water pools 

Sean Adam, Maximilian Lau, and Conrad Jackisch

Climate change in combination with forest management practices is leading to increased DOC release from a forested reservoir catchment in the western Ore Mountains in Germany. The most significant sources of DOC loadings are likely several disturbed patches of former peatland in the catchment. We suspect that the soil water availability and subsequent variable hydrological connectivity of water pools in the shallow subsurface could be major factors for DOC mobilisation impeding the drinking water production in the region.

We present data from almost one year of intensive monitoring in two small catchments (1 ha) located on i) a shallow histosol with a highly compacted mineral subsoil and ii) a regolithic cambisol. Catchment drainage was constantly observed for water levels and in situ spectroscopy to infer discharge rates and DOC concentrations. Soil moisture and temperature, surface temperature and irradiation were continuously measured along the slope gradient. During monthly campaigns in the vegetation period, pore water samples were taken from high and low points of 15 m grid cells spanning the catchments.

In our poster, we would like to discuss our findings that pore water availability is non-uniformly distributed suggesting discrete subsurface flow paths in the catchments. In low moisture conditions, subsurface water pools can be isolated from the pore water network. We argue that disconnected pools accumulate DOC during low moisture conditions, which is then released when the pools are reconnected during strong precipitation events.

How to cite: Adam, S., Lau, M., and Jackisch, C.: DOC mobilisation from forest soils governed by intermittent hydrological connectivity of subsurface water pools, EGU General Assembly 2023, Vienna, Austria, 23–28 Apr 2023, EGU23-12766, https://doi.org/10.5194/egusphere-egu23-12766, 2023.

EGU23-12770 | Posters on site | HS2.1.5

Soil moisture regime under different forest types 

Václav Šípek, Nikol Zelíková, Lukáš Vlček, Jitka Toušková, and Miroslav Tesař

An understanding of the spatial and temporal variation of soil moisture is essential for studying other hydrological, biological, or chemical soil processes, such as water movement, microbial activity, and biogeochemical cycling. The study focuses on the description of soil water dynamics at several sites with different types of forests and their health status. Specifically, the results are based on the thorough description of the soil water regime under spruce forest in two mountainous plots. At one plot the measurements are supplemented with site influenced by bark beetle attack and at another site the comparison with beech forest. The analysis was based on soil water regime measurements from several vegetation seasons (comprising wet and dry years). We investigated both column average soil water content and also its vertical distribution. The water balance of the soil column was studied by the bucket-type soil water balance model.

It was shown that the forest type is an important factor controlling the rate of evapotranspiration which in turn influences the soil water regime, especially in dry periods. In wet periods, the differences among particular sites were negligible. In dry periods, the soil was slightly wetter in the site affected by the bark beetle outbreak in the surface soil layer and drier in the deeper soil layer. Similarly, the beech and spruce forest differences were most pronounced in dry periods. In this case, the beech forest was more efficient in terms of evapotranspiration water consumption which resulted in drier soil compared to spruce covered plot. In the spruce site, the soil was regularly drier only at the beginning of the season which was given by different interception rates during winter. The differences between spruce and beech forest were based namely on the water consumption efficiency and differences in interception rates, vertical distribution of the roots, and soil hydraulic properties.

This research was supported by the Technological Agency of the Czech Republic (SS05010124), SoilWater project (EIG CONCERT-Japan), and the institutional support of the Czech Academy of Sciences, Czech Republic (RVO: 67985874).

How to cite: Šípek, V., Zelíková, N., Vlček, L., Toušková, J., and Tesař, M.: Soil moisture regime under different forest types, EGU General Assembly 2023, Vienna, Austria, 23–28 Apr 2023, EGU23-12770, https://doi.org/10.5194/egusphere-egu23-12770, 2023.

EGU23-13089 | ECS | Orals | HS2.1.5 | Highlight

Large-scale shifts in transpiration dynamics following bark beetle infestation: Stomatal conductance responses 

Ye Su, Meijun Li, Wei Shao, and Jerker Jarsjö

Tree mortality triggered by bark beetle infestation can significantly affect terrestrial carbon and water balances. However, how to improve the parameterization of the stomatal conductance to express the dynamics of ecosystem disturbance remains unclear. A subalpine forest located in the Rocky Mountains experienced a severe bark beetle outbreak in 2008, which provided a unique opportunity to investigate carbon and water flux changes covering the periods of pre-infestation (2005-2007), infestation (2008-2009), and post-infestation (2010-2014). Affected by bark beetle infestation, the stomatal conductance during the summer season (July and August) significantly reduced from 0.0018 m/s in the pre-infestation period to 0.0011 m/s in the infestation period. The decrease in stomatal conductance was not solely caused by the decrease of LAI, but also related to variation in parameter g1 in three commonly-used models of Ball-Barry, Leuning, and Medlyn. The parameter g1 was related to water use efficiency (WUE), and WUE values increased in the infestation period and decreased in the post-infestation period providing evidence that the physiological behavior was significantly changed due to bark beetle infestation. As for the simulation of transpiration, the fitted parameter significantly improved the accuracy in comparison with recommended parameterization. With the inclusion of temporally varied stomatal conductance, estimated transpiration during the infestation period and post-infestation period was improved by 4.3%~13.6% in comparison with the unvaried parameterization fitted in the pre-infestation period. Accounting for the temporally varied stomatal conductance parameters in response to disturbed environments may improve the description of stomatal conductance leading to better model performance in estimated water and carbon balances.

How to cite: Su, Y., Li, M., Shao, W., and Jarsjö, J.: Large-scale shifts in transpiration dynamics following bark beetle infestation: Stomatal conductance responses, EGU General Assembly 2023, Vienna, Austria, 23–28 Apr 2023, EGU23-13089, https://doi.org/10.5194/egusphere-egu23-13089, 2023.

EGU23-13837 | ECS | Posters on site | HS2.1.5

Forest-floor litter and deadwood cycle significant amounts precipitation 

Marius G. Floriancic, Scott T. Allen, Raphael Meier, Lucas Truniger, James W. Kirchner, and Peter Molnar

Forests modulate precipitation and evapotranspiration fluxes. One important – yet often overlooked - component in the forest water cycle is the forest-floor litter layer. Leaves and deadwood retain significant amounts of annual precipitation and enhance subcanopy humidity. At the “Waldlabor Zurich” ecohydrology field site we conducted numerous experiments to quantify the water fluxes from and to the forest-floor litter layer. We estimated the total retention capacities of needle, broadleaf and deadwood litter, assessed the litter water content before and after precipitation events, and measured soil moisture in litter-covered and litter-free plots. We used micro lysimeters to estimate evaporation from the litter layer and measured subcanopy humidity and temperature at different heights above the forest floor to assess the effect of evaporation on subcanopy microclimate.

Storage capacities of needle litter and broadleaf litter averaged 3.1 and 1.9 mm, respectively, with evaporation timescales exceeding 2 days, whereas deadwood stored ~0.7 mm of precipitation, and retained water for >7 days. Deadwood water retention increased with more advanced decomposition. Together the forest floor litter layer reduced soil water recharge, reduced soil evaporation rates, and insulated against ground heat fluxes thus impacting snowmelt patterns. Timeseries of deadwood water content revealed a diel cycle of stored water, water content increased during nighttime due to condensation of dew and fog and decreased during the day when vapor pressure deficit and evaporation were high. The water evaporating from the forest‐floor litter layer increased humidity, decreased temperature, and reduced vapor pressure deficit in the subcanopy atmosphere. Although, the absolute amounts of water storage in the forest-floor litter layer are relatively small, these storages were frequently filled and emptied with every precipitation event, thus effecting the overall soil water recharge. Overall, 18% of annual precipitation, or 1/3 of annual evapotranspiration, were retained in the forest-floor litter layer suggesting that overlooking litter interception may lead to substantial overestimates of recharge and transpiration in many forest ecosystems.

How to cite: Floriancic, M. G., Allen, S. T., Meier, R., Truniger, L., Kirchner, J. W., and Molnar, P.: Forest-floor litter and deadwood cycle significant amounts precipitation, EGU General Assembly 2023, Vienna, Austria, 23–28 Apr 2023, EGU23-13837, https://doi.org/10.5194/egusphere-egu23-13837, 2023.

EGU23-14167 | ECS | Orals | HS2.1.5

Dry seasons and dry years amplify the Amazon and Congo forests’ rainfall self-reliance 

Lan Wang-Erlandsson, Ruud van der Ent, Arie Staal, Patrick Keys, Delphine Clara Zemp, Ingo Fetzer, Makoto Taniguchi, and Line Gordon

Rainfall is a key determinant of tropical rainforest resilience in South America and Africa, of which a substantial amount originates from terrestrial and forest evaporation through moisture recycling. Both continents face deforestation that reduces evaporation and thus dampens the water cycle, and climate change that increases the risk of water-stress induced forest loss. Hence, it is important to understand the influence of forest moisture supply for forest rainfall during dry periods. Here, we analyze mean-years and dry-years dry-season anomalies of moisture recycling in the South American (Amazon) and African rainforests (Congo) over the years 1980-2013. Annual average reliance of forest rainfall on their own moisture supply (ρfor) is 26 % in the Amazon and 28% in the Congo forest.  In dry seasons, this ratio increases by 7% (or ~2 percentage points) in the Amazon and up to 30 % (or ~8 percentage points) in Congo. Dry years further amplify dry season ρfor in both regions by 4-5 %. In both Amazon and Congo, dry season amplification of ρfor are strongest in regions with a high mean annual ρfor. In the Amazon, forest rainfall self-reliance has declined over time, and in both Amazon and Congo, the fraction of forest evaporation that recycles as forest rainfall has declined over time. At country scale, dry season ρfor can differ drastically from mean annual ρfor (e.g., in Bolivia and Gabon, mean annual ρfor is ~30% while dry season ρfor is ~50 %). Dry period amplification of ρfor illuminates additional risks of deforestation as well as opportunities from forest conservation and restoration, and is essential to consider for understanding upwind forest change impacts on downwind rainfall at both regional and national scales.

How to cite: Wang-Erlandsson, L., van der Ent, R., Staal, A., Keys, P., Zemp, D. C., Fetzer, I., Taniguchi, M., and Gordon, L.: Dry seasons and dry years amplify the Amazon and Congo forests’ rainfall self-reliance, EGU General Assembly 2023, Vienna, Austria, 23–28 Apr 2023, EGU23-14167, https://doi.org/10.5194/egusphere-egu23-14167, 2023.

EGU23-14582 | Posters on site | HS2.1.5

Comparing tree ring chronology and soil water model for a hydric hemiboreal forest 

Andis Kalvans and Iluta Dauškane

Air temperature and hence potential evapotranspiration trends are clearly positive worldwide, while precipitation trends are unclear largely due to large inherent variability. Apparently, because of climate change increasing evapotranspiration is likely to lead to depletion of soil water reserves in many ecosystems, but ecosystem feedbacks can have a nonlinear impact of the water regime. For example, in a hemi boreal forest at a hydric setting, higher evapotranspiration due to higher temperatures can lead to improved soil aeration, facilitating the rejuvenation of woody vegetation and further increase of transpiration. Process-based soil water models can be used to investigate such phenomena. However, the models need to be validated. Long time series of the forest soil water regime are sparce. Instead, the tree-ring width data (chronology) can be used as a proxy for growing conditions in the past, as the soil water regime has the firs order controlling factor. We are constructing a Hydrus-1D soil-water model for three hydric forest sample plots in Latvia using the e-obs data set for model forcing. The model results then are compared to the local tree-ring chronology, particularly examining pointer years as extreme cases for evaluating hydrological situation. The model will provide opportunity for scenario investigation of the interactions between climate and soil water regime in hemiboreal forest ecosystem. This work was supported by ERDF postdoctoral research project “Groundwater and soil water regime under climate change” (No. 1.1.1.2/VIAA/3/19/524).

How to cite: Kalvans, A. and Dauškane, I.: Comparing tree ring chronology and soil water model for a hydric hemiboreal forest, EGU General Assembly 2023, Vienna, Austria, 23–28 Apr 2023, EGU23-14582, https://doi.org/10.5194/egusphere-egu23-14582, 2023.

EGU23-15252 | ECS | Orals | HS2.1.5

Former land use and tree age affects nitrate leaching from European forest soils 

Caitlin Lewis, Martin Lukac, Elena Vanguelova, and Matthew Ascott

Forest ecosystems are typically associated with good water quality; an ecosystem service often claimed as a benefit of afforestation schemes. However, legacy effects of historical land use, plus decades of elevated nitrogen deposition inputs from traffic pollution, and agricultural and industrial activities in combination with higher nitrogen scavenging by forests, have led to elevated nitrate leaching from forested lands across Europe. Elevated nitrate leaching threatens the quality of surface and groundwater. It is also related to soil acidification and depletion of base cations, compromising the nutritional status of the soil and, subsequently, current and future trees generations. Several variables that affect the response of nitrate leaching to elevated deposition inputs have previously been identified in long-term forest monitoring datasets. Here we collated a European-scale dataset from published literature of throughfall nitrate concentrations and nitrate leaching, and variables affecting this relationship, e.g. soil type, surrounding land use and climate, broadening the evidence beyond these long-term monitoring datasets.

We identified a variation in response to elevated deposition between coniferous and broadleaved forests. This could be partly attributed to the former land uses typically associated with the different tree species. Broadleaf forests planted on former arable land exhibited a different response to elevated deposition than afforested heathlands/grasslands and conifers planted on arable land. An age effect was also observed, with nitrate leaching from forest soils increasing with tree age until 80 years old for conifers and 50 years old for broadleaves, then declining as trees aged further. This research provides evidence to assess the timescale over which afforestation schemes can deliver expected benefits to water quality. It also highlights that considering former land use is important to identify locations in forested landscapes where groundwater nitrate concentrations may be elevated.  

How to cite: Lewis, C., Lukac, M., Vanguelova, E., and Ascott, M.: Former land use and tree age affects nitrate leaching from European forest soils, EGU General Assembly 2023, Vienna, Austria, 23–28 Apr 2023, EGU23-15252, https://doi.org/10.5194/egusphere-egu23-15252, 2023.

EGU23-17269 | ECS | Orals | HS2.1.5

How do bark beetle outbreaks impact water quality in temperate forested catchments? 

Daphné Freudiger, Bernd Ahrends, Henning Meedenburg, Birte Scheler, and Ulrike Talkner

Temperate forests provide ecosystem services such as protecting water environment, timber and fuel production, carbon sequestration, and reduction of nutrient loss. During the last decades, large forest areas were decimated world-wide by bark beetle attacks. Under climate change, drought and higher temperatures increase the risk of infestation. Future forest ecosystem services are therefore at risk of deterioration and it is essential to understand how bark beetle attacks and following management practices influence nutrient cycling, nitrate (NO3) and dissolved organic carbon (DOC) fluxes in seepage water. After dieback, accelerated mobilization of nutrients can be expected due to an increase in mineralization rates and the lack of plant nutrient uptake, whereas the lack of litter input may reduce nutrient leaching. The significantly reduced interception and evapotranspiration might furthermore increase soil water contents and seepage fluxes. Regeneration strategies (e.g. site clearance vs. keeping the dead trees, natural vs. artificial regeneration, regeneration with nurse crops) are decisive for the extent and persistence of the impact of calamities on water quality and quantity. We use a meta-data-analysis to gather knowledge out of approx. 60 studies around the world, to assess the expected behaviours of DOC and NO3 concentrations in seepage water and streams after bark beetle outbreaks in temperate forests and to identify gap of knowledge. Most studies focussed on nitrate leaching and only few on DOC. Overall, DOC concentrations increase in seepage water and streams directly after dieback, reaching a peak 2 to 3 years after disturbance. In the opposite, the first evidences of increased NO3 concentrations are visible approximately one year after disturbance and peak is reached within 3 to 10 years (on average after 5 years), when DOC decreases. NO3 maxima never exceeded drinking water limit. In all studies, DOC and NO3 concentrations recovered to pre-event or, in some cases, were even below the pre-dieback conditions only few years after the peak. Forest ecosystems seem therefore to be resilient to disturbances showing overall rapid recovery of ecosystem functions. However, the timing and duration of the concentration peaks largely differed among the studies, which might be explained by the extent and velocity of tree dieback in the studied areas, the harvest management practices and the type of vegetation re-growth after disturbance, but also by the local climatic conditions and the catchment size. Only few studies specifically analysed these effects on nutrient fluxes and their results differ considerably. More research is needed for assessing the influence of different regeneration strategies after calamities on water quality risks in forested catchments. A bark beetle attack currently decimating the Norway Spruce forest in the well-monitored Lange Bramke catchment (Harz, Germany), offers a unique opportunity to answer this question. With long-term datasets of NO3 and DOC concentrations in stream and the recent installation of a network of lysimeters at three soil depths in a) a healthy forest area, and infested areas b) with dead trees standing, and c) with site clearance, we will be able to better understand the effect of regeneration strategies on nutrient fluxes.    

How to cite: Freudiger, D., Ahrends, B., Meedenburg, H., Scheler, B., and Talkner, U.: How do bark beetle outbreaks impact water quality in temperate forested catchments?, EGU General Assembly 2023, Vienna, Austria, 23–28 Apr 2023, EGU23-17269, https://doi.org/10.5194/egusphere-egu23-17269, 2023.

EGU23-17565 | ECS | Posters on site | HS2.1.5

A Tendency Toward Further Advancement In Forest Digitalization Via Combined Sap Flow, Spectrometer, Soil, And Microclimate Data 

Riccardo Valentini, Jim Yates, Andrea Petroselli, Alexis Yaroslavtsev, Flavia Tauro, Francesco Renzi, and Shahla Asgharinia
The science of forest digitalization via technological innovation offers an opportunity to develop new methods for mass monitoring forest resources. A key constraint has been cost restraints preventing the mobilization and collection of big data to efficiently capture, store, and analyze retrieved data. The Internet of Things (IoT) and advances in microprocessing are steadily changing this. The TreeTalker® is a multisensory IoT-driven platform designed to detect and collect information on individual trees, where its nested sensor approach captures several key ecophysiological parameters autonomously and in quasi-real time at a relatively low cost.
Here we combine a new additional probe for the detection of soil parameters, mainly soil temperature and soil moisture. The aim of this study was to design a compatible soil probe with TreeTalker® platform with reasonable accuracy maintaining the principle of lower cost for mass monitoring. For this purpose, two surficial sensing frequency domain-based soil probes with 50 and 3000 kHz bands were designed and integrated into the TreeTalker® platform for real-time and continuous soil data collection. In order to demonstrate the capability of the new additional part, a three-phase experimental process was performed including (1) sensor sensitivity analysis, (2) sensor calibration using eight different soil types, (3) a survey on signal correlation with soil water content and soil matric potential and (4) long-term field data monitoring.
A negative linear correlation was demonstrated under temperature sensitivity analysis for both types of probes, and for calibration, nonlinear regression analysis was applied to collected samples, explaining the relationship between the sample volumetric water content (collected by digital scale) and the sensor frequency output. Based on a preliminary trial, we investigate that frequency signal has a stronger correlation with soil matric potential (R2= 80%) rather than soil water content (R2= 62%) due to the sensitivity of the probe under free and bound water. This opens a new window for water potential measurement which is a key parameter for the understanding of Plant-Soil interactions. Furthermore, in a field scenario, three TreeTalkers were mounted near the commercial precise soil sensors, so-called TDR systems (time domain reflectometry) to analyze the accuracy of the low-cost soil probe in comparison to TDR system for both wet and dry seasons in silty-loamy soil type. The results revealed a better correlation for collected data in the wet season than in the dry period. We also present an innovative electrical impedance analysis for detecting soil water potential and soil water content.  system for both wet and dry seasons in silty-loamy soil type. The results revealed a better correlation for collected data in the wet season than in the dry period.

How to cite: Valentini, R., Yates, J., Petroselli, A., Yaroslavtsev, A., Tauro, F., Renzi, F., and Asgharinia, S.: A Tendency Toward Further Advancement In Forest Digitalization Via Combined Sap Flow, Spectrometer, Soil, And Microclimate Data, EGU General Assembly 2023, Vienna, Austria, 23–28 Apr 2023, EGU23-17565, https://doi.org/10.5194/egusphere-egu23-17565, 2023.

EGU23-165 | ECS | Posters virtual | HS2.1.6

Hydrological model calibration in a Himalayan Catchment Using Remote sensing/Reanalysis Datasets. 

Mani Kanta Malla and Dhyan Singh Arya

Hydrological models are simplified mathematical representations of various hydrological processes and their interactions in a catchment. They are widely employed to simulate hydrological responses under diverse scenarios of climate, land use, land cover, and agricultural and soil management practices, which are helpful for planning water resources and management at the catchment scale. The parameters of the hydrological models are often optimised by calibrating them such that the observed and simulated streamflow match closely. Reliable prediction of hydrological variables of interest in ungauged or poorly gauged basins and addressing the uncertainty associated with the prediction is a challenging task as it is very difficult to calibrate the models due to the unavailability of measured hydrological responses. Escalating research interest in predicting hydrological fluxes at ungauged or poorly gauged catchments has been witnessed recently using distributed modelling, advanced scientific methods, and the availability of high-resolution satellite-based and reanalysis datasets used in model calibration. Additionally, the ability of remote sensing data sources to consider spatial variability is a further benefit in calibrating hydrological models, which lowers the level of uncertainty in the outputs. This proposed study focuses on calibrating 3 layered Variable Infiltration Capacity (VIC) model with soil moisture, and evapotranspiration obtained from different remote sensed and reanalysis data sets in the Upper Indus basin of the Hindukush Himalayan region. As the Upper Indus basin has limited meteorological stations and no gauging stations in the Indian mainland, the current study has much scope to quantify the water resources using different remote sensing/reanalysis datasets. The results expected from this study are to find the suitable variable and reanalysis product for the calibration of the VIC model and the uncertainty associated with various remote sensing and reanalysis products.

How to cite: Malla, M. K. and Arya, D. S.: Hydrological model calibration in a Himalayan Catchment Using Remote sensing/Reanalysis Datasets., EGU General Assembly 2023, Vienna, Austria, 23–28 Apr 2023, EGU23-165, https://doi.org/10.5194/egusphere-egu23-165, 2023.

EGU23-523 | ECS | Posters on site | HS2.1.6

An assessment of the water availability for mountain communities in the Parvati basin, Western Himalaya using a distributed hydrological model 

Pradeep Srinivasalu, Anil Kulkarni, Srinivas Vv, and Satheesh Sk

The impact of changing climate on the Himalayas strongly influences the amount and timing of water available in the region. Millions of people in the downstream regions of Himalayan catchments depend on streams and rivers originating from the region for domestic consumption, livelihood, agriculture, and hydropower (Immerzeel et al., 2020). Many studies have highlighted the importance of snow and glacier melt towards water availability at the basin scale (Khanal et al., 2021; Prasad et al., 2019). However, the water availability at a much finer scale (i.e., to individual mountain communities) remains unquantified. Understanding the mountain communities' water availability is imperative to mitigate climate change impacts and ensure their water and food security (Kulkarni et al., 2021). In the present study, we aim to estimate the water availability to the communities in the Parvati Basin of Western Himalaya, including the contributions of snow and glacier melt, rainfall, and groundwater to runoff. The catchment has a total area of 1754 km2 and consists of 279 glaciers which cover an area of 395.6 km2. The volume of the glaciers and their mass balance are computed to understand the present state of the glaciers. The volume of the glaciers is estimated as 21.3 ± 3.8 km3 using laminar flow and scaling methods. The mass balance of the glaciers was estimated using the improved accumulation area ratio (IAAR) method as -0.44 ± 0.23 m w.e.a−1. We simulate the daily runoff in the catchment using the Spatial Processes in Hydrology (SPHY) model, which is a fully distributed cryospheric-hydrological model. The volume and mass balance results are used to define the model's initial conditions and constrain mass loss during the simulations. Further, the study also aims to understand the role played by seasonal snow cover on the water available to the mountain communities. The outcome of this assessment would help to facilitate making informed hydrological and agricultural policies to mitigate the impact of climate change.

How to cite: Srinivasalu, P., Kulkarni, A., Vv, S., and Sk, S.: An assessment of the water availability for mountain communities in the Parvati basin, Western Himalaya using a distributed hydrological model, EGU General Assembly 2023, Vienna, Austria, 23–28 Apr 2023, EGU23-523, https://doi.org/10.5194/egusphere-egu23-523, 2023.

EGU23-982 | ECS | Orals | HS2.1.6

Impact of mountain topography on potential evapotranspiration and water drainage 

David Luttenauer, Sylvain Weill, and Philippe Ackerer

Hydrological models are currently used to simulate the water cycle at the catchment scale using climatic forcing. For water management purposes, one of the most important components to be determined is drainage. The estimation of drainage into an aquifer is directly related to the water input (precipitation), the outputs through evaporation and transpiration, and water flow dynamics in the unsaturated zone. The output fluxes are difficult to estimate through direct measurements and are often estimated using mathematical models build on climatic processes and data. Amongst the climatic data that are used, solar radiation is a key parameter since it estimates the energy available for open surface or soil evaporation and plant transpiration. Solar radiation can be computed directly knowing the sun’s position, provided by satellite surveys (with a spatial resolution down to 6x6km2 and a time resolution of one hour) or interpolated from values measured at meteorological stations. Values based on observations should be preferred because direct computation is strongly biased due to the effects of weather conditions (cloud for example). In mountainous regions, the orientation of the hillslope regarding the sun's position can strongly impact the amount of solar energy arriving on the canopy or the soil.

The questions we address in this communication are the following: when applying physically based hydrological models to mountainous regions, is it really necessary to consider the potential sky obstruction due to the mountainous terrain of each grid cell to assess solar radiation? By rebound, does this strongly impact the estimation of evapotranspiration and water drainage to the aquifer?

To answer these questions, a mixed methodology that relies on two steps is proposed and tested. The first step consists of a theoretical computation of solar radiation for each grid cell of a given Digital Elevation Model using GIS tools. The second steps aim at correcting the first step computations to be consistent with measured or satellite data. For the first step, the (Scharmer, Greif 2000) model - which computes the 3 components of global radiation (direct, diffuse, and reflected by surrounding surfaces for clear sky conditions) – is used. The model also considers the local terrain to estimate the sky obstruction. In the second step, the data are averaged at the scale of the prescribed data (satellite or interpolated) and linearly corrected with a proportionality coefficient so that the average computed value fits the prescribed average value.

This methodology is then applied to a water catchment in the Vosges Mountains located close to Strasbourg (France). The proportionality coefficient varies locally between 0.2 and 2.5 showing that the local impact of topography on radiation is very significant. Using this correction coefficient in the Penman-Monteith formula, the relative difference in evapotranspiration is respectively -80% and +180% from the mean value for shaded areas and sunniest areas. For water drainage estimated through a conceptual model, the relative differences vary from -20% for the most exposed areas to +20% for the less exposed areas, demonstrating that orientation should be accounted for when simulating the response of mountainous watersheds.

How to cite: Luttenauer, D., Weill, S., and Ackerer, P.: Impact of mountain topography on potential evapotranspiration and water drainage, EGU General Assembly 2023, Vienna, Austria, 23–28 Apr 2023, EGU23-982, https://doi.org/10.5194/egusphere-egu23-982, 2023.

EGU23-1313 | Posters on site | HS2.1.6

Evapotranspiration of an Abandoned Grassland in the Italian Alps: Modeling the impact of shrub encroachment 

Davide Canone, Davide Gisolo, Ivan Bevilacqua, Alessio Gentile, Justus van Ramshorst, Maurizio Previati, and Stefano Ferraris

Shrub encroachment of grasslands in the Alps is still a poorly studied phenomenon. Therefore, this study analyses the possible effect of shrub encroachment on actual evapotranspiration (ETa) at an abandoned grassland in the Northwestern Italian Alps, colonised by Elaeagnus Rhamnoides shrubs. This is done by means of micrometeorological and eddy covariance data collected during four growing seasons. Additionally, the Hydrus 1D hydrological model modified to account for a soil column with two vegetation types is used.  This modified model is run with a variable percentage of shrubs on evapotranspiration, ranging from 0 to 80% and it is validated by using the measured eddy covariance-derived ETa. The Hydrus 1D model is also applied in its usual set-up, having only one vegetation type, to estimate the ETa from both grassland and shrubs separately.

The performance of the modified model with two vegetation types is acceptable, although it is very variable between different growing seasons and in dry condition it could be further improved (R between 0.50 in 2016 and 0.73 in 2014 considering the probable actual percentage of ETa affected by shrubs. The percentage varies between 20% in 2016 and 60% in 2014). Besides, the model captures the inter-annual variability of ETa. The agreement of cumulative simulated and observed ETa is good, since the deviation between observed and modelled cumulative ETa is always lower, in the four analysed growing seasons, than 50 mm.

The simulated ETa approximates the eddy covariance-derived ETa, however the modelled soil water content is very sensitive to precipitation events, more than the measured soil water content. Both models, with the modified and the usual setup, tend to overestimate the vegetation stress during dry periods. Nevertheless, the single vegetation model results allow us to conclude that the shrubs likely are responsible for an enhancement of ETa and an alteration of the hydrological cycle accordingly. Finally, we explore how some micro-meteorological drivers of ETa (vapour pressure deficit – VPD, net radiation, wind speed, air temperature and ground heat flux - G0) affect the difference between modelled and simulated ETa, and between simulated ETa from shrubs and from grass. Frequently, higher deviations from zero are found especially with high VPD and G0.

How to cite: Canone, D., Gisolo, D., Bevilacqua, I., Gentile, A., van Ramshorst, J., Previati, M., and Ferraris, S.: Evapotranspiration of an Abandoned Grassland in the Italian Alps: Modeling the impact of shrub encroachment, EGU General Assembly 2023, Vienna, Austria, 23–28 Apr 2023, EGU23-1313, https://doi.org/10.5194/egusphere-egu23-1313, 2023.

Mountain hydrology faces a number of specific challenges, such as the high spatial variability of conditions and processes in horizontal and vertical dimension, and the comparatively low density and limited representativity of hydrometeorological observation networks. Vít Klemeš (1990) characterized these challenges very pointedly when he noted that mountainous areas, despite their hydrological importance, represent “some of the blackest black boxes in the hydrological cycle”.

In the meantime, our knowledge about mountain hydrology has improved considerably, although the challenges can still be characterized as greater than for most lowland regions. Also, global hydrological models have become a research field in their own right since the time of Klemeš’ statement, and even though these models face similarly increased challenges in mountain regions, they can be useful for studying mountain regions and their water resources in a larger context. In addition, valuable information can be extracted from an overview of regional studies, as has been done, for example, in the mountain-specific parts of the IPCC Special Report on the Ocean and Cryosphere in a Changing Climate and the IPCC Sixth Assessment Report.

This contribution will discuss a comprehensive view from the mountains looking downstream, with a focus on the importance of mountain water resources for the lowlands.

Reference

Klemeš V, 1990. Foreword. In: Molnár L, ed. Hydrology of Mountainous Areas. Proceedings of a workshop held at Strbské Pleso (Czechoslovakia), June 1988. IAHS Publication 190, IAHS, Wallingford, ISBN 0-947571-42-6, p. 7

How to cite: Viviroli, D.: Mountain water resources and the importance of looking downstream, EGU General Assembly 2023, Vienna, Austria, 23–28 Apr 2023, EGU23-1408, https://doi.org/10.5194/egusphere-egu23-1408, 2023.

EGU23-1662 | ECS | Orals | HS2.1.6

Hydrological characteristics of Sutri Dhaka glacier catchment in the western Himalaya 

Sourav Laha, Parmanand Sharma, Sunil N. Oulkar, Lavkush Patel, Bhanu Pratap, and Meloth Thamban

The Himalaya is a massive cryospheric reserve, which provides a significant amount of fresh water to major Asian rivers like the Indus, Ganges, Brahmaputra, etc. Climate-induced cryospheric change is one of the major worldwide concerns, particularly in the Himalaya. Meltwater from glaciers and snow stabilises the downstream river runoff, and it buffers against drought during the driest years to some extent. The hydrological impact due to climate change in the high Himalayan catchments is potentially amplified by the shrinkage of snow and ice reserves. Therefore, it is important to analyse the potential hydrological changes at catchment to regional scales in the Himalaya. Hydrological changes at the regional scale are mainly determined by glacier catchment scale hydrology. Presently, understanding the regional scale discharge in the Himalaya suffers from large uncertainties, and one major source is the lack of glacier catchment scale hydrological understanding. Motivated by the above, here we are studying the glacio-hydrological characteristics of the Sutri Dhaka Glacier (debris-free glacier) catchment, which is located in the Chandra basin, western Himalaya. The glacierised area is ~20 km2, and the total catchment area is ~45 km2.

To the glacier catchment, we are applying an hourly timescale glacio-hydrological model to simulate discharge and the corresponding hydrograph components from 1980 to 2022. We also obtained extensive long-term field measurements of glacier mass balance, meteorological parameters, and discharge for the ablation season of 2016 to 2022 (with some gaps). These field data are used to calibrate the model parameters using a Bayesian framework and validate the simulated discharge and glacier mass balance. The simulated discharge variability from the diurnal to inter-annual time scale matches with the observations with reasonable accuracy (R2>0.75). Also, the model is able to capture the strong seasonality of the diurnal discharge amplitude, which has a direct relation to the storage-release properties of the glacier. Particularly, the diurnal discharge variability from the Himalayan glacier catchment is not well explored in the literature. We have also computed the associated uncertainties in the model as we as in the observations. Our present analysis will help to improve the existing process-based understanding of the glacier catchment scale discharge from the glacierised Himalayan region.

How to cite: Laha, S., Sharma, P., Oulkar, S. N., Patel, L., Pratap, B., and Thamban, M.: Hydrological characteristics of Sutri Dhaka glacier catchment in the western Himalaya, EGU General Assembly 2023, Vienna, Austria, 23–28 Apr 2023, EGU23-1662, https://doi.org/10.5194/egusphere-egu23-1662, 2023.

EGU23-1676 | ECS | Orals | HS2.1.6

Seasonal variation in stable isotope compositions of surface waters from Upper Sutlej River Basin: Estimation of the moisture source 

Kanishak Sharma, Anil Kumar Gupta, Sameer Kumar Tiwari, and Nikitasha Chatterjee

The stable isotopes of water, 18O and 2H, are impacted by climatic events that give them a distinct fingerprint of their source. Investigating the origin of river water requires this fingerprint as a precursor. On an annual basis and at the global level, the flow of moisture from the oceans and its return via rainout and runoff is similar to a dynamic equilibrium. Rivers in the Himalayan region have their moisture source in various end members which include glacier/snow melting, rainfall/runoff, and groundwater/springs. Sutlej River is one such river that travels across the Himalaya and receives its waters from all the aforementioned regions. 105 water samples from 36 different locations have been collected from the Upper Sutlej River Basin in the pre-monsoon, post-monsoon, and lean seasons to study the isotope system of surface water in the basin. A seasonal cycle with high δ18O and δD values (‰) during the pre-monsoon (March to May; −14.42, −114.94), intermediate values during the winter (lean season) (December to February; −12.63, −105.10), and low values during the post-monsoon (October to November; −12.13, −101.6) is observed. The river falls in the western Himalaya that receives precipitation both from the Indian Summer Monsoon (ISM) as well as from the Western Disturbances (WDs). The intercept and the d-excess values in the water samples fluctuate due to the variable contributions from these two moisture sources and the related rainfall in different seasons which are generally higher than the global meteoric waters. The 168-hour back trajectories in different seasons using HYSPLIT model converging at a height of 4,200 m a.s.l. (mean elevation of the Upper segment of the catchment) for moisture source identification have shown that winds mainly blow from south or south-east with moisture source from the Arabian Sea and the Bay of Bengal in summer and monsoon seasons, whereas in winter and spring seasons winds blow mainly from the west bringing moisture from the Central Asian and Eurasian water bodies through Western Disturbances. The results of HYSPLIT model and isotopic analysis indicate a dominant contribution of Western Disturbances and glacier melt in the upper segment of the basin which is consistent with recent data on glacier retreats in the Himalayan region.

Keywords: Himalayan Rivers, Sutlej River, Stable Isotopes, Western Disturbances, Indian Summer Monsoon.

How to cite: Sharma, K., Gupta, A. K., Tiwari, S. K., and Chatterjee, N.: Seasonal variation in stable isotope compositions of surface waters from Upper Sutlej River Basin: Estimation of the moisture source, EGU General Assembly 2023, Vienna, Austria, 23–28 Apr 2023, EGU23-1676, https://doi.org/10.5194/egusphere-egu23-1676, 2023.

EGU23-1746 * | ECS | Orals | HS2.1.6 | Highlight

Unravelling the origins of precipitation over the world’s water towers 

Jessica Keune and Manuela Brunner

Mountain regions supply around 22% of the world's population with freshwater — from precipitation over these water towers to melt water from snow packs and glaciers. However, the frozen reservoirs of water that usually act to buffer precipitation deficits are diminishing as a result of climate change. As a consequence, precipitation will become the main source of freshwater supplied by these water towers. Yet, already today, precipitation deficits over many water towers frequently cause severe droughts that further induce supply deficits in downstream regions. 

Here, we unravel the origins of precipitation over the most important water towers worldwide and illustrate their dependency on upwind land regions. Using a moisture tracking framework constrained by satellite observations, we disentangle the local and remote surface drivers of drought over these water towers and highlight the role of forested and irrigated regions during these events. Our results indicate that many water towers can self-sustain their precipitation during drought events through an increased self-supply of moisture for precipitation: over the water tower of the Ganges-Brahmaputra, for example, around 80% of the precipitation during drought events is supplied by the water tower itself and its dependent downstream region. Our findings highlight the vulnerability of the world's most important water towers to drought from an atmospheric perspective and outline the potential of localized forest and land management practices to secure freshwater to billions of people in the future.

How to cite: Keune, J. and Brunner, M.: Unravelling the origins of precipitation over the world’s water towers, EGU General Assembly 2023, Vienna, Austria, 23–28 Apr 2023, EGU23-1746, https://doi.org/10.5194/egusphere-egu23-1746, 2023.

Streamflow seasonality in mountain regions is besides climate often shaped by reservoir regulation. Such regulation is particularly important in the Alps where meltwater from glaciers and the snowpack are captured in reservoirs to generate hydropower during the winter season. While reservoirs affect streamflow seasonality, information on past seasonal reservoir operation patterns is rarely publicly available. Consequently, little is known about spatial variations in reservoir storage and release signals in dependence of climate and catchment characteristics. Here, we develop a generalized additive modelling approach to reconstruct daily and seasonal reservoir patterns from observed streamflow time series that encompass a period before and a period after a known year of reservoir construction.

We apply this approach to reconstruct the seasonality of reservoir regulation, i.e. information on when water is stored in and released from a reservoir, for a dataset of 74 regulated catchments in the Central Alps. Using these reconstructed seasonal regulation patterns, we identify groups of catchments with similar reservoir operation strategies using functional clustering. We find that reservoir management varies by catchment elevation. Seasonal redistribution from summer to winter is strongest in high-elevation catchments, where reservoirs are mostly used for hydropower production, while seasonal redistribution is much weaker in the downstream regions, where reservoirs are used for a range of different purposes. The clear relationship between reservoir operation and elevation has practical implications. First, these elevational differences in reservoir regulation can and should be considered in hydrological model calibration. Furthermore, the reconstructed reservoir operation signals can be used to study the joint impact of climate change and reservoir operation on different streamflow signatures, including extreme events. Last, the potential of regulation as a climate adaptation measure may vary for the high-elevation and downstream regions.

How to cite: Brunner, M. I. and Naveau, P.: Disentangling reservoir regulation patterns from natural streamflow in the Alps and their downstream regions, EGU General Assembly 2023, Vienna, Austria, 23–28 Apr 2023, EGU23-1948, https://doi.org/10.5194/egusphere-egu23-1948, 2023.

The Tibetan Plateau functions as the Asian water tower. It is highly sensitive to climate change and is warming faster than low-lying areas. The snow-melt dynamics are being perturbed, precipitation and evaporation patterns are shifting, and permafrost is degrading. Climate change therefore threatens the basin water supply as well as agriculture, hydropower, and industry which depend on it. The scientific questions we emphasized here are: (i) How evaporative water demand (EWD) changes in space and time during the current decades across the Asian water tower? (ii) Which driver should be attributable for the change? (iii) How EWD change informs the potential alteration of surface water resources in the Asian water tower? The expected outcomes would improve our understanding of the hydroclimatic change in the Asian water tower as well as other high-water yielding mountainous regions worldwide. 

How to cite: Xu, S.: Trends in evaporative water demands in the Tibetan Plateau and its implication for hydroclimatic change, EGU General Assembly 2023, Vienna, Austria, 23–28 Apr 2023, EGU23-2205, https://doi.org/10.5194/egusphere-egu23-2205, 2023.

In snow-dominated regions, snowmelt water plays a critical role in recharging the subsurface and generating streamflow. With a changing climate, the fraction of annual precipitation that falls as snow will probably decline. Rainfall and snowmelt water have different interactions with the subsurface and potentially vegetation, thus affecting the partitioning of precipitation into subsurface storage and streamflow. Currently, our understanding of how snow-to-rain transition affects this hydrologic partitioning in mountainous catchments is still limited. To take the best management practices for climate change adaptation, it is of critical importance to study how a catchment responds to such environmental disturbances.

In this study, we use the geophysics-informed hydrologic modeling to study the effect of snow-to-rain transition on hydrologic partitioning in a snow-dominated mountainous catchment in Idaho, USA. In the modeling, the subsurface structure was extracted from velocity map obtained from seismic refraction tests. Many studies has highlighted the importance of the heterogeneous subsurface in water partitioning in catchments, but accurate characterizations with traditional field techniques such as drilling are challenging. The hydrologic model developed from geophysical results is then calibrated with historical hydrometeorological measurements. Two climate change scenarios are designed to study the impact of warming on streamflow generation and water storage. In Scenario 1, a uniform warming is considered throughout the year, and an air temperature increase (+2.5 °C) is applied to change the phase of precipitation. In scenario 2, warming is only applied to the snow season (i.e., from December to April). The numerical modeling results show that a uniform warming (scenario 1) significantly promotes evapotranspiration (ET), and streamflow becomes less productive. Warming in the snow season only (scenario 2) induces an earlier, flashier streamflow but the partitioning of precipitation between storage and streamflow is not significantly changed. Compared to simulation results from traditional hydrologic modeling (without the heterogeneous deep subsurface), geophysics-informed hydrologic modeling reveals the importance of water storage in the fractured bedrock in response to the climate change.

How to cite: Chen, H. and Niu, Q.: Effect of snow-to-rain transition on precipitation partitioning in a mountainous catchment: insights from geophysics-informed hydrologic modeling, EGU General Assembly 2023, Vienna, Austria, 23–28 Apr 2023, EGU23-2920, https://doi.org/10.5194/egusphere-egu23-2920, 2023.

EGU23-7013 | Orals | HS2.1.6

Could land management modify water resources in Mediterranean mountain areas? 

Javier Zabalza-Martínez, Estela Nadal-Romero, Manel Llena, Melani Cortijos-López, Teodoro Lasanta-Martínez, Juan Ignacio López-Moreno, Sergio M. Vicente-Serrano, Diana Pascual, and Eduard Pla

Water resources availability is one of the main concerns for policy makers around the World. In the Mediterranean basin, this problem has been increased given the extreme variability in climate and the land use changes that have occurred during the last century (i.e. land abandonment). Streamflow and other environmental variables related to vegetation have been analysed in three Mediterranean mid-mountain basins under conditions of Climate Change (CC), under conditions of Land Use Change (LUC) and under its Combined Action (CA). The Land Use changes have been defined in the framework of the Life MIDMACC project and are related to land management through shrubland cleaning activities in abandoned fields and forest management that is determined by a 50% decrease in tree density in a forest community.

Three basins (Leza, Estarrún and L'Anyet) have been simulated using the Regional Hydro-Ecologic Simulation System (RHESSys) for the periods 2035-2064 and 2070-2099. The aim of the study is to determine the impacts of climate change and land management on both streamflow and other variables such as Net Primary Production or Potential Evapotranspiration in these basins (representative of Mediterranean mid-mountains) in order to analyse how the management proposed can be used to adapt these basins to climate and whether it is capable of mitigating the forecast reduction in streamflow associated with climate trends.

The results with LUC reveal a clear positive trend, increasing the streamflow in the basins of Leza and L'Anyet rivers (+9.76% and +4.70%) and slightly decrease (-0.13%) in Estarrún river due to the limited area to be managed. The combined action (CA) shows, in general, an attenuation in the clear negative trend of streamflow under climate change (CC) conditions. This suggests that the land management proposed in the LIFE MIDMACC project could help the adaptation of Mediterranean mid-mountain basins to climate change and the mitigation of its effects.

Acknowledgements: This research project was supported by the Life MIDMACC project ((LIFE18 CCA/ES/001099)) project funded by the European Commission. Melani Cortijos-López is working with an FPI contract (PRE2020-094509) from the Spanish Ministry of Economy and Competitiveness associated to the MANMOUNT project. Manel Llena has a “Juan de la Cierva Formación” postdoctoral contract (FJC2020-043890-I/AEI/ 10.13039/501100011033) from the Spanish Ministry of Science and Innovation.


How to cite: Zabalza-Martínez, J., Nadal-Romero, E., Llena, M., Cortijos-López, M., Lasanta-Martínez, T., López-Moreno, J. I., Vicente-Serrano, S. M., Pascual, D., and Pla, E.: Could land management modify water resources in Mediterranean mountain areas?, EGU General Assembly 2023, Vienna, Austria, 23–28 Apr 2023, EGU23-7013, https://doi.org/10.5194/egusphere-egu23-7013, 2023.

EGU23-7433 | Posters on site | HS2.1.6

Future evolution of the snowpack in the Iberian peninsula 

Jesús Revuelto, César Deschamps-Berger, Juan Ignacio López Moreno, Laura Sourp, Sylvia Terzago, Francisco Rojas Heredia, and Marion Réveillet

The mountains of the Iberian peninsula host seasonal snowpacks in various environments, from mediterranean climate in the Sierra Nevada to alpine climate in the Pyrenees. This range of conditions is expected to result in different, but largely unknown, sensitivity of the snowpacks to the ongoing and future climate change. We modeled the snowpack in five sites which were selected over the peninsula for their environmental importance as indicated by their national park status. We downscaled the EURO-CORDEX meteorological forcings on a 250 m grid and forced SnowModel to obtain an ensemble of spatialized snowpack simulations over the historical period (1970-2005) and a projection period (2005-2100) considering different RCP scenarios. The accuracy of the simulation was evaluated with satellite snow cover images and in-situ measurements. The general decrease in snowpack impacts the hydrological cycle temporality and the frequency of snow droughts in the basins but is modulated by the varying climatic conditions between the study sites.

How to cite: Revuelto, J., Deschamps-Berger, C., López Moreno, J. I., Sourp, L., Terzago, S., Rojas Heredia, F., and Réveillet, M.: Future evolution of the snowpack in the Iberian peninsula, EGU General Assembly 2023, Vienna, Austria, 23–28 Apr 2023, EGU23-7433, https://doi.org/10.5194/egusphere-egu23-7433, 2023.

EGU23-7654 | Orals | HS2.1.6

The impact of climate change on fish habitat availability in mountain rivers 

Gianluca Filippa, Erica Vassoney, Alberto Viglione, Paolo Vezza, Giovanni Negro, Andrea Mammoliti Mochet, and Claudio Comoglio

Mountain rivers are threatened by various natural and human-induced impacts, all of them potentially altering the availability of habitats for fish communities. These impacts include, among others, climate- change-associated reduction of discharge and water abstraction by humans, e.g., for hydropower production and irrigation. A quantitative assessment of future water, and subsequent fish habitat, availability is therefore pivotal to the effective and sustainable management of water resources in mountain basins.

In this work, we investigated the effect of climate change on discharge and fish habitat availability in two alpine catchments in the Western Italian Alps.

Historical discharge was modeled by means of a relatively simple rainfall-runoff model (TUWmodel), whereas discharge projections were computed under different state-of-the-art greenhouse gas scenarios both for the near future (2041-2060) and the far future (2080-2099). Discharge was then translated into habitat availability with the MesoHABSIM (Mesohabitat Simulation Model) methodology, an approach that allows to simulate the variations in habitat availability for the local fish population (brown and marble trout).

We found significant changes in future runoff, in turn leading to marked changes in fish habitat availability, with contrasting response in glaciated vs non glaciated basins.

We demonstrated that the combination of a hydrological model, climate scenarios and habitat modeling allows the depiction of future ecological scenarios for alpine rivers, thereby representing a potential support for water resources management and decision-making.


How to cite: Filippa, G., Vassoney, E., Viglione, A., Vezza, P., Negro, G., Mammoliti Mochet, A., and Comoglio, C.: The impact of climate change on fish habitat availability in mountain rivers, EGU General Assembly 2023, Vienna, Austria, 23–28 Apr 2023, EGU23-7654, https://doi.org/10.5194/egusphere-egu23-7654, 2023.

High mountains, which exhibit alpine and subalpine characteristics, represent 15% of the earth’s land area and are estimated to contribute about 17% of global runoff. Depending on hydrogeological setting, a significant amount of catchment water can be stored in high mountainous underground as groundwater, which can contribute substantially to streamflow and represent an important water source. However, high-alpine catchments are often characterized by great geological complexity and highly heterogeneous hydraulic properties. For that reason, proper system characterization, monitoring and modeling remain challenging. In this study, we investigated a geologically complex alpine catchment in the Dolomites (Italian Alps) by combining hydrogeological investigation, hydrological monitoring and numerical modelling. A process based but spatially lumped hydrological model was applied to simulate the continuous measured catchment discharge in a period of three years, which covers a large variation of hydrodynamic conditions. The current model structure couples the sequential hydrogeological units within the studied catchment: (1) the fractured dolomitic rocks as bedrock aquifer and 2) the unconsolidated deposits accumulating on the slopes and at the valley floor as porous aquifer. In order to evaluate the model structure and parameterization in depth, we applied a multi-step evaluation approach considering both parameter sensitivity and uncertainty. The current modelling results demonstrate that the newly developed model can reproduce most discharge behavior of aquifers. The model indicates a dynamic linkage between surface and subsurface storage units during different flow conditions. Besides the matrix and conduit flow in fractured dolomitic aquifer, it highlights the important role of unconsolidated sediments (porous aquifer) to the storage and discharge behavior of the entire groundwater system. Furthermore, with the comprehensive model evaluation we learned the model structure deficit during extreme high flow condition and proposed a more detailed hydrogeological conceptual model to improve the model realism.

How to cite: Chen, Z., Lucianetti, G., and Hartmann, A.: Understanding collective behavior of bedrock and porous aquifers and their contribution to the total water storage and discharge dynamics of a high mountainous catchment – Dolomites, Alps, EGU General Assembly 2023, Vienna, Austria, 23–28 Apr 2023, EGU23-8899, https://doi.org/10.5194/egusphere-egu23-8899, 2023.

EGU23-10024 | Posters on site | HS2.1.6 | Highlight

Groundwater pathways and storage dynamics in steep mountain topography 

Kapiolani Teagai, John Armitage, Léo Agélas, Christoff Andermann, Niels Hovius, and Basanta Raj Adhikari

The Himalayan Mountain range is considered as a sustainable large water reservoir, often termed as “water towers of Asia”. This important reservoir of water is replenished annually by monsoon precipitation and is slowly drained in dry season. However, the processes that govern this water budget: the connectivity between perched aquifers situated high in the topography and the underlying fractured bedrock, is not well understood. In this study we investigate the surface-subsurface coupling and characterize the water pathways on a watershed scale. This will help to better understand where and how water is stored within the steep Himalayan topography. The study focuses on the unglaciated Kahule Khola watershed (~33 km²) situated north of Kathmandu in the central Himalayas (ranging from ~1000 to ~3500 m asl). During two field campaigns, we mapped the location of springs before (in May 2022) and after (in November 2022) the monsoon season. We characterized the surface infiltration capacity, soil permeability and carried out multiple ERT surveys covering the first 3000 m elevation profile. All these measurements were made on the major landforms (ridges, V-shaped gullies, and debris filled gullies) and different land use types (terraces, forest, meadow, and landslide debris), giving a clear picture of the landscape structure within this catchment. Infiltration rates and soil permeability are high with an average over 1 m/d, which suggests that infiltration dominates over surface runoff during the monsoon. ERT surveys show low resistivity (from ~100 to ~1000 Ω.m) at shallow depth in line with a weathered upper soil layer. Below this layer the ridges have a higher resistivity (from ~1000 to ~50000 Ω.m) while the gullies have very low resistivities suggesting saturated perched aquifers systems close to the surface. We found that spring heads move up or down slope to the seasonal water table fluctuations, tracing the topographic intersection of the groundwater with the surface. These observations suggest that water storage is substantial but not uniformly distributed within the landscape over time and space. We propose that besides the fractured bedrock, filled gullies and landslide deposits form perched water pockets with an important role in storing and distributing water, especially in the higher parts of mountain landscape.

How to cite: Teagai, K., Armitage, J., Agélas, L., Andermann, C., Hovius, N., and Adhikari, B. R.: Groundwater pathways and storage dynamics in steep mountain topography, EGU General Assembly 2023, Vienna, Austria, 23–28 Apr 2023, EGU23-10024, https://doi.org/10.5194/egusphere-egu23-10024, 2023.

EGU23-10266 | ECS | Orals | HS2.1.6

Are rock glaciers preferential meltwater pathways to alpine aquifers? 

Bastien Charonnat, Michel Baraer, Jeffrey M. McKenzie, Eole Valence, and Janie Masse-Dufresne

A limitation in generating reliable projections of the impact of climate change on subarctic glacierized watersheds is a lack of understanding of the involved processes. While glaciers are often the targets of glacierized watershed research, glaciers are only one of the many features controlling headwater hydrology. Recent studies suggest that the contribution and evolution of other hydrological components under climate change conditions, as well as their interactions with groundwater and surface runoff, must be considered to fully predict future climate change impacts. For example, rock glaciers are recognized for their hydrogeological significance, but their hydrologic processes remain understudied. We present a research program focused on a 5 km2 glacier and rock glacier continuum in the upper section of Shar Ta Gà’ (Grizzly Creek) in the Kluane First Nation territory, Yukon, Canada. The continuum is characterized by the absence of an apparent surface hydrology outlet and no substantial groundwater exfiltration has been detected in the Shar Ta Gà’ River situated directly downstream of the rock glacier. Some diffuse groundwater seepages have been mapped but their yield represent a fraction only of the volumes that are expected from the glacier drainage area.

We apply a multimethod approach (including geophysics, hydrochemistry, and UAV based surveying) to characterize the hydrological and hydrogeological behavior of the Shar Ta Gà’ rock glacier in a context where drilling is prohibited. Here we present results from a distributed hydrologic monitoring network of extreme precipitation events that occurred between 2018 and 2022. The network records water pressure, electrical conductivity, water temperature, hydrometeorological data and time lapse images. The results depict the rock glacier as a complex, multi-channel, evolutive hydrogeological system that collects water from upstream channels and from a porous surface. The water is distributed among different reservoirs and/or preferential channels. The rock glacier appears being a node in the hydrological and hydrogeological system, collecting the waters from the continuum and allowing their transfer to granular aquifers and possibly fractured aquifers.

How to cite: Charonnat, B., Baraer, M., McKenzie, J. M., Valence, E., and Masse-Dufresne, J.: Are rock glaciers preferential meltwater pathways to alpine aquifers?, EGU General Assembly 2023, Vienna, Austria, 23–28 Apr 2023, EGU23-10266, https://doi.org/10.5194/egusphere-egu23-10266, 2023.

The Andes are among the regions most affected worldwide by water insecurity with an increasing number of vulnerable people. Particularly seasonally dry regions such as the Bolivian-Peruvian Altiplano and the Dry Andes of Central Chile and Western Argentina exhibit considerable water stress due to increasingly adverse impacts from climate and land use changes, and growing water demand.

Adaptation to changing water availability is therefore a priority, but systematic scientific and diverse knowledge on adaptation policies and experiences has barely been documented for the Andean region. Here we present the first comprehensive assessment of climate change adaptation in the entire Andes for different adaptation types (management and planning, monitoring system, nature-based solutions, grey infrastructure, financing, and awareness and behaviour) and policies (climate change law, glacier law, Nationally Determined Contributions). This study is based on work contributed to and recently published in the IPCC’s Sixth Assessment Report, Working Group II (Chapter 12: Central and South America).

In the last two decades, several policies on climate change, water protection, regulation and management laws for adaptation in the mountain water sector have been implemented. The first Framework Law on Climate Change was implemented in Peru (2018) and is under way in Colombia, Chile and Venezuela. One milestone represents the Glacier Protection Law in place in Argentina (2010–2019) and under construction in Chile (since 2005). Furthermore, new water laws that include principles of integrated water resource management have entered into force, for example, in Peru (2009) and Ecuador (2014), or are under way in Colombia (since 2009). However, current realities in the Andes show major challenges in implementing integrated and sustainable water management mechanisms and policies. These are related but not limited to political and institutional instabilities, governance structures, fragmented service provision, lack of economies of scale and scope, corruption and social conflicts.

Although a growing body of climate change adaptation-related policies and initiatives exist for the Andes, evidence on their effectiveness is scarce. In many parts of the region the level of success of adaptation measures depends largely on the governance of projects and stakeholder-based processes and is closely related to their effectiveness, efficiency, social equity and sociopolitical legitimacy. Examples of successful implementation linked to e.g. watershed protection include water funds (e.g. Quito, Ecuador) and stakeholder platform processes (e.g. Moyobamba, Peru). Even less evidence has been reported for limits of adaptation or maladaptation experiences in the water sector. Most barriers to advance adaptation in the Andes are associated with missing links of science–society–policy processes, institutional fragilities, pronounced hierarchies, unequal power relations and top-down water governance regimes.

Adaptation gaps could be bridged by strengthening transdisciplinary research at the science-policy interface with blended bottom-up and top-down approaches in locally tailored adaptation agendas. Recently, the inclusion of indigenous and local knowledges in current adaptation baselines has attracted increasing attention, particularly in regions with a high share of indigenous peoples, such as Ecuador, Peru and Bolivia. Important questions centre around how to integrate diverse knowledge from the early planning stages on, to achieve enhanced or transformational adaptation building on co-produced knowledge.

How to cite: Huggel, C. and Drenkhan, F.: Assessment of climate change adaptation to improve water security in the Andes: current policies, remaining gaps and future opportunities, EGU General Assembly 2023, Vienna, Austria, 23–28 Apr 2023, EGU23-11312, https://doi.org/10.5194/egusphere-egu23-11312, 2023.

EGU23-11342 | Posters on site | HS2.1.6

Locally relevant and accurate climate impact assessments: A case study for Bhutan 

Mark Hegnauer, Laurene Bouaziz, Bart Van den Hurk, Philippe Floch, Hideki Kanamaru, and Alessandra Gage

Understanding the impact of climate change on water resources is crucial for selecting adequate adaptation strategies at a local scale. Global meteorological re-analysis datasets are useful to evaluate current-day climate conditions and trends, as a first step in a climate change assessment in poorly gauged basins. However, these datasets often lack the level of detail to calculate meaningful climate impacts at a local scale, especially in mountainous regions, where topography and orographic effects play a crucial role on the temporal and spatial variability of climate characteristics and change. In this study, we test how the combined use of global, regional and local datasets together with fieldwork result in locally relevant climate change impact assessment. The method is applied in Bhutan, a country with large differences between hydroclimatic zones, caused by the steep topography and the occurrence of the annual Monsoon rains in the Southern half of the country. The results of this study show the large variability between different global datasets in terms of precipitation volumes. The comparison of global, regional and local meteorological datasets in combination with locally observed streamflow data suggest that the regional re-analysis dataset is the most reliable and plausible to use for the climate impact assessment. Interestingly, the two global datasets used in this study, ERA5 (Hersbach et al., 2018) and W5E5 (Lange et al., 2021), seem to either underestimate (W5E5) or overestimate (ERA5) the precipitation considerably. The regional Indian Monsoon Data Assimilation and Analysis (IMDAA, Ashrit, 2020) precipitation re-analysis dataset seems to best represent the current climate conditions in Bhutan. This conclusion was further supported during a field visit, which highlighted that the spatial variability of the precipitation was likely not well captured the local precipitation gauges, which were mostly in the valleys. As this local data is used for the bias correction of the W5E5 dataset, it is likely that W5E5 is also not representative of the spatial variability of the local climate in Bhutan. This study demonstrates the importance of local knowledge, locally observed hydrological data and fieldwork to strengthen the local and regional climate impact assessments.

References

Ashrit, R., Indira Rani, S., Kumar, S., Karunasagar, S., Arulalan, T., Francis, T., et al. (2020). IMDAA regional reanalysis: Performance evaluation during Indian summer monsoon season. Journal of Geophysical Research: Atmospheres, 125, e2019JD030973. https://doi.org/10.1029/2019JD030973  

Hersbach, H., Bell, B., Berrisford, P., Biavati, G., Horányi, A., Muñoz Sabater, J., Nicolas, J., Peubey, C., Radu, R., Rozum, I., Schepers, D., Simmons, A., Soci, C., Dee, D., Thépaut, J-N. (2018): ERA5 hourly data on pressure levels from 1959 to present. Copernicus Climate Change Service (C3S) Climate Data Store (CDS). (Accessed on < DD-MMM-YYYY >), https://doi.org/10.24381/cds.bd0915c6

Lange, S., Menz, C., Gleixner, S., Cucchi, M., Weedon, G.P., Amici, A., Bellouin, N., Schmied, H.M., Hersbach, H., Buontempo, C., Cagnazzo C., 2021. WFDE5 over land merged with ERA5 over the ocean (W5E5 v2.0). ISIMIP Repository. https://doi.org/10.48364/ISIMIP.342217

How to cite: Hegnauer, M., Bouaziz, L., Van den Hurk, B., Floch, P., Kanamaru, H., and Gage, A.: Locally relevant and accurate climate impact assessments: A case study for Bhutan, EGU General Assembly 2023, Vienna, Austria, 23–28 Apr 2023, EGU23-11342, https://doi.org/10.5194/egusphere-egu23-11342, 2023.

EGU23-12879 | ECS | Posters on site | HS2.1.6

Trend analyses and characterization of discharge patterns of Austrian springs 

Magdalena Seelig, Simon Seelig, Jutta Eybl, and Gerfried Winkler

Climate change alters the processes and components of the global water cycle. With about 50 % of the Austrian water supply depending on springs, the response of spring discharge to changes in climate is a key question of sustainable water resources management. The monitoring system of the Hydrographic Service of Austria provides long-term data of 94 springs distributed over whole Austria. With this study we provide trend analyses related to climate change and statistical analyses of spring discharge patterns related to their runoff characteristics on a national scale. The analyses account for the structure of the time series and address requirements of objectivity, transparency and reproducibility. Trend significance is assessed employing the seasonal Mann-Kendall test, and trend magnitude is calculated by the Theil-Sen slope. Autocorrelation function and pardè coefficient are calculated for each spring, similarities are explored using cluster analysis and set in a regional context. The results identify spatiotemporal patterns across Austria and highlight the significance of accurate spring flow characterization with regard to future challenges of water resources management.

How to cite: Seelig, M., Seelig, S., Eybl, J., and Winkler, G.: Trend analyses and characterization of discharge patterns of Austrian springs, EGU General Assembly 2023, Vienna, Austria, 23–28 Apr 2023, EGU23-12879, https://doi.org/10.5194/egusphere-egu23-12879, 2023.

EGU23-13133 | ECS | Posters on site | HS2.1.6

Dynamics of multi-specie pasturelands under potential climate changes. The Gran Paradiso Park of Italy. 

Sonia Morgese, Francesca Casale, and Daniele Bocchiola

Climate change’s effects are remarkable on water systems, especially for alpine mountain regions. This study aims to assess the impact of climate change upon productivity of mountain pastures in the Gran Paradiso National Park (GPNP), Italy. For this purpose, some agro-climatic indices were introduced. GPNP dynamics are linked to the complex cryospheric hydrology of Alpine catchment and to the interspecies competition, which are in turn expected to change remarkably under prospective global warming scenarios. The hydrological Poli-Hydro model was used to simulate the cryospheric processes affecting the hydrology of high altitude catchments of the area. The Poli-Pasture model was developed for the simulation of pasture vegetation growth, and completed with adaptation of the CoSMo model, to consider interspecific competition. Two species were chosen for low altitude (elevation lower than 1800 m a.s.l.), e.g. Trifolium Alpinum and Dactylis Glomerata, and two species, Festuca Rubra and Nardus Stricta, for high altitude (elevation greater than 1800 m a.s.l.).

Model calibration and validation were performed against LAI (Leaf Index Area) during 2005-2019, using observed values available from satellite imagery.

Through four scenarios from the Sixth Assessment Report of IPCC (SSP1-2.6, SSP2-4.5, SSP3-7.0 and SSP5-8.5) applied to six GCM models (CESM2, CMCC, EC-EARTH3, HADGEM3 and MPI-ESM), meteorological data up to the year 2100 were derived. Using such climate projections, future agro-climatic indices, leaf area index and pasture yield were estimated.

According to IPCC projections, during growing season, temperature will noticeably increase at the end of the century, especially in high altitude areas, where mountain areas will experience highest temperature eve, with few heat wave days.

Due to increasing temperatures, a potential increase in productivity has been found in higher areas (up to 96% more by 2050 and 123% in by 2100, according to SSP5 8.5 scenario) and a lower change in lower elevation areas. The results provide preliminary evidence of potential livestock, and thereby economic development in the valley at higher altitudes than now. Under reduction of precipitation in summer, decrease in water consumption is expected, with possible lack of available water.

How to cite: Morgese, S., Casale, F., and Bocchiola, D.: Dynamics of multi-specie pasturelands under potential climate changes. The Gran Paradiso Park of Italy., EGU General Assembly 2023, Vienna, Austria, 23–28 Apr 2023, EGU23-13133, https://doi.org/10.5194/egusphere-egu23-13133, 2023.

Recurrent flood estimation studies in Himalayan catchments located in India are crucial and require abundant monitoring and supervision. Reliable estimation of design floods for mountainous catchments corresponding to various return periods is challenging. Recently, climate change has exacerbated this challenge which pose a serious threat to the water resources within Himalayan region. The Geomorphology based Unit hydrograph theory can provide reliable estimates of design floods for Himalayan catchments. The theory involves determination of Geomorphological Instantaneous Unit Hydrograph (GIUH) corresponding to a catchment and utilizing the GIUH to predict design flood for a design rainfall input. In this study, it is envisaged to model the complex dynamics of floods in a Himalayan catchment by using a modified version of GIUH which is known as Equivalent Geomorphological Instantaneous Unit Hydrograph (E-GIUH). EGIUH overcomes many limitations associated with the conventional GIUH. The application of E-GIUH is performed for Seer catchment which is a sub-basin of Sutlej River basin. The design rainfall input to the E-GIUH is determined from Indian Meteorological Department (IMD) gridded rainfall data for the present (1951-2019) as well as the future time periods (2021-2060 and 2061-2100). Coupled Model Intercomparison Project phase 6 (CMIP6) experiments are considered to determine future projections of rainfall over Seer catchment which are subsequently used to estimate design rainfall input for future time periods. Design flood estimates are obtained for various Shared Socioeconomic Pathways (SSPs), particularly SSP126, SSP245 and SSP585 scenarios from CMIP6 experiments. The geomorphological descriptors used for development of E-GIUH model of the Seer catchment are evaluated using the GIS framework.

Keywords: Climate Change, CMIP6, E-GIUH, IMD, SSP, Seer Catchment

How to cite: Rana, S. and Chavan, S. R.: Design Flood estimation based on Equivalent Geomorphological Instantaneous Unit Hydrograph for a Himalayan catchment, EGU General Assembly 2023, Vienna, Austria, 23–28 Apr 2023, EGU23-13139, https://doi.org/10.5194/egusphere-egu23-13139, 2023.

EGU23-13389 | Orals | HS2.1.6

Tropical Alpine Ecosystems under climate change: Paramos and moorlands in peril 

Fernando Jaramillo, Kristian Rubiano, Nicola Clerici, and Adriana Sánchez

Tropical Alpine Ecosystems are high-altitude grasslands located above 3000 m.a.s.l. along the tropical belt of three continents. Their unique vegetation and soil characteristics, in combination with low temperature and abundant precipitation, create the most advantageous conditions for regulating and storing surface and groundwater. However, increasing temperatures and changing patterns of precipitation due to greenhouse-gas-emission climate change are threatening these fragile environments, reducing their extent and modifying their altitudinal distribution range. Here, we investigate the impact of climate change on the distribution and extent of global Tropical Alpine Ecosystems. We use an ensemble of historical and projected climate data (SSP585) from seven General Circulation Models from the Coupled Model Intercomparison Project Phase 6 (CMIP6) to estimate annual average values of temperature and annual accumulated values of precipitation for reference (1985-2014) and far future (2070-2100) 30-year periodos. We produced the 95% probability current and future hydroclimatic spaces for every ecosystem to determine the range at which Tropical Alpine Ecosystem currently thrives in the climatic space, and investigate a number of hydroclimatic variables. Then, we used the projected climate time-series data to assess the current Tropical Alpine Ecosystem areas that will be unable to keep up with the temperature and precipitation changes by exceeding their reference climatic boundaries in the far future. Overall, our results showed that the Tropical Alpine ecosystem would drastically reduce its extent. Approximately 45% of its current extent will experience hydroclimatic conditions beyond their reference climatic boundaries. For example, the Ethiopian montane moorlands in Africa will be the most impacted ecoregion with a reduction of approximately 95% of its current extent. For the case of páramos in the North of the South American continent, increasing temperatures and changing precipitation will render ~50% of the current extent unsuitable for these ecosystems during the dry season. Our results highlight the magnitude of the impacts of climate change on Tropical Alpine Ecosystem and the vulnerability of water security of millions of people who depend on its ecological functioning. These results also have implications for biodiversity conservation, as endemic species will be threatened by habitat reduction and shifts in their distribution ranges.

How to cite: Jaramillo, F., Rubiano, K., Clerici, N., and Sánchez, A.: Tropical Alpine Ecosystems under climate change: Paramos and moorlands in peril, EGU General Assembly 2023, Vienna, Austria, 23–28 Apr 2023, EGU23-13389, https://doi.org/10.5194/egusphere-egu23-13389, 2023.

EGU23-13993 | Posters on site | HS2.1.6

Statistical-topographical mapping of rainfall over mountainous terrain with the β-IDW approach 

Jan Wienhöfer, Lucas Alcamo, Jan Bondy, and Erwin Zehe

We present a robust approach for quantitative precipitation estimation (QPE) for water resources management in mountainous catchments, where rainfall sums and variability are correlated with orographic elevation, but density of rain gauges does not allow for advanced geostatistical interpolation of rainfall fields. 
Key of the method is modelling rainfall at unobserved locations by their elevation-dependent expected daily mean, and a daily fluctuation which is determined by spatial interpolation of the residuals of neighbouring rain gauges, which are scaled according to the elevation difference. The scaling factor is defined as the ratio of covariance and variance, in analogy to the "beta" used in economics.
The approach is illustrated for the Chirilu catchments (Chillón, Rímac, Lurín) in the Andes near Lima, Peru. The results are compared to conventional IDW interpolation and a merged national rainfall product. The method results in QPE that are better matching with observed discharges. The β-IDW approach thus provides a robust and flexible means to estimate rainfall input to mesoscale mountainous catchments.


How to cite: Wienhöfer, J., Alcamo, L., Bondy, J., and Zehe, E.: Statistical-topographical mapping of rainfall over mountainous terrain with the β-IDW approach, EGU General Assembly 2023, Vienna, Austria, 23–28 Apr 2023, EGU23-13993, https://doi.org/10.5194/egusphere-egu23-13993, 2023.

EGU23-15315 | Orals | HS2.1.6 | Highlight

Socio-hydrological pathways: Cryosphere changes and adaptation strategies in the Trans-Himalaya of Ladakh, India 

Marcus Nüsser, Dagmar Brombierstäudel, Mohd Soheb, and Susanne Schmidt

The Himalayan cryosphere is shrinking at an accelerating rate. This alarming trend is accompanied by more frequent natural hazards that threaten exposed mountain communities. Problems range from damages of irrigation canals and eroded fields to massive destruction of human habitat. Predicted changes in meltwater supply, modelled under the generic term ‘peak water’, require greater and concerted effort to understand and support local adaptation strategies to cope with experienced and predicted water scarcity. Regional development processes are further characterised by rapid and largely unplanned urbanisation, infrastructure development and related environmental degradation exacerbating risks for large numbers of people already affected by climate change. To meet these grand challenges, an interdisciplinary research perspective is needed for the Himalayan region based on the integration of natural and social sciences. Therefore, an improved understanding of socio-hydrological pathways is necessary to capture local and regional particularities and dynamics, including cryosphere changes, glacio-fluvial runoff, socioeconomic processes, indigenous environmental knowledge, and external development interventions. Based on a long-term study conducted in the Trans-Himalayan region of Ladakh, we explore the role of land use changes, water harvesting infrastructures, including implementation of ice reservoirs (so-called “artificial glaciers”) and construction of improved irrigation networks. Furthermore, the role of social institutions ranging from village to non-governmental organizations and state-sponsored development programs are considered. The presentation uses the case study of Ladakh to develop a grounded socio-hydrological framework for the fragile Trans-Himalayan region that may be used as a basis for sustainable development pathways.

How to cite: Nüsser, M., Brombierstäudel, D., Soheb, M., and Schmidt, S.: Socio-hydrological pathways: Cryosphere changes and adaptation strategies in the Trans-Himalaya of Ladakh, India, EGU General Assembly 2023, Vienna, Austria, 23–28 Apr 2023, EGU23-15315, https://doi.org/10.5194/egusphere-egu23-15315, 2023.

EGU23-15317 | ECS | Posters on site | HS2.1.6

Assessing the impact of climate change on Hydrological regime of Afghan catchments 

Jamal Shokory, Pascal Horton, Bettina Schaefli, and Stuart Lane

Rapid climate change is impacting water resources in Afghanistan, a country in the western Himalaya that is poorly developed in terms of scientific research and environmental monitoring. It is a semi-arid to arid country of Central Asia where livelihoods and economies have developed to be strongly dependent upon mountain water resources, and where snow- and glacier-melt delivers 80% of Afghanistan’s water supply. Rising average global temperatures and glacier shrinkage pose a significant threat to water supply. Once glaciers shrink to a certain size, “peak water” will be reached. Water supply will decline. If winter snowfall declines, or becomes more variable, glaciers are less likely to compensate for the associated water shortage that results, a process that will be compounded by continuing population growth and groundwater over-abstraction.

In order to understand the implications of glacier recession now and in the future with relative contributions of ice, snow and other components to water supply for Afghan water resources, three representative catchments were selected based on their locations and data availability. The TaqchaKhana catchment (264.4 km2 area with 3.1% glacier cover) in the north; the Sust catchment (4609 km2 area with 16% glacier cover) in the east; and the Bamyan catchment (325.3 km2 area with 0.7% glacier cover) in the center of Afghanistan. Climate and streamflow data for 2012 to 2019 obtained from Ministry of Energy and Water of Afghanistan.

In this study the glacier and snowmelt – soil contribution (GSM-SOCONT) hydrological model was modified to allow a simple representation of the effects of debris cover development on ice melt which is commonly overlooked in hydrological models of mountain water resources. The model was individually calibrated for each catchment based on Shuffled Complex Evolution Algorithm (SCE-UA), with the best parameters taken after 20,000 iterations. Eight regional climate models (RCMs) under two scenarios (2.6 and 8.5) were used in the model to simulate future streamflow in the catchments. The RCMs were bias corrected using non-parametric statistical transformation. Future glacier evolution was introduced to the model using a very simple propagation of current measured glacier recession rates into the future. After calibration on data for the periods 2012-2019 and an associated uncertainty analysis, the models were deemed sufficient to understand the relative importance of different sources to water supply and to predict future water supply. The current contributions from glacier melt were observed to be 70% for the Sust catchment, 49% for the TaqchaKhana catchment, and 11% for the Bamyan catchment. Future climate conditions initially increased the ice melt contribution for the Sust and the TaqchaKhana but reduced it for the Bamyan, confirming our hypothesis that direct effects of changing temperature and precipitation in Afghanistan are likely masked by a glacial subsidy.

How to cite: Shokory, J., Horton, P., Schaefli, B., and Lane, S.: Assessing the impact of climate change on Hydrological regime of Afghan catchments, EGU General Assembly 2023, Vienna, Austria, 23–28 Apr 2023, EGU23-15317, https://doi.org/10.5194/egusphere-egu23-15317, 2023.

EGU23-15451 | ECS | Orals | HS2.1.6

Understanding the seasonal and spatial variation of water balance in the Karnali basin in Nepal 

Pranisha Pokhrel, Jasper Griffioen, and Walter Immerzeel

The hydrology of large mountainous basins is sensitive to climate and land use change and impacts downstream availability in a diverse way. Our knowledge of the spatial and temporal variation of the water balance for large-scale mountainous basins like the Karnali (40,000 km2) is very limited.  Studies focus either on small alpine catchments or on major river basins of near continental scale. Studies focusing on the intermediate scale, where mountain water supply is directly linked to people and ecosystems downstream are scarce, but needed. In this study, we provide insight into the seasonal and spatial differences in meltwater contribution to streamflow, rain runoff, evapotranspiration and groundwater baseflow, with a particular focus on upstream-downstream dependencies. We use a high-resolution SPHY model, which we calibrate step-wise using satellite data of glacier mass balance and snow covers and observed river flow data. We explore the hydrological variability at the sub-basin scale, discuss the seasonal and spatial heterogeneity of the water balance components, and seek to understand the major drivers. Our results provide a baseline against which impacts of climate and land use changes will be assessed in a subsequent study.

How to cite: Pokhrel, P., Griffioen, J., and Immerzeel, W.: Understanding the seasonal and spatial variation of water balance in the Karnali basin in Nepal, EGU General Assembly 2023, Vienna, Austria, 23–28 Apr 2023, EGU23-15451, https://doi.org/10.5194/egusphere-egu23-15451, 2023.

EGU23-17182 | ECS | Posters on site | HS2.1.6

Sustainable water management under climate change in Southern Ecuador 

Johanna Ochoa Ruilova, María Alvarado-Carrión, Jairo Cabrera, Rolando Célleri, Patricio Crespo, Pablo Guzmán-Cárdenas, Santiago Núñez-Mejía, and Ana Ochoa-Sánchez

Global warming and changes in the magnitude and spatial distribution of precipitation have already reduced water availability in many mountain areas, including the Andes Mountain range (IPCC, 2022). Globally, approximately 2.3 billion people are currently living in highly water-stressed areas (UN Water, 2021). By the end of the century, humid and semi-humid regions would decrease by 2.3 and 4.9 %, respectively (Tabari, 2020). These scenarios, together with population and water demand increase result in (i) the water demand risks to exceed the existing capacity of water supply and (ii) the wastewater treatment infrastructure fails to treat all polluted effluent water. As such, we proposed a project to the VLIR-UOS TEAM initiatives and got funded from 2022 to 2027. Our project aims to define the effect of climate change and increasing water demand projections and to propose and develop water management strategies that will secure the water supply of Andean cities in the future.

Our study site is Cuenca, a middle-size city located in southern Ecuador and, as many Andean cities, lacks of enough data (e.g. water scarcity is uncertain on its scale and periodicity all along the region) that allows informed decision making. In this sense, this project will reduce the uncertainty of global scenarios to propose adequate bottom up adaptation strategies that lead to better water resources management at a household and
regulatory level. The objectives of the proposed project are built under the Integrated Water Resource Management approach (IWRM) and water security. During a first phase, the project will provide climate and hydrological projections in the main catchments in Cuenca for the period 2020-2050 and during the second phase, we will provide water availability projections and water management adaptation plans built with citizens and decision makers.

A priority of this project is to enhance capacity building of local governments (e.g. Municipality of Cuenca, ETAPA EP which is the local water company), national institutions and Universities; this is key to achieve the transfer of knowledge and capacity building to the partner Universities and partner institutions. Citizens and other stakeholders are also key elements for the development of this initiative. Our ultimate goal is to implement the adaptation strategies proposed during the development of this project in the plans, policies and regulations for the city, working together with the citizens in three key axes: educommunicational activities, new or additional normative proposals, and infrastructure strategies. Furthermore, there is the need to propose and evaluate climate adaptation strategies applied to Andean cities (including outside Ecuador), and thus the methodology developed in the project will be made available to those cities.

The proposed project takes environment indirectly as one of the main objectives since the development of water management strategies considering climate change and increasing water demand, will directly contribute to the improvement and stabilization of the environment. Additionally, the project considers gender balance, with a female project director in Cuenca and a 40% female presence in co-promoters and team members.

How to cite: Ochoa Ruilova, J., Alvarado-Carrión, M., Cabrera, J., Célleri, R., Crespo, P., Guzmán-Cárdenas, P., Núñez-Mejía, S., and Ochoa-Sánchez, A.: Sustainable water management under climate change in Southern Ecuador, EGU General Assembly 2023, Vienna, Austria, 23–28 Apr 2023, EGU23-17182, https://doi.org/10.5194/egusphere-egu23-17182, 2023.

EGU23-315 | Posters on site | HS2.1.7

The importance of snowmelt in the water balance of the Toconao sub-basin, Salar de Atacama 

Sonia Valdivielso, Enric Vázquez-Suñé, Juan Ignacio López Moreno, Emilio Custodio, Rotman Criollo Manjarrez, John W. Pomeroy, and Ashkan Hassanzadeh

The Salar de Atacama basin is one of the best-studied saline endorheic basins in the world due to the delicate balance between extraction of lithium-rich brine from its core, tourism, and the unique ecosystems of its surrounding lagoons. However, no study to date has quantified the contribution of snowmelt compared to rainfall in supporting groundwater recharge in the basin. In this work, satellite information (Moderate Resolution Imaging Spectroradiometer, MODIS) is used to characterize the spatial and temporal dynamics of snow coverage. However, snow equivalent water is not available from remote sensing, so the Cold Regions Hydrological Model (CRHM) was used to simulate snow water equivalent, runoff, infiltration and other hydrological processes governing the water balance and groundwater recharge. CRHM makes it possible to link physical processes to hydrological processes using hydrological response units (HRU) as control volumes for water balances and as a means of discretizing the basin. HRU were defined in the Toconao sub-basin, in the eastern part of the Salar de Atacama watershed and CRHM was parameterized from regional hydrological knowledge and run for several years, forced by reanalysis data. Special attention was paid to better understand the energy balance of snow, including sublimation and wind transport ablation losses, soil infiltration processes, and the role of snowmelt in surface runoff generation and direct and indirect groundwater recharge.

Satellite observations of snow cover recorded from 2000 to 2020 showed frequent snowfalls both in summer and winter. The greatest extent of snow cover occurred during winter, accounting for 60% of the annual snow-cover extent. Snow cover is generally located above 4500 m asl in summer, while in winter the snow cover is more extensive, covering a large part of the basin. The CRHM simulations show that the greatest amount of precipitation of the year falls as rain in the summer months with the drier winter dominated by snowfall. The intense summer rains produce the greatest annual fluxes of runoff and infiltration. In winter, snowmelt infiltration is approximately twice that from rainfall. Snow losses by wind transport and sublimation had little impact on the overall water balance despite the dry environment.

How to cite: Valdivielso, S., Vázquez-Suñé, E., López Moreno, J. I., Custodio, E., Criollo Manjarrez, R., Pomeroy, J. W., and Hassanzadeh, A.: The importance of snowmelt in the water balance of the Toconao sub-basin, Salar de Atacama, EGU General Assembly 2023, Vienna, Austria, 23–28 Apr 2023, EGU23-315, https://doi.org/10.5194/egusphere-egu23-315, 2023.

Snowmelt runoff is a significant component in the glacierized and snow-covered basins of the western Himalaya. Modelling is the most useful tool to quantify snowmelt contribution in mountainous rivers, but the paucity of in-situ observations makes the model calibration quite challenging and therefore model parameters are often adopted from the neighboring river basins. In the present study, we applied Snowmelt Runoff Model (SRM) in the Chandra-Bhaga Basin and Chhota Shigri Glacier Catchment in the western Himalaya. We systematically checked the transferability of the model parameters between the catchment and basin. Using snow cover area (SCA), precipitation, and temperature as inputs, the daily discharge for the Chhota Shigri Catchment and Chandra-Bhaga Basin was reconstructed over 2003–2018. The mean annual discharge was found as 1.2 ± 0.2 m3/s and 55.9 ± 12.1 m3/s over 2003-2018 for the Chhota Shigri Catchment and Chandra-Bhaga Basin, respectively. The discharge in the Chhota Shigri Catchment was mainly controlled by summer temperature and summer SCA, whereas in the Chandra-Bhaga Basin summer SCA and summer precipitation controlled the discharge. At both the catchment and basin scale, the decadal comparison revealed an increase (11% and 9%) and early commencement (10 days and 20 days) of the maximum monthly discharge over 2011-2018 compared to 2003-2010. In the Chhota Shigri Catchment, the model output is almost equally sensitive to the 'degree day factor' and 'runoff coefficient for snow,' but most sensitive to the 'runoff coefficient for snow' in the Chandra-Bhaga Basin. Even though the SRM parameters were calibrated in a data-rich Chhota Shigri Glacier Catchment, their application in the Chandra-Bhaga Basin led to a large discharge overestimation at the basin scale and was not transferable even in the same basin. We suggest to be cautious while adopting/transferring model parameters for SRM from other basins, particularly for the ungauged basins.

How to cite: Vinze, P. and Azam, M. F.: Evaluation of Parameter Transferability of Snowmelt Runoff Model in Chandra-Bhaga Basin, India, EGU General Assembly 2023, Vienna, Austria, 23–28 Apr 2023, EGU23-534, https://doi.org/10.5194/egusphere-egu23-534, 2023.

EGU23-1361 | Posters on site | HS2.1.7

A snow reanalysis for Italy: IT-SNOW 

Francesco Avanzi and the IT-SNOW team

Quantifying the amount of snow deposited across the landscape at any given time is the main goal of snow hydrology. Yet, answering this apparently simple question is still elusive -- particularly in complex and high-elevation terrains where data are sparse. To contribute to the advancement of snow hydrology in Mediterranean regions, we present the first serially complete and multi-year snow reanalysis for Italy (IT-SNOW). IT-SNOW covers the period from September 2010 to August 2021, with future updates envisaged on a regular basis. This reanalysis is the output of a real-time snow and glacier monitoring chain – S3M Italy -- developed for the Italian Civil Protection Department by CIMA Research Foundation. Spatial resolution is 500 m, with input data coming from thousands of weather stations across the Italian territory. By assimilating blended snow-covered area maps from Sentinel-2, MODIS, and the Eumetsat H-SAF products, as well as interpolated snow-depth maps from in-situ data, IT-SNOW optimally combines dynamic modeling and data towards reconciled estimates of snow amount and water equivalent at various scales. IT-SNOW was validated using Sentinel-1-based maps of snow depth and in-situ snow data in the Alps and the Apennines, with little bias compared to the former and typical Root Mean Square Errors of 30 to 60 cm and 90 to 300 mm for snow depth and Snow Water Equivalent, respectively. A comparison at 102 gauge stations showed a strong (0.87) correlation between peak SWE in IT-SNOW and measured annual streamflow, with snow being 22% of annual streamflow on average. IT-SNOW is freely available at the following DOI: https://doi.org/10.5281/zenodo.7034956 and we encourage users to validate and provide critical feedback for future releases.  

How to cite: Avanzi, F. and the IT-SNOW team: A snow reanalysis for Italy: IT-SNOW, EGU General Assembly 2023, Vienna, Austria, 23–28 Apr 2023, EGU23-1361, https://doi.org/10.5194/egusphere-egu23-1361, 2023.

EGU23-1557 | ECS | Posters on site | HS2.1.7

The potential use of high-resolution SWE estimates from remote sensing imagery to predict snow melt rates 

Valentina Premier, Nicola Ciapponi, Michele Bozzoli, Giacomo Bertoldi, Riccardo Rigon, Claudia Notarnicola, and Carlo Marin

Snow water equivalent is a key variable in hydrology. An accurate SWE estimation is crucial for runoff prediction, especially for catchments with strong nival regimes. Direct observations are unfortunately rare and are available only at a point scale. Accurate spatialized estimates of SWE are thus difficult to be obtained. Physically based models often suffer from the inaccuracies of input data and uncertainty of model parametrization. In this sense, the integration of traditional techniques with remote sensing observation is valuable. Although current satellite missions do not provide direct SWE observation, they allow us to extract important proxy information that is crucial for SWE reconstruction. In this sense, we propose to exploit optical and radar sensors to retrieve accurate information on the persistence of snow on the ground. In fact, the longer the persistence, the deeper the snowpack. To achieve enough spatial and temporal detail, we merged multi-scale information from MODIS, Sentinel-2, and Landsat missions. The key idea is to exploit the snow pattern persistence that we can observe with good spatial detail from Landsat and Sentinel-2 missions to reconstruct the scene when a low-resolution image (MODIS) is acquired. Furthermore, information on the duration of the melting phase can also be retrieved by exploiting the synthetic aperture radar (SAR) mounted on board of Sentinel-1. Hence, we can estimate the number of days of melting. In-situ data, when available, are also exploited in the reconstruction. In detail, air temperature is used to estimate the potential melting and the snow depth increases to determine the number of days in accumulation. The reconstruction approach is then simple: by knowing the days in melting, the total amount of melted SWE is determined. Assuming that the melted SWE is equal to the accumulated SWE, we can redistribute SWE throughout the season using a simple approach as the degree day. The final output is a daily time-series with a spatial resolution of few dozens of m. One of the major advantage of the proposed approach, compared to more traditional SWE estimation techniques, is that it does not depend from precipitation observation, often highly uncertain in high-elevation catchments. When evaluated against a reference product (i.e., Airborne Snow Observatory), the method shows a bias of -22 mm and an RMSE of 212 mm for a catchment of 970 km2 in Sierra Nevada (CA). In this work, we investigate the relationship between the melted SWE and the measured riverine discharge for a number of catchments in South Tyrol (Italy). The results may be of great interest, especially for poorly monitored basins with highly variable snow accumulation that are exploited for hydroelectric energy production. In detail, we propose a long-term analysis on SWE time-series to understand if there are evident trends that might improve hydroelectric power management.  

How to cite: Premier, V., Ciapponi, N., Bozzoli, M., Bertoldi, G., Rigon, R., Notarnicola, C., and Marin, C.: The potential use of high-resolution SWE estimates from remote sensing imagery to predict snow melt rates, EGU General Assembly 2023, Vienna, Austria, 23–28 Apr 2023, EGU23-1557, https://doi.org/10.5194/egusphere-egu23-1557, 2023.

EGU23-4012 | ECS | Orals | HS2.1.7

How well do global snow products characterize snow storage in High Mountain Asia? 

Yufei Liu, Yiwen Fang, Dongyue Li, and Steven A. Margulis

Accurate characterization of peak snow water storage is essential for assessing warm-season water availability in regions reliant on snowmelt-driven runoff. However, knowledge of peak snow water storage in data-sparse regions, such as High Mountain Asia (HMA), is still lacking due to overreliance on model-based estimates. Here, estimates of peak snow storage from eight global snow products were evaluated over HMA, using a newly developed High Mountain Asia Snow Reanalysis (HMASR) dataset as a reference. The particular focus of this work was on peak annual snow storage, as it is the first-order determinant of warm-season water supply in snow-dominated basins.

The results suggest large uncertainty in the eight global snow products in High Mountain Asia, with the climatological peak storage found to be 161 km3 ± 102 km3 across products. Compared to HMASR, most global snow products underestimate peak snow storage in HMA, with an average 33% underestimation. Large inter-product variability in cumulative snowfall (335 km3 ± 148 km3) is found to explain most of the peak snow storage uncertainty (>80%). Significant snowfall loss to ablation during accumulation season (51% ± 9%) also plays an important role in peak snow storage uncertainty, and deserves more investigation in future work.

How to cite: Liu, Y., Fang, Y., Li, D., and Margulis, S. A.: How well do global snow products characterize snow storage in High Mountain Asia?, EGU General Assembly 2023, Vienna, Austria, 23–28 Apr 2023, EGU23-4012, https://doi.org/10.5194/egusphere-egu23-4012, 2023.

EGU23-4071 | ECS | Posters on site | HS2.1.7

Long term hydrological dynamics of an Alpine glacier 

Maria Grazia Zanoni, Elisa Stella, and Alberto Bellin

Several studies have been showing that major environmental changes will occur in mountainous regions, with dramatic effects in glacierized areas. In particular, the Alps are experiencing a sharper rising in air temperature, compared to other regions. The European Alps are water towers providing fresh water to highly populated areas in a fragile environment with ecosystems and human activities that adapted to low flow and storage in winter followed by high flow in summer. This dynamic is in phase with agricultural use and touristic needs while hydropower makes use of reservoirs to allow
flexibility and increase production in the most profitable periods. Climate change may significantly impact this timing, thereby changing the scenario and introducing new challenges in water resources management.

In the present work, we comprehensively analyzed the long-term (1976-2019) meteorological and streamflow time series of a small (8.5 km2) Alpine glacierized catchment, fed by the Careser glacier, in Peio valley, Italy. A Dense Deep feed-forward Neural Network (DNN) was employed to gap-fill the daily time series of the streamflow, available since 1976. Daily temperature and monthly precipitations at the glacier were obtained by interpolating the measurements at the 32 closest meteorological stations by Kriging with the External Drift.

The resulting reconstructed time series were used to investigate the changes in streamflow from 1976. The analysis revealed that precipitation did not change significantly in the observed period. On the contrary, a statistically significant temperature increase was observed (∆T = 0.022, 0.052, 0.046 oC y−1 for the maximum, minimum and mean daily temperatures), which is, therefore, the main driver of the observed changes in the streamflow. Ablation, in terms of loss of glacier thickness, continued to increase, but the glacier’s contribution to summer runoff first increased, up to the middle of the nineties of the previous century, and successively decreased dramatically as an effect of the reduction of the glacier area. In addition, significant anticipation of the summer streamflow peak was observed in the last decade.

The proposed analysis evidenced how the rise of temperature in the Alpine region is already having a profound impact on streamflow seasonality, which is expected to exacerbate in the near future, given the projected further increase of the temperature. More from a technical point of view, the combination of classical geostatistical methods with DNN allowed a reliable reconstruction of meteorological and hydrological missing data. The algorithms developed in this study can be easily exported in other similar situations.

How to cite: Zanoni, M. G., Stella, E., and Bellin, A.: Long term hydrological dynamics of an Alpine glacier, EGU General Assembly 2023, Vienna, Austria, 23–28 Apr 2023, EGU23-4071, https://doi.org/10.5194/egusphere-egu23-4071, 2023.

EGU23-4515 | ECS | Orals | HS2.1.7 | Highlight

A glacio-hydrological perspective on the extreme year 2022 in Switzerland 

Marit Van Tiel, Matthias Huss, Massimiliano Zappa, and Daniel Farinotti

Summer 2022 broke numerous glaciological, hydrological and climatological records in Europe. Dry and warm conditions led to extreme low-water levels and problems with water supply. The hot summer in combination with little snow in winter was disastrous for the Swiss glaciers; they never lost as much volume in the century-long observational record. At the same time, this massive glacier melt meant an alleviation of the downstream hydrological drought situation. Glacier contributions to streamflow during hot and dry periods, as well as their changes due to glacier retreat are, however, poorly quantified.

In this study, we characterize the glacio-hydrometeorological extremeness of the hydrological year 2022 in Switzerland and compare it with other exceptional years in the past. Observational streamflow records from about 80 stations along glacier-fed rivers were analyzed, together with (i) temporally downscaled and spatially extrapolated glacier mass balance observations, as well as (ii) temperature and precipitation information. Results show that precipitation and temperature were exceptional, but there have been years since 1961 that were warmer or drier. However, the combined effect of low precipitation and high temperatures led to record-low summer flows throughout Switzerland, apart from the Rhone river, the upstream part of the Aare river, and a few high-elevation catchments. Catchments with a glacier cover of more than 20% even resulted in above normal summer streamflow in 2022.

The annual relative meltwater contribution from glacierized areas ranged from a few percent up to 80% of the total streamflow among the catchments and equaled up to double the mean contribution estimated for the period 1981-2010. Although 2022 glacier volume losses broke records, only a few catchments showed a record amount of glacier melt water contribution to streamflow. This may hint that for most catchments, glacier retreat is dominating the melt response to extreme warm conditions, instead of differences in the respective meteorological conditions. This process reduces the crucial capacity of glaciers to alleviate downstream drought conditions. Overall, the study highlights the need for an integrated analysis of meteorological, hydrological and glaciological data to understand the spatiotemporal dynamics of extreme dry and warm years. 

How to cite: Van Tiel, M., Huss, M., Zappa, M., and Farinotti, D.: A glacio-hydrological perspective on the extreme year 2022 in Switzerland, EGU General Assembly 2023, Vienna, Austria, 23–28 Apr 2023, EGU23-4515, https://doi.org/10.5194/egusphere-egu23-4515, 2023.

EGU23-5576 | Posters on site | HS2.1.7 | Highlight

Past and future decrease in snow in the central European rain-snow transition zone 

Michal Jenicek, Ondrej Nedelcev, Jan Hnilica, and Vaclav Sipek

Mountains are referred to as water towers because they substantially affect the hydrology of downstream areas. However, snow storages will decrease in the future due to the increase in air temperature which will affect streamflow regime and water availability. Therefore, the main objectives of our research were 1) to quantify past and future changes in snow storages for a large set of mountain catchments representing different elevations and 2) to analyse how snow responds to climate variability. The snow storage was simulated for 59 mountain catchments located in six mountain regions in Czechia for the period 1965–2019 using a bucket-type catchment model. The predictions of the future climate from EURO-CORDEX experiment were considered in the model to simulate the future change in snow.

Analyses using the Mann-Kendall test identified decreasing trends in snow storages in western parts of Czechia (by up to −45 mm per decade), while no trends were detected in eastern part of Czechia suggesting the partly different climatology of both regions. In contrast to weak trends in SWE, significant trends were documented for snow cover duration, which decreased on average by 5.5 days per decade. The reason was mostly earlier snowmelt and melt-out, while trends in snow cover onset were not identified. Nevertheless, snow responded differently to climate variables across elevations. Below 900 m a.s.l., the snow was controlled mainly by air temperature, while above 1200 m a.s.l., snow responded dominantly to changes in precipitation. With the increase in air temperature in last five decades, its importance in controlling snow storage and variability increased at all elevations.

While only some significant changes in Czechia were documented in last five decades, substantial changes are expected by the end of the 21st century, such as the decrease in annual maximum SWE by 30-75%, mainly at elevations below 1200 m a.s.l. Changes are also expected for other snow-related variables, such as snow cover duration, which will be shorter, especially due to earlier start of the melting season and thus melt-out. In general, the melt-out day is projected to occur by 30-60 days earlier compared to current conditions by the end of the century. The results also showed the large variability between individual climate projections and indicated that the increase in air temperature causing the decrease in snowfall might be partly compensated by the increase in winter precipitation. Changes in snowpack will cause the highest streamflow during melting season to occur one month earlier, in addition to lower spring runoff volumes due to lower snowmelt inputs. Additionally, the model predicted the increase in winter runoff for the future period due to the increase in air temperature and thus the shift from snowfall to rain. These changes may impose more pressure to create adaptation strategies for water reservoirs management to keep all reservoir functions, such as flood and drought protection, drinking water supply and hydropower.

How to cite: Jenicek, M., Nedelcev, O., Hnilica, J., and Sipek, V.: Past and future decrease in snow in the central European rain-snow transition zone, EGU General Assembly 2023, Vienna, Austria, 23–28 Apr 2023, EGU23-5576, https://doi.org/10.5194/egusphere-egu23-5576, 2023.

EGU23-6591 | ECS | Posters on site | HS2.1.7

Exploring the pathways of precipitation, snowmelt and glacier melt through the subsurface in high resolution, coupled, data-driven modeling experiment of the Langshisha catchment in the Himalaya 

Caroline Aubry-Wake, Lauren Somers, Varya Bazilova, Philip Kraaijenbrink, Sonu Khanal, and Walter Immerzeel

 Groundwater can be an important water source for mountain streams. To gain insights into the sources of groundwater recharge and their pathways to the downstream environments, the interactions between surface water and groundwater are investigated for the Langshisha catchment, in the Langtang basin, Nepal Himalaya. The 0.81 km2 study area ranges in elevation from 4130 to 4450 m. a.s.l., with a landscape of coarse debris, pocket meadows and moraine sediments. It is bordered on three sides by steep mountain cliffs, the Langshisha glacier outlet creek, and the Langtang river.  To simulate the hydrological behaviour of the area, we couple the glacio-hydrological model Spatial Processes in Hydrology (SPHY), a spatially distributed water balance model and the groundwater flow model MODFLOW6. We analyze three approaches to simulate the subsurface hydrology of the area:  (1) using the glacio-hydrological model alone, (2) a one-way coupling of the glacio-hydrological model with a groundwater numerical model, where the groundwater recharge from the glacio-hydrological model is used as input to the groundwater model, and (3) a two-way coupled surface water and groundwater model. The model is evaluated with in-situ field data of soil moisture, shallow groundwater levels and streamflow measurements collected intermittently over the 2013-2022 period as well as isotopic and geochemistry water sample data collected in November 2022.  Preliminary results suggest that despite the additional computational demands and time required to develop and apply a fully coupled approach, it provides essential knowledge regarding the cryosphere-surface water-groundwater interactions. Our preliminary results showcase the importance of field observations to constrain modelling efforts and will serve to guide further model applications to assess the importance of representing cryosphere-surface water-groundwater interactions in mountain landscapes. 

How to cite: Aubry-Wake, C., Somers, L., Bazilova, V., Kraaijenbrink, P., Khanal, S., and Immerzeel, W.: Exploring the pathways of precipitation, snowmelt and glacier melt through the subsurface in high resolution, coupled, data-driven modeling experiment of the Langshisha catchment in the Himalaya, EGU General Assembly 2023, Vienna, Austria, 23–28 Apr 2023, EGU23-6591, https://doi.org/10.5194/egusphere-egu23-6591, 2023.

EGU23-7664 | ECS | Orals | HS2.1.7

Surface and subsurface hydrology of a high-altitude catchment in the Trans-Himalayan region of Ladakh, India 

Mohd Soheb, Peter Bastian, Marcus Nüsser, Susanne Schmidt, Shaktiman Singh, Himanshu Kaushik, and Alagappan Ramanathan

In the cold-arid Trans-Himalayan region of Ladakh, cryospheric meltwater plays a critical role for irrigated agriculture and local livelihoods. Despite the vital importance of reliable water supply under conditions of ongoing climate change, the relative contributions from glaciers and seasonal snow cover melt, together with permafrost thaw to surface and subsurface discharge are largely unknown due to the lack of in-situ data and local hydrological modelling. This study attempts to improve the understanding of regional hydrology, based on the case study of Stok catchment, where snow and glacier meltwater feeds a village of more than 300 households. We quantified long-term (2003-2019) surface and subsurface flow using a distributed temperature index and coupled surface/subsurface flow models forced by daily in-situ, meteorological, satellite and reanalysis data. These models were calibrated with the measured discharge data from two summer periods (2018 and 2019) in order to better understand the characteristics of surface and subsurface hydrology of the catchment. We also investigated the specific contributions from the cryospheric components and from rainfall to the total flow, and water loss through sublimation. A decline in annual discharge with characteristic inter-annual variations was identified over the observation period with about half of the total accumulated flow through the subsurface. We found that snowmelt contribution was highest (~60%) followed by ice melt (~20%) and rainfall (~15%), whereas sublimation contributes to ~8% of the water loss in a hydrological year. The findings and approach of this study are important for applied hydrological studies and planning future water management strategies in the region of Ladakh.

How to cite: Soheb, M., Bastian, P., Nüsser, M., Schmidt, S., Singh, S., Kaushik, H., and Ramanathan, A.: Surface and subsurface hydrology of a high-altitude catchment in the Trans-Himalayan region of Ladakh, India, EGU General Assembly 2023, Vienna, Austria, 23–28 Apr 2023, EGU23-7664, https://doi.org/10.5194/egusphere-egu23-7664, 2023.

The water balance of high-alpine glacierized catchments is largely dominated by snow and ice processes. When modelling the hydrological response of such catchments, a reliable representation of snow/ice accumulation and melt should be ensured, especially when studying the effects of climate change. Even though numerous state-of-the-art hydrological models are able to adequately represent the contribution of snow melt into the total runoff with the use of complex approaches (e.g. energy balance models), glacier dynamics are still based on conceptual or empirical methods, which exhibit some limitations compared to more sophisticated models (e.g. explicit ice-flow dynamics).
The Water Flow and Balance Simulation Model (WaSiM) is a process-based hydrological model that includes an empirical volume-area scaling approach for describing the glacier’s evolution. Although acceptable estimates can be obtained with this approach, an integration to a more complex glacier representation is still missing. For this reason, a coupling scheme between WaSiM and the Open Global Glacier Model (OGGM) is developed, hence accounting for explicit ice-flow dynamics.
The workflow consists mainly on three steps: i) a first WaSiM run to obtain monthly values of temperature and precipitation that serve as input for the ii) second step, which is running OGGM. Finally, iii) a dynamic model run of WaSiM with the updated output from OGGM (annual glacier outlines and ice thickness) is performed. Within this last step, the glacier’s volume internally calculated by WaSiM (i.e. with the VA-scaling approach) is replaced by OGGM’s output, while performing a simultaneous multi-data set automatic calibration. In this calibration, only WaSiM parameters are adjusted and simulation results are compared against glacier mass balances (OGGM) and observed runoff. The performance of the calibration is then evaluated in terms of a weighted multi-objective function. Although the best fit between observed and simulated runoff is achieved when considering only runoff observations (single-data calibration), glacier components are better represented when calibrating the coupled model with the multi-data set (i.e. also including glacier mass balances). Therefore, a trade-off is made between general model performance and accurate runoff prediction. 
This coupling scheme is aimed for hydrological modellers with no additional expertise on glacier modelling, since OGGM is set up according to its default parameters. Finally, it could serve as a tool not only to predict the hydrological response of any glacierized catchment (even without any available glacier data), but also to make predictions under future climate projections with a more reliable representation of glaciers. 

How to cite: Pesci, M. H. and Förster, K.: Process-based water balance modelling with explicit ice-flow dynamics and multi-data set calibration: the WaSiM-OGGM coupling scheme, EGU General Assembly 2023, Vienna, Austria, 23–28 Apr 2023, EGU23-7688, https://doi.org/10.5194/egusphere-egu23-7688, 2023.

EGU23-7950 | ECS | Posters on site | HS2.1.7

Utilization of snow depth patterns to derive spatially distributed precipitation correction factors for operational hydrological modelling 

Thomas Pulka, Franziska Koch, Mathew Herrnegger, and Karsten Schulz

Simulations and information on snow cover dynamics and snowmelt in high-alpine catchments are essential for the operation of storage hydropower plants in order to predict reservoir inflow during the snowmelt season. The distribution of the seasonal snowpack is driven by the mountainous topography and vegetation, the predominant weather patterns as well as the microclimatic conditions in the area of interest. At the same time, observations of precipitation and its distribution, the basis for modelling the spatio-temporal distribution of the snowpack, are rare and error-inflicted in these regions. Especially winter precipitation is often largely underestimated in high-alpine areas. Due to the manifold and multiscale influencing factors and scarcity of measurements, the estimation of inputs for hydrological simulations in the mountains is challenging and afflicted by many uncertainties. Snow depth data in a high spatial resolution can, e.g., be obtained via terrestrial, airborne or spaceborne remote sensing techniques and can be used to support snow-hydrological modelling. Vögeli et al. (2016) showed that such snow depth maps, taken at the end of the snow accumulation period, can be utilized for precipitation scaling to significantly improve snowpack modelling in terms of spatial distribution and quantity. This study examines the benefit and challenges of precipitation scaling for enhancing reservoir inflow predictions by applying the conceptual hydrological model COSERO (Herrnegger et al., 2016). The model is computationally efficient and was successfully calibrated and validated in numerous catchments in Austria and neighbouring countries. Among other catchments, COSERO is used operationally by the hydropower operator VERBUND AG in the high-alpine headwater catchments of the Kölnbrein reservoir in the Malta Valley, the largest reservoir in Austria with a capacity of 200 million m³. The basis of our meteorological model forcings is the INCA precipitation analysis product, provided by the Austrian Central Institute for Meteorology and Geodynamics. We applied the precipitation scaling based on snow depth patterns on the INCA data in a sub-daily and sub-kilometre resolution. We investigate, if this approach leads to a more realistic representation of alpine snowpack and runoff simulated by COSERO, aiming to improve operational reservoir management.

Acknowledgements: We thank the VERBUND AG for fruitful discussions and providing us with data.

Bibliography

Herrnegger, M., Senoner, T., Nachtnebel, H.-P., 2016. Adjustment of spatio-temporal precipitation patterns in a high Alpine environment. Journal of Hydrology 556, 913–921. https://doi.org/10.1016/j.jhydrol.2016.04.068

Vögeli, C., Lehning, M., Wever, N., Bavay, M., 2016. Scaling Precipitation Input to Spatially Distributed Hydrological Models by Measured Snow Distribution. Front. Earth Sci. 4. https://doi.org/10.3389/feart.2016.00108

How to cite: Pulka, T., Koch, F., Herrnegger, M., and Schulz, K.: Utilization of snow depth patterns to derive spatially distributed precipitation correction factors for operational hydrological modelling, EGU General Assembly 2023, Vienna, Austria, 23–28 Apr 2023, EGU23-7950, https://doi.org/10.5194/egusphere-egu23-7950, 2023.

EGU23-8748 | ECS | Orals | HS2.1.7

Glacier and snow melt contributions to streamflow on James Ross Island, Antarctic Peninsula 

Ondřej Nedělčev, Michael Matějka, Kamil Láska, Zbyněk Engel, Jan Kavan, and Michal Jeníček

Antarctic Peninsula region experienced a rapid increase in air temperature during the second half of the 20th century. Although the warming was interrupted in the first decades of the 21st century, future climate projections predict that air temperature will increase significantly until the end of the 21st century in this area. Changes in air temperature have large impact on runoff process, especially in proglacial environment. Even though these changes affects both terrestrial and marine ecosystems, runoff generation in Antarctic Peninsula region is still poorly understood. Therefore, we analysed runoff process in small, partly glaciated catchment on James Ross Island, which belongs to the largest deglaciated area in Antarctica. Our objective was to 1) describe runoff variability in this area and 2) to estimate glacier, snow, and rain contributions to runoff in relation to climate variability.

Due to limited discharge measurements, we used semi-distributed bucket-type HBV model to simulate runoff process in years 2010–2020 in a daily temporal resolution. Input data for the model were time series of in situ measured air temperature, and simulated precipitation. Precipitation was simulated by the Weather Research and Forecasting model driven by ERA5 reanalysis. The HBV model was calibrated against measured daily discharge from six weeks long period in February and March 2018, and seasonal ablation measurements from years 2014–2020.

The results showed that 93% of the annual runoff occurred from October to May. The highest mean monthly runoff occurred in the second half of summer due to combination of strong glacier and snow melt. Additionally, large runoff was found in November which was caused by melt-out of seasonal snow cover. The major part (53%) of runoff originates from snow cover, 41% originates from glacier and only 6% from rainfall. Snowmelt runoff dominated during winter (with overall low absolute values of runoff) and in autumn. In summer, snowmelt runoff was almost the same as glacier runoff. In autumn, contribution of glacier to total runoff was slightly higher than contribution of snow. Contribution of snow to total runoff was higher in colder years with higher precipitation. In contrast, melting glacier contributed more during warmer years with less precipitation.

How to cite: Nedělčev, O., Matějka, M., Láska, K., Engel, Z., Kavan, J., and Jeníček, M.: Glacier and snow melt contributions to streamflow on James Ross Island, Antarctic Peninsula, EGU General Assembly 2023, Vienna, Austria, 23–28 Apr 2023, EGU23-8748, https://doi.org/10.5194/egusphere-egu23-8748, 2023.

EGU23-9243 | ECS | Orals | HS2.1.7

Adapting a snowpack model to simulate cold-based glacial hydrological processes in the McMurdo Dry Valleys, Antarctica 

Tamara Pletzer, Nicolas Cullen, Jonathan Conway, Trude Eidhammer, and Marwan Katurji

Glacial melt is the primary source of freshwater for the fragile microbial ecosystem in the McMurdo Dry Valleys (MDV) of Antarctica. These glaciers are cold-based, with internal temperatures around -18°C, however, air temperatures hover around 0°C for several weeks in the summer and föhn wind events can rapidly raise ice surface temperatures to the melting point. Thus, episodical glacial melt is sensitive to small changes in the climate.  

The aim of this research is to adapt a detailed snowpack model embedded in a distributed hydrological model to simulate the surface energy balance and run-off of a glacier in the MDV. To do this, the snowpack model in the WRF-Hydro-Crocus modelling scheme, which has been used for avalanche forecasting and temperate glaciers, is adapted to the MDV. Several modifications are made to model calculations and parameters to allow the model to successfully simulate surface energy balance and runoff in this environment. For example, the parameters for the Crocus albedo scheme are adjusted to obtain band profiles for snow, firn and ice that replicate observed albedo and remain internally consistent between surface types. The modelling system is then validated against data from an automatic weather station, eddy covariance measurements and stream discharge. It is shown to be suitable for future efforts to model the full hydrological cycle of glacial meltwater in this region.

How to cite: Pletzer, T., Cullen, N., Conway, J., Eidhammer, T., and Katurji, M.: Adapting a snowpack model to simulate cold-based glacial hydrological processes in the McMurdo Dry Valleys, Antarctica, EGU General Assembly 2023, Vienna, Austria, 23–28 Apr 2023, EGU23-9243, https://doi.org/10.5194/egusphere-egu23-9243, 2023.

EGU23-10137 | Orals | HS2.1.7

Toward a glacier retreat driven redistribution of water resources 

Michel Baraer, Bryan Mark, and Jeff McKenzie

Assessments of glacier retreat impacts on water resources are often carried out using hydrological models calibrated using stream discharge time series. Because long-term discharge measurements are scarce in different regions of the world, models’ outcomes are analyzed assuming implicitly that stream discharge evolution projections at the outlet of a watershed affect the entire drainage area following a uniform pattern. In the present study, building on the learnings from the peak water analysis we performed in 2012, we explore the heterogeneity in Rio Santa sub-watersheds responses to deglaciation. The future of water resources at each watershed is projected by applying the peak water model with the latest glacier area estimations. The resulting map of the projected water availability across the Rio Santa watershed is then overlayed with previous works and literature-based water quality and demand maps.

Results show that, while glaciers are losing their hydrological influence across the Cordillera Blanca, gaps open between water availability and demand for water at different levels of the watershed. Moreover, the dry season share of polluted sub-watersheds into the Rio Santa discharge increasing due to glacier retreat, water quality evolution will add up to the challenge of sharing an already scarce resource.

Our study suggests that deglaciation in the tropical Andes affects populations and economic activities in a complex, disparate and evolutive way. Therefore, anticipating glaciers retreat redistribution of the water resources requires integrating hydrological, chemical, biological, economic, and sociological water resources aspects in locally grounded studies.  


How to cite: Baraer, M., Mark, B., and McKenzie, J.: Toward a glacier retreat driven redistribution of water resources, EGU General Assembly 2023, Vienna, Austria, 23–28 Apr 2023, EGU23-10137, https://doi.org/10.5194/egusphere-egu23-10137, 2023.

EGU23-10181 | ECS | Orals | HS2.1.7

Isotopic composition as a tracer of different source contributions to stream flow in the glacierized catchments of Central Asia 

Zarina Saidaliyeva, Maria Shahgedanova, Vadim Yapiyev, Andrew Wade, Fakhriddin Akbarov, Mukhammed Esenaman, Vassiliy Kapitsa, Nikolay Kassatkin, Diliorom Kayumova, Ilkhomiddin Rakhimov, Rysbek Satylkanov, Daniyar Sayakbaev, Igor Severskiy, Maksim Petrov, Ryskul Usubaliev, and Gulomjon Umirzakov

The mountains of Central Asia are water towers servicing the arid downstream regions and maintaining irrigation and food production. There are several sources of runoff: liquid precipitation, snowpack, glacier ice, ground ice (including rock glaciers and permafrost), and ground water. The relative contributions of different water sources to stream flow are poorly quantified and its improved understanding will reduce uncertainty in hydrological modelling and projections of changes in water resources. In 2019-21, an extensive sampling programme was conducted to quantify the relative contributions of water sources to stream flow in the Tien Shan and Pamir-Alai using stable water isotope tracers (SWI) of oxygen and hydrogen. Samples of the event-based precipitation, river discharge taken daily or twice-daily at the designated sampling points and every fortnight along the river courses, and water sources were collected in the glacierized catchments in Kazakhstan (Ulken Almaty and Kishi Almaty catchments), Kyrgyzstan (Ala-Archa and Chon-Kyzyl Suu), Tajikistan (Varzob and Kafornihon), and Uzbekistan (Chirchik). The samples were processed using Picarro isotope analyser. A data set of SWI ratios from approximately 6000 samples has been produced and analysed. It is the first comprehensive SWI database in Central Asia contributing to understanding of regional and global isoscapes and water resources. The local meteoric water line (LMWL) was developed from the event-based precipitation samples. It is approximated as δD = 7.6δ18O + 8.7. The values of SWI in precipitation exhibit a clear annual cycle and depend on precipitation type (rain, snow, and mixed). The derived seasonal SWI values are different from those available from the Water Isotopes Database being nearly twice as high in winter. Snow, glacier ice and permafrost exhibit distinct isotopic signatures although these vary between the basins. Glacier ice in the Chirchik basin appears to be more depleted than elsewhere. Rock glaciers were sampled in the Ulken Almaty basin showing SWI ratios similar to those of glacier ice but both are distinct from permafrost. These results point at the feasibility of the application of the mixing model and end-member mixing analysis approaches to the partitioning of runoff and quantifying relative contributions of different water sources in the Tien Shan and Pamir-Alai. This is a policy-relevant task under the conditions of climate change.

How to cite: Saidaliyeva, Z., Shahgedanova, M., Yapiyev, V., Wade, A., Akbarov, F., Esenaman, M., Kapitsa, V., Kassatkin, N., Kayumova, D., Rakhimov, I., Satylkanov, R., Sayakbaev, D., Severskiy, I., Petrov, M., Usubaliev, R., and Umirzakov, G.: Isotopic composition as a tracer of different source contributions to stream flow in the glacierized catchments of Central Asia, EGU General Assembly 2023, Vienna, Austria, 23–28 Apr 2023, EGU23-10181, https://doi.org/10.5194/egusphere-egu23-10181, 2023.

EGU23-10420 | Orals | HS2.1.7

The value of distributed snow cover and soil moisture data for multi-objective calibration of a conceptual hydrologic model 

Rui Tong, Juraj Parajka, Fuqiang Tian, Borbála Széles, Isabella Greimeister-Pfeil, Mariette Vreugdenhil, Jürgen Komma, and Günter Blöschl

The latest advances and availability of satellite observations have great potential for improving hydrological model simulations of the water cycle. The recent study by Tong et al. (2021) showed that satellite observations of snow cover and soil moisture could improve river runoff simulations of conceptual hydrologic models with lumped model parameters. Still, the value and potential of spatial patterns of satellite observations for hydrologic model parametrization need to be better understood. This study aims to evaluate and compare different multiple-objective calibration strategies that use model inputs and satellite observations for the model calibration in lumped, spatially distributed and stepwise ways. We aim to test the potential of daily MODIS (Moderate Resolution Imaging Spectroradiometer) snow cover and ASCAT (Advanced Scatterometer) soil water index images observed over 204 Austrian catchments in 2000-2014. Results show that stepwise calibration strategies that first calibrate the snow model parameters to satellite snow cover data followed by calibrating the remaining model parameters outperform (particularly in lowlands) the classical calibration strategies estimating model parameters in one single calibration step. The use of distributed snow cover and soil moisture patterns in model calibration improves the snow and soil moisture simulation performance of the model. The use of MODIS snow cover data has a more significant contribution to the overall improvement in model performance than ASCAT soil moisture data.


References:

Tong, R., Parajka, J., Salentinig, A., Pfeil, I., Komma, J., Széles, B., Kubáň, M., Valent, P., Vreugdenhil, M., Wagner, W., and Blöschl, G.: The value of ASCAT soil moisture and MODIS snow cover data for calibrating a conceptual hydrologic model, Hydrol. Earth Syst. Sci., 25, 1389-1410, 10.5194/hess-25-1389-2021, 2021.

How to cite: Tong, R., Parajka, J., Tian, F., Széles, B., Greimeister-Pfeil, I., Vreugdenhil, M., Komma, J., and Blöschl, G.: The value of distributed snow cover and soil moisture data for multi-objective calibration of a conceptual hydrologic model, EGU General Assembly 2023, Vienna, Austria, 23–28 Apr 2023, EGU23-10420, https://doi.org/10.5194/egusphere-egu23-10420, 2023.

EGU23-10634 | Orals | HS2.1.7

Development of an operational snow energy balance model informed by numerical weather prediction and remote sensing for the Western United States 

McKenzie Skiles, Joachim Meyer, Dillon Ragar, Patrick Kormos, and Andrew Hedrick

The Colorado River, which supplies water to the Western United States (WUS) and Mexico, is fed primarily from snow melting out of the Rocky Mountains. Currently, snowmelt contribution to streamflow is forecast using a calibrated temperature index model (SNOW-17). This approach is simple, and computationally efficient, but loses efficacy when snow conditions are outside the calibration period as temperature index models do not represent all of the physical processes that control accumulation and melt rates. For example, in the southern headwaters of the Colorado River forecasting errors have been related to surface darkening and accelerated melt following episodic dust on snow events. Here, we present an ongoing project to develop and mature a spatially distributed snow energy balance model, informed with numerical weather prediction (NWP) and remote sensing, to support operational decision making. This effort is a collaboration between the University of Utah's Snow Hydrology Research to Operations (Snow HydRO) Laboratory, the USDA-ARS Northwest Watershed Research Center (NWRC), and the Colorado Basin River Forecast Center (CBRFC). The model, iSnobal, is forced with the High Resolution Rapid Refresh (HRRR) NWP and is assessed against in situ observations and snow depth maps from the Airborne Snow Observatory in representative headwater basins. Initial testing of the HRRR-iSnobal combination showed that it can simulate snow accumulation, in terms of both patterns and magnitude, but that snowmelt rates were too slow. This was attributed to inaccurate radiation balance, specifically shortwave radiation due to the traditional treatment of net shortwave, including a 'time since snowfall' albedo decay curve. To account for spatial and temporal variability in snow albedo, daily observations from the spatially and temporally complete MODIS fractional snow products (MODSCAG+MODDRFS) were incorporated to update net solar radiation inputs. The updates were tested in different ways including direct albedo updates, direct decay curve component updates, and basin specific calibration decay curves. Although all remote sensing based update approaches improved snowmelt timing, direct updates had the greatest improvement in years with more intense snow darkening. This presentation will include a summary of current results, updates on incorporation into operational forecasting, and highlight plans for future developments.

How to cite: Skiles, M., Meyer, J., Ragar, D., Kormos, P., and Hedrick, A.: Development of an operational snow energy balance model informed by numerical weather prediction and remote sensing for the Western United States, EGU General Assembly 2023, Vienna, Austria, 23–28 Apr 2023, EGU23-10634, https://doi.org/10.5194/egusphere-egu23-10634, 2023.

EGU23-11164 | Orals | HS2.1.7 | Highlight

Glaciers’ role as water resource in the Swiss Alps 

Daniel Farinotti, Aaron Cremona, Marit van Tiel, and Matthias Huss

In high-mountain environments such as the European Alps, glaciers are an important component of the water cycle. With ongoing climate change, this role seems in jeopardy though: glaciers in Switzerland, for example, have lost more than 30% of their volume since the year 2000, and future projections indicate a future with ice-free landscapes if society was to fail in taking immediate and stringent climate action.

In this contribution, the role of glaciers as water resource will be reviewed. By taking the Swiss Alps as an example, their contribution to regional water supplies and usage will be quantified. A focus will be on the glaciers’ role in providing water during dry periods, as well as the relevance of glacier melt in the context of hydropower production.

Based on both extended glaciological measurements collected in the frame of the Glacier Monitoring Switzerland (GLAMOS) program and daily glacier melt data retrieved through automated methods, we will for example quantify the meltwater contribution that glaciers had in the extremely hot summer 2022. The year saw a record-high 6% glacier volume loss and we show that individual heat waves contributed over-proportionally to this amount: 35% of the total summer ice loss, for example, occurred in the 25 hottest days, delivering a water amount that corresponds to 56% of the total summer melt seen on average for the past decade.

Such phases of extreme melt can also be challenging for water resource management. In high-alpine rivers, where annual glacier contributions to streamflow were up to 80% in 2022, existing hydropower infrastructure can for example be overwhelmed. For a country that sees some 2.1kWh of hydro-electricity being produced for every cubic meter of glacier melt, this raises questions about future management strategies, and calls for robust projections of future streamflow.

How to cite: Farinotti, D., Cremona, A., van Tiel, M., and Huss, M.: Glaciers’ role as water resource in the Swiss Alps, EGU General Assembly 2023, Vienna, Austria, 23–28 Apr 2023, EGU23-11164, https://doi.org/10.5194/egusphere-egu23-11164, 2023.

Alpine glaciated catchments are rapidly changing with glacier retreat. Combined with future earlier snow melt and more liquid precipitation, the importance of high alpine catchments to provide essential water resources for downstream uses will increase. In this context, groundwater storage may play a critical role in maintaining baseflow during drought events. In this study, we provide an overview of the hydrogeological functioning of the Otemma glacier catchment, a typical glaciated catchment in the Swiss Alps. Based on three years of field data, we provide a complete conceptual model of the volumes and timescales at which different landforms store and release water and compare those results with a catchment-scale analysis of the winter discharge recession. Based on water isotopes and geochemical data, we show the strong spatial heterogeneity in the water sources that recharge those landforms and how they are interconnected. Finally, we present results of a 3D model of the groundwater-surface water interactions in the proglacial outwash plain, discuss where potential new floodplains may form in the future and show a rather limited potential storage of the order of 20 mm. We conclude that superficial landforms have a limited potential to provide significant baseflow for downstream users but can provide significant moisture for high alpine ecosystems. Nevertheless, we show that bedrock infiltration likely represents the largest groundwater reservoir but more research is needed to characterize its role in the future.

How to cite: Müller, T., Lane, S. N., and Schaefli, B.: Characterizing the current and future groundwater storages in a highly glaciated catchment : a synthesis of 3 years of field observations and modelling results, EGU General Assembly 2023, Vienna, Austria, 23–28 Apr 2023, EGU23-11831, https://doi.org/10.5194/egusphere-egu23-11831, 2023.

EGU23-13841 | Posters on site | HS2.1.7

Discharge characteristics for different glacier mass balance conditions at Vernagtferner, Ötztal Alps 

Astrid Lambrecht and Christoph Mayer

Discharge from glaciers plays an important role for ecosystems, land use and hydropower production in different regions of the world. The discharge hydrograph in glaciated catchments is determined by several parameters, like snow cover, glacier size and glacier mass balance, besides others. Variations in these parameters might considerably change the temporal availability of melt water in such regions, which needs to be taken into account for long term water management planning.

Here, we investigate in detail the characteristics of discharge in a highly glaciated catchment in the central eastern Alps. The Vernagtferner basin (11 km² area and 6.9 km² glacier area) is characterised by a high density of monitoring stations, which are an ideal basis for testing and applying models of snow and glacier evolution, as well as discharge simulations. The combination of a gauging station with meteorological observations and continuous monitoring of snow and ice melt at different locations, allows to investigate the major processes in detail. During the period 2019 to 2022 rather different mass balance conditions occurred, which strongly influenced the temporal evolution of the discharge generation. We investigate the significance of snow cover, firn and glacier ice to the melt water generation and the temporal characteristics of the hydrograph.

How to cite: Lambrecht, A. and Mayer, C.: Discharge characteristics for different glacier mass balance conditions at Vernagtferner, Ötztal Alps, EGU General Assembly 2023, Vienna, Austria, 23–28 Apr 2023, EGU23-13841, https://doi.org/10.5194/egusphere-egu23-13841, 2023.

EGU23-13878 | ECS | Posters on site | HS2.1.7

Linking detailed canopy structure and snow process model representations to explore the dynamics of snowpack properties and ground conditions 

Giulia Mazzotti, Jari-Pekka Nousu, Tobias Jonas, and Matthieu Lafaysse

A large portion of boreal and alpine forests of the Northern Hemisphere hosts seasonal snowpacks over multiple months of the year. Rising temperatures and forest disturbances are causing rapid change to these environments; therefore, accurate prediction of forest snow is relevant for a variety of disciplines such as biogeochemistry, ecohydrology, cryospheric, and climate sciences. Research in each of these fields relies on process-based models that are usually discipline-specific, e.g., snow hydrology and land surface models. These models are intended for a broad range of spatiotemporal scales and consequently include canopy and snowpack process representations of varying complexity. Detailed snow physics models that resolve the microstructure of individual snow layers, motivated by avalanche forecasting and snow remote sensing, have existed for years. More recent advances in forest snow process representation and increasing availability of high-resolution canopy structure datasets have led to the development of snow-hydrology models capable of resolving tree-scale processes.

Here, we introduce a new model system that combines concepts from two such sophisticated models: the snowpack representation from Crocus, and the canopy representation from the Flexible Snow Model. We present multi-year simulations at 2-m resolution across sub-alpine and boreal forest landscapes. Spatially explicit simulations allow us to assess the spatio-temporal dynamics of snow properties, ground conditions and land surface states, and to unravel their distinct dependencies on canopy structure heterogeneities at a previously unfeasible level of detail. This work aims to inform and further promote the use of process-based modelling tools in interdisciplinary ecosystem research at the interface between snow and ecosystem science, and in support of environmental change impact studies, management practices and mitigation/adaptation strategies.

How to cite: Mazzotti, G., Nousu, J.-P., Jonas, T., and Lafaysse, M.: Linking detailed canopy structure and snow process model representations to explore the dynamics of snowpack properties and ground conditions, EGU General Assembly 2023, Vienna, Austria, 23–28 Apr 2023, EGU23-13878, https://doi.org/10.5194/egusphere-egu23-13878, 2023.

EGU23-14338 | ECS | Orals | HS2.1.7

Influence of sun cups on surface albedo of wet Alpine snowpack 

Francesca Carletti, Loïc Brouet, Michael Lehning, and Mathias Bavay

In high elevation Alpine areas, characterised by high snow accumulation and radiation-driven melt processes, the formation of peculiar ablation features called sun cups can be observed. Sun cups likely influence the energy and mass balance of the wet snowpack by locally reducing the snow albedo, leading to an enhanced ablation in the hollows. To our knowledge, these phenomena are to date poorly explored in the literature and little to no attempts have yet been made to study their evolution in time and correlate them with meteorological forcings and energy fluxes over the wet snowpack.

The dynamics of the sun cups was investigated at the high elevation Alpine site of Weissfluhjoch (Davos, Switzerland) over the Spring of 2022. At the site, the snow surface was mapped on an hourly basis by means of a fixed, automated high-resolution 3D terrestrial laser scanner. Snow height maps were obtained by processing the registered point clouds.

Sun cups were individually and automatically detected over the snow surface maps by a delineation algorithm in Python. The evolution of sun cups in time was studied with respect to their maximum depth and cross-section.

The maximum depth and cross-section evolution of sun cups showed a high correlation with the measured albedo, especially when they are fully-formed. This finding suggests that peculiar snow surface formations that can be detected by means of remote sensing systems can give valuable additional information about the ongoing processes within the wet snowpack, paving the way to a radar-assisted modelling of the snowmelt dynamics. In an era of increasing concern over the availability of water resources, a better understanding and modelling of snowmelt dynamics is of major importance, especially in remote areas where accurate predictions are required for operational purposes (e.g. hydropower and irrigation).

How to cite: Carletti, F., Brouet, L., Lehning, M., and Bavay, M.: Influence of sun cups on surface albedo of wet Alpine snowpack, EGU General Assembly 2023, Vienna, Austria, 23–28 Apr 2023, EGU23-14338, https://doi.org/10.5194/egusphere-egu23-14338, 2023.

EGU23-15485 | ECS | Posters on site | HS2.1.7

The use of snow fences for snow conservation 

Philip Crivelli

With ongoing climate change, residual snow in the mountains is disappearing ever earlier each year. This reduces their potential to be used as a water source later in the year. Especially for infrastructures like mountain huts, this can lead to severe problems. Our study describes how to actively apply the basics of snowdrift fences as snow-farming to establish snow depots as summer water source. This project asses how drifting snow can be applied in a practical and sustainable way in alpine terrain without the use of snow-groomers or snow-cannons.

Existing, scientific models of snow transport are utilized in conjunction with the fundamentals of snow fence design to maximize the yield of residual snow in complex alpine terrain, contributing to water supply security. The study presents the results and approaches to the implementation of CFD modelling integrating meteo and snowpack models to analyze mountain terrain for potential sites. These results form the basis for the use of snowdrift fences to increase water storage in mountain regions.

How to cite: Crivelli, P.: The use of snow fences for snow conservation, EGU General Assembly 2023, Vienna, Austria, 23–28 Apr 2023, EGU23-15485, https://doi.org/10.5194/egusphere-egu23-15485, 2023.

After several decades of climate change impact studies on high alpine environments, the hydrological community has come to a good agreement on how cryosphere-dominated streamflow regimes will evolve in the future. And observed streamflow regime trends largely confirm existing predictions for Alpine environments. Many of these predictions are based on models that lack a detailed representation of hydrological processes that occur below the snowpack or the ice-cover; these model focus on the representation of snow accumulation and snow and ice-melt and use simply methods to transform liquid water input into streamflow.

However, the gradual reduction of snow cover duration might significantly affect streamflow generation processes in Alpine environments, e.g. via the evolution of spatial and temporal patterns of groundwater recharge or of hydrologic connectivity and of the related seasonal stream network structure.  

In this presentation, we will synthesize what we learned about the interaction of the cryosphere with streamflow generation from our multiyear process studies in two high Alpine catchments in Western Switzerland, the Vallon de Nant and the Otemma glacier catchment. We elaborate perspectives for future field work but also for hydrological model development.

How to cite: Schaefli, B. and Ceperley, N.: When snow and ice are gone: beyond hydrological regime changes,  what are the nuts and bolts of future streamflow generation processes?, EGU General Assembly 2023, Vienna, Austria, 23–28 Apr 2023, EGU23-15908, https://doi.org/10.5194/egusphere-egu23-15908, 2023.

EGU23-16153 | Posters on site | HS2.1.7

Water budget in the Rutor glacier area: results from multidisciplinary activities 

Stefania Tamea, Elisabetta Corte, and Carlo Camporeale

Due to global warming and glacial retreat, periglacial areas and headwater catchments are experiencing relevant changes in surface processes and in water budgets. The water cycle, altered by the changing snow accumulation/melting dynamics, ice ablation, higher altitude increasing rainfalls frequencies, is shifting towards larger average and peak runoff productions. These alterations have also an impact on sediment production, on geomorphological processes, on ecosystem dynamics. The goal of our research is to take advantage of multidisciplinary activities aimed at monitoring the glacial and peri-glacial area of the Rutor glacier, in the Aosta valley (north-western Italian Alps) to quantify its dynamics under climate change. The Rutor glacier is fast-retreating and has a terminus that moved more than 2 km since the mid-19th century: it is thus a perfect case study to investigate snow/ice dynamics and runoff production, considering also that the periglacial area is characterized by a number of lakes and channels that collect and convey the melt water, while dynamically responding to it. In this work, we present the results from a multidisciplinary collaboration that involves hydrologists, geophysicists, geomatics and water engineers with the goal of monitoring stream flows, water properties, lake water balance and runoff production. Thanks to the contribution of different disciplines, we could gain an advanced quantitative knowledge of the water budget in the area that will represent a starting point for further investigations of processes and interactions within this unique melting landscape.

How to cite: Tamea, S., Corte, E., and Camporeale, C.: Water budget in the Rutor glacier area: results from multidisciplinary activities, EGU General Assembly 2023, Vienna, Austria, 23–28 Apr 2023, EGU23-16153, https://doi.org/10.5194/egusphere-egu23-16153, 2023.

EGU23-16657 | ECS | Orals | HS2.1.7

Relationship between rainfall and flood frequency curves in high elevation areas 

Giulia Evangelista, Irene Monforte, Marco Demateis Raveri, and Pierluigi Claps

Flood hazard assessment and its relationship with extreme rainfall probabilities is a well-addressed topic in the literature, but not enough in mountain areas, where the climate change effect can hit much more than in other physical contexts. In mountain basins, the lack of systematic data and the complexity of the rain/snow phenomena make investigations even more necessary to figure out the consequences of global warming.

This study explores how the partial contributing area effect due to snow accumulation, on the one hand, and the basin runoff coefficient, on the other hand, shape the relationship between rainfall and flood probabilities in high elevation areas. To this aim, the FloodAlp geomorphoclimatic model (Allamano P. et al., 2009) is used.

The model is based on the derived distribution approach, producing as a result a simplified flood frequency curve based on the intra-annual variability of the portion of the catchment area covered by snow, according to simple descriptions of the seasonal variation of the freezing elevation and of the hypsographic curve of the basin.

To model the basin hypsometric features, we propose the use of a two-parameter Strahler function, which is a more accurate and alternative formulation to the simple one-parameter function originally used in the model. The role of the extreme rainfall frequency analysis is also explicitly analysed, by applying the model using rainfall extremes recorded both in the daily and 24-hours windows. In this application, the only parameter that requires calibration is the runoff coefficient. Considering recordings of annual maximum daily discharges, the runoff coefficients for more than 100 gauged basins in north-western Italy have been calibrated. Comparisons are then possible between the shapes of rainfall and flood frequency distributions within the sample analysed, that also take into account the basin geomorphoclimatic features. Results of this application address the selection of relevant characteristics in relation to the impact of climate change on mountain floods as a result of changes in temperatures and in the statistics of rainfall extremes.


How to cite: Evangelista, G., Monforte, I., Demateis Raveri, M., and Claps, P.: Relationship between rainfall and flood frequency curves in high elevation areas, EGU General Assembly 2023, Vienna, Austria, 23–28 Apr 2023, EGU23-16657, https://doi.org/10.5194/egusphere-egu23-16657, 2023.

EGU23-614 | ECS | PICO | HS2.1.8

A New Lumped Descriptor of Basin-Wide Hydrological Connectivity 

Francesco Dell'Aira and Claudio I. Meier

In their efforts to study the rainfall-runoff conversion process, hydrologists have deployed a variety of approaches. Despite the huge range of methodologies, a general theme can be identified: there is a trade-off between how generalizable a model can be across different basins and the degree of detail in basin characterization. On one hand, regionalization approaches and deep-learning models use lumped information, typically covering some combination of average geometric, topographic, land-cover, and climatic characteristics of a basin. Based on these descriptors, some general, typically empirical relationship is derived to explain the hydrological response of any watershed within a homogeneous region, e.g., by fitting a regional equation to predict the 10-yr flood at ungauged locations, or by developing regional statistical models on the pooled, standardized data from all the hydrologically similar basins. On the other hand, distributed, physically-based models attempt to simulate the water exchanges occurring within a catchment at different spatial and time scales, at the cost of a detailed, spatially-explicit basin characterization, with the resulting lack of transferability to other watersheds.

While a lumped characterization of basins is crucial for a variety of approaches aimed at model transferability, such as regionalization techniques for flood prediction or deep learning models for flood forecasting, most procedures only consider basin-averaged properties or at most their distribution. Thus, they are unable to account for hydrological connectivity, even though it is well known that it has strong effects on a watershed’s response. For example, the percentage of impervious area is often used as a proxy for the level of urbanization in catchments, but it cannot provide any information about how urbanized areas are located with respect to each other and the watershed outlet, although different spatial configurations of these may result in different hydrological behaviors, for the same precipitation input.

We propose a new, lumped hydrological connectivity index that can incorporate information on how different parts of a basin, with their various topographic and land-use characteristics, are connected to each other and the stream network. In this way, we incorporate their relative contributions to the hydrologic response of the watershed, depending on their location. This index can be regarded as a condensed measure of the potential that each location has for generating runoff at the watershed outlet, given spatially-explicit characterizations of its properties. It can be used in synergy with other lumped descriptors to provide a more detailed basin characterization that reflects hydrological connectivity.

We test the predictive power of the proposed index in the framework of regional flood frequency analysis finding that it benefits well-established approaches for hydrological prediction in ungauged basins.

How to cite: Dell'Aira, F. and Meier, C. I.: A New Lumped Descriptor of Basin-Wide Hydrological Connectivity, EGU General Assembly 2023, Vienna, Austria, 23–28 Apr 2023, EGU23-614, https://doi.org/10.5194/egusphere-egu23-614, 2023.

EGU23-789 | ECS | PICO | HS2.1.8

Hydro-climatic shifts of worldwide river basins in the past century 

Muhammad Ibrahim, Miriam Coenders, Ruud Van der Ent, and Markus Markus Hrachowitz

Understanding of river basins hydro-climatic shifts and their drivers in the past is of significant importance for the prediction of future projections. This study evaluates the hydro-climatic shifts of worldwide river basins through Budyko Framework at 20 years’ time steps from 1901 to 2000 based on field-measured runoff data. It is also aimed to identify whether shifts are related to climate change, human interventions, or both. The selected river basins cover a wide range of climates and topography. The movement of basins in the Budyko Space is quantified from the first twenty years to the next twenty years. It is found that 47% of the catchments observed an increase in their aridity and evaporative indices between a period of comparison from 1901 to 1920 and 1921 to 1940. An increase in both indices means that these catchments have moved toward a drier state and more precipitation is partitioned into evaporation as compared to runoff. However, it is observed that during periods from 1961 to 1980 & 1981 to 2000 this percentage has reduced to 20% only and more number of catchments (47%) have observed a decrease in the aridity index as well as the evaporative index. It is seen that major hydro-climatic shifts of river basins have occurred from an increase in aridity and evaporative indices to a decrease in both indices from start to the end of the past century. It is concluded that with time, more number of catchments have moved towards a wet state and observed an increase in runoff as compared to the past. Although, more catchments observed a shift but the magnitude of movement is not that much high for all of them. It is observed that the catchments with a high aridity and evaporative index are more sensitive to change. On average for all time periods of comparison, it is found that for 90% of the catchments the climate change is the main driver of hydro-climatic shifts and the change for the remaining is caused by combined effects of climate and human interventions. This understanding of hydroclimatic shifts of river basins over time can be helpful for water management practices, especially for the catchments which are sensitive to change and also have observed an increase in runoff.

How to cite: Ibrahim, M., Coenders, M., Van der Ent, R., and Markus Hrachowitz, M.: Hydro-climatic shifts of worldwide river basins in the past century, EGU General Assembly 2023, Vienna, Austria, 23–28 Apr 2023, EGU23-789, https://doi.org/10.5194/egusphere-egu23-789, 2023.

EGU23-1404 | PICO | HS2.1.8

Evaluating the seasonal non-stationarity in the Wei River Basin 

Xin Yuan and Fiachra O'Loughlin

Due to the impact of changing climate and human activities on hydrology, non-stationary research is becoming more popular. In the Wei River Basin, which is the largest tributary of the Yellow River, non-stationary has been studied for decades and has found non-stationary signals in discharge and precipitation records. However, these studies have mainly focused on the annual time series and ignored the seasonal signal.

In this study, to investigate the non-stationarity more comprehensively, two non-stationary tests have been applied including the Mann-Kendall test and the Heuristic segmentation algorithm. These tests were applied to runoff time series from 12 catchments and catchment averaged precipitation and temperature time series derived from 114 meteorological stations. Like other studies, our results, show that on the annual timescale, non-stationary signals (multiple change points and decreasing trends) are found in the runoff time series on most catchments along the mainstem, while the runoff time series of the Beiluo catchment does not show any non-stationarity signal. However, our results show that there is clearly a seasonal difference with change points occurring at contrasting times. Among all time series, about 40% show only single nonstationary signals (trend or change point), while the remainder exhibit multiple signals indicating the importance of using multiple tests. While the results show that non-stationary signals exist in all time series, further work is needed to quantify if or to what level are meteorological variables the driver of non-stationary signals in the runoff time series.  

How to cite: Yuan, X. and O'Loughlin, F.: Evaluating the seasonal non-stationarity in the Wei River Basin, EGU General Assembly 2023, Vienna, Austria, 23–28 Apr 2023, EGU23-1404, https://doi.org/10.5194/egusphere-egu23-1404, 2023.

EGU23-2650 | ECS | PICO | HS2.1.8

CAMELS-spat: catchment data for spatially distributed large-sample hydrology 

Wouter Knoben and Martyn Clark

The recent publication of large-sample datasets for hydrologic modeling and analysis has led to a revival of comparative hydrology. The “CAMELS” branch of these datasets currently provide catchment attributes and meteorological time series for basins located in the United States, Chile, Brazil, Australia and Great-Britain, with a dataset for France under development. A key characteristic of these datasets is that information is provided as catchment-averaged data; i.e. each catchment is treated as a lumped entity with no spatial variability. Some progress is being made to extend large-sample hydrology to include spatially distributed data, most notably by the recent LamaH dataset which covers part of Central Europe.

Here we present progress on developing a continental domain dataset for large-sample hydrology intended for spatially distributed modeling and analysis. Our domain covers the United States and Canada, expanding both geographically and climatically on the region covered by the LamaH dataset. We focus mostly on relatively undisturbed headwater catchments, because accurate data on water management policies and infrastructure can be difficult to obtain. Our aim is to provide the necessary data for process-based modeling and analysis at a sub-daily temporal resolution. 

How to cite: Knoben, W. and Clark, M.: CAMELS-spat: catchment data for spatially distributed large-sample hydrology, EGU General Assembly 2023, Vienna, Austria, 23–28 Apr 2023, EGU23-2650, https://doi.org/10.5194/egusphere-egu23-2650, 2023.

EGU23-5256 | ECS | PICO | HS2.1.8

Caravan - A global community dataset for large-sample hydrology 

Frederik Kratzert, Grey Nearing, Nans Addor, Tyler Erickson, Martin Gauch, Oren Gilon, Lukas Gudmundsson, Avinatan Hassidim, Daniel Klotz, Sella Nevo, Guy Shalev, and Yossi Matias

High-quality datasets are essential to support hydrological science and modeling. Several datasets exist for specific countries or regions (e.g. the various CAMELS datasets). However, these datasets lack standardization, which makes global studies difficult. Additionally, creating large-sample datasets is a time and resource consuming task, often preventing the release of data that would otherwise be open. Caravan (as in “a series of camels”) is an initiative that tries to solve both of these problems by creating an open data processing environment in the cloud for the community to use.

Caravan is a globally consistent and open dataset

Caravan leverages globally available data sources that are published under an open license to derive meteorological forcings and attributes for any catchment. We use ERA5-Land for meteorological forcings and hydrological reference states (SWE and four levels of soil moisture) and HydroATLAS for the catchment attributes. Currently, Caravan consists of 6830 gauges with daily streamflow data (median record length ~30 years), 9 meteorological variables (from 1981 - 2020) in different daily aggregations, 4 hydrological reference states, and a total of 221 catchment attributes.

Caravan is derived entirely in the cloud

All meteorological time series (and hydrological reference states) from ERA5-Land are processed on Google Earth Engine, which removes the burden of downloading and processing large amounts of raw gridded data. Similarly, all catchment attributes are computed on Earth Engine. The code used to derive Caravan is publicly available (https://github.com/kratzert/Caravan/) . Once you have streamflow records and the corresponding catchment polygons, deriving all other data (forcing data and attributes) is a matter of a few hours of actual work. Depending on the number of catchments, their size and spatial distribution, that are being processed at once on Earth Engine , it might take a day or two for Earth Engine to extract meteorological data and catchment attributes. 

Most importantly: Caravan is a community project

Even though the existing data in Caravan has good coverage over most climate zones, the spatial coverage is still patchy. Here is where we see Caravan as a community effort. Given the provided code, everybody with access to streamflow data and the authorisation to redistribute it can create a Caravan extension with minimal effort and share the extension with the community, thus contributing to a dynamically growing dataset. A full step-by-step tutorial is available at https://github.com/kratzert/Caravan/wiki. We envision that, with many people participating, this will result in a truly global and spatially consistent, large-sample hydrology dataset. A first Caravan extension was already published by Julian Koch (https://zenodo.org/record/7396466), which increased the number of gauges to 7138, by adding 308 gauges in Denmark.

How to cite: Kratzert, F., Nearing, G., Addor, N., Erickson, T., Gauch, M., Gilon, O., Gudmundsson, L., Hassidim, A., Klotz, D., Nevo, S., Shalev, G., and Matias, Y.: Caravan - A global community dataset for large-sample hydrology, EGU General Assembly 2023, Vienna, Austria, 23–28 Apr 2023, EGU23-5256, https://doi.org/10.5194/egusphere-egu23-5256, 2023.

EGU23-5492 | ECS | PICO | HS2.1.8

Estimating the parameters of a flood forecasting model: with or without updating procedures? 

Paul C. Astagneau, François Bourgin, Vazken Andréassian, and Charles Perrin

When they are used for operational forecasting, hydrological models are almost always combined with some kind of updating procedures. Then a question arises: should the model parameters be calibrated with or without the updating procedures? Calibrating with the updating procedures often improves forecast efficiency, but it can also lead to parameter inconsistency and ultimately to a drop in performance in some cases.

In this study, we evaluate the pros and cons of making the parameters of a flood forecasting model vary with lead times. We investigate the dependencies of the model parameters to the lead times and determine where and when this procedure significantly improves forecast quality. A modified version of the GR5H hydrological model is used on 229 French catchments where 10,652 events were selected. The model is run at the hourly time step and combined with a simple updating procedure to produce forecasts at four lead times. The model parameters were estimated from a large screening of the parameter space (3 million runs for each catchment). Results show that the parameters related to fast catchment processes are the most dependant on lead times, indicating the need for more specific parameter estimation methods when modelling catchments prone to flash floods.

How to cite: Astagneau, P. C., Bourgin, F., Andréassian, V., and Perrin, C.: Estimating the parameters of a flood forecasting model: with or without updating procedures?, EGU General Assembly 2023, Vienna, Austria, 23–28 Apr 2023, EGU23-5492, https://doi.org/10.5194/egusphere-egu23-5492, 2023.

EGU23-7302 | ECS | PICO | HS2.1.8

Lag in catchment vegetation response to water availability and atmospheric dryness 

Guta Wakbulcho Abeshu and Hong-Yi Li

Catchment water availability for vegetation use (i.e., catchment wetness) and atmospheric water demand (i.e., vapor pressure deficit, VPD) are two of the major abiotic factors that control the intra-annual variability of catchment vegetation carbon uptake (i.e., GPP). This study analyzes 380 catchments distributed across the contagious US to explore the causality and interconnectedness between these two factors and catchment vegetation productivity. We use indices to represent seasonal climatic, hydrologic, and vegetation characteristics: Horton Index (HI), ecological aridity index (EAI), evaporative fraction index (EFI), and carbon uptake efficiency (CUE). Further, we employ statistical methods, including circularity statistics, spearman's correlation, Granger's causality, and PCMCI+, to depict connections between catchment wetness, atmospheric dryness, and vegetation carbon uptake. Our results indicate that catchment water supply-productivity and water demand-productivity cause-effect relations occur within a maximum span of two months (i.e., ±1 month from GPP). The annual scale relationships of these variables are more likely driven by a few dominant months. Moreover, attributed to the lag, hysteresis exists between GPP and catchment wetness and between GPP and VPD. The narrowest hysteresis develops in dry catchments (i.e., HI→1, EFI→1, and CUE have low intra-annual variability), and the wide hysteresis develops in catchments where HI and EFI have strong intra-annual variability, and their seasonal patterns are not in phase. For catchments that are not permanently under water-limited or energy-limited conditions, vegetation is under hydrologic stress (i.e., high HI) during the peak growing period. GPP is at its highest in this period, and CUE is out of phase with HI and in phase with EFI. These findings support the need for developing a direct functional framework between catchment water supply, atmospheric demand, and vegetation productivity. Such a framework can help us track normal and extreme hydrologic and climatic signals' effect on catchment vegetation and vice versa.

How to cite: Abeshu, G. W. and Li, H.-Y.: Lag in catchment vegetation response to water availability and atmospheric dryness, EGU General Assembly 2023, Vienna, Austria, 23–28 Apr 2023, EGU23-7302, https://doi.org/10.5194/egusphere-egu23-7302, 2023.

EGU23-9640 | PICO | HS2.1.8

Automated classification of the German soil map (BUEK 200) into FOOTPRINT soil types and its parameterization for hydrological modelling 

Stefan Reichenberger, Thorsten Pohlert, Qianwen He, Sebastian Gebler, Sebastian Multsch, and Beate Erzgraeber

The FOOTPRINT Soil Type (FST) system has been derived during the FOOTPRINT project (2006-2009) to facilitate spatially distributed hydrological and solute transport modelling at national or EU scale. The basic idea of this approach is to classify the soil typological units (STUs) of a national or European soil database into a limited number of soil types (FSTs) in order to reduce the number of unique soil-climate combinations for the later numerically expensive simulations. The FST code consists of a hydrological class (the FOOTPRINT Hydrologic Group), a topsoil and a subsoil texture code and an organic matter profile code. The FST system is model-independent, but complete parameterization methodologies were established during FOOTPRINT for MACRO, a 1-D dual permeability model for simulating water flow and solute transport in macroporous soils at field level. In this study we i) translated the latest version of the German soil map 1:200,000 (BUEK200) into FSTs, ii) derived representative profiles for all FSTs with arable land use, and iii) parameterized these representative profiles in MACRO. The 3648 STUs with arable land use in the BUEK200 were classified into 226 FSTs. Area proportions covered by the different FSTs are highly skewed: The 13 FSTs with the largest areas already cover 50 % of the total arable land. The hydrological class of each FST indicates whether artificial drainage is needed to allow arable landuse, and a map of potentially drained arable land was derived for Germany accordingly. A representative soil profile was established for every FST by depth-based averaging over all soil profiles belonging to the same FST. Special care had to be taken to ensure that mineral soil layers were not mixed with peat or hard rock layers. The plausibility of the representative FST profiles and their MACRO parameterization was checked with water balance simulations. The present case study for the BUEK200 soil database demonstrates the potential of the FST system for spatially distributed hydrological and solute transport modelling at large scale based on national soil databases.

How to cite: Reichenberger, S., Pohlert, T., He, Q., Gebler, S., Multsch, S., and Erzgraeber, B.: Automated classification of the German soil map (BUEK 200) into FOOTPRINT soil types and its parameterization for hydrological modelling, EGU General Assembly 2023, Vienna, Austria, 23–28 Apr 2023, EGU23-9640, https://doi.org/10.5194/egusphere-egu23-9640, 2023.

EGU23-10031 | ECS | PICO | HS2.1.8

A comprehensive global analysis of the spatiotemporal variability of Land Surface Temperature 

Laura Torres-Rojas and Nathaniel W. Chaney

Land surface temperature (LST) is a crucial state variable determining the interactions between the land surface and the atmosphere (i.e., energy, water, and carbon fluxes). Accordingly, several hydrological quantities, such as soil moisture content, vegetation water stress, gross primary production, and crop yield, correlate strongly with it. Thus, LST constitutes a critical variable in understanding the physics of multiple land surface processes. Decades of global satellite remotely sensed fields are now available, creating an unprecedented opportunity to understand better the LST spatiotemporal variability by diagnosing its spatial and temporal persistence, deriving spatial and temporal correlation lengths, identifying areas with similar spatiotemporal patterns, and determining the physical factors influencing this variability from regional to global scales. This presentation will address this gap in understanding by comprehensively analyzing the spatiotemporal variability of LST globally. Preliminary work regarding this topic has been performed using the

As part of our evaluation, we will first derive the Empirical Spatio-Temporal Covariance Functions (ESTCFs) for the global ~5x5 km Copernicus LST hourly product. A 1x1-arcdegree moving window will be defined over the globe to compute the ESTCFs, and an hourly time step between 2010 and 2022 will be used for the analysis. The analysis will focus exclusively on the daytime of summer months because spatial heterogeneity of LST will play the most significant role in summertime (e.g., daytime summer convection). To summarize the obtained ESTCFs, a parametric spatiotemporal covariance function model will be fit to each 1x1-arcdegree ESTCF. From this parametric fit, we will evaluate the persistence of the patterns, analyze the spatial and temporal correlation lengths, and evaluate the space-time interaction displayed for different locations. Additionally, clustering analysis will be applied directly to the derived parametric covariance functions to identify functionally similar areas. Finally, we will compare the derived empirical covariance functions to well-known factors spatiotemporal influencing LST variabilities such as land cover, surface thermal properties, topography, incoming solar radiation, and meteorological conditions.

How to cite: Torres-Rojas, L. and Chaney, N. W.: A comprehensive global analysis of the spatiotemporal variability of Land Surface Temperature, EGU General Assembly 2023, Vienna, Austria, 23–28 Apr 2023, EGU23-10031, https://doi.org/10.5194/egusphere-egu23-10031, 2023.

EGU23-10294 | ECS | PICO | HS2.1.8

Large Sample Basin Attribute Generation and Interpretation 

Dan Kovacek and Steven Weijs

In recent years several large-sample hydrometeorological datasets have been developed and used as inputs in both process-based and machine learning hydrological models, often for runoff prediction in ungauged basins.  Large sample hydrology datasets take information from a rapidly evolving array of geospatial data sources to create indices describing basin attributes associated with runoff-generating processes.  

In this study we discuss nuances of computational representation of basins, attribute interpretation with respect to physical processes, attributes vs. applications, the rate of change of spatial information sources, and the rapid growth and use of open source software tools.  Preliminary findings from generating a large sample dataset of ungauged basin attributes (~1M basins) are presented to support convergence towards standardized computational methods for basin attribute selection and calculation.

How to cite: Kovacek, D. and Weijs, S.: Large Sample Basin Attribute Generation and Interpretation, EGU General Assembly 2023, Vienna, Austria, 23–28 Apr 2023, EGU23-10294, https://doi.org/10.5194/egusphere-egu23-10294, 2023.

EGU23-10344 | PICO | HS2.1.8

Interpretable Unsupervised Classification of River Catchments with Network Science 

Fabio Ciulla and Charuleka Varadharajan

The classification of river catchments has been an active field of study for decades and the recent surge in hydrological and environmental datasets promotes the formulation of new approaches to this endeavor. We present a novel method for catchment classification based on physical traits similarity using network science, where the relationship among the catchments is represented by the edges of a network. Under this framework we leverage the capability of networks to capture collective behaviors to find clusters of catchments with similar physical traits. The use of networks allows the adoption of similarity metrics other than the common euclidean distance, which is subjected to quality degradation in high dimensions but is still required in many traditional clustering algorithms. Also, a network of traits is built to investigate their similarity patterns and condense this information into a small number of interpretable traits categories. Such categories are used to provide a characterization of each cluster of catchments. The method has been tested on over 9000 river catchments across the contiguous United States, each one accompanied by traits such as climate or vegetation coverage, and anthropogenic features such as land use or proximity to developed areas. The resulting classification shows a remarkable geographical coherence supported by the characteristic traits categories. Additionally, we find that when hydrological indices (like statistics on streamflow or water temperature) are aggregated according to the clusters of catchments, different clusters show different hydrologic behaviors. This, along with the information from cluster characterization, allows us to establish a connection between hydrological behaviors and physical traits. Finally, this framework can be applied at multiple scales, from continental to regional. When tested on a regional scale, the method automatically modifies the network topology to reflect the traits patterns relevant to the area under investigation.

How to cite: Ciulla, F. and Varadharajan, C.: Interpretable Unsupervised Classification of River Catchments with Network Science, EGU General Assembly 2023, Vienna, Austria, 23–28 Apr 2023, EGU23-10344, https://doi.org/10.5194/egusphere-egu23-10344, 2023.

EGU23-13916 | ECS | PICO | HS2.1.8

Demonstrating the importance of streamflow observation uncertainty when evaluating and comparing hydrological models 

Jerom Aerts, Jannis Hoch, Gemma Coxon, Nick van de Giesen, and Rolf Hut

Large-sample hydrology datasets provide an excellent test-bed for evaluating and comparing hydrological models. The validity of the results from studies that use large-sample hydrology datasets, however, can be undermined when observation uncertainty is not taken into account in the analyses. The differences between model simulations might well be within the observation uncertainty bounds and are, therefore, inconclusive on model performance.

To this end, we highlight the importance of including streamflow observation uncertainty when conducting hydrological evaluation and model comparison experiments based on the CAMELS-GB dataset (Coxon et al., 2015) . We introduce a generic flexible workflow that accounts for streamflow observation uncertainty, but is also applicable for other sources of observation uncertainty. This workflow is implemented in the ‘FAIR by design’ eWaterCycle platform (Hut et al., 2022). 

Two experiments are conducted to demonstrate the effect that streamflow observation uncertainty has on large-sample dataset based conclusions. The first experiment is an inter-model comparison experiment of the distributed PCR-GLOBWB and wflow_sbm hydrological models (Hoch et al. (2022) & van Verseveld et al. (2022)). The second experiment is an inner-model evaluation of the impact of additional streamflow based calibration on the results of the distributed wflow_sbm hydrological model. For the latter we found that approximately one third of the catchment simulations resulted in model differences that fell within the bounds of streamflow observation uncertainty.

How to cite: Aerts, J., Hoch, J., Coxon, G., van de Giesen, N., and Hut, R.: Demonstrating the importance of streamflow observation uncertainty when evaluating and comparing hydrological models, EGU General Assembly 2023, Vienna, Austria, 23–28 Apr 2023, EGU23-13916, https://doi.org/10.5194/egusphere-egu23-13916, 2023.

EGU23-14357 | ECS | PICO | HS2.1.8

CAMELS-SAX: A meteorological and hydrological dataset for spatially distributed modeling of catchments in Saxony 

Corina Hauffe, Clara Brandes, Kan Lei, Sofie Pahner, Philipp Körner, Rico Kronenberg, and Niels Schuetze

Comparative hydrology has been found to deepen our understanding of hydrological processes in catchments and helps to improve the proper evaluation of hydrological models. Recently, the global hydrological community has developed a series of publicly available, large-scale  „CAMELS“-datasets that provide catchment attributes and meteorological time series of catchments on a national level. These datasets include catchment-averaged values of catchment characteristics and meteorological time series and therefore allow only lumped modeling. In this study, we introduce a new dataset "CAMELS-SAX" for large-sample studies in the region of Saxony (Germany), which has a high diversity and heterogeneity of catchment attributes, such as geology and land use. "CAMELS-SAX" consists of meteorological and hydrological time series covering 60 years of data on a daily timestep for more than 200 catchments. The dataset includes spatially distributed catchment attributes and covers an area of about 23.000 km² with undisturbed and anthropogenic-influenced catchments ranging from 1 km² up to 5.000 km², which can be used for spatially distributed modelling. We will provide the standardized dataset for the German Federal State of Saxony for studies evaluating distributed models' performance on a smaller spatial scale. In the presentation, we show an overview of catchment attributes, time series, and hydrological signatures for the subset of undisturbed catchments. In addition, we present the results of a sensitivity analysis of the hydrological behavior caused by climate change.

How to cite: Hauffe, C., Brandes, C., Lei, K., Pahner, S., Körner, P., Kronenberg, R., and Schuetze, N.: CAMELS-SAX: A meteorological and hydrological dataset for spatially distributed modeling of catchments in Saxony, EGU General Assembly 2023, Vienna, Austria, 23–28 Apr 2023, EGU23-14357, https://doi.org/10.5194/egusphere-egu23-14357, 2023.

EGU23-15001 | ECS | PICO | HS2.1.8

Analysis and attribution of the hydrological coherence of gridded precipitation and temperature datasets in the Italian Alpine Region 

Andrea Galletti, Diego Avesani, Alberto Bellin, and Bruno Majone

Large-scale hydrological modeling has gained a wealth of attention in the last decades, due to the importance of assessing the growing anthropogenic and climate change impacts on water resources. In the context of these studies, the Alpine Region has historically played a key role, being widely recognized as “Europe’s water tower” and given the complex combination of anthropogenic and climatic drivers influencing its hydrology. The application of hydrological modeling at the synoptic scale requires an accurate assessment of the climatic forcing, chiefly precipitation and temperature. Nowadays, a number of observation-derived gridded products providing precipitation and temperature over a regular grid are available to benchmark and support large-scale analyses. However, these products are often not tailored to potential hydrological applications and are based on data with different and often uncertain levels of accuracy and resolution. In this context, assessing the uncertainty due to the climatic forcing and its relationship with the hydrological response of different catchments becomes crucial in order to gain confidence in the simulations. In the present study, we analyze the ability of several gridded datasets (which are best suited to large-scale analyses) to reproduce observed streamflows of more than 200 reaches across the Italian Alps. The simulations have been conducted by feeding HYPERstreamHS, a distributed hydrological model specifically tailored for large-scale simulations, with the following gridded meteorological datasets: MESAN, COSMO reanalysis, APGD, MSWEP, E-OBS, MESCAN, and ERA5-Land. Hydrological coherence was first evaluated by means of the NSE and KGE efficiency indexes. Then, we attempted to break down the main drivers of hydrological coherence by classifying the analyzed catchments based on hydrological and geomorphological characteristics, and by analyzing the relative incidence on the uncertainty of temperature and precipitation, by means of ANOVA.

How to cite: Galletti, A., Avesani, D., Bellin, A., and Majone, B.: Analysis and attribution of the hydrological coherence of gridded precipitation and temperature datasets in the Italian Alpine Region, EGU General Assembly 2023, Vienna, Austria, 23–28 Apr 2023, EGU23-15001, https://doi.org/10.5194/egusphere-egu23-15001, 2023.

EGU23-17151 | PICO | HS2.1.8

Spatial variability and temporal changes of drought generation processes over Europe and the Alps 

Anne Van Loon, Manuela Brunner, and Jonas Götte

Hydrological extreme events are generated by different sequences of hydro-meteorological drivers, the importance of which may vary within the sample of drought events and in space and time. Here, we investigate how the importance of different hydro-meteorological driver sequences varies by event magnitude, in space, and in time using large samples of catchments in Europe and the Alps. To do so, we develop an automated classification scheme for streamflow drought events, which assigns events to one of eight drought event types - each characterized by a set of single or compounding drivers. Our results show that (1) moderate droughts are mainly driven by rainfall deficits while severe events are mainly driven by snowmelt deficits; (2) rainfall deficit droughts and cold snow season droughts are the dominant drought event type in Western Europe and in Eastern and Northern Europe, respectively; (3) temporal changes in both drought intensity, deficit, and duration and generation processes are stronger in high- than in low-elevation catchments; and (4) in high-elevation catchments, snowmelt-deficit-induced droughts become more frequent, leading to increases in drought deficits. We conclude that climate impact assessments on droughts can profit from assessing changes in drought generation processes to improve the understanding of how drought magnitudes are changing in a warming world.

How to cite: Van Loon, A., Brunner, M., and Götte, J.: Spatial variability and temporal changes of drought generation processes over Europe and the Alps, EGU General Assembly 2023, Vienna, Austria, 23–28 Apr 2023, EGU23-17151, https://doi.org/10.5194/egusphere-egu23-17151, 2023.

HS2.2 – From observations to concepts to models (in catchment hydrology)

EGU23-344 | ECS | Posters on site | HS2.2.1

An information-theoretic approach for evaluating catchment scale process relationships 

Gowri Reghunath and Pradeep P. Mujumdar

Hydrological responses of a catchment evolve due to the complex interactions between various climate inputs and landscape characteristics. Such interactions and the resulting hydrological processes need to be adequately understood to explicitly describe the catchment’s behaviour and process dynamics. Hydrological modelling serves as a powerful tool to strengthen the understanding of such complex process interactions. Conventional hydrological modelling practices focus on calibrating the model outputs with an aim only to match the observed discharge at stream gauge locations. This procedure might not adequately capture the process interactions and the underlying causalities, especially in catchments exhibiting strong non-linear hydrological process relationships. While getting the streamflow right, there is a chance that the other hydrological processes may be wrongly captured, i.e., getting the right calibration results for the wrong reasons. In this study, information-theoretic measures such as Shannon Entropy, Mutual Information and Transfer Entropy are used to understand the process relationships simulated using a physically based hydrological model. The grid-based Variable Infiltration Capacity (VIC) model is employed at a spatial resolution of 0.25 x 0.25-degree over the Cauvery river basin in peninsular India at a daily time scale. Entropy measures are applied to the major hydrological processes such as rainfall, surface runoff, actual evapotranspiration and baseflow, which are simulated using the model, and their relationships are evaluated using non-linear correlation metrics. The study also proposes an entropy-based calibration framework for improving the model efficiency in simulating the catchment water balance. This work highlights the advantages of using information-theoretic measures over conventional methods in evaluating hydrological process relationships, especially in catchments manifesting strong non-linear hydrological behaviour.

How to cite: Reghunath, G. and Mujumdar, P. P.: An information-theoretic approach for evaluating catchment scale process relationships, EGU General Assembly 2023, Vienna, Austria, 23–28 Apr 2023, EGU23-344, https://doi.org/10.5194/egusphere-egu23-344, 2023.

EGU23-403 | ECS | Posters on site | HS2.2.1

Development of an hourly hydrological model for Great Britain 

qianyu zha, Yi He, and Timothy Osborn

Assessment of climate change impacts on flooding risks has been undertaken by using hydrological models calibrated at a daily time step and driven by daily outputs from the global or regional climate models. However, the daily scale model typically underestimates the magnitude of floods. A model run at a higher temporal resolution can be more capable of capturing flood peaks and hence more representative of the expected future flood magnitude (Beylich et al., 2021; Huang et al., 2019). This study aims to develop an hourly HBV hydrological model for Great Britain. The precipitation observations at an hourly time step for Great Britain [CEH-GEAR1hr] (Lewis et al., 2022) were used to calibrate the hourly HBV model. The model was also calibrated using daily observations from HadUK-Grid dataset (Hollis et al., 2019). The CAMELS-GB catchments in Great Britain (Coxon et al., 2020) were selected as the study area. Hourly time series of flow data were obtained from Environment Agency (EA) for England, Scottish Environment Protection Agency (SEPA) for Scotland and Natural Resources Wales (NRW) for Wales. Daily flow data are from National River Flow Archive (NRFA). The calibrating objective function for the HBV hydrological model at both daily and hourly time steps is Nash–Sutcliffe efficiency (NSE) (Nash and Sutcliffe, 1970), and also the modified Kling-Gupta efficiency (KGE), the ratio of the root-mean-square error to the standard deviation (RSR)  and Pearson's correlation coefficient (r) were used to compare. For the daily model, more than 77% and 35% of the CAMELS-GB catchments achieve NSE values over 0.6 and 0.8, respectively. The hourly model performance is comparable with the daily model and the hourly model outperforms the daily model in capturing the peak flows.

References
Beylich, M., Haberlandt, U., Reinstorf, F., 2021. Daily vs. hourly simulation for estimating future flood peaks in mesoscale catchments. Hydrol. Res. 52, 821–833. 
Coxon, G., Addor, N., Bloomfield, J.P., Freer, J., Fry, M., Hannaford, J., Howden, N.J.K., Lane, R., Lewis, M., Robinson, E.L., Wagener, T., Woods, R., 2020. CAMELS-GB: hydrometeorological time series and landscape attributes for 671 catchments in Great Britain. Earth Syst. Sci. Data 12, 2459–2483. 
Hollis, D., McCarthy, M., Kendon, M., Legg, T., Simpson, I., 2019. HadUK‐Grid—A new UK dataset of gridded climate observations. Geosci. Data J. 6, 151–159. 
Huang, Y., Bárdossy, A., Zhang, K., 2019. Sensitivity of hydrological models to temporal and spatial resolutions of rainfall data. Hydrol. Earth Syst. Sci. 23, 2647–2663. 
Lewis, E., Quinn, N., Blenkinsop, S., Fowler, H.J., Freer, J., Tanguy, M., Hitt, O., Coxon, G., Bates, P., Woods, R., Fry, M., Chevuturi, A., Swain, O., White, S.M., 2022. Gridded estimates of hourly areal rainfall for Great Britain 1990-2016 [CEH-GEAR1hr] v2.
Nash, J.E., Sutcliffe, J.V., 1970. River flow forecasting through conceptual models part I — A discussion of principles. J. Hydrol. 10, 282–290. 


How to cite: zha, Q., He, Y., and Osborn, T.: Development of an hourly hydrological model for Great Britain, EGU General Assembly 2023, Vienna, Austria, 23–28 Apr 2023, EGU23-403, https://doi.org/10.5194/egusphere-egu23-403, 2023.

EGU23-1369 | ECS | Orals | HS2.2.1

Physics-based hydrological modeling of the joint variations of stream network length and catchment discharge 

Francesca Zanetti, Gianluca Botter, and Matteo Camporese

Understanding the spatiotemporal dynamics of runoff generation in headwater streams is crucial for better characterizing catchment functioning under current and projected climatic conditions. In this context, experimental data on the expansion and contraction of the stream network can be especially valuable. These data can be gathered exploiting different tools and techniques, from visual surveys to cameras, from remote sensing to electrical conductivity probes. New available data are often used to study joint variations of active stream length and discharge at the catchment outlet and allowed the scientific community to derive general laws for describing and interpreting such complex behavior. However, field mapping is highly time consuming, e.g. because the instruments deployed required an intense supervision to ensure the reliability of the data collected. Using physically based numerical models to simulate the spatial configuration of the wet channels and the corresponding catchment discharge thus represents a promising application. In this study, we used CATHY (CATchment HYdrology), an integrated surface–subsurface hydrological model, to study event-based dynamics of catchment discharge and active stream network in two synthetic catchments with pre-defined geological characteristics (hydraulic conductivity, porosity, water retention curve, depth to bedrock) and different morphometric properties (shape and slope). We run a set of simulations under time-variant conditions and under steady state conditions for different levels of catchment wetness and we analyzed the emerging relationship between total active length (L) and outlet discharge (Q). The numerical simulations were used to investigate the role of topography, climate and morphology on the dynamics of L and Q, and the ensuing L(Q) relationship. Numerical models can be a valuable tool for investigating the internal dynamics of the soil moisture that eventually drives the joint changes of river network length and discharge in response to precipitation.

How to cite: Zanetti, F., Botter, G., and Camporese, M.: Physics-based hydrological modeling of the joint variations of stream network length and catchment discharge, EGU General Assembly 2023, Vienna, Austria, 23–28 Apr 2023, EGU23-1369, https://doi.org/10.5194/egusphere-egu23-1369, 2023.

EGU23-2314 | ECS | Posters on site | HS2.2.1

An analytical generalization of Budyko framework with physical accounts of climate seasonality and water storage capacity 

Xu Zhang, Jinbao Li, Qianjin Dong, and Ross A. Woods

The Budyko framework is an effective and widely used method for describing long-term water balance in large catchments. However, it only considers the limits of water and energy in evaporation (E), and ignores the impacts of climate seasonality and water storage capacity (Sc), resulting in errors for Mediterranean climate and catchments with small Sc. Here we combined the Ponce-Shetty model with Budyko hypothesis, and analytically generalized Budyko framework with physical accounts of climate seasonality and Sc. Precipitation (P), potential evaporation (PE), and Sc are used to represent the limits of water, energy, and space for E, respectively. Our results show that previous Budyko-type equations can be treated as special cases of generalized Budyko-type equations with uniform P and PE and infinite Sc. The new generalized equations capture the observed decrease in E due to asynchronous P and PE and small Sc, and perform better than the Budyko-type equations with varying parameters in the contiguous United States with fewer parameters. Overall, our generalization of Budyko framework improves the robustness and accuracy for estimating mean annual E with the aid of physical interpretation, and will facilitate water balance assessment at regional to global scales.

How to cite: Zhang, X., Li, J., Dong, Q., and Woods, R. A.: An analytical generalization of Budyko framework with physical accounts of climate seasonality and water storage capacity, EGU General Assembly 2023, Vienna, Austria, 23–28 Apr 2023, EGU23-2314, https://doi.org/10.5194/egusphere-egu23-2314, 2023.

EGU23-4281 | ECS | Posters on site | HS2.2.1

Hourly model simulation to improve the estimation of extreme floods in small catchments in Western Germany 

Li Han, Björn Guse, Dung Nguyen, Oldrich Rakovec, Xiaoxiang Guan, Sergiy Vorogushyn, Luis Samaniego, and Bruno Merz

The July 2021 flood in Western Germany is one of the most severe flood events in small-scale catchments during the past decades. It has led to life loss and severe damage in the Ahr, Erft, and Rur basins. The BMBF-funded joint project KAHR (https://hochwasser-kahr.de) deals with the effects of this flood and develops scientific knowledge to assist the reconstruction process. To analyze past floods and develop future flood management strategies, there is a need for small-scale flood modeling with finer spatial-temporal resolution in this area. Based on the derived simulated floods, we can investigate the spatiotemporal patterns of extreme weather and associated meteorological and hydrological conditions that could lead to similar or more significant flood events.

This study uses the mesoscale hydrological model mHM at hourly resolution for three small catchments Ahr, Erft, and Rur. This is one of the first applications of mHM forced with hourly meteorological forcing data and should enable more accurate processes and representation of such extreme floods. In a further step, a regional weather generator and a disaggregation procedure are applied to generate 10,000 years of synthetic hourly meteorological data for the Ahr, Erft, and Rur catchments. These data are used to create long time series of discharge with the calibrated mHM model. This enables the investigation of extreme floods and the assessment of flood risk under future climate conditions.

How to cite: Han, L., Guse, B., Nguyen, D., Rakovec, O., Guan, X., Vorogushyn, S., Samaniego, L., and Merz, B.: Hourly model simulation to improve the estimation of extreme floods in small catchments in Western Germany, EGU General Assembly 2023, Vienna, Austria, 23–28 Apr 2023, EGU23-4281, https://doi.org/10.5194/egusphere-egu23-4281, 2023.

EGU23-4911 | ECS | Orals | HS2.2.1

Satellite-based soil moisture could enhance the reliability of agro-hydrological modeling in large transboundary river basins 

Mohammad Reza Eini, Christian Massari, and Mikołaj Piniewski

Satellite-based observations of soil moisture, leaf area index, precipitation, and evapotranspiration facilitate agro-hydrological modeling thanks to the spatially distributed information. In this study, the Climate Change Initiative Soil Moisture dataset (CCI SM, a product of the European Space Agency (ESA)) adjusted based on Soil Water Index (SWI) was used as an additional (in relation to discharge) observed dataset in agro-hydrological modeling over a large-scale transboundary river basin (Odra River Basin) in the Baltic Sea region. This basin is located in Central Europe within Poland, Czech Republic, and Germany and drains into the Baltic Sea. The Soil and Water Assessment Tool+ (SWAT+) model was selected for agro-hydrological modeling, and measured data from 26 river discharge stations and soil moisture from CCI SM (for topsoil and entire soil profile) over 1476 sub-basins were used in model calibration for the period 1997-2019. Kling–Gupta efficiency (KGE) and SPAtial EFficiency (SPAEF) indices were chosen as objective functions for runoff and soil moisture calibration, respectively. Two calibration strategies were compared: one involving only river discharge data (single-objective - SO), and the second one involving river discharge and satellite-based soil moisture (multi-objective – MO). In the SO approach, the average KGE for discharge was above 0.60, whereas in the MO approach, it increased to 0.67.The SPAEF values showed that SWAT+ has acceptable accuracy in soil moisture simulations. Moreover, crop yield assessments showed that MO calibration also increases the crop yield simulation accuracy. The results show that in this transboundary river basin, adding satellite-based soil moisture into the calibration process could improve the accuracy and consistency of agro-hydrological modeling.

How to cite: Eini, M. R., Massari, C., and Piniewski, M.: Satellite-based soil moisture could enhance the reliability of agro-hydrological modeling in large transboundary river basins, EGU General Assembly 2023, Vienna, Austria, 23–28 Apr 2023, EGU23-4911, https://doi.org/10.5194/egusphere-egu23-4911, 2023.

EGU23-5579 | ECS | Posters on site | HS2.2.1

Developing generic reservoir operating rules for inclusion in the national-scale hydrological modelling of Great Britain 

Saskia Salwey, Gemma Coxon, Francesca Pianosi, Rosanna Lane, Michael Bliss Singer, and Chris Hutton

To meet growing water demand and to satisfy an increasing population, reservoirs are continually being integrated into river systems across the world. The presence of a reservoir can dictate the downstream flow regime, such that in many locations, understanding reservoir operations can be crucial to understanding the hydrological functioning of an impacted catchment. Consequently, over the last two decades, correctly representing reservoirs, and their operations, in hydrological modelling frameworks has become a key area of research for simulating water availability. Although substantial progress has been made in modelling reservoir operations (which control how water volumes are distributed across space and time), there is still no consensus on the best way to define, calibrate and evaluate operating rules within hydrological models. In most locations, data describing reservoir operating rules are not available, and timeseries of reservoir inflow, outflow and storage are often unpublished. Consequently, modelers must simplify and generalize sets of release rules from very little information, particularly where they are to be applied across large scales (e.g. across hundreds of reservoirs). Generic reservoir operating rules have typically been tested and developed using the Global Reservoir and Dam (GranD) database and thus are biased towards large irrigation reservoirs (which make up the majority of the dataset). Whilst operating rules have also been tested across many hydropower and multipurpose reservoirs, a gap remains for the definition of generic reservoir operating rules designed for smaller water supply reservoirs that can be applied nationally in countries such as Great Britain (GB).

In this study, we integrate a new generic reservoir simulation component into a national-scale hydrological model of Great Britain and compare simulation results from two modelling scenarios (with and without the new reservoir component). The first scenario, where reservoirs are omitted, is used as a benchmark representative of current modelling practices in GB (where none of the national-scale hydrological models include reservoirs), whilst the second uses a set of generic operating rules focused on simulating small, water resource reservoirs. In both scenarios, we use Multiscale Parameter Regionalisation (MPR) for model calibration. To assess the suitability of our operating rules for simulating future conditions and evaluating water availability during hydrological extremes, we test the consistency of model performance across the onset, duration and recovery from droughts. This study will demonstrate the importance of including reservoir representation in hydrological models of Great Britain, and will introduce a set of operating rules suitable for smaller reservoirs with a focus on water supply.

How to cite: Salwey, S., Coxon, G., Pianosi, F., Lane, R., Bliss Singer, M., and Hutton, C.: Developing generic reservoir operating rules for inclusion in the national-scale hydrological modelling of Great Britain, EGU General Assembly 2023, Vienna, Austria, 23–28 Apr 2023, EGU23-5579, https://doi.org/10.5194/egusphere-egu23-5579, 2023.

EGU23-6075 | ECS | Posters on site | HS2.2.1

Global validation of the SoilClim soil moisture estimates using in-situ and remote sensing observations 

Marketa Podebradska, Milan Fischer, Jan Balek, and Miroslav Trnka

Soil moisture is a key factor for plant growth and agricultural production. Therefore, it has become a fundamental part of agricultural drought monitoring systems developed for various spatial scales ranging from local to regional and global. Despite the development of large-scale soil moisture monitoring systems, in-situ soil moisture observations still remain inadequate for precise soil moisture monitoring, especially in remote areas, where there is a limited number of monitoring stations. Together with remote sensing technologies soil moisture modeling may provide an alternative to in-situ measurements that delivers spatially continuous estimates over large geographic areas. SoilClim is a semi-empirical water balance model that, together with other outputs (e.g., reference and actual evapotranspiration, soil temperature), estimates daily soil moisture in various depths of soil profile. The model has previously been validated on a total of 20 sites (5 in Central Europe and 15 in central USA) and is now used for global monitoring and prediction of soil moisture and drought intensity in an operational and interactive web platform (www.windy.com). Our study evaluates the SoilClim soil moisture global measurements with 0.1° spatial resolution using two independent sources of information: i) in-situ soil moisture measurements from the International Soil Moisture Network, and ii) the soil moisture derived from the Metop ASCAT sensors on Metop-A and Metop-B satellites. In the conference presentation we will introduce the SoilClim model and present results of the global validation including statistical spatial analysis and triple collocation.

Acknowledgement: This study was conducted with support of SustES - Adaptation strategies for sustainable ecosystem services and food security under adverse environmental conditions (CZ.02.1.01/0.0/0.0/16_019/0000797).

How to cite: Podebradska, M., Fischer, M., Balek, J., and Trnka, M.: Global validation of the SoilClim soil moisture estimates using in-situ and remote sensing observations, EGU General Assembly 2023, Vienna, Austria, 23–28 Apr 2023, EGU23-6075, https://doi.org/10.5194/egusphere-egu23-6075, 2023.

EGU23-7358 | ECS | Posters on site | HS2.2.1

Flow intermittence prediction using a hybrid hydrological modelling approach: a guide to reducing uncertainty related to observed intermittence data 

Louise Mimeau, Annika Künne, Flora Branger, Sven Kralisch, Alexandre Devers, and Jean-Philippe Vidal

Rivers are rich in biodiversity and act as ecological corridors for plant and animal species. With climate change and increasing anthropogenic water demand, more frequent and prolonged periods of drying in river systems are expected, endangering biodiversity and river ecosystems. However, understanding and predicting the hydrological mechanisms that control periodic drying and rewetting in rivers is challenging due to a lack of studies and hydrological observations, particularly in non-perennial rivers.

Within the framework of the Horizon 2020 DRYvER (Drying River Networks and Climate Change) project, a hydrological modelling study of flow intermittence in rivers is being carried out in 6 European catchments (Croatia, Spain, Finland, France, Hungary, Czech Republic) characterized by different climate, geology and anthropogenic use. The objective of this study is to represent the spatio-temporal dynamics of flow intermittence at the reach level in meso-scaled river networks (between 200 km² and 350 km²). The daily and spatially distributed flow condition (flowing or dry) is predicted using the J2000 distributed hydrological model coupled with a Random Forest classification model. Observed flow condition data from different sources (water level measurements, photo traps, water temperature measurements, citizen science applications) are used to build the predictive model. In this study we aim to evaluate the impact of the observed flow condition dataset (sample size, spatial and temporal representativeness) on the performance of the predictive model.

Results show that the hybrid modelling approach developed in this study allows to predict precisely the spatio-temporal patterns of drying in the 6 catchments. This study shows the value of combining different sources of observed flow condition data to reduce the uncertainty in predicting flow intermittence.

How to cite: Mimeau, L., Künne, A., Branger, F., Kralisch, S., Devers, A., and Vidal, J.-P.: Flow intermittence prediction using a hybrid hydrological modelling approach: a guide to reducing uncertainty related to observed intermittence data, EGU General Assembly 2023, Vienna, Austria, 23–28 Apr 2023, EGU23-7358, https://doi.org/10.5194/egusphere-egu23-7358, 2023.

EGU23-7472 | Orals | HS2.2.1 | Highlight

Recent progress in land surface models related to the hydrological cycle 

Matthias Cuntz

What is the difference between a hydrologic model and a land surface model (LSM)? While hydrologic models concentrate on water fluxes and stores, LSMs describe the coupled energy, water and carbon cycles. There are also little conceptual LSMs so that they can best be compared to so-called process-based hydrologic models. Quite a few of the LSMs were developed as part of Earth System Models. Their primary output variables are hence the exchange fluxes with the atmosphere and they are often operated on continental to global scale, which implies very coarse spatial resolutions compared to hydrologic models.

Here I will describe how state-of-the-art LSMs describe the water fluxes and how the fluxes are evaluated. I will outline current developments in the LSM community, focusing on the developments related to the hydrologic cycle. I will discuss current trends amongst developers of LSMs and problems that originate from these trends. I will also point to the challenges that come from ever increasing model resolutions. I will discuss in this context the scaling issue of, for example, soil parameters and how specific choices lead to problems in other parts of the LSM.

How to cite: Cuntz, M.: Recent progress in land surface models related to the hydrological cycle, EGU General Assembly 2023, Vienna, Austria, 23–28 Apr 2023, EGU23-7472, https://doi.org/10.5194/egusphere-egu23-7472, 2023.

EGU23-7622 | Orals | HS2.2.1

Modelling Infiltration and Infiltration Excess: The Importance of Fast and Local Processes 

Axel Bronstert, Daniel Niehoff, and Gerd R. Schiffler

A major aim of physically based distributed hydrological models is an adequate representation of hydrological processes, including runoff generation processes. A significant proportion of runoff is generated through the subsurface, i.e. by groundwater flow or unsaturated subsurface stormflow. However, in the case of high rainfall intensity and/or low soil-surface infiltrability, surface runoff may strongly contribute to total runoff, too, either through saturation excess (“Dunne-type surface runoff”) or infiltration excess (“Hortonian surface runoff”). Both types of surface runoff can be rather important if antecedent wetness is high and parts of the catchment area are saturated (leading to saturation excess), or if the maximum infiltration rate into the soil surface is less than the actual rainfall intensity (resulting in infiltration excess). Even though the latter process can be very important during high-intensity rainstorms, both for flood generation and for matter transport linked with surface runoff, an appropriate consideration of this process in catchment models is still challenging. Actually, budgeting between the actual rainfall intensity and the soil surface infiltration capacity is required. This may appear simple in principle, but there are a number of challenges in the details: First, the ‘real’ rainfall intensity may vary tremendously in time increments much smaller than the time step of the model. The soil surface infiltrability can also be significantly reduced, e.g. by crusting, compaction or rain energy-induced sealing of the soil surface or through hydrophobic effects.

Otherwise, soil infiltrability can be strongly enhanced as a consequence of preferential flow paths / macropores caused by e.g. bioturbations or other voids.

Finally, there is high variability of such soil surface features appearing at a rather small spatial scale, below the typical spatial modelling unit.

This contribution presents observational data and model approaches to deal with these challenges. We show results from combined infiltration and infiltration-excess experiments and observations at three different spatial scales. Then, we present a model approach based on a double-porosity soil, thus enabling the combined modelling of high infiltration rates and dampened soil moisture distribution after termination of infiltration, as observable in the field. Furthermore, we present an approach to model the effects of soil surface conditions on actual infiltration capacity and its variation.

We show simulation results where these approaches improved the overall plausibility and explanatory power of the model concerning surface runoff generation and soil moisture dynamics. For instance, model results of infiltration experiments at the plot and hillslope/field scales show that it is possible to simulate high infiltration rates jointly with a relatively slow movement of moisture within the soil matrix, field phenomena often observed in the case of heavy rainfall. Other simulation efforts deal with the non-linear and space-time variable effects of soil surface conditions. This is a rather important feature for flood generation in the case of high rainfall intensity and low soil infiltrability.

How to cite: Bronstert, A., Niehoff, D., and Schiffler, G. R.: Modelling Infiltration and Infiltration Excess: The Importance of Fast and Local Processes, EGU General Assembly 2023, Vienna, Austria, 23–28 Apr 2023, EGU23-7622, https://doi.org/10.5194/egusphere-egu23-7622, 2023.

Climate change increases the risk of water scarcity due to a higher probability of droughts and heat waves, even in temperate countries. A currently controversial adaptation strategy deployed by farmers is the multiplication of small dams to intercept water during the winter months (either from hillslopes or headwater streams), and store it through the summer months to secure irrigation and cattle watering. However, the impact of such practices on catchment water balance and streamflow dynamics is difficult to assess, because of the lack of reliable data but also the lack of models able to represent these devices. In the framework of the J2000 distributed hydrological model, we developed a simple component representing farm dams in mesoscale to regional scale catchments. The model was applied to the Rhône catchment in France (~ 100000 km²), using a database of known locations of farm dams to assess the impact of these dams on catchment water balance components and several streamflow dynamics indicators. Several scenarios were simulated, under present climate, according to various parameterizations such as absence / presence of dams but also varying the density and dimensions of the reservoirs, as well as their infiltration properties and drainage areas. The results show that the impact of such dams is potentially high, but is also highly dependent on the parameterization scenarios, thus confirming the need for more complete land and water uses databases.

How to cite: Branger, F., Bonneau, J., Pouchoulin, S., and Sauquet, E.: Cumulative impact of farm dams on catchment water balance and streamflow dynamics at the regional scale. A numerical experiment using a distributed hydrological model., EGU General Assembly 2023, Vienna, Austria, 23–28 Apr 2023, EGU23-8106, https://doi.org/10.5194/egusphere-egu23-8106, 2023.

EGU23-8529 | ECS | Posters virtual | HS2.2.1

Spatiotemporal analysis and modeling of nonstationarity in hydrological time series 

Nishant Kumar, D. Nagesh Kumar, and Tirthankar Roy

Detection of nonstationarity in hydrological time series is most commonly done through one or two unit root tests, which usually do not account for all the possible reasons that could induce nonstationarity in a time series. To overcome this, we carried out five different unit root tests, i.e., Augmented Dickey-Fuller (ADF) test, Kwiatkowski Phillips Schmidt Shin (KPSS) test, Phillips Perron (PP) test, Variance Ratio (V ratio) test, and Leybourne McCabe (LMC) test, along with the line spectrum analysis in the frequency domain. These tests were conducted on daily rainfall data at forty contiguous grid points around the Malaprabha basin in India using data from the Indian Meteorological Department. The main goal was to find different nonstationary time series and investigate the spatiotemporal patterns of the nonstationarity and use that information to further develop nonstationary time series models through three different modeling approaches, i.e., Seasonal Autoregressive Integrated Moving Average (SARIMA), Exponential Smoothing (ES), and Long Short-Term Memory (LSTM). The performance of these models was evaluated on the basis of Nash Sutcliffe Efficiency (NSE) and R2 value. 

How to cite: Kumar, N., Kumar, D. N., and Roy, T.: Spatiotemporal analysis and modeling of nonstationarity in hydrological time series, EGU General Assembly 2023, Vienna, Austria, 23–28 Apr 2023, EGU23-8529, https://doi.org/10.5194/egusphere-egu23-8529, 2023.

EGU23-9526 | ECS | Orals | HS2.2.1

Multi-basin calibration of the ECMWF land-surface model ECLand 

Stephan Thober, Robert Schweppe, Matthias Kelbling, Sebastian Müller, Juliane Mai, Christel Prudhomme, Gianpaolo Balsamo, and Luis Samaniego

Accurately and efficiently estimating parameters for spatially distributed environmental models is impossible without proper regularization of the parameter space. The Multiscale Parameter Regionalization (MPR, Samaniego et al. 2010) makes use of high-resolution physiographic data (i.e., physiographic data such as soil maps and land cover information) to translate local land surface properties into model parameters. MPR consists of two steps: first, the high-resolution model parameters are derived from physiographic data via transfer functions at the native resolution. Second, the model parameters are upscaled to the target resolution used by the environmental modelling application. MPR has been already successfully applied for the mesoscale hydrologic model (mHM, Samaniego et al. 2010, Kumar et al. 2013). The model agnostic, stand-alone version  implementation of MPR (Schweppe et al., 2022) allows applying this technique to any land-surface model or hydrological model.

In this study, we apply the MPR to optimize parameters for the land-surface model ECLand (Boussetta et al. 2021) of the ECMWF Integrated Forecasting System. Calibrating ECLand parameters at individual river basins leads to an improved representation of river discharge, i.e., an improved Kling-Gupta efficiency. In an ongoing effort, we explore model parameters optimization on multiple basins simultaneously to provide an improved representation of river discharge at a global scale. The calibration locations are chosen to cover different climates, soil, and land characteristics among other features.

References:

Samaniego L., Kumar, R., and Attinger, S.: “Multiscale parameter regionalization of a grid-based hydrologic model at the mesoscale”, Water Resour. Res., 46, 2010.

Kumar, R., Samaniego, L., and Attinger, S.: “Implications of distributed hydrologic model parameterization on water fluxes at multiple scales and locations”, Water Resources Res, 2013

Schweppe, R., Thober, S., Müller, S., Kelbling, M., Kumar, R., Attinger, S., and Samaniego, L.: MPR 1.0: a stand-alone multiscale parameter regionalization tool for improved parameter estimation of land surface models, Geosci. Model Dev., 15, 859–882, https://doi.org/10.5194/gmd-15-859-2022, 2022

Boussetta S, Balsamo G, Arduini G, Dutra E, McNorton J, Choulga M, Agustí-Panareda A, Beljaars A, Wedi N, Munõz-Sabater J, de Rosnay P, Sandu I, Hadade I, Carver G, Mazzetti C, Prudhomme C, Yamazaki D, Zsoter E. ECLand: The ECMWF Land Surface Modelling System. Atmosphere. 2021; 12(6):723. https://doi.org/10.3390/atmos12060723

How to cite: Thober, S., Schweppe, R., Kelbling, M., Müller, S., Mai, J., Prudhomme, C., Balsamo, G., and Samaniego, L.: Multi-basin calibration of the ECMWF land-surface model ECLand, EGU General Assembly 2023, Vienna, Austria, 23–28 Apr 2023, EGU23-9526, https://doi.org/10.5194/egusphere-egu23-9526, 2023.

EGU23-9706 | ECS | Orals | HS2.2.1

Hydrological Signature Representation of 7533 KGE Calibrated Conceptual Model Structures 

Diana Spieler and Niels Schütze

Discussions calling for more rigorous evaluation practices for hydrologic models have recently increased. In addition to the widely used integral objective functions, hydrologic signatures are becoming common evaluation metrics for proving the suitability of hydrologic models for specific application purposes.

This work calibrates 7488 fixed conceptual model structures using KGE as an objective function. These structures range from a 1 to 3 storage model space previously used for an automatic model structure identification experiment. In this experiment we simultaneously calibrated the model structure (number of stores and flux equations) and its parameter values. Additionally, we calibrated 45 literature-based model structures (MARRMoT Toolbox) to extend the structural diversity in the analyzed models. We select well-performing models based on their KGE value (as is common practice) and analyze their performance using 12 selected hydrological runoff signatures. These signatures represent five aspects of the hydrological regime (magnitude, frequency, duration, rate of change, and timing). The large number of model structures, calibrated to the streamflow of 12 MOPEX catchments, allows general insight into how well common conceptual model structures can represent observed hydrological behavior evaluated by signatures.

Results show a general behavior of model structures calibrated to KGE to perform well in representing runoff ratio, mean discharge, the 95th streamflow percentile, and the mean half-flow date. However, the analyzed conceptual model structures struggle to represent low flow and frequency signatures. When evaluated only for KGE, we can identify dominating model structures over all catchments. When evaluated for signatures, there are no model preferences over all analyzed catchments but different models seem to have their merits under specific conditions. These results support the need for ensuring model adequacy for a given task.

How to cite: Spieler, D. and Schütze, N.: Hydrological Signature Representation of 7533 KGE Calibrated Conceptual Model Structures, EGU General Assembly 2023, Vienna, Austria, 23–28 Apr 2023, EGU23-9706, https://doi.org/10.5194/egusphere-egu23-9706, 2023.

EGU23-9829 | Orals | HS2.2.1

Evaluating global hydrological-process modelling beyond river discharge observations 

Rafael Pimentel, Louise Crochemore, Jafet C.M. Andersson, and Berit Arheimer

Catchment modelling of water balance components is nowadays done at high spatial resolution for continental and global scales, thanks to the increasing computational capacity and the growing trend towards open data. One of these process-based models is the World-Wide HYPE (WW-HYPE; Arheimer et al., 2020), which was set-up by a stepwise calibration strategy to avoid equifinality when using streamflow data for parameter estimation. In this presentation we suggest to further evaluate whether the model is right for the right reason by comparing internal variables against independent Earth Observations (EO). We then assume that the results are robust if the two different sources of data reveal the same results. This approach could become a new standard method today for evaluating continuous process-based global models as there are numerous EO products representing various hydrological variables, most of them covering at least the last decade.

We propose to compare three aspects when evaluating robustness in global hydrological variables: i) long-term means, ii) seasonal variability through monthly means, and iii) equifinality by comparing model-streamflow performance versus internal variable performance.

We applied this method by comparing six hydrological variables (potential and actual evapotranspiration, snow cover, snow water equivalent, soil moisture or changes in water storages) from EO-products (based on MODIS, GlobSnow, ESA-CCI Soil Moisture and GRACE) with WWH variables for the time-period 2000-2014 (Pimentel et al, 2023). We then found that the general patterns in the hydrological cycle show good agreement between catchment modelling and EO at the global scale, although some months in water-storage changes differed. These dissimilarities indicate that hydrological variables above the ground and earlier in the flow path are more robust than the sub-surface downstream processes, such as soil moisture distribution and water-storage changes, which reflect more complex processes that can be challenging to describe both by hydrological models and satellite sensors. Regarding geographical distribution, there is a larger spread in results from regions with extreme characteristics, such as cold regions (Canadian prairies), arid regions (western USA, deserts), highly forested areas (Amazonas), and transition zones (Sahel and Mediterranean Basin). This indicate that the particularity of these regions calls for specific regional modelling and monitoring approaches rather than continental or global approaches.

On the contrary, in temperate regions at mid-latitudes, e.g., eastern USA and central Europe, almost all the hydrological variables were found robust. With respect to equifinality, overall, there were no indication on good discharge performance and bad internal model representation. The exercise shows the potential in using EO products for model evaluation beyond traditional river-discharge observations from gauges, to first assess the robustness of hydrological variables and second to determine which processes should be better represented in model parameterisation, without forgetting that EO products are not a ground truth and are also assigned with uncertainties.


References:

Arheimer et al., 2020: Global catchment modelling using World-Wide HYPE (WWH), open data and stepwise parameter estimation, HESS 24, 535–559, https://doi.org/10.5194/hess-24-535-2020

Pimentel et al., 2023: Assessing Robustness in Global Hydrological Modelling through EO Comparisons, HSJ (in review)

How to cite: Pimentel, R., Crochemore, L., Andersson, J. C. M., and Arheimer, B.: Evaluating global hydrological-process modelling beyond river discharge observations, EGU General Assembly 2023, Vienna, Austria, 23–28 Apr 2023, EGU23-9829, https://doi.org/10.5194/egusphere-egu23-9829, 2023.

EGU23-9847 | Orals | HS2.2.1 | Highlight

Impact of calibration metric selection and spatial heterogeneity in soil parameters on the realism of distributed hydrological models 

Pablo A. Mendoza, Nicolás Vásquez, Nicolás Cortés-Salazar, Naoki Mizukami, and Ximena Vargas

Distributed hydrological models are useful tools to explicitly simulate the spatial heterogeneity of water and energy fluxes and storages. Nevertheless, their parameters are typically calibrated using streamflow-based objective functions that integrate information on the spatial variability of physical processes into a single metric. Additionally, these models contain several soil parameters that can be distributed in space, affecting the spatial representation of hydrological variables. Here, we examine the implications of streamflow-based calibration metric selection and spatial heterogeneity in soil parameters on the realism of model simulations, with emphasis on spatial patterns. To this end, we conduct several calibration experiments in six pilot basins with different hydrological regimes (two snowmelt-driven, two mixed-regime, and two rainfall-driven basins), in central-southern Chile, using the Variable Infiltration Capacity (VIC) model coupled with the mizuRoute routing model. In each experiment we assess, for a given calibration objective function, the effects of distributing individual soil parameters using a spatial regularization strategy based on principal component analysis of physiographic and soil characteristics (elevation, slope, clay content, sand content and bulk density), defining the case of spatially constant soil parameters as the benchmark (i.e, only meteorological forcing data and vegetation attributes are spatially distributed). To evaluate simulated spatial patterns, we use satellite remote sensing data of soil moisture from the ESA-CCI product, and fractional snow-covered area, actual evapotranspiration (ET), and land surface temperature from MODIS products. The results show that similar streamflow performance metrics can be achieved with different combinations of regularized soil parameter and calibration metric; however, the simulated spatial patterns can be considerably different, without clear connections with the hydrological regime. Further, a streamflow-based calibration is insufficient to represent the seasonality of other variables, especially in water-limited catchments, where important shifts (e.g., up to five months) in peak ET can be obtained compared to the reference product.

How to cite: Mendoza, P. A., Vásquez, N., Cortés-Salazar, N., Mizukami, N., and Vargas, X.: Impact of calibration metric selection and spatial heterogeneity in soil parameters on the realism of distributed hydrological models, EGU General Assembly 2023, Vienna, Austria, 23–28 Apr 2023, EGU23-9847, https://doi.org/10.5194/egusphere-egu23-9847, 2023.

Evapotranspiration (ET) and recharge fluxes are fluxes at the land-atmosphere interface. Evaporative flux links the surface and atmospheric systems and the recharge flux links the surface and subsurface systems. These are two critical fluxes in the water cycle that have major impact on agriculture, water supply, climate, biogeochemical cycles and etc. These fluxes are interconnected and depend on the soil moisture content.  In situ measurements of ET and recharge are costly, limited and cannot be readily scaled to regional scales relevant to weather and climate studies. Sequence of land surface state observations of moisture (SM) and temperature (LST), widely available from remote sensing across a range of scales, contain implicit information that can be used for characterization and mapping of evapotranspiration and recharge fluxes.

In this work, A variational data assimilation (VDA) framework is developed to estimate key parameters of ET and recharge flux by assimilating Soil Moisture Active Passive (SMAP) soil moisture and Geostationary Operational Environmental Satellite (GOES) land surface temperature data into a coupled dual-source energy and water balance model. These parameters include neutral bulk heat transfer coefficient (CHN) and evaporative fraction from soil (EFS) and canopy (EFC)) that regulate the partitioning of available energy, and the effective saturated hydraulic conductivity (Ks) and bore size index (B) that regulate the movement of moisture into the soil column. The uncertainties of the retrieved parameters are estimated through the inverse of the hessian of the cost function, obtained using the lagrangian methodology. Analysis of the second-order information provides a tool to identify the optimum parameter estimates and guides towards a well-posed estimation problem.

The proposed framework is implemented over the US Southern great plain (SGP) and Oklahoma Panhandle region (with computational grid size of 0.05 degree) to map evapotranspiration and recharge fluxes across a range of temporal scales. Comparison with in-situ observations from the USCRN and the Mesonet sites show that the proposed assimilation framework can accurately estimate the temporal variability of root zone soil moisture profile. The evapotranspiration estimates show good agreement with the in-situ data from Atmospheric Radiation Measurement (ARM) sites at different locations and the estimated annual recharge flux values are within the range suggested in the literature for this region. Results demonstrate the success of the proposed assimilation framework in estimating key water cycle components and their interrelations across a range of spatial and temporal scales from remotely sensed near surface soil moisture and temperature data.

How to cite: Farhadi, L. and Mahmood, A.: An Integrated Variational Framework for Coupled Estimation of Evapotranspiration and Recharge by Assimilating Land Surface Soil Moisture and Soil Temperature Data , EGU General Assembly 2023, Vienna, Austria, 23–28 Apr 2023, EGU23-9997, https://doi.org/10.5194/egusphere-egu23-9997, 2023.

EGU23-10121 | ECS | Posters on site | HS2.2.1

Evaluation of four hydrological models to simulate daily streamflow time series in a tropical river basin of Brazil 

Leandro Ávila, Reinaldo Silveira, André Campos, Nathalli Rogiski, Camila Freitas, Cássia Aver, and Fernando Fan

The Electric Energy Company of Parana (COPEL GeT), the Meteorological System of Parana (SIMEPAR) and RHAMA Consulting company are undertaking the research project PD-6491- 0503/2018 for the development of a hydrometeorological seasonal forecasting for Brazilian reservoirs. The project, sponsored by the Brazilian Electricity Regulatory Agency (ANEEL) under its research and development program, aims the forecasting of streamflow, at temporal scales ranging from 1 to 270 days, at hydro power enterprises, which are integrated by the National Power System Operator (ONS) through its Interconnected System (SIN). With the aim of implement a seasonal forecasting system using different hydrological modeling approaches, it is necessary first to validate the use of different hydrological models during the calibration and validation stages. This work evaluates the performance of four conceptual hydrological models to represent daily streamflow regimes at four hydropower plants located in the Teles Pires river basin (Brazil). The adopted models included the GR4J, HYMOD, HBV, and the SMAP. The calibration of the parameters for each hydrological model was performed using the SCE-UA method and a triangular weighting function was adopted for routing the hydrograph between sub-watersheds. The evaluation of each model was elaborated by the comparison of the observed and simulated streamflow time series during the calibration (2010-2016) and the validation period (2016-2019) using deterministic metrics and statistical tests. A post-processing procedure based on the quantile-quantile method was applied in order to correct the simulated data and reduce the bias with respect the observed data. In general, the results show that the SMAP model present a better performance to simulate the daily streamflow regimes at the simulated hydropower plants, with Nash-Sutcliffe coefficient (NSE) greater than 0.65, and NSElog values greater than 0.8. In addition, the bias correct procedure shows a significant improvement in the adjust of the simulated data to represent the periodic streamflow regimes in the selected river basin.

How to cite: Ávila, L., Silveira, R., Campos, A., Rogiski, N., Freitas, C., Aver, C., and Fan, F.: Evaluation of four hydrological models to simulate daily streamflow time series in a tropical river basin of Brazil, EGU General Assembly 2023, Vienna, Austria, 23–28 Apr 2023, EGU23-10121, https://doi.org/10.5194/egusphere-egu23-10121, 2023.

Physically-based hydrologic models can accurately simulate streamflow in natural environment, but they cannot precisely consider the anthropogenic disturbance caused by the operation of large-scale dams. We tried to overcome this issue by developing a hybrid modeling framework, consisting of physically-based models for simulating upstream natural watersheds and deep-learning-based models for simulating dam operation. The model was developed for the Paldang Dam watershed, a major water source for Seoul metropolitan area, where the importance of stable water supply has increased due to the increase of population and water use per capita. The prediction performance of the hybrid model was compared with that of models built based only on the physically-based hydrologic model, namely the Variable Infiltration Capacity model, with single and cascaded structure. For the validation period, Nash-Sutcliffe Efficiency from the developed hybrid model, the single model, and the cascaded model were 0.6410, -0.1054, and 0.2564, respectively, suggesting that the consideration of dam operation aided by the machine learning algorithm is essential for accurate assessment of streamflow.

This work was supported by the National Research Foundation of Korea(NRF) grant funded by the Korea government(MSIT) (No. NRF-2022R1A4A3032838).

How to cite: Kim, Y. and Kim, D.: A Hybrid Hydrological Modelling Approach Combining Physically-Based and Deep-Learning-Based Models to Consider Dam Operations, EGU General Assembly 2023, Vienna, Austria, 23–28 Apr 2023, EGU23-10287, https://doi.org/10.5194/egusphere-egu23-10287, 2023.

EGU23-10593 | ECS | Orals | HS2.2.1

Incorporating The Variable Contributing Area Concept in The HYPE Modelling Framework 

Mohamed Ismaiel Ahmed, Kevin Shook, Alain Pietroniro, Tricia Stadnyk, John W. Pomeroy, Charlotta Pers, and David Gustafsson

Modelling the hydrology of the North American prairie region is complicated by the dominance of cold region processes and by the flat topography, which contains millions of depressions. The depressions contribute to variable contributing areas in prairie basins, due to their varying water storage. The relationships between the depressional storage, and the contributing fraction are hysteretic and strongly influence the basin responses. Most hydrological models do not represent these complex hysteretic relationships, and therefore struggle in simulating the hydrology of the region. In this study, we propose a novel Hysteretic Depressional Storage (HDS) algorithm that is based on the known hysteretic properties of prairie depressions. HDS is implemented into the HYPE modelling framework to improve the simulations of prairie streamflow by accounting for the variable contributing area. The modified HYPE, and the original program are tested on two depression-dominated basins in Saskatchewan, Canada. The modified HYPE model show improved simulation of streamflows compared to the original HYPE model. The HDS algorithm can contribute to improving the streamflow simulation of not only the North American prairie region, but also in the arctic and Siberian regions, which are dominated by the same complex depressional storages. The modified HYPE model should also improve the estimates of surface water storage and the resulting evaporative fluxes in these regions, increasing model fidelity and improving water budget estimates in these complex terrains, especially under changing climates.

How to cite: Ahmed, M. I., Shook, K., Pietroniro, A., Stadnyk, T., Pomeroy, J. W., Pers, C., and Gustafsson, D.: Incorporating The Variable Contributing Area Concept in The HYPE Modelling Framework, EGU General Assembly 2023, Vienna, Austria, 23–28 Apr 2023, EGU23-10593, https://doi.org/10.5194/egusphere-egu23-10593, 2023.

The Geum River basin, located in the west-central part of the Korean Peninsula, is the third largest and minimally human-disturbed river basin in South Korea. Streamflow and available water resources from this basin is critical for water supply for agriculture. Due to the increased population, industrialization, and climate change, changes in streamflow and available water resources for the Geum River are expected. However, there are limitations in analyzing water resource changes in the Geum River Basin with discontinuous and relatively short observational streamflow records.

In this study, we propose to dynamically downscale daily surface and base runoff data from the 10-km ERA5 reanalysis product via VIC-River Routing model. The VIC-River Routing model was ran at the 90-meter spatial resolution with geographical information to reconstruct long-term naturalized streamflow data over 1950-2021. In the VIC-River Routing model, the flow direction, stream order, and slope estimated from the 90-meter digital elevation model (DEM) over Geum River basin as the topographical parameters. This downscaled natural streamflow data will provide an opportunity to investigate hydroclimatic changes of the hydrologic regime of Geum River.

How to cite: Kim, B.-H. and Kam, J.: Dynamical downscaling of ERA5-based high-resolution streamflow dataset over the Geum River basin, South Korea via VIC-river routing model (1950-2021), EGU General Assembly 2023, Vienna, Austria, 23–28 Apr 2023, EGU23-10748, https://doi.org/10.5194/egusphere-egu23-10748, 2023.

EGU23-10786 | Posters on site | HS2.2.1

Estimation of spatio-temporal groundwater recharge in Jeju Island, Korea 

Jeong Eun Lee, Chul-Gyum Kim, Jeongwoo Lee, Il-Moon Chung, and Sun Woo Chang

Accurate estimation of groundwater recharge in Jeju Island, which relies on groundwater for most of its water use, is very important for water resource management and planning. However, Jeju watershed is a volcanic island with high permeability, ephemeral streams and mountain areas, so it is difficult to estimate the hydrological components using existing hydrological models. To overcome these limitations, SWAT-K (Soil and Water Assessment Tool-Korea), which can simulate ephemeral stream and threshold runoff, was used to estimate hydrological components (such as precipitation, evapotranspiration, runoff, and groundwater recharge) of Jeju watershed (~1,828 km2). The overall procedure of SWAT-K modeling (model setup, calibration and validation) was performed from 1991 to 2020. The simulated and observed daily streamflows were compared and showed a good agreement. In particular, a reasonable estimation of groundwater recharge was confirmed through the comparison of simulated groundwater recharge and the observed groundwater level. Finally, the spatio-temporal groudwater recharge characteristics were analyzed using the SWAT-K results.

Acknowledgement : Research for this paper was carried out under the KICT Research Program (project no.20220275-001, Development of coastal groundwater management solution) funded by the Ministry of Science and ICT.

How to cite: Lee, J. E., Kim, C.-G., Lee, J., Chung, I.-M., and Chang, S. W.: Estimation of spatio-temporal groundwater recharge in Jeju Island, Korea, EGU General Assembly 2023, Vienna, Austria, 23–28 Apr 2023, EGU23-10786, https://doi.org/10.5194/egusphere-egu23-10786, 2023.

EGU23-10854 | Orals | HS2.2.1

Intercomparison of local evapotranspiration estimates at high latitudes 

Kolbjørn Engeland, Helene Birkelund Erlandsen, Emiliano Gelati, Shaochun Huang, Devaraju Narayanappa, Norbert Pirk, Olga Silantyeva, Lena Merete Tallaksen, Astrid Vatne, and Yeliz A Yilmaz

The main motivation for this study is to improve knowledge about the actual evapotranspiration in cold environments. Erlandsen et al (2021) summarize evapotranspiration estimates that range from 175 – 500 mm/year, i.e. between 13 and 31% of mean annual precipitation for Norway. The study is part of the LATICE (Land-ATmosphere Interactions in Cold Environments) strategic research initiative at the University of Oslo. Here we have launched a new initiative, LATICE MIP-ET that aims to compare model estimates of evapotranspiration (ET) in a high latitude environment.

In this study, we compare local observations of evapotranspiration with local estimates from two land surface models (CLM and SURFEX) and three hydrological models (SHYFT, HBV and Lisflood). Observations are available at five eddy covariance flux sites with a gradient in climate across Norway, from low altitude forested and grassland sites to high mountain and high latitude sites. To run the models three sets of forcing data will be used.

The presentation will summarize the models’ ability to capture diurnal and seasonal variations in evapotranspiration as compared to the observations. We will also compare how models simulate the relationship between potential and actual evapotranspiration and assess the models’ sensitivity to the choice of vegetation-and soil parameters and forcing data used.

References:

Erlandsen, H.B., Beldring, S., Eisner, S., Hisdal, H., Huang, S., Tallaksen, L.M. (2021) Constraining the HBV model for robust water balance assessments in a cold climate. Hydrology Research 2021; nh2021132. doi: https://doi.org/10.2166/nh.2021.132

How to cite: Engeland, K., Erlandsen, H. B., Gelati, E., Huang, S., Narayanappa, D., Pirk, N., Silantyeva, O., Tallaksen, L. M., Vatne, A., and Yilmaz, Y. A.: Intercomparison of local evapotranspiration estimates at high latitudes, EGU General Assembly 2023, Vienna, Austria, 23–28 Apr 2023, EGU23-10854, https://doi.org/10.5194/egusphere-egu23-10854, 2023.

Space-time patterns of surface fluxes and states have direct implications for boundary layer growth, cloud development, phenology, and runoff generation, among other processes. Emerging field-scale resolving land surface models (the terrestrial component of Earth system models), such as HydroBlocks, aim to represent this complexity by modeling the water, energy, and biogeochemical cycles at meter-km spatial scales over continental extents. Although there have been significant advances in the representation of heterogeneity in land surface modeling over the past decade, there has yet to be a concerted effort to evaluate the realism of the simulated time-evolving field-scale spatial patterns; this, in part, is due to the challenge of how to interpret the space-time fields. Empirical space-time covariance presents a unique solution; it can robustly summarize the space-time structure of a given flux or state for a given area (e.g., watershed) via a simple 2D surface (e.g., Figure 1). In this presentation, we will demonstrate how space-time covariance provides an effective and efficient approach to facilitate evaluation of the simulated spatiotemporal patterns.

            As a proof of concept, the simulated spatiotemporal patterns of land surface temperature (LST) of a HydroBlocks model simulation over the central United States are evaluated using observations from satellite remote sensing (GOES-16/17). First, for each 0.25 arcdegree grid cell over the study domain, the empirical spatiotemporal covariance functions (ESTCFs) are assembled for HydroBlocks (simulation) on one side and GOES (observation) on another. For this case, each ESTCF is calculated from hourly data for clear-sky pixels during the summers of 2017-2022. The ESTCFs are then initially compared via simple metrics (e.g., RMSE). To ease understanding, a space-time parametric covariance function is then fit to each ESTCF; the comparison of the parameters (e.g., spatial correlation length) provides a richer understanding of the strengths and weaknesses of the model. The resulting analysis illustrates how space-time covariance can efficiently summarize the complex simulated spatiotemporal patterns and thus serve as a useful metric to both evaluate and inform model development to improve process representation.

How to cite: Chaney, N. and Torres-Rojas, L.: Space-time covariance: An effective tool to evaluate the simulated spatiotemporal patterns in land surface models, EGU General Assembly 2023, Vienna, Austria, 23–28 Apr 2023, EGU23-11061, https://doi.org/10.5194/egusphere-egu23-11061, 2023.

EGU23-12205 | ECS | Posters on site | HS2.2.1

Hydrological simulation of flow rates in (un)gauged catchments of East-Flanders (Belgium) by the SWAT+ and PDM models. 

Kobe Braet, Lara Van Der Veken, Emma Tronquo, Jonas-Frederik Jans, and Niko Verhoest

Hydrological models are key instruments to predict hydrological extremes, such as droughts and floods. These hydrological extremes are becoming more and more frequent in Belgium. Therefore, creating a climate robust water system is becoming a priority. This research aims to provide flow rate predictions for several catchments in the province of East-Flanders based on meteorological, soil, land use and DEM data. These were collected by local monitoring networks and transformed by, among others, local pedotransfer functions and spatial interpolation methods.

A physically based model (SWAT+) is used to simulate flow rate estimates for (un)gauged catchments and to calculate different scenarios related to land use change or a changing climate. The simulated flow rates are used as training data for a simple conceptual model (PDM). The PDM-model is more suited for real-time modelling and can be used as a basis to take policy decisions. The strength of physically based models is that they require minor calibration, while conceptual models have a more feasible computation time. By combining the strengths of both models, an estimate can be made for the flow rates in different (un)gauged catchments of East-Flanders.

How to cite: Braet, K., Van Der Veken, L., Tronquo, E., Jans, J.-F., and Verhoest, N.: Hydrological simulation of flow rates in (un)gauged catchments of East-Flanders (Belgium) by the SWAT+ and PDM models., EGU General Assembly 2023, Vienna, Austria, 23–28 Apr 2023, EGU23-12205, https://doi.org/10.5194/egusphere-egu23-12205, 2023.

EGU23-12558 | ECS | Orals | HS2.2.1

Multi-model approach in a variable spatial framework for streamflow simulation 

Cyril Thébault, Charles Perrin, Vazken Andréassian, Guillaume Thirel, Sébastien Legrand, and Olivier Delaigue

Accounting for the variability of processes and climate conditions between catchments and within catchments remains a challenge in hydrological modelling. To address this issue, various approaches were developed over the past decades. Among them, multi-model approaches provide a way to quantify and reduce the uncertainty linked to the choice of model structure, and semi-distributed approaches propose a good compromise to account for spatial variability of the processes by dividing the catchment in sub-catchments while maintaining a limited level of complexity. However, these two approaches were barely applied together. The aim of this work is to answer the following question: what are the contributions of multi-model approaches in a variable spatial framework for the simulation of streamflow over a large sample of catchments?

To this end, a large set of 121 uninfluenced catchments in France was assembled, with precipitation, evapotranspiration and streamflow data at an hourly time step over the 1998-2018 period. The semi-distribution set-up was kept simple by considering a single intermediate catchment between a downstream station and one or more upstream catchments. The multi-model approach was implemented with 13 hydrological structures, three calibration options and two spatial frameworks, for a total of 78 distinct modelling options. A simple average method was used to combine the streamflow at the outlet of the catchments and sub-catchments. In this work, the benchmark considered is the most efficient lumped model considered individually on each catchment.

The semi-distributed multi-model approach generates better performance at the time-series scale than the lumped models. The gain is mainly brought by the multi-model aspect while the spatial framework gives a more occasional benefit. This study also highlight the advantages of using a large set of models in a semi-distributed multi-model framework to simulate streamflow in a large sample hydrology context.

How to cite: Thébault, C., Perrin, C., Andréassian, V., Thirel, G., Legrand, S., and Delaigue, O.: Multi-model approach in a variable spatial framework for streamflow simulation, EGU General Assembly 2023, Vienna, Austria, 23–28 Apr 2023, EGU23-12558, https://doi.org/10.5194/egusphere-egu23-12558, 2023.

EGU23-13397 | ECS | Orals | HS2.2.1

How could we improve the spatial consistency of water fluxes in a semi-distributed hydrological model? A multi-criteria approach 

Shu-Chen Hsu, Alban de Lavenne, Charles Perrin, and Vazken Andréassian

While hydrological models aim to represent the hydrological behaviour of catchments, many of them have been streamlined on the exclusive basis of streamflow simulation performance, i.e. among the possible parameter sets, the 'optimal' is the one which brings the best simulation of streamflow during the calibration period. However, we sometimes encounter 'optimal' sets which perform well in discharge simulation but yield unrealistic simulations of other fluxes (e.g. actual evaporation fluxes, inter-catchment groundwater fluxes). Previous studies tried to constrain the exploration of parameter space with measurements complementary to river discharge: this application of extra information aims to increase the physical realism of the model compared to discharge-only calibration. In this study, we carry out an original investigation to take advantage of the spatial patterns of the complementary data in order to drive the calibration towards a more spatially consistent solution.

We propose here a feasibility test, to constrain the spatial consistency of fluxes of a semi-distributed GR model (GRSD). Our study area is the Somme catchment (6100 km2 ) with 17 internal gauging stations, each of them having more than 15 years of discharge measurement. As a first step, we use the long-term actual evaporation from Budyko-estimation as an extra constraint, which has been widely used for describing spatial patterns of climate. In the second step, we develop a criterion describing the spatial consistency between the pattern of measured and simulated fluxes. By constraining the model with extra information, the model is expected to yield a more consistent simulation of fluxes in comparison with the classical calibration practice. Moreover, we analysed the impact of this additional constraint on the spatial organisation of IGF over the catchment as both the other components in water balance analysis, actual evaporation and discharge, are constrained.

How to cite: Hsu, S.-C., de Lavenne, A., Perrin, C., and Andréassian, V.: How could we improve the spatial consistency of water fluxes in a semi-distributed hydrological model? A multi-criteria approach, EGU General Assembly 2023, Vienna, Austria, 23–28 Apr 2023, EGU23-13397, https://doi.org/10.5194/egusphere-egu23-13397, 2023.

EGU23-13592 | ECS | Posters on site | HS2.2.1

Improved ecohydrologic modelling using spatial patterns of remotely sensed land surface temperature 

Doris Duethmann, Martha Anderson, Marco Maneta, and Doerthe Tetzlaff

Considering different types of hydrologic observations for model calibration in addition to streamflow is a suitable strategy to better constrain model parameters and improve process-consistency of hydrologic models. In this regard, land surface temperature (Ts) is an interesting variable as it is at the core of the surface energy and water balance. This study aims at evaluating the benefits of integrating spatial patterns of satellite-derived Ts into calibration of the process-based ecohydrologic model EcH2O. We furthermore explore the value of an increasing number of Ts images in the calibration period. The study is performed in a mixed land cover catchment in NE Germany and makes use of Landsat-derived Ts data. Our results show that satellite-derived Ts is useful for reducing uncertainties of energy-balance related vegetation parameters, which are hardly constrained when the model is calibrated to streamflow only. Good model performance with respect to streamflow does not preclude low performance in terms of Ts and including satellite-derived Ts for model calibration clearly improves simulated spatial patterns of Ts. Spatial patterns in observed Ts are shown to be strongly related to land cover class and a vegetation index, and our results indicate that further model improvements may be possible by better representing observed variations of leaf area index within the ecohydrologic model.

How to cite: Duethmann, D., Anderson, M., Maneta, M., and Tetzlaff, D.: Improved ecohydrologic modelling using spatial patterns of remotely sensed land surface temperature, EGU General Assembly 2023, Vienna, Austria, 23–28 Apr 2023, EGU23-13592, https://doi.org/10.5194/egusphere-egu23-13592, 2023.

EGU23-13624 | ECS | Posters on site | HS2.2.1

Enhancing Predictions of Land Subsidence Induced by the Groundwater Withdrawal in the Mekong Delta, Vietnam 

Artur Guzy, Philip Minderhoud, Bente Lexmond, Claudia Zoccarato, and Pietro Teatini

Globally, land subsidence caused by groundwater pumping is a common phenomenon. Numerous subsurface processes, both natural and anthropogenic, contribute to its occurrence. In coastal regions, severe land subsidence exacerbated by groundwater pumping is particularly detrimental. On top of that, coastal areas affected by natural compaction, river delta consolidation processes, and additional exposure to drainage-induced aquifer-system compaction are especially susceptible to flooding and salinization due to the steadily rising sea level triggered by climate change.

The Mekong delta, one of the world's largest deltas, is densely populated and crucial for agricultural production. The delta is low-lying and has a high rate of natural compaction, whereas human activities accelerate land subsidence. A numerical model of groundwater-extraction-induced aquifer-system compaction was developed in 2017 to demonstrate the effects of 25 years of groundwater extraction on land subsidence in the delta. The model encompassed the time range from 1991 to 2016 using geological, hydrogeological, geomechanical, and remote sensing data. In 2020, the model was updated to include a surface water network. Six scenarios were developed to simulate potential future pathways of hydraulic head evolution and aquifer-system compaction in the Mekong delta from 2019 to 2100.

Our research aims to enhance the reliability of the existing numerical model of groundwater extraction-induced aquifer-system compaction in the Mekong delta, given the significance of such scenarios in the development of policies to mitigate the negative effects of groundwater pumping.  Our research focuses on four steps.

First, a novel subsurface model representation.

The 3D subsurface model of the Mekong delta was developed using ten hydrogeological cross-sections derived from 96 geological borehole logs interpolated linearly. This resulted in a subsurface model consisting of 15 layers, including seven aquifers, seven aquitards, and a phreatic top layer. The goal of the current study is to develop a new schematisation of the aquifer system within the Mekong delta based on 522 borehole logs and to investigate the spatial variability of the aquifer system using advanced geostatistical tools.

Second, a hydrogeological schematization enhancement.

In the current schematisation, aquitards are discretized as a single layer, resulting in the inability to simulate delayed groundwater pressure propagation within the aquitard. Several additional models with refined aquitard discretization are constructed and compared to evaluate the effect.

Third, the quantification of the influence of deterministic modelling on compaction.

The hydrogeological model is deterministically parameterized and calibrated using hydraulic head time series. Utilizing stochastic modelling of hydrogeological parameters, the impact of this deterministic modelling approach on simulated compaction is determined.

Fourth, a hydrogeological and geomechanical parameters consistency improvement.

The previous hydrogeological and geomechanical model parameterizations are inconsistent since the groundwater model and the geomechanical module were initially parameterized and calibrated independently. To address this issue, an iterative procedure is used to calibrate storage and compression indexes consistently for each individual model layer. This is accomplished by utilising groundwater head datasets recorded by 358 piezometers and land subsidence datasets retrieved by InSAR from 2006 to 2010 and 2016 to 2019.

How to cite: Guzy, A., Minderhoud, P., Lexmond, B., Zoccarato, C., and Teatini, P.: Enhancing Predictions of Land Subsidence Induced by the Groundwater Withdrawal in the Mekong Delta, Vietnam, EGU General Assembly 2023, Vienna, Austria, 23–28 Apr 2023, EGU23-13624, https://doi.org/10.5194/egusphere-egu23-13624, 2023.

EGU23-13738 | ECS | Posters on site | HS2.2.1

A universal decay function based meteorologically-driven and calibration-free runoff generation module 

Prashant Istalkar and Basudev Biswal

An accurate estimate of streamflow has been a challenging task due to the complex and interconnected hydrological processes. A simple, robust and calibration-free runoff generation module is desirable in several water resource management applications. But spatial heterogeneity of, but not limited to, topography, soil and land cover makes it challenging to develop desirable runoff generation module. To address this, several runoff generations theories that apply laws of physics at the grid-scale were proposed and tested.  However, these theories have not shown a significant difference in performance on considering catchment as spatially distributed and a single unit(lumped). A typical runoff generation module follows saturation excess or infiltration excess mechanism for runoff generation. The root zone storage capacity (Smax), which controls the dynamics of water storage and partitioning of available water into different fluxes, is an important free-parameter in the saturation excess mechanism. The value of Smax needs to be estimated using observed streamflow time series. However, recent studies demonstrate that the Smax is controlled by local climate and land cover. So, in the current study, we hypothesized that runoff generation is solely governed by climate input and the amount can be estimated without explicit consideration of Smax. We tested the hypothesis using Dynamic Budyko (DB) framework, which simulates the runoff at a daily time scale using ‘instantaneous dryness index (Φ)’. We proposed a universal decay function to predict Φ using rainfall and potential evapotranspiration. The performance of proposed runoff generation module is compared with HBV and GR4J runoff generation modules for 416 MOPEX study basins. The proposed calibration free runoff generation module shows very similar performance to that of calibrated HBV and GR4J with median NSE as 0.68,0.7 and 0.68, respectively. The proposed framework can be coupled with any routing module to estimate the streamflow at basin outlet. The introduction of proposed framework address several long-term challenges in rainfall-runoff modeling. Our results suggest that more efforts should be considered in developing rainfall-runoff modeling frameworks that exploit information available in meteorological input to address streamflow dynamics.

How to cite: Istalkar, P. and Biswal, B.: A universal decay function based meteorologically-driven and calibration-free runoff generation module, EGU General Assembly 2023, Vienna, Austria, 23–28 Apr 2023, EGU23-13738, https://doi.org/10.5194/egusphere-egu23-13738, 2023.

EGU23-14099 | ECS | Orals | HS2.2.1

Validation of an irrigation scheme inside ORCHIDEE land surface model at global scale 

Pedro Felipe Arboleda Obando, Agnès Ducharne, Luiza Vargas-Heinz, Zun Yin, and Philippe Ciais

Irrigation activities play a key role in food production and consume 90% of freshwater withdrawal worldwide. These activities have a strong impact on water and energy budgets and associated biogeochemical cycles, and can have effects on local and regional climate. Furthermore, irrigation activities are projected to increase due to population growth and climate change. This context has encouraged the inclusion of irrigation in land surface models (LSMs), which simulate the continental branch in earth system models.

Here we present an irrigation scheme within the ORCHIDEE LSM that replicates flood and drip techniques. Water demand is calculated as the soil moisture deficit with respect to a target value. This deficit is estimated in the root zone of the crop and grass fraction (which contains both irrigated and rainfed crops), but the demand is limited by the fraction equipped for irrigation and by the water supply, i.e. water available in rivers and aquifers reduced to preserve a minimum volume in each water store for ecosystems. In addition, the scheme prioritizes water abstraction by source (surface or groundwater) according to the Siebert et al. map (2010). Hence, in a gridcell with little groundwater pumping infrastructure, most of the water will be extracted from the river, even if the water demand is not fully supplied. The water finally withdrawn for irrigation is allocated on the surface of the soil column for infiltration, and a maximum irrigation rate is set to prevent runoff production. The user-defined parameters that drive the scheme's response are the root zone depth and soil moisture target, the minimum volume left for ecosystems, and the maximum irrigation rate.

For validation, we use this scheme inside ORCHIDEE to run global offline simulations without and with irrigation. We use a set of parameter values that tries to fit the irrigation rates reported by AQUASTAT, while reducing the bias of evapotranspiration in irrigated areas with respect to the satellite-based products. We explore the possible reduction of bias in other variables like leaf area index, water storage anomalies and observed discharge. Finally, we correlate the bias reduction with landscape features to gain insights on the shortcomings of the irrigation scheme and ORCHIDEE.

How to cite: Arboleda Obando, P. F., Ducharne, A., Vargas-Heinz, L., Yin, Z., and Ciais, P.: Validation of an irrigation scheme inside ORCHIDEE land surface model at global scale, EGU General Assembly 2023, Vienna, Austria, 23–28 Apr 2023, EGU23-14099, https://doi.org/10.5194/egusphere-egu23-14099, 2023.

EGU23-14263 | ECS | Posters on site | HS2.2.1

Comparing river routing concepts in distributed hydrological modeling 

Laurène Bouaziz, Joost Buitink, Willem van Verseveld, Dirk Eilander, Mark Hegnauer, Eric Sprokkereef, Jasper Stam, Niek van der Sleen, and Rita Lammersen

Distributed hydrological models are valuable tools for operational and strategic water management planning. These models include a representation of vertical processes such as interception, transpiration and infiltration and require a lateral component to route the water downstream along the river network. The kinematic wave is a commonly used approach for lateral flow in distributed hydrological models, which assumes that topography mainly controls the water flow. While this applies in steep terrain, the assumptions of the kinematic wave do not apply in flatter landscapes. The Wflow framework is a free and open-source distributed hydrological modeling platform developed by Deltares (van Verseveld et al., 2022). The Wflow framework has been extensively tested in catchments around the world using the SBM vertical concept in combination with the kinematic wave for lateral river, overland flow and subsurface flow routing. Recently, the local inertial approximation, which only neglects the convective acceleration term in the Saint-Venant equations, was implemented in the Wflow framework as an alternative lateral routing concept to accurately represent river routing processes in flatter areas. In addition, the numerical scheme proposed by de Almeida et al. (2012) was implemented for the simulation of 2D overland flow. Using the HydroMT (Hydro Model Tools, https://github.com/Deltares/hydromt) Python package, we set-up wflow_sbm models for the Rhine and the Meuse basins and compare alternative concepts for river (and overland flow) routing, including kinematic wave, local inertial 1D and local inertial 1D2D. The results show significant differences in the shape and magnitude of modeled peak flows and the importance of floodplain storage and floodwave attenuation processes, as the local inertial 1D2D simulations were closest to streamflow observations. With this study, we stress the importance of including relevant routing processes (floodwave attenuation through overbank flow in the floodplains) as opposed to a more extensive calibration which would compensate for these lacking processes.


References:

de Almeida, G. A. M., P. Bates, J. E. Freer, and M. Souvignet, 2012, Improving the stability of a simple formulation of the shallow water equations for 2-D flood modeling, Water Resour. Res., 48, W05528, https://doi.org/10.1029/2011WR011570.

van Verseveld, W. J., Weerts, A. H., Visser, M., Buitink, J., Imhoff, R. O., Boisgontier, H., Bouaziz, L., Eilander, D., Hegnauer, M., ten Velden, C., and Russell, B.: Wflow_sbm v0.6.1, a spatially distributed hydrologic model: from global data to local applications, Geosci. Model Dev. Discuss. [preprint], https://doi.org/10.5194/gmd-2022-182, in review, 2022.

How to cite: Bouaziz, L., Buitink, J., van Verseveld, W., Eilander, D., Hegnauer, M., Sprokkereef, E., Stam, J., van der Sleen, N., and Lammersen, R.: Comparing river routing concepts in distributed hydrological modeling, EGU General Assembly 2023, Vienna, Austria, 23–28 Apr 2023, EGU23-14263, https://doi.org/10.5194/egusphere-egu23-14263, 2023.

Conceptual hydrological models can play an important role in real-time river forecasting systems due to their limited calculation time and versatility. Nevertheless, their simplified structure, very often based on the water content in multiple storages, and constrained physical background hampers their applicability in seasonally influenced catchments. In particular, these models often show good forecasting performance in one season (e.g. for high discharges in wet seasons), but fail to capture events in other seasons (e.g. due to typical high intensity precipitation during dry periods). To overcome this issue, we propose a seasonal calibration approach for conceptual hydrological models, based on the results of a seasonal sensitivity analysis. The obtained seasonal models however induce an additional challenge within a continuous real-time river forecasting system: the transition from one seasonal model to another. The latter is of particular importance when the volume of the storages in the conceptual model changes between different seasons. An application with the conceptual NAM model for three catchments in Belgium will be used to illustrate the proposed calibration strategy and a number of possible solutions for the transition issue.

How to cite: Nossent, J. and Nsubuga, R.: A seasonal calibration approach of conceptual hydrological models for improved real-time river forecasting, EGU General Assembly 2023, Vienna, Austria, 23–28 Apr 2023, EGU23-14378, https://doi.org/10.5194/egusphere-egu23-14378, 2023.

Intensive Soil and Water Conservation (SWC) has taken place in the Yellow River basin (YRB) to control soil erosion and river sediment, it has altered the eco-hydrological processes and particularly led to the runoff reduction. However, the SWC are rarely simulated explicitly in the hydrological models of the YRB. In order to understand its hydrological impacts, this study developed a SWC parameterization scheme in an existing distributed physically-based model (GBEHM). The hillslope SWC was parameterized as additional surface storage capacity and simulated together with hillslope hydrological processes. The check dams along the river networks were parameterized as reservoirs and simulated together with the flow routing. The improved model (GBEHM-SWC) had been calibrated and validated comprehensively using the observed river discharge and remote sensing-based evapotranspiration. The annual precipitation and runoff significantly decreased during 1982-2000 at the rate of -4.3 and -1.0 mm/yr, respectively. In the following period 2001-2019, the precipitation recovered at 3.2 mm/yr with a slight increasing in runoff at 0.2mm/yr. Compared to the previous period, the annual average precipitation and temperature increased by 27.3 mm and 0.85 ℃, whereas the observed runoff decreased by 4.3 mm. Therefore, we applied the GBEHM-SWC to quantify the impacts of climate change and SWC in the YRB, spatially and temporally. The SWC contributed to the annual runoff reduction by 3.8 and 3.7 mm (or 2.84 and 2.74 billion m3), respectively, in which the hillslope SWC measures accounted for 51% of the annual runoff reduction. Without the append SWC measures, the annual runoff would increase by 2.9 mm (or 2.17 billion m3) in the recent period due to the precipitation increase. Hillslope SWC and river-networks SWC have their largest impact on runoff reduction in the Longmen-Sanmenxia section and Toudaoguai-Longmen section, respectively. The parameterization scheme developed for the distributed model is useful for the watershed hydrological simulation and prediction under the intensive SWC implementation.

How to cite: Yan, Z., Lei, H., Yang, D., and Gao, H.: Simulating the hydrological impacts of intensive Soil and Water Conservation Measures in the Yellow River Basin Using a Distributed Physically-based Model, EGU General Assembly 2023, Vienna, Austria, 23–28 Apr 2023, EGU23-15058, https://doi.org/10.5194/egusphere-egu23-15058, 2023.

EGU23-15217 | ECS | Posters on site | HS2.2.1

EDCHM: A c++ based R package for flexible semi-distributed conceptual hydrological modeling 

Kan Lei, Diana Spieler, and Niels Schütze

Modular hydrological modeling has been around for some time, with early examples such as the Modular Modeling System (MMS) developed in 1996. In 2011,Fenicia et al. introduced the SUPERFLEX modeling framework, refined by Molin et al. (2021) as the Python package SurperflexPy. A framework with an even larger library of processes is the Raven modeling framework introduced by Craig et al. (2020).

This work introduces a c++ based R package prioritizing convenience while still offering flexibility for semi-distributed hydrological modelling. The EDCHM framework defines five basic layers: atmosphere, snow pack, land, soil, and ground, with the soil and ground layers able to be further divided into sublayers. Each layer has its own characteristics and state variables such as capacity and water volume. EDCHM defines 12 basic processes, including 10 hydrological and 2 meteorological processes such as evapotranspiration and infiltration. Each process has a single flux output, and it can occur within a single layer or between layers. The input requirements are flexible and depend on the specific method used. A process with a specific method is referred to as a module in EDCHM. EDCHM also includes 34 predefined model structures with fixed connections between processes and layers, ranging from 6 to 15 processes. The key feature of EDCHM is the model builder, which allows users to easily generate the model function just by selecting the process methods, the input data list, and the parameter list with ranges will also be created. This makes it fast and efficient for users to build and calibrate models. EDCHM is implemented in c++ and supports vectorization and parallelization through R-Package Rcpp and furrr. Users can easily build new models with their own ideas or ideas from literature.

EDCHM has been tested on 34 east-german catchments, with over 60 models calibrated in lumped form and 6 catchments calibrated with 3 and 5 sub-catchments or more than 50 HRUs. Our results show that EDCHM is highly effective in the application of hydrological modeling, with a key feature being its efficiency.


Craig et al. (2020). https://doi.org/10.1016/j.envsoft.2020.104728

Fenicia et al. (2011). https://doi.org/10.1029/2010WR010174

EDCHM: https://github.com/LuckyKanLei/EDCHM

How to cite: Lei, K., Spieler, D., and Schütze, N.: EDCHM: A c++ based R package for flexible semi-distributed conceptual hydrological modeling, EGU General Assembly 2023, Vienna, Austria, 23–28 Apr 2023, EGU23-15217, https://doi.org/10.5194/egusphere-egu23-15217, 2023.

Hydrological models are powerful tools, that allows users to create a simplified representation of real-world system and that serve to understand the hydrological processes in a basin, and predict their future behavior, including, for example, the effects of climate change. However, these models are subject to multiple sources of uncertainty, including structural uncertainty, related to the hydrological processes simulated and to the spatial discretization applied (lumped, semi-distributed or distributed models). The effects of this modelling decision could be particularly relevant when the objective is to simulate more than one hydrological process.

The objective of this work is to determine if the use of different model structures (lumped or semi-distributed), and the selection of process to be simulated allows reducing the uncertainty of the estimation of more than one hydrological process. Using Raven, a robust and flexible hydrological modelling framework, that supports a wide variety of modelling options, and sits atop a robust and extendible software architecture, eight model structures have been constructed to simulate the River Colorado en Junta con Palos Basin. This basin located in the central zone of Chile (Lat.-35.25, Lon. 71), has a snow-pluvial regime and an average annual rainfall of 1796 mm for the period 1979-2020.  Additionally, this basin covers an area of 879 km2, with a wide elevation range, from 643 m.a.s.l. to 4074 m.a.s.l.

The results have shown some differences at modelling daily streamflow (KGE from 0.68 to 0.72 in the lumped models, and from 0.68 to 0.8 in semi-distributed models). Furthermore, other important changes have been visualized related to the characterization of snow cover and soil moisture in the first layer of soil. The simulated series have been compared to satellite data (products MODIS10A2 for snow cover and NASA-USDA Enhanced SMAP Global Soil Moisture Data for superficial soil moisture).

In the case of the snow cover, the annual duration of snow cover was evaluated, obtaining Pearson's coefficient values between 0.4 and 0.56 for lumped models, while these values reach 0.65 in the case of semi-distributed models. Regarding soil moisture, the changes were more significant when changing the structure of the model (selection and parameterizations of the processes), rather than its spatial discretization, with a range of KGE values from 0.34 to values close to 0.7, strongly influenced by the methods used to evaluate evapotranspiration and infiltration, as well as by the characteristics of the soil.

Overall, this work demonstrates the potential of a flexible hydrologic modeling framework to assess and reduce the structural uncertainty of hydrologic models, taking advantage of the potential of these tools.

How to cite: Rodriguez, P. and Vargas, X.: Evaluation of the structural uncertainty of hydrological models in the estimation of multiple hydrological processes, EGU General Assembly 2023, Vienna, Austria, 23–28 Apr 2023, EGU23-15920, https://doi.org/10.5194/egusphere-egu23-15920, 2023.

EGU23-3 | Posters virtual | HS2.2.5

Runoff characterisation by SEC measurements in spring water 

Elke Bozau and Tobias Licha

Extreme weather periods in the Harz Mountains with heavy rain events (e.g., July 2017) and long dry periods (September 2016, May – November 2018, September 2020) trigger extreme changes in surface runoff. However, such events do not lead to unknown, unpredictable chemical changes of the spring water in the Upper Harz Mountains (Bozau et al., 2013 and 2021). In order to obtain more information on the chemical evolution and to predict drying out events, spring waters of several catchment areas of the Harz Mountains were monitored. Every spring has a typical runoff pattern combined with specific chemical variations. The order of drying out during long droughts depends on the catchment size of the individual spring and did not change in the observation period.

Since February 2020, the specific electrical conductivity (SEC) of the spring "Innerstesprung" near Clausthal has been systematically measured at least once a week. This spring has its source in fractured Paleozoic greywacke, flows at the surface for about 30 m in a little artificial channel and then passes into the reservoir lake "Entensumpf". The measured SEC data are compared with daily precipitation rates. Drying out and first flush events show specific SEC trends. Furthermore, frozen snow covers are reflected by the SEC data. The SEC values of the spring water range between 55 and 100 µS/cm. Minimum values are typical for long rainy periods and snow melt in February. Only in 2017 (with about 300 mm precipitation during one week of July) 57 µS/cm were found in summer time. The maximum values of SEC are measured immediately before the drying out of the spring. Furthermore, a special effect of SEC enrichment after the first flush event has been observed. An impact of the enhanced deforestation which started in 2020 was not seen during the monitoring period. The spring runoff, precipitation and evaporation rates during the drying out events can be used for the calculation of the catchment areas. Furthermore, water-rock interactions along the flow path of spring water were investigated by batch tests.

References:

Bozau, E., Stärk, H.-J., Strauch, G., 2013. Hydrogeochemical characteristics of spring water in the Harz Mountains, Germany. Geochemistry, 73, 283-292.

Bozau, E, Bauer, G., Licha, T., Lojen, S., 2021. Hydrochemical response of spring and mine waters in the Upper Harz Mountains (Germany) after dry periods and heavy rain events. ZDGG, 172(1), 73-82.

How to cite: Bozau, E. and Licha, T.: Runoff characterisation by SEC measurements in spring water, EGU General Assembly 2023, Vienna, Austria, 23–28 Apr 2023, EGU23-3, https://doi.org/10.5194/egusphere-egu23-3, 2023.

EGU23-348 | ECS | Posters on site | HS2.2.5

Detecting the occurrence of preferential flow in soils with stable water isotopes 

Jonas Pyschik and Markus Weiler

Preferential flow in soils and hillslopes may transport water faster than the soil matrix. These features activate quickly during precipitation events, increase infiltration and vertical pathways can play an important role in runoff generation. However, preferential pathways are difficult to identify as common techniques (e.g. piezometer, soil moisture sensors, hillslope trenches) do not sufficiently represent the spatial scale and frequency of these features and other approaches (e.g. dye patterns) are labour intensive and heavily invasive.

Here, we present a method to derive locations of preferential flow only by using vertical stable water isotope profiles in soils. In four catchments, we each drilled 120 soil cores (1-3m) and analysed the stable isotope composition of the soil water in 10-20cm increments to derive depth profiles. Visually selecting profiles with similar isotopic seasonality patterns not influenced by preferential flow, we determined a reference isotope profile for each catchment using a LOESS regression. These represent a soil profile only influenced by vertical matrix infiltration. To account for differences in soil conductivity and porosity, the reference profiles were scaled by depths to each profile. Locations where the measured profile deviates significantly from the reference, we assume an influence of vertical or lateral preferential flow.

With this method we found evidence for preferential flowpaths in all catchments. Especially in the alpine catchment with highly heterogeneous soils many profiles showed distinct preferential flow features. There, some profiles also indicate multiple, vertically independent pathways. The depth at which these pathways occurred were highly variable, even at neighbouring profiles.

Overall our results demonstrate the feasibility to assess preferential flow only using soil water isotope profiles while also underlining the large spatial and vertical variability of preferential flowpaths at the hillslope and catchment scale.

How to cite: Pyschik, J. and Weiler, M.: Detecting the occurrence of preferential flow in soils with stable water isotopes, EGU General Assembly 2023, Vienna, Austria, 23–28 Apr 2023, EGU23-348, https://doi.org/10.5194/egusphere-egu23-348, 2023.

EGU23-2784 | ECS | Orals | HS2.2.5

Combining land surface modelling and Earth observations: the key role of soil moisture data to improve estimates of agricultural water uses 

Sara Modanesi, Gabriëlle J. M De Lannoy, Michel Bechtold, Luca Brocca, Jacopo Dari, Louise Busschaert, Martina Natali, and Christian Massari

Soil moisture is an essential climate variable and the main driver for water exchanges between the land surface and the atmosphere. An accurate knowledge of the soil moisture conditions is also crucial to estimate the amount of water needed or used for agricultural purposes.

As human demand for water is increasing along with extreme drought events, an optimal agricultural management is paramount to cope with a drier and warmer future, e.g. in Mediterranean regions. Thus, the knowledge of soil moisture is central for monitoring agricultural drought, optimizing agricultural water uses (i.e., irrigation) and improving the water cycle and land-atmosphere processes understanding. Nevertheless, the point-based nature and limited spatial coverage of in situ soil moisture observations in conjunction with the poor parameterization of human processes in earth system models (i.e., unmodelled or wrongly modelled irrigation), undermine the ability to accurately monitor and forecast drought events as well as the capacity to safely manage water resources.

Remote sensing observations offer a unique opportunity to fill these gaps as they can directly observe the processes of the plant-soil continuum. Here we provide insights on the value of satellite-based soil moisture and soil moisture-related measurements (i.e, radar backscatter) for land surface models and for agricultural drought research. We will show the utility of both classical coarse-scale and new high resolution observations for a number of applications that span from irrigation estimation, crop yield analysis, improvement of water cycle processes to estimation of small scale soil moisture variability across agricultural and mountaineous European pilot sites.

How to cite: Modanesi, S., De Lannoy, G. J. M., Bechtold, M., Brocca, L., Dari, J., Busschaert, L., Natali, M., and Massari, C.: Combining land surface modelling and Earth observations: the key role of soil moisture data to improve estimates of agricultural water uses, EGU General Assembly 2023, Vienna, Austria, 23–28 Apr 2023, EGU23-2784, https://doi.org/10.5194/egusphere-egu23-2784, 2023.

Accurate measurements and estimates of evapotranspiration (ET) and soil moisture are essential for efficient crop management and understanding of hydrological processes in agricultural catchments. In this study, we used satellite imagery for a small catchment (Nučice, Czech Republic) to retrieve vegetative indices (VIs, including NDVI, SAVI and EVI), hence to analyse their spatial and temporal variability. Furthermore, we investigated the relationship between vegetative indices (VIs), measured evapotranspiration (ET), and soil water storage (SWS). Also, for each variable, we aggregated weekly data at the seasonal temporal resolution, being able to study the trends of each variable’s statistical moments. Moreover, we employed the Normalized Nash-Sutcliffe Efficiency (NNSE) index to study the error and the bias between normalized variables within the same seasonality. We found linear relationships between VIs, ET, and SWS when they exceeded a certain threshold. We were able to estimate the ET by exploiting its linear relationships with VIs and SWS, thus bridging the measurement gap. Our results suggest ET prediction based on VIs can be used during the growing season but may give inaccurate results after harvest (when VIs have low values). SWS can provide a reasonable estimate of the ET when no vegetation is present. Furthermore, the good correspondence between the seasonal NNSE indices and the trends of statistical moments of ET, VIs, and SWS suggest that subsurface processes might be inferred from seasonal vegetation cover. Therefore, this allows us to anticipate the likelihood of seasonal correlations across surrogate variables, further studying the spatial variations of SWS throughout the catchment in connection to ET and VIs.

This research has been supported by the Grant Agency of the Czech Technical University in Prague, Grant No. SGS20/156/OHK1/3T/11 and TUdi project, EU Horizon 2020 Grant Agreement No 101000224.


How to cite: Li, T., Schiavo, M., and Zumr, D.: Mutual relationships between evapotranspiration and soil water storage in a small agricultural catchment and their consistency from a statistical viewpoint, EGU General Assembly 2023, Vienna, Austria, 23–28 Apr 2023, EGU23-3298, https://doi.org/10.5194/egusphere-egu23-3298, 2023.

EGU23-3658 | ECS | Orals | HS2.2.5

Harnessing integrated hydrologic modeling to analyze the coastal impacts of groundwater-surface water interactions on beach surface stability and freshwater availability 

Anner Paldor, Ryan S. Frederiks, Rachel Housego, Britt Raubenheimer, Steve Elgar, Nina Stark, and Holly A. Michael

Coastal aquifers supply freshwater to nearly half of the world's population, and their importance for sustainable development in coastal areas is immense. Due to the proximity to the ocean, salinization is typically the biggest risk for coastal groundwater resources. Furthermore, the interactions between groundwater and surface water during coastal flooding often result in surface instabilities arising from elevated groundwater heads. Here, integrated hydrologic modeling is used to examine the effect of groundwater-surface water interactions on the salinity distribution in aquifers and on the stability of beach surfaces. The processes considered include multi-scale fluctuations in sea level (tides, storm surges, and glacial cycles). Results show that modern salt distributions may change even if the current conditions remain stable, when considering short- and long-term cyclical processes that aquifers are likely still responding to. It is also found that during coastal flooding, critical hydraulic gradients may develop, potentially destabilizing the beach surface. The distribution of these critical gradients depends on beach topography, with a non-trivial relationship between surface elevation and the location of critical gradients. These results mean that the interactions between groundwater and surface water likely play a pivotal role in the hydrologic state of coastal systems, with important implications for water resources management and for natural hazard mitigation.

How to cite: Paldor, A., Frederiks, R. S., Housego, R., Raubenheimer, B., Elgar, S., Stark, N., and Michael, H. A.: Harnessing integrated hydrologic modeling to analyze the coastal impacts of groundwater-surface water interactions on beach surface stability and freshwater availability, EGU General Assembly 2023, Vienna, Austria, 23–28 Apr 2023, EGU23-3658, https://doi.org/10.5194/egusphere-egu23-3658, 2023.

EGU23-4085 | ECS | Posters on site | HS2.2.5

Data-guided exploration of streamflow generation mechanism: A global-scale analysis 

Hamed Sharif and Ali Ameli

Identifying a catchment’s streamflow generation mechanisms could inform the hydrologic functioning of the catchment, and how the catchment responds to the changes in climate and land-use. This study focuses on identifying the dominant streamflow generation mechanism and its drivers at more than 2,000 natural catchments located in North and South America, Europe, and Oceania. First, in a given catchment, we use a suite of diagnostic tools to infer the relative contribution of different streamflow generation mechanisms from precipitation and streamflow observations and simulated time series of subsurface storage. Then, in a large sample hydrology framework, we explore the major physical and climatic drivers of streamflow generation mechanisms. In this study, we made progress in differentiation among, seemingly similar, but naturally different subsurface mechanisms of streamflow generation (e.g., subsurface stormflow, transmissivity feedback, groundwater flow) as well as in identifying the drivers of these mechanisms. Our study extracts generalizable process understanding by combining conventional hydrologic science tools with modern data learning techniques.

How to cite: Sharif, H. and Ameli, A.: Data-guided exploration of streamflow generation mechanism: A global-scale analysis, EGU General Assembly 2023, Vienna, Austria, 23–28 Apr 2023, EGU23-4085, https://doi.org/10.5194/egusphere-egu23-4085, 2023.

EGU23-4973 | Orals | HS2.2.5

The International Soil Moisture Network - a global interoperable data center for in situ soil moisture observations 

Fay Böhmer, Tunde Olarinoye, Wolfgang Korres, Kasjen Kramer, Stephan Dietrich, Matthias Zink, Irene Himmelbauer, Lukas Schremmer, Ivana Petrakovic, Daniel Aberer, Roberto Sabia, Raffaele Crapolicchio, Philippe Goryl, Klaus Scipal, and Wouter Dorigo

Soil moisture is recognized as an Essential Climate Variable (ECV), because it is crucial to assess water availability for plants and hence food production. Having long time series of freely available and interoperable soil moisture data with global coverage enables scientists, farmers and decision makers to detect trends, assess the impacts of climate change and develop adaptation strategies.

The collection, harmonization and archiving of in situ soil moisture data was the motivation to establish the International Soil Moisture Network (ISMN) at the Vienna University of Technology in 2009 as a community effort. Based on several project funding periods by the European Space Agency (ESA), the ISMN became an essential means for validating and improving global land surface satellite products, climate and hydrological models.

Permanent funding for the ISMN operations was secured through the German Government (Ministry of Digital and Transport) and therefore the ISMN has successfully migrated at the end of 2022 to its new host the International Centre for Water Resources and Global Change (ICWRGC) and the German Federal Institute of Hydrology (BfG). Furthermore, the ISMN was recognized by WMO in their latest State of Global Water Resources report.

To improve the data service delivery, ISMN users can now benefit from a newly developed dataviewer which features functionalities such as data archives and advanced filter options (e.g. for climate and landcover types, for data quality) developed in synergies with the ESA project Fiducial Reference Measurements for Soil Moisture (FRM4SM). This presentation aims at showcasing these latest upgrades as well as new network contributions to the ISMN.

How to cite: Böhmer, F., Olarinoye, T., Korres, W., Kramer, K., Dietrich, S., Zink, M., Himmelbauer, I., Schremmer, L., Petrakovic, I., Aberer, D., Sabia, R., Crapolicchio, R., Goryl, P., Scipal, K., and Dorigo, W.: The International Soil Moisture Network - a global interoperable data center for in situ soil moisture observations, EGU General Assembly 2023, Vienna, Austria, 23–28 Apr 2023, EGU23-4973, https://doi.org/10.5194/egusphere-egu23-4973, 2023.

EGU23-5130 | ECS | Posters on site | HS2.2.5

Tracking water movement through a small agricultural catchment using StorAge Selection functions  and hydrologic modeling 

Hatice Türk, Markus Hrachowitz, Karsten Schulz, Christine Stumpp, Michael Stockinger, Peter Strauss, and Günter Blöschl


Determining the processes that drive streamflow generation and catchment-scale transport of nutrients and pollutants by water is one of the challenges of modern hydrology. In the last decades, substantial knowledge has been gained from high-frequency and high-resolution measurements of tracers to track water movements within a hydrological system. For example, the stable isotopes of oxygen (d18O) and hydrogen (d2H) have been widely used to disentangle the contributions of different runoff generation mechanisms by modeling water travel and residence times. However, quantifying the effects of catchment internal factors for similar or different transit time distributions, particularly in characteristically complex and heterogeneous catchments, remains a challenge. Here we test different shapes for age selection functions (StorAge Selection) of individual distinct storage components (e.g., the root zone, groundwater) of the agricultural Hydrological Open Air Laboratory (HOAL) catchment in Petzenkirchen, Austria. The HOAL has a variety of runoff generation mechanisms, including overland flow, wetlands, and tile drains, as well as high-resolution tracer and hydrological data that allows for broad storage-discharge relationship testing. The main goal of this study is to estimate the transit time distributions associated with varying fluxes from these components (e.g., overland flow, groundwater recharge) to learn about catchment internal streamflow generation processes. Water flow is modeled with a water age balance model and are replaced by selecting the appropriate transfer functions. Testing different age selection functions for various storage components of the catchment will provide a better understanding of catchment dynamics under different environmental conditions, allowing for better calibration of catchment-scale water and nutrient transport models.


How to cite: Türk, H., Hrachowitz, M., Schulz, K., Stumpp, C., Stockinger, M., Strauss, P., and Blöschl, G.: Tracking water movement through a small agricultural catchment using StorAge Selection functions  and hydrologic modeling, EGU General Assembly 2023, Vienna, Austria, 23–28 Apr 2023, EGU23-5130, https://doi.org/10.5194/egusphere-egu23-5130, 2023.

EGU23-6098 | ECS | Posters virtual | HS2.2.5

Assessment of the impact of soil hydraulic parameters based on various Microwave datasets on estimation of hydrological fluxes 

Vikrant Maurya, Manika Gupta, Juby Thomas, Prashant Kumar Srivastava, Dharmendra K. Pandey, Naresh Chandra Pant, and Atul Kumar Sahai

Soil Moisture (SM) is a key variable in the quantification of the water and the energy-balance fluxes occurring within the atmosphere and the surface. Recent advances in microwave remote sensing provide an unprecedented opportunity to monitor surface soil moisture globally but at a coarse (~25-40 km) spatial resolution. Although hydrological models based on water and energy fluxes are also used for estimation of the high spatial resolution soil moisture at regional scale to understand the surface hydrological processes, agricultural applications, and the water resource management remains a challenge as it depends upon hydraulic parameters. Therefore, the study focuses on the assessment of the impact of the downscaled SM derived from different microwave datasets on optimized soil hydraulic parameters and eventually its effect on discharge at the basin scale. The aim is achieved in two steps: firstly, the coarse scaled SM products from different microwave datasets (Advanced Microwave Scanning Radiometer 2 (AMSR-2) and Soil Moisture Active Passive (SMAP)) are downscaled to 1km spatial resolution using a disaggregation algorithm. Secondly, effective soil hydraulic parameters are optimized with dual input of downscaled SM and the discharge for the Kosi Basin. The results show that there is a significant impact of the optimization of soil hydraulic parameters on the hydrological fluxes and discharge. The effective soil hydraulic parameter derived from the downscaled product of SMAP L3 shows a promising result in simulation of SM from hydrological model in addition to that the optimization technique using GA in the hydrological models ensures a better process representation and spatial prediction.

How to cite: Maurya, V., Gupta, M., Thomas, J., Srivastava, P. K., Pandey, D. K., Pant, N. C., and Sahai, A. K.: Assessment of the impact of soil hydraulic parameters based on various Microwave datasets on estimation of hydrological fluxes, EGU General Assembly 2023, Vienna, Austria, 23–28 Apr 2023, EGU23-6098, https://doi.org/10.5194/egusphere-egu23-6098, 2023.

EGU23-6635 | ECS | Posters on site | HS2.2.5

The riparian zone as a gatekeeper for subsurface stormflow 

Alexey Kuleshov, Anne Hartmann, Theresa Blume, and Maria-Luisa Hopp

Subsurface stormflow (SSF) can be a major streamflow generation process in small catchments. It is known that SSF generated on the hillslopes of the catchment may change both in its chemical and quantitative composition on the way to the stream. This occurs primarily due to processes in the riparian zone. The riparian zone plays the role of a "reactor" where mixing, storage, and biogeochemical transformation of the hillslope SSF composition occurs.  However, we still lack a comprehensive understanding of this “gatekeeper function” of the riparian zone, controlling the timing and spatial patterns of connectivity and the chemistry of the water being transferred from the hillslopes into the stream.
In our study we aim to investigate the SSF signal transformation in the riparian zone. We installed three “dual-use trenches” per catchment in four different catchments located in Germany and Austria. With this novel dual-use trench approach we are able to measure hillslope SSF as well as inject tracer into the riparian zone. We measure response dynamics, timing, flow volumes and chemistry at the upslope side of the trench. We will identify tracers or tracer combinations that characterize SSF and can be used to identify hillslope SSF in riparian zone groundwater and stream flow. The inter-comparison of the four different catchments allows us to evaluate the influence of landscape and climate characteristics. We then use tracer injections at the downslope side of the dual-use trench in combination with an array of shallow groundwater observation wells downslope of the trench to investigate the physical and chemical transformation of hillslope SSF in the riparian zone. This array of wells extends both upstream and downstream of the trench, enabling us to trace the transformation of the uninterrupted physical and chemical signal of SSF on the adjacent hillslopes on its passage to the stream and to evaluate the influence of parafluvial flow.
Here, we present first data on tracer concentrations in hillslope SSF and riparian zone groundwater from our test catchments. Ultimately, we aim to develop a conceptual matrix, by which it will be possible to estimate the degree of SSF transformation in the riparian zone, depending on watershed characteristics (topography, soil depth and soil hydraulic properties) and hydrological conditions (antecedent wetness of the watershed and seasonal dynamics).

How to cite: Kuleshov, A., Hartmann, A., Blume, T., and Hopp, M.-L.: The riparian zone as a gatekeeper for subsurface stormflow, EGU General Assembly 2023, Vienna, Austria, 23–28 Apr 2023, EGU23-6635, https://doi.org/10.5194/egusphere-egu23-6635, 2023.

Soil moisture measurements are very popular. Yet they provide a very incomplete picture about the state of the partially saturated zone and the capillary binding of soil water. Here we propose that the free energy of the soil water stock offers a superior perspective on storage dynamics, as it combines soil water content, gravity potential and matric potential data. Based on this new state variable, we show that the partially saturated zone is characterized by a system-specific balance of storage and release corresponding to local state of minimum free energy. The latter depends on the soil water retention curve and topography/depth to groundwater. In the absence of an external rainfall or radiative forcing, the system will thus naturally relax back to and persist in this equilibrium. Hydrological systems are however not isolated, they are frequently forced out of their equilibrium either by rainfall or by radiation driven evaporation. Here we show that the corresponding storage dynamics manifests as deviations of the free energy from and relaxations back the local equilibrium and that the latter separates two different regimes, which are either associated with a storage excess and overshoot of potential energy or a storage deficit and overshoot of capillary binding energy. We demonstrate that these pseudo oscillations are distinctly different in different hydrological landscapes. As the free energy state of the soil water stock, the storage equilibrium and the ranges of both storage regimes depend jointly on depth to groundwater and the soil water retention curve, we combine both controls into a hydrological system characteristics we call the ‘energy state function’ of the soil. We show that the latter allows an insightful inter-comparison of storage dynamics with in different hydrological landscapes, and a priory estimate of depth to groundwater, based on available soil moisture and matric potential data. Finally, we demonstrate a threshold-like relation between the free energy of soil water in the riparian zone and streamflow generation, where the tipping points coincides with the transition from a storage deficit to a storage excess.

How to cite: Zehe, E., Hoffmeister, S., and Loritz, R.: Free energy of soil water – a superior perspective on storage dynamics and its sensitivity to soil hydraulic properties and topography, EGU General Assembly 2023, Vienna, Austria, 23–28 Apr 2023, EGU23-6735, https://doi.org/10.5194/egusphere-egu23-6735, 2023.

EGU23-7917 | ECS | Posters on site | HS2.2.5

Towards a robust parameterization of subsurface stormflow in hydrological models at the catchment scale 

Tamara Leins, Francesca Pianosi, and Andreas Hartmann

In addition to overland flow, subsurface stormflow (SSF) can play a major role for runoff generation during certain events. Even though SSF is a well-recognised process, there is a lack of systematic studies on SSF, partly because it is very difficult to quantify. In hydrological modelling, this can lead to an unclear distinction of SSF from other processes. If parameters that describe SSF processes or thresholds are implemented in hydrological models, they are often used as fitting parameters and can contribute to overall model uncertainty. So far, there has been no systematic benchmarking of SSF routines in hydrological models.

This presentation discusses how we plan to address this research gap. In order to address the inconsistency of SSF representation in hydrological models, different existing lumped hydrological models will be set up for four study sites located in the Alps, Ore Mountains, Black Forest and Sauerland. In a first step, different models will be calibrated using only basic data like discharge observations, climate data and readily available geodata. Differences in SSF simulations will be detected and quantified and the models will be benchmarked regarding the simulation of SSF dynamics and associated uncertainties. In a next step, we will include new experimental data on SSF derived at the four study sites in the calibration of the lumped hydrological models by a multi-objective calibration and evaluation framework. In order to consider SSF observations collected at scales different than the scale of model application, new SSF metrics will be developed. Testing different combinations of these metrics for model calibration it will be possible to state which SSF proxies can lead to the most productive improvement of SSF simulations.

Identifying current weaknesses in SSF representation of current models, and providing directions for improving them by including the most beneficial SSF metrics, this project will show potential for the improvement of SSF simulations through SSF data collection. In a final application of the most reliable SSF simulations to all study sites, we will show the impact of extreme wet or extreme dry conditions on SSF occurrence and SSF volumes.

How to cite: Leins, T., Pianosi, F., and Hartmann, A.: Towards a robust parameterization of subsurface stormflow in hydrological models at the catchment scale, EGU General Assembly 2023, Vienna, Austria, 23–28 Apr 2023, EGU23-7917, https://doi.org/10.5194/egusphere-egu23-7917, 2023.

EGU23-8754 | Orals | HS2.2.5

Assimilation of SMAP surface soil moisture retrievals into the FAO crop growth model AquaCrop v7.0 

Michel Bechtold, Louise Busschaert, Shannon de Roos, Zdenko Heyvaert, Sujay Kumar, Jonas Mortelmans, Samuel Scherrer, Maxime Van den Bossche, Dirk Raes, Elias Fereres, Margarita Garcia-Vila, Pasquale Steduto, Theodore Hsiao, Maher Salman, and Gabrielle De Lannoy

Recently, the FAO crop model AquaCrop v7.0 has been released as open-source code along with the standard graphical user interface for single field applications, and Linux, Windows, and Mac stand-alone executables for plugin into regional or climate simulations (https://www.fao.org/aquacrop/en/). In addition, AquaCrop v7.0 has been coupled as the first crop model into NASA’s Land Information System (LIS) to support regional modeling and data assimilation (DA) using spatially complete re-analysis meteorological forcings, and to produce spatio-temporally complete geolocated NetCDF output for the first time. This presentation explores the potential of soil moisture updating for improving crop growth model estimates of AquaCrop.

Our DA setup uses the one-dimensional ensemble Kalman filter to assimilate the SMAP Level-2 surface soil moisture retrieval product from April 2015 through 2021 on a quarter-degree regular model grid over Europe. Prior to assimilation, a climatological rescaling is applied to remove the observation-minus-forecast bias. A preliminary evaluation against in-situ data of the International Soil Moisture Network indicates that topsoil (0-30 cm) soil moisture estimates of AquaCrop are improved through the DA compared to the model-only estimates. Our results show that the adjusted soil moisture strongly modulates biomass accumulation during the main growing period from April to June, particularly over moisture-limited areas. The impact on biomass will be further evaluated with the Copernicus Global Land Service dry matter productivity product as the observational reference.

How to cite: Bechtold, M., Busschaert, L., de Roos, S., Heyvaert, Z., Kumar, S., Mortelmans, J., Scherrer, S., Van den Bossche, M., Raes, D., Fereres, E., Garcia-Vila, M., Steduto, P., Hsiao, T., Salman, M., and De Lannoy, G.: Assimilation of SMAP surface soil moisture retrievals into the FAO crop growth model AquaCrop v7.0, EGU General Assembly 2023, Vienna, Austria, 23–28 Apr 2023, EGU23-8754, https://doi.org/10.5194/egusphere-egu23-8754, 2023.

EGU23-8815 | Orals | HS2.2.5

Inverse identification of soil properties at catchment scale via pilot point calibration of an integrated surface-subsurface hydrological model 

Arkadiusz Głogowski, Wiesław Fiałkiewicz, Oliver Schilling, and Philip Brunner

For water managers, extreme weather events such as droughts and heavy rainfall can pose severe challenges. Both sudden and longer term surpluses or shortages of water are operationally challenging to deal with. Investigating the effects of extreme hydrological events at the catchment scale requires the development of hydrological models capable of simulating such events. The present study is focused on developing such a model for an agricultural catchment using the integrated surface-subsurface hydrological flow model (ISSHM) HydroGeoSphere. For robust simulation of the impact of heavy rainfall and drought events on water availability and crops, an accurate representation of the spatially highly variable soil hydraulic properties has been identified as crucial. To identify effective soil hydraulic properties at the catchment scale, we propose a method combining real time observations of soil moisture, groundwater levels and catchment outflow with an ISSHM of the catchment via pilot point-based model inversion. The applicability of the method is demonstrated on a 17 km2 tributary agricultural catchment of the Odra River located 20 km north of Wrocław, Poland. The validation data for the approach consist of soil samples analysed both before and after the vegetation period.

How to cite: Głogowski, A., Fiałkiewicz, W., Schilling, O., and Brunner, P.: Inverse identification of soil properties at catchment scale via pilot point calibration of an integrated surface-subsurface hydrological model, EGU General Assembly 2023, Vienna, Austria, 23–28 Apr 2023, EGU23-8815, https://doi.org/10.5194/egusphere-egu23-8815, 2023.

EGU23-8875 | ECS | Posters on site | HS2.2.5

Tracing Longitudinal Patterns of Subsurface Hillslope-Stream Connections Across Catchments 

Natasha Gariremo, Luisa Hopp, and Theresa Blume

Subsurface stormflow (SSF) generated on hillslopes is an important hydrological process in headwater catchments. Tracing SSF flow paths and ultimately quantifying its contribution to streamflow is challenging as the signal can undergo various transformations from the hillslope. The riparian zone specifically, can act as a mixing and storage zone and may change strongly the physical and chemical signals of hillslope SSF before it reaches the stream. As a consequence, SSF may not be recognized as streamflow contribution. Thus, the relevance of this process for streamflow generation is currently not fully understood. In addition, studies often focus on quantifying SSF generation at the hillslope scale. Therefore, there is a lack of data to fully understand SSF characteristics at the catchment scale.

The aim of this study is to characterize the hillslope-stream connectivity at the reach to catchment scale, using physical as well as chemical information. To deal with the challenges associated with measuring the SSF signal, this study implements a novel multi-method experimental design that will create a unique along-stream data set of hillslope contributions to streamflow in four test catchments in Germany and Austria. A combination of extensive salt dilution gauging along streams, water level measurements in-stream and in near-stream groundwater, longitudinal Radon profiles in streamwater and regular sampling of near-stream groundwater and streamwater for hydrochemical analyses will allow to evaluate the spatial variability of SSF inputs to the stream and to quantify the along-stream attenuation of the SSF signal.

Here, we present the study outline as well as first data of water chemistry in near-stream groundwater and streamwater and will characterize the longitudinal patterns of a range of hydrochemical tracers along the streams in the four test catchments. The data set we will collect will be used to simplify and minimize future experimental effort and to identify simple proxies for regionalization. Ultimately, we aim to develop a framework to determine the likelihood of hillslope-stream connectivity at the catchment scale, as influenced by landscape and climate characteristics.

How to cite: Gariremo, N., Hopp, L., and Blume, T.: Tracing Longitudinal Patterns of Subsurface Hillslope-Stream Connections Across Catchments, EGU General Assembly 2023, Vienna, Austria, 23–28 Apr 2023, EGU23-8875, https://doi.org/10.5194/egusphere-egu23-8875, 2023.

EGU23-9868 | ECS | Orals | HS2.2.5

Model simplification to simulate groundwater recharge from perched gravel-bed braided rivers 

Antoine Di Ciacca, Scott Wilson, and Thomas Wöhling

Braided rivers are an important source of groundwater recharge in New Zealand. They consist of multiple temporary channels in a gravel environment and, as a consequence, their interactions with groundwater are complex and highly variable in space and time at different scales. Recently, the gravels of the contemporary braidplain of these rivers have been described and referred to as the ‘braidplain aquifer’. It is within this aquifer that hyporheic and parafluvial flows occur. In these systems, the groundwater recharge to the deeper regional aquifer is actually the water exchange between the braidplain and the regional aquifers. Some of these braided rivers are perched above the regional water level in their main losing section, which means that an unsaturated zone exists between the braidplain and regional aquifer. This complexity calls for the use of 3D fully integrated hydrological models to represent groundwater – surface water interactions in these environments. However, these complex models are very computationally intensive, which strongly limits their use in parameter inference and uncertainty quantification schemes as well as their applicability to regional scale problems.

We present a modelling framework that includes a 3D fully coupled HydroGeoSphere (HGS) model and several 2D cross-sectional HYDRUS-2D models (with 1, 2 and 3 layers). This framework aims at simplifying the model while ensuring the appropriate simulation of the groundwater recharge. We demonstrate our modelling approach on the relatively small Selwyn River. Piezometric data and groundwater recharge estimates derived from satellite photography were available for this river. First, stochastic simulations were performed using the 2D cross-sectional models and compared to observations in order to explore the validity of different subsurface conceptualizations and parameter values. Second, the selected conceptualization and parameter values were used to parameterize the 3D fully coupled HGS model. Third, the groundwater recharge simulated by the 3D and the 2D models were compared. Our results demonstrate that the observations can only be reproduced with a minimum of 3 distinct layers, with a lower permeability layer in the middle. Furthermore, this modelling exercise revealed the primary importance of the width and thickness of the braidplain aquifer as they determine the infiltration front width and the pressure head applied to the braidplain aquifer bottom, respectively. This shows that the properties, dimensions and water level in the subsurface are controlling the groundwater recharge from the perched braided river rather than the river characteristics. Moreover, we show that a 2D cross-sectional model can effectively replace the 3D fully coupled model to simulate groundwater recharge from the perched braided river and that this reduces the model run time by 3 orders of magnitude. Finally, some analytical equations, which can be easily implemented in regional groundwater models, were tested as a further simplification of the 2D model.

How to cite: Di Ciacca, A., Wilson, S., and Wöhling, T.: Model simplification to simulate groundwater recharge from perched gravel-bed braided rivers, EGU General Assembly 2023, Vienna, Austria, 23–28 Apr 2023, EGU23-9868, https://doi.org/10.5194/egusphere-egu23-9868, 2023.

EGU23-10152 | Posters on site | HS2.2.5

Grid resolution, time discretization, boundary condition, and other challenges in coupled surface/subsurface hydrological modeling 

Claudio Paniconi, Claire Lauvernet, and Christine Rivard

In this study we push the limits of a physics-based detailed model of surface water/groundwater interactions, CATHY, in order to explore numerical issues related to discretization, coupling, and scale effects. Regardless of the spatial scale of the model domain (field, hillslope, catchment, ...), the processes that are simulated by integrated models such as CATHY are characterized by different dynamic time scales across subsystems and thus require appropriate time stepping schemes. Accurate tracking (in a mass balance sense) of complex exchange fluxes is also a challenge. At larger spatial scales, concerns related to aspect ratio and mesh distortion can influence and constrain grid discretization choices. Across the land surface boundary, different options for representing boundary conditions can lead to widely varying model behaviors. Finally, model performance assessments can be highly sensitive to the response variables of interest. We will illustrate some of these challenges via test case simulations of a long (13 km) transect and a small (0.3 ha) hillslope.

How to cite: Paniconi, C., Lauvernet, C., and Rivard, C.: Grid resolution, time discretization, boundary condition, and other challenges in coupled surface/subsurface hydrological modeling, EGU General Assembly 2023, Vienna, Austria, 23–28 Apr 2023, EGU23-10152, https://doi.org/10.5194/egusphere-egu23-10152, 2023.

EGU23-10343 | ECS | Posters on site | HS2.2.5

Combined Effects of Geological Heterogeneity and Discharge Events on Groundwater and Surface Water Mixing 

Guilherme Nogueira, Daniel Partington, and Jan H. Fleckenstein

Exchange between stream water (SW) and groundwater (GW) is an important mechanism controlling water quality in river-corridors. Different works have already recognized the complex interactions between hydrological and geological characteristics for SW-GW exchange fluxes (EF). However, it remains unclear how EF and subsequent SW-GW mixing are affected by different discharge events (e.g., peak discharge magnitude and event duration) that take place within different geological settings (e.g., highly permeable sand units juxtaposed to low permeable silt units). Here, to assess the combined effects of geological heterogeneity and discharge events on the EF patterns and subsequent SW-GW mixing in riparian aquifers, we combined a fully-coupled 3D numerical model with a mixing cell routine using 35 binary sedimentary geological settings (covering five different sand to silt ratios in the alluvial aquifer material) and eight different hydrological scenarios. Our results indicate that geological heterogeneity at the reach-scale has secondary effects on EF patterns and on the resulting net EF, mainly affecting the EF magnitudes. While EF magnitudes increased with increasing sand fractions (and hydraulic conductivity (K) values), including geological heterogeneity in the model generally enlarged SW infiltration, resulting in slightly higher net EF in comparison to the equivalent K homogenous cases. In general, SW-GW mixing under baseflow conditions decreased with increasing sand fractions. Furthermore, mixing was higher in the equivalent homogenous cases (e.g., similar K values) in comparison to the heterogeneous cases. On the other hand, the increase in SW-GW mixing due to discharge events was larger in sand units, as well as in the generated heterogeneous cases in comparison to their equivalent homogeneous cases. The results also indicated that more intense discharge events (higher peak discharge) promoted SW-GW mixing more than longer events presenting similar cumulative discharge values. Our work extends the knowledge on SW-GW mixing, critical for river restoration strategies and for downstream management of dam-regulated rivers, and sheds some light on potential future research direction in integrated SW-GW assessments and modelling.

How to cite: Nogueira, G., Partington, D., and Fleckenstein, J. H.: Combined Effects of Geological Heterogeneity and Discharge Events on Groundwater and Surface Water Mixing, EGU General Assembly 2023, Vienna, Austria, 23–28 Apr 2023, EGU23-10343, https://doi.org/10.5194/egusphere-egu23-10343, 2023.

EGU23-10604 | ECS | Posters on site | HS2.2.5

Simulating tsunami flooding and seawater infiltration using coupled surface-subsurface flow models 

Jiaqi Liu, Philip Brunner, and Tomochika Tokunaga

Tsunami disasters cause not only human casualties and economic losses by short-term seawater flooding but also long-term salinization issues to groundwater resources due to seawater infiltration into coastal unconfined aquifers. The two processes, seawater flooding and infiltration, have been commonly simulated in a separate manner using tsunami models and groundwater models, respectively. Thanks to many recent advances in fully integrated hydrological modeling techniques, simulating surface and subsurface flow processes across various time scales within one conceptual framework is now feasible. Here, we present numerical simulations of the coupled processes of seawater flooding and infiltration based on a coastal urban area of Niijima Island, Japan, under the future Nankai Trough earthquake and tsunami scenarios. The HydroGeoSphere code was used to solve 2-D surface flow by St Venant equation and 3-D subsurface flow by Richard’s equation. The baseline simulation showed that road networks acted as fast paths for seawater flooding, while bare lands and building areas were the primary locations for seawater infiltration into the subsurface. The occurrence of seawater ponding was found to be controlled by both topographic variations at the land surface and the saturation condition of the soil medium in the subsurface. Moreover, the type of topographic data used in the model (DEM or DSM) and the equivalent hydraulic conductivity applied to building restructures showed significant effects on the simulated intensity of surface flow and the amount of seawater infiltration. These findings indicated that surface-subsurface interactions and the properties of both surface and subsurface domains are important factors to be considered for improving infrastructure safety evaluation and water resources management in tsunami-prone areas.

How to cite: Liu, J., Brunner, P., and Tokunaga, T.: Simulating tsunami flooding and seawater infiltration using coupled surface-subsurface flow models, EGU General Assembly 2023, Vienna, Austria, 23–28 Apr 2023, EGU23-10604, https://doi.org/10.5194/egusphere-egu23-10604, 2023.

EGU23-10678 | Orals | HS2.2.5

Numerical modelling of integrated processes in cryo-hydrogeological systems: Applications in Nunavik, Quebec, Canada 

John Molson, Oleksandra Pedchenko, Madiha Khadhraoui, Richard Fortier, and Jean-Michel Lemieux

Numerical simulations of coupled groundwater flow, heat and mass transport have been carried out for better understanding of cryo-hydrogeological system behavior under climate change.

Simulations are based on conceptual models of two well-monitored field sites at Umiujaq and Salluit, in Nunavik, (northern Quebec), Canada. The Umiujaq site contains discontinuous permafrost as discrete mounds within a marine silt bounded by unconfined and confined sand aquifers, while the Salluit site includes a bedrock river-talik system within continuous permafrost.

All simulations are run with the finite element HEATFLOW/SMOKER code which includes density-dependent groundwater flow, advective-conductive heat transport and advective-dispersive microparticle transport. Water-ice phase change, latent heat, ice-fraction dependent relative permeability and temperature-dependent thermal parameters are integrated in the solution. The thermal-hydraulic system is driven by ground surface recharge/discharge conditions which depend on the thermal state of the shallow subsurface (frozen or thawed), and by coupling with air-ground temperature gradients. Microparticle transport includes thaw-dependent particle suspension and velocity-dependent downgradient retention in heterogeneous porous media.

At the Umiujaq site, the two-dimensional vertical-plane simulations through a permafrost mound show how supra- and sub-permafrost groundwater flow can affect permafrost thaw which can lead to the release of microparticles, contributing to increased groundwater turbidity. At the Salluit site, supported by cross-sections of electrical resistivity tomography, the simulated 3D river-talik system follows the river meanders and responds dynamically to seasonal changes in air temperature and groundwater pumping.  The groundwater pumping rate needs to be managed for sustainable use, especially in winter when the talik is hydraulically disconnected from the river bed.

How to cite: Molson, J., Pedchenko, O., Khadhraoui, M., Fortier, R., and Lemieux, J.-M.: Numerical modelling of integrated processes in cryo-hydrogeological systems: Applications in Nunavik, Quebec, Canada, EGU General Assembly 2023, Vienna, Austria, 23–28 Apr 2023, EGU23-10678, https://doi.org/10.5194/egusphere-egu23-10678, 2023.

EGU23-11145 | ECS | Orals | HS2.2.5

Short-Term Dynamics of the Flowing Stream Drainage Density 

Izabela Bujak, Ilja van Meerveld, Andrea Rinaldo, and Jana von Freyberg

Many headwater streams are non-perennial. The flowing stream network dynamically expands and contracts during and after rainfall events, resulting in temporal changes in the flowing stream drainage density (DD). This dynamic behavior has consequences for solute transport and the organisms that live in the streams. Therefore, it is important to understand the hydrological processes responsible for these changes in DD to better predict the impacts of climate change on riverine ecosystems. However, until now, our knowledge of event-scale DD dynamics is limited because experimental data remain sparse.

We monitored DD in two 5-ha catchments in the Swiss Alpine foothills from June to October 2021. We installed a dense wireless sensor network to monitor the water levels in the streams and groundwater, soil moisture, and precipitation. In addition, we did multiple mapping surveys during different hydrological conditions and developed a simple model to calculate DD from these measurements at a 10-min resolution. We used these data to explore how short-term changes in DD relate to water storage in the catchments.

Our surveys showed that during the wet 2021 summer, DD varied considerably both in space and time, ranging from 2.7 to 32.2 and 7.8 to 14.6 km/km2 for the flatter and steeper catchment, respectively. The model provided reliable estimates of DD variations at 10-min resolution for both catchments (accuracies >0.94). In the flatter catchment, the relations between DD and either discharge or groundwater became steeper when DD was larger than 20 km/km2.DD increased rapidly with wetter conditions when the groundwater levels rose to 20 cm from the surface and streamflow was initiated in multiple shallow-incised channels. From analyzing multiple consecutive rainfall events, we found that the discharge-DD relationship was counterclockwise when conditions were dry. This is likely caused by the streamflow coming from nearby the outlet where the topographic wetness index is high. Surface flow in the upstream tributaries emerges only once the maximum subsurface transport capacity is exceeded, causing a rapid increase in DD. After the rainfall ends, discharge recedes quickly, whereas DD remains high due to ongoing groundwater seepage at the channel heads. For events with wetter conditions, there was no hysteresis, likely because the maximum subsurface transport capacity is exceeded faster throughout the catchment. Such threshold behavior and hysteresis were also not observed for the steep catchment, where multiple groundwater springs were flowing throughout the study period, resulting in much smaller DD variations.

How to cite: Bujak, I., van Meerveld, I., Rinaldo, A., and von Freyberg, J.: Short-Term Dynamics of the Flowing Stream Drainage Density, EGU General Assembly 2023, Vienna, Austria, 23–28 Apr 2023, EGU23-11145, https://doi.org/10.5194/egusphere-egu23-11145, 2023.

EGU23-11353 | ECS | Orals | HS2.2.5

Stable isotopes as a tool for improving rainfall-runoff modelling in South Africa 

Jared van Rooyen, Andrew Watson, Yuliya Vystavna, and Jodie Miller

Understanding the way in which a water budget is distributed within a hydrological system is imperative in the prediction of the systems behaviour when this water budget has changed. A complex interaction of variable flow rates, residence times and reactive transport, controls the available streamflow of a river system not only over seasonal changes, but under longer term climate fluctuations as well. Hydrological modelling techniques have been instrumental in predicting these changes by monitoring/simulating rainfall, river and groundwater contributions but are dependent on robust data collection through the maintenance of old infrastructure and the creation of new infrastructure. South Africa is a pertinent example of the decline of gauging infrastructure and a prime use case for novel stable isotope techniques as an accessory to traditional hydrological modelling in semi-gauged watersheds. Furthermore, to constrain contributions in modified systems, that include reservoirs and land use changes, isotopes present an opportunity to assess unpredictable water mobilisation in the streamflow system. In this study, stable isotope measurements of rainwater, groundwater and stream water (δ2H and δ18O), together with a tertiary mixing model were used to develop an isotope-enabled version of the JAMS/J2000 rainfall-runoff model, named J2000iso. The application was applied to the upper Berg River catchment, a catchment impacted by recent drought, but important for regional water supply. Compared to the base version, the J2000iso had 13% more simulated interflow, with 56% less variance in the ensemble results and less overall process uncertainty. The J2000iso was also more robust than the base version during a subsequent validation. The isotope-enabled models provided a means to constrain the proportion of surface runoff, interflow and baseflow considering the streamflow signal changes due to upstream reservoir operations. As many catchments in South Africa are still ungauged or impacted by upstream reservoirs, the J2000iso model provides a means to simulate hydrological processes, given the appropriate collection of isotope and auxiliary data.

How to cite: van Rooyen, J., Watson, A., Vystavna, Y., and Miller, J.: Stable isotopes as a tool for improving rainfall-runoff modelling in South Africa, EGU General Assembly 2023, Vienna, Austria, 23–28 Apr 2023, EGU23-11353, https://doi.org/10.5194/egusphere-egu23-11353, 2023.

EGU23-11410 | Orals | HS2.2.5

Soil moisture response as a tool to understand hydrological processes across forested catchments in different climates 

Daniele Penna, Catalina Segura, Marco Borga, Christophe Hissler, Jerome Latron, Pilar Llorens, Chiara Marchina, Nuria Martìnez-Carreras, and Giulia Zuecco

Comparative analysis of the hydrological response at the catchment scale across different climates is critical to understand possible similarities in runoff generation processes. In this work, we relied on high-resolution soil moisture measurements in three European forested catchments to characterize hydrological responses during different wetness conditions. The study sites include Ressi, Italy (2.4 ha), Weierbach, Luxembourg (42 ha), and Can Vila, Spain (56 ha). We analyzed the seasonal variability in the difference between soil moisture at a relatively shallow (10–15 cm) and deep (45–60 cm) location within soil profiles in each catchment in the period 2017–2021, which included a wide range of meteorological conditions. We found contrasting soil moisture patterns across the investigated catchments. In the most humid site, Ressi, which receives over 2000 mm of precipitation per year, we often found similar soil moisture at the two soil depths, and soil moisture at the shallow depth was rarely higher than that at the deeper layer, suggesting very frequent vertical connectivity in this site. In Weierbach, which receives around 1000 mm of precipitation per year, soil moisture in the shallow sensor was consistently higher than in the deeper soil except during wet conditions when water content was similar across the entire soil profile. During dry conditions, evaporation of shallow water resulted in consistently higher soil moisture in the deeper layers. We infer that in Weierbach vertical connectivity between deep and shallow soil layers develops only during wet conditions. Despite similar total precipitation amount between Can Vila and Weierbach, soil moisture patterns were very different. In Can Vila, soil moisture was consistently higher in the deeper layer compared to the shallow one irrespectively of the season. This difference could be driven by very high evaporation of shallow water or a significant contribution of groundwater that promotes vertical connectivity. Our approach provides a relatively simple and inexpensive method to assess differences in hydrological behavior solely based on soil moisture data, opening the possibility for further analysis and comparisons across multiple catchments.

How to cite: Penna, D., Segura, C., Borga, M., Hissler, C., Latron, J., Llorens, P., Marchina, C., Martìnez-Carreras, N., and Zuecco, G.: Soil moisture response as a tool to understand hydrological processes across forested catchments in different climates, EGU General Assembly 2023, Vienna, Austria, 23–28 Apr 2023, EGU23-11410, https://doi.org/10.5194/egusphere-egu23-11410, 2023.

EGU23-11474 | ECS | Orals | HS2.2.5

Improving drain flow simulations in a national hydrologic model with machine learning estimates of drain fraction 

Raphael Schneider, Saskia Noordujin, Hafsa Mahmood, Simon Stisen, and Anker Lajer Højberg

Agricultural areas are often artificially drained, especially in temperate and flat landscapes. This also applies to Denmark, where approximately half of the agricultural area is artificially drained, mostly with tile drains. The generated drain flow has significant impacts on various aspects of the hydrologic cycle such as groundwater recharge, flow paths and transport times. Consequently, drain flow is a major control on the transport of nutrients such as nitrogen. Yet, detailed knowledge of spatial and temporal variability of drain flow is inadequate due to insufficient observations of drain flow, lacking knowledge of drain infrastructure and issues of scale and hydrogeologic heterogeneity.

The objective was to improve the simulation of both the spatial and temporal variability of drain flow in a large-scale hydrological model used to map nitrate transport. This model is a physically-based, distributed groundwater-surface water model of all of Denmark. It is a major challenge to simulate drain flow distribution in space and time with the national model due to its coarse horizontal resolution (500m or 100m), and the lack of drain flow observations at relevant scale. Hence, to achieve the objective, we gathered existing field-scale drain flow observations from all over Denmark. For these drain catchments, fine-scale (10m) physically based hydrological models were setup and calibrated against the drain flow observations. After successful calibration, the resulting simulated distributions of drain fraction (drain flow relative to precipitation) were regionalized to applicable areas across all of Denmark. The regionalization was performed using decision tree machine learning algorithms, and a set of topographic and geologic covariates available nationally at fine resolution. An analysis of spatial transferability of the machine learning algorithm allowed to limit predictions to applicable areas. Finally, these estimates of drain fraction are used in the calibration of the large-scale national hydrologic model, amongst other objective functions such as streamflow and groundwater heads.

How to cite: Schneider, R., Noordujin, S., Mahmood, H., Stisen, S., and Højberg, A. L.: Improving drain flow simulations in a national hydrologic model with machine learning estimates of drain fraction, EGU General Assembly 2023, Vienna, Austria, 23–28 Apr 2023, EGU23-11474, https://doi.org/10.5194/egusphere-egu23-11474, 2023.

EGU23-12171 | ECS | Orals | HS2.2.5

When four or more (tracers) are better than one and why you should ski (to sample) 

Natalie Ceperley, Anthony Michelon, Harsh Beria, Joshua Larsen, Torsten Vennemann, and Bettina Schaefli

We measured a combination of natural tracers of water at a high frequency, including stable isotope compositions (δ2H, δ17O, δ18O), electrical conductivity, and water and soil temperature to characterize hydrological processes in a snow-dominated Alpine catchment and to understand the diversity of streamflow sources and flow paths. Previous work metabarcoding eDNA from stream samples led us to suppose that subsurface connectivity was a primary driver of genetic richness in the water of an alpine catchment, however our process understanding was limited.   By diving into temperature measurements in soil and water, electrical conductivity, and stable isotopes, we start to weave together the complexity of this subsurface connectivity.  Of particular interest in this alpine catchment is the seasonality of connectivity, which is mainly, in different forms, in melt periods occurring in spring and during rain-fed runoff events in summer and rain-on-snow events in winter.   This is dramatically different than in non-mountain, low-elevation environments where connectivity is observed in the cold or winter season.  In this presentation, we will compare and contrast what we learn from each tracer and highlight findings that could only be learned by bringing them all together.  We will reveal how these tracers inform our understanding of the timing of snow presence and melt, the existence of sub-snowpack local flow, the magnitude of subsurface exchange, and the mixing of snowmelt with groundwater. These insights into the details of streamflow generation in such a dynamic environment were only possible due to the intense, year-round field work.

How to cite: Ceperley, N., Michelon, A., Beria, H., Larsen, J., Vennemann, T., and Schaefli, B.: When four or more (tracers) are better than one and why you should ski (to sample), EGU General Assembly 2023, Vienna, Austria, 23–28 Apr 2023, EGU23-12171, https://doi.org/10.5194/egusphere-egu23-12171, 2023.

EGU23-12302 | ECS | Orals | HS2.2.5

Monitoring of subsurface runoff using absolute gravimetry in Taiwan 

Kuanhung Chen and Cheinway Hwang

Calibration of subsurface runoff models in a catchment scale requires lots of observation sites/wells due to their scale difference. An observation site could fail to receive the required data due to variations in flow paths in rainfall events.  Therefore, establishing an effective monitoring site for subsurface runoff is a challenging task in hydrology studies. An alternative choice of monitoring equipment for subsurface runoff is using a terrestrial gravimeter. A terrestrial gravimeter has a broader sensible region than a monitoring well or several ERT (Electrical Resistivity Tomography) profiles. In addition, it takes the water(mass) itself as a tracer rather than using biogeochemical proxies and thus the quantity of runoff is estimated through observed gravity changes accordingly. Due to such advantages, in this presentation, we demonstrate the possibility of using gravimetry to monitor subsurface runoff in Taiwan. In one of the study sites at a proximal fan, our studies cover hourly, daily, weekly and monthly time spans, which encounter different intensities of rainfall over 1.5 years. The infiltration coefficient and percolation rate over 30 m length around our study site were determined in a severe rain event. In another study where we placed an absolute gravimeter in land subsidence regions, we estimated water storage changes at different sites after a wet season and rank their capability for being an artificial recharge pond. This presentation demonstrates the possibility of terrain gravimetry used in calibrating subsurface runoff models. We can picture that when quantum gravimeters are well-developed, high-temporal gravity measurements can assist to build a more accurate subsurface runoff model.

How to cite: Chen, K. and Hwang, C.: Monitoring of subsurface runoff using absolute gravimetry in Taiwan, EGU General Assembly 2023, Vienna, Austria, 23–28 Apr 2023, EGU23-12302, https://doi.org/10.5194/egusphere-egu23-12302, 2023.

EGU23-12690 | Posters on site | HS2.2.5

Drained, dampened, delayed: Deep soil moisture dynamics 

Theresa Blume, Daniel Rasche, Andreas Güntner, and Markus Morgner

Soil moisture is most often measured in-situ only to depths of about 50 cm. This is due to either the larger effort or challenges in installation or at some sites due to the presence of weathered bedrock. It is furthermore often assumed that with the top 50 cm of the soil we already capture the main part of the root zone and thus the major processes of infiltration, evaporation and transpiration should all be reflected in these soil moisture observations. However, due to lack of data we cannot be sure that this is really the case.

In this study we are reviewing soil moisture dynamics measured in the field at depths ranging between 70 and 450 cm. This includes more than 100 sensors at depth >70 cm and more than 60 at depth >100 cm. These sensors are installed in sandy soil in 14 different forest stands of the TERENO observatory in north-eastern Germany. We examine both seasonal and event responses. We furthermore compare the responses in the unsaturated zone also to the responses observed in shallow and deep groundwater. Using simple uncalibrated 1D Hydrus simulations we then put our observations into the context of those simulated by the model under pure matrix flow conditions, thus ignoring any preferential flow. The above described setup allows us to investigate the effects of infiltration, percolation, preferential flow, deep drainage, and transpiration at depths usually not accounted for in standard monitoring networks.

How to cite: Blume, T., Rasche, D., Güntner, A., and Morgner, M.: Drained, dampened, delayed: Deep soil moisture dynamics, EGU General Assembly 2023, Vienna, Austria, 23–28 Apr 2023, EGU23-12690, https://doi.org/10.5194/egusphere-egu23-12690, 2023.

EGU23-13461 | ECS | Posters on site | HS2.2.5

HydroCAL: An Integrated Surface-Subsurface Cellular Automata Hydrological Model to simulate streamflow and river network dynamics 

Luca Furnari, Alessio De Rango, Giuseppe Mendicino, Gianluca Botter, and Alfonso Senatore

One of the main constraints to the operational use of Integrated Surface and Subsurface Hydrologic Modelling (ISSHM) is the computational cost of such a complex approach. The growth of High-Performance Computing (HPC) has continuously pushed forward this limit, targeting the objective of "hyper-resolution" modelling. The Extended Cellular Automata (XCA) paradigm allows easy parallelization of numerical code and can be used in different HPC systems. Moreover, XCA have other unique features, like asynchronism, that can further break down the elapsed time.

HydroCAL is an integrated surface-subsurface Cellular Automata Layer hydrological model built by coupling a diffusive-like 2D water surface routing module and a 3D subsurface routing module based on the variably saturated Richards' equation. The model was implemented by adopting the parallel scientific software library Open Computing Abstraction Layer (OpenCAL), which allows researchers to exploit different parallelization techniques, hardware architectures and XCA-specific features.

Here we extend the HydroCAL model's capabilities, including groundwater and evapotranspiration modules that significantly contribute to the baseflow generation and river reach activation/deactivation dynamics, allowing continuous simulations beyond the storm-event scale. The enhanced model is used at ultra-high resolution (100 m) in a small steep-orography headwater Mediterranean catchment characterized by high hydrogeological heterogeneity. A multivariate calibration and validation approach is adopted over long-term simulations, using the observed active stream network dynamics and the recorded streamflow at the catchment outlet.

The results show that HydroCAL can adequately reproduce the hydrological response, simulating several multipeak events and reproducing the recession phases. Moreover, groundwater behaviour contributes to the simulation of the complex river network activation and deactivation dynamics. Overall, the HydroCAL model implementation upon the XCA paradigm allows highly detailed coupled simulations for long periods with reasonable computational times.

How to cite: Furnari, L., De Rango, A., Mendicino, G., Botter, G., and Senatore, A.: HydroCAL: An Integrated Surface-Subsurface Cellular Automata Hydrological Model to simulate streamflow and river network dynamics, EGU General Assembly 2023, Vienna, Austria, 23–28 Apr 2023, EGU23-13461, https://doi.org/10.5194/egusphere-egu23-13461, 2023.

EGU23-13578 | Posters on site | HS2.2.5

Evaluating surface-subsurface lateral flow interaction and solute concentration in a river channel using the diffusive wave inverse problem 

Roger Moussa, Samer Majdalani, Jean-Baptiste Charlier, and Martin Le Mesnil

Lateral flow L(t) representing surface-subsurface flow exchange is a major process during flood events, which can be either gains (positive) or losses (negative) to the channel. The inverse problem consists of evaluating L(t) knowing the inflow I(t) and the outflow O(t) on a channel. However L(t) and the corresponding solute concentration are very difficult to measure on real channels, and we are always not sure to which extent the evaluated L(t) is close to the real one. This paper aims at evaluating L(t) and the corresponding solute concentration in a channel using the analytical solution of the inverse problem of the Hayami diffusive wave equation (DWE) with L(t) uniformly distributed along the channel, used in the MHYDAS model (Moussa et al., 2002). Applications are shown on an experimental channel (4 m) and on six natural river channels (5 to 20 km). First, we conceived and built a novel 4 m experimental channel (Majdalani et al., 2019) where I(t), O(t) and L(t) and are highly controlled at 1 second time step and we realize 62 experimental hydrograph scenarios corresponding to different shapes of I(t) and L(t). We validate the hypotheses of both the DWE Hayami model and the corresponding inverse model (with very high criteria functions values for a large majority of scenarios) which reflects the ability of the DWE inverse model to reproduce complex lateral flow hydrograph and solute concentration dynamics (Moussa and Majdalani, 2018). Second, we apply the methodology on two French karst rivers in order to evaluate surface-subsurface flows during flood events (Le Mesnil et al., 2022): three river reaches in the Loue catchment in a temperate/mountainous climate, and three river reaches in the Cèze catchment in a Mediterranean climate. Results show that flood process seasonality is mainly related to karst aquifer saturation rate, while intra-site variability is linked to karst area extension and river morphology. Results are encouraging to extend this approach to a variety of sites, notably those affected by significant surface water-groundwater interaction and groundwater flooding. Such approach, by providing discretized information on flood processes, could help refining lumped hydrological models, or facilitate the use of semi-distributed ones. The coupled experimental-modelling approach proposed herein opens promising perspectives regarding the evaluation of lateral flow on real channels.


References

Le Mesnil M., Charlier J.-B., Moussa R., Caballero Y., 2022. Investigating flood processes in karst catchments by combining concentration-discharge relationship analysis and lateral flow simulation. Journal of Hydrology 605 (2022) 127358, 14 pp. https://doi.org/10.1016/j.jhydrol.2021.127358

Majdalani S., Moussa R., Chazarin J.-P., 2020. A novel platform to evaluate the dampening of water and solute transport in an experimental channel under unsteady flow conditions. Hydrological Processes, 34, 956-971. Article ID: hyp13624. DOI: 10.1002/hyp.13624

Moussa R., Majdalani S., 2019. Evaluating lateral flow in an experimental channel using the diffusive wave inverse problem. Advances in Water Resources, vol 127, 120–133. https://doi.org/10.1016/j.advwatres.2019.03.009

Moussa R., Voltz M., Andrieux P., 2002. Effects of the spatial organization of agricultural management on the hydrological behaviour of a farmed catchment during flood events. Hydrological Processes 16 : 393-412 (DOI: 10.1002/hyp.333).

How to cite: Moussa, R., Majdalani, S., Charlier, J.-B., and Le Mesnil, M.: Evaluating surface-subsurface lateral flow interaction and solute concentration in a river channel using the diffusive wave inverse problem, EGU General Assembly 2023, Vienna, Austria, 23–28 Apr 2023, EGU23-13578, https://doi.org/10.5194/egusphere-egu23-13578, 2023.

EGU23-13933 | ECS | Posters on site | HS2.2.5

Subsurface stormflow source area identification using depth profiles of the water-soluble organic matter 

Christina Fasching and Peter Chifflard

Hydrological dynamics of hillslopes, particularly subsurface stormflow (SSF), are highly complex and variable in space and time. Frequently, available studies are often limited to single slopes or few storm events. As a result, the transfer of these findings to other slopes or catchments is associated with great uncertainties. Thus, for upscaling and model validation, a quantification of the hydrological dynamics of hillslopes and the factors influencing the spatial and temporal patterns of subsurface stormflow is urgently needed. Closely related to the hydrological dynamics of hillslopes is the export of organic carbon from the soils to the adjacent stream. However, the spatial sources of carbon are still largely unclear because the exact flow paths of SSF within the slope are not well known. In order to address this knowledge gap, we took a hydro-biogeochemical approach, that measures the water-soluble organic matter (WSOM; concentration, absorbance and fluorescence) along 480 locations on 100 hillslopes, in four contrasting catchments – varying from low to high mountain ranges (Sauerland, Ore Mountains, Black Forest, Alps). This enables us to derive empirical relations among different landforms (i.e., convergent, divergent and planar slope shapes, flow path lengths and valley shapes), bedrock and soil properties, and to quantify the spatial variability and stability of subsurface hydrological process patterns (e.g., flow directions, transit times, hydrochemical and biochemical composition). Distributed sampling of WSOM along the soil profile (6 WSOM samples per profile; both during wet and dry conditions) will help to assess the vertical and lateral subsurface flowpaths of water in the unsaturated and saturated zone, and the spatial discretization of source areas for SSF. We will use an array of state-of-the-art laboratory equipment and methods (TOC-Analyzer, Fluorescence Spectrometry) to analyze WSOM. First results will show depth profiles of WSOM in the four contrasting catchments from the low to high mountain ranges (Sauerland, Ore Mountains, Black Forest, Alps). By these depth profiles source areas of SSF can be detected.

How to cite: Fasching, C. and Chifflard, P.: Subsurface stormflow source area identification using depth profiles of the water-soluble organic matter, EGU General Assembly 2023, Vienna, Austria, 23–28 Apr 2023, EGU23-13933, https://doi.org/10.5194/egusphere-egu23-13933, 2023.

EGU23-14388 | Posters on site | HS2.2.5

Fast and Invisible: Conquering Subsurface Stormflow through an Interdisciplinary Multi-Site Approach 

Peter Chifflard, Theresa Blume, Stefan Achleitner, Bernhard Kohl, Markus Weiler, Stefan Hergarten, Florian Leese, Luisa Hopp, Andreas Hartmann, Christian Reinhardt-Imjela, and Ilja van Meerveld

Where does water go when it rains? Where are floods generated and how? What controls stream water quality during events? These questions are important to many fields from engineering and flood protection to water and ecosystem management and prediction of impacts of global change. The most elusive processes in the process-ensemble underlying these questions is subsurface stormflow (SSF), the fast event response triggered by lateral subsurface flow. SSF is prevalent and a more important process than generally accounted for because a basic understanding based on systematic studies across scales and sites is still lacking. However, only with systematic studies will it be possible to really advance our understanding by discovering general principles of SSF functioning and to provide protocols and best practices for its assessment, both experimentally and with respect to modelling.

In many natural landscapes, SSF, i.e. any subsurface flow that occurs in response to a precipitation event, plays a major role in runoff generation: either by contributing directly to streamflow or by producing saturated areas or return flow, which then is the underlying cause of saturation excess overland flow. Therefore, much of what we see as event response in the hydrograph might be the direct or indirect result of SSF. It is likely that the discharge signal of SSF, including the indirectly triggered response in the stream, is larger than we generally assume. While its importance is probably largest in the headwaters, headwaters make up 70% of the stream network and greatly influence the supply and transport of water and solutes downstream. However, SSF is elusive and poorly accounted for as measurements are difficult for several reasons: the inaccessibility of the subsurface, the large spatial variability and heterogeneity, the variable sources and the fact that it is a threshold-driven process that only occurs during certain events. Thus, systematic studies of SSF are lacking, mainly due to difficulties of quantification.

We suggest such a systematic study of SSF in different environments, across scales, and using a well-designed and replicated selection of approaches including novel approaches. This will be followed by a systematic evaluation of methods and possible proxies as well as model intercomparison, evaluation and improvement. Thereby, we will focus on 4 challenges: 1) Development of novel experimental methods,2) Spatial patterns of SSF, 3) Thresholds and cascading effects of SSF, 4) Impacts of SSF.

Whereas standard single research projects investigate part of this puzzle at a specific location, this Research Unit provides the unique opportunity of fitting a large number of puzzle pieces together. This Research Unit will have a strong emphasis on experimental work in four contrasting catchments from the low to high mountain ranges (Sauerland, Ore Mountains, Black Forest, Alps) that then directly feeds into a collaborative modelling effort, which in turn influences experimental design in an iterative process.

How to cite: Chifflard, P., Blume, T., Achleitner, S., Kohl, B., Weiler, M., Hergarten, S., Leese, F., Hopp, L., Hartmann, A., Reinhardt-Imjela, C., and van Meerveld, I.: Fast and Invisible: Conquering Subsurface Stormflow through an Interdisciplinary Multi-Site Approach, EGU General Assembly 2023, Vienna, Austria, 23–28 Apr 2023, EGU23-14388, https://doi.org/10.5194/egusphere-egu23-14388, 2023.

Root-zone soil moisture is decisive in partitioning the water fluxes at the land surface, e.g. between evapotranspiration and groundwater recharge. Field-scale estimates of these time variant recharge rates can be derived from 1D soil hydrologic models, if the soil moisture product represents the respective scales and dynamics, and lateral fluxes can be neglected. Measured soil moisture time series can be used to calibrate these models by optimizing soil hydrologic properties (SHPs) and in this way increase confidence in simulated downward flux from a soil column (potential groundwater recharge). To obtain indirectly and non-invasively measure soil moisture at the field scale, Cosmic-ray neutron sensing (CRNS) has gained increasing attention in the last years. However, the variable penetration depth of the sensor and its decreasing sensitivity with depth and distance from the sensor complicate the interpretation of the soil moisture product and limit direct comparison to simulated soil moisture.

Within this study a two-layered Hydrus-1D model (up to 1.5 m depth) has been set up at an agricultural field site for one cropping season and calibrated using different soil moisture products to derive potential groundwater recharge estimates. While the use of point soil moisture sensor network data (SN) in the optimization is straightforward, different options to use CRNS data are evaluated: i) the COSMIC operator (simulates neutron count rates) ii) weighting simulated soil moisture according to CRNS vertical sensitivity, iii) applying a soil moisture profile correction on measured CRNS soil moisture before comparison.

Optimizing the SHPs did result in very good model performance for the SN as well as for the CRNS options (KGE > 0.86). While the SN delivers information down to a depth of 90 cm, using CRNS data that considers the vertical sensitivity (option i) and ii)) can result in difficulties informing the bottom layer of the model, which shows in optimized SHPs hitting the previously determined parameter bounds. Compared to that, using CRNS option (iii) leads to slightly reduced performance measures in the optimization but better informs the SHPs of the bottom layer when averaging modeled soil moisture over a fixed depth. For the successful optimizations, regardless of the method, recharge rates vary little and are comparable to independently estimated water flux at the field site.

Results of the study confirm the ability of the profile correction to increase CRNS information content to the main rooting zone and the validity of assuming a fixed integration depth, although this is expected to vary between field sites. This encourages also the use of CRNS soil moisture for non-experts of the method for soil hydrologic and landscape models as well as water balance calculations targeting downward fluxes.

How to cite: Scheiffele, L. M., Munz, M., Francke, T., Baroni, G., and Oswald, S. E.: Constraining groundwater recharge estimates at the field scale using soil hydrologic modelling and measured root zone soil moisture: how to deal with the vertical sensitivity of cosmic-ray measurements, EGU General Assembly 2023, Vienna, Austria, 23–28 Apr 2023, EGU23-15330, https://doi.org/10.5194/egusphere-egu23-15330, 2023.

Land subsidence is mainly caused by over-exploitation of groundwater, and it has been resulting in several problems along the coastal areas in Japan such as damages to buildings and facilities, changes of stream slopes, and increased risks of river flooding during high tides or storm surges. At the south bank of the Nabaki River in the Kujukuri coastal plain, Japan, some inland areas have become below the mean sea-level due to land subsidence. To prevent flooding in these areas, the local authority has constructed pumping stations and ditch networks at both sides of the tidal river since 1960s. The former can discharge the unnecessary water out to keep the land surface areas dry while the latter contributes to the agricultural productions by efficiently discharge water out. However, the pumping and discharging behaviours result in lowering groundwater levels that may cause further seawater intrusion. Here, a numerical model was developed by using the HydroGeoSphere code to investigate how the land subsidence and mitigating measures affect the quality of near-surface groundwater resources. The model solved coupled surface-subsurface flow and mass transport processes with the variable-density effect. Different scenarios were designed to compare the situations with and without land subsidence and pumping activities. The simulation results showed that, although the pumping stations and ditch systems performed effectively for preventing flooding associated with land subsidence, this system can enhance seawater intrusion to the inland aquifer from the tidal river. The results suggest that the pump stations and ditch systems built for preventing floods in subsidence areas should be carefully evaluated for their potential impacts on the groundwater flow regime and water quality. 

How to cite: Tsai, C. S., Liu, J., Ito, Y., and Tokunaga, T.: The impact of land subsidence and mitigating measures on near-surface groundwater salinities at the south bank of the Nabaki River, Japan, EGU General Assembly 2023, Vienna, Austria, 23–28 Apr 2023, EGU23-15520, https://doi.org/10.5194/egusphere-egu23-15520, 2023.

EGU23-15840 | ECS | Posters on site | HS2.2.5

Development of a ground platform to measure runoff data in rivers in the brazilian semiarid region 

Rodrigo Rodrigues and Carlos Costa

The occurrence of floods dates back to the history of human civilization, and in recent years it has been increasing significantly. To minimize the risks and mitigate the damage caused by extreme events, an efficient warning system must exist. In Brazil, river discharge data are produced by means of fluviometric stations maintained by government agencies. A promising solution is the application of tools that employ image-based approaches, where it is possible to determine the surface velocity of the riverbed from a particle image velocimetry (VIP) analysis. To correct the topography of the riverbed, LIDAR sensors and structure-of-motion photogrammetry (EDM) techniques can be employed in association with the tool applied to determine surface velocity fluxes. After the generation of raw runoff data there will be a calibration and treatment of the obtained data. In this context, the objective of the project is to develop ground platforms capable of performing real-time estimates of river discharge. It is expected that after the development of the data collection platform it will be possible to apply the tool in the areas of sedimentology, hydrology, water quality simulation, urban macrodrainage, power generation, among others. 

How to cite: Rodrigues, R. and Costa, C.: Development of a ground platform to measure runoff data in rivers in the brazilian semiarid region, EGU General Assembly 2023, Vienna, Austria, 23–28 Apr 2023, EGU23-15840, https://doi.org/10.5194/egusphere-egu23-15840, 2023.

Local heavy precipitation regularly causes great damage resulting from flash floods in smaller catchments. Appropriate discharge records are usually unavailable to derive an extreme value statistics and regionalization approaches predicting peak discharge from discharge records of larger basins cannot include the small-scale effects and local processes. In addition, forecasting flash floods from rainfall forecast requires to identify the initial soil moisture conditions under which a catchment is most prone to trigger flash floods. In this respect, soil moisture affects runoff at the local scale during runoff generation (infiltration), but also at the catchment scale during runoff concentration with possible infiltration of overland flow (run-on infiltration) along the flow path.

Our proposed framework to study the role of soil moisture on flash floods includes three steps: (1) to validate long-term hydrological simulations with in-situ soil moisture data to derive typical probability distributions of initial soil moisture depending on soil properties, vegetation and land cover, groundwater influences, etc; (2) to derive the sensitivity of runoff generation to soil moisture at the local and catchment scale by combining different probabilities for rainfall amount, duration and initial soil moisture resulting in the same joint probability and (3) to include the effect of soil moisture on run-on infiltration by linking a distributed hydrological and 2D-hydraulic model to simulate runoff hydrographs with and without run-on infiltration. The final set of simulations with the distributed, process-based rainfall-runoff model RoGeR for different temporal (event to long-term) and spatial scale (plots to submeter scale) allows us for a given catchment to derive the role of soil moisture on different hydrological processes (runoff generation and runoff concentration). We developed a spatial explicit method, which combines the joint probability of soil moisture and rainfall for runoff formation with hydraulic assumptions to determine runoff concentration and thus the corresponding hydrographs and the specific conditions in a catchment that can trigger flash floods. These simulations are compared in different test catchments with discharge records to validate out model chain. Finally, a comparison among different catchments with different characteristics (soil, geology, land-use, geomorphology, etc) enables us to derive a flood generation soil moisture sensitivity which should help to improve hydrological models to include all relevant processes and to focus our future in-situ soil moisture observations in the sensitive catchments to allow for a better prediction of flash floods by including observed soil moisture instead of simulated values. 

How to cite: Weiler, M., Leistert, H., Schmit, M., and Steinbrich, A.: Linking in-situ and simulated soil moisture data for flood prediction: the advantage of joint probabilities of initial soil moisture and rainfall characteristic, EGU General Assembly 2023, Vienna, Austria, 23–28 Apr 2023, EGU23-16866, https://doi.org/10.5194/egusphere-egu23-16866, 2023.

EGU23-17088 | Orals | HS2.2.5

Modeling the age of subsurface runoff at the catchment scale – what makes it younger or older? 

Ingo Heidbüchel, Jie Yang, and Jan H. Fleckenstein

Whether subsurface flow is relatively young or old when it passes by the catchment outlet is a strong indicator of weathering processes, nutrient availability, pollution susceptibility and the hydrologic response of a catchment. It depends not only on individual catchment, climate, event and vegetation properties, it is also the result of a multitude of interactions between different processes and catchment states within the hydrologic system.

In order to begin to disentangle the cause-effect chains (or better even: webs), we employed the physically-based, spatially explicit 3D model HydroGeoSphere in a virtual catchment running 100 scenarios with different combinations of catchment, climate and vegetation properties. One result showed, e.g., that streamflow in forested areas appeared to become older on average compared to a non-vegetated site. Upon closer inspection, this was not necessarily only caused by subsurface runoff becoming slower/older due to lower hydraulic conductivities of drier soils when there was active root water uptake. Another component of this increase in stream water age was the different partitioning of precipitation into subsurface runoff and groundwater flow. Relatively more water was transported in the slower groundwater domain and less within the soil at the bedrock-soil interface.

This is to show that, in order to make meaningful predictions about the age of hydrologic fluxes, it may not be the best approach to single out specific catchment and climate properties. Instead, it can be extremely helpful to look at the individual properties and the processes they control, their potential interactions and interdependencies, in a bottom-up approach within the framework of a hydrologic model.

How to cite: Heidbüchel, I., Yang, J., and Fleckenstein, J. H.: Modeling the age of subsurface runoff at the catchment scale – what makes it younger or older?, EGU General Assembly 2023, Vienna, Austria, 23–28 Apr 2023, EGU23-17088, https://doi.org/10.5194/egusphere-egu23-17088, 2023.

EGU23-17547 | ECS | Posters on site | HS2.2.5

Optimization of Soil Texture and Hydraulic Parameters Using the Soil Moisture Observation in Land Surface Model 

Sujeong Lim, Claudio Cassardo, and Seon Ki Park

Soil moisture is a key variable in the hydrologic cycle and affecting to weather and climate, thus accurate soil moisture prediction is necessary in the land surface modeling. In this study, we use UTOPIA (University of Torino land surface Process model for Interaction in the Atmosphere) that is a one-dimensional land surface model representing the interactions at the interface between atmospheric surface, vegetation and soil layers. Soil texture estimated by percentages of clay, silt, and sand is the dominant factor to predict soil moisture. However, it is hard to measure the accurate soil information due to insufficient and uncertain observation. Therefore, we have implemented the micro-genetic algorithm (micro-GA) within UTOPIA to optimize the percentages of clay, silt, and sand estimating the soil texture and hydraulic parameters by evaluating the soil moisture performance against in-situ observation. As a global optimization algorithm, the micro-GA evolves to the best potential solution based on the natural selection or survival of the fittest. Compared to the control experiments using a soil database or in situ observation, optimization results show that the optimal soil texture and hydraulic parameters lead to an improvement in soil moisture prediction.

How to cite: Lim, S., Cassardo, C., and Park, S. K.: Optimization of Soil Texture and Hydraulic Parameters Using the Soil Moisture Observation in Land Surface Model, EGU General Assembly 2023, Vienna, Austria, 23–28 Apr 2023, EGU23-17547, https://doi.org/10.5194/egusphere-egu23-17547, 2023.

EGU23-317 | ECS | Orals | HS2.2.7

Testing drought sensitivity of different land use types via a low parameter isotope-aided ecohydrological model approach in a lowland headwater catchment, Germany 

Jessica Landgraf, Dörthe Tetzlaff, Christian Birkel, Jamie Lee Stevenson, and Chris Soulsby

Stable water isotopes are naturally occurring conservative tracers that act as a fingerprint of water sources and ecohydrological fluxes. Previous studies have shown that some of those fluxes, like evapotranspiration and infiltration, are influenced by vegetation. Thus, land use will play an increasingly important role in water partitioning considering projected climate change-induced shifts of patterns in precipitation and increased atmospheric water demand. The sensitivity of different land use types to drought conditions and their influence on water partitioning varies, and still lacks understanding.

We used stable water isotopes to follow the pathway of precipitation into soil at a lowland headwater catchment with multiple land use types (forest, grassland, arable and agroforestry sites) and integrated our data into a one-dimensional, tracer-aided, plot scale model. The model requires precipitation, potential evapotranspiration and leaf area index as input data and the results were calibrated to real time soil moisture and isotope data. The dataset was collected in the long-term experimental Demnitzer Millcreek Catchment (DMC), Germany, over the growing season of 2021 and includes hydroclimatic conditions as well as isotopes in precipitation, soil water and groundwater. The 2021 conditions, though relatively average in terms of wetness, were affected by a dry spring, an exceptionally large summer storm event (~60 mm) as well as “memory effect” of previous intense drought years.

The implementation of the isotope calculations into the model showed that such a simple, low-parameterisation approach with easily accessible input data can be used to estimate the water balance and track isotopic transformations under plot sites with various land use conditions. The most rapid turnover of water was found under arable land use which resulted in short-term crop vulnerability to drought and slow but more rapid recovery and replenishment of moisture deficits. Forest soils showed slower water turnover with lower soil moisture, mainly reflecting higher interception losses and higher transpiration rates. This, together with access to deeper water, means drought stresses build more slowly at forest sites but can last much longer as storage recovery is slow (>1 year) due to high evapotranspiration. Via adapting the model input data, we further simulated drought conditions to assess the “water footprint” of alternative land use under drought stress.

Our study illustrated the potential of stable water isotope data for simplified ecohydrological modelling approaches to quantify water partitioning. The different effects of land use types on ecohydrological fluxes were successfully simulated and their drought resilience was estimated. For the DMC and similar lowland catchments with similar soil types (sand at forest, loam at grassland and crops) and land cover in Central Europe with the modelled drought conditions, forest sites will initially be more resilient but more vulnerable to lasting droughts, while grassland and arable sites tend to recover more quickly, but can be rapidly stressed by short-term severe events. The modelling provides an experimental framework for assessing the differential effects of droughts of varying longevity and severity on alternative land use strategies.

How to cite: Landgraf, J., Tetzlaff, D., Birkel, C., Stevenson, J. L., and Soulsby, C.: Testing drought sensitivity of different land use types via a low parameter isotope-aided ecohydrological model approach in a lowland headwater catchment, Germany, EGU General Assembly 2023, Vienna, Austria, 23–28 Apr 2023, EGU23-317, https://doi.org/10.5194/egusphere-egu23-317, 2023.

EGU23-374 | ECS | Orals | HS2.2.7

Synoptic water isotope surveys to understand the hydrology of large intensively managed catchments 

Ke Chen, Doerthe Tetzlaff, Guodong Liu, Chris Soulsby, and Tobias Goldhammer

Precise knowledge of hydrological processes across large scale catchments is crucial to sustainably meet the growing water demand and improve water management strategies in cities. However, it has been always a major challenge to comprehensively understand the hydrology of a large catchment due to the spatial heterogeneity of climate, topography and anthropogenic activities. Combining tracers with hydroclimatic records, this study used seasonal synoptic surveys in 2021 to better understand the water cycling, storage and losses of the intensively managed 10,000 km2 catchment of the River Spree in Berlin, Germany. Apart from the upper headwaters, the hydrology of the Spree is heavily regulated by reservoir releases, pumped minewater discharges, engineered flows in wetlands and lakes, water abstractions and urban drainage. Moreover, the catchment is drought-sensitive with potential evapotranspiration often exceeding annual rainfall. This is reflected in the spatial and temporal variability of the isotopic composition of river water. In the steeper, upper headwater areas, the river is dominated by groundwater sources but showing evident influence by rainfall in winter, with a “flashy” rainfall-runoff response. However, flows in the middle part of the catchment have enhanced baseflows and attenuated high flows from extensive reservoir and pumped minewater releases. The reservoir waters are isotopically heavier and reflect the effects of open water evaporation. Fractionation effects strengthen downstream as managed wetland areas and natural lakes further enhance evaporation and attenuate flows. Our estimations on evaporation losses also show that the mine water pumping, water abstractions and wastewater additions largely contribute to the catchment water balance and therefore have pronounced impacts on water evaporations. Seasonally, the effects of evaporation on the isotopic composition of the lower river network are strongest in summer and autumn, though they remain in winter and spring, indicating a large memory effect due to long mean travel times within the river system. Tritium variability along the river reflects inputs of younger and older water in different parts of the river system; though the influence of pumped groundwater means that the mean age of stream water in the lower river is likely to be >50 years. Isotope studies at large scales play a valuable role to in better understanding the hydrology of this complex, heavily modified river system and provide an evidence base for more sustainable management of the potentially fragile water resource situation in the future.

How to cite: Chen, K., Tetzlaff, D., Liu, G., Soulsby, C., and Goldhammer, T.: Synoptic water isotope surveys to understand the hydrology of large intensively managed catchments, EGU General Assembly 2023, Vienna, Austria, 23–28 Apr 2023, EGU23-374, https://doi.org/10.5194/egusphere-egu23-374, 2023.

Understanding the transport processes and travel times of pollutants such as nitrate or pesticides in the subsurface is crucial for an effective management of drinking water resources. Transport processes and hydrologic processes, like infiltration, percolation, root water uptake or runoff generation processes, are inherently linked to each other. In order to account for this link, we couple the process-based hydrologic model RoGeR (including infiltration in the soil matrix, macropores and cracks) with StorAge Selection (SAS) functions. We assign to each hydrological process a specific SAS function (e.g. beta-type distribution or power distribution). To represent different transport mechanisms, we combined a specific set of SAS functions into four transport model structures: complete-mixing, piston flow, advection-dispersion and advection-dispersion with time-variant parameters. In this contribution, we quantify and illustrate the results of our modelling experiments at the Rietholzbach lysimeter, Switzerland. We compare our simulations to the measured hydrologic variables (percolation and evapotranspiration fluxes and soil water storage dynamics) and the measured water stable isotope signal (18O) in the lysimeter seepage for a period of ten years (1997-2007). An additional artificial bromide tracer experiment was used to benchmark the models. Additionally, we carried out a sensitivity analysis and provide Sobol’ indices. Our results show that the advection-dispersion transport model with time-variant parameters produces the best results. And thus, advective-dispersive transport processes play a dominant role at Rietholzbach lysimeter. Our modelling approach provides the capability to test hypotheses of different transport mechanisms and to improve process understanding and predictions of transport processes. Overall, the combined model allows a very effective simulation of combined flux and transport processes at various temporal and spatial scales.

How to cite: Schwemmle, R. and Weiler, M.: Consistent modelling of transport processes and travel times – coupling hydrologic processes with StorAge Selection functions, EGU General Assembly 2023, Vienna, Austria, 23–28 Apr 2023, EGU23-457, https://doi.org/10.5194/egusphere-egu23-457, 2023.

The northeastern states of India have extensive deposits of coal among other minerals. Coal mining activities contribute significantly to the economy of these states, providing livelihood to a substantial segment of the populace. Unscientific mining practices have contributed adversely to environmental health of the region, particularly to aquatic systems. Acid mine drainage (AMD) discharge from the mines pollute the streams and rivers, causing serious deterioration of the aquatic environment. Stable isotopes combined with physico-chemical parameters are a promising tool for understanding pollution sources, hydrological processes, factors influencing such processes, and fate of pollutants in hydrological systems. The present study was conducted in AMD affected streams & rivers flowing through the states of Arunachal Pradesh, Nagaland, Assam and Meghalaya in northeast India in two different seasons (pre-monsoon (PRM) & post monsoon (POM)). Water samples were analyzed for 24 physicochemical parameters including the major ions. Stable isotopes of oxygen & hydrogen in water samples were estimated. The results of both sampling seasons are significantly different and reveal that water samples of all sampling sites are dominated by presence of high SO42- in both the sampling seasons; abundance of major ions during PRM are in order SO42->Mg2+>Ca2+>HCO3->Na+>Cl->NO3->K+>NH4+>F- and during POM are in order SO42-> Ca2+>Mg2+>HCO3->Na+>Cl->NO3->K+>NH4+>F-. The stable isotopes of water (δ18O & δD) analysis results indicated enrichment during the POM sampling season. δ18O (‰ V-SMOW)  ranged between -8.60 to -4.95 during PRM and -6.60 to -3.94 during POM, δD (‰ V-SMOW) ranged between -58.29 to -29.63 during PRM and -41.40 to -28.69 during POM. The deuterium excess (d-excess ‰) ranged between 5.70 ~ 17.94 during PRM and 1.57 ~ 14.49 during POM. The hydrochemical characteristics of water during both sampling seasons were deciphered through comprehensive analysis of hydrochemistry (piper diagram, durov plot, gibbs diagram, ion ratios, chadha’s plot) and stable isotopes. The results are discussed.

How to cite: Kumar, V., Paul, D., and Kumar, S.: Seasonal Variation in Stable Isotopes and Physico-chemical Characteristics of AMD Affected Water Bodies in Northeast India, EGU General Assembly 2023, Vienna, Austria, 23–28 Apr 2023, EGU23-859, https://doi.org/10.5194/egusphere-egu23-859, 2023.

EGU23-1230 | ECS | Orals | HS2.2.7

What explains low young water fractions at high elevations? 

Alessio Gentile, Davide Canone, Natalie Ceperley, Davide Gisolo, Maurizio Previati, Giulia Zuecco, Bettina Schaefli, and Stefano Ferraris

The concept of young water fraction, introduced by Kirchner (2016) and defined as the fraction of streamflow that was stored less than about 2-3 months in the catchment, is increasingly used in catchment intercomparisons studies to understand and conceptualize the hydrological processes governing the catchment's functioning. However, the development of perceptual models is not always as straightforward as it may seem. Past works have shown that high mountainous catchments worldwide reveal small young water fractions. These low young water fractions at high elevations have been explained by different hydrological processes, including deeper vertical infiltration promoted by the presence of both fractured bedrock and freely draining soils (e.g., luvisols and cambisols) and long groundwater flow paths driven by the topographic roughness. But, a harmonious explanation of how the relevant mechanisms in mountainous catchments lead to low young water fractions at high elevations is missing.

Using a data set composed of 27 study catchments, located both in Switzerland and in Italy (of which 22 are from the previous work of von Freyberg et al., 2018), we explore both the drivers and the conceptualization of the processes that potentially clarify this surprising result. We assume that this lowering can be explained by groundwater storage potential and the interplay of the seasonal dominance of hydrological processes. For groundwater storage potential we use the proportion of catchment area covered by Quaternary deposits (a parameter that is readily available for the studied catchments). For the interplay of seasonal processes, we use the length of the low-flow period as a measure for the duration of the groundwater (in terms of age, old water) dominated recession period.

Our results suggest that the length of the low-flow period is clearly the main driver of low young water fractions at high elevation. Here, the long winter period, characterised by absence of liquid water input and hence by a low-flow regime, promotes a progressive emptying of the groundwater storage. Even during summer, recent snowmelt and rainfall that transit through the subsurface push out old groundwater into the stream, as reflected by high proportions of baseflow also during high-flow periods. However, during summer, the relative share of old water remains lower than during winter and accordingly, the longer the winter period (with very low young water fractions), the lower the annual young water fraction. Quaternary deposits could play a role in reducing young water fractions via their capacity to store groundwater, but further detailed geological information would be necessary for a complete picture about the role of geology.

How to cite: Gentile, A., Canone, D., Ceperley, N., Gisolo, D., Previati, M., Zuecco, G., Schaefli, B., and Ferraris, S.: What explains low young water fractions at high elevations?, EGU General Assembly 2023, Vienna, Austria, 23–28 Apr 2023, EGU23-1230, https://doi.org/10.5194/egusphere-egu23-1230, 2023.

EGU23-1503 | ECS | Orals | HS2.2.7

Water quality and water circulation formation of a deep lake on the basis of interaction between surface water and groundwater in a highly acidic hot spring region 

Koichi Sakakibara, Sae Mizushima, Yoshikuni Hodoki, Maki Tsujimura, Kei Suzuki, and Hodong Park

Hydrological interactions between surface water and groundwater are key processes to describe the watershed water cycle including lake water hydrology. Understanding these processes is important for quality and quantity controls of water resources and their future management. Water originating from mining/hot spring regions gives significant impacts on local water resources. However, hydrological processes of how the discharged water with unique water quality affects different water bodies have not been fully understood. Therefore, the study aims to investigate features of surface water and groundwater interaction forming lake hydrology in a highly acidic Tamagawa hot spring region, in Japan. For this, the river water, spring water, and lake water at 51 locations in total were sampled. Lake water collection with depths of 0, 50, 100, 200, 300, and 400 m was undertaken at the center of Lake Tazawa. A variety of environmental tracers such as pH, EC, DO, inorganic ion concentrations, oxygen/hydrogen stable isotopes, CFCs, and SF6 in collected water samples were measured.

The river water upstream of the Tamagawa River showed a pH of <3.0 and characteristic Ca-Cl type water quality due to the influence of a highly acidic hot spring. The other river and spring waters were almost neutral and of the Na-HCO3 type water quality. Lake Tazawa water was weakly acidic (pH 5.5, Ca-Cl type water quality), suggesting that the water in the lake originated mainly from the Tamagawa River. Vertical profiles of environmental tracers of lake water at the center of Lake Tazawa indicated that dissolved oxygen concentrations were above 87% saturation even at depths greater than 100 m, suggesting that a rapid lake circulation was occurring. The multiple uses of gas tracers (SF6 and CFC-12) suggested that water age is 4 and 12-20 years in the water close to the lake surface and water deeper than 50 m, respectively. The binary plot of SF6 and CFC-12 concentration indicated that the exponential mixing primarily governs lake water circulation processes. Moreover, calculations of the water balance of Lake Tazawa for the five-year period from 2011 to 2015 inferred that groundwater inflow into Lake Tazawa from the surrounding area may have occurred at a rate of at least 5-12 mm/day. These findings suggest that the inflow of groundwater and river water into Lake Tazawa is responsible for the lake's water quality and a part of rapid lake water circulation.

How to cite: Sakakibara, K., Mizushima, S., Hodoki, Y., Tsujimura, M., Suzuki, K., and Park, H.: Water quality and water circulation formation of a deep lake on the basis of interaction between surface water and groundwater in a highly acidic hot spring region, EGU General Assembly 2023, Vienna, Austria, 23–28 Apr 2023, EGU23-1503, https://doi.org/10.5194/egusphere-egu23-1503, 2023.

EGU23-1537 | Posters on site | HS2.2.7

The tale of two tracers: No evidence for systematic underestimation of transit times inferred by stable isotopes in SAS function models. 

Markus Hrachowitz, Siyuan Wang, Gerrit Schoups, and Christine Stumpp

Stable isotopes (δ18O) and tritium (3H) are frequently used as tracers in environmental sciences to estimate age distributions of water. However, it has previously been argued that seasonally variable tracers, such as δ18O, generally and systematically fail to detect the tails of water age distributions and therefore substantially underestimate water ages as compared to radioactive tracers, such as 3H. In this study for the Neckar river basin in central Europe and based on a >20-year record of hydrological, δ18O and 3H data, we systematically scrutinized the above postulate. This was done by comparing water age distributions inferred from δ18O and 3H with a total of 12 different model implementations, including lumped parameter sine-wave (SW) and convolution integral models (CO) as well as integrated hydrological models in combination with SAS-functions (IM-SAS).

We found that, indeed, water ages inferred from δ18O with commonly used SW and CO models are with mean transit times (MTT) ~ 1 – 2 years substantially lower than those obtained from 3H with the same models, reaching MTTs ~ 10 years. In contrast, several implementations of IM-SAS models did not only allow simultaneous representations of stream flow as well as δ18O and 3H stream signals, but water ages inferred from δ18O with these models were with MTTs ~ 16 years much higher than those from SW and CO models and similar to those inferred from 3H, which suggested MTTs ~ 15 years. Characterized by similar parameter posterior distributions, in particular for parameters that control water age, IM-SAS model implementations individually constrained with δ18O or 3H observations, exhibited only limited differences in the magnitudes of water ages in different parts of the models as well as in the temporal variability of TTDs in response to changing wetness conditions. This suggests that both tracers lead to comparable descriptions of how water is routed through the system. These findings provide evidence that allowed us to reject the hypothesis that δ18O as a tracer generally and systematically “cannot see water older than about 4 years” and that it truncates the corresponding tails in water age distributions, leading to underestimations of water ages. Instead, our results provide evidence for a broad equivalence of δ18O and 3H as age tracers for systems characterized by MTTs of at least 15 – 20 years.

Overall, this study demonstrates that previously reported underestimations of water ages are most likely not a result of the use of δ18O or other seasonally variable tracers per se. Rather, these underestimations can be largely attributed to choices of model approaches and complexity not considering hydrological next to tracer aspects. We therefore advocate to avoid the use of this model type in combination with seasonally variable tracers if possible, and to instead adopt SAS-based or comparable model formulations.

How to cite: Hrachowitz, M., Wang, S., Schoups, G., and Stumpp, C.: The tale of two tracers: No evidence for systematic underestimation of transit times inferred by stable isotopes in SAS function models., EGU General Assembly 2023, Vienna, Austria, 23–28 Apr 2023, EGU23-1537, https://doi.org/10.5194/egusphere-egu23-1537, 2023.

Understanding the hydrogeological functioning of aquifers is essential in contexts where water resources are intensively used. Moreover, climate change can have long-term effects on groundwater in terms of availability, residence and transit times. Thus, careful management of groundwater resources require the understanding of the aquifer’s characteristics that can allow then the setting of sustainable yields values in contexts where water is exploited. This understanding requires in particular the estimation of the age of the groundwaters as well as the transfers/transit times within the aquifers. Our study focuses on the Volvic volcanic aquifer (Chaîne des Puys, France), where the question of water use has increasingly raised for several years, given the significant use of drinking water, both for the public drinking water network and bottled water, and the decrease of precipitations (and groundwater recharge) over the watershed due to climate change.

Previous studies on Volvic watershed allow defining the overall functioning of the system and comparing withdrawals and recharge on an annual scale, but groundwater ages have been only roughly defined even if they appear as a key point for addressing the question of the resource decrease. We propose then a multi-tracers approach, based on hydrogeological monitoring (hydrodynamical and meteorological data’s), including the estimation of groundwater ages (CFCs, tritium (3H)), major and traces elements chemistry and water stable isotopes (18O/2H) to better characterise this resource decrease and more peculiarly its origin and its impact on the environment that has never been addressed.  The relative fractions of modern and ancient water contributions to the Volvic aquifer will thus be estimated as well as the apparent ages of groundwaters. We highlight here the complementarity of tracers used in the dating of waters, which allows a better definition of recharge sources and flow paths within the aquifer.

This will provide key information about the time of the recharge and the time when the decrease began due to increase of abstraction, climate change or a combination of both of these effects.

How to cite: Nevers, P., Aumar, C., Celle, H., Vergnaud, V., Yvard, B., Huneau, F., and Mailhot, G.: Estimation of groundwater ages, recharge and transfers times in volcanic aquifers: Advantages and interests of multi-tracer approaches (3H, CFC-SF6, 18O/2H) coupled to hydrogeological data in the management of water resource of the Volvic watershed (FR)., EGU General Assembly 2023, Vienna, Austria, 23–28 Apr 2023, EGU23-1880, https://doi.org/10.5194/egusphere-egu23-1880, 2023.

As global climate change alters hydroclimatic responses beyond the range of predictability based on historic hydrometeorological records, water resource practitioners are increasingly reliant on new methods of modelling continental and global hydrology. Though local scale heterogeneity and connectivity between hydrologic storages and fluxes tends to be averaged out across large domains, it is precisely these process scale changes that remain crucial as early indicators of climate change. A lack of data at continental scales, and particularly in high latitude regions, can therefore challenge accurate model calibration and evaluation. Efficient and accessible hydrologic prediction tools capable of diagnosing and interpreting continental scale changes in water balance components and overall water supply, ecosystem changes, and uncertainty methods for operational decision-making are needed.

This presentation focuses on the recent advances in large-domain tracer-aided stable isotope modelling and the contributions isotope tracers make on improving hydrologic process representation across large-domains. The influence of process-based model outcomes will be highlighted using examples from cold regions domains, including the propagation of small historical differences into significantly different upper quantile flow predictions. Despite significant advances in tracer-aided modelling, the path forward must include building and supporting global operational monitoring networks, providing standard guidance for integration of tracer-aided approaches, and a focus on building model agnostic workflows and tools that efficiently leverage tracer-aided approaches.

How to cite: Stadnyk, T.: Predicting the unpredictable: Advances in Tracer-aided hydrologic modeling, EGU General Assembly 2023, Vienna, Austria, 23–28 Apr 2023, EGU23-2158, https://doi.org/10.5194/egusphere-egu23-2158, 2023.

EGU23-2231 | Orals | HS2.2.7

How to deal with spectral interferences when measuring water stable isotopes of plants? 

Natalie Orlowski, Lena Wengeler, and Barbara Herbstritt

Nowadays, a wide range of water extraction/vapor equilibration techniques for obtaining soil and plant water isotopic composition (δ18O and δ2H) is applied by various ecohydrological disciplines. Here, researchers need to rely on accurate and precise measurements of water isotope ratios for tracing water movement through the critical zone. Previous research has shown that utilizing isotope ratio infrared spectroscopy (IRIS) to analyze water or vapor samples containing co-extracted/-equilibrated organic contaminants (e.g., methanol, ethanol) has the potential to result in significant inaccuracies through spectral interferences. However, the scientific community and the manufacturers have not effectively addressed the inaccuracies caused by organic contaminants. While some hardware solutions for combusting organics as well as some software solutions exist for spectral interference detection during liquid water IRIS analysis, limited tools exist for the post-correction of direct vapor-mode IRIS data e.g., from in-situ water vapor measurements or from the direct water vapor equilibration laser spectrometry method (DVE-LS).

For our study, we applied three different water extraction and vapor equilibration techniques (i.e., DVE-LS, in-situ water vapor measurements and cryogenic vacuum extraction) to four types of vegetables (cauliflower, celery root, kohlrabi and potatoes). We investigated how co-extracted organic contaminants (i.e., methanol and ethanol) via the different methods affect the isotopic ratios between liquid and vapor CRDS measurements of our vegetable samples. Through applying different CRDS instrument-specific post-correction options, we could reduce isotopic discrepancies and maximize the accuracy and precision of CRDS measurements from vegetables.

We could show that all vegetables produced species-specific different amounts of organic contaminants, which affected the isotope ratios obtained via the different extraction or vapor equilibration techniques in different ways. Clear relationships between DVE-LS samples and spectral parameters indicated co-equilibrated contaminants which we used for a technique-specific ‘organics-correction’. Whereas, results obtained from in-situ water vapor measurements were the least affected by organic contaminants and showed the smallest data spread. Those were also comparable to results from cryogenic vacuum extraction for some type of vegetables.

Our study underlines the importance and necessity of plant water vapor isotope data post-correction and highlights the need for a definitive and general protocol in order to prevent ill-founded ecohydrological data interpretations.

How to cite: Orlowski, N., Wengeler, L., and Herbstritt, B.: How to deal with spectral interferences when measuring water stable isotopes of plants?, EGU General Assembly 2023, Vienna, Austria, 23–28 Apr 2023, EGU23-2231, https://doi.org/10.5194/egusphere-egu23-2231, 2023.

    River damming alters biogeochemical cycles in river continuum. Yet, its effect on the biogeochemical behavior of riverine strontium (Sr) is still unclear. Here, we measured riverine 87Sr/86Sr in both dissolved and particulate phases and relevant parameters in karst cascade reservoirs of Southwest China, and simulated 87Sr/86Sr fractionation during biological processes through experimental incubation of model phytoplankton. The results showed that the dissolved 87Sr/86Sr was rather homogeneous across the water body and nearly identical to inorganic particulate-bound 87Sr/86Sr, and reservoir Sr mainly sourced from carbonate weathering. However, the dissolved Sr concentrations were stratified and increased with depths of the reservoir water columns. This stratification was likely caused by phytoplankton and the precipitation and dissolution of calcite, with the stratified strength controlled by reservoir hydraulic loads. A long-term loads along cascade reservoirs thus could result in a significant increase in dissolved Sr concentrations rather than 87Sr/86Sr. The culture experiment indicated that the dissolved Sr was massively captured by the phytoplankton during which insignificant 87Sr/86Sr fractionation occurred. Thus, the 87Sr/86Sr of reservoir phytoplankton would conserve the dissolved 87Sr/86Sr. The distinctly lower 87Sr/86Sr of phytoplankton than terrestrial organic particulates highlights its potential to distinguish autochthonous and allochthonous sources of reservoir particulate matter. This study demonstrated that damming largely alters the elemental and isotopic distribution of riverine Sr and would deepen the understanding of Sr biogeochemistry in dammed rivers.

How to cite: Qiu, X. and Wang, B.: Effect of damming on riverine strontium geochemical behavior: Evidence from 87Sr/86Sr analysis, EGU General Assembly 2023, Vienna, Austria, 23–28 Apr 2023, EGU23-2273, https://doi.org/10.5194/egusphere-egu23-2273, 2023.

Streamflow in the glacierized catchments over the Tibetan Plateau receives multi-recharge sources, such as rainfall, melt water from snowpack and glacier, and groundwater. Identifying their contributions to streamflow is challenge but it is vital for understanding streamflow and its composition in response to climate change. In this study, based on high-resolution isotopic (18O) and hydrochemical (Cl-) data in the Yangbajing (YBJ) catchment of the Tibetan Plateau in China, we found that the hydrograph in a year can be separated into five segments, each of which is constituted of two or three dominant recharge sources. Thus, we developed a stepwise EMMA (end-member mixing analysis) method to partition the hydrograph and calculate contributions of water sources to streamflow in each segment of the hydrograph. Results show that the overall contributions of deep and shallow groundwater, melt water from glacier and snowpack, and precipitation are 21.8%, 9.8%, 37.5%, 8.5% and 22.4%, respectively, in a year. Specifically, in the low flow period (January 8 - April 26), streamflow is fed by deep and shallow groundwater (75.2% and 24.8%, respectively). In the early rising period of hydrograph (April 27-June 9) when temperature begins to rise, streamflow fed by deep groundwater decreases and its contribution by snow melt water increases (52.5% and 47.5%, respectively). In the fast-rising period (June 10-June 30), streamflow fed by deep groundwater is minor (4.8%) while snow and glacier melt water becomes the dominant recharge sources to the stream water (52.8% and 42.4%, respectively). In the summer period of July 1- September 23, the streamflow is highest, and the greatest glacier melt water and rainfall contributes to 52.4% and 36% of the stream flow, respectively. In the recession period (September 24 - January 7) when temperature drops and rainfall ceases, streamflow is fed again by deep groundwater and shallow groundwater (45.7% and 54.3%, respectively).

How to cite: Li, G., Chen, X., Gao, M., and Wang, Y.: Identifying contributions of multi- recharge sources to streamflow by using a stepwise approach based on isotopic and hydrochemical signals in a glacierized catchment over Tibetan Plateau, EGU General Assembly 2023, Vienna, Austria, 23–28 Apr 2023, EGU23-2292, https://doi.org/10.5194/egusphere-egu23-2292, 2023.

EGU23-3009 | Posters on site | HS2.2.7

Tracing 36Cl in river water of Eastern Australia 

Dioni I. Cendón, Klaus Wilcken, Stephen J. Harris, Stuart I. Hankin, Mark A. Peterson, and Bryce F.J. Kelly

Chlorine-36, generally expressed as a ratio against stable chlorine (36Cl/Cl x1015), has a half-life of 301 kyr, thus it is a useful tracer for estimating residence time of old groundwater between 50 kyr - 1 Myr. An underutilised use of 36Cl/Cl is as a sensitive tracer of catchment scale processes such as: identifying sources of salinity, weathering, delineating groundwater-surface water interactions, quantifying irrigation infiltration, and identifying anthropogenic inputs.

We highlight the utility of 36Cl/Cl for gleaning insights into regional natural and anthropogenic processes in the Nogoa, Namoi and Murrumbidgee river catchments of eastern Australia. All catchments are within important agricultural regions and are regulated by one or more large reservoirs in their headwaters. The Nogoa River (Lat 23°S) flows east and forms part of the Fitzroy River that meets the Coral Sea near the town of Rockhampton. The Namoi (Lat 30°S) and Murrumbidgee (Lat 35°S) rivers form part of the Murray-Darling Basin and flow westwards (inland) before joining the Darling and Murray Rivers respectively to flow south towards the Southern Ocean. River water was sampled bi-monthly in several stations from the upper to middle reaches of each river during two years between 2017-2020. Sampling took place during drought conditions; 2019 being the driest in ~120 years of instrumental records in many areas. Climatic conditions favoured sampling of baseflow with flows mostly relying on reservoir releases in some cases (Namoi River) until total reservoir and river dryness.

At the ground surface 36Cl can be produced via two main pathways. Typically, the dominant source of 36Cl in surface water is atmospheric, which was produced in the troposphere and stratosphere via interaction of cosmic-ray protons and secondary neutrons with Ar. However, secondary cosmic-ray neutrons can produce 36Cl when they collide with rocks and minerals. These reactions are modulated by the composition of the geological materials and their elevation. The Nogoa and Namoi Rivers have similar basic geological materials in their headwaters at relatively lower altitudes, while the Murrumbidgee has abundant mafic and felsic igneous rocks in the headwaters at higher altitudes.

In general, the Namoi River showed the higher 36Cl/Cl ratios (~650-300) followed by the Murrumbidgee River (~500-200) and the lowest readings were recorded in the Nogoa River (~200-100). These results do not follow simple latitudinal or elevation trends. In this presentation we discuss plausible geological and anthropogenic processes that may account for the observations.

How to cite: Cendón, D. I., Wilcken, K., Harris, S. J., Hankin, S. I., Peterson, M. A., and Kelly, B. F. J.: Tracing 36Cl in river water of Eastern Australia, EGU General Assembly 2023, Vienna, Austria, 23–28 Apr 2023, EGU23-3009, https://doi.org/10.5194/egusphere-egu23-3009, 2023.

Streamwater temperature is an important water quality parameter, and controls metabolic and other reaction processes. In urban systems, streamwater temperature has been shown to depend substantially on the near-stream land cover: Riparian buffer zones may cool urban streams, while effluent from wastewater treatment plants is known to raise streamwater temperatures. Groundwater contributions can decrease summer and increase winter streamwater temperature, essentially acting as a temperature buffer. In consequence, streamwater temperature is highly dependent on the specific layout of the urban system.

Streamwater temperature fluctuates on annual, seasonal, daily, and diurnal basis, however, storm events may additionally impact streamwater temperature on short time scales. The timing and patterns of streamwater temperature responses to storm events relative to the hydrograph may differ from event to event. Because urban infrastructure is typically designed to rapidly route water to the sewer network to avoid flooding, streamwater temperature response patterns are likely related to event- and site-specific water sources contributing to streamflow. Changes in temperature patterns could thus be linked to changes in water release processes. If we disentangle the various empirical relationships revealing potential physical controls on how water is conveyed to streams in urban areas, temperature could potentially be used as a cheap tracer of water sources and pathways in urban systems, which are typically difficult to assess.

We investigated and quantified different streamwater temperature response patterns to stormflow, to understand predictors of diverse streamwater temperature responses to summer storms. We found that streamwater temperature shows varied response patterns to storms, including temperature increases and decreases. Some of the temperature increases may take the shape of rapid “heat pulses”, a short but relatively high magnitude temperature increase and subsequent drop at the start of the hydrograph. Streamwater temperature responses to storms were event-specific and could be clearly linked to event characteristics. Understanding the streamwater temperature response can thus aid in understanding urban source contributions to streamflow, because the mixing of sources – and the timing of this mixing process – causes a unique streamwater temperature pattern. Likely sources contributing to the streamwater temperature patterns are ponded surface waters and storm drains, or cooler water from the shallow subsurface. These findings indicate that streamwater temperature may be used as a cheap but effective tracer informing the contributions from different source zones in urban catchments.

How to cite: Knapp, J. and Kelleher, C.: Hunting for heat pulses: streamwater temperature responses to summer storms as tracer for urban water sources, EGU General Assembly 2023, Vienna, Austria, 23–28 Apr 2023, EGU23-3190, https://doi.org/10.5194/egusphere-egu23-3190, 2023.

EGU23-4596 | ECS | Posters on site | HS2.2.7

Tracer-aided hydrological model in large mountainous catchments 

Yi Nan and Fuqiang Tian

Issues related to large uncertainty and parameter equifinality have posed big challenges for hydrological modeling in cold regions where runoff generation processes are particularly complicated. Tracer-aided hydrological models that integrate the transportation and fractionation processes of water stable isotope are increasingly used to constrain parameter uncertainty and refine the parameterizations of specific hydrological processes in cold regions. However, the common unavailability of site sampling of spatially distributed precipitation isotopes hampers the practical applications of tracer-aided models in large-scale catchments. We explored the utility of precipitation isotope data derived from the isotopic general circulation models (iGCMs) in driving tracer-aided hydrological models in the typical large basins on the Tibetan Plateau (TP). Results indicate that the model driven by iGCM data can simulate the variation of isotope composition in stream water well. Integrating isotope simulation into the hydrological model helps reduce the modeling uncertainty, improve the parameter identifiability, and improve the quantification of the contributions of runoff components to streamflow.

How to cite: Nan, Y. and Tian, F.: Tracer-aided hydrological model in large mountainous catchments, EGU General Assembly 2023, Vienna, Austria, 23–28 Apr 2023, EGU23-4596, https://doi.org/10.5194/egusphere-egu23-4596, 2023.

EGU23-5004 | Posters on site | HS2.2.7

Better considering tracer distribution within boreholes while FVPDM tests 

Serge Brouyère, Nataline Simon, and Pierre Jamin

Characterizing groundwater fluxes is essential in many hydrogeological studies, especially to assess contaminant transport in the subsurface. In this context, the Finite Volume Point Dilution Method (FVPDM) is a single-well experiment consisting in continuously injecting a tracer into a well and monitoring the evolution of the tracer concentration into the same well. A part of the injected tracer is carried out of the well by the groundwater flow and therefore the higher the tracer dilution, the lower the tracer concentration remaining in the well. In such tests, the water within the tested interval has to be continuously mixed using a mixing pump in order to perfectly homogenize the tracer concentration. Yet in practice, when FVPDM are performed in long-screened boreholes or in very permeable aquifers, it can be technically difficult to maintain a mixing important enough so that the tracer concentration is homogenous along the well. In order to assess the effect of non-perfect mixing on FVPDM results, we introduce here a new discrete model that explicitly considers the recirculation flow rate. The mathematical developments are validated using field measurements resulting of FVPDM tests performed under pumping conditions in a high hydraulic conductivity aquifer. Additionally, a sensitivity analysis was performed in order to assess the effect of recirculation flow rate and to define the limits of the FVPDM and the advantages of the discrete model. Results confirm that it is essential to accurately consider the recirculation flow rate when performing FVPDM in the field. Non-perfect mixing occur as soon as the recirculation flow rate applied is not high enough compared to the groundwater flow rate. In this case, the tracer concentration is not uniform with decreasing tracer concentrations along the tested interval. Since the tracer concentration is measured within the recirculation loop (which helps the mixing of the tracer), neglecting the recirculation flow rate during field data interpretation can lead to significantly overestimate groundwater fluxes if the classical analytical solution is applied to interpret tracer concentration evolution. The discrete model introduced here, which was validated through field measurements, can be used instead to properly estimate groundwater fluxes and assess the tracer distribution within the tested interval.

How to cite: Brouyère, S., Simon, N., and Jamin, P.: Better considering tracer distribution within boreholes while FVPDM tests, EGU General Assembly 2023, Vienna, Austria, 23–28 Apr 2023, EGU23-5004, https://doi.org/10.5194/egusphere-egu23-5004, 2023.

EGU23-5166 | ECS | Posters on site | HS2.2.7

Spatial patterns of stable isotopes in precipitation in Switzerland for the use in hydrological and hydrogeological applications 

Valentina Pelzmann, Albrecht Leis, Marc Schuerch, and Christian Reszler

The stable isotopes of the water molecule, oxygen-18 and deuterium, provide an ideal tracer for water movement and offer a broad range of possibilities to study different processes in the water cycle. To be used in hydrological analyses and modelling the isotope data in precipitation as an “input” function has to be known for the particular catchment or point of interest. This paper presents the development and application of a method interpolating – on a monthly basis – stable isotope data in precipitation of the isotope observation network in Switzerland (ISOT), a module of the NAQUA National Groundwater Monitoring. Several influencing variables (e.g., topographical parameters, climate variables) are tested in a multi-regression framework, and the residuals are interpolated by the use of ordinary kriging. The different variants are tested by cross-validation, splitting the sample in two periods. The tests also provide information about regional differences of the interpolation quality in Switzerland, from which recommendations are made to densify the existing network. Maps of oxygen-18 and deuterium in a 500 m raster are delivered for selected months and years. As a further step in this study, for particular measurement sites of groundwater and surface water with known catchments, the “input” function is determined and compared to the measurements to (i) further validate the interpolation method and, (ii) to improve existing hydrological and hydrogeological information about the location of the recharge area and mean travel times. Also, the “input” functions can be used in hydrological modelling of combined water movement and solute transport in water quality studies.

How to cite: Pelzmann, V., Leis, A., Schuerch, M., and Reszler, C.: Spatial patterns of stable isotopes in precipitation in Switzerland for the use in hydrological and hydrogeological applications, EGU General Assembly 2023, Vienna, Austria, 23–28 Apr 2023, EGU23-5166, https://doi.org/10.5194/egusphere-egu23-5166, 2023.

The travel time of precipitation entering a catchment and leaving it as streamflow varies according to the flow paths it takes, with fast travel times posing a high risk to river water quality. However, investigating influences on travel times is challenging due to the complex water flow through heterogeneous landscapes. Recent studies investigated the fraction of streamflow younger than approximately three months (Fyw) using multi-year data (long-term Fyw) or one-year calculation windows to investigate its time-variability (time-variable Fyw). Nonetheless, the influences on time-variable Fyw and the demarcation between long-term and time-variable are not clear yet. Here, we investigated the long-term, the time-variable, and the Fyw derived from an exponential TTD model of nine major catchments in Central Europe and compared them to catchment characteristics and hydrometeorological variables. Additionally, one- to eight-year calculation windows were used and its impact on the variability of time-variable Fyw was investigated. All three methods of estimating Fyw led to similar results, indicating spatial organization of water flow in Central Europe. Spatial analysis further indicated a negative relationship between Fyw and catchment altitude. Contradicting and lacking spatiotemporal relationships to other investigated variables pointed to possibly unknown, region-specific influences on Fyw. With increasing calculation window size, the variability of time-variable Fyw results decreased. Long-term Fyw depended on the method used to define “long-term”, and many time series related factors, beside the actual target of investigation, i.e., catchment water flow, impacted Fyw. This finding points to difficulties in comparability of studies and catchments when using different window sizes, and we thus recommend future studies to calculate long-term Fyw using all data and one- to several-year time-variable Fyw to facilitate comparability.

How to cite: Stockinger, M. and Stumpp, C.: Lessons learned from the spatiotemporal analysis of long-term and time-variable young water fractions of large Central European catchments, EGU General Assembly 2023, Vienna, Austria, 23–28 Apr 2023, EGU23-5400, https://doi.org/10.5194/egusphere-egu23-5400, 2023.

EGU23-5977 | Orals | HS2.2.7

Groundwater Residence Time in Iceland Depicted by Stable Water- and Carbon Isotopes 

Arny Sveinbjornsdottir, Andri Stefánsson, and Stefán Arnórsson

Iceland is young (the oldest rocks ca 16M years) and characterized by active and widespread volcanism, defined along a Neovolcanic rift zone.  More than 90% of the Icelandic bedrock is of basaltic origin. The permeability of the Tertiary lava pile is 1-4*10-14 m2 but for younger geological formations especially within geothermal areas the permeability is several orders of magnitude higher due to active fissures and faults. The deeper crust has however a very low permeability as pores and fissures are filled with secondary minerals.


Due to the high permeability in the upper crust groundwater is often mixed with water components originating from different conditions, of different age and in some cases also affected by water-rock interaction.   Thus groundwater dating is complex and to succeed in estimating groundwater residence time it is of vital importance that interdisciplinary methods are applied to understand the geochemistry, geology and hydrology of a specific groundwater system.


In this presentation an overview of using stable water- and carbon isotopes to estimate groundwater residence time is given. It is demonstrated how stable water isotopes including the second order parameter; deuterium excess, can be used to estimate relative ages. Also how radiocarbon age estimations have successfully been used when comprehensive corrections for “dead carbon” from the bedrock and CO2 gas from the deep crust or mantle are applied together with δ13C to correct for modern carbon of organic origin.

How to cite: Sveinbjornsdottir, A., Stefánsson, A., and Arnórsson, S.: Groundwater Residence Time in Iceland Depicted by Stable Water- and Carbon Isotopes, EGU General Assembly 2023, Vienna, Austria, 23–28 Apr 2023, EGU23-5977, https://doi.org/10.5194/egusphere-egu23-5977, 2023.

Stable isotopes (δ18O) and tritium (3H) are frequently used as tracers in environmental sciences to estimate age distributions of water. However, it has previously been argued that seasonally variable tracers, such as δ18O, generally and systematically fail to detect the tails of water age distributions and therefore substantially underestimate water ages as compared to radioactive tracers, such as 3H. In this study for the Neckar river basin in central Europe and based on a >20-year record of hydrological, δ18O and 3H data, we systematically scrutinized the above postulate together with the potential role of spatial aggregation effects to exacerbate the underestimation of water ages. This was done by comparing water age distributions inferred from δ18O and 3H with a total of 12 different model implementations, including lumped parameter sine-wave (SW) and convolution integral models (CO) as well as integrated hydrological models in combination with SAS-functions (IM-SAS).

We found that, indeed, water ages inferred from δ18O with commonly used SW and CO models are with mean transit times (MTT) ~ 1 – 2 years substantially lower than those obtained from 3H with the same models, reaching MTTs ~ 10 years. In contrast, several implementations of IM-SAS models did not only allow simultaneous representations of stream flow as well as δ18O and 3H stream signals, but water ages inferred from δ18O with these models were with MTTs ~ 16 years much higher than those from SW and CO models and similar to those inferred from 3H, which suggested MTTs ~ 15 years. Characterized by similar parameter posterior distributions, in particular for parameters that control water age, IM-SAS model implementations individually constrained with δ18O or 3H observations, exhibited only limited differences in the magnitudes of water ages in different parts of the models as well as in the temporal variability of TTDs in response to changing wetness conditions. This suggests that both tracers lead to comparable descriptions of how water is routed through the system.  our results provide evidence for a broad equivalence of δ18O and 3H as age tracers for systems characterized by MTTs of at least 15 – 20 years. The question to which degree aggregation of spatial heterogeneity can further adversely affect estimates of water ages remains unresolved as the lumped and distributed implementations of the IM-SAS model provided inconclusive results.

Overall, this study demonstrates that previously reported underestimations of water ages are most likely not a result of the use of δ18O or other seasonally variable tracers per se. Rather, these underestimations can be largely attributed to choices of model approaches and complexity not considering hydrological next to tracer aspects. Given the additional vulnerability of SW and CO model approaches in combination with δ18O to substantially underestimate water ages due to spatial aggregation and potentially other, still unknown effects, we, therefore, advocate avoiding the use of this model type in combination with seasonally variable tracers if possible, and to instead adopt SAS-based or comparable model formulations.

How to cite: Wang, S., Hrachowitz, M., and Schoups, G.: Stable water isotopes and tritium tracers tell the same tale: No evidence for underestimation of catchment transit times inferred by stable isotopes in SAS function models., EGU General Assembly 2023, Vienna, Austria, 23–28 Apr 2023, EGU23-6333, https://doi.org/10.5194/egusphere-egu23-6333, 2023.

EGU23-6934 | ECS | Orals | HS2.2.7

Multi-tracer tests to disentangle mobile-immobile regions in a highly entropic aquifer 

Guglielmo Federico Antonio Brunetti, Christine Stumpp, Carmine Fallico, Gerardo Severino, and Samuele De Bartolo

Anomalous transport processes are frequently observed in radial flow to wells in highly heterogeneous aquifers. This is generally related to the presence of preferential flow pathways that bypass the sediment matrix, thus leading to the formation of fast flow channels, whose magnitude depends on the geological entropy of the system. Tracer tests can be effectively combined with laboratory or field-scale experimental campaigns to understand better the interlinkage between heterogeneity and preferential flow, and to distinguish hydraulically active and inactive regions. Despite considerable past research efforts, these mechanisms are only partially understood. To advance the current understanding, we study transport processes in a laboratory-built highly heterogeneous aquifer under radial flow conditions. The experimental device (200 x 200 x 100 cm) consists of 2527 randomly distributed cells (10 x 10 x 5 cm) of 12 different porous mixtures assembled in 7 layers to form a 35 cm-deep aquifer. This particularly design is intended to maximize the geological entropy of the aquifer, which is equipped with 37 piezometers placed in a radial configuration at different distances from the central (pumping) well. Multiple conservative tracer tests were conducted by injecting a mixture of deuterated water (D2O) and Potassium Bromide (KBr) into different piezometers, and then by analysing the resulting Breakthrough Curves (BTCs) at the central pumping well. BTCs reveals features peculiar of anomalous transport, such as non-symmetry, early peaks and tailing, which depend on the injecting location. This, jointly with the incomplete mass recovery after 48 hours, suggests the simultaneous presence of fast flow in highly conductive regions, which exchange mass with quasi-immobile portions of the aquifer. By dealing with tests individually, it is seen that curves for the two tracers have a similar trend, with almost perfect overlap in the part before the peaks. Differences in the tailing of the BTCs between the two tracers, that exhibit different molecular diffusion coefficients, indicate the importance of diffusion mechanism taking place in the porous matrix.

How to cite: Brunetti, G. F. A., Stumpp, C., Fallico, C., Severino, G., and De Bartolo, S.: Multi-tracer tests to disentangle mobile-immobile regions in a highly entropic aquifer, EGU General Assembly 2023, Vienna, Austria, 23–28 Apr 2023, EGU23-6934, https://doi.org/10.5194/egusphere-egu23-6934, 2023.

Glaciers and permafrost, as core hydrological components of cold regions, are sensitive to climate change and the response in turn affects regional water resources. The ablation of glaciers and permafrost has caused severe environmental problems, including sea level rise, the release of greenhouse gases and further global warming. One poorly understood part that has so far remained underdeveloped is the change natural radioactivity related to ablation processes in cold regions. Radium isotope (223Ra, 224Ra, 226Ra and 228Ra) has been considered as an effective tracer for submarine groundwater discharge into coastal and estuarine environments over years. Unlike the coastal environments, Ra activities and activity ratios seem to show a unique distribution in cold regions. Ra will accumulate with glaciers and permafrost ablation and the activity ratios of 224Ra/228Ra (<1 in cold regions and >1 in coastal regions) indicate that the radioactive equilibrium of short-time Ra isotopes has not yet been reached, which seems to be closely related to glaciers and permafrost thawing. The results of laboratory experiments show that Ra distribution between ice and water will change during freezing, and Ra exchange will occur at the ice-water interface with interaction time increasing. This study aims to explore how natural radioactivity varies in cold regions, and to provide a new tracing method for hydrological investigation in cold regions.

How to cite: Lu, X., Li, L., and Yi, L.: Using radium isotope fingerprinting to trace hydrogeochemistry change and permafrost water cycle in cold regions, EGU General Assembly 2023, Vienna, Austria, 23–28 Apr 2023, EGU23-7578, https://doi.org/10.5194/egusphere-egu23-7578, 2023.

EGU23-8988 | Posters on site | HS2.2.7

Water and nutrient sources in a short stream reach 

Przemyslaw Wachniew, Radosław Szostak, Damian Zięba, and Mirosław Zimnoch

This work stems from several years of research conducted in a medium size lowland catchment of the groundwater-fed Kocinka River in Poland that aimed at quantification of sources and transformations of nitrate pollution. Deconvolution of nitrate sources and transformations at the catchment scale appeared to be difficult because of the mostly diffuse character of groundwater inflows with diverse concentrations of nitrate. Additionally, the hydromorphological characteristics that may affect riverine nutrient cycling change significantly along the river. Therefore, a short, 2.6 km long reach of the upper Kocinka was selected for a more detailed study. This reach is representative of small, channelized streams in urbanized rural areas that receive loads of nutrients and other contaminants from various, often episodic, sources such as farmyard, urban and road runoff, sewage and wastewater disposal, fish ponds. Isotopic compositions of water and nitrate. temperature of water as well as drone-based thermal images were used to characterize sources of streamflow and nitrate. Tracer experiment with tritium and the radioactive phosphorus isotope (32P) provided insights [1] into the significance of transient storage zones in solute transport and the extent of phosphorus removal.

The research has been partially financed from the funds of the "Excellence Initiative - Research University" program at AGH University of Science and Technology.

[1] Zieba, D., & Wachniew, P. (2021). Phosphorus Transport in a Lowland Stream Derived from a Tracer Test with 32P. Water 2021, 13, 1030.


How to cite: Wachniew, P., Szostak, R., Zięba, D., and Zimnoch, M.: Water and nutrient sources in a short stream reach, EGU General Assembly 2023, Vienna, Austria, 23–28 Apr 2023, EGU23-8988, https://doi.org/10.5194/egusphere-egu23-8988, 2023.

EGU23-9031 | ECS | Orals | HS2.2.7 | Highlight

An isotope-enabled modeling approach to track snowmelt and groundwater contribution to runoff and root water uptake in a snow dominated mountainous catchment 

Matthias Sprenger, Syvain Kuppel, Rosemary Carroll, Craig Ulrich, and Kenneth Williams

The snow dominated headwaters of the Colorado River are crucial for the water supply of the south-western US. The current water crisis in the Colorado basin makes understanding runoff processes in mountainous regions more necessary than ever. We present how our observations of stable isotopes of water (2H and 18O) in the precipitation, stream-, soil-, xylem-, and groundwater at the East River in the upper Colorado River, combined with multiple hydrometric datasets since 2014 (multi-location stream gauging, groundwater levels, soil moisture snow water equivalent, and eddy-covariance fluxes), can be used to rigourously contrain and evaluate an ecohydrological modelling tool to then identify the time and location of snowmelt and groundwater subsidies to runoff and plant water use. To this end, we deployed a new version of the spatially-distributed, process-based model EcH2O-iso, with a multi-objective model-data fusion procedure. The simulations notably underline the dominant role of snowmelt as a main driver of runoff generation, through its direct contribution to runoff peak during the late spring snowmelt, and to the groundwater recharge that eventually feeds the significant baseflow contribution in this catchment. Our analysis further explores the use of water ages and numerical tracers to better disentangle these cross-seasons carry-over of water between critical zone compartments.

How to cite: Sprenger, M., Kuppel, S., Carroll, R., Ulrich, C., and Williams, K.: An isotope-enabled modeling approach to track snowmelt and groundwater contribution to runoff and root water uptake in a snow dominated mountainous catchment, EGU General Assembly 2023, Vienna, Austria, 23–28 Apr 2023, EGU23-9031, https://doi.org/10.5194/egusphere-egu23-9031, 2023.

EGU23-9057 | Posters on site | HS2.2.7

Geology controls hydrological regime and spatio-temporal origin of surface and subsurface water in two adjacent mountain catchments in Central Italy 

Francesca Manca di Villahermosa, Marco Dionigi, Marco Donnini, Davide Fronzi, Alberto Tazioli, Andrea Spoloar, Clara Turetta, Davide Cappelletti, Chiara Petroselli, Federica Bruschi, Roberta Selvaggi, Daniele Penna, and Christian Massari

Understanding hydrological flow pathways and spatio-temporal origin of surface and subsurface water in catchments with highly fractured geology is particularly challenging. In this work, we relied on the integration of hydrometric measurements with stable oxygen and hydrogen isotope data in two adjacent catchments in the Sibillini Mountains National Park, Central Italy, to better understand the drivers of the catchment hydrological response and the spatio-temporal origin of stream and spring waters. The Ussita catchment is 44 km2 and its highest elevation is 2204 m a.s.l. The Nera catchment is 110 km2 and its highest peak is 2233 m a.s.l. The two rivers merge at the Visso Village, at 615 m a.s.l.

The area is characterised by heavily fissured and fractured calcareous rocks that foster the occurrence of several springs, some of them of karst origin. Both catchments host a dense hydrometerological network. The experimental apparatus is completed with one piezometer, soil moisture probes at five locations, lysimeters at two depths and four throughfall plots under beeches and oaks. Monthly samples for isotopic analysis are being collected since fall 2020 from precipitation at three different elevations and four locations, the streams at different sections, and four springs in the Nera catchment only.

Preliminary results show a distinct hydrological behaviour in the annual streamflow regimes: the Ussita stream slightly reacts only to the largest storms and during intense snowmelt periods, whereas the Nera stream has a very damped response during all the year, revealing a clear buffer effect of the large subsurface reservoir, facilitated by the highly fractured nature of the geological setting. As expected, there is an elevation and seasonal effect in the isotopic composition of precipitation, although the seasonal effect is partly masked by the exceptionally high temperatures occurred in fall 2021. However, the time series of isotope data in stream water show a damped signal and very low seasonal variability in both streams, matching the observed low variability of streamflow. Only the Ussita catchment shows some more enriched outliers likely reflecting runoff response during large storm events. Interestingly, stream and spring samples from both catchments lie along but also above and below the Local Meteoric Water Line, suggesting that the sampled spring and stream water was either originated i) from precipitation fell, infiltrated, and stored well before the collection of the precipitation samples, and released; ii) and/or from areas outside the topographic catchments, and therefore not adequately characterized by the isotopic signal of sampled precipitation. The isotopic composition of the streams and springs is statistically the same, revealing that spring groundwater is the main component of stream runoff. Moreover, the isotope signature of both springs and streams is much closer to that of winter precipitation rather than summer precipitation indicating a major role of winter precipitation in recharging the catchments, consistently with the precipitation seasonal regime. On-going work is assessing the spatial difference in the isotopic composition and quantifying the temporal origin of stream and spring water of the two catchments.

How to cite: Manca di Villahermosa, F., Dionigi, M., Donnini, M., Fronzi, D., Tazioli, A., Spoloar, A., Turetta, C., Cappelletti, D., Petroselli, C., Bruschi, F., Selvaggi, R., Penna, D., and Massari, C.: Geology controls hydrological regime and spatio-temporal origin of surface and subsurface water in two adjacent mountain catchments in Central Italy, EGU General Assembly 2023, Vienna, Austria, 23–28 Apr 2023, EGU23-9057, https://doi.org/10.5194/egusphere-egu23-9057, 2023.

EGU23-9603 | Orals | HS2.2.7

Geologic and geomorphic setting control of water sources and flow paths in mountainous headwater catchments 

Catalina Segura, Zachary Perry, and Jaime Ortega Melendez

Communities downstream from mountainous regions rely on snowmelt for water supply. As climate change reduces the reliability of the snowpack in these regions it is important to understand how and when rain and melt water are stored and released as runoff. In mountainous regions the prediction of water movement is especially complex because water storage capacity and overall water input magnitude and form vary over short distances given variable geology, geomorphology, and topography. We used water stable isotopes (WSI) and water chemistry (ions and cations) to investigate seasonal water sources and contributions in a 64 km2 headwater mountain catchment in Oregon (USA). In one study, we collected > 1,000 synoptic samples between 2021 and 2022 across different seasons in 12 headwater streams (600–1,200 m in elevation and drainage areas 0.1–5 km2) and analyzed them for WSI. Results demonstrate that despite season there are localized variations in WSI within less than 1-km2 between catchments underlain by similar geology but characterized by different geomorphic history of mass wasting events (landslides and earthflows). We also observed weak relationships between elevation and WSI in some streams suggesting that their sources of baseflow are not directly controlled by seasonal precipitation but by differences in storage over spatially variability geomorphic history.  In a second study, we investigated relative streamflow contributions from five tributaries (0.7–17 km2) over the whole year based on weekly WSI and water chemistry in grab and precipitation samples. We found strong differences across streams; the most interesting was a spring-fed stream, whose water contribution varies widely throughout the year, resembling a snowmelt system (with high relative water input in the summer). The depleted WSI signal and relatively high cations concentrations of this stream reveals higher elevation snowfall is moving to the stream through relatively long flow paths. This stream is underlain by porous lava flows demonstrating a strong geologic control on runoff generation. The contribution of this stream to the whole watershed is over 27 times larger in the summer compared to any other season. This finding challenges the idea of streamflow scaling with drainage area because the effective drainage area of this stream varies between 0.8 and 47 km2 while the topographic derived drainage area is 0.7 km2.

How to cite: Segura, C., Perry, Z., and Ortega Melendez, J.: Geologic and geomorphic setting control of water sources and flow paths in mountainous headwater catchments, EGU General Assembly 2023, Vienna, Austria, 23–28 Apr 2023, EGU23-9603, https://doi.org/10.5194/egusphere-egu23-9603, 2023.

EGU23-9949 | Posters on site | HS2.2.7

Timing of an Alpine water cycle unraveled by water isotopes and age-dating tracers (3H, 3He, 14C, CFCs, SF6 and 222Rn), Eastern Alps, Austria 

Martin Kralik, Daniel Elster, Ramon Holzschuster, and Christine Stumpp

Alpine regions are important as “water towers” in regional water supply of clean groundwaters due to their increased precipitation rates and their unspoiled environment. However, they are often characterised by complex geology structures, covered by down-sliding glacio-fluvial sediments. Groundwater recharge conditions and mean transit times (MTTs) are fundamental components of mountain watershed hydrological systems. Here, we used measurements of stable water isotopes of precipitation, pore water, surface and groundwater. In addition, measurements of environmental age tracers (222Rn, CFCs, 3H, 3He, 4He and 14C) were performed to investigate groundwater MTTs from springs in glacio-limnic sediments (<20 m) and deeper wells (>20 m) located along a mountainous hillslope (1,400-800 m) within the Subersach watershed near Sibratsgfäll, Bregenzer Wald, Austria. The near surface spring waters contain 3H and CFCs in excess. The deeper artesian well samples contain 3H and CFCs, in addition to elevated terrigenic 4He and low 14C values, suggesting a mixture of waters characterised by residence times that are modern (<70 years) and pre-modern (>70 years). We show that binary-mixing MTT models with distinct young and old fractions are needed to explain the full suite of environmental tracers, further supporting the importance of groundwater mixing processes.

The vertical unsaturated infiltration in silt/sand dominated glacio-lacustrine sediments were estimated by seasonal variation of 2H/18O-isotopes in pore-water to be 1-4 m/year approximately. Precipitation in the Flysch dominated area at higher altitudes is transported partly as mountain bloc recharge and ascends into the glacial sediments, indicated by temperatures 2-3° C higher than the mean surface temperature. The MTTs of the shallow groundwater (<20 m) estimated by a combination of isotopes 2H/18O, 3H/3He, 13C/14C and tracer gases (CFC, SF6) indicate ages between some months and 4 years. Radon measurements identify springs supplied by very young drainage or surface waters. Deeper (>20 m) artesian wells in the western part are dominated by MTT older than 70 years.

The research project “Understanding of Extreme Climatological Impacts from Hydrogeological 4D Modelling” (EXTRIG) was funded by the Austrian Academy of Sciences.

How to cite: Kralik, M., Elster, D., Holzschuster, R., and Stumpp, C.: Timing of an Alpine water cycle unraveled by water isotopes and age-dating tracers (3H, 3He, 14C, CFCs, SF6 and 222Rn), Eastern Alps, Austria, EGU General Assembly 2023, Vienna, Austria, 23–28 Apr 2023, EGU23-9949, https://doi.org/10.5194/egusphere-egu23-9949, 2023.

EGU23-10782 | ECS | Orals | HS2.2.7

Characterizing landscape influences on hydrological flow pathways in a peri-urban Mediterranean catchment 

Amanda Carneiro Marques, Carla Sofia Santos Ferreira, Núria Martínez-Carreras, Zahra Kalantari, and Christian David Guzman

Stable isotopes are an important tool to describe the movement of water through the hydrosphere. They are used as tracers to characterize hydrograph properties. In field studies, stable isotope analyses using hourly and bulk end-member calculations can be used to estimate baseflow/precipitation contributions and to relate hydrograph response to land cover across a watershed. To enable proper planning of paved surface expansions and the nature of storm drainage systems, advanced understanding of the influences of spatial land-use patterns on Mediterranean streamflow regimes are needed to support water management in peri-urban catchments. This study focuses on Ribeira dos Covões, a small peri-urban catchment (around 6 km2), located in central continental Portugal. The catchment is composed of sandstone in the west portion (56%) and limestone in the east portion (41%), with some alluvial deposits (3%) in the main valleys. Flow and precipitation data were collected every five minutes during storms for several years. In 2018, sampling campaigns also included the collection of pre-event, event, and post-event water stable isotopes in different seasons of the year for streamflow at four sites, representing distinct land coverage and lithological landscape combinations. Preliminary results using precipitation and baseflow fraction calculations based on oxygen-18 measurements show that the catchment outlet provides a 49% baseflow contribution (old water fraction) at the beginning of the dry season and 36% in the wet season. An 85% baseflow contribution was estimated for Quinta (mainly forest area in sandstone) during the dry season, and 64-74% for Espírito Santo (largely urban in sandstone) during the wet season. The baseflow contribution at Porto Bordalo (urban area in limestone) is not significant because the flow is controlled by precipitation. Further investigation will involve connecting the results of most recent stable isotope data analyses to the approaches that were used in the past (e.g. separation of baseflow based on low-pass digital filters). Such connection will clarify streamflow response from distinct peri-urban pattern and lithological landscape combinations and their contributions to catchment runoff, aiming to explore the similarities and differences among these methods and quantify the effects of hydrological regime and land use changing patterns over time.

How to cite: Carneiro Marques, A., Ferreira, C. S. S., Martínez-Carreras, N., Kalantari, Z., and Guzman, C. D.: Characterizing landscape influences on hydrological flow pathways in a peri-urban Mediterranean catchment, EGU General Assembly 2023, Vienna, Austria, 23–28 Apr 2023, EGU23-10782, https://doi.org/10.5194/egusphere-egu23-10782, 2023.

EGU23-10980 | Posters on site | HS2.2.7

A multi-well tracer test for characterizing the preferential flow of the shallow aquifers in the Tatun Volcanic Area 

Pei-Yun Tseng, Yi-Ling Chen, and Ching-Huei kuo

A multi-well tracer test was conducted in a volcanic area where is mainly composed of sedimentary rocks units and tuff breccia with attitude of the N46E, 18S. in Northern Taiwan. The distance between the injection well #14 and monitoring wells #-2 and #6 are 236 and 682 m, respectively.

A Bimodal breakthrough curve was received from both wells indicating the existence of more than one channel in the system. Surprisingly, the first peak arrives simultaneously at both wells with almost a 3 times difference in distance. A much fast flow between Well #14 and #6 was found. This result matches the local orientation of the formation and may show strong geology control groundwater flow of the region resulting in a preferential flow. With the moment analysis, the difference in communication between the injection well and the two monitoring wells can be depicted by 50% of the flow circulation coming from 25% and 30% storage capacity for Well #2 and Well #6, respectively implying that groundwater flows through more fractures between Well #14 and 6.  An obvious tailing breakthrough curve of Well #6 also reflects more fractures than that of Well #2.

How to cite: Tseng, P.-Y., Chen, Y.-L., and kuo, C.-H.: A multi-well tracer test for characterizing the preferential flow of the shallow aquifers in the Tatun Volcanic Area, EGU General Assembly 2023, Vienna, Austria, 23–28 Apr 2023, EGU23-10980, https://doi.org/10.5194/egusphere-egu23-10980, 2023.

Stable isotopes, δ2H and δ18O, of precipitation and groundwater in two adjacent catchments, the north, and south, in the Tatun Volcanic Group, Taiwan were used to characterize the regional groundwater. The results show that the isotopic composition of precipitation exhibits seasonal variations, which suggests different sources of moisture generation for the rainfall in the study area. In general, the north catchment shows more enriched isotopic characteristics than that of the south one.  

The seasonal variations of precipitation, with lighter in summer, arise from changes in isotopic water vapor composition associated with the seasonal activity of the Asian monsoon which was used in estimating the mean residence time (MRT) of groundwater in the region. The preliminary results show that the average MRT of the study area ranges from 180 to 500 days in the north catchment while it is 180 to 900 days in the south catchment.

How to cite: Chen, Y.-L. and Kuo, C.-H.: Using stable isotopes and mean residence time to characterize the groundwater system in the Tatun Volcanic Group, Taiwan, EGU General Assembly 2023, Vienna, Austria, 23–28 Apr 2023, EGU23-11069, https://doi.org/10.5194/egusphere-egu23-11069, 2023.

EGU23-11080 | Posters on site | HS2.2.7

Tracer test for evaluating the shallow groundwater flow in a volcanic area, Taiwan 

Ching-Huei kuo, Pei-Yun Tseng, and Yi-Ling Chen

A tracer test, involving conservative and reactive, was conducted in a volcanic area in Northern Taiwan to evaluate shallow groundwater characteristics. The distance between injection Well #14 and monitoring Wells #2 and #6 are 236 and 682 m, respectively.

  A breakthrough curve was received from both wells for conservative tracer, 2,6NDS, while the reactive one was obtained only at Well#6 indicating the existence of heterogeneity in groundwater and fracture distribution in the region.  A much fast flow between Well#14 and #6 was found as the first peak arrives at the same time with a 3 times difference in distance.  This result matches the local orientation of the formation and may show strong geology control groundwater flow of the region resulting in a preferential flow. However, a chaser influence was identified by an irregularity of breakthrough curves for both wells.

How to cite: kuo, C.-H., Tseng, P.-Y., and Chen, Y.-L.: Tracer test for evaluating the shallow groundwater flow in a volcanic area, Taiwan, EGU General Assembly 2023, Vienna, Austria, 23–28 Apr 2023, EGU23-11080, https://doi.org/10.5194/egusphere-egu23-11080, 2023.

EGU23-11098 | Posters on site | HS2.2.7

Efficacy of Halon-1301 as an age tracer - Multi-tracer evaluation in Shimabara springs 

Makoto Kagabu, Shinsuke Kojima, and Miku Ishibashi

For sustainable use and management of local water resources, it is essential to clarify the groundwater flow system and its scale, and one of the effective methods is to estimate the residence time. One of the methods to clarify the residence time is to use "age tracers", which are mainly used for chlorofluorocarbons (CFCs) and sulfur hexafluoride (SF6) in Japan. Since each tracer has its own advantages and disadvantages, a combination of several tracers is necessary to improve the accuracy of the estimated residence time, and the development of new age tracers is required. Overseas studies such as Beyer et al. (2014) have begun to report the application of Halon-1301 as a new age tracer, but there are no such reports in Japan. Therefore, we evaluated the applicability of the Halon-1301 method in Japan by evaluating the residence time of five of the Shimabara springs in Shimabara City, Nagasaki Prefecture, using multiple age tracers.

How to cite: Kagabu, M., Kojima, S., and Ishibashi, M.: Efficacy of Halon-1301 as an age tracer - Multi-tracer evaluation in Shimabara springs, EGU General Assembly 2023, Vienna, Austria, 23–28 Apr 2023, EGU23-11098, https://doi.org/10.5194/egusphere-egu23-11098, 2023.

EGU23-12064 | ECS | Posters on site | HS2.2.7

Evaluation of the mechanism of residence time change of Shimabara springs based on high frequency water sampling survey 

Miku Ishibashi, Koichi Sakakibara, and Makoto Kagabu

It is essential to clarify the groundwater flow system and its scale for the sustainable use and management of local water resources. One effective method is to estimate the residence time of groundwater. The Shimabara springs exist in Nagasaki Prefecture, Japan, and its water quality has been characterized over time. However, there have been few studies on water quality characteristics and isotope variations with fine resolution in a region such as Japan, where seasonal changes in precipitation are observed. Therefore, we conducted periodic water sampling at five locations in the Shimabara Springs at a frequency of about once a month, and evaluated water quality characteristics and isotope variations. CFC-12, an age dating tracer, was also used for a multifaceted study. During the observation period, we observed precipitation that was more than five times larger than the normal year, and in response to this, we were able to identify springs that showed changes in various hydrologic parameters. In the presentation, we will discuss the relationship between precipitation, residence time, and water quality, and present a schematic diagram of the mechanism of this spring discharge.

How to cite: Ishibashi, M., Sakakibara, K., and Kagabu, M.: Evaluation of the mechanism of residence time change of Shimabara springs based on high frequency water sampling survey, EGU General Assembly 2023, Vienna, Austria, 23–28 Apr 2023, EGU23-12064, https://doi.org/10.5194/egusphere-egu23-12064, 2023.

EGU23-12174 | Orals | HS2.2.7

Performance of the Picarro CRDS water isotope analyzer for δ2H tracer studies 

Magdalena E. G. Hofmann, Joyeeta Bhattacharya, Jan Woźniak, Jinshu Yan, and Ruthger van Zwieten

The Picarro water isotope analyzers (L2130-i/L2140-i) have become a standard technique to measure the natural abundance of δ18O, δ2H and 17O-excess of water isotopes in climate, environment, and hydrological studies. In addition, some applications require to measure highly enriched δ2H water isotope samples, e.g., when tracing water flows in hydrology. In this case, the 2H/1H ratio is used as a tracer when fluorescent tracers are not an option, e.g., when tracing drinking water.

Measuring highly enriched water samples with optical spectroscopy comes along with two challenges: (i) the memory effect, the carryover from small fractions of water from one sample to another, and (ii) the spectroscopic limits of the analyzer. Here, we address both challenges by characterizing the memory effect for highly enriched δ2H samples considering the recently developed express mode that allows to reduce/remove the memory effect at a much faster rate compared to the standard mode [1, 2] and by reviewing the spectroscopic limits of the analyzer.

In this study, we tested the performance of the Picarro L2130-i water isotope analyzer for a set of samples with varying 2H/1H ratios of 0.1 to 2.0% (corresponding to δ2H values of about 6,000 to 130,000‰). We found that (i) the analyzer shows an excellent linearity over a high δ2H enrichment range (up to 130,000‰); (ii) the analyzer shows a negligible concentration dependence at high enrichment levels; (iii) the spectroscopic limits of the analyzer can be extended by reducing the injection volume (<1.8uL); (iv) the memory effect can be reduced significantly when using the express mode compared to the standard mode.

Our results show that the Picarro L2130-i water isotope analyzer is an adequate tool for measuring highly enriched δ2H water samples, and we will discuss best practices when measuring these samples.  


References

[1] Hofmann, M. E. G., Lin, Z., Woźniak, J., and Drori, K.: Improved throughput for δ18O and δD measurements of water with Cavity Ring-Down Spectroscopy, EGU General Assembly 2021, online, 19–30 Apr 2021, EGU21-14254, https://doi.org/10.5194/egusphere-egu21-14254, 2021.

[2] Landais, A., Minster, B., Zuhr, A., Hofmann, M., and Fourré, E.: Performances of express mode vs standard mode for δ18O, δD and 17O-excess with a Picarro analyzer, EGU General Assembly 2022, Vienna, Austria, 23–27 May 2022, EGU22-4278, https://doi.org/10.5194/egusphere-egu22-4278, 2022.

How to cite: Hofmann, M. E. G., Bhattacharya, J., Woźniak, J., Yan, J., and van Zwieten, R.: Performance of the Picarro CRDS water isotope analyzer for δ2H tracer studies, EGU General Assembly 2023, Vienna, Austria, 23–28 Apr 2023, EGU23-12174, https://doi.org/10.5194/egusphere-egu23-12174, 2023.

EGU23-12668 | Orals | HS2.2.7

Testing a conceptual model of runoff generation processes for a small pre-alpine catchment with tracer data 

Giulia Zuecco, Chiara Marchina, Ylenia Gelmini, Daniele Penna, Marco Borga, and Ilja van Meerveld

Conceptual models of catchment hydrological functioning are crucial to understand and predict runoff and the tracer responses during rainfall events, and thus for sound water resources management and pollution mitigation measures. In this study, we use hydrometric and tracer data (stable isotopes, major ions and electrical conductivity (EC)) collected in the Ressi catchment, a 2-ha watershed in the Italian pre-Alps, to test our existing conceptual model of runoff generation mechanisms. This model was based on previous hydrometric measurements and isotope data for selected events and highlights the importance of precipitation and antecedent conditions for hillslope-riparian zone-stream connectivity. More specifically, we determined if the temporal variability in the concentration-discharge relations can be explained by event characteristics, i.e., rainfall event size, intensity, and antecedent moisture conditions.

The Ressi catchment is characterized by high seasonality in runoff response, due to the seasonality in rainfall (high in fall) and evapotranspiration (high in summer). Discharge and rainfall have been measured continuously since August 2012. Stream water, precipitation, shallow groundwater and soil water samples were collected for tracer analyses during 20 rainfall-runoff events between September 2015 and August 2018. All samples were analyzed for EC, isotopic composition (2H and 18O) and major ion concentrations. To investigate the possible controls on the concentration-discharge relations, we determined the main event characteristics (e.g., total event rainfall, rainfall intensity, antecedent soil moisture and depth to water table, runoff coefficient) for each event.

Based on previous applications of isotope- and EC-based hydrograph separation in the Ressi catchment, we expected different dynamics of the major ions in stream water, depending on the magnitude of the rainfall-runoff events. For all major ions, we hypothesized a dilution effect, and a more marked response for large, long duration events with wet antecedent conditions. The temporal dynamics of calcium, magnesium, sodium and sulfate concentrations confirmed our hypotheses. On the contrary, nitrate, potassium and chloride concentrations sometimes increased at the onset of the event, before a later dilution. These temporal dynamics led to complex hysteretic relations with discharge that could not be explained by the event characteristics. We attribute the rapid increase in the concentrations of these solutes to a quick flushing from the dry parts of the stream channel and the near surface-soil layers of the riparian zone at the onset of the event. The revised conceptual model for the geochemical response of this catchment should, therefore, include a rapid flow pathway that leads to the mobilization of nitrate, chloride and potassium ions, and describe the rapid establishment of hydrological connectivity along the streambed and the near-channel zones.


Keywords: concentration-discharge relation; major ions; electrical conductivity; stable isotopes; hysteresis; forested catchment.

How to cite: Zuecco, G., Marchina, C., Gelmini, Y., Penna, D., Borga, M., and van Meerveld, I.: Testing a conceptual model of runoff generation processes for a small pre-alpine catchment with tracer data, EGU General Assembly 2023, Vienna, Austria, 23–28 Apr 2023, EGU23-12668, https://doi.org/10.5194/egusphere-egu23-12668, 2023.

EGU23-12966 | ECS | Posters on site | HS2.2.7

Groundwater Flow System in Klang River Watershed, Kuala Lumpur, Malaysia 

Mariko Saito, Maki Tsujimura, Norsyafina Roslan, Kamarudin Samuding, Faizah Che Ros, and Ismail Yusoff

This study aims to clarify the groundwater recharge and flow processes in a basin located in a tropical humid area with a complex geological setting. We conducted intensive sampling campaigns for river water and groundwater during three different time periods in the relatively dry season (September 2019, January-March 2020, and August-September 2022). The 40 river water samples and 25 groundwater samples were taken from the upper-stream area with an altitude of 527 m to the downstream area with an altitude of 10 m. The oxygen-18 (δ18O) and deuterium stable isotopic compositions and inorganic constituent concentrations were determined on all water samples. We also used the monthly stable isotopic compositions in rainwater observed at a location with an altitude of 26 m, 15 km apart from the Klang River basin, by the Global Network of Isotopes in Precipitation database (GNIP), IAEA. These chemical compositions were used as tracers to investigate the groundwater recharge and flow system. The deep groundwater shows a lower δ18O than the volume-weighted mean of rainwater and higher ion concentrations, whereas the shallow groundwater shows a higher δ18O and lower ion concentrations. This suggests that the deep groundwater with low δ18O seems to be recharged in the mountainous area with an altitude ranging from 70 to 1421 m. Additionally, we conducted a principal component analysis and cluster analysis using inorganic constituent concentrations and stable isotopic compositions, showing that the deep and shallow groundwater samples are classified into two groups. This shows that the deep groundwater in the downstream area is recharged mainly in the mountainous areas with the highest altitude of 1421 m, and the shallow groundwater is recharged partly in the hilly areas with the highest altitude of 250 m. We believe our study serves new findings on the groundwater flow system in mega-cities of tropical climate regions.

How to cite: Saito, M., Tsujimura, M., Roslan, N., Samuding, K., Che Ros, F., and Yusoff, I.: Groundwater Flow System in Klang River Watershed, Kuala Lumpur, Malaysia, EGU General Assembly 2023, Vienna, Austria, 23–28 Apr 2023, EGU23-12966, https://doi.org/10.5194/egusphere-egu23-12966, 2023.

EGU23-12983 | ECS | Posters on site | HS2.2.7

River influence on groundwater – head changes vs. chemical changes 

Johannes Christoph Haas, Alice Retter, Steffen Birk, Heike Brielmann, and Christine Stumpp

High correlations between river stages and groundwater levels are often seen as an indicator of surface water influence on groundwater. However, such a simple correlation does not necessarily provide information about the nature of said influence, i.e. whether the groundwater hydraulic head only follows the changes in river level or if there is also significant inflow of surface water into the aquifer.

In two large sampling campaigns (early summer and late autumn) covering 45 groundwater and 11 river sites stretching from the alpine region to the foreland basins of the Mur river, Austria using surface water-borne wastewater indicators, stable isotopes of water and selected microbial indicators [1], we show that the influence of surface water intrusion into the shallow aquifer often can be traced hundreds of meters away from the river. Still, at some wells in close vicinity to the river (< 50m) with high correlation of water levels (R > 0.9), isotope data and wastewater indicators hint at no direct surface water influence.

However, one could argue that even at these locations it is plausible that a flood event in the river might reverse flow temporarily, signs of which will not be found by irregular sampling at an inappropriate temporal scale, as the river-borne substances will be quickly flushed out of the shallow aquifer due to the generally effluent conditions. Operating a high-resolution UV-Vis sensor, monitoring nitrate and other key components, we show that direct river influence in the given case still is unlikely.

[1] https://doi.org/10.5194/egusphere-egu21-13111

How to cite: Haas, J. C., Retter, A., Birk, S., Brielmann, H., and Stumpp, C.: River influence on groundwater – head changes vs. chemical changes, EGU General Assembly 2023, Vienna, Austria, 23–28 Apr 2023, EGU23-12983, https://doi.org/10.5194/egusphere-egu23-12983, 2023.

EGU23-13138 | ECS | Orals | HS2.2.7

Transient effect on groundwater age distribution – age measurements disprove steady state assumption 

Tamara Kolbe, Jean Marçais, Virginie Vergnaud, Barbara Yvard, Alejandro Chamorro, and Kevin Bishop

Groundwater ages are key indicators for flow and transport processes as well anthropogenic and geogenic solutes that impact groundwater quality. Commonly, lumped parameter models (LPMs) are applied to interpret environmental tracers, like chlorofluorocarbons (CFCs) or tritium. LPMs require a steady state assumption and they are less complex, computational demanding and data intensive compared to transient numerical models. But when steady-state assumptions are valid for groundwater age simulations is questionable.

An initial sampling campaign of CFCs measured in 9 wells at different depths on a 0.47 km2 subcatchment of the Krycklan catchment in 2017 revealed a groundwater age stratification with depth that was representative for the area1. Mean groundwater ages at the water table (2-6 meters depth) in the unconsolidated till overburden were already 30 years and increased with depth to the deepest sampling at 30 meters. These results indicate a lag of rejuvenation caused by a subsurface discharge zone that evolves between two soils types with different hydrogeological properties. The comparison of the steady-state numerical simulation and LPM has proven that the LPM yields an overall recharge rate and estimation of the extent of the subsurface discharge zone.  Seasonal changes of recharge were not expected to impact the age stratification. But repeated sampling in 2021 and 2022 has shown a clear shift of the groundwater age stratification. Numerical modeling is used to understand that transient effect.


References:

1Kolbe, T, Marçais, J, de Dreuzy, J-R, Labasque, T, Bishop, K. Lagged rejuvenation of groundwater indicates internal flow structures and hydrological connectivity. Hydrological Processes. 2020; 34: 2176– 2189. https://doi.org/10.1002/hyp.13753


How to cite: Kolbe, T., Marçais, J., Vergnaud, V., Yvard, B., Chamorro, A., and Bishop, K.: Transient effect on groundwater age distribution – age measurements disprove steady state assumption, EGU General Assembly 2023, Vienna, Austria, 23–28 Apr 2023, EGU23-13138, https://doi.org/10.5194/egusphere-egu23-13138, 2023.

EGU23-13279 | Posters on site | HS2.2.7

River and Groundwater Interaction in the mid-stream area of Tama River, Tokyo, Japan 

Taiga Suzuki, Maki Tsujimura, Keisuke Sato, Hiroko Asakura, and Kosuke Nagano

This study aims to evaluate a role of Tama river in groundwater recharge by using multi-tracer approach and statistical analysis in a mid-stream area of Tama River, western Tokyo.


We performed an intensive sampling of river water, groundwater and spring water in the mid-stream area of Tama River watershed including tributaries, Akikawa River and Asakawa River from May through September 2022, and totally 21 of river water, 35 of groundwater and 17 of spring water were sampled, and stable isotopic compositions (δ2H, δ18O), inorganic constituent concentrations were determined on all water samples.


The d18O of Tama River water increases with flow especially after joining of the tributaries. The chemistry of Tama River, shallow groundwater and the spring water is characterized dominantly by Ca-HCO3 type, whereas the deep groundwater shows a Na-HCO3 or Na-Ca-Mg-HCO3 type dominantly.


We applied End Member Mixing Analysis to estimate the contribution ratio of Tama River water to the shallow groundwater in the mid-stream area using d18O and SiO2 as tracers, and we selected the volume weighted mean of precipitation, mean of Tama river water and the groundwater taken in the border between mountain and plain area. The contribution ratio of river water to the total groundwater recharge ranges from 21% to 83%.


Also, we performed a principal component analysis using all analyzed components to evaluate the category of the water chemistry considering the river water and the groundwater interaction. Further, we conducted hierarchical clustering analysis using PCA results.


Consequently, the all of water samples are classified in 6 groups, and the shallow groundwater is categorized in the same group as the river water.


The results show clearly that the Tama River water contributes dominantly to the shallow groundwater in the mid-stream area, and the river water partly recharges the deep groundwater. It seems to be due to the decline of the major aquifers from south-west to north east directions, which is from river to mid-stream plain area.

How to cite: Suzuki, T., Tsujimura, M., Sato, K., Asakura, H., and Nagano, K.: River and Groundwater Interaction in the mid-stream area of Tama River, Tokyo, Japan, EGU General Assembly 2023, Vienna, Austria, 23–28 Apr 2023, EGU23-13279, https://doi.org/10.5194/egusphere-egu23-13279, 2023.

EGU23-13281 | ECS | Posters on site | HS2.2.7

Drivers and controls of greenhouse gas dynamics in subarctic, alpine catchments 

Andrea L. Popp, Nicolas Valiente Parra, Kristoffer Aalstad, Sigrid Trier Kjær, Norbert Pirk, Alexander Eiler, Peter Dörsch, Dag Olav Hessen, and Lena Merete Tallaksen

Headwater catchments are known to substantially contribute to global carbon and nitrogen cycles through transport, storage, and direct emissions of greenhouse gases (GHGs). Despite extensive research on GHG dynamics in headwater systems, their drivers and controls remain elusive, particularly in cold region environments that are undergoing rapid transformations. Cryospheric changes, such as alterations in snowpack mass, are known to be strongly coupled with the hydrological cycle. However, we have limited insight into the nexus between snow cover changes, source water contributions (e.g., groundwater and glacial meltwater) to surface waters and associated biogeochemical cycling. 

To better understand the hydrological and biogeochemical changes in cold regions, we obtained field- and satellite-derived data from two sub-arctic catchments (one glaciated, one non-glaciated) in the north-western part of the Hardangervidda mountain plateau (South Central Norway). With this work, we aim to obtain an improved understanding of the impact of snow cover on GHGs dynamics in high-latitude, alpine catchments. During late summers in 2020 and 2021, we analysed various water sources including streams, lakes, groundwater, snow and ice for environmental tracers (major ions, stable water isotopes, radon-222) and GHGs  (CO2, CH4 and N2O). The combination of environmental tracer data with a Bayesian end-member mixing model allowed us to partition water source contributions to streams and lakes. To estimate snow cover anomalies between 2020 and 2021 compared to a five-year mean, we retrieved fractional snow cover durations (FSCDs) from 2016 to 2021 by applying a spectral unmixing algorithm to merged Sentinel-2 and Landsat 8 imagery over Finse. 

According to the satellite-derived data, 2020 was exceptionally snow-rich, while 2021 was a normal year. Our results indicate that GHG saturations distinctively differ among different water sources (e.g., lakes and streams), of which most are supersaturated. Thus, surface waters act as net sources for GHGs to the atmosphere, at least for the time windows of our sampling campaigns. Gas saturations distinctively differed between the glaciated and the non-glaciated catchments as well as between snow-rich and normal snow conditions. Groundwater is the most CO2 and CH4 supersaturated water source. However, groundwater only marginally contributed to surface waters and is thus not a major driver of GHGs emissions. Consequently, we hypothesise that snow cover, glacial meltwater, and resulting differences in subsurface water routing control GHGs dynamics at our study site. These findings provide new insights into the linkage between snow cover and the associated different hydrologic conditions and GHGs dynamics in high-latitude and alpine inland waters. 

How to cite: Popp, A. L., Valiente Parra, N., Aalstad, K., Trier Kjær, S., Pirk, N., Eiler, A., Dörsch, P., Hessen, D. O., and Tallaksen, L. M.: Drivers and controls of greenhouse gas dynamics in subarctic, alpine catchments, EGU General Assembly 2023, Vienna, Austria, 23–28 Apr 2023, EGU23-13281, https://doi.org/10.5194/egusphere-egu23-13281, 2023.

EGU23-13510 | ECS | Posters on site | HS2.2.7

Comparison of Runoff characteristics in bare and vegetated headwater catchments, Northern Alps, Japan 

Mayu Fujino, Koich Sakakibara, Maki Tsujimura, and Keisuke Suzuki

We evaluated an effect of alpine vegetation on water storage and runoff characteristics in alpine zones. We sampled rainwater, snowmelt water and runoff water from bare and vegetated catchments in August and October 2019 in headwater catchment of Mt. Norikura, Japan. We compared the water chemistry of runoff water from bare catchments and vegetated catchments. The pH, electrical conductivity and total dissolved ion concentrations of runoff water from vegetated catchments were higher than those from bare catchments, suggesting a longer contact time between water and the regolith in the vegetated catchments. We also applied two-component hydrograph separation to calculate the contribution of precipitation and groundwater components to the runoff water. The contribution of groundwater component to runoff water ranged from 0.8% to 63.8% in the vegetated catchments, whereas that ranged from 0.3% to 14.6% in the bare catchments. Furthermore, the groundwater contribution was higher in the area with vegetation predominantly over the bare area in each catchment. This suggests that the runoff water has longer transit time in the vegetated areas than the bare areas. In the vegetated areas, the subsurface water should flow with longer transit time due to an existence of well-developed regolith with coarse-grained sediments as compared with that in bare areas. Thus, the alpine vegetated area has a higher water storage function than the bare area. Our results show that we need to consider the vegetation and regolith conditions and subsurface flow processes to the hydrological processes in mountainous areas, especially in alpine zones.

How to cite: Fujino, M., Sakakibara, K., Tsujimura, M., and Suzuki, K.: Comparison of Runoff characteristics in bare and vegetated headwater catchments, Northern Alps, Japan, EGU General Assembly 2023, Vienna, Austria, 23–28 Apr 2023, EGU23-13510, https://doi.org/10.5194/egusphere-egu23-13510, 2023.

EGU23-13702 | ECS | Posters on site | HS2.2.7

New estimation to the turnover time of Lake Ohrid: an environmental isotope and noble gas study 

Marianna Túri, Marjan Temovski, Gabriella Ilona Kiss, István Csige, and László Palcsu

We present noble gas composition and environmental isotope signature (δ18O, δ2H, δ15NNO3-, 3H) of waters sampled from Lake Ohrid. The lake is one of Europe's deepest (max. depth ~288 m) and oldest lake, situated in southeastern part of the continent at the border between Albania and North Macedonia.

The sampling campaign was in the summer of 2017, when 100 water samples were taken from 19 depth profiles (at depths of 5 m, 25 m, 50 m, 100 m, 150 m, 200 m and 250 m) for water stable isotopes, noble gases, and tritium. Samples for δ15NNO3- measurement of nitrate were collected at 7 m and 27 m depth.

Lake Ohrid, situated between Galičica Mt. to the east and Jablanica and Mokra Mts to the west, is a large (surface area ~350 km2), oligotrophic, and one of the most voluminous lakes (~55 km3) and together with Lake Prespa represents the biggest water system in the Balkan region. Numerous studies have been carried out on the hydraulic connection between the two lakes using stable isotopes and hydrological modelling. The water balance of Lake Ohrid is dominated by inflow from karst aquifers, direct precipitation and with slightly smaller shares from river runoff. Lake Ohrid is strongly influenced by karstic springs, adjacent to large part of the coastline, sub-aquatic as well as surface springs which are particularly cool, clean and oxygen-rich inflowing water. The springs are fed by aquifers that are recharged from precipitation and, along the eastern shoreline, also by Lake Prespa.

The lake sediment covers a record of the last 1.5 million years. To better understand the link between the atmosphere and the sediment, our goal is to estimate the water turnover time of Lake Ohrid and to give an isotopic overview about the lake system. Our measured stable isotope data provide background information about hydrogen and oxygen isotope variability of the lake. The stable isotope results together with tritium data present a prospect for estimating evaporation and mixing proportions. The noble gas results detail the layers of the estimated mixing processes. Nitrogen stable isotope data provides additional information about the locality and the type of potential pollution sources.

How to cite: Túri, M., Temovski, M., Kiss, G. I., Csige, I., and Palcsu, L.: New estimation to the turnover time of Lake Ohrid: an environmental isotope and noble gas study, EGU General Assembly 2023, Vienna, Austria, 23–28 Apr 2023, EGU23-13702, https://doi.org/10.5194/egusphere-egu23-13702, 2023.

EGU23-13728 | Orals | HS2.2.7

Groundwater flow system as determined by multi-tracer approach in Tokyo Metropolitan area, Japan 

Maki Tsujimura, Kosuke Nagano, Keisuke Sato, Taiga Suzuki, and Hiroko Asakura

We performed an intensive monitoring and sampling of groundwater in Tokyo Metropolitan area to investigate the groundwater flow system from upland to lowland areas. We took 83 groundwater samples at 39 locations, 25 stream water samples, 7 spring water samples from August 2018 through June 2021. We also observed the spatial distribution of hydraulic head in the groundwater. The stable isotopic composition of oxygen 18 and deuterium, SF6 concentration, and solute ions concentrations were determined on all water samples.

The SF6 age of groundwater in the upland area ranges from a few years to 40 years, whereas that in the lowland area ranges from 40 years to more than 80 years. The solute concentrations are characterized by Ca-HCO3 type in the upland, whereas that is categorized in Na-HCO3 or Na-Cl type. In addition, d18O of the groundwater in the upland ranges from -10.4 per mil to -8.8 per mil, whereas that in the lowland ranges from -9 per mil to -8 per mil.

The hydraulic head distribution shows that the unconfined groundwater flows from west to east directions in parallel with the topographical surface, and the confined groundwater flows from south-west toward north-east directions in parallel with the bedrock surface topography.

The results show that the groundwater flows from west toward east directions across the border of the upland and the lowland, and it flows across the boundary of the aquifers, meaning the unconfined groundwater recharges the confined groundwater in an area where a certain amount of unconfined groundwater is pumped up.

How to cite: Tsujimura, M., Nagano, K., Sato, K., Suzuki, T., and Asakura, H.: Groundwater flow system as determined by multi-tracer approach in Tokyo Metropolitan area, Japan, EGU General Assembly 2023, Vienna, Austria, 23–28 Apr 2023, EGU23-13728, https://doi.org/10.5194/egusphere-egu23-13728, 2023.

EGU23-14005 | Posters on site | HS2.2.7

Quantifying changes in stream-landscape connectivity: combining high-resolution data of non-perennial streams and environmental tracers 

Jana von Freyberg, Izabela Bujak, Andrea Rinaldo, and Ilja van Meerveld

Changes in hydrologic connectivity between streams and the surrounding landscape are among the most important factors that control the temporal variation in streamwater chemistry. In most headwater catchments, the dynamic expansion and contraction of the non-perennial stream network affects and reflects this hydrologic connectivity. Until now, however, the spatiotemporal variations of non-perennial stream networks have been mapped only sporadically and environmental tracer data to explore the dynamic connectivity for these streams are lacking.

Within the TempAqua project, we have monitored the temporal variation in environmental tracers (solutes, stable water isotopes) in precipitation, soil- and groundwater, as well as in stream water during rainfall events in the pre-Alpine Erlenbach catchment. We combine these measurements with novel, sub-hourly data on stream network expansion and contraction.

Our data show that the total flowing stream length increased rapidly, up to 10-fold, during individual rainfall events. Changes in solute concentrations in streamwater indicate that different water stores become dynamically connected to the stream and disconnect again during subsequent dry periods: at the beginning of an event, the dilution of sulphate and calcium suggest a surface runoff contribution of rainwater at the time of rapid expansion of the network and increasing discharge. As rainfall continues, the stream network expands further due to rising groundwater tables, which is indicated by increased nitrate and sulphate concentrations in the stream. The magnitude and importance of these processes depends more on antecedent wetness conditions than event magnitude.

Our observations shed light onto the short-term mechanisms by which non-perennial streams start to flow during rainfall events, and provide new knowledge to address emerging questions on the functional relationships between stream-landscape connectivity, hydrological responses and water quality in headwater catchments, and their vulnerability to global climate change.

How to cite: von Freyberg, J., Bujak, I., Rinaldo, A., and van Meerveld, I.: Quantifying changes in stream-landscape connectivity: combining high-resolution data of non-perennial streams and environmental tracers, EGU General Assembly 2023, Vienna, Austria, 23–28 Apr 2023, EGU23-14005, https://doi.org/10.5194/egusphere-egu23-14005, 2023.

EGU23-14684 | Posters on site | HS2.2.7

Inferring the dynamics of StorAge Selection functions from GR4J 

Alban de Lavenne, Julien Tournebize, Hocine Henine, and Vazken Andréassian

Models based on StorAge Selection (SAS) functions are useful tools for understanding of factors controlling transit time distribution (TTD) and catchment-scale solute export. SAS functions describe the sampling of different ages in catchment storage that produces river discharge. This sampling may vary over time, for instance according to soil moisture:  the young water fraction is generally higher in wet conditions and lower in dry conditions. 

In this work, we investigated how the dynamic of this sampling could be related to the different fluxes and model states of the hydrological model GR4J. Different coupling strategies are tested over the French Orgeval catchment (ORACLE observatory, 104 km²) using chloride concentrations as a conservative tracer. The modelling results allowed to verify that the groundwater contribution, and in particular that outside the topographic catchment (intercatchment groundwater flow), strongly influences the age of the river flow. This study thus opens perspectives to better constrain the modelling of groundwater contribution to the river flow within the GR4J model.

How to cite: de Lavenne, A., Tournebize, J., Henine, H., and Andréassian, V.: Inferring the dynamics of StorAge Selection functions from GR4J, EGU General Assembly 2023, Vienna, Austria, 23–28 Apr 2023, EGU23-14684, https://doi.org/10.5194/egusphere-egu23-14684, 2023.

The Upper Jurassic aquifer (UJA) within the South German Molasse Basin (SGMB) is the most important exploration horizon for geothermal energy supply in Bavaria. The UJA shows a heterogeneous geology with karstic features and deep fault-zones. The result is a complex hydrogeology consisting of different groundwater types which differ significantly in their hydrochemical and isotopic composition.

Despite the great interest in the Upper Jurassic aquifer for geothermal energy supply, leading to numerous scientific studies, the exact apparent groundwater age, the infiltration area and the regional flow system remain yet unknown.

In this study we are using a multi parameter approach for the determination of apparent groundwater age distributions with the innovative 14CDOC and 81Kr methods and combine them with hydrochemistry data and stable water isotopes (δ18O/δ2H).

Our results indicate that the UJA system consists of at least two groundwater components: an up to now unknown young meteoric water component from the Pleistocene/Holocene transition and an older Pleistocene component. The apparent 14CDOC ages increase from south to north and show some evidence that the infiltration area of the UJA is located in the southern part of the SGMB and a groundwater flow directed to the north.

How to cite: Winter, T. and Einsiedl, F.: Characterisation of the regional groundwater flow system in the South German Molasse Basin using apparent groundwater age distributions with 14CDOC and 81Kr, EGU General Assembly 2023, Vienna, Austria, 23–28 Apr 2023, EGU23-15240, https://doi.org/10.5194/egusphere-egu23-15240, 2023.

Diurnal fluctuations of hydrological processes, such as discharge and groundwater level, and of in-stream concentrations of various solutes have been observed in many catchments. The timing of minima and maxima of hydrometric and hydrochemical parameters during the 24 hour cycle can be used to elucidate the baseflow dynamics of catchment hydrological processes and of the mobilization of solutes into streams. In general, diurnal fluctuations of discharge and in-stream solute concentrations have been related to effects of evapotranspiration, temperature-controlled viscosity changes of water, freeze-thaw cycles and a temperature-dependent increase of biological activity during the day. The aim of this study was to better understand the seasonal and topography-driven release of dissolved organic carbon (DOC) during inter-event periods in a small forested headwater catchment within the Bavarian Forest National Park (Germany). We analyzed DOC concentrations and DOC absorbance metrics (as an indicator for DOC quality characteristics) at three topographically different positions of the headwater stream in high frequency by means of in-situ UV-Vis spectrometry over the period of two years. Our data show distinct seasonal differences in the amplitude of diurnal fluctuations of discharge as well as DOC concentrations that are accompanied by clear differences in DOC absorbance characteristics. The timing of diurnal minima and maxima of discharge and DOC concentrations changes over the seasons and along the stream. We present a comprehensive analysis of diurnal fluctuations of discharge, DOC concentrations and DOC quality metrics as influenced by season and topographical position and relate this to findings from other research studies. Disentangling the patterns and dynamics of diurnal variations of hydrological and biogeochemical variables is crucial for fully understanding catchment functioning and the export of carbon from terrestrial catchments as one component of the global carbon budget, particularly because extended drought (i.e., baseflow) periods are forecast to occur more often as a consequence of climate change.

How to cite: Hopp, L. and Blaurock, K.: Seasonal dynamics of diurnal fluctuations of in-stream dissolved organic carbon concentrations and quality metrics in a forested headwater catchment, EGU General Assembly 2023, Vienna, Austria, 23–28 Apr 2023, EGU23-15253, https://doi.org/10.5194/egusphere-egu23-15253, 2023.

EGU23-15677 | ECS | Orals | HS2.2.7

Architecture of seepage zones combined with their residence time to constrain hydrogeological models 

Ronan Abhervé, Clément Roques, Eliot Chatton, Laurent Servière, Jean-Raynald de Dreuzy, and Luc Aquilina

Hydrological predictions for ungauged basins at catchment and regional scales are still challenged by the lack of available data. Under the assumption that the perennial stream network is mostly fed by groundwaters, its spatial extent is controlled by the magnitude of the subsurface hydraulic conductivity (K) with respect to the actual recharge rate (R). In addition, the residence time of groundwater is directly controlled by the storage capacity of the aquifer system, i.e. the porosity (Ө). Here we propose a new inversion approach that jointly considers the spatial organization of observed hydrographic network and the residence times of groundwater measured at springs to infer the geometry of the aquifer system and its hydraulic properties.

We used a dataset gathered in an alpine catchment observatory (Natural conservation area of the Massif of Saint-Barthélemy, Pyrenees, France). The extent of the stream network has been mapped using field observation. Residence times have been obtained from concentrations of dissolved CFCs and SF6 gases measured at 6 spring locations distributed over the catchment. The average transit time is about 30 years for perennial springs with a significant variability across the watershed. The relatively high residence time is also confirmed by high Helium concentrations.

In our inversion scheme, we evaluate the accuracy of an ensemble of 3D hydrogeological models with different aquifer geometries and hydraulic properties. We found that topography and aquifer compartmentalization, through the decreasing trend in hydraulic conductivity, are key parameters in setting the spatial pattern of seepage areas and the distribution of transit times across the catchment. In addition, by running transient simulations of the model ensemble we further explore the accuracy of the models by comparing results with measurements of stream discharge and the intermittency of the hydrographic network. We found that intermittence seems to be connected to high transmissive shallow flow structures with low storage capacities (mostly organized within shallow soils and rockslides). However, perennial springs are sustained by deep groundwater flow paths within the bedrock. In perspective, we discuss the potential evolution of the extent, discharge magnitude and the transit time of seeping groundwater under changing recharge scenarios.

How to cite: Abhervé, R., Roques, C., Chatton, E., Servière, L., de Dreuzy, J.-R., and Aquilina, L.: Architecture of seepage zones combined with their residence time to constrain hydrogeological models, EGU General Assembly 2023, Vienna, Austria, 23–28 Apr 2023, EGU23-15677, https://doi.org/10.5194/egusphere-egu23-15677, 2023.

Current methods for tracing the surface infiltration of meteoric groundwaters rely on isotope geochemistry and dye tracers, which can be used to determine groundwater age and altitude at the point of infiltration. Temporal and spatial variability in atmospheric conditions, and water-rock interactions, can make the interpretation of isotopes uncertain. Low tracer recovery and long residence times often make dye tracers impractical. Here, we propose a new method of groundwater tracing based on fingerprinting of natural dissolved organics (derived from local flora and fauna). We validate our method at the Grimsel Test and Mont Terri underground rock laboratories in Switzerland, located within fractured crystalline rock (granite) and sedimentary systems, respectively. Based on a non-targeted approach using two-dimensional gas chromatography, we derive detailed organic fingerprints for groundwater, surface soils, and lakewater and river water samples from each location. These organic fingerprints are then compared to determine the near-surface infiltration environments feeding individual groundwater samples. Using principal component analysis, we show that individual groundwater samples can be identified as having derived from identifiable surface sources. Our research demonstrates that dissolved natural organic molecules, and their relative abundance, are sufficiently well-preserved in groundwater over timescales of several decades, that they can be used to discriminate the near-surface environment(s) through which meteoric groundwater has infiltrated. Organic fingerprinting could prove a powerful tool for an improved understanding of groundwater flow systems, particularly when used in combination with other complimentary tracing techniques.

How to cite: Stillings, M., Lunn, R., and Shipton, Z.: Fingerprinting dissolved organic compounds: A potential tool for identifying the surface infiltration environments of meteoric groundwaters, EGU General Assembly 2023, Vienna, Austria, 23–28 Apr 2023, EGU23-16229, https://doi.org/10.5194/egusphere-egu23-16229, 2023.

During prolonged drought periods surface water contributions via bank filtration to drinking water production sites located on alluvial aquifers can become increasingly relevant due to associated changes in the hydraulic boundary conditions. Considering the predicted increase of occurance probabilities for hot and dry summers in the humid climate zone, these sites might be prone to an increased risk related to anthropogenic emissions into the connected surface water bodies in the near future.

We studied these processes at two well fields (8 active wells in total) located on the alluvial aquifer of the river Kyll, Germany, about 1 km downstream of the community of Kordel and the city´s waste water treatment plant. For six months we sampled bi-weekly water quality parameters in the wells (horizontal distances to the river varied between 30 and 420 m) and at three locations at the river Kyll. Samples were analyzed for stable water isotopes, EC, pH, DO, DOC, major ions, metals and selected pharmaceutical products. Based on a mixing analysis using major ion data we quantified the mean surface water contribution for each well, varying between 40 and 95 %. Using a darcian modelling approach based on continuous pumping rates, hydraulic gradients, existing information on hydraulic conductivities and the possible geometric connectivity of each of the wells to the river we were able to infer potential residence time distributions for the estimated surface water contributions for each of the wells. Comparing these distributions with nutrient gradients and oxic conditions we find significant correlations with the 0.05 quantile shortest residence time estimations, only. Resulting residence times of surface water contributions within the alluvial aquifer range from several days to weeks instead of previously estimated months to years. Dynamics in stable water isotope patterns in rainfall, surface water and groundwater show as well changes in surface water and groundwater composition within two weeks following the changes in the rainfall isotopic composition. Contrary to nutrient dynamics, the trace organic compounds, i. e. pharmaceutical products did not show spatial or temporal patterns, but a constant, substance specific degradation which leads to the conclusion that trace organic compound retention occurs in the nutrient rich near proximity of the river bed, i.e. the hyporheic zone.

These results demonstrate how quantitative and qualitative surface water contributions to groundwater / drinking water wells can have an increased relevance under drought conditions than previously anticipated.

How to cite: Schuetz, T. and Förster, A.: Infering the relevance of bank filtration processes for drinking water production sites on alluvial aquifers under drought conditions using residence time distributions and water quality parameters, EGU General Assembly 2023, Vienna, Austria, 23–28 Apr 2023, EGU23-16851, https://doi.org/10.5194/egusphere-egu23-16851, 2023.

HS2.3 – Water quality at the catchment scale

EGU23-276 | ECS | Orals | HS2.3.1 | Highlight

Wildfire impacts on water: improving impact assessment though model adaptation 

Marta Basso, Jacob Keizer, Dalila Serpa, Marcos Mateus, and Diana Vieira

Wildfires are a threat to water security worldwide, due to the negative effect of the post-fire mobilization of sediments and associated nutrients and contaminants on the waterbodies located downstream of burned areas. Such impacts have been assessed in field studies and, more recently, also through modelling approaches. Models are valuable tools for anticipating the potential negative impacts of wildfires, allowing to test different environmental scenarios. The state of the art in post-fire model adaptation has shown that most studies simulate the hydrological and erosion response in the first post-fire year in situ, without considering the cascading effects on downstream waterbodies. In addition, few studies have evaluated the long-term impacts of wildfires, likely due to the limited available data. Among the existing gaps in post-fire modelling, ash transport has recently been identified as a priority. The lack of ash modelling studies has been ascribed to the limited understanding of ash behavior and the difficulties of incorporating ash-related processes into the structure of existing models.

As a way to fulfill these research gaps and advance the state of the art in post-fire hydrological modeling, the authors provided several contributions in recent years.

For instance, a watershed model has been coupled with a reservoir model to simulate the effects of fires on drinking water supplies, using the outputs of the main streams as inputs to the reservoir branches. As most simulations commonly end at the watershed outlet, a simple methodology was proposed to assess how the impacts on watercourses propagate to the drinking water supply inlet. The results showed that integrated modeling frameworks are critical for anticipating the off-site impacts of fires.

Post-fire management can also influence the impacts of fires beyond the first post-fire rainfall events, when the soil is exposed and ash and sediment transport is greatest. Another modelling exercise evaluates the long-term impacts of different post-fire management options, more specifically terracing, mulching and natural recovery, on water availability and quality.

As post-fire ash and sediment mobilization is typically limited to the duration of the rainfall events, which typically lasts for a few hours, hydrological models that run at a daily time-step can underestimate the environmental impacts of fires. To improve the knowledge of post-fire hydrological processes at event-based scale, two hydrological models (LISEM and MOHID) were calibrated, accounting for burn severity and initial soil moisture conditions before each specific rainfall event.

The work done in the past years is expected to be of added value for the post-fire modeling community, providing future directions on post-fire hydrological modelling studies.


How to cite: Basso, M., Keizer, J., Serpa, D., Mateus, M., and Vieira, D.: Wildfire impacts on water: improving impact assessment though model adaptation, EGU General Assembly 2023, Vienna, Austria, 23–28 Apr 2023, EGU23-276, https://doi.org/10.5194/egusphere-egu23-276, 2023.

EGU23-572 | ECS | Orals | HS2.3.1

Post-fire water contamination risk assessment in Portugal 

Niels Nitzsche, Joost Schuurman, Luís Dias, João Pedro Nunes, and Joana Parente

Wildfires in the Mediterranean basin, especially in Portugal, have increased in extent and frequency over the last few years. One of the many impacts of wildfires on humans and ecosystems is on the water quality of surface waters. Ashes and increased erosion rates might elevate the influx of nutrients, sediments, or other water quality-related components, possibly affecting the water supply. This study has three main objectives. (1) Identifying post-fire water contamination events in over 60 Portuguese reservoirs, through changepoint analysis of historical time series for (2) Testing the relationship between post-fire water contamination events with fire-, watershed-, reservoir-, and climatic drivers through logistic regression using generalized additive models. (3) The modelling and evaluation of post-fire water supply contamination risks in Portugal, using a deterministic approach. Results showed increases in TSS in 13.6% of all wildfires. Most changes fell into the unusually large fire seasons of 2003-2005 and 2017, while the most significant impacts could be seen in southern reservoirs after 2005. Fire size was identified as the main driver of post-fire water contamination, while reservoir and climate-related characteristics like water levels also played a significant role in TSS. Increased levels of suspended sediments were identified as a potential threat to the water supply, especially when large wildfires coincide with drought-induced low reservoir water levels. The modelling of past water contamination episodes shows a similar spatial distribution as the structural fire risk in Portugal, identifying the centre (and southern) regions as the most affected areas. This study may support numerous case and modelling studies and inform water managers about possible future threats.

How to cite: Nitzsche, N., Schuurman, J., Dias, L., Nunes, J. P., and Parente, J.: Post-fire water contamination risk assessment in Portugal, EGU General Assembly 2023, Vienna, Austria, 23–28 Apr 2023, EGU23-572, https://doi.org/10.5194/egusphere-egu23-572, 2023.

EGU23-1074 | ECS | Orals | HS2.3.1

Comparing Critical Source Areas for the Sediment and Nutrients of Calibrated and Uncalibrated Models in a Plateau Watershed in Southwest China 

Meijun Chen, Annette B. G. Janssen, Jeroen J. M. de Klein, Xinzhong Du, Qiuliang Lei, Ying Li, Tianpeng Zhang, Wei Pei, Carolien Kroeze, and Hongbin Liu

Controlling non-point source pollution is often difficult and costly. Therefore, focusing on areas that contribute the most, so-called critical source areas (CSAs), can have economic and ecological benefits. CSAs are often determined using a modelling approach, yet it has proved difficult to calibrate the models in regions with limited data availability. Since identifying CSAs is based on the relative contributions of sub-basins to the total load, it has been suggested that uncalibrated models could be used to identify CSAs to overcome data scarcity issues. Here, we use the SWAT model to study the extent to which an uncalibrated model can be applied to determine CSAs. We classify and rank sub-basins to identify CSAs for sediment, total nitrogen (TN), and total phosphorus (TP) in the Fengyu River Watershed (China) with and without model calibration. The results show high similarity (81%-93%) between the identified sediment and TP CSA number and locations before and after calibration both on the yearly and seasonal scale. For TN alone, the results show moderate similarity on the yearly scale (73%). This may be because, in our study area, TN is determined more by groundwater flow after calibration than by surface water flow. We conclude that CSA identification with the uncalibrated model for TP is always good because its CSA number and locations changed least, and for sediment, it is generally satisfactory. The use of the uncalibrated model for TN is acceptable, as its CSA locations did not change after calibration; however, the TN CSA number decreased by around 60% compared to the figures before calibration on both yearly and seasonal scales. Therefore, we advise using an uncalibrated model to identify CSAs for TN only if water yield composition changes are expected to be limited. This study shows that CSAs can be identified based on relative loading estimates with uncalibrated models in data-deficient regions.

How to cite: Chen, M., Janssen, A. B. G., de Klein, J. J. M., Du, X., Lei, Q., Li, Y., Zhang, T., Pei, W., Kroeze, C., and Liu, H.: Comparing Critical Source Areas for the Sediment and Nutrients of Calibrated and Uncalibrated Models in a Plateau Watershed in Southwest China, EGU General Assembly 2023, Vienna, Austria, 23–28 Apr 2023, EGU23-1074, https://doi.org/10.5194/egusphere-egu23-1074, 2023.

EGU23-2101 | ECS | Posters on site | HS2.3.1

Drinking water quality research of the soum centers and settled areas in south Gobi of Mongolia 

Altantungalag Danzan, Uuganbayar Purevsuren, and Gan-Erdene Dorjgotov

Groundwater is vital resource for both the local people and livestock of the Gobi region of Southern Mongolia where surface water distribution is limited. Apparently, whether the water is suitable for drinking purpose is significant issue to study. The purpose of this study is to assess the quality of water in local water supply wells and to identify  hydrochemical facies and origin of the micro elements of the water. In the study, totally 233 water samples were collected from the existing water wells located in 77 soum centers and settled areas of 10 provinces of southern Mongolia. The water samples were analyzed at the Central Geological Laboratory in Ulaanbaatar. Major cations (K+, Na+, Ca2+, Mg2+, SiO2) and anions (Cl-, HCO3-, SO4-, NO2-, NO3-, F-) were determined. In addition, total 12 trace metals (Be, B, Cr, Mn, Cu, As, Se, Sr, Mo, Cd, Ba, U) have been determined by the ICP-124. As a result, the groundwater of the target region is identified to be alkaline and as for the mineralization, it refers to fresh or brakishwater type. Hydrochemical facies are identified to be the types of Ca-HCO3, NaCl, Ca-Na-HCO3 and Ca-Mg-Cl. Moreover, the sources of major ions of the groundwater in the region is characterized by more dominance of water and rock unit interaction and less impact of recharge and evaporation. When compared to drinking water standard, the hardness, Na ion and Mg ion exceed the maximum allowable limits in the water samples taken from water wells of 28 soums, 24 soums and 47 soums, respectively. The concentration of arsenic was higher than drinking water standards of World Health Organization (WHO) in 21 soums of the study area and other metals including uranium, strontium and selenium in water exceeded drinking water standards in 9 soums centers water supply wells.

How to cite: Danzan, A., Purevsuren, U., and Dorjgotov, G.-E.: Drinking water quality research of the soum centers and settled areas in south Gobi of Mongolia, EGU General Assembly 2023, Vienna, Austria, 23–28 Apr 2023, EGU23-2101, https://doi.org/10.5194/egusphere-egu23-2101, 2023.

EGU23-2206 | Orals | HS2.3.1

A novel machine learning national model for diffuse source total phosphorus concentrations in streams 

Brian Kronvang, Jørgen Windolf, Henrik Tornberg, Jonas Rolighed, and Søren Larsen

Data on the diffuse source annual flow weighted total phosphorus (TP) concentrations from 349 Danish streams draining smaller catchments (< 50 km2) for the period 1990-2019 were used for developing a model in machine learning software (DataRobot version 6.2; DataRobot Inc. Boston MA, USA). The developed diffuse source TP-concentration model will substitute an older model that have been in place to calculate P-loadings to Danish estuaries from ungauged areas. A total of 207 streams with 3,144 annual observations of flow-weighted TP concentrations together with information on 19 explanatory variables was entered into the DataRobot software. DataRobot divides the input data into three layers: Training dataset (64%), validation dataset (16%) and hold out dataset (20%). Thereafter, DataRobot conducts a five-layer cross-validation and tests among 72 different model types before suggesting final best solutions.

In this case, the TP-concentration model was developed as an ‘eXtreme Gradient Boosted Trees Regressor with early stopping’ as suggested by the DataRobot software to be superior for modelling the annual flow-weighted TP concentration based on 13 explanatory variables. The most influencing explanatory variables in the final model are: 1) tile drainage in the catchments; 2) ; 3) period (two periods with different sampling regimes; 4) proportion of agricultural land; 5) importance of bank erosion; 6) deviation of annual runoff from long-term mean. The final TP-concentration model has a R2=0.69 for the training dataset, R2 = 0.71 for the validation dataset and R2 = 0.67 for the hold out dataset.

A validation of the new machine learning TP-concentration model on 142 independent streams with 1,261 annual observations was conducted to investigate the uncertainty of the model simulations. The validation showed the TP-concentration model to have a high explanatory power (R2=0.60) and with a very good simulation performance in the nine Danish georegions, as well as for the 30 year long time series of data. 

An application of the model for calculating flow-weighted TP-concentrations within nearly 3,200 catchment polygons (ID15’s) covering the Danish land area showed that the new developed machine learning TP-model is a valuable tool both for calculation of TP-loadings from ungauged areas to lakes and coastal waters as well as for linking catchment pressures to stream ecological status.   

How to cite: Kronvang, B., Windolf, J., Tornberg, H., Rolighed, J., and Larsen, S.: A novel machine learning national model for diffuse source total phosphorus concentrations in streams, EGU General Assembly 2023, Vienna, Austria, 23–28 Apr 2023, EGU23-2206, https://doi.org/10.5194/egusphere-egu23-2206, 2023.

EGU23-2722 | ECS | Posters on site | HS2.3.1

Influence of sanitary infrastructure on nutrient transport mechanisms in a headwater catchment 

Caroline Spill, Lukas Ditzel, and Matthias Gassmann

Sanitary infrastructures draining smaller villages are often not taken specifically into account when discussing catchment transport process. One reason is the limited data availability, as they are usually not part of (high frequency) monitoring strategies, although it has been shown, that they can have a significant impact on water quantity and quality. Especially in first- or second-order streams, they can contribute a big share to the discharge volumes. At the same time, the dilution effect of small streams is limited. This is critical, as e.g. wastewater treatment plants (WWTPs) often have to meet lower requirements compared to their bigger counterparts treating water from cities, meaning, that especially nutrient concentrations can be still high in the effluent.

We measured discharge and different water quality data in a headwater stream (2.77 km²), which is influenced by agriculture, a small village and point sources: two combined sewer overflows (CSOs) and one WWTP. In comparison to other studies, we decided to implement our measurements shortly after the point sources, to measure the nutrient signal with little influence of in-stream processes.

The WWTP always contributed a high share of water, especially during dry periods. However, the discharge from the WWTP was much higher, than one would expect based on the number of inhabitants. Water quality data from the WWTP suggest, that groundwater is infiltrating into the sewer system and is additionally treated within the WWTP. This could also explain the high number of CSO events: infiltrating groundwater leads to the exceedance of the sewer system design capacities even at medium-sized rainfall events. As a consequence, not only CSO events occur more often, but also cleaning processes within the WWTP seem to be interrupted, explaining the increasing ammonium and ortho-phosphorus concentrations during events. Especially during long-lasting events with several peaks, the hysteresis analysis shows the activation of different nutrient sources, indicating a complex interaction between the sanitary infrastructure and the catchment itself.

Our data shows, that even small point sources from villages can have a significant influence on water quantity and quality. Similar to agricultural or natural catchments, their individual influence varies depending on season and pre-event conditions and are not constant throughout the year.

How to cite: Spill, C., Ditzel, L., and Gassmann, M.: Influence of sanitary infrastructure on nutrient transport mechanisms in a headwater catchment, EGU General Assembly 2023, Vienna, Austria, 23–28 Apr 2023, EGU23-2722, https://doi.org/10.5194/egusphere-egu23-2722, 2023.

EGU23-2990 | Posters on site | HS2.3.1

Developing the real-time water quality program using machine learning and API. 

Gihun Bang, Na-Hyeon Gwon, Min-Jeong Cho, Ji-Ye Park, and Sang-Soo Baek

The importance of water quality monitoring (e.g., TOC, DO, Chl-a, TN, and TP) is increasing in part of agriculture, water treatment, and policy decision. As the computing power has been increased, we could develop the real-time water quality system. Our system can forecast the water quality after 2 days from now. To simulate the water quality of ND river, the random forest (RF) and artificial neural network (ANN) were adopted. Furthermore, the program provides a user-friendly system using a graphic user interface (GUI). Our prediction program consists of 3 major phases. Phase 1 utilizes an application programming interface (API) to load the data from national institutes (NI). Phase 2 is the simulation of flowrate of ND River. Phase 3 simulates the water quality using machine learning. RF models produced R2 values of 0.46, 0.8, 0.59, 0.46, 0.67 for chl-a, DO, TN, TOC, and TP respectively while ANN models resulted in R2 values of 0.22, 0.72, 0.53, 0.35, 0.63. Overall, DO shows the most accurate result while TN and TP showed reasonable simulation results, by showing over 0.5 of R2. Our study demonstrates that API service with machine learning is useful for simulating real-time water quality.

How to cite: Bang, G., Gwon, N.-H., Cho, M.-J., Park, J.-Y., and Baek, S.-S.: Developing the real-time water quality program using machine learning and API., EGU General Assembly 2023, Vienna, Austria, 23–28 Apr 2023, EGU23-2990, https://doi.org/10.5194/egusphere-egu23-2990, 2023.

Intensive livestock production has raised enormous water quality concerns in Europe and elsewhere around the world. There is a need to examine long-term water quality trends and understand the drivers for the trends based on detailed catchment monitoring. Given orthophosphate-phosphorus (P) is highly relevant to eutrophication in freshwater lakes and rivers, we monitored its concentration and load trends in streamwater of a livestock-intensive catchment in western Norway for a 20-year period, using the approaches of continuous flow measurements and flow-proportional composite water sampling. Precipitation and catchment-level soil P balance, as well as field-level measurements of soil P status, were monitored to examine the drivers. Trend analyses showed that both annual mean P concentration (range: 0.05–0.14 mg L-1; mean: 0.08 mg L-1; p = 0.001) and annual P load (range: 0.35–1.46 kg ha-1; mean: 0.65 kg ha-1; p = 0.0003) increased significantly over the 20-year monitoring period. The mean concentrations were positively correlated with cumulative soil P surplus (R2 = 0.55, p = 0.0002). Although discharge of the streamflow significantly affected annual P load, the P surplus appeared to be an even more important factors. The study highlights that long-term P surplus plays a critical role in influencing orthophosphate-P concentration and loads in livestock-intensive regions. There is a big challenge to reduce the P surplus, which however may be achieved through integrated strategies such as reducing livestock density, manure refinement and transport to crop-intensive regions, improving livestock feeding management, and increasing crop P removal.

How to cite: Liu, J., Bechmann, M., and Øgaard, A. F.: Water quality trends and the drivers in livestock-intensive regions: Results from 20 years of catchment monitoring in Norway, EGU General Assembly 2023, Vienna, Austria, 23–28 Apr 2023, EGU23-3176, https://doi.org/10.5194/egusphere-egu23-3176, 2023.

EGU23-3184 | ECS | Orals | HS2.3.1

Shedding light on the organic matter black box: Using fluorescence spectroscopy to understanding microbial sources and pathways TLF 

Natasha Harris, Gareth Old, Mike Bowes, Peter Scarlet, David Nicholls, Linda Armstrong, Daniel Read, Ben Marchant, and James Sorensen

The river Thames catchment  passes through rural and urban centres covering many different environments and land uses. Therefore, it is exposed to a range of stresses from sewage pollution to run off from agriculture. As such, UKCEH has been conducting water quality monitoring of the Thames since 1997, which later expanded into the Thames Initiative. The Thames Initiative collects a wide range of chemical and biological data, at 19 sites across the Upper Thames Catchment and its tributaries. For 18 months, in 2012-13, fluorescence spectroscopy and PARAFAC analysis was used to identify 4 components of fluorescent organic matter (FOM). This research focusses on the role of the fourth component, C4, which represents a tryptophan like FOM(TLF). The study is looking at the peak’s temporal variability at all 19 sites within the Thames catchment, alongside nutrient and biological data. This will enable greater understanding TLF’s sources and pathways by analysing TLF’s interaction with other nutrients and pollutants.  There is robust research linking TLF to sewerage pollution and more widely anthropogenic activity. However, the understanding of TLF as a product of insitu production from microorganisms is still in relative infancy, particularly when looking for evidence in the field at a catchment level. In this study multiple variate linear modelling using forward stepwise regression techniques have been applied to the data at each site to investigate the sources of C4 across the catchment to understand both catchment and instream processes. The possible predictors available to each model were dissolved potassium (DK), total dissolved nitrogen (TDN), dissolved calcium (DCa), total bacterial counts(TBC) and chlorophyll a. The models used between 2-3 predictors (σ=2.53, μ =0.678). DK was the most common (18 models),  followed by TBC (11 models), then DCa and TDN (both 8 models) and finally chlorophyll a (2 Models). These results suggest a dominant source of C4 across the catchment is from the wastewater as dissolved potassium is a sewerage indicator.  Secondly the occurrence of TDN or dissolved  calcium suggest a more dominate baseflow path of the fluorescence at these sites, as found in previous analysis of these sites.  However, most novelty is the regular occurrence of TBC in the models. This suggests  the C4 component has a bacteriological element as well, which means it is likely there is an important contribution of TLF by insitu-production from microorganisms.

How to cite: Harris, N., Old, G., Bowes, M., Scarlet, P., Nicholls, D., Armstrong, L., Read, D., Marchant, B., and Sorensen, J.: Shedding light on the organic matter black box: Using fluorescence spectroscopy to understanding microbial sources and pathways TLF, EGU General Assembly 2023, Vienna, Austria, 23–28 Apr 2023, EGU23-3184, https://doi.org/10.5194/egusphere-egu23-3184, 2023.

EGU23-3930 | ECS | Posters on site | HS2.3.1

How much did the Nitrates Directive contribute to changes in surface water nitrate concentrations across German catchments? 

Tam Nguyen, Rohini Kumar, Pia Ebeling, Fanny Sarrazin, Andreas Musolff, and Jan Fleckenstein

Nitrate originating from agricultural lands is identified as one of the main causes of water pollution in Europe. As a result, the European Nitrates Directive (ND) was introduced in 1991 to protect water bodies from nitrate pollution by reducing diffuse nitrogen inputs. Despite decades having passed since its implementation, there are diverging observations of nitrate concentration changes in surface waters in Europe. Recent work suggested that the success of input reduction can be strongly blurred due to long water and nitrogen transit times and the built-up of nitrogen stores in catchment soils, making it difficult to evaluate the effectiveness of the ND. Therefore, it is still unclear to what extent the ND contributed to changes in surface water nitrate concentrations.  Such understanding could help to develop better management policies. In this study, we used previously calibrated nitrate export models for various German catchments (Nguyen et al., 2022) based on the principle of water transit times and observed inputs (baseline scenario). We then force these models with different N input trajectories that assume no implementation of the ND (hypothetical scenarios). Here, we will compare simulation results from the baseline scenario with hypothetical scenarios to evaluate the effectiveness of the ND implementation as well as its controlling factors. In addition, we will also check if different catchments respond differently to changes in N inputs to see whether different management strategies are needed for different catchments.

Nguyen, T. V., Sarrazin, F. J., Ebeling, P., Musolff, A., Fleckenstein, J. H., & Kumar, R. (2022). Toward understanding of long-term nitrogen transport and retention dynamics across German catchments. Geophysical Research Letters, 49, e2022GL100278. https://doi.org/10.1029/2022GL100278

How to cite: Nguyen, T., Kumar, R., Ebeling, P., Sarrazin, F., Musolff, A., and Fleckenstein, J.: How much did the Nitrates Directive contribute to changes in surface water nitrate concentrations across German catchments?, EGU General Assembly 2023, Vienna, Austria, 23–28 Apr 2023, EGU23-3930, https://doi.org/10.5194/egusphere-egu23-3930, 2023.

EGU23-4144 | ECS | Posters on site | HS2.3.1

Long-term dynamics of nitrogen export from European catchments 

Fanny Sarrazin, Tam Nguyen, Andreas Musolff, Pia Ebeling, Masooma Batool, Paromita Sarker, Yevheniia Anpilova, Jan Fleckenstein, Sabine Attinger, and Rohini Kumar

Since the beginning of the twentieth century, anthropogenic activities have severely altered the global nitrogen (N) cycle through the fixation of atmospheric N for the production of N fertilizers, the cultivation of N fixing crops, fossil fuel combustion, and the discharge of human and industrial wastewater into the environment. Both N diffuse sources (fertilizer application, biological N fixation and atmospheric N deposition) and point sources (wastewater) have led to the contamination and eutrophication of numerous water bodies worldwide and are still threatening human and aquatic ecosystem health today. This calls for both large-scale and long-term analyses of N dynamics to gain a better understanding of the changes in N export from streams in response to changes in N input following environmental policies and technological developments.

In this study, we investigate the long-term dynamics of N export from European river basins over the last 70 years, which is made possible by our recent development of novel gridded datasets of long-term N diffuse sources and point sources across Europe (Batool et al., 2022). To this end, we apply the mHM hydrological model coupled with the SAS-N model (Nguyen et al., 2022). The latter accounts for possible N accumulation in the soil (biogeochemical legacy), as well as in the subsurface (hydrological legacy) utilizing water travel time via StorAge Selection (SAS) functions. We quantify N export in major European river basins (e.g. Danube, Elbe, Rhine, Rhone, Seine) accounting for the uncertainties in input data and model parameters (Sarrazin et al., 2022). We identify distinct relationships between N inputs and simulated N export, resulting from different legacy behaviours across river basins. Overall, we find a decreasing contribution of point sources to total N export over the study period, due to improvements in wastewater treatment. Through learning from the past N export dynamics, our study ultimately contributes to informing the development of future management strategies to reduce N levels below target values.

Batool, M., Sarrazin, F. J., Attinger, S., Basu, N. B., Van Meter, K., & Kumar, R. (2022). Long-term annual soil nitrogen surplus across Europe (1850–2019). Sci. Data, 9, 612. https://doi.org/10.1038/s41597-022-01693-9

Nguyen, T. V., Sarrazin, F. J., Ebeling, P., Musolff, A., Fleckenstein, J. H., & Kumar, R. (2022). Toward understanding of long-term nitrogen transport and retention dynamics across German catchments. Geophys. Res. Lett., 49, e2022GL100278. https://doi.org/10.1029/2022GL100278

Sarrazin, F. J., Kumar, R., Basu, N. B., Musolff, A., Weber, M., Van Meter, K. J., & Attinger, S. (2022). Characterizing catchment-scale nitrogen legacies and constraining their uncertainties. Water Resour. Res., 58, e2021WR031587. https://doi.org/10.1029/2021WR031587

How to cite: Sarrazin, F., Nguyen, T., Musolff, A., Ebeling, P., Batool, M., Sarker, P., Anpilova, Y., Fleckenstein, J., Attinger, S., and Kumar, R.: Long-term dynamics of nitrogen export from European catchments, EGU General Assembly 2023, Vienna, Austria, 23–28 Apr 2023, EGU23-4144, https://doi.org/10.5194/egusphere-egu23-4144, 2023.

EGU23-4639 | Posters on site | HS2.3.1

Occurrence of Dissolved Organic Nitrogen (DON) in Low-relief Streams on the Eastern Shore of Virginia, USA 

Janet Herman, Benjamin Burruss, and Aaron Mills

The agricultural use of nitrogenous fertilizer in watersheds along the Atlantic Coast, USA, has fueled concerns and investigations into the upland-derived nitrate (NO3­-) discharging to coastal waters.  Past studies of low-relief, gaining streams in small watersheds on the Eastern Shore of Virginia, USA, have quantified the NO3-­-N flux to seaside lagoons and the Atlantic Ocean.  The contribution of dissolved organic nitrogen (DON) to the total nitrogen loading to coastal waters had not previously been evaluated.  This study quantified concentrations of DON, NO3­-, and total dissolved nitrogen (TDN) under baseflow conditions in 15 streams varying in watershed size and cropland use on the Eastern Shore of Virginia across a one-year period.  Mean concentrations of DON in streams ranged from 0.328 to 2.14 mg N L-1 and represented 12 to 70% of the TDN pool.  In 14 of the 15 streams, NO3- was the principal form of nitrogen ranging in mean concentrations from 0.094 to 6.06 mg N L­-1.  Instream DON concentrations were independent of NO3- concentrations, watershed area, and cropland use.  Unlike NO3-, DON varied seasonally with highest DON concentrations observed in spring.  DON ranged from 6 to 41% of the TDN in shallow groundwater with concentrations from 0.776 to 2.12 mg N L-1.  These concentrations were lower than the respective concentrations determined in overlying surface-water samples (0.001 to 0.773 mg N L-1) collected concurrently.  In a laboratory experiment, DON of 1.02 mg N L-1 was eluted in the effluent from an intact streambed sediment core using artificial groundwater influent containing NO3- only and represented nearly 60% of the TDN in the core effluent.  The results of this study establish DON as an important and dynamic constituent of the TDN pool in freshwater streams discharging from the Eastern Shore of Virginia, USA, to the coastal waters of the Atlantic Ocean.

How to cite: Herman, J., Burruss, B., and Mills, A.: Occurrence of Dissolved Organic Nitrogen (DON) in Low-relief Streams on the Eastern Shore of Virginia, USA, EGU General Assembly 2023, Vienna, Austria, 23–28 Apr 2023, EGU23-4639, https://doi.org/10.5194/egusphere-egu23-4639, 2023.

EGU23-4869 | Posters on site | HS2.3.1

Variation of dissolved phosphorus in groundwater of riparian zones in an agricultural area 

Dong-Chan Koh and Hong-Il Kwon

Phosphorus, which is one of important factors of surface water eutrophication, has been the main issue in surface water quality management. In recent years, there has been an increasing interest in phosphorus in groundwater as well as surface water. Increasing number of studies has reported groundwater with high concentrations of phosphorus and its effect on adjacent surface water. The multi-level monitoring wells were installed in riparian zones of an agricultural area to demonstrate processes of phosphorus in groundwater. A stream in the area is largely in gaining condition, but losing condition was found in the area with extensive groundwater pumping. In this study, the processes of increasing and decreasing phosphorus concentration in groundwater under anaerobic conditions were examined with redox sensitive species. The dominant redox processes in groundwater were identified using redox sensitive parameters, which varied from oxic to sulfate reduction. Phosphorus concentrations were low in oxic and denitrification dominant condition and high in iron reducing dominant condition. This result was consistent with many recent studies. It is expected that phosphorus concentrations were reduced by precipitation of secondary iron minerals in the aerobic condition and increased by dissolution of the secondary minerals in the anaerobic condition. However, phosphorus concentration in the groundwater tended to attenuate under the more reducing condition than iron-reducing dominant condition. In this study, we tried to interpret dissolved phosphorus concentration in relation to the redox sensitive species and to understand the attenuation processes of dissolved phosphorus under strongly reducing conditions.

How to cite: Koh, D.-C. and Kwon, H.-I.: Variation of dissolved phosphorus in groundwater of riparian zones in an agricultural area, EGU General Assembly 2023, Vienna, Austria, 23–28 Apr 2023, EGU23-4869, https://doi.org/10.5194/egusphere-egu23-4869, 2023.

EGU23-4890 | ECS | Orals | HS2.3.1

Can we trust our data sources? A case study presenting limits of spatial detail of sediment transport modelling 

Miroslav Bauer, Tomas Dostal, Josef Krasa, John Schwartz, and Karina Bynum

The paper discusses the limits of data sources that are widely available, used and applicable for soil erosion and sediment transport modelling. It emphasizes the accuracy and spatial detail of land use and stream topology data. These two inputs are critical in terms of sediment transport dynamics. The aim of the paper is to point out the error propagation into results at the small catchment scale if the data is used inappropriately. In contrast, we show how the quality and accuracy can be significantly improved by checking, verifying and modifying the directly available data sources to make them applicable at the scale of smaller catchment (tens of km2). The accuracy that can be achieved by directly measuring and describing the real situation in the field (land use, streams, crops) is discussed.

WaTEM/SEDEM (based on RUSLE and sediment transport capacity assessment) was selected as a modelling approach. The results will be interpreted using a case-study of the Oostanaula watershed, Tennessee, USA, approximately 10km2. Modelling utilized the most recent available DEM, land use and soil data in raster resolution 10x10 m.

Research has been supported by project TUDI (European Union's Horizon 2020 research and innovation programme under grant agreement No 101000224), LTA-USA 19019 (Ministry of Education of the Czech Rep.), TAČR SS02030027 and SS05010180 (Technology Agency of the Czech Republic)

How to cite: Bauer, M., Dostal, T., Krasa, J., Schwartz, J., and Bynum, K.: Can we trust our data sources? A case study presenting limits of spatial detail of sediment transport modelling, EGU General Assembly 2023, Vienna, Austria, 23–28 Apr 2023, EGU23-4890, https://doi.org/10.5194/egusphere-egu23-4890, 2023.

EGU23-4967 | Posters on site | HS2.3.1

Assessment of sediment and nutrient sources and their influence on eutrophication: case study from the Czech Republic 

Josef Krasa, Jakub Borovec, Barbora Jáchymová, Miroslav Bauer, and Tomáš Dostál

The purpose of a three-year project QK22020179 is to build a methodology to assess the importance of the impact of sediments deposited in the tributary parts of reservoirs on water quality. The project should describe the dynamics of phosphorus release or capture in sediments in relation not only to the environment of the reservoir, but also to the source basin, the mineralogical composition of the sediment, its granularity and chemistry, and the method of its supply to the reservoirs.

In 2022, the solution was concentrated in the catchment areas of the Bojkovice, Boskovice, Hamry, Seč, Stanovice and Lučina reservoirs. Sediment traps were installed in the inflow reservoirs, continuous models of sediment transport from the catchment were also compiled for the reservoirs, and key parts of the catchment area were defined as potential main sources of sediment. By analyzing the mineralogy and chemistry of the listed source areas, especially on the basis of data from agrochemical analysis of agricultural soils, potential links are now being created between the sediment properties in the inlet parts of the reservoirs and the source areas defined by the model.

The paper will present the current results and the overall methodology with the aim of obtaining feedback in the discussion, because the methodology of potential "fingerprinting" of sediment in catchments and defining the importance of its properties for the behavior of reservoirs in terms of eutrophication has not yet been developed in the Czech Republic, let alone successfully solved.

Research has been supported by projects QK22020179 and SS03010332.

How to cite: Krasa, J., Borovec, J., Jáchymová, B., Bauer, M., and Dostál, T.: Assessment of sediment and nutrient sources and their influence on eutrophication: case study from the Czech Republic, EGU General Assembly 2023, Vienna, Austria, 23–28 Apr 2023, EGU23-4967, https://doi.org/10.5194/egusphere-egu23-4967, 2023.

EGU23-5299 | ECS | Orals | HS2.3.1

The derivation of denitrification conditions in groundwater: Combined method approach and application for Germany 

Tim Wolters, Thomas Bach, Michael Eisele, Wolfram Eschenbach, Ralf Kunkel, Ian McNamara, Reinhard Well, and Frank Wendland

Denitrification in groundwater is an important process that helps to maintain environmental standards, yet there are very few studies that determine the spatial variation of denitrification conditions in aquifers on a regional scale. We introduce a procedure to derive spatially continuous estimates of denitrification conditions in groundwater based on the interpolation of measurements of the redox-sensitive parameters oxygen, nitrate, iron, manganese and DOC, combined with the quantification of denitrification using a 2D-hydrodynamic model based on first-order reaction kinetics. We applied this procedure to Germany, using measured values from more than 24,000 groundwater monitoring sites from 2007 to 2016. Annual concentrations of the five parameters at the monitoring sites were regionalized using an optimized, iterative inverse distance weighting procedure within 15 aquifer typologies for spatial delineation. The annual grids (2007–2016) of each parameter were then overlaid and a median over time was calculated. Discrete ranks were then assigned to the concentrations of each parameter based on their redox class, and ultimately, after overlaying the five parameters, a mean value was calculated describing the nitrate degradation conditions in groundwater. After assigning half-life times and reaction constants to those denitrification conditions, we quantified denitrification in groundwater using the hydrodynamic model WEKU.

To assess the plausibility of the derived denitrification in groundwater, we compared our results with the proportion of denitrified nitrate determined with the N2/Ar method at 820 groundwater monitoring wells in three German Federal States, which showed an overall good agreement. Accordingly, the method presented here is suitable to be used for the regionally differentiated derivation of denitrification conditions in groundwater. For regions with denitrifying groundwater conditions, the results provide an explanation for frequently observed discrepancies between high nitrate emissions from the soil and low nitrate concentrations in the groundwater of intensively used agricultural areas.

How to cite: Wolters, T., Bach, T., Eisele, M., Eschenbach, W., Kunkel, R., McNamara, I., Well, R., and Wendland, F.: The derivation of denitrification conditions in groundwater: Combined method approach and application for Germany, EGU General Assembly 2023, Vienna, Austria, 23–28 Apr 2023, EGU23-5299, https://doi.org/10.5194/egusphere-egu23-5299, 2023.

Current state-of-art studies have been largely focusing on analysing how headwater catchment characteristics influence the sensitivity of the water yield in response to climate change. However, there has been little research combining both hydrological analysis with in situ water quality assessment and understanding how extreme climate events could influence the water quality of the headwater catchment, especially under anthropogenic stress. Therefore, this research aims at understanding the mechanisms of how different types of droughts modify the water quality of an anthropogenically impacted catchment.

The research is performed on the Lauter river, which takes its source from two headstreams, the Scheidbach and the Wartenbach in the Palatinate Forest, Rhineland-Palatinate and flows between the French-German border and ultimately flow into the Rhine River. The discharge time series of 59 years and water quality data of 48 years are being analysed. We will present the methodology of the research and current updates on the progress. The research is planned to proceed in three steps, 1) understanding the water partitioning mechanism and defining different drought types by using the SWAT (The Soil & Water Assessment Tool), 2) studying the water quality behavior under different hydrologic scenarios by conducting in situ water quality monitoring experiments, 3) predicting the water quality trend under future climate change and anthropogenically impacted scenarios. Current results include water quantity trend analysis based on the daily flow rate data at the Salmbacher Passage measuring station on the Lauter river and a primary catchment modeling result with the SWAT.

Keywords: Drought, Water quality, SWAT model, Headwater catchment

How to cite: Liu, X. and de Jong, C.: Analysis of the impacts of droughts on the water quality of the transboundary German-French Lauter catchment with SWAT, EGU General Assembly 2023, Vienna, Austria, 23–28 Apr 2023, EGU23-5376, https://doi.org/10.5194/egusphere-egu23-5376, 2023.

EGU23-5516 | ECS | Orals | HS2.3.1

Comparison of spatio-temporal low-flow models for predicting remobilization of water pollutants 

Johannes Laimighofer, Alexander Pressl, Günter Langergraber, Gabriele Weigelhofer, and Gregor Laaha

Droughts are significant hydrological and environmental hazards that threaten the ecological functioning of water bodies. Low flow with increased water temperature leads to a cascade of hydrochemical processes. This is a particular cause of concern for regions like eastern Austria, where agricultural land use and the projected risk of low flows and increased water temperatures due to climate change are particularly high. Under these scenarios, nutrient release from river sediments may become the dominant factor for the water quality of Iotic ecosystems. The role of this remobilization-potential for water quality is assessed in the project DIRT based on a combination of laboratory experiments with at-site water quality monitoring and regionalized streamflow observations.

Here we focus on space-time models of low flow and stream temperature, which are crucial for upscaling the remobilization potential along the river network. We present a study that compares different models for spatio-temporal low flow regionalization at the monthly scale in eastern Austria.

We evaluate three different statistical models: (i) a tree-based boosting model, (ii) a simple linear regression model with 3-way interactions, and (iii) a combination of a non-linear boosting approach and Top-kriging. Our results show a very high performance for all models, with an overall R² of 0.88 and a median R² of 0.70. The best performance is reached by the combination of Top-kriging with a non-linear boosting approach. However, accuracy of the model is somewhat lower in headwater gauges, whereas non-headwater catchments are even better modeled by a simple spatio-temporal Top-kriging approach. In a next step, the model shall be integrated with laboratory experiments and water-quality monitoring to develop space-time models that can predict the remobilization of pollutants from river sediments.

How to cite: Laimighofer, J., Pressl, A., Langergraber, G., Weigelhofer, G., and Laaha, G.: Comparison of spatio-temporal low-flow models for predicting remobilization of water pollutants, EGU General Assembly 2023, Vienna, Austria, 23–28 Apr 2023, EGU23-5516, https://doi.org/10.5194/egusphere-egu23-5516, 2023.

EGU23-5599 | ECS | Orals | HS2.3.1

Surprising consistency in event-scale nitrate export patterns across catchments 

Carolin Winter, James W. Jawitz, Matthew J. Cohen, Pia Ebeling, and Andreas Musolff

High nitrate concentrations in groundwater and surface water threaten drinking water quality and the integrity of aquatic ecosystems. Discharge events can play a disproportionate role in nitrate mobilization and transport from source to stream, while observed inter-event variability in export patterns is often high. One approach for analyzing the variability of nitrate export is the relationship between nitrate concentrations and discharge. Such C-Q relationships applied across different time scales can inform about source availability (or limitation) of the specific solute and hydrological connectivity to the stream network. Recent studies revealed striking differences between long-term and event-scale C-Q relationships for nitrate, and further that inter-event variability in C-Q relationships decreases with event magnitude (Knapp et al., 2020; Musolff et al., 2021; Winter et al., 2022). This suggests that an integrated measure for nitrate export from long-term data may be insufficient to understand these mechanisms. Here, we hypothesize that event-specific nitrate export patterns systematically diverge from long-term patterns and converge towards chemostatic or dilution patterns at high-magnitude events, depending on the availability and hydrological connectivity of nitrate sources within the catchment. To verify this hypothesis, we analyzed C-Q relationships across 41 catchments in the U.S., using daily discharge and nitrate concentration data. We compared long-term and event-specific C-Q relationships for 5067 discharge events and described inter-event variability in relation to event magnitude. We found that the long-term C-Q relationship was more dynamic than the one averaged for individual events and that the variability of event-specific C-Q slopes significantly decreased with event magnitude, indicating that different mechanisms of source mobilization and transport operate at different time scales and event magnitudes. Notably, high-magnitude events converged towards chemostatic patterns and rarely showed evidence of dilution and thus source limitation, which might hint at substantial nitrogen legacies. The divergence between long-term and event-specific C-Q slopes increased with the share of agricultural area and fertilizer application in the catchment. The consistent patterns in long-term and event-scale nitrate export patterns across a large number of catchments allow us to relate these patterns with the availability, spatial distribution and hydrological connectivity of nitrate sources within the catchments. As such, our study is an important step towards understanding the relevant mechanisms for nitrate mobilization and transport during runoff events.

References

Knapp, J. L., Freyberg, J. von, Studer, B., Kiewiet, L., and Kirchner, J. W.: Concentration-discharge relationships vary among hydrological events, reflecting differences in event characteristics, Hydrol. Earth Syst. Sci. Discuss., 1–27, https://doi.org/10.5194/hess-24-2561-2020, 2020.

Musolff, A., Zhan, Q., Dupas, R., Minaudo, C., Fleckenstein, J. H., Rode, M., Dehaspe, J., and Rinke, K.: Spatial and Temporal Variability in Concentration-Discharge Relationships at the Event Scale, Water Resour. Res., n/a, e2020WR029442, https://doi.org/10.1029/2020WR029442, 2021.

Winter, C., Tarasova, L., Lutz, S. R., Musolff, A., Kumar, R., and Fleckenstein, J. H.: Explaining the Variability in High-Frequency Nitrate Export Patterns Using Long-Term Hydrological Event Classification, Water Resour. Res., 58, e2021WR030938, https://doi.org/10.1029/2021WR030938, 2022.

How to cite: Winter, C., Jawitz, J. W., Cohen, M. J., Ebeling, P., and Musolff, A.: Surprising consistency in event-scale nitrate export patterns across catchments, EGU General Assembly 2023, Vienna, Austria, 23–28 Apr 2023, EGU23-5599, https://doi.org/10.5194/egusphere-egu23-5599, 2023.

EGU23-5744 | Orals | HS2.3.1

Quantification of the reasons for the bird lake brownification in Finland 

Katri Rankinen, Virpi Junttila, Martyn Futter, José Enrique Cano Bernal, Daniel Butterfield, and Maria Holmberg

Browning of surface waters due to increased terrestrial loading of dissolved organic carbon is observed across the Northern Hemisphere. Brownification is often explained by changes in large scale anthropogenic pressures (acidification, climate and land use). We quantified the effect of environmental changes on observed brownification of an important bird lake Kukkia in Central Finland. Water bird densities have decreased there during last decades, probably due to brownification of the lake. We studied past trends of organic carbon loading from catchments based on observations since 1990’s. We created scenarios for atmospheric deposition, climate and land use change to simulate their quantitative effect on brownification of the lake by process-based models (PERSiST for hydrology, INCA-C for carbon loading and MyLake for carbon processes in the lake). Increase in forest cut area appeared to be the primary reason for brownification of the lake. Decrease in acidic deposition has resulted in a lower leaching of dissolved organic carbon, but the effect is small. Runoff and total organic carbon leaching from terrestrial areas to the lake is smaller than it would have been without observed increasing trend in temperature by two degrees. 

How to cite: Rankinen, K., Junttila, V., Futter, M., Cano Bernal, J. E., Butterfield, D., and Holmberg, M.: Quantification of the reasons for the bird lake brownification in Finland, EGU General Assembly 2023, Vienna, Austria, 23–28 Apr 2023, EGU23-5744, https://doi.org/10.5194/egusphere-egu23-5744, 2023.

The requirements under the present River Basin Management Plans (RBMP) for the EU Water Framework Directive (WFD) are to reduce the total nitrogen (TN) loadings to the Hjarbæk Estuary in Denmark from the present (2015-2019) annual loading of 1900 tonnes N to 662 tonnes N in 2027. The catchment area to the estuary represents a total of 1177 km2 and the catchment is drained by four major streams. The Danish national monitoring programme has established gauging stations covering 969 km2 of the catchment area the remaining 208 km2 being ungauged areas. Modelled data on N-leaching from the root zone on agricultural fields and surface water monitoring data on N-export losses are available from the 1980’ies and onward.

A detailed mapping of nitrogen (N) attenuation in the catchment have been conducted at a scale of ca. 15 km2 (ID15 sub-catchments) including mapping of both N-retention in groundwater and surface waters as well as N-delays in groundwater in Karst sub-catchments. The mapping shows large differences in N-retention in groundwater within the ID15 sub-catchment (<20 % to >80 %) and the same large variation is seen for N-retention in surface waters (<20 % to >80 %). An analysis of delays in the transport for N from fields to surface waters have shown that especially one of the four monitored catchments (Simested stream) experiences a long delay in N repsonses (> 10 years).  

A new portfolio of N mitigation measures to be adopted at source (e.g. catch crops, early seeding, set a side, afforestation) or during transport from field to surface water (several types of constructed wetlands, riparian buffers and restored wetlands) has been scientifically approved and made available for farmers by the Danish EPA and Agricultural Agency.

The huge N-reduction needed in the Hjarbæk coastal catchment (65%) will require management efforts where farmers and authorities utilize both source oriented and transport oriented mitigation measures. These solutions should be implemented in a targeted manner guided by the local N-retention maps, as well as using all available monitoring data to pinpoint high-risk areas for N-leaching from fields and N-exports from the four sub-catchments as well as the ungauged areas. In this presentation we will showcase examples on how both targeted and collective mitigation measures can optimally be dosed in the Hjarbæk coastal catchment to reach the targets set in the RBMP 3.   

How to cite: Windolf, J., Tornbjerg, H., Larsen, S., and Kronvang, B.: Use of high spatial resolution nitrogen attenuation mapping in groundwater and surface waters for planning how to reach nitrogen reduction goals in 3rd River Basin Management Plans: Hjarbæk coastal catchment, Denmark, EGU General Assembly 2023, Vienna, Austria, 23–28 Apr 2023, EGU23-5800, https://doi.org/10.5194/egusphere-egu23-5800, 2023.

EGU23-6014 | Orals | HS2.3.1 | Highlight

Land to water phosphorus transfer processes under climate change 

Per-Erik Mellander, Daniel Hawtree, Golnaz Ezzati, Conor Murphy, Jason Galloway, Leah Jackson-Blake, Magnus Norling, Phil Jordan, Simon Pulley, and Adrian Collins

Water quality in European rivers is degraded by nutrient loss to waters, and such problems can be exacerbated by climate change. Climate smart mitigation measures are needed and these require insight into the underlying processes of nutrient loss under future weather conditions. To address this, the aim of this study was to assess how a changing climate may alter phosphorus (P) mobilisation, delivery and impact in two hydrologically contrasting agricultural river catchments (ca 11 km2) in Ireland. As part of the WaterFutures project and the Agricultural Catchments Programme, The Simply P model was calibrated with 10 years of high frequency data of hydro-chemo-metrics for the two catchments. Five downscaled Global Climate Models (CNRM-CM5, EC-EARTH, HadGEM2-ES, MIROC5 and MPI-ESM-LR) were used to simulate two far-future climate scenarios, one intermediate emission pathway (RCP4.5) and one intensive emission pathway (RCP8.5). The scenarios were used to estimate P concentrations and loads for the coming century. A newly developed P Mobilisation index (ratios of concentration percentiles) and P Delivery index (ratios of mass load percentiles) was used to assess changes in P transfer for the modelled P concentrations and P loads.

In a hydrological flashy catchment, it was estimated that climate change alone may increase mean annual total P (TP) concentration from 0.120 mg/L monitored between 2010-2019 to 0.184 mg/L by 2070-2100. A corresponding increase in Delivery index by around 25% and 40% (for RCP4.5 and RCP8.5, respectively) but no change in Mobilisation index suggests that the impact is mostly due to enhanced hydrological connection and/or reduced P retention. The mean annual total reactive P (TRP) concentration was estimated to show minor decreases from 0.079 mg/L to 0.075 mg/L. A corresponding decrease in the Mobilisation index by around 5% and 10% (for RCP4.5 and RCP8.5, respectively) but an increase in Delivery index by 25% and 40% suggests a possible decrease in soil P detachment and/or solubilisation, limiting the increased delivery potential. The same analysis on data from a groundwater-fed catchment suggests that climate induced changes in TP and TRP concentrations were mostly related to delivery processes for TP.

The underlying processes for P losses associated with climate change are likely to be different for TP and TRP and for catchments with different hydrological controls. Such information helps to target more resilient land use mitigation methods and further design these for scenarios of future weather conditions and land use.

How to cite: Mellander, P.-E., Hawtree, D., Ezzati, G., Murphy, C., Galloway, J., Jackson-Blake, L., Norling, M., Jordan, P., Pulley, S., and Collins, A.: Land to water phosphorus transfer processes under climate change, EGU General Assembly 2023, Vienna, Austria, 23–28 Apr 2023, EGU23-6014, https://doi.org/10.5194/egusphere-egu23-6014, 2023.

EGU23-6212 | ECS | Orals | HS2.3.1

Reducing future coastal eutrophication under global change in Europe 

Aslıhan Ural-Janssen, Carolien Kroeze, and Maryna Strokal

Agricultural production and sewer systems have been the main contributors to nutrient losses to surface waters. A high load of nutrients by rivers causes coastal eutrophication and leads to harmful algal blooms. Several negative environmental impacts of eutrophication include the production of toxins by cyanobacteria, fish kills, increased production of algae, and reduction in coral reef communities and aquatic vegetation. Despite the environmental policies and targets in Europe, rivers transport large amounts of nutrients to coastal waters and thus, coastal eutrophication is still an issue. Half of the nitrogen (N) exports by the European rivers to coastal waters is from agricultural production. The losses can increase if effective actions are not taken to improve agricultural management. As a result, the risks of coastal eutrophication will likely increase in the future coupled with global change including socio-economic development and climate change.

This study aims to assess the future river export of N and phosphorous (P) and explore options to reduce associated coastal eutrophication in Europe under global change with a focus on sustainable agriculture and urbanization. We use the MARINA-Nutrients (Model to Assess River Inputs of Nutrients to seAs) model for 601 European basins to quantify river exports of N and P in the 21st century, and calculate an indicator for coastal eutrophication potential (ICEP) to evaluate their impacts on coastal waters. We develop scenarios based on existing storylines (e.g., Shared Socio-economic Pathways, Representative Concentration Pathways) to quantify the impacts of socio-economic and climate changes on future coastal pollution in Europe. In our scenarios, we reflect on environmental policies (e.g., Green Deal, reduced waste, and improved wastewater treatment) from optimistic views.

Model results show that under the current practice approximately one-third of the European basin area, including 59% of the total population, is responsible for over half of nutrient losses to European rivers. Over one-fourth of river exports of N and P ended up in the Atlantic Ocean and the Mediterranean Sea around 2017-2020, respectively. On the other hand, intensive agriculture and technological development will increase nutrient pollution in coastal waters. For example, river exports of N and P to coastal waters are projected to increase by approximately 20-30% by 2050 under a scenario with high global warming and high urbanization rates. The Atlantic Ocean is projected to receive the largest portion of nutrient losses in the future compared to other European seas in 2050. In our scenarios, we analyze optimistic options to reduce future coastal eutrophication in European coastal waters. during the presentation, we will show the effects of several optimistic options (e.g., recycling of organic waste) on reducing coastal eutrophication. We will discuss the possible implications of the Green Deal and European environmental policies for coastal water quality in Europe.

How to cite: Ural-Janssen, A., Kroeze, C., and Strokal, M.: Reducing future coastal eutrophication under global change in Europe, EGU General Assembly 2023, Vienna, Austria, 23–28 Apr 2023, EGU23-6212, https://doi.org/10.5194/egusphere-egu23-6212, 2023.

EGU23-6952 | ECS | Orals | HS2.3.1

The Derivation of Irish Water Quality via Sentinel-2 Imagery 

MinYan Zhao and Fiachra O'Loughlin

The water quality in Republic of Ireland is regulated under the water framework directive (WFD), which requires all EU countries achieve good ecological and chemical status before 2027. However, the Irish Environmental Protection Agency (EPA) reports in 2021 that just half of the rivers, lakes, estuaries, and coastal waters achieved satisfactory or higher status.

Water quality in Ireland is monitored by traditional methods, which cannot provide timely spatiotemporal information. While remote sensing (RS)-based water quality monitoring work have been carried out in many EU countries in accordance with WFD directive, the use of RS for water quality estimation in Ireland has not been fully explored.

To explore the feasibility of RS for Irish waters, Sentinel-2 surface reflectance has been used to assess several water quality parameters (chlorophyll-a, transparency, turbidity, suspended solids (SS), total nitrogen, total phosphorus, biological oxygen demand (BOD), dissolved oxygen, and chemical oxygen demand (COD)) from March 2017 to July 2022. These were compared with the Sentinel-2 surface reflectance data resulting in a total of 6509 corresponding data points.

Initially, empirical algorithms were used to derive water quality concentrations in rivers, lakes, estuaries, and coastal waters separately. Initial results indicate that the combination of green and blue bands was correlated to coastal waters’ chlorophyll-a (R2 = 0.27). For chlorophyll-a in transitional waters, the combination of red and red edge was highly correlated. However, no single band or combination were suitable for deriving chlorophyll-a in lakes. For SS, red and near infrared band are useful in detecting changes in coastal and transitional waters. Whereas, for lakes and rivers, blue and shortwave infrared band were best to derive SS. In addition to empirical algorithms, multiple machine learning methods have been used to derive water quality parameters from Sentinel-2 reflectance, with the aim of exploring if machine learning approaches can improve estimates compared with the empirical approaches.

How to cite: Zhao, M. and O'Loughlin, F.: The Derivation of Irish Water Quality via Sentinel-2 Imagery, EGU General Assembly 2023, Vienna, Austria, 23–28 Apr 2023, EGU23-6952, https://doi.org/10.5194/egusphere-egu23-6952, 2023.

EGU23-7069 | ECS | Orals | HS2.3.1

Post-drought nitrate mobilization in German catchments     

Felipe Saavedra, Andreas Musolff, Jana Von Freiberg, Ralf Merz, Kay Knoll, Christin Müller, Manuela Brunner, and Larisa Tarasova

Nitrate excess in rivers is caused by anthropogenic nitrogen sources, such as agriculture and wastewater. Diffuse sources stemming from agricultural fertilization can remain in the soil for long periods of time as a legacy and are mobilized through hydrological pathways that connect sources with rivers. Previous studies show that drought periods can increase nitrogen stored in the soil due to lower nitrate transport to streams and less nitrate uptake by plants due to dry conditions. This accumulation of nitrogen during drought and its subsequent transport under wet conditions during the post-drought period can result in high nitrate concentrations in rivers.

In our study, we analyze the nitrate response of 190 German rivers during hydrological post-drought conditions from 1978 to 2019. We define droughts as periods with more than 30 consecutive days of discharge deficit using a variable threshold method and post-droughts as 100-day periods following the termination of a drought. We particularly focus on post-drought periods in the winter season that display the most pronounced concentration anomalies. Our results show that during the winter post-drought period, 66% of the catchments export higher nitrate concentrations compared to non-drought conditions, with 19% of the catchments exporting significantly higher nitrate concentrations (Kruskal-Wallis test, p-value<0.05). Catchments that exhibit a significant increase in nitrate concentrations during winter post-drought periods tend to be characterized by higher annual precipitation and shallower aquifers, indicating that fast hydrological transport could be a key factor in the winter post-drought delivery of nitrate excess. A projected increase in the frequency of severe droughts due to climate change could lead to more frequent post-drought episodes with high nitrate concentrations in the future. Understanding the main drivers of post-drought transport of nitrate across catchments is crucial for focusing management efforts efficiently.

How to cite: Saavedra, F., Musolff, A., Von Freiberg, J., Merz, R., Knoll, K., Müller, C., Brunner, M., and Tarasova, L.: Post-drought nitrate mobilization in German catchments    , EGU General Assembly 2023, Vienna, Austria, 23–28 Apr 2023, EGU23-7069, https://doi.org/10.5194/egusphere-egu23-7069, 2023.

EGU23-7478 | ECS | Posters on site | HS2.3.1

The controlling mechanism of nitrogen dynamics across a large river basin 

Hongkai Qi, Yi Liu, Xingxing Kuang, Xin Luo, and Jiu Jimmy Jiao

Investigating the dynamics and distribution of nitrogen (N) in river networks is essential for environmental management and pollution control. However, the controlling mechanisms of N dynamics across large watersheds are not well understood. In this study, we examined N concentration and stable isotopes (δ2H-H2O, δ18O-H2O, δ15N-NO3- and δ18O-NO3-) in river water and groundwater through field sampling from 284 sites across the Pearl River Basin, China. Preliminary results show that nitrate (NO3-) is the primary form of riverine dissolved inorganic nitrogen (DIN), and NO3- concentration is three times higher in the groundwater than in river water (mean of  330.5 ± 480.1 μmol/L v.s. 93.2 ± 65 μmol/L). The signature of δ15N-NO3- and δ18O-NO3- indicates that riverine nitrogen is primarily fromsoil organic N. The δ18O-NO3- values ranged from 2.76‰ to 7.52‰, indicating that nitrification is the dominant process in the N cycle of river water across the basin. Denitrification is not apparent in the water column because δ15N-NO3- does not show a negative correlation with NO3- concentration. We find that the source region has the highest NO3- concentration (187.1 ± 16 μmol/L) in river waters. The high cropland proportion (36.5% ± 5%) leads to higher soil N accumulation due to fertilization, and the highest oxidation-reduction potential (222.3 ± 7 mV) indicates the strongest oxidation environment for nitrification. As the nitrification process produces H+, which can consume carbonate and increase dissolved inorganic carbon (DIC), the highest DIC concentration (3139.3 ± 777.5 μmol/L) further proves the most robust nitrification process in the source regions. In conclusion, nitrification can control N dynamics and dominate NO3- distribution in river water in large watersheds.

How to cite: Qi, H., Liu, Y., Kuang, X., Luo, X., and Jiao, J. J.: The controlling mechanism of nitrogen dynamics across a large river basin, EGU General Assembly 2023, Vienna, Austria, 23–28 Apr 2023, EGU23-7478, https://doi.org/10.5194/egusphere-egu23-7478, 2023.

EGU23-7759 | ECS | Orals | HS2.3.1

Performance of a Parsimonious Phosphorus Model (SimplyP) in Two Contrasting Agricultural Catchments in Ireland 

Daniel Hawtree, Jason Galloway, Ognjen Zurovec, Leah Jackson-Blake, Magnus Norling, and Per-Erik Mellander

The Agricultural Catchment Program (ACP) has collected over a decade’s worth of high frequency data for a number of hydrologic and chemical indicators at agricultural catchments around the Republic of Ireland. This dataset provides an excellent foundation for conducting robust modelling studies assessing long term hydrochemical dynamics in agricultural sites, within the context of EU regulations around the protection of water quality.

To examine the risks of phosphorus (P) export from agricultural catchment in this context, the parsimonious phosphorus model SimplyP was applied to two ACP study sites. These sites are in close proximity and are of similar size to each other but have contrasting physical characteristics and hydrochemical dynamics. Site “A” is dominated by grasslands with heavy soils and is P export risky, while site “B” is primarily arable land-use on lighter soils and has a lower risk of P export.

In these catchments, SimplyP was used to simulate streamflow, sediment, and phosphorus (PP, TRP, TP) over the period of 2010 – 2019. The model is calibrated and validated independently three times to different objective functions (NSE, KGE, NSE log) to provide models focused on peak flows, balanced, and low flows, respectively. Model performance is evaluated over the entire calibration and validation period, as well as year-by-year assessments, which highlights the influence of meteorological and antecedent moisture conditions on model behaviour.

How to cite: Hawtree, D., Galloway, J., Zurovec, O., Jackson-Blake, L., Norling, M., and Mellander, P.-E.: Performance of a Parsimonious Phosphorus Model (SimplyP) in Two Contrasting Agricultural Catchments in Ireland, EGU General Assembly 2023, Vienna, Austria, 23–28 Apr 2023, EGU23-7759, https://doi.org/10.5194/egusphere-egu23-7759, 2023.

EGU23-7990 | Posters on site | HS2.3.1

Probabilistic modelling of water quality in the Ramganga River, India, informed by sparce observational data 

Miriam Glendell, Rajiv Sinha, Bharat Choudhary, Manudeo Singh, and Surajit Ray

Impaired water quality continues to be a serious problem in surface waters worldwide. Despite extensive regulatory water quality monitoring implemented by the Government of India over the past two decades, the spatial and temporal resolution of water quality observations, the range of monitored contaminants and data related to characterisation of point source effluents are still limited. In addition, discharge data for trans-boundary rivers is considered sensitive information and is not publicly available. Hence, quantifying, and mitigating pollutant loads and planning effective mitigation strategies are hindered by data paucity and there is an urgent need for the development of decision support tools (DST) that can account for these uncertainties.

In this study, we tested the application of a probabilistic DST based on Bayesian Belief Networks, to evaluate pollution risk from nutrients (phosphate, nitrate, ammonia), sediments and heavy metals (Cd, Cr, Cu, Pb, Zn) in the Ramganga river basin (30,839 km2), the first major tributary of the Ganga in the state of Uttar Pradesh, India, and is understood to be a significant source of pollution into the Ganga River, contributed from a range of industries, domestic sources and intensive farming practices. Bayesian belief networks are graphical causal models that enable to integrate observational data (both spatial and temporal) with data from literature and expert knowledge within a probabilistic framework, whilst accounting for uncertainty.

The objectives of this study were to 1) develop a parsimonious conceptual model of the system that allows harnessing diverse but limited data, 2) evaluate the important components of the system to inform further data collection and management strategies, and 3) simulate plausible management scenarios. We simulated the impacts of point source management interventions on pollution risk, including provision of sufficient municipal sewage treatment plant (STP) capacity, enhanced STP treatment levels and sufficient industrial wastewater effluent treatment capacity. We found a clear effect of enhanced STP interventions on improved regulatory standard compliance for nitrate (from 92% to 95%) and phosphate (from 33% to 41%). However, the effect of interventions on heavy metal pollution risk was not clear, due to considerable uncertainties related to the lack of reliable discharge data and the characterisation of industrial effluent quality. The parsimonious DST helped to collate the available understanding related to water quality impacts from multiple pollutants in the Ramganga river basin, while sensitivity analysis highlighted critical areas for further data collection.

How to cite: Glendell, M., Sinha, R., Choudhary, B., Singh, M., and Ray, S.: Probabilistic modelling of water quality in the Ramganga River, India, informed by sparce observational data, EGU General Assembly 2023, Vienna, Austria, 23–28 Apr 2023, EGU23-7990, https://doi.org/10.5194/egusphere-egu23-7990, 2023.

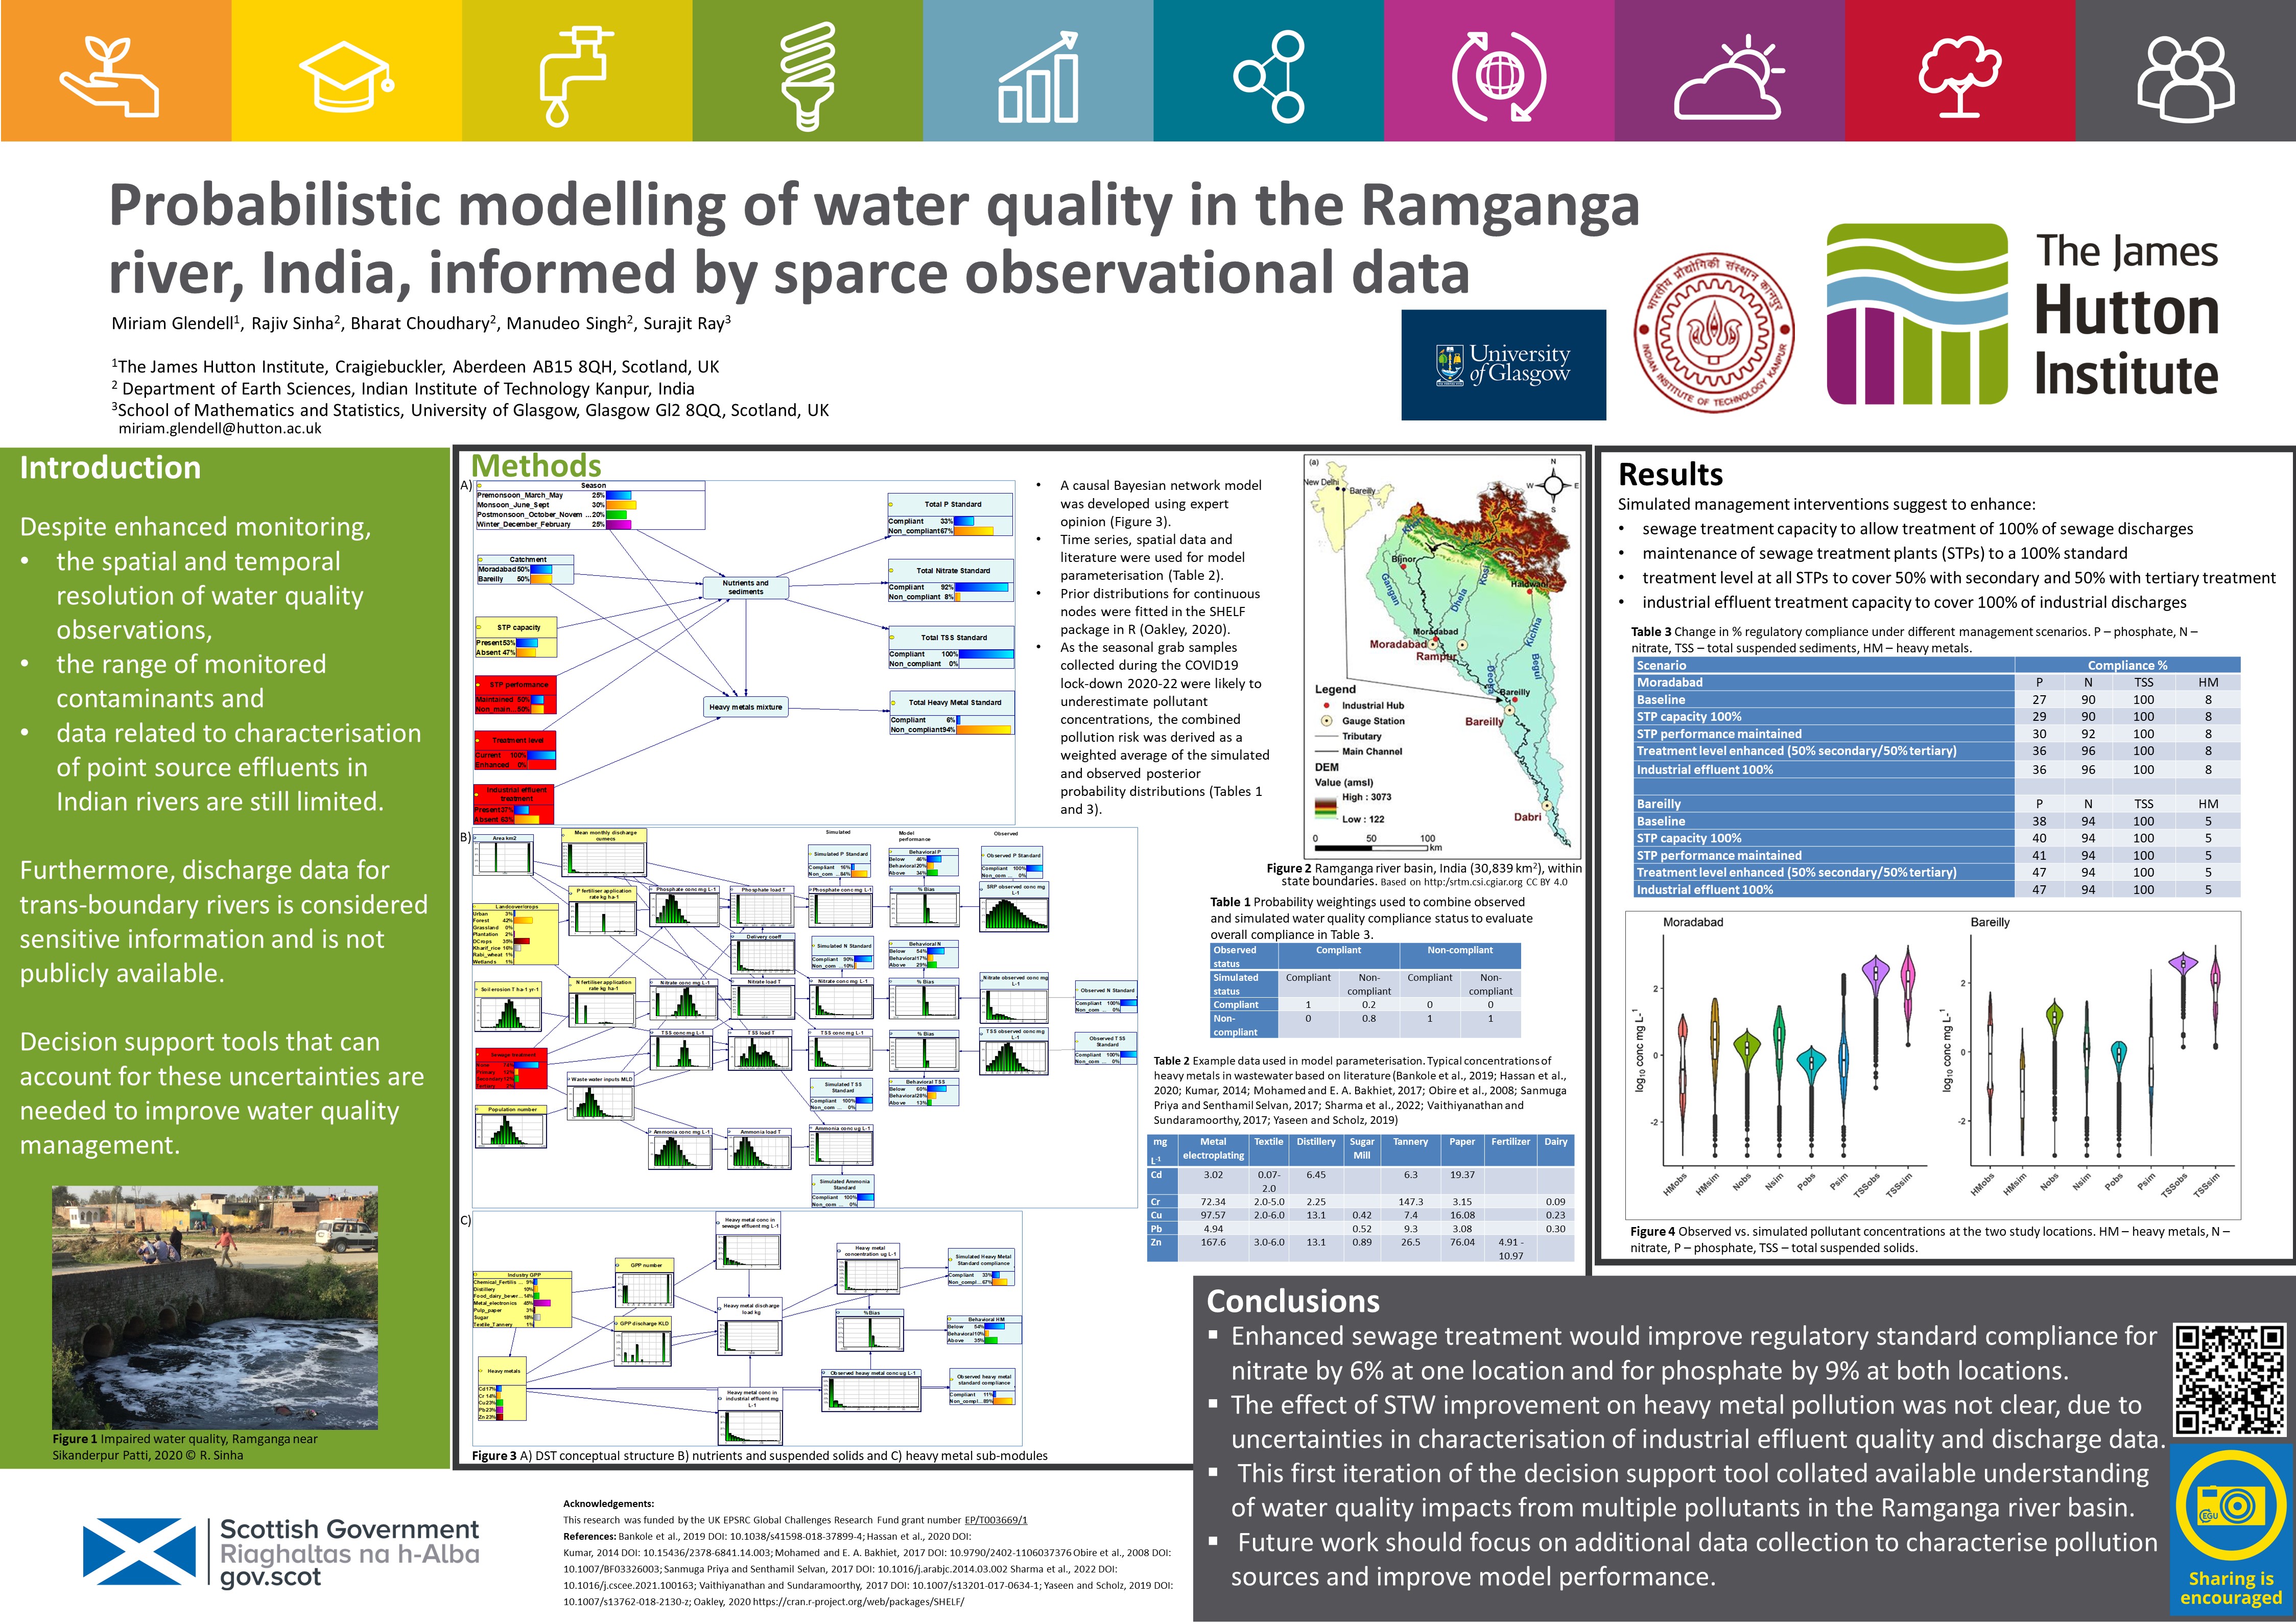
EGU23-9879 | ECS | Posters on site | HS2.3.1

High frequency monitoring of dissolved organic matter dynamics in urban headwaters: implications of monitoring resolution for process inference 

hongzheng zhu, Kieran Khamis, David M. Hannah, and Stefan Krause

Submersible optical sensor technology provides new opportunities for high frequency observations of riverine dissolved organic matter (DOM) and nutrients that cannot be achieved from traditional discrete sampling. High frequency data are essential to reveal the DOM transport, processing and transformation changes during storm events. However, previous studies have tended to focus on DOM mobilization and transport in rural catchments, largely neglecting urban headwater systems despite DOM behaviour being highly variable given complex interactions between varying sources and pathways in urban catchments. The few studies that have explored urban DOM dynamics have done so over relatively short timescales (e.g., seasonal) and have not systematically explored the impacts of monitoring resolution on DOM process interpretation. This is surprising given the dynamic nature of urban hydrological systems. To address this research gap, we collected high frequency water quality and hydro metrological data (5 min resolution, 10/21-10/22) for an urban headwater stream (Bourn Brook, Birmingham, UK). An in-situ multi-parameter sensor (Proteus, Eureka) was deployed for monitoring tryptophan-like fluorescence (TLF, Ex 275 nm/ Em 350 nm) and humic-like fluorescence (HLF, Ex 325 nm/ Em 470 nm). High temporal resolution data (5 minutes) were aggregated into 10,15, 30, 60,120,180 minutes datasets to explore the impacts on concentration-discharge (C-Q) patterns and hysteresis, thus aim to understand the effects of monitoring rate on interpretation of solute pathways and determine the sufficient temporal resolution to capture the salient urban DOM storm-driven dynamics. Our results highlight that at coarser monitoring frequency (>30 min), the “first-flush” of liable DOM is hard to detect, but the recession dynamic (usually consisting of more humic-like compounds) is still adequately captured. At monitoring frequencies > 30 min, both HLF and TLF displayed clockwise hysteresis indices, suggesting proximal DOM sources were delivered through the urban drainage system on the rising limb. However, figure of eight hysteresis was most commonly identified for both fluorescence peaks when sub-15 min data were investigated, which suggested a more complex relationship with multiple sources of DOM being mobilised during storm events. Furthermore, chemodynamic behaviour for both HLF and TLF was observed at monitoring frequencies >30 min; yet at higher monitoring frequencies TLF displayed chemostatic behaviour at high discharge. Our works not only emphasised the importance of conducting high frequency monitoring when designing urban water quality studies as coarser resolution monitoring will not fully capture the urban DOM dynamic, but also provides new insight into the importance of carefully considering monitoring frequency and provides guidance for adaptive monitoring approaches if installations are constrained by power requirements or data storage.

How to cite: zhu, H., Khamis, K., Hannah, D. M., and Krause, S.: High frequency monitoring of dissolved organic matter dynamics in urban headwaters: implications of monitoring resolution for process inference, EGU General Assembly 2023, Vienna, Austria, 23–28 Apr 2023, EGU23-9879, https://doi.org/10.5194/egusphere-egu23-9879, 2023.

EGU23-10405 | ECS | Posters on site | HS2.3.1

The influence of erosion sources on sediment-related water quality attributes 

Simon Vale, Hugh Smith, John Dymond, Rob Davies-Colley, Andrew Hughes, Arman Haddadchi, and Chris Phillips

Erosion of fine sediment and its delivery to streams pose significant issues for freshwater quality and  downstream receiving environments. Increased sediment delivery can lead to negative impacts due to changes to visual clarity (VC) and nutrient levels, which can degrade freshwater and marine environments. Most research on sediment in catchments focuses primarily on the total mass or quantity of sediment in relation to erosion, sediment transport, and deposition. In contrast, ‘quality’ aspects, notably particle size as it affects water quality, are not often evaluated, particularly in terms of their erosion source. This is problematic, as the physical qualities of sediment, which strongly affect environmental behaviour and influence water quality, may vary across catchments, geological parent materials, and erosion processes. Here, we assess the extent to which sources, defined spatially according to erosion process and geological parent material, may be discriminated, and classified by their sediment-related water quality (SRWQ) attributes. This involved 1) evaluating variability in SRWQ attributes across different sources; 2) reclassifying sources to the minimum number needed to adequately represent variation in attributes; and 3) assessing the potential influence of erosion sources on instream VC.

Erosion sources were sampled across two New Zealand catchments representing six types of erosion and eight parent materials. Sample measurements focused on particle size, organic matter content, and light beam attenuation (which is convertible to VC). Particle size attributes included three size fractions (<0.063mm, 0.063 – 2mm, and >2mm), particle size distribution (PSD) attributes (mean, D10, D50, and D90, based on both surface area (sur) and volume (vol) distributions). Organic matter related attributes included the percentage of particulate organic carbon (POC), particulate organic nitrogen (PON), inorganic suspended solids (InorgSS), and volatile suspended solids (VSS). Given its importance for predicting VC, light beam attenuation coefficient (beam- ) was measured and converted into beam-  to use as a SRWQ attribute.

The results indicate that SRWQ attributes show significant variation across erosion sources. The extent to which attributes differed between sources often related to whether there was a strong association between a specific erosion process and parent material. The 19 a priori source classifications were reduced to 5 distinct sources that combined erosion process and parent material (i.e., bank erosion – alluvium; mass movement – ancient volcanics; mass movement – sedimentary; surficial erosion; gully – unconsolidated sandstone). At low sediment concentration (SC), the impact of erosion source on VC became most evident ranging from 2.6 to 5.6 m at a SC of 5 g m-3. These findings showed how catchment sources of sediment, in addition to sediment concentration, influence VC, and highlight the need to consider quality as well as quantity of material supplied to stream networks when planning erosion control.

How to cite: Vale, S., Smith, H., Dymond, J., Davies-Colley, R., Hughes, A., Haddadchi, A., and Phillips, C.: The influence of erosion sources on sediment-related water quality attributes, EGU General Assembly 2023, Vienna, Austria, 23–28 Apr 2023, EGU23-10405, https://doi.org/10.5194/egusphere-egu23-10405, 2023.

EGU23-10487 | ECS | Posters on site | HS2.3.1

Predicting river water quality under different environmental factors and its significance with Machine Learning approach 

Sun Hee Shim, Hye Won Lee, and Jung Hyun Choi

River Water Quality (RWQ) is significantly influenced by natural and anthropogenic activities such as land use and land cover changes. Urbanization has led to an increase in impervious surfaces, which alters hydrological flow pattern and delivers non-point pollutants to the stream more efficiently. In addition, intensification of agricultural activities can result in the increased nutrient loads due to alternations in surface soil properties. Hence, it is necessary to understand the impact of surrounding environment with specific emphasis on geographical factors (e.g. climate change, land use patterns and landscape metrics) on the RWQ in order to develop sustainable water quality management strategies effectively. We collected pollutant concentration Biochemical Oxygen Demand (BOD), Total Phosphorus (T-P), and  Total Organic Carbon(TOC) from monitoring stations in the Nakdong River watershed. To utilize field monitoring data, we developed a Machine Learning (ML) models (DNN, XGBoost and Random Forest) to predict RWQ in accordance with different environmental factors. SHapley Additive exPlanations (SHAP) was used to illustrate the significance of land uses and landscape patterns on RWQ in Nakdong River. The results of this study can (1) demonstrate the relationship of water quality variables with land uses and landscape patterns, (2) identify pollution sources and factors that affect Nakdong River, and (3) support catchment managers and stakeholders in evaluating the benefits and risks of water management strategies in priority areas.

How to cite: Shim, S. H., Lee, H. W., and Choi, J. H.: Predicting river water quality under different environmental factors and its significance with Machine Learning approach, EGU General Assembly 2023, Vienna, Austria, 23–28 Apr 2023, EGU23-10487, https://doi.org/10.5194/egusphere-egu23-10487, 2023.

Landscape disturbance pressures in forested headwater regions can modify both the supply and transport of sediment from hillslopes to river networks. The effects of these pressures on phosphorus (P) mobility in rivers vary regionally depending upon the type and severity of the disturbance as well as interactions amongst other watershed scale controls such as climate, geology, hydrology and vegetation. The present study examines P dynamics in a gravel-bed river across multiple disturbances during environmentally sensitive periods of summer low-flow. Six study sites were selected to represent a gradient of sediment pressures from landscape disturbances (e.g., roads, harvesting, wildfire, sewage) in the Crowsnest River, Alberta. Interactions between fine bed sediments and soluble reactive phosphorus (SRP) were examined using equilibrium phosphorus concentrations (EPC0) and diffusive fluxes of SRP from the riverbed sediments. Diffusive fluxes at each site were estimated using gradients of SRP between pore-water in the bed and water column, determined from vertical distributions of SRP in the gravel matrix measured with pore-water peepers. SRP concentrations in pore-water were variable among depths and sites but were elevated downstream of the stream reach receiving primary sewage effluent outflow. Larger SRP concentration gradients were observed at sites that had either smaller substrate or increased biofilm activity. The EPC0 and diffusive pore-water flux data suggest that fine sediment in the riverbed acted as a source of SRP to the water column under low-flow conditions when the risk for eutrophication is higher and such conditions favor the growth of biofilms. EPC0 concentrations showed large inter- and intra-site variability indicating heterogeneous responses to disturbance. Furthermore, overlapping, and varying proportions of historic and contemporary harvesting, roads, road-stream or culvert crossings, and OHV use confounds the apportionment of landscape impacts. This study provides insight into the potential for the regulation of P by sediments in gravel-bed rivers following a range of landscape disturbance effects.

How to cite: Stone, M. and Watt, C.: Cumulative disturbance effects on phosphorus mobility in a gravel-bed river at the catchment scale, EGU General Assembly 2023, Vienna, Austria, 23–28 Apr 2023, EGU23-10511, https://doi.org/10.5194/egusphere-egu23-10511, 2023.

EGU23-10669 | Posters on site | HS2.3.1

Prediction and analysis of algal bloom trend in Yeongsan River using EFDC 

Hye Yeon Oh, Hye Won Lee, and Jung Hyun Choi

 Green algae, which is called water bloom, refers to a phenomenon in which cyanobacteria proliferate in large quantities and change the color of water to green. Algal bloom is one of the major water quality problems in freshwater ecosystems because it causes oxygen depletion in deep layer, oxygen supersaturation and toxicity in the surface layer, odor generation, fish death, and scum formation. Green algae are caused by hydraulic factors such as increased residence time due to the installation of hydraulic structures such as weirs, as well as physicochemical factors such as excessive influx of nutrients and rise in water temperature. One of Korea's four major rivers, the Yeongsan River, which originates in Damyang-gun, Jeollanam-do and flows into the West Sea, is experiencing water pollution problems, including algae, as the water quality and hydraulic environment change due to the construction and opening of weirs. Accordingly, Gwangju Metropolitan City, a large city where more than 80% of the population of the Yeongsan River basin resides, and Seungchon Weir, one of the two artificial weirs located in the Yeongsan River, were selected as the study area. In this study, the Environmental Fluid Dynamics Code (EFDC), a three-dimensional hydraulic and water quality dynamics model that can simulate various water quality indicators such as Chl-a, DO, T-N, and T-P, which was used to predict the trend of algal bloom in the study area.

How to cite: Oh, H. Y., Lee, H. W., and Choi, J. H.: Prediction and analysis of algal bloom trend in Yeongsan River using EFDC, EGU General Assembly 2023, Vienna, Austria, 23–28 Apr 2023, EGU23-10669, https://doi.org/10.5194/egusphere-egu23-10669, 2023.

EGU23-10753 | Orals | HS2.3.1

Modeling urban phosphorus export to receiving waters: magnitudes, speciation, and management implications 

Mahyar Shafii, Stephanie Slowinski, Yuba Bhusal, Md Abdus Sabur, Calvin Hitch, William Withers, Fereidoun Rezanezhad, and Philippe Van Cappellen

Understanding phosphorus (P) dynamics in urban landscapes is an emerging research topic as P export from urban landscapes towards aquatic ecosystems causes eutrophication-related challenges in these environments. We investigated P export and forms in four research sites in Ontario, Canada, including three urban catchments and a stormwater pond, all located within the Great Toronto Area in the drainage basin of Lake Ontario. We conducted P speciation laboratory analyses on runoff and suspended sediment samples to measure total P (TP), total dissolved P (TDP), dissolved reactive P (DRP), dissolved unreactive P (TDP–DRP), and PP (TP–TDP). Multiple linear regression (MLR) models were also developed to quantify annual loadings of these P species. Models indicated that P loadings in our sites were close to the lower limit of values reported in the literature, with the simulated range of 0.2—0.46 kg ha-1 yr-1 for TP export, 0.06—0.168 kg ha-1 yr-1 for TDP, 0.011—0.073 kg ha-1 yr-1 for DRP, 0.026—0.095 kg ha-1 yr-1 for DUP, and 0.163—0.288 kg ha-1 yr-1 for PP. In our MLR models, precipitation explained a large fraction of variability in loadings with the median of 58% across all models. Moreover, we realized that as the proportion of residential land within the drainage area increased, larger amounts of P loadings were exported at the catchment scale. Results also implied that pond served as a major P sink, with annual retention of 82, 93, 91, 94, and 77% for TP, TDP, DRP, DUP, and PP, respectively. Mass balance analyses based on sequential P extraction in the sediment core samples revealed that P retention was attributed to sedimentation in the ponds, as well as chemical precipitation of P with calcium mineral phases. In terms of P composition, most of P export in our sites (72—88%) were in particulate form. Besides, the ratio between dissolved forms and TP were the highest in the catchment with the largest amount green spaces. This study demonstrates that, as land-use characteristics impose variations in constituent loadings, urban P management options also have to be varying from a catchment to another. However, sediment removing practices such as the use of ponds will certainly be a reliable P retention approach as most of urban P could be sediment-bound. Furthermore, enhancing the formation of calcium phosphate and other redox-stable mineral phases could be explored as a best management practice in existing and new ponds for improving P retention.  

How to cite: Shafii, M., Slowinski, S., Bhusal, Y., Sabur, M. A., Hitch, C., Withers, W., Rezanezhad, F., and Van Cappellen, P.: Modeling urban phosphorus export to receiving waters: magnitudes, speciation, and management implications, EGU General Assembly 2023, Vienna, Austria, 23–28 Apr 2023, EGU23-10753, https://doi.org/10.5194/egusphere-egu23-10753, 2023.

Through precipitation, nutrients on the surface flow along the river and flow out to the coast. In order to effectively manage coastal water quality and ecosystem, it is essential to study the changes in terrestrial nutrient discharge to the coast through streamflow. However, research on long-term on estuarial or coastal water quality and river streamflow data remains limited particularly around the Korean Peninsula where long-term data for water quality and streamflow are available.
Here, this study aimed to investigate changes in inland nutrient fluxes the coastal regions around the Korean Peninsula and the contribution of changes of streamflow and water quality. The overarching question of this study is to which extent can changes in nutrient flux discharge be contributed by changes in streamflow or nutrient concentrations? First, we used observational data of rivers during the spring months (March through May) to assess changes in the nutrient fluxes over 2012–2021, which were springtime TN, TP and Chlorophyll-a nutrient fluxes from the inland to the coastal regions of the surrounding Korean Peninsula. Second, we conducted analytically a simple decomposition analysis of the relative contribution of changes in streamflow and nutrient concentration to the changes of nutrient fluxes model.
Results show that the change rate of annual spring nutrient (TN, TP, Chlorophyll-a) flux was more affected by streamflow flowrate (84, 51, 91%, respectively) than nutrient concentration (19, 48, 5%, respectively). In addition, the regional analysis of the nutrient flux on the Korean Peninsula (the western, northern, and eastern sides) showed the contribution of the western side was the largest to changes the total nutrient fluxes.
This study emphasized the importance of hydrological linkage between the water and nutrient cycles through an analytical approach, highlighting the potential impacts of changes of nutrient fluxes on off-shore ecological communities and aquacultural productivities.  

How to cite: Kim, Y. and Kam, J.: Observed Changes in Springtime Nutrient Flux Budget along the Korean Peninsula (2012-2021): Roles of Streamflow and Nutrient, EGU General Assembly 2023, Vienna, Austria, 23–28 Apr 2023, EGU23-10889, https://doi.org/10.5194/egusphere-egu23-10889, 2023.

EGU23-11646 | ECS | Posters virtual | HS2.3.1

Urban impact on water quality of a coastal catchment in Brazil 

Julia dos Santos da Silva, Patrícia Kazue Uda, Henrique Von Linsingen Pereira, and Priscilla Kern

Rapid and unplanned urban development has become critical to urban water resources in developing countries. In general, water quality degradation of rivers and ecosystems are result of lack of sewage treatment and urban management failures. In Brazil, the sanitary sewage system and the stormwater system are separated, and irregular connections of sewage to the pluvial network are common. In this context, it is fundamental to monitor water quality to understand how rivers are being modified by urbanization and, in the future, to propose measures for environmental recovery and for regulation of sanitation. Conceição Lagoon (CL), situated in the south of Brazil, is the largest lagoon system (21 km2) of Santa Catarina state. Similar to other regions in Brazil, water quality is degraded as a result of the urbanization of its basin. Thus, this study analyzed the influence of urbanization on the water quality of the largest sub-basin affluent to CL, the João Gualberto (JG) Basin (9.92 km2). Five field work were conducted, with measurements in loco and laboratory analysis, in two sample sites: upstream of urbanization (contribution area equal to 0.17 km2) and downstream of urbanization (contribution area equal to 6.07 km2). Were analyzed parameters capable of indicating contamination by sewage; chlorophyll-a; total coliforms (TC); fecal coliforms (FC); biochemical oxygen demand (BOD); total phosphorus; dissolved oxygen (DO); pH; ammonia, nitrate and nitrite. In addition, flow measurements to calculate the nutrient loads arriving in the lagoon and the trophic index (TRIX), which characterizes the trophic conditions of water bodies. Results were evaluated in regards to the resolution of CONAMA 357/05, which defines the maximum concentrations of water quality parameters for water bodies in Brazil. Chlorophyll-a concentrations were generally low. In regards to fecal coliforms, high values of 2419.6 MPN for TC were found at all points, with a maximum of 21.8 MPN of FC in upstream and 1046.2 MPN in downstream. Lower values of BOD, phosphorus, nitrite, ammonia and nitrate were obtained for the most upstream monitored point, and the highest values for downstream. The downstream of the river exceeded the limits in 0.110 mg/L N-NO2, 11.548 mg/L N-NO3 and 0.18 mg/L P, considered as the main sources of nutrients for the eutrophication process. DO values decreased from upstream to downstream, remaining within the limit such as for the pH. Differences in concentration of all parameters analyzed, at the upstream and downstream points, indicate domestic sewage releases, as it passes through urbanization. In relation to TRIX, the river presented an oligotrophic state in its upstream and eutrophic state for its downstream. The research allowed to confirm the JG river, the main tributary of the lagoon, contributes to the release of loads of nutrients and, consequently, to the eutrophication process of CL, expanding the understanding of the influence of surface runoff from the basin on the hydrodynamics of the lagoon.

How to cite: dos Santos da Silva, J., Kazue Uda, P., Von Linsingen Pereira, H., and Kern, P.: Urban impact on water quality of a coastal catchment in Brazil, EGU General Assembly 2023, Vienna, Austria, 23–28 Apr 2023, EGU23-11646, https://doi.org/10.5194/egusphere-egu23-11646, 2023.

EGU23-11746 | ECS | Orals | HS2.3.1

Quantifying the Downstream Impact of Implementing Irrigation in a Semi-Arid Mediterranean Basin in NE of Spain 

Víctor Altés, Miquel Pascual, Maria José Escorihuela, and Josep Maria Villar

Irrigation in arid and semi-arid regions is key to maintain the productivities and the well-being of farmers. However, irrigation is an important source of pollution to rivers due to the impact of agricultural drainage [1], which may contain high levels of salts, nutrients and other pollutants. In the present study we quantified the impact of implementing irrigation in a 10,000 ha semi-arid basin of the Noguera Ribagorçana river (Ebro Basin, NE Spain). Water quality data obtained during 20 years (2002-2022) in four different sampling points in the river (three before, and one after the main agricultural drainage returns of the basin, which drains 4,366 ha) were analyzed, focusing on nitrate concentration (NO3-, ppm), phosphate concentration (PO43-, ppm), and electrical conductivity of the water (EC, dS/m). In 2002, less than 4,000 ha were under irrigation and during the studied period, a total of 5,571 hectares were brought under irrigation progressively over time, with the implementation of a new irrigation district in the area. Results showed a significative difference in the concentration of NO3- in the river water before and after the main agricultural drainage return of the new irrigation district. However, phosphorous concentration and electrical conductivity showed no significative differences between the sampling points before and after the main agricultural drainage returns. On the other hand, NO3- values at the sampling point after the main agricultural drainage return have increased over time as it did the irrigated area. Thus, along the 18 km of the Noguera Ribagorçana river observed in this study, NO3- levels have increased on average from 1.7 ppm at the first sampling point to 10.9 ppm at the last sampling point, after the returns of agricultural drainage in the basin. Therefore, we could state that implementing irrigation in 5,571 ha represents an increase of 9.2 ppm of NO3- in the water of the Noguera Ribagorçana river in the studied area.

[1] Blann, K. L.; Anderson, J. L.; Sands, G. R.; Vondracek, B. Effects of Agricultural Drainage on Aquatic Ecosystems: A Review. Crit. Rev. Environ. Sci. Technol. 2009, 39 (11), 909–1001. https://doi.org/10.1080/10643380801977966.


How to cite: Altés, V., Pascual, M., Escorihuela, M. J., and Villar, J. M.: Quantifying the Downstream Impact of Implementing Irrigation in a Semi-Arid Mediterranean Basin in NE of Spain, EGU General Assembly 2023, Vienna, Austria, 23–28 Apr 2023, EGU23-11746, https://doi.org/10.5194/egusphere-egu23-11746, 2023.

EGU23-12117 | ECS | Posters on site | HS2.3.1

Watershed Characteristics and Water Quality in Suburban River in Tokyo: Asakawa River 

Masato Oda, Koji Kodera, Yoichi Morimoto, and Yoshihiro Igari

1. Introduction

In the Asakawa River, a suburban river in Tokyo, there are issues of water quality such as wastewater problems or substance runoff from forest ecosystem. To understand the water quality and characteristics of the river basin, not only field surveys but also comprehensive studies combining various methods are required. This study aims to clarify the characteristics of the Asakawa River watershed based on the results of field surveys, water quality analysis, and statistical analysis using the results.

2. Method

To understand the watershed characteristics and water quality of the Asakawa River, data analysis, field survey, water quality analysis, statistical analysis, and comparison with previous studies were conducted. Data analysis was conducted to obtain population trends and population density by township from the census results, changes in the watershed land use ratio from the National Land Numerical Data, and population trends by sewage treatment method from the Hachioji City Basic Plan for Domestic Wastewater Treatment 2014. Field surveys were conducted with monthly observations during a 17-month period from June 2020 to October 2021, and self-recording instrument observations from November 2021 to January 2022. Water quality analysis was conducted for total organic carbon and major dissolved constituents in July 2020, October 2020, January 2021 and September 2021. Ammonium ion, nitrite, nitrate and phosphate were measured of the samples of September,2021 . In the statistical analysis section, a cluster analysis was performed using the September 2021 data, which has the largest number of measured items. Comparison with previous studies was made between the electrical conductivity values of Ogura (1980) and Ota and Omori (2004) and the electrical conductivity values of the present field observations.

3. Results and Discussion

Monthly observations showed an increase in electrical conductivity (EC) during the winter months. The pH was low in winter, due to groundwater, and high in summer, possibly due to algal carbonate assimilation. In summer, pH was higher, because of carbon assimilation by algae. Nitrate ions were detected upstream in many locations, probably due to nitrogen saturation in the forest ecosystem. High concentrations of nitrate were detected in the Yamadagawa Riv., where wastewater from a sewage treatment plant flows in. It indicates that the wastewater from the plant has not been completely treated. Ammonium and nitrite were also detected upstream, indicating the effluent from the septic tank may have had an effect. Cluster analysis produced five clusters. In the Yudonogawa Riv., the upstream and downstream observation points were classified into different clusters, suggesting that water quality changes as the river flows downstream.

4. Conclusion

From this study, four issues in the Asakawa Riv. watershed were identified: the pollution caused by septic tank effluent in upper stream, nitrate runoff due to nitrogen saturation in the forest ecosystem upstream, pollution caused by the inflow of sewage treatment plant effluent into the small tributary named Yamadagawa Riv. and pollution caused by domestic wastewater from the Yudonogawa Riv. watershed which locates in southern part of its basin. To solve these problems, improvement of the watershed environment is required.

How to cite: Oda, M., Kodera, K., Morimoto, Y., and Igari, Y.: Watershed Characteristics and Water Quality in Suburban River in Tokyo: Asakawa River, EGU General Assembly 2023, Vienna, Austria, 23–28 Apr 2023, EGU23-12117, https://doi.org/10.5194/egusphere-egu23-12117, 2023.

EGU23-12436 | ECS | Orals | HS2.3.1

Impact of deforestation on catchment hydrology and nitrogen losses 

Mufeng Chen, Angela Lausch, Seifeddine Jomaa, Salman Ghaffar, Burkhard Beudert, and Michael Rode

Forest status in natural catchment is substantially important for hydrology and water quality, but it has been increasingly altered by human activities and climatic factors. Due to recent rapid changes in forest cover, there is an urgent need for hydrological water quality models which can adapt to these changing environmental conditions. The objective of this study was to analyse the impact of rapid continuous forest decline on nitrogen losses in a temperate mountain range catchment using a dynamic setting of the HYPE (HYdrological Predictions for the Environment) model. The modified model was applied to the Große Ohe catchment, Germany, which has experienced severe forest dieback (caused by bark beetle infestations) and its recovery over the last three decades. The model was validated by using also additional 25 years data from an internal gauge station (Forellenbach) and two soil measurement sites. Three scenarios, namely, no forest change, deforestation with subsequent regeneration, and deforestation without regeneration, were compared to identify key factors influencing catchment discharge and nitrogen export due to deforestation and regeneration. Results showed that the model performed well at the Große Ohe catchment scale, with Nash-Sutcliffe Efficiency values of 0.77 and 0.57 for discharge and IN concentration, respectively, and percentage BIAS values of -11.6% and 0.5%, respectively, during the validation period. Similar good performances were also observed at other scales. The simulation results proved that the improved model was able to (1) well capture the timing of peak flows and the seasonal dynamics of inorganic nitrogen (IN) concentration, and more importantly, (2) reflect the first increasing and then decreasing trend of discharge and IN concentration, in accordance with the deforestation and forest regeneration, respectively. By comparing scenarios, after experienced forest dieback without regeneration, the discharge and IN concentration exports were 24.9% and 160%, respectively, greater than those of scenario without forest change. However, the discharge and IN concentration exports were only 3.63% and 39.6% greater, respectively, with the help of continuous regeneration, indicating that forest regeneration is important for restoring hydrological and water quality status in the catchment. Compared to non-change scenario, the deforestation scenario exhibited decreased annual plant uptake of 34.7%, and strong increase in annual denitrification and N mineralization suggesting that the increased nitrogen export was likely induced by the reduction in vegetation uptake and the increased availability of soil nitrogen from tree residues. Overall, the adapted mechanistic modelling under the changing catchment forest conditions can strongly support forest management in terms of water quality.

How to cite: Chen, M., Lausch, A., Jomaa, S., Ghaffar, S., Beudert, B., and Rode, M.: Impact of deforestation on catchment hydrology and nitrogen losses, EGU General Assembly 2023, Vienna, Austria, 23–28 Apr 2023, EGU23-12436, https://doi.org/10.5194/egusphere-egu23-12436, 2023.

EGU23-13252 | ECS | Posters on site | HS2.3.1

Stoichiometry on the edge - Humans induce strong imbalances of reactive C:N:P ratios in streams 

Alexander Wachholz, Joni Dehaspe, Pia Ebeling, Rohini Kumar, Andreas Musolff, Felipe Saavedra, Carolin Winter, Soohyun Yang, and Daniel Graeber

Anthropogenic nutrient inputs lead to severe degradation of surface water resources, affecting aquatic ecosystem health and functioning. Ecosystem functions such as nutrient cycling and ecosystem metabolism are not only affected by the over-abundance of a single macronutrient but also by the stoichiometry of the reactive molecular forms of dissolved organic carbon (rOC), nitrogen (rN), and phosphorus (rP). So far, studies mainly considered only single macronutrients or used stoichiometric ratios such as N:P or C:N independent from each other. We argue that a mutual assessment of reactive nutrient ratios rOC:rN:rP relative to organismic demands enables us to refine the definition of nutrient depletion versus excess and to understand their linkages to catchment-internal biogeochemical and hydrological processes. Here we show that the majority (94%) of the studied 574 German catchments show a depletion or co-depletion in rOC and rP, illustrating the ubiquity of excess N in anthropogenically influenced landscapes. We found an emerging spatial pattern of depletion classes linked to the interplay of agricultural sources and subsurface denitrification for rN and topographic controls of rOC. We classified catchments into stoichio-static and stochio-dynamic catchments based on their degree of intra-annual variability of rOC:rN:rP ratios. Stoichio-static catchments (4036% of all catchments) tend to have higher rN median concentrations, lower temporal rN variability and generally low rOC medians. Our results demonstrate the severe extent of imbalances in rOC:rN:rP ratios in German rivers due to human activities. This likely affects the inland-water nutrient retention efficiency, their level of eutrophication, and their role in the global carbon cycle. Thus, it calls for a more holistic catchment and aquatic ecosystem management integrating rOC:rN:rP stoichiometry as a fundamental principle.

How to cite: Wachholz, A., Dehaspe, J., Ebeling, P., Kumar, R., Musolff, A., Saavedra, F., Winter, C., Yang, S., and Graeber, D.: Stoichiometry on the edge - Humans induce strong imbalances of reactive C:N:P ratios in streams, EGU General Assembly 2023, Vienna, Austria, 23–28 Apr 2023, EGU23-13252, https://doi.org/10.5194/egusphere-egu23-13252, 2023.

EGU23-14138 | ECS | Posters on site | HS2.3.1

Spatial vs temporal variability in German river water quality 

Linus S. Schauer, James W. Jawitz, Matthew J. Cohen, and Andreas Musolff

River water quality is degraded by a multitude of diffuse and point sources impeding ecosystem functioning and constituting a severe risk for human water security all over the world. Monitoring campaigns are the basis of evaluating water quality by characterizing probability of concentrations in time and space, allowing to identify solute source zones and flow paths. This knowledge can then aid in the development of effective water quality management strategies. However, it is not clear, whether current monitoring approaches provide sufficient information to allow to soundly characterize concentration probability over time and localize pollution sources in space. We propose a space-time variance framework to characterize spatial and temporal variation in river water quality and analyze its interplay. Specifically, we assess for discharge and two contrasting solutes (anthropogenic: NO3-, biogenic: DOC) by analyzing time series data across 1386 stations in Germany (Ebeling et al. 2022) . Variability is quantified by using the Coefficient of Variation (CV) of mean temporal and spatial variation of subsets of catchments. We find a large span of both spatial and temporal CV for discharge, NO3- and DOC. Overall, variability of discharge was considerably higher in time and space than the variation of NO3- and DOC. Differences between CVs of NO3- and DOC were smaller than expected from their different landscape sources. Apart from analyzing national to continental-scale data records, we plan to analyze archetypal patterns of solutes by utilizing a stochastic modelling approach. Ultimately, the aim is to inform stakeholders whether monitoring strategies such as synoptic sampling are viable approaches and to disentangle anthropogenic and natural drivers to illuminate their role for spatial and temporal variation in river ecosystems.

Ebeling, P., Kumar, R., Lutz, S. R., Nguyen, T., Sarrazin, F., Weber, M., Büttner, O., Attinger, S., and Musolff, A.: QUADICA: water QUAlity, DIscharge and Catchment Attributes for large-sample studies in Germany, Earth Syst. Sci. Data, 14, 3715–3741, https://doi.org/10.5194/essd-14-3715-2022, 2022.

How to cite: Schauer, L. S., Jawitz, J. W., Cohen, M. J., and Musolff, A.: Spatial vs temporal variability in German river water quality, EGU General Assembly 2023, Vienna, Austria, 23–28 Apr 2023, EGU23-14138, https://doi.org/10.5194/egusphere-egu23-14138, 2023.

1. Introduction
There are many volcanoes in the Japanese archipelago, and their formation factors and magma composition vary from volcano to volcano. Due to these differences in characteristics, it is expected that the water quality of rivers and springs around volcanoes will also differ. Based on the results of the measurement and analysis of river water quality in volcanic areas such as Mt.Tokachi, Mt.Asama, Mt.Kusatsu-Shirane, Mt.Ontake, Mt.Hakone, and Shinmo-dake where surveys and water sampling were conducted, we compared water quality in the water environment around each volcano and tried to understand the relationship between the characteristics of volcanoes and water quality.

2. Overview of the target area and survey/analysis methods
The target volcanoes were Mt.Tokachi, Mt.Kusatsu-Shirane, Mt.Asama, Mt.Ontake, Mt.Hakone, and Mt.Shinmoe. Each of these sites was surveyed several times to several dozen times, with frequency ranging from monthly to half a year, for several years. Water temperature, pH (RpH), electrical conductivity (EC), flow rate, COD, etc., as well as TOC (total organic carbon) and major dissolved constituents were measured in the field.

3. Results
The electrical conductivity (EC) values were generally low in the rivers around Ontake, and some rivers in Mt.Kusatsu-Shirane showed EC similar to that of the surrounding hot spring water due to the influence of the underground hydrothermal system. Mt.Tokachi, Mt.Kusatsu-Shirane, Mt.Hakone, and Mt.Shinmoe, and especially Mt.Kusatsu-Shirane and Mt.Hakone have rivers with values exceeding 3,000μS/cm. Since EC is affected by the recent eruption history, surrounding land use, wind-transported salt, and other factors, we will examine the effects of each of these factors to determine the influence of geological formation age and underground eruptive activity on the surface water quality of the volcanoes. The results suggest the possibility that the geological formation age and subterranean eruptive activity may have an impact on the surface water quality.

4. Conclusion
Based on the results of surface water quality analysis at volcanoes, we compared the characteristics of the water environment between volcanoes and attempted to understand the relationship between volcanic activity and surface water quality. The relationship between final volcanic activity (magmatic eruptions) at volcanoes and EC values around volcanic bodies shows a certain correlation, but it is suggested that the quality of surface water is affected by volcanic activity depending on the development of hydrothermal systems at each volcano and the most recent volcanic activity. In the future, we would like to explore methods for comparative research between volcanoes, paying attention to the effects of land use and wind-blown salt around volcanoes, and focusing more deeply on the relationship between dissolved constituents and volcanic activity.

How to cite: Igari, Y., Kodera, K., and Horiuchi, M.: Study on Comparative Assessment of Water Environment around Volcanoes Focusing on Surface Water Quality -Case studies in volcanic areas around Japan-, EGU General Assembly 2023, Vienna, Austria, 23–28 Apr 2023, EGU23-15467, https://doi.org/10.5194/egusphere-egu23-15467, 2023.

Many surface water lakes in northern Europe have seen a rise in their organic matter content. When the water is used for human consumption, this has an indirect effect on human health, by increasing the risk of pathogens appearance and of biofilm formation after water treatment. Besides, organic matter negatively affects the color, odor and taste of water, which displeases the consumers. In order to ensure a good drinking water quality at the tap, its treatment should thus be adapted to the organic matter content.

In this study we (i) characterize the trend and seasonality patterns of organic matter in the Gileppe Lake over the last 20 years and (ii) unravel mechanisms causing the observed fluctuations using time series statistical modelling. The water reservoir created by the Gilleppe dam in the North of Wallonia has an available volume of 3.100.000 m³. It is used to supply a hydro-electric power plant, and to provide drinking water to the city of Verviers and its surroundings. The water producer « Société Wallonne des Eaux (SWDE) » extracts an annual volume of around 14 million m³ to that end. The SWDE has been measuring the quality of the extracted water since 1991, at an increasing frequency. These measurements include parameters related to organic matter content such as total organic carbon (TOC), color and chemical oxygen demand.

The TOC concentrations in the Gileppe lake indicate there has been a rise in organic matter in the Gileppe lake since the 90’s, as the concentration was 3,7 mg/l in October 1997, and increased to 10,4 m/l in October 2019. The TOC also has a seasonal variability, with the highest concentration peaks being reached during the autumn.

We characterize the evolution of the potential drivers of the increasing trend and the seasonality: climate (precipitation, T°), land use (mainly forest cover area and type) and anthropogenic pressure (presence of septic tanks, wastewater release, agricultural runoff). We then investigate if, according to the literature, the evolution of these variables could explain of the observed organic matter trends and seasonality.

How to cite: Verstraeten, E., Alonso, A., and Vanclooster, M.: Characterizing the drivers of organic matter fluctuations in surface water lakes: the case of the Gileppe water reservoir in Wallonia (Belgium), EGU General Assembly 2023, Vienna, Austria, 23–28 Apr 2023, EGU23-15570, https://doi.org/10.5194/egusphere-egu23-15570, 2023.

Keywords

Freshwater pollution, climate change, water quality monitoring, emerging contaminants, diffuse agricultural pollution, catchment monitoring.

Abstract

Despite the implementation of river basin management plans across EU, river water quality is in decline with agriculture, forestry and hydromorphological pressures now the dominant pressure for river waters in Ireland.  The number of high quality river sites reflecting natural, undisturbed conditions declined from 31.6% of river sites monitored in 1990 to just 1.1% of monitored sites in 20211

Climate change increases in heavy rainfall events in conjunction with flooding will lead to increased suspended solid and nutrient loadings in rivers2 with a substantial upsurge in the intensity of winter rainfall together with increasing frequency in heavy rainfall events3 in Ireland4 leading to increased pollution of freshwater systems and a surge in transient pollution events.

‘Reliable high quality information on the environmental quality of surface waters’ is critical for  agencies to make evidence based decisions on appropriate management measures to restore water quality at European scale5.  However current water quality monitoring programmes in Ireland rely heavily on grab water samples which is inadequate at detecting transient pollution6

Are transient pollution events contributing to increased solids, nutrients loads and emerging contaminants affecting aquatic species in these declining Q5 sites?  This research aims to investigate by applying field assessments, sensor technology and automatic sampling to two river stations in the North West of Ireland; on the River Unshin a high ecological status water body and on the River Owenmore, a moderate ecological status water body.  As the pathway from land to waters for multiple diffuse agricultural pollutants, including phosphorus, sediment and pesticide are similar7 and turbidity can be used as an indicator for suspended sediment8, a baseline turbidity survey is being carried out to identify a ‘trigger level’ above which the collection of water samples is initiated. 

Other research has shown no simple relationship between discharge, turbidity and precipitation9 but initial baseline data obtained shows some correlation with turbidity and increased flows.

References

(1)          Trodd, W.; O’Boyle, S.; Gurrie, M. 2022.

(2)          Whitehead, P.; Butterfield, D.; Wade, A., SC070043/SR1; Environment Agency: Bristol, 2008; p 115.

(3)          Murphy, C.; Broderick, C.; Matthews, T. K. R.; Noone, S.; Ryan, C. EPA Research Report 277; Maynooth University, 2019; p 76. https://www.epa.ie/publications/research/climate-change/research-277-irish-climate-futures-data-for-decision-making.php (accessed 2023-01-09).

(4)          O’Connor, P.; Meresa, H.; Murphy, C., Weather 2022. https://doi.org/10.1002/wea.4288.

(5)          Kristensen, P.; Bogestrand, J. Surface Water Quality Monitoring — European Environment Agency January 1996; European Topic Centre on Inland Waters; Publication; National Environmental Research Institute: Denmark, 1996; p 82. https://www.eea.europa.eu/publications/92-9167-001-4 (accessed 2023-01-09).

(6)          Regan, F.; Jones, L.; Ronan, J.; Crowley, D.; Mcgovern, E.; Mchugh, B.; 2018.

(7)          Thomas, I.; Bruen, M.; Mockler, E.; Werner, C.; Mellander, P.-E.; Reaney, S. M.; Rymsezewicz, A.; McGrath, G.; Eder, E.; Wade, A.; Collins, A.; Arheimer, B.; EPA RESEARCH PROGRAMME 2021–2030; EPA Research Report 396; University College Dublin: Dublin, 2021; p 64. https://www.epa.ie/publications/research/water/Research_Report_396.pdf.

(8)          Uhrich, M. A.; Bragg, H. M.; Water-Resources Investigations Report, 2003; p 2. https://doi.org/10.3133/wri034098.

(9)          Wang, K.; Steinschneider, S. Water Resources Research 2022, 58 (10), e2021WR031863. https://doi.org/10.1029/2021WR031863.

How to cite: Cronin, L., Regan, F., and Lucy, F. E.: Detection of transient pollution events in an Irish river catchment in the context of increasing frequency and intensity of rainfall events due to climate change, EGU General Assembly 2023, Vienna, Austria, 23–28 Apr 2023, EGU23-15993, https://doi.org/10.5194/egusphere-egu23-15993, 2023.

EGU23-16201 | ECS | Orals | HS2.3.1

Rapid Phosphate Monitoring in Irish Freshwater Systems Using a Novel Microfluidic Colorimetric System 

Rachel Bracker, Lisa Cronin, Aironas Grubliauskas, Louis Free, Joyce O’Grady, Sean Power, Karen Daly, Nigel Kent, Fiona Regan, and Blánaid White

The discharge of phosphorus associated with wastewater has decreased significantly in Europe over the past 25 years1, however the problem of diffuse pollution persists2.  Studies have shown that regulatory monitoring can miss elevated spikes in phosphorus concentrations3 and high frequency monitoring is required4. Such programmes are resource intensive, requiring effective tools which enable appropriate water quality data collection and quality assurance5.

A low cost, portable, and rapid phosphate detection system is needed to enable the quick detection of phosphate in areas affected by high phosphate levels6. A new system is being developed by evolving a colorimetric detection system using microfluidic lab-on-a-disc technology which has previously been demonstrated7. It utilizes a micro-spectrometer and the molybdenum blue method, and has been built with the intent of requiring limited training.

The range of the system is 5-400 µg/L, which encompasses the threshold value of 35 µg/L P for Irish rivers and groundwaters8. The system is extremely portable due to its compact size and weighing less than 2 kg. With a run time of 15 minutes per ten samples, it enables the in-situ detection of phosphate for rapid on-site monitoring.

To test the system, rivers in the northwest of Ireland were identified. Three of these rivers have historical orthophosphate readings in the range of 5 - 47 µg/L and two others were reported considerably higher at 84 µg/L.  

With this microfluidic phosphate detection system, rapid in-situ detection and reliable, real-time monitoring of phosphorus in freshwater systems can be achieved. 

References:

1)European waters -- Assessment of status and pressures 2018 — European Environment Agency. https://www.eea.europa.eu/publications/state-of-water (accessed 2022-06-13).

2)Biddulph, M.; Collins, A. l.; Foster, I. d. l.; Holmes, N. The Scale Problem in Tackling Diffuse Water Pollution from Agriculture: Insights from the Avon Demonstration Test Catchment Programme in England. River Research and Applications 2017, 33 (10), 1527–1538. https://doi.org/10.1002/rra.3222.

3)Fones, G. R.; Bakir, A.; Gray, J.; Mattingley, L.; Measham, N.; Knight, P.; Bowes, M. J.; Greenwood, R.; Mills, G. A. Using High-Frequency Phosphorus Monitoring for Water Quality Management: A Case Study of the Upper River Itchen, UK. Environ Monit Assess 2020, 192 (3), 184. https://doi.org/10.1007/s10661-020-8138-0.

4)Bowes, M. J.; Palmer-Felgate, E. J.; Jarvie, H. P.; Loewenthal, M.; Wickham, H. D.; Harman, S. A.; Carr, E. High-Frequency Phosphorus Monitoring of the River Kennet, UK: Are Ecological Problems Due to Intermittent Sewage Treatment Works Failures? Environ. Monit. 2012, 14 (12), 3137–3145. https://doi.org/10.1039/C2EM30705G.

5)Quinn, N. W. T.; Dinar, A.; Sridharan, V. Decision Support Tools for Water Quality Management. Water 2022, 14 (22), 3644. https://doi.org/10.3390/w14223644.

6)Park J.; Kim, K. T.; Lee; W. H. Recent advances in information and communications technology (ICT) and sensor technology for monitoring water quality. 2020, Water, 12 (2)

7)O’Grady, J., Kent N., Regan, F. (2021). Design, build and demonstration of a fast, reliable  portable phosphate field analyser. Case Stud. Chem. Environ. Eng., 2020, 4, 100168

8)Tierney, D.; O’Boyle, S. Water Quality in 2016: An Indicators Report; Environmental Protection Agency, Ireland: Wexford, 2018; p 48.

How to cite: Bracker, R., Cronin, L., Grubliauskas, A., Free, L., O’Grady, J., Power, S., Daly, K., Kent, N., Regan, F., and White, B.: Rapid Phosphate Monitoring in Irish Freshwater Systems Using a Novel Microfluidic Colorimetric System, EGU General Assembly 2023, Vienna, Austria, 23–28 Apr 2023, EGU23-16201, https://doi.org/10.5194/egusphere-egu23-16201, 2023.

EGU23-16398 | ECS | Orals | HS2.3.1

Main drivers of the seasonal and annual changes in phosphorus content in the Guadaira river (South of Spain) 

Manuel Jesús Jurado-Ezqueta, Eva Contreras, Cristina Hidalgo, Laura Serrano, and María José Polo

High amounts of nutrients favor the growth of algae that consume oxygen from the aquatic environment causing eutrophication. In the case of phosphorus, it comes mainly from two sources: fertilizers washed from agricultural areas by runoff water and urban and industrial development. In the first case, the phosphorus loads do not have a clear point of entry into the water channels, whereas in the second one, the phosphorus loads can be generated from point sources, such as discharges from the wastewater treatment plants (WWTP) but also from non-point sources, such as urban areas runoff in episodes of intense rainfall. 
The main purpose of this work is to analyze the content of phosphorus in water for more than 40 years and inquiry into the origin of the sources that may have produced the phosphorus loads. For this purpose, the Guadaira river basin (South of Spain), where agricultural land uses converge with numerous human activities resulting in high pressures on water quality, was selected. 
The results highlight that the phosphates threshold value established for good/moderate state (0.32 mg PO4/l) is exceeded by 96% of the measurements during the period 1981-2022 in a water quality control point located downstream of the main WWTP, which threat the wastewater of Seville, and that in addition collects the contributions from the other WWTPs and agricultural lands located in the basin. The episodes of sediment contribution that occurred during the period 1981-2022 were analyzed at this control point, and from the 184 episodes found, 30 episodes may have been due to runoff (which also may have originated from agricultural areas or from the overflow of water collectors) (type 1 episodes) and 79 may have been due to urban spills (type 2). 80% of both types of episodes were found to be higher than 1.5 mg/l being able to reach concentration values of up to 14 mg/l. Most of the episodes of dry months were categorized as type 2, reaching the highest concentration values (8-17 mg/l), while type 1 episodes were mostly present in rainy months.

Finally, despite the increase of the stable population (+0.52% ∼ +1.42% per year between 2000 and 2012) and tourism (average ≈ +3.23% per year), the WWTP improvement has achieved a decrease in the mean phosphorus concentrations of -0,2% per year. Despite the investment in the WWTP of the basin is necessary to improve its operation and efficiency as well as its adaptation to the increase in population and tourism to ensure better water quality of the water resources.

Acknowledgements: This work has been funded by the project TransDMA – Adaptation of the Water Framework Directive to the Andalusian reality: The Guadalquivir estuary as an integrated management model, promoted by the Ministry of Economy, Knowledge, Business and University and co-financed by the operational program FEDER 2014-2020 in Andalusia.

How to cite: Jurado-Ezqueta, M. J., Contreras, E., Hidalgo, C., Serrano, L., and Polo, M. J.: Main drivers of the seasonal and annual changes in phosphorus content in the Guadaira river (South of Spain), EGU General Assembly 2023, Vienna, Austria, 23–28 Apr 2023, EGU23-16398, https://doi.org/10.5194/egusphere-egu23-16398, 2023.

EGU23-16608 | Posters on site | HS2.3.1

Robustness of the nitrate transfer model NIT-DRAIN in an artificially drained agricultural area 

Hocine Henine, Samy Chelil, Cedric Chaumont, and Julien Tournebize

Nitrate leaching due to excessive agricultural fertilization affects the quality of both surface and ground water. The presence of subsurface drains in agricultural areas introduces significant modifications to the hydrological behavior and results in the increase of nutrients and fertilizers losses from farmland to surface water. The recent development of the NIT-DRAIN conceptual model allows the simulation of nitrate transfer at the agricultural drainage system outlet and the estimation of the initial prewinter nitrogen pool (PWNP), equivalent to the remaining nitrogen pool at the start of winter season. This model was applied to three representative drained agricultural areas in France (La Jaillière, 1 ha; Gobard, 36 ha and Rampillon, 355 ha). The hourly drainage discharge and nitrate concentration data are recorded over a period of several years. The objective of this study is to evaluate of the spatiotemporal robustness of the NIT-DRAIN model, by testing the functioning of the model regarding a single or a generic set of model parameters for the three study sites.

The results showed that the model estimation of the PWNP is more precise at the small scale (Jailliere site). At the large scale, the PWNP estimation is slightly different from the measurement (<10kgN/ha). The model calibration for each study site shows high model performance for nitrate fluxes and concentrations, with Nash-Sutcliffe criterion greater than 0.6. These performances are preserved when calibrating a generic set of parameters to all the three sites. These results validate the robustness of the NIT-Drain model. This study present a simplified and operational approach for the quantification of PWNP applied to the subsurface drained agricultural lands by measuring nitrate concentration at outlet instead of soil core sampling.

How to cite: Henine, H., Chelil, S., Chaumont, C., and Tournebize, J.: Robustness of the nitrate transfer model NIT-DRAIN in an artificially drained agricultural area, EGU General Assembly 2023, Vienna, Austria, 23–28 Apr 2023, EGU23-16608, https://doi.org/10.5194/egusphere-egu23-16608, 2023.

Due to rising water quality-related issues, a periodic and continuous monitoring system is mandatory for inland water bodies. Water quality estimation is essential for water resource management and the sustainability of riverine ecosystems. Existing in-situ, field-based, and wet laboratory estimations, although precise and accurate, account for the lack of spatial and temporal variability and represent point sampled assessment. With a high temporal resolution and fine spatial resolved scaling, remote sensing data, including the Landsat-8,9 series, and Sentinel-2 series, consecutively provide high-spatio-temporal resolution observations for real-time analysis. The Google server and cloud-based Google Earth Engine (GEE) platform support image collections, atmospherically-radiometrically corrected imagery, and large-data processing. Taking the inland waterbodies of Delhi as the study area, this study is carried out in GEE to (i) design, inquire and pre-process all Landsat and Sentinel series observations that coincide with in situ measurements; (ii) extract the spectra to develop empirical models for water quality parameters and (iii) visualize the results graphically using geospatial distribution maps, time-series charts, and create a web-application. Water quality parametric analyses were conducted for Optically Active constituents (OAC), i.e., chlorophyll-a, suspended solids, and turbidity. Validation with an independent site location is the next area of study for estimating the predicted and observed values. Spectral characteristics show correlation and similarity with the field data and active optical constituents. Besides visualizing long-term spatial and temporal variabilities through thematic maps and time-series charts, anomalies such as eutrophication at specific sites can also identify using the models developed. An online application is in progress to allow users to explore and analyze water quality trends using the latest Landsat-9 dataset. Integrating remotely-sensed images, in situ measurements, and cloud computing can offer new opportunities to implement effective monitoring programs and understand water quality dynamics.

How to cite: Galodha, A., Lall, B., Ahammad, S. Z., and Anees, S.: Spatio-temporal, geospatial, and time series analysis of water quality estimation using Landsat 8,9, Sentinel-2, and MODIS series for the region of India: A Google Earth Engine based web-application, EGU General Assembly 2023, Vienna, Austria, 23–28 Apr 2023, EGU23-16876, https://doi.org/10.5194/egusphere-egu23-16876, 2023.

EGU23-17358 | ECS | Orals | HS2.3.1

Modeling the impact of land-use and climate change on water quality of a deep dam reservoir 

Yu-I Lin, Mei-Siang Yu, Hue-Shien Chang, and Shu-Yuan Pan

Te-Chi Reservoir is an multipurpose reservoir, which supplies drinking water for a population of ~2,800,000 and generate hydroelectric power in the Taichung city, Taiwan. In the past 10 years, this reservoir experienced several events of algal blooms and extreme drought. According to the historical water quality data, the frenauency of the trophic state for the reservoir has increased in the recent years. The N/P ratios of the reservoir are generally greater than 15, indicating that the limited nutrient of eutrophication is phosphorous. In this study, we developed an integrated model to predict the water quality of the reservoir using an input of 10-year observational data. A hydrological stream flow model (i.e., SWAT) was integrated with the simple phosphorous (P) input-output models (i.e., the Vollenweider model) to simulate the change of the trophic state and the concentration of P in the reservoir. We first investigated the hydrological variability impact on the P load in past three year when the extreme weather (drought) happened.The results showed that the concentraion of total phosphorous (TP) was significantly influenced by the inflow of the river to the reservoir and the precipitation (rainfall). The simulated concentrations of TP in dry seasons were typically higher than that in the wet seasons. During the drought, the internal loading, such as resuspension, played a significant source of P for the reservoir. We also investigated the sources and loads of key water pollutants, especially nitrogen and phosphorous, from the spatial aspect in the watershed of the reservoir. The results indicated that the TP loads of each sub-catchment area ranged from 2.76 to 4.12 kg/h. Furthermore, in order to understant the feasibility of establishment of riparian buffer strip, the effect of the land use change on water quality was simulated. This study demonstrated the application of the integrated SWAT-Vollenweider model for a reservior to identify the drivers of pollutants for managing its watershed to mitigate the potential of eutrophication.

How to cite: Lin, Y.-I., Yu, M.-S., Chang, H.-S., and Pan, S.-Y.: Modeling the impact of land-use and climate change on water quality of a deep dam reservoir, EGU General Assembly 2023, Vienna, Austria, 23–28 Apr 2023, EGU23-17358, https://doi.org/10.5194/egusphere-egu23-17358, 2023.

Chromium (VI) [Cr(VI)] is abundantly used for several industrial applications especially in stainless steel production and as an anti-corrosive agent in ceramics, textile industries and tanneries. Despite its versatile uses, Cr (VI) is a major environmental threat and is a known carcinogen. Therefore, proper precaution must be implemented while working with Cr (VI) or while disposing it after use. Due to improper handling and lack of proper care, Cr(VI) is still found in industrial wastewaters or landfill sites. The Cr(VI) in landfills can leach into the ground during rainfall and can risk the contamination of the groundwater causing a health catastrophe when consumed. This study focuses on effective Cr(VI) remediation by the process of adsorption. Magnetite particles synthesized by co-precipitation method at various temperatures (room temperature of 25οC, 60οC and 90οC) are used as an absorbent for achieving maximum removal efficiency of Cr(VI) from water. An initial concentration of 10mg/l at pH 7.2 and time of contact 10 minutes is taken as the starting parameters for Cr(VI) for the batch adsorption studies. The surface morphology, chemical composition and the magnetic properties of the magnetite particles are determined from FESEM (Field Emission Scanning Electron Microscope), EDS (Energy-Dispersive  Spectroscopy) and VSM (Vibrating Sample magnetometer) characterization methods, respectively. The synthesis of the magnetite particles at various temperatures can affect both its physical (mainly pore size, shape, texture etc.) and magnetic properties and therefore can pose significant changes on the adsorption efficiency. The effect of the magnetite particle dose, pH of Cr(VI), time of contact between the magnetite particles and Cr(VI) and the effect of the change in the concentration of Cr(VI) are predicted in this study. A special focus is given on determining the variation in the magnetic properties of the magnetite particles due to different temperatures of synthesis. In case of any such noteworthy change in the magnetic properties, the alteration in the individual adsorption capacities of the iron-oxide particles are highlighted in this study. Langmuir and Freundlich isotherm models are used to predict the adsorption mechanisms.

Keywords: Adsorption; Magnetite particles; Characterization; Magnetic properties; Langmuir and Freundlich isotherms.

How to cite: Ganguly, S. and Ganguly, S.: Adsorption of Hexavalent Chromium by magnetite particles synthesized at various temperatures: effect of magnetic properties of the particles on individual adsorption mechanisms, EGU General Assembly 2023, Vienna, Austria, 23–28 Apr 2023, EGU23-160, https://doi.org/10.5194/egusphere-egu23-160, 2023.

EGU23-1646 | Orals | HS2.3.2

Hydrological driver for leptospiroses abundance in a small tropical catchment ? Example from the New Caledonian leptospirosis hot-spot 

Pierre Genthon, Roman Thibeaux, Nazha Selmaoui-Folcher, Caroline Tramier, Malia Kainiu, Marie-Estelle Soupé-Gilbert, Kavya Wijesuriya, and Cyrille Goarant

Leptospirosis is a zoonosis caused by pathogenic Leptospira shed in the urine of mammals, able to survive in water and soils and remobilized during rainy events. Pathogenic Leptospira (PL) concentrations were measured together with hydrological variables in the upper Thiem river, near the Touho village, a hot spot for leptospirosis in the main island of New Caledonia (a small tropical island itself a hot spot for leptospirosis). Two hundred twenty-six water samples were collected at the outlet of as 3 km2 sub-watershed, which is frequented by invasive mammals (rodents, deer and wild pigs) known to be animal reservoirs for leptospirosis. The main features of our results highlight that (i) samples collected at the beginning of a rain event occurring after a dry period may contain high PL concentrations (ii) PL concentrations at the heart of a wet period exhibit significant correlation with rainfall, water level and suspended matter concentration (SMC) (iii) elevated PL concentration may be observed a few days after the main flood event and within weakly turbid waters, (iV) the largest PL concentrations were observed in the middle and at the end of a wet rain season. Comparison of PL concentrations with hydrological data (rainfall, water level, SMC, soil moisture) reveals that they cannot be explained by a linear combination of hydrological variables. Indeed, nonlinear machine learning models provided a fair fit to observed data (99% of explained variance on their decimal logarithm and a mean ratio of 2.5 between raw observed data and modeled values). Comparison of identical machine learning models of water levels, SMC and PL concentration shows that the remaining error in PL concentration data does not only result from the limited dataset but rather from the intrinsic characteristics of the Leptospira signal. Our results may help to refine recommendations for leptospirosis control towards local populations. Further studies in larger watersheds draining in more populated areas will be conducted to confirm and extend these findings

How to cite: Genthon, P., Thibeaux, R., Selmaoui-Folcher, N., Tramier, C., Kainiu, M., Soupé-Gilbert, M.-E., Wijesuriya, K., and Goarant, C.: Hydrological driver for leptospiroses abundance in a small tropical catchment ? Example from the New Caledonian leptospirosis hot-spot, EGU General Assembly 2023, Vienna, Austria, 23–28 Apr 2023, EGU23-1646, https://doi.org/10.5194/egusphere-egu23-1646, 2023.

EGU23-1765 | Orals | HS2.3.2

DNA tracer degradation and adsorption in environmental matrices 

Liping Pang, Laura Heiligenthal, Aruni Premaratne, Kyrin Hanning, Phillip Abraham, Richard Sutton, John Hadfield, and Craig Billington

Synthetic DNA tracers are a promising tool for tracking water contamination pathways. However, quantitative data are lacking on their degradation and adsorption in environmental matrices. Laboratory experiments were conducted to exam the degradation of multiple DNA tracers in stream water, groundwater, and domestic and dairy-shed effluent, and adsorption to stream sediments, soils, coastal sand aquifer media and alluvial sandy gravel aquifer media. The selected DNA tracers were double stranded 302 base pair (bp) and 352 bp in lengths. Their internal amplicons used for qPCR detection were almost the same, but the 352 bp tracers had longer non-amplified flanking regions.

Overall, 352 bp tracer degradation was significantly slower than that of the 302 bp tracers (p = 0.018). Results of thermodynamic analysis indicated that the 352 bp tracers had greater tracer stability. These findings are consistent with our previous field observations that 352 bp tracer reductions were consistently lower than 302 bp tracer reductions in stream water, groundwater, and soils. These findings suggest that longer non-amplified flanking regions may better protect DNA tracers from environmental degradation. In general, the DNA tracers degraded more quickly in the stream water and effluent samples than in the groundwater samples, and fast DNA tracer degradation was associated with high bacterial concentrations.

The two sets of DNA tracers differed little in their adsorption to stream sediment-stream water or aquifer media-groundwater mixtures (p > 0.067). However, the 352 bp tracers adsorbed significantly less to soil-effluent mixtures than the 302 bp tracers (p = 0.005). Compared to their adsorption to the aquifer media-groundwater and stream sediment-stream water mixtures, DNA tracer adsorption to soil-effluent mixtures was relatively less. A plausible explanation is that DNA tracers may compete with like-charged organic matter for adsorption sites, thus were less adsorbed to environmental media in the presence of organic matter.

Our study findings provide insights into the fate of DNA tracers in the aquatic environment and may assist with the future design of DNA tracers for environmental studies. The DNA tracer degradation rates established in this study for a range of environmental conditions could be used to inform the design of future field investigations, such as injection concentrations, sampling distances and experimental durations.

How to cite: Pang, L., Heiligenthal, L., Premaratne, A., Hanning, K., Abraham, P., Sutton, R., Hadfield, J., and Billington, C.: DNA tracer degradation and adsorption in environmental matrices, EGU General Assembly 2023, Vienna, Austria, 23–28 Apr 2023, EGU23-1765, https://doi.org/10.5194/egusphere-egu23-1765, 2023.

EGU23-3673 | Posters on site | HS2.3.2

Temporal stability of Escherichia coli and enterococci concentrations in sandy bottom sediment of a Pennsylvania creek 

Yakov Pachepsky, Dana Harriger, Christina Panko Graff, Matthew Stocker, and Jaclyn Smith

Fecal indicator bacteria (FIB), Escherichia coli, and enterococci are used to define regulatory thresholds for microbial water quality of streams and bodies of water and water body waters used for recreation and irrigation. Bottom sediments serve as secondary habitats for FIB that can enter water columns and alter microbial water quality, notwithstanding waste management at surrounding lands. Therefore, monitoring of indicator bacteria in bottom sediments is important. The discovery of persistent spatial patterns of environmental variables has been beneficial in environmental monitoring. Such patterns often termed temporal stability manifestation, helped substantially decrease the number of monitoring locations by estimating the spatial variation across the observation area according to the established spatial patterns. Temporal stability of indicator bacteria concentrations was observed in water columns of streams and ponds but was so far never researched for bottom sediments.

This work aimed to investigate the temporal stability of E. coli and enterococci concentrations along a reach of the Conococheague creek in the  USGS Conococheague-Opequon Subbasin). Three monitoring sites - TP, I81, and SS  were established where the creek collected the surface runoff from the forested headwater, agricultural, and mixed urban and agricultural areas, respectively. Sediment samples were taken collected weekly continuously for three years. FIB concentrations were measured by membrane filter method for E. coli using the mTec agar and enterococci using the mEI agar. The temporal stability was quantified using the mean relative differences (MRD) of concentrations. To obtain the relative differences for each location, the ratios of logarithms of concentration at each location and the average logarithm of concentrations across all locations were decreased by one for each observation time. MRDs were the relative differences for each location averaged over all observation times.

The sediment was sandy. Annual amplitudes of concentrations of both FIB in sediments were about three orders of magnitude in the range from 1 to 7000 colony forming units (g dry weight)-1. The sine function with the maximum in July and minimum in February gave a reasonable approximation of the annual dynamics at all locations over three years. The MRD values were equal to -0.198± 0.023, -0.012±0.019, and 0.210±0.021 for E. coli and -0.160±0.023, 0.000±0.017, and 0.165±0.024 for enterococci (mean standard error) at TP, I81, and SS locations, respectively. When converted to absolute values, concentrations were on average about 60% higher at SS than at I81, and 60% lower at TP than at I81. Values of MRD over warm (April-September) and cold (October-March) seasons followed the same pattern as the above annual values, with the range of MRD slightly larger over the cold season and somewhat smaller over the warm season as compared with the annual values.

Qualitative metrics also indicated the prevalence of specific spatial patterns. In particular, E. coli (enterococci) concentrations at TP, I81, and SS were smaller than at two other sites in 65% (63%),  28%(24%), and 6%(13%)  of observation times, respectively. 

Overall, three years of observations showed that persistent spatial patterns were present and manifested themselves against the backdrop of persistent temporal oscillatory annual patterns.

How to cite: Pachepsky, Y., Harriger, D., Panko Graff, C., Stocker, M., and Smith, J.: Temporal stability of Escherichia coli and enterococci concentrations in sandy bottom sediment of a Pennsylvania creek, EGU General Assembly 2023, Vienna, Austria, 23–28 Apr 2023, EGU23-3673, https://doi.org/10.5194/egusphere-egu23-3673, 2023.

EGU23-3691 | Posters on site | HS2.3.2

Occurence of selected hydroxy derivatives of polycyclic aromatic hydrocarbons in wastewater treatment plant 

Katarzyna Styszko, Justyna Pamuła, Elżbieta Sochacka-Tatara, and Agnieszka Pac

Evidence of the causal-empirical link between man-made chemicals present in industrial and household products, often leakage into the environment, and the effects on public health is growing, although still limited. These include, among other things, air pollutants in the environment associated with the highest prevalence of asthma, as well as respiratory and cardiovascular diseases in urban populations. There is strong evidence of health risks posed by human exposure to organic air pollutants such as PAH (polycyclic aromatic hydrocarbons) from combustion processes (solid fuels, coal and biomass) and communication. Generally, PAHs are formed during incomplete combustion and pyrolysis of organic material in a wide range of temperatures, up to over 1200 ° C. After entering the body, PAHs are transported to the alveoli and then spread throughout the body with the blood. The biological effects that PAHs cause in the human body are short-term, chronic, or long-term health effects, i.e. carcinogenicity, immunotoxicity, or developmental toxicity, genotoxicity. After entering the human body, PAHs undergo a complicated metabolism process and are excreted in the form of OH-PAHs with urine and faeces.

The purpose of the study was to analyse selected OH-PAHs in influent and effluent wastewater from the wastewater treatment plant (WWTP). Analysed PAH metabolites are: 1- and 2-hydroxynaphthalene, 2- and 9-hydroxyfluorene, 9-hydroxyphenenthrene, 1-hydroxypyrene, and 3-hydroxybenzo(a)pyrene. The wastewater samples came from the largest WWTP in Kraków. OH-PAH concentration levels were determined by gas chromatography with mass spectrometry (GC-MS), preceded by the extraction of analytes into the solid phase and their derivatization.

The concentrations of the analyzed compounds were at the level of ng/L. Regardless of the season of sampling for analysis (summer and winter), the highest concentrations, even up to 400 ng/L, were found in 2-hydroxynaphthalene and 9-hydroxyfluorene in influents. 1-hydroxypyrene, which according to literature reports is considered a marker of exposure to PAHs, was observed for influent and effluent samples only in winter at the level of only a few ng/L.


Keywords: Hydroxy derivatives of polycyclic aromatic hydrocarbons, Biomarker, Wastewater

Acknowledgments: A Research project financed by program “Initiative for Excellence – Research University” for the AGH University of Science and Technology. The research was supported  by Research Subsidy AGH 16.16.210.476.

How to cite: Styszko, K., Pamuła, J., Sochacka-Tatara, E., and Pac, A.: Occurence of selected hydroxy derivatives of polycyclic aromatic hydrocarbons in wastewater treatment plant, EGU General Assembly 2023, Vienna, Austria, 23–28 Apr 2023, EGU23-3691, https://doi.org/10.5194/egusphere-egu23-3691, 2023.

EGU23-4369 | ECS | Orals | HS2.3.2

Navigating the Danube: A data-driven approach to evaluate the impact of inland shipping on faecal pollution 

Ahmad Ameen, Sophia D. Steinbacher, David Lun, Gerhard Lindner, Julia Derx, Regina Sommer, Katalin Demeter, Rita Linke, Günter Blöschl, Alfred P. Blaschke, Alexander K. T. Kirschner, and Andreas H. Farnleitner

Introduction: Inland navigation has seen explosive growth over the past few decades, leading to increasing concerns about its environmental and health impacts. Coastal waters are usually monitored for wastewater contamination by maritime traffic, but little is known about faecal pollution caused by the inland waterways transport in large rivers. The Danube River in Europe is a very popular destination for cruise ship trips. The extent to which the faecal pollution in the Danube is caused by shipping traffic in general and the growing number of cruise ships specifically is still largely unknown. The Danube River Information Service (DoRIS) has been established to track ship traffic and provide data for monitoring in Austria. This database allows the estimation of the faecal pollution potential of ships with a high level of spatial and temporal resolution for the first time.

Methodology: An approach was developed to investigate the potential contribution of various ship categories to faecal pollution in the Danube River (Lower Austria) by combining water quality monitoring data with ship traffic data. The ship traffic data was extracted from DoRIS using a Python-based programming language code and sorted into three categories (cruise, passenger, and freight ships). Water quality monitoring was conducted at 11 transects along a 223-kilometre Danube River reach in Lower Austria. In collaboration with local authorities, each river transect was sampled at 5 points across the profile for one year at monthly intervals. The faecal indicator bacterium E. coli along with physio-chemical water quality parameters was analyzed for all samples. Theoretical faecal impact scenarios were developed using data on average daily ship traffic and factors such as ship type, onboard wastewater treatment facilities, onboard passenger capacity, and seasonal fluctuations of cruise tourism. To evaluate the influence of local and regional shipping traffic on the faecal pollution dynamics, a statistical correlation analysis was performed using data from the entire river reach and ship berthing stations.

Results: The faecal impact scenario analysis, revealed that the shipping industry had the same degree of maximum pollution potential as treated municipal wastewater. In case of improper onboard wastewater treatment, faecal pollution can be substantial. According to water quality monitoring, 94% of the samples had low to moderate faecal pollution, while none were classified as high. As a result, no significant increase in E. coli concentrations was detected throughout the 223 km long river stretch. However, at one of the 11 river transects, significant variations in the E. coli concentration were detected. After conducting a correlation analysis using statistical parameters for the whole river reach, we found no significant correlation between E. coli concentrations and any of the investigated ship counting metrics or ship types. Nonetheless, E. coli concentration was found to be significantly higher at one of the cruise ship berthing stations.

Acknowledgement: The research was funded by Amt der Niederösterreichischen Landesregierung, Abteilung Wasserwirtschaft (WA2) and the GFF Niederösterreich mbH (LS19-016 Future Danube). We would like to thank collaboration partners from the government of Lower Austria and the Austrian shipping inspectorate.

How to cite: Ameen, A., Steinbacher, S. D., Lun, D., Lindner, G., Derx, J., Sommer, R., Demeter, K., Linke, R., Blöschl, G., Blaschke, A. P., Kirschner, A. K. T., and Farnleitner, A. H.: Navigating the Danube: A data-driven approach to evaluate the impact of inland shipping on faecal pollution, EGU General Assembly 2023, Vienna, Austria, 23–28 Apr 2023, EGU23-4369, https://doi.org/10.5194/egusphere-egu23-4369, 2023.

EGU23-4946 | ECS | Orals | HS2.3.2

Risk assessment of waterborne virus in Lake Geneva: the present and the future 

Chaojie Li, Émile Sylvestre, Tim Julian, and Tamar Kohn

The presence of waterborne enteric viruses in lake recreational water sites is not desired, as they may have a negative impact on human health. However, their concentrations, fate and transport in lakes remain poor understood. To date, the health risks posed by enteric viruses in surface water was typically assessed via monitoring of fecal indicators, such as E. coli, whereas a direct assessment of fate and transport of waterborne viruses is less common. In this study, we propose a coupled water quality and quantitative microbial risk assessment (QMRA) model to study the transport, fate and infection risk of four common enteric viruses, using Lake Geneva as a study site. The measured virus load in raw sewage entering the lake was characterized, fitted with different distributions and then used as the source term in the water quality simulations. A Eulerian transport model was employed to model virus transport while considering spatially and temporally varying inactivation of viruses. Eventually, the probability of infection was quantified by linking the virus concentrations at a popular beach with QMRA. The model framework was then applied to model current situations as well as future scenarios under climate change. In the simulations of year 2019, it was found that environmental stressors noticeably reduce the infection probability exerted by viruses with low background inactivation in summer, but effects in the winter are minor. Norovirus appeared to be the most abundant species and also led to the highest infection probability, which was at least 10 times greater than that of the other viruses studied. In addition, the model highlighted the role of the wind field in conveying the contamination plume and hence in determining infection probability. The simulations for the future revealed an increase of virus inactivation rates in summer times due to higher water temperature as well as increased radiation levels due to reduced cloud coverage. The enhanced inactivation in summer could compensate for the higher virus loading caused by population growth. In contrast, in winter minor temperature changes and inconsequential radiation variation would not offset the increased virus loading. However, even in the winter cases the future infection risks would not undergo significant change compared with the current situation.  The proposed model framework is flexible and could be relatively easily refined and adapted for other locations and scenarios. This study highlights the potential of combining water quality simulation and virus-specific risk assessment for a safe water resources usage and management.

How to cite: Li, C., Sylvestre, É., Julian, T., and Kohn, T.: Risk assessment of waterborne virus in Lake Geneva: the present and the future, EGU General Assembly 2023, Vienna, Austria, 23–28 Apr 2023, EGU23-4946, https://doi.org/10.5194/egusphere-egu23-4946, 2023.

EGU23-5660 | Orals | HS2.3.2 | Highlight

Regional Scale Modelling of Pharmaceutical Pollution in Rivers by Integrating Rural and Urban Sources 

Francesco Bregoli, Leo Posthuma, Nikola Rakonjac, Caterina Zillien, Peter Vermeiren, Erwin Roex, Sjoerd van der Zee, Erwin Meijers, and Ad Ragas

Contaminants of emerging concern (CECs) can threaten aquatic ecosystems and human health. Both rural and urban areas are main sources of CECs to the environment. In rural areas, veterinary pharmaceuticals (VPs) are used to prevent diseases and protect the health of farm animals. The excrements of medicated animals are spread as manure to agricultural lands, where, after rainfall, VPs can be mobilized and reach surface waters through runoff. In urban areas, pharmaceuticals excreted by humans are collected in sewage systems and are only partially removed in wastewater treatment plants (WWTPs). Eventually, pharmaceuticals can reach surface waters through discharge of WWTP effluent. Currently, most of the predictive models only consider one source type, e.g. WWTPs or agricultural land. This limits their prediction performance since many CECs are being emitted by multiple source types. Therefore, the aim of this study is to integrate urban and rural sources of CECs in one regional water quality assessment.

Here, we predicted the concentration of CECs in the Eem river basin, the Netherlands, given land-use data combined with hydrological modeling. This allows for integrated evaluation of rural and urban emissions. These emissions were predicted with models developed within the context of the SUSPECt project (https://cec-partnership.nl/web/index.php/projects/suspect). CECs exposures were predicted with the Dutch National Water Quality Model where WWTPs emissions were included as point sources and rural emissions as diffuse sources. The temporal resolution of the model hydrology is seasonal. This is key to analyze the temporal variation of concentration due to manuring of agricultural lands which mainly occurs in Spring.

Predicted concentrations were successfully compared to measured concentrations taken in the SUSPECt project and from the database of the KIWK project (www.kennisimpulswaterkwaliteit.nl) for 6 compounds: carbamazepine and fipronil (only urban sources) and trimethoprim, sulfamethoxazole, permethrin and dexamethasone (urban and rural sources).

How to cite: Bregoli, F., Posthuma, L., Rakonjac, N., Zillien, C., Vermeiren, P., Roex, E., van der Zee, S., Meijers, E., and Ragas, A.: Regional Scale Modelling of Pharmaceutical Pollution in Rivers by Integrating Rural and Urban Sources, EGU General Assembly 2023, Vienna, Austria, 23–28 Apr 2023, EGU23-5660, https://doi.org/10.5194/egusphere-egu23-5660, 2023.

EGU23-7060 | ECS | Orals | HS2.3.2

Estimating Pathogen Removal in Bank Filtration – A Methodology for the Construction of Surrogate Models to Assist Decision Making 

Dustin Knabe, Aronne Dell'Oca, Alberto Guadagnini, Monica Riva, and Irina Engelhardt

Induced bank filtration is a known method for sustainable drinking water production in regions with limited groundwater resources. However, this method is at risk from surface water contaminations, e.g., by pathogens. Numerical models simulating pathogen fate in groundwater are typically too complex to be used as standard tools by waterworks managers or environmental agencies. To mitigate this problem, we present a methodology for the construction of easy-to-use reduced order models as surrogates for complex numerical reactive transport models for pathogens and pathogen indicators in induced bank filtration.

First, a streamlined one-dimensional numerical model was set up for the reactive transport of pathogens and pathogen indicators in induced bank filtration. Processes in the model include advection-dispersion, inactivation, attachment to and detachment from the sediment as well as straining and the presence of a clogging layer. Model parameters are divided into two groups: Group A includes site specific parameters for which values are typically available (with limited uncertainty) for management- and engineer-level users (e.g., grain size, distance of extraction well to the river); Group B includes process parameters which are typically affected by high uncertainty (e.g., inactivation and detachment coefficients).

We rely on an extensive dataset for coliforms and somatic coliphages collected over a 16-month period at an active induced bank filtration site. Stochastic inversion is used to assess uncertainty for model parameters of Group B (constrained on the dataset), while those of Group A are set to the values of the specific site. Principal component analysis (PCA) is applied to reduce the dimensionality of model parameter space and correlation amongst the uncertain parameters of Group B. A surrogate model is then constructed through generalized polynomial chaos expansion (gPCE). In this, the value range of Group A parameters is based on typical scenarios for induced bank filtration sites, while the range of the PCA-reduced Group B parameters is set to the uncertainty identified in the stochastic inversion.

The surrogate model allows to evaluate, at significantly reduced computational cost, the removal of coliforms and somatic coliphages in induced bank filtration based on user-defined values for parameters of Group A, but also including the uncertainty stemming from parameters of Group B. The surrogate model estimates for removal are in good agreement with observed removals for coliforms and somatic coliphages at the monitored site and with other (albeit limited) datasets from induced bank filtration sites found in the published literature. At this stage, the obtained surrogate model can be considered as a prototype. The assessment of its full potential requires additional extensive validation against other field sites. In general, surrogate models together with the overall methodological framework we propose, can be seen as a promising tool to assist informed decisions about pathogen transport at induced bank filtration sites.

How to cite: Knabe, D., Dell'Oca, A., Guadagnini, A., Riva, M., and Engelhardt, I.: Estimating Pathogen Removal in Bank Filtration – A Methodology for the Construction of Surrogate Models to Assist Decision Making, EGU General Assembly 2023, Vienna, Austria, 23–28 Apr 2023, EGU23-7060, https://doi.org/10.5194/egusphere-egu23-7060, 2023.

EGU23-7243 | ECS | Posters on site | HS2.3.2

Quantifying in-situ decay-rates of faecal indicators and pathogenic viruses in a river section in Germany. 

Malte Zamzow, Wolfgang Seise, Hans-Christoph Selinka, and Frank Schumacher

For assessing the health risk at recreational waters resulting from wastewater discharges from urban catchments, knowledge about the dynamics of the ratio between faecal indicator bacteria and pathogenic viruses is essential. Differences in wastewater concentrations, decay rates, and relevant exposure concentrations may influence how reliable concentrations of faecal indicator bacteria truly reflect existing health risk. Full-scale experiments on decay rates of pathogenic viruses in natural surface waters, especially fresh waters, are largely missing.

In the present study, we quantified the decay rates of faecal indicator bacteria and pathogenic viruses in a natural surface water. To this end, we performed two Lagrangian sampling campaigns after combined sewer overflows (CSO) along a river section in Berlin, Germany. During the campaigns the same body of contaminated water was resampled while travelling through the city. Organic micro-pollutants (Gabapentine, Acesulfame), and inorganic ions (Cl-, SO42-) were analysed to function as conservative tracer substances. Wastewater and stormwater amounts were estimated in each sample. Furthermore, all samples were analysed for humane Norovirus GII, Adenovirus 40/41, somatic coliphages, f-specifc coliphages, intestinale enterococci, and E.coli. Decay rates were derived by relating the pathogens to the estimated fraction of wastewater. The observation time was 5 and 2 days for the first and second CSO event, depending on the flow of the river. Decay rates indicate a significant variability between organisms but also between sampling campaigns as a result of different physical-chemical conditions. While the oxygen was completely consumed in the wastewater plume of the first event, this was not the case during the second event, which still allowed pathogen removal by grazing of heterotrophic zooplankton. Our results contribute to the general understanding of pathogens and faecal indicators in surface waters.

How to cite: Zamzow, M., Seise, W., Selinka, H.-C., and Schumacher, F.: Quantifying in-situ decay-rates of faecal indicators and pathogenic viruses in a river section in Germany., EGU General Assembly 2023, Vienna, Austria, 23–28 Apr 2023, EGU23-7243, https://doi.org/10.5194/egusphere-egu23-7243, 2023.

EGU23-7290 | Orals | HS2.3.2

Coupling targeted monitoring, pathway-oriented data intensive modelling and fate process-based modelling to estimate emission loads and concentrations of trace pollutants in the Danube River Basin 

Ottavia Zoboli, Marianne Bertine Broer, Oliver Gabriel, Jos van Gils, Sibren Loos, Steffen Kittlaus, and Matthias Zessner

The number of trace pollutants released by anthropogenic activities is increasing exponentially, their distribution in the environment is often ubiquitous and tracking their fate in river systems via monitoring would require a prohibitive financial effort due to high analytical costs. In this context, models are an irreplaceable tool to identify and quantify emissions loads and to estimate concentration levels in unmonitored catchments. Within the Interreg project Danube Hazard m3c, a novel combined approach has been applied in the Danube River Basin. Firstly, the pathway-oriented MoRE model (Modeling of Regionalized Emissions) was applied at the mesoscale in seven largely diverse river catchments (sub catchments of 40-650 km2) located in four different countries. This semi-empirical and relatively data intensive model could be robustly applied thanks to a rarely available data basis, which was achieved via a targeted and harmonized measurement campaign carried out in multiple environmental and engineered compartments for selected trace pollutants representative of larger groups of substances with comparable patterns of diffuse and point emissions, namely agricultural biocides, industrial chemicals, pharmaceuticals and contaminants of both natural and anthropogenic origin. The high parametrization efforts of the MoRE model yield a quite accurate analysis of emission pathways (e.g. wastewater treatment plant discharges, groundwater and interflow, soil erosion) and estimation of contaminants concentration in the rivers. In a second step, the system understanding gained through MoRE was utilized to improve the performance of the DHSM (Danube Hazardous Substance Model, based on the EU SOLUTIONS model), also applied in the same seven catchments for comparison. This second tool is a source-oriented fate process-based model, with only limited regional data requirements (primarily hydrological data) and which thus requires a much easier parametrization. The parallel application of the two models in the test catchments revealed major differences in the identification of emission pathways, e.g. diffuse emissions of industrial chemicals (PFOS and PFOA) and pharmaceuticals, and in the estimation of emission loads of metals from hotspots, e.g. from mining sites. As last step, the improved version of DHSM was applied to the whole Danube River Basin to quantify the relevance of different sources and pathways of emissions for the selected indicator contaminants and to estimate the risk of exceedance of the environmental quality standards in unmonitored surface water bodies. An early application of the DHSM for 17 target contaminants revealed Danube River Basin-wide emissions ranging between 0.1 and about 4,000 tonnes per year, with the share of point sources ranging between < 1% to >95%. This contribution focuses on the enhanced system understanding and improved modelling performance gained through the novel combined application of both approaches and will include final updated and validated basin-wide emission estimates.

How to cite: Zoboli, O., Broer, M. B., Gabriel, O., van Gils, J., Loos, S., Kittlaus, S., and Zessner, M.: Coupling targeted monitoring, pathway-oriented data intensive modelling and fate process-based modelling to estimate emission loads and concentrations of trace pollutants in the Danube River Basin, EGU General Assembly 2023, Vienna, Austria, 23–28 Apr 2023, EGU23-7290, https://doi.org/10.5194/egusphere-egu23-7290, 2023.

EGU23-7592 | ECS | Posters virtual | HS2.3.2

The fate of urease inhibitors in two agricultural soils 

Sophia Schmalhorst, Sandra Kühn, Martin Kaupenjohann, and Sondra Klitzke

Urease inhibitors (UI) are organic trace substances, which are applied along with urea fertilizers to reduce NH3 emissions from agricultural fields. Due to the recent amendment to the German fertilizer act (DüngG) which now dictates the use of UI, increasing amounts of these substances will be applied to arable soils.  So far, little is known about the fate of UI in soils and there is only few data on the leaching of UI from soil to groundwater, especially with respect to field data. However, first studies have proven traces of UI in surface and ground waters, raising concern among drinking water suppliers. Therefore, the aim of this study was to investigate the fate of two different UI, i.e. N-(2-Nitrophenyl) phosphoric acid triamide (2-NPT) and N-(n-Butyl)thio-phosphoric triamide (NBPT) in two agricultural soils, addressing the following questions:

  • How long do UI remain in the topsoil following application?
  • Which portion will be translocated to deeper soil layers?


On two agriculturally used fields in the state of Brandenburg (Germany) with sandy soils, which differ in their topsoil total carbon concentration (Berge 0.96 %, Ribbeck 1.39 %) and pH (Berge 5.9, Ribbeck 7.6), 2-NPT (as urea prills) and NBPT (as a mixture with urea solution) were applied along with urea. Soil samples were taken from the topsoil at 0-5 cm depth (using a soil sampling ring with a volume of 100 cm³) and from 5-15 cm and 15-30 cm depth (using a Pürckhauer sampler) of 4 different plots each prior to the application of the substances. Afterwards, samples from the topsoil were taken 1, 3, 6, 8, 10, 12, 14 and 21 days following the application. On the last day of the sampling period, samples from 5-15 cm and 15-30 cm depth were taken in addition. Samples were stored at -18°C until analysis.

Based on recovery tests by spiking the study soils with UI, the field-moist samples (sieved to 2 mm) were extracted according to the following procedure: 20 ml extraction solution (50 Vol.-% Acetonitrile/50 Vol.-% H20 for 2-NPT and 0.1 M KCl for NBPT) were added to 10 g soil, then shaken on a horizontal shaker (30 min, 120 rpm). After centrifugation (30 min, 3830 g), the supernatant was filtered through cellulose acetate filters (0.45 µm) and transferred to vials. The extracts were adjusted to neutral pH using dilute NaOH solution and stored in the refrigerator until measurement by HPLC-MS.

The concentration on 1 day of 2-NPT in the Berge topsoil amounted to 353 ± 151 µg/kg and in the Ribbeck topsoil 302 ± 148 µg/kg. NBPT was not found in any of the two soils. Whilst 2-NPT was no longer detectable in the Ribbeck topsoil after 10 days, 2-NPT decreased much slower in the Berge topsoil, reaching concentrations of 15.4 ± 15.7 µg/kg after 21 days. None of the inhibitors could be detected in deeper soil layers. Results will be discussed in the context of the site-specific soil parameters and the local precipitation data.

How to cite: Schmalhorst, S., Kühn, S., Kaupenjohann, M., and Klitzke, S.: The fate of urease inhibitors in two agricultural soils, EGU General Assembly 2023, Vienna, Austria, 23–28 Apr 2023, EGU23-7592, https://doi.org/10.5194/egusphere-egu23-7592, 2023.

Natural and constructed wetlands are now frequently used across the United States for mitigating nitrate losses to both surface and groundwater. Though the use of wetlands as a treatment approach for nitrate in runoff is well known, other active contaminants regularly co-occur with nitrate, potentially affecting the efficacy of nitrate-N removal. For example, veterinary pharmaceuticals have been observed in runoff originating from fields that receive livestock facility animal waste. In 2022, two mesocosm experiments were conducted to evaluate the combined effects of 4 common-use veterinary antibiotics (VAs) (chlortetracycline, sulfamethazine, lincomycin, monensin) on nitrate-N reduction efficiency. We hypothesized veterinary antibiotics would significantly impact nitrate-N removal through changes in denitrification processes within wetland ecosystems. To test this hypothesis, we simulated two pulse-flow storm events (2.5mg N03-N/L, 7.5 mg N03-N/L) and quantified the combined effects of trace-level antibiotics (1.0 mg/L) on the nitrogen cycle in fully saturated treatment wetlands. Results from previous experiments we conducted suggest nitrate reduction rates in treatments receiving antibiotics (CA= -1.04, FTWA= -1.31) remove nitrate more efficiently than those without (C= -0.01, FTW= -0.52). Plant uptake of VAs was also assessed, with results indicating that accumulation of VA compounds in wetland plants occurs and is primarily limited to the below ground biomass (Above ground= 0.59mg per plant, Below ground=206.66mg per plant) and the antibiotic species. Findings from these experiments will provide new insight into whether antibiotic residues in wetland environments affect proposed mitigation strategies for controlling nitrogen losses from fertilized crops and managing nitrate contamination of ground and surface water.

How to cite: Russell, M.: Assessing the impact of Veterinary Antibiotic species on Treatment Wetland Nutrient Removal at the Mesocosm Scale, EGU General Assembly 2023, Vienna, Austria, 23–28 Apr 2023, EGU23-8135, https://doi.org/10.5194/egusphere-egu23-8135, 2023.

Irrigation ponds provide a substantial amount of water for crop production.  An increasingly large body of evidence has linked microbial impairment of these resources to foodborne outbreaks. Therefore, monitoring the microbial quality of irrigation ponds is especially prudent for food safety and reducing the incidences of illnesses and deaths resulting from contamination events. Escherichia coli (E. coli) is used worldwide as an indicator for microbial contamination of water resources as concentrations are usually indicative of pathogen presence and/or cases of illnesses.

Algae and cyanobacteria (collectively henceforth referred to as phytoplankton can comprise large fractions of the overall biomass in waterbodies. Phytoplankton are important in water quality monitoring because they directly affect water quality metrics such as dissolved oxygen and pH as well as potentially producing toxic compounds. The interaction between E. coli concentrations and phytoplankton in environmental waters has received relatively little attention and has not been studied in ponds providing water for irrigation. The objective of this work was to see if phytoplankton can be used as predictors of E. coli concentrations in irrigation ponds.

Two irrigation ponds in Maryland, USA were sampled and sensed eleven times on the permanent spatial grid during the 2017 and 2018 growing seasons. A YSI sonde was used to measure water quality variable (WQV) concentrations of pH, dissolved oxygen (DO), specific conductance (SPC), temperature(C) , turbidity (NTU), phycocyanin, Chlorophyll a (CHL),and dissolved organic matter (FDOM). Total carbon (TC), and total nitrogen (TN) were measured in the laboratory. Phytoplankton functional groups (PFG) were green algae, diatoms, cyanobacteria, and dinoflagellates. Identification and enumeration of PFG was performed with laboratory microscopy.  The random forest (RF) algorithm was used to predict E. coli concentrations and rank variables by importance using three predictor sets including water quality variables (WQV)+PFG, PFG only, and WQV only on the 2017, 2018, and 2017+2018 datasets.

For both ponds, the WQV predictor set alone provided the best model performance metric results (R2= 0.671 and 0.812, and RMSE= 0.321 and 0.374 log concentrations for Ponds 1 and 2, respectively). The combined phytoplankton and WQV predictor sets provided very close results to the WQV results alone and in all the phytoplankton variables alone as predictors showed the worst performance. The top predictors in the PFG+WQV for Pond 1 were CHL, TN, pH, NTU, and FDOM which was similar to the WQV only set. Flagellates ranked among the most important predictors in the PFG+WQV (6th) and PFG predictor sets (1st). In Pond 2, the top predictors in the PFG+WQV were TC, C, pH, DO, and TN. Diatoms were found to be the leading predictor in the PFG-only dataset in Pond 2.

Results of this work indicate that in studies of water bodies the effect of phytoplankton on E. coli concentrations is well represented by the water quality variables, and concentrations of the phytoplankton groups per se do not add information for improvement of the prediction of microbial water quality evaluated by E. coli concentrations using the usually very efficient machine learning predictive random forest algorithm.  

How to cite: Stocker, M., Smith, J., and Pachepsky, Y.: Can data on major phytoplankton functional group concentrations improve the estimation of E. coli concentrations in agricultural pond waters?, EGU General Assembly 2023, Vienna, Austria, 23–28 Apr 2023, EGU23-8294, https://doi.org/10.5194/egusphere-egu23-8294, 2023.

EGU23-8436 | Posters virtual | HS2.3.2

Spatiotemporal variability of microcystin concentrations in water of an irrigation pond in Maryland, USA 

Jaclyn Smith, Matthew Stocker, and Yakov Pachepsky

Cyanotoxins in agricultural irrigation waters pose a potential human and animal health risk. Cyanotoxins can be transported to crops and soil during irrigation where they can remain in the soils for extended periods and be absorbed by root systems. While studies have reported spatial and temporal distributions for cyanotoxins in various freshwater sources, little has been reported for agricultural irrigation ponds. This research aimed to determine if persistent spatial and temporal patterns of the cyanotoxin microcystin occur in agricultural irrigation ponds. The study was performed at a working irrigation pond in Maryland, USA, during the 2022 summer sampling campaign consisting of 6 sampling dates over a fixed spatial 10-location grid. Concentrations of microcystin were determined using ELISA microcystin-ADDA kits. Ten water quality parameters were obtained using fluorometry and in-situ sensing. Relative differences (RDs) between a sampling location’s microcystin concentration and average concentrations across the pond were computed for each sampling date. Mean relative differences (MRDs) were computed for each sampling location for all sampling dates. Positive (negative) MRDs were found in locations where concentrations were predominantly larger (smaller) than the pond’s average. Persistent spatial patterns of microcystin concentrations were established. The pond’s flow conditions and bank proximity to sample locations were indicative of the MRD values signs and amplitude. The highest absolute values of the Spearman correlation coefficients were found between microcystin and pH (-0.777), and microcystin and phycocyanin (0.669). The lowest absolute values for correlation coefficients were found for colored dissolved organic matter (0.226) and chlorophyll-a (0.289). Correlations between microcystin relative differences and water quality relative differences were generally low and not statistically significant. Results of this work show that microcystin concentrations can exhibit stable spatial and temporal patterns in irrigation ponds, indicating that water quality sampling for cyanotoxins and placement of water intake should not be arbitrary. Research of the spatiotemporal organization of other cyanotoxin concentrations as well as understanding the degree of site-specificity of cyanotoxin concentration relationships with water quality parameters presents an interesting research avenue.

How to cite: Smith, J., Stocker, M., and Pachepsky, Y.: Spatiotemporal variability of microcystin concentrations in water of an irrigation pond in Maryland, USA, EGU General Assembly 2023, Vienna, Austria, 23–28 Apr 2023, EGU23-8436, https://doi.org/10.5194/egusphere-egu23-8436, 2023.

EGU23-9942 | ECS | Orals | HS2.3.2

The fate of nitrification and urease inhibitors in simulated bank filtration 

Muhammad Zeeshan, Marco Scheurer, Christina Förster, Christine Kuebeck, Aki Sebastian Ruhl, and Sondra Klitzke

Nitrification and urease inhibitors (NUI) are used in conjunction with nitrogen (N) fertilizers on agricultural soils to improve the efficiency of N fertilizers and reduce the emission of greenhouse gases. After application, NUI might transfer to aquatic environments through leaching or surface runoff. Nowadays, NUI such as 1,2,4-triazole, 3,4-dimethylpyrazole (3,4-DMPP) and dicyandiamide (DCD) are frequently found in surface waters with concentrations in the magnitude of µg/L. The fate of NUI in bank filtration (BF) is currently poorly known. BF is a sustainable water treatment system providing high quality water by efficiently removing numerous organic micropollutants from the source water. Herein, sorption and degradation of NUI in simulated BF under near-natural conditions was investigated. Besides, the effect of NUI on the microbial biomass of slowly growing microorganisms and the role of microbial biomass on NUI removal was investigated. Duplicate sand columns (length 1.7 m), fed with surface water were spiked with a pulse consisting of four nitrification (1,2,4-triazole, DCD, 3,4-DMPP and 3-methylpyrazole) and two urease inhibitors (n-butyl-thiophosphoric acid triamide and n-(2-nitrophenyl) phosphoric triamide). The average spiking concentration of each NUI was 5 µg/L. The flow velocity was adjusted to 0.2 m/d. Breakthrough curves of tracer (sodium chloride) and the NUI appeared at same time; therefore, sorption may be ruled out. Additionally, experimental and modeled breakthrough curves of NUI suggested no retardation for any of the inhibitors. Therefore, biodegradation was identified as the main elimination pathway for all substances and was highest in zones of high microbial biomass. N-butyl-thiophosphoric acid triamide was completely removed within a hydraulic retention time (HRT) of 24 hours and proved to be a highly degradable substance. Nitrification inhibitors showed 50% mass recovery (except for 3,4-DMPP) after an HRT of 4 days. A slight effect of NUI on microbial biomass was observed. This study highlights that hydraulic retention time and microbial biomass are key indicators for the degradation of NUI.

How to cite: Zeeshan, M., Scheurer, M., Förster, C., Kuebeck, C., Ruhl, A. S., and Klitzke, S.: The fate of nitrification and urease inhibitors in simulated bank filtration, EGU General Assembly 2023, Vienna, Austria, 23–28 Apr 2023, EGU23-9942, https://doi.org/10.5194/egusphere-egu23-9942, 2023.

EGU23-10140 | Orals | HS2.3.2

Understanding the impacts of dogs and birds on faecal pollution of bathing waters in Dublin Bay 

Guanghai Gao, John O'Sullivan, Aisling Corkery, Liam Reynolds, Niamh Martin, Laura Sala-Comorera Sala-Comorera, Gregory O’Hare, and Wim Meijer

Dublin Bay is a shallow bay located on the east coast of Ireland in Irish Sea. The water body is bounded to the west by Dublin City and to the east by the Irish Sea, with its northern and southern extents being defined by Howth Head and Dalky, respectively.  The southern side of the Bay includes the designated bathing waters of Sandymount Strand and the non-designated (but monitored) bathing waters of Merrion Strand. The water quality of these bathing areas remains vulnerable to numerous microbial pollution inputs, and these continue to present risks to recreational and economic activities that underpin much of the ecosystem service provision in the area, particularly during the bathing water that extends from June to September each year. Microbial pollutants are known to derive from agricultural diffuse sources in upland catchments and from point discharges from the wastewater drainage network, specifically during wet weather events when combined sewer overflows (CSOs) are active.  However, while accepted as being problematic in the overall pollution ‘mix’, concentrations of faecal indicator bacteria (FIB) from the faeces of dogs (dog fouling) and from local bird communities are less well understood – Dublin Bay was designated a 'biosphere reserve' by UNESCO in 2015 and remains home to numerous species of seabirds, many of which are present in internationally important numbers.

Here we present an assessment of the significance of FIB inputs from dogs and birds in their contribution to total faecal pollution in Dublin Bay.  The extent of dog fouling was assessed through five daily ‘beach sweeps’ on both Sandymount and Merrion Strands from 2019 to 2021. Eighty-one dog fouling events (30 and 51 on Sandymount and Merrion Strands, respectively) were observed, equating to an average of six fouling ‘events’ per day at Sandymount and 10 ‘events’ per day at Merrion. Laboratory testing was undertaken to determine average Escherichia coli (E. coli) and enterococci concentrations in the dog faeces.  BirdWatch Ireland (an independent bird protection organisation in Ireland) data from the Dublin Bay Birds Project (2013 to 2016) was used to quantify E. Coli and enterococci pollution loadings to Dublin Bay bathing waters deriving from the presence of both migratory and non-migratory bird populations during the bathing water season.

A coupled hydrodynamic and water quality model was integrated with sediment-bacteria interaction model which was further developed to simulate the inputs from dogs and birds. The model was then calibrated and validated with extensive water quality and ADCP (current speed and direction) measurements collected in nearshore areas around Dublin Bay to simulate the transport and fate of FIB in the study area.  The model included the freshwater (river) inputs carrying diffuse agricultural pollutants to the Bay, and the known point source pollution releases from within wastewater drainage network.  A dynamic decay rate, which included the effects of  temperature and light intensity was included in the model.

This research (Acclimatize) was part funded by the European Regional Development Fund through the Ireland Wales Cooperation Programme.

How to cite: Gao, G., O'Sullivan, J., Corkery, A., Reynolds, L., Martin, N., Sala-Comorera, L. S.-C., O’Hare, G., and Meijer, W.: Understanding the impacts of dogs and birds on faecal pollution of bathing waters in Dublin Bay, EGU General Assembly 2023, Vienna, Austria, 23–28 Apr 2023, EGU23-10140, https://doi.org/10.5194/egusphere-egu23-10140, 2023.

EGU23-10824 | Orals | HS2.3.2

Wildfire Threats to Groundwater Supplies: Implications for Pathogen and Particulate Contaminant Transport in Porous Media 

Monica Emelko, Omar Chowdhury, Xiaohui Sun, Allie Kennington, Philip Schmidt, Uldis Silins, and Micheal Stone

Climate change-associated wildfires are increasing in frequency and severity, causing increasingly variable or deteriorated water quality, and challenging in-plant treatment processes beyond design and operational response capacities, to the point of service disruptions. Recent work has shown that the wildfire impacts on drinking water treatability can extend far downstream and be long-lasting. Notably, very little information regarding the impacts of severe wildfire on groundwater supplies is currently available.

Wildfire transforms fuels (i.e. biomass, soil organic matter). Pyrogenic carbonaceous material formed after wildfire includes particulate ash and biochar, which often contains toxic polyaromatic hydrocarbons, dioxins and furans, as well as some heavy metals. These mobile materials may be incorporated into soil profiles (change the soil properties, e.g., hydrophobicity, pH), redistributed, or removed from a burned site by wind and water erosion to source water. While surface water treatment technologies may have some capacity to remove these contaminants from surface water, the subsurface fate and mobility of these toxic particles has not been documented and is not understood. Moreover, the implications of potential changes in dissolved organic carbon on pathogen transport in these systems has not been documented. Because groundwater-based drinking water supplies do not typically require treatment beyond disinfection, it is possible that contaminated particles could enter drinking water wells after wildfire. Moreover, NOM-associated changes in water quality may increase the risk of pathogen transport through the subsurface.

Here, the impacts of wildfire on the transport E. coli and Cryptosporidium parvum oocysts in various porous media environments (e.g., particle properties, solution chemistry, organic matter character) were evaluated. Column tests were conducted using laboratory prepared wildfire ash-impacted water and wildfire impacted surface water collected after the 2017 Kenow Wildfire in Waterton, Alberta, Canada. These investigation demonstrate that under certain conditions potential post-fire shifts in water quality can substantially enhance particle/microbe transport in porous media, thereby underscoring the need to evaluate microbial risks to groundwater supplies after severe wildfire.

How to cite: Emelko, M., Chowdhury, O., Sun, X., Kennington, A., Schmidt, P., Silins, U., and Stone, M.: Wildfire Threats to Groundwater Supplies: Implications for Pathogen and Particulate Contaminant Transport in Porous Media, EGU General Assembly 2023, Vienna, Austria, 23–28 Apr 2023, EGU23-10824, https://doi.org/10.5194/egusphere-egu23-10824, 2023.

EGU23-11053 | Orals | HS2.3.2

Protection of groundwater against microbial contamination 

Jack Schijven, Harold van den Berg, and Saskia Rutjes

A novel microbial risk analysis of groundwater as part of the Dutch guideline document for Quantitative Microbial Risk Assessment (QMRA) of drinking water consumption encompasses 1) vulnerability assessment of groundwater production sites, 2) calculating the protection zone against microbial contamination to remain below an infection risk of 1/10,000 persons/year, 3)  assessment of contamination sources within the protection zone, and 4) QMRA for identified contamination sources. Protection zones are based on a standard virus contamination scenario and may be computed using a required minimal travel time, a hydrological model that includes a first order decay term for virus inactivation and attachment, or the computational tool QMRAwell. QMRAwell is designed for unconfined and (semi)confined sandy aquifers with a forced groundwater gradient due to pumping. QMRAwell can also be used to conduct  QMRA.

How to cite: Schijven, J., van den Berg, H., and Rutjes, S.: Protection of groundwater against microbial contamination, EGU General Assembly 2023, Vienna, Austria, 23–28 Apr 2023, EGU23-11053, https://doi.org/10.5194/egusphere-egu23-11053, 2023.

EGU23-11264 | ECS | Posters on site | HS2.3.2

Occurrence and Distribution of PFAS in the River and Groundwater at Two Danube Sites 

Ali AA Obeid, Thomas James Oudega, Ottavia Zoboli, Claudia Gundacker, Alfred Paul Blaschke, Matthias Zessner, Ernis Saracevic, Nicolas Devau, Margaret E. Stevenson, Nikola Krlovic, Meiqi Liu, Zsuzsanna Nagy-Kovács, Balázs László, Gerhard Lindner, and Julia Derx

Per- and Polyfluoroalkyl Substances (PFAS) are chemicals used for many domestic and industrial purposes related to their physicochemical properties. However, those same properties make them mobile and persistent in the environment, and on top of that, they are toxic and can affect human health in the short and long term, as they are bio-accumulative. Many processes govern the transport of PFAS in the surface waters and groundwater, e.g., sorption, biodegradation, co-transport, and transformation. Monitoring PFAS at different locations can help understand these processes and provide datasets to calibrate and validate reactive transport models simulating PFAS fate and transport. This study compares PFAS presence and distribution in river water and groundwater at two Danube river sites. One site is characterized by a steady water level in the river and natural flow from the river to the groundwater, with a clogging layer at the aquifer-river interface. In contrast, the other site has a more dynamic water level in the river, several pumping wells affecting water infiltration rates, and lacks a clogging layer.

Samples were collected monthly for 12 months at the static study site and 8 months at the dynamic study site. Targeted analysis for 32 PFAS compounds has been carried out using liquid chromatography mass spectrometry (LCMS). The concentrations of the compounds were generally less than 20 ng/l, and most of the compounds were lower than the limit of quantification/detection. The results show that 3H-perfluoro-3-[(3-methoxypropoxy) propanic acid] (ADONA) had the highest concentration at the two sites, both in the river and groundwater. The longer chain PFAS exhibited a slight reduction in concentration from the river towards groundwater due to, most likely, sorption, while the shorter chain did not. The 6:2 FTS precursor was detected in the river but not in the groundwater. For some substances, the concentrations were higher in the groundwater compared to the river, indicating either background water influence, a transformation of PFAS, different transport routes (e.g., accumulation over time), or longer flow paths. Longer chain lengths, greater than 9 carbon atoms, were never detected above the limit of quantification in the river and groundwater. More PFAS compounds were detected at the dynamic study site than at the static one, even though, it is located further downstream, indicating nearby PFAS sources or/and influents along the river course. It is worth mentioning that large wastewater treatment plants are discharging their effluent downstream of the static site, in addition to sewer overflows from large cities in between. The PFAS concentrations in the river and groundwater during one high-flow event showed little difference compared to the ones during basic monthly monitoring at both study sites, however, another high flow event is needed to confirm this observation.

How to cite: Obeid, A. A., Oudega, T. J., Zoboli, O., Gundacker, C., Blaschke, A. P., Zessner, M., Saracevic, E., Devau, N., Stevenson, M. E., Krlovic, N., Liu, M., Nagy-Kovács, Z., László, B., Lindner, G., and Derx, J.: Occurrence and Distribution of PFAS in the River and Groundwater at Two Danube Sites, EGU General Assembly 2023, Vienna, Austria, 23–28 Apr 2023, EGU23-11264, https://doi.org/10.5194/egusphere-egu23-11264, 2023.

Karst aquifers are vulnerable to contaminations due to their specific characteristics which allow for a rapid recharge and high velocities within the saturated zone. Contaminants such as pathogenic bacteria, viruses, and antibiotic resistance genes (ARG) can enter the groundwater and reach springs at high concentrations (Auckenthaler et al., 2002). This poses a potential threat, especially considering that drinking water treatment is less effective against microbial contaminations (Auckenthaler & Huggenberger, 2003) or missing, particularly in developing countries. Potential input of such contaminants is related for example to spills and leaks of waste water or application of manure. Many small-scale laboratory studies have been performed to understand the mobility of virus and bacteria, yet only little is known from large scale field tracer tests.

We performed tracer tests using different non-pathogenic bacteria, bacteriophages, and extracellular DNA as surrogates for pathogens and ARGs together with uranine within the catchment of the Gallusquelle karstic spring. The average flow velocities in the groundwater system were about 30 and 87 m/h during our tracer tests. Tracers were injected as instantaneous input (10 minutes input time). Periodical sampling for the biological tracers started with the first detection of uranine about 80 to 90 hours after injection. Bacterial and eDNA tracers were analysed using qPCR methods while bacteriophages were additionally analysed using a culture-based method (plaque assay) to count active phages. First data indicates that all tracer materials were successfully injected into the groundwater and detected at the Gallusquelle spring. Results of the first tracer test suggest that all used tracer materials were transported over at least 3 km within the system. Furthermore, active bacteriophages of the second tracer test were transported over 9 km from a stormwater detention basin to the spring within 90 hours. 1D-transport modelling revealed much lower mass recovery for these active phages compared to the soluble tracer uranine (about 1% as maximum compared to approximately 31% for uranine).


Auckenthaler, A., Raso, G. & Huggenberger, P. (2002): Particle transport in a karst aquifer: natural and artificial tracer experiments with bacteria, bacteriophages and microspheres. Water Sci. Technol., 46, 131-138

Auckenthaler, A. & Huggenberger, P. (2003): Schlussfolgerungen und Empfehlungen. In: Auckenthaler, A. & Huggenberger, P. [eds.]: Pathogene Mikroorganismen im Grund- und Trinkwasser. Birkhäuser Verlag, Basel, 184 S.

How to cite: Serbe, R., Schiperski, F., Stelmaszyk, L., Stange, C., and Scheytt, T.: Transport of bacteria, bacteriophages, and extracellular DNA as surrogates for pathogens and antibiotic resistance genes in a karst aquifer (Gallusquelle, South-West Germany), EGU General Assembly 2023, Vienna, Austria, 23–28 Apr 2023, EGU23-11903, https://doi.org/10.5194/egusphere-egu23-11903, 2023.

EGU23-12147 | Posters on site | HS2.3.2

Upscaling bacterial overland transport – a multi-parametric approach 

Julia Derx, Rita Linke, Regina Sommer, Peter Strauss, Alba Hykollari, Alexander Faltejsek, Jack Schijven, Alfred Paul Blaschke, Alexander Kirschner, and Andreas Farnleitner

Water contaminated with human and animal enteric pathogens puts public health at serious risk. All countries and regions of the world require highly robust and effective water management and treatment systems to guarantee safe water and protect public health. To this end, we need accurate predictions of the origin of pathogens , how they move through the environment and where they end up.

This study is part of a four-year project and aims to develop new bacterial overland transport - BOT models to provide answers to the above questions. The project takes a holistic, quantitative approach to transfer BOT model parameters onto large scales. Small-scale precipitation experiments are conducted in the laboratory and larger-scale experiments are conducted using a rainfall simulation under real environmental conditions. The state-of-the-art combination of quantitative, microbiological, and molecular methods and parameters will provide the scientific basis for more accurate predictions of BOT, which eventually may be extended to viruses and protozoa in the future.

How to cite: Derx, J., Linke, R., Sommer, R., Strauss, P., Hykollari, A., Faltejsek, A., Schijven, J., Blaschke, A. P., Kirschner, A., and Farnleitner, A.: Upscaling bacterial overland transport – a multi-parametric approach, EGU General Assembly 2023, Vienna, Austria, 23–28 Apr 2023, EGU23-12147, https://doi.org/10.5194/egusphere-egu23-12147, 2023.

EGU23-13821 | Orals | HS2.3.2

Nitrification and urease inhibitors - From fields to drinking water resources? 

Ursula Karges, Christine Kübeck, Tim aus der Beek, Sebastian Sturm, Richard Beisecker, Theresa Seith, Muhammad Zeeshan, and Sondra Klitzke

Applications of nitrification and urease inhibitors (NUI) with nitrogen fertilisers on agricultural soils are intended to improve the efficiency of nitrogen fertilisers and also to prevent nitrogen emissions from the fertilisers. However, the deliberate release of chemicals into the environment carries a certain degree of risk due to spreading in the water systems. Both sensitive ecosystems and water supplies may be affected. Processes that need to be considered for a reliable assessment regarding the fate and distribution of these substances in the different compartments are manifold. So far, reliable predictions in literature are scarce and regulatory approaches are based on limited information on substance fate.

Yet, two out of the ten NUIs currently approved in Germany, have been found in surface waters, prompting further investigation. In this context, no analytical method has been established so far for some of the other NUIs, thus there is no information available on the occurrence of these substances. In order to gain transparency on the actual environmental fate and implications for drinking water production of these NUI has been analyzed In addition to legal approval procedure different processes and scenarios relevant to their fate were investigated in the INHIBIT project.

Following a comprehensive literature review, experimental investigations were carried out to further evaluate the environmental behaviour of these substances on an empirical basis. Initially, a multi-method was developed for the simultaneous determination of 1H-1,2,4-triazole (triazole), dicyandiamide (DCD), 3,4-Dimethylpyrazol-phosphate (DMPP), 3-Methylpyrazole (3-MP), N-(n-butyl)thiophosphoric triamide (NBPT) and N-(2-nitrophenyl)phosphoric triamide (2-NPT) in soil pore water. Experiments conducted in this research project provided essential empirical information on the hydrolysis stability, degradation behaviour and sorption tendency in soils for selected NUI. In addition, vessel, column, lysimeter and practical field application tests were carried out to obtain empirical information on the leaching risk of these substances via the transport pathway unsaturated zone-leachate-groundwater. Furthermore, the indirect input pathway via infiltrating surface waters (bank filtration) was investigated. Studies were carried out on different soils and using different parameters in order to depict different site conditions.

Results indicated a high hydrolysis stability for the nitrification inhibitors (NI) DCD, DMPP, 3-MP and triazole. The hydrolysis stability of the urease inhibitors (UIs) NBPT and 2-NPT is strongly pH-dependent. While NBPT is particularly unstable in an acidic environment, 2-NPT shows the lowest stability in a more alkaline environment. Sorption tendency to soils of all compounds was low. Microbial degradation of NI in soils was lower compared to urease inhibitors (UIs). Overall, the NI triazole, DCD, 3-MP and DMPP were found to be potentially relevant substances for drinking water production. The NI active substances DCD and triazole were additionally monitored in several surface waters and were frequently detected, in some cases at very high concentrations of several µg/L. These findings underline the relevance of these substances for water resources.

How to cite: Karges, U., Kübeck, C., aus der Beek, T., Sturm, S., Beisecker, R., Seith, T., Zeeshan, M., and Klitzke, S.: Nitrification and urease inhibitors - From fields to drinking water resources?, EGU General Assembly 2023, Vienna, Austria, 23–28 Apr 2023, EGU23-13821, https://doi.org/10.5194/egusphere-egu23-13821, 2023.

EGU23-14533 | Orals | HS2.3.2

Fate and transport modelling of microbial water quality: impacts of climate change and socioeconomic development 

Ekaterina Sokolova, Viktor Begion, M. M. Majedul Islam, and Mia Bondelind

Anthropogenic activities in a watershed may pose human health risks due to faecal contamination of surface waters. Thus, socioeconomic development is important when predicting future microbial water quality. Moreover, climate change alters meteorological conditions, thereby affecting flow regimes as well as fate and transport of microorganisms. In this study, possible risks due to socioeconomic development and climate change were assessed for the drinking water source Lake Vomb in Sweden by means of water quality modelling. The hydrological model ArcSWAT and the hydrodynamic model MIKE 3 FM were used to simulate fate and transport of two microorganisms, i.e., Cryptosporidium and E. coli, from the watershed to the water intake. The hydrological model and the hydrodynamic model were calibrated and validated using observed data on water flow and water temperature, respectively. The water quality in the watershed and in the lake was simulated for a baseline scenario and for future scenarios in the second half of this century. The future scenarios were formulated based on Representative Concentration Pathways (RCPs) and Shared Socioeconomic Pathways (SSPs). The modelling results illustrated the effects of climate changes and of socioeconomic development. The results were also interpreted in the context of infection risks to drinking water consumers using quantitative microbial risk assessment. This study clearly illustrates that socioeconomic development is important to include when investigating future microbial water quality.

How to cite: Sokolova, E., Begion, V., Islam, M. M. M., and Bondelind, M.: Fate and transport modelling of microbial water quality: impacts of climate change and socioeconomic development, EGU General Assembly 2023, Vienna, Austria, 23–28 Apr 2023, EGU23-14533, https://doi.org/10.5194/egusphere-egu23-14533, 2023.

EGU23-15047 | Orals | HS2.3.2

Transfer patterns of pharmaceuticals used in agriculture into streams under Mediterranean climate at the catchment-scale 

Nico Hachgenei, Guillaume Nord, Lorenzo Spadini, Nicolas Robinet, Christine Baduel, and Céline Duwig

Livestock-breeding relies on a large array of pharmaceuticals. Many of them may pose a risk to aquatic life if they reach surface water bodies.  Depending on their physicochemical properties, some pharmaceuticals present strong sorption coefficients and are thus not expected to reach surface water bodies under most conditions. Mediterranean climate is characterized by a dry summer followed by intense storm events. We studied the effect of this climatic condition on the risk of transfer of pharmaceutical residues to streams at the catchment-scale. The study area is the 42km2 Claduègne catchment in the French Ardèche department. It is characterized by extensive agricultural land-use under Mediterranean climate.

Surveys with local livestock farmers were conducted in order to identify the commercial pharmaceutical products and the active ingredients systematically used in the study area as well as their application rate, frequencies and seasonal patterns. Stream water was analyzed on high frequency (up to 3h-1) during flood events and compared to some samples outside of flood events. A total of 32 liquid water samples were collected and analyzed for 3 veterinary pharmaceuticals systematically used in the study area as well as 14 molecules of various use. They were concentrated via solid phase extraction and analyzed using high performance liquid chromatography (HPLC) coupled to a tandem mass spectrometer. The concentration values where below the limits of detection (0.1 - 1 ng L-1) most of the time, but peaked at high concentrations for short periods during flood events. The concentration reached up to 355 times the Predicted No Effect Concentration (PNEC) for Fenbendazole FBZ, the antiparasitic used in pork in the region. This indicates that rapid transfer processes during flood events represent an elevated risk of transfer of these molecules toward streams. Parallel transit time modelling revealed high event water fractions during flood events in the studied catchment.

We conclude that under these climatic conditions, special care should be taken after treatment application to avoid pastures that are hydrologically connected to surface water bodies. In addition, the results suggest that low-frequency monitoring is not sufficient to detect these high concentration levels that exist during very short durations of a few hours or less.

How to cite: Hachgenei, N., Nord, G., Spadini, L., Robinet, N., Baduel, C., and Duwig, C.: Transfer patterns of pharmaceuticals used in agriculture into streams under Mediterranean climate at the catchment-scale, EGU General Assembly 2023, Vienna, Austria, 23–28 Apr 2023, EGU23-15047, https://doi.org/10.5194/egusphere-egu23-15047, 2023.

EGU23-16837 | ECS | Orals | HS2.3.2

Modelling multitudes of pharmaceuticals in the global river system at high spatial resolution 

Heloisa Ehalt Macedo, Bernhard Lehner, Jim Nicell, Usman Khan, Eili Klein, and Günther Grill

Treated and untreated domestic wastewaters that are discharged into surface waters often contain a variety of chemical substances, including residuals of pharmaceuticals that are not fully metabolized by the human body. These substances may be harmful to the health of aquatic ecosystems and to humans who rely on them as a source of water supply. Despite growing concerns and their frequent detection in wastewaters and surface waters, the concentrations of pharmaceuticals are not regularly monitored in water bodies. As an alternative to comprehensive monitoring campaigns that tend to be very resource intensive, contaminant fate models may be used to provide information to support the development of targeted local monitoring schemes in regions of highest exposure to pharmaceuticals in the environment as well as the prioritization of substances for further investigation.

In this work, a global contaminant fate model (called HydroFATE) was developed with the objective of estimating the concentration of contaminants of emerging concern (including pharmaceuticals) in the global river network at a high spatial resolution (500 m). The contaminant emission is calculated based on consumption per capita and population density. Then, the contaminant loads of treated or untreated wastewaters are reduced in the model either by centralized or decentralized wastewater treatment, by natural attenuation in soils and runoff, and/or by decay processes in rivers and lakes. HydroFATE’s structure is based on a vector routing structure, which besides its spatial precision being higher than in global pixel-based models, it is also fast to process. This key aspect allows for more complex analyses, including repeated execution of multiple substances and different scenarios in a short period of time, making HydroFATE a capable tool to inform on the prioritization of substances.

The model’s performance was validated by comparing predicted concentrations in river reaches worldwide against literature reports of measured concentrations of 22 broadly consumed antibiotics for which at least sparsely monitored data existed. The sensitivity of the model’s predictions was tested by altering key model parameters. This validation process showed that HydroFATE is generally able to predict aquatic concentrations measured worldwide to within one order of magnitude, which is judged to be sufficient for the intended purposes of the model.

Finally, HydroFATE was applied to estimate the concentrations of the 40 most widely used antibiotics in households worldwide and to compare these concentrations, both individually and cumulatively, to established no-effect thresholds of environmental exposure. It was estimated that a total of 8,500 tonnes of antibiotics per year are discharged into the river system. We found that 6.0 million km of rivers worldwide may have environmental exposure levels that exceed the no-effect concentration of antibiotic pollution during low streamflow conditions, with the largest extent of these rivers being in Southeast Asia, the most densely populated region in the world. The main contributors of exposure were found to be the widely and heavily used antibiotics amoxicillin, ceftriaxone, and cefixime.

How to cite: Ehalt Macedo, H., Lehner, B., Nicell, J., Khan, U., Klein, E., and Grill, G.: Modelling multitudes of pharmaceuticals in the global river system at high spatial resolution, EGU General Assembly 2023, Vienna, Austria, 23–28 Apr 2023, EGU23-16837, https://doi.org/10.5194/egusphere-egu23-16837, 2023.

EGU23-17381 | ECS | Orals | HS2.3.2

Understanding the connectivity of pharmaceutical pollution in river catchments 

Julia Costescu, Louise Bracken, Laura Turnbull-Lloyd, Sim Reaney, and Damian Crilly

The near ubiquitous presence of pharmaceutical compounds in environmental waters represents an emerging cause for concern, but gaps remain in our understanding of how human and veterinary pharmaceuticals enter and travel through river catchments. A more holistic approach is needed in order to develop effective management strategies that conform to the catchment-based approach, although this is complicated by the patchy nature of available monitoring data for river water and by the significant seasonal variation in concentrations which makes comparisons even within datasets tenuous. Here, an exploration of pharmaceutical concentrations across the Aire catchment in the UK aims to provide insight into how the underlying connectivity of the catchment system, conceptualized as a source-pathway-receptor model, may determine observed patterns of contamination. To account for temporal variations of inputs and flow, samples collected on two separate occasions (corresponding to low and high flow conditions, respectively) were used to create two spatial snapshots for contamination with nine representative compounds. The snapshots were then used to explore spatial patterns in the catchment and what factors – topographic, physico-chemical, or related to potential sources and pathways for pharmaceutical pollution – may influence them. For the first snapshot, conducted in low flow conditions, none of the locations had concentrations above the limit of detection for five of the nine target analytes (Atenolol, Diclofenac, Erythomycin, Iopromide and Sulphadiazine). Results for the detected compounds have emphasized the difference in spatial patterns based on use category: as opposed to the veterinary use compound (Cypermethrin), the human use compounds (Carbamazepine, Lidocaine and Sucralose) showed significant correlation to contributing area, as well as to population served by the wastewater treatment plants upstream of the sampling sites and corresponding estimates for amounts of prescribed active ingredient. Sucralose also produced strong correlations to Carbamazepine and Lidocaine, supporting its use as a proxy for contamination with human pharmaceuticals, alongside the more frequently cited Carbamazepine. Ultimately, this research will inform the development of a graph representation of the system, used to assess the relative contribution of different pathways as they connect to the river channel and to inform as to the best intervention points within the catchment.

How to cite: Costescu, J., Bracken, L., Turnbull-Lloyd, L., Reaney, S., and Crilly, D.: Understanding the connectivity of pharmaceutical pollution in river catchments, EGU General Assembly 2023, Vienna, Austria, 23–28 Apr 2023, EGU23-17381, https://doi.org/10.5194/egusphere-egu23-17381, 2023.

Heavy metal pollution in the riverine system is a major concern as it is a primary source of fresh water and has the potential to cause minuet to severe health impacts in humans. Excess heavy metal contamination in the riverine system may introduce potentially toxic elements into the aquifers via recharge or vice versa. The present study is aimed to understand the heavy metal pollution and the human health risk assessment of surface and groundwater in the Upper Yamuna River Basin (UYRB) and its spatial distribution.  For the study, twenty-eight river water and forty-eight groundwater samples were collected in May 2022 and analyzed for 15 heavy metals. Except for a few metals in groundwater (As, Fe, Mn, and Al) and surface water (As, Al, Mn), the rest were in compliance with the BIS and WHO acceptable limits. The mean metal concentration in groundwater were observed in the order of Cd < Cu < Cr < Ni < Co < Mo < Li < As < Al < Ba < B < Mn < Sr < Zn < Fe, whereas in surface water it followed the order of Cd < Cu < Cr < Ni < Co < Mo < Zn < Li < As < Ba < Al < Mn < Fe < B < Sr. The non-carcinogenic (HI) value for groundwater in adults ranged between 0.3 – 15.4 with an average of 3.95, while it ranged between 0.3 – 7.4 with an average of 2.4 for river water.  Similarly, the average incremental lifetime cancer risk (ILCR) value for adults in groundwater is 1.4 × 10⁻³ and 9 × 10⁻⁴ for river water. The health risk implication in children were found to be higher than the adults. The higher HI and ILCR values may be associated with the high arsenic concentration compared to their standard acceptable limit. Even though the HI and ILCR values exceeded the standard values, the heavy metal pollution (HPI) index values for all the samples were below the permissible limit. It may be due to the lower concentration or the absence of major concerned metals (Cd, Cu, Cr, Ni, etc.). Heavy metals are varyingly distributed in the basin, whereas, the lower catchment, which is the major urban center of the country is found to have comparatively higher concentrations of heavy metals and related health risks.

Keywords: Heavy metal, Yamuna river, Human health assessment, Pollution index

How to cite: Rajan, S. and Raju, N. J.: Heavy metal contamination in surface and groundwater and its human health risk assessment in the Upper Yamuna River Basin, India, EGU General Assembly 2023, Vienna, Austria, 23–28 Apr 2023, EGU23-704, https://doi.org/10.5194/egusphere-egu23-704, 2023.

EGU23-906 | ECS | Posters virtual | HS2.3.3

Land Use Practices and their Resulting Impacts on Surface Water Quality 

Emily Nottingham and Tiffany Messer

Contaminants of emerging concern (CECs) are becoming a major source of water impairment throughout the world. Land use practices within urban and rural areas have shown to be sources of CECs. Contaminants enter the environment through direct application or waste disposal with runoff and soil leaching depositing CECs into streams and lakes. Therefore, this study sought to characterize the nutrients, heavy metals, pesticides, human pharmaceuticals, and personal care products appearing in streams across varying Kentucky landscapes. Field sampling included using both Polar Organic Chemical Integrative Samplers and water grab samples from March-October 2022 at four stream sites in an oil and gas, urban, mining, and agricultural regions of the Commonwealth. Preliminary results exhibited occurrence of contaminants varied by location, season, and flood conditions. The urban site resulted in the highest concentrations of chloride, nitrate-N, caffeine, and cotinine (by-product of Nicotine), particularly in the spring months. The watershed with the most active mines showed the highest concentrations of strontium along with significantly larger concentrations of sulfate that were above the ecotoxicology limits (200 mg/L) and EPA secondary drinking water standards (250 mg/L). The watershed associated with the most oil and gas wells showed the highest concentrations of barium. This site also showed higher concentrations of human pharmaceuticals (e.g., Carbamazepine, Codeine, Diltiazem, Diphenhydramine, Fluoxetine), likely a result of an older wastewater infrastructure and straight-pipes that discharged untreated water into the sampled stream. Finally, the agricultural site showed the highest concentrations of aluminum, iron, and lead and had higher sediment loads during flood events in the spring months, which likely resulted in the concentrations of these three metals being above the chronic criteria for aquatic organisms. Additionally, the agricultural site had the highest concentrations of both lincomycin and sulfonamide, common antibiotics used to treat livestock. This study is the necessary first step in reaching the UN’s Sustainable Development Goals by developing a comprehensive understanding of land use impacts on contaminant presence and concentration in surface waters. Further, findings from this project will be incorporated into the design and placement of best management practices to limit the impact of CECs.

How to cite: Nottingham, E. and Messer, T.: Land Use Practices and their Resulting Impacts on Surface Water Quality, EGU General Assembly 2023, Vienna, Austria, 23–28 Apr 2023, EGU23-906, https://doi.org/10.5194/egusphere-egu23-906, 2023.

EGU23-2267 | ECS | Orals | HS2.3.3 | Highlight

Comparative assessment of PFAS concentrations in emission pathways, surface and groundwater in the upper Danube Basin 

Meiqi Liu, Ernis Saracevic, Nikola Krlovic, Ottavia Zoboli, Steffen Kittlaus, Gerhard Rab, Ali Obeid, Thomas Oudega, Julia Derx, and Matthias Zessner

Recent years have seen increasing interest in Per- and Polyfluoroalkyl Substances (PFAS) in the urban water cycle. PFAS are human-manufactured chemicals that have been employed globally in industrial and household products with outstanding chemical stability and mobility. This study set out a one-year monitoring scheme as a basis to better understand the sources, transport and fate of PFAS at a large catchment scale. The monitoring results will further assist the development of a contamination distribution model.

Nine Danube tributary sites including regions with low and high pollution risk were selected, based on the existing monitoring results from other research and inventories of hotspots like industries and landfills, to investigate the appearance of pollutants along the surface water of the catchment. Two locations on the Danube mainstream were targeted for more frequent monitoring of surface water and connected groundwater, furthermore, bank-filtration models will be built for these sites. In the case of point sources, five municipal wastewater treatment plants, four direct industrial dischargers and four legacy landfill sites were selected to identify the impact of these hotspots. Surface runoff at three small catchments dominated by either arable land, grassland or forests, together with samples of atmospheric deposition at three city sites were collected to cover potential diffuse pathways of PFAS transport in the catchment.

At the current stage, two-thirds of the sampling has been carried out for the Danube locations and the rest of the sites are approaching completion. Targeted analysis method using liquid chromatography mass spectrometry (LCMS) was employed, to assess the presence of thirty-two different PFAS compounds.

Despite the fact of being restricted in the EU, PFOA and PFOS were still detected in most samples. Additionally, short-chain perfluoroalkyl carboxylic (PFCA) and sulfonic (PFSA) acids were prominently detected in 110 surface and groundwater samples, while 97% of the total concentration exceeds the newly proposed EQSD(Environmental Quality Standards Directive) of 4.4 ng/L to EU in 2022. What stands out in the results is that, at a site downstream of an industrial hotspot region in the upper part of the catchment, samples show a total PFAS concentration greater than 2700 ng/L, a significant proportion of which came from two replacement compounds, ADONA and GenX. This “signal” is still observed far downstream. In contrast to most of the tributaries, ADONA and GenX were detected in all samples from the two Danube sites and accounted for the largest proportion of the total concentration. Analysis of twelve groundwater samples below one landfill site observed a median total concentration of 110 ng/L, meanwhile three landfill leachate samples were analysed showing amounts greater than 720 ng/L. In addition to the compounds mentioned above, the presence of 6:2 fluorotelomer sulfonate (FTS), Perfluorooctanesulfonamide (FOSA) and sulfonamidoacetic acid (FOSAA) were not negligible in these samples. Wastewater samples are still under evaluation and details will be shown at the conference.

The monitoring results indicate the significant contribution of hotspot regions and point sources to the PFAS contamination in the river, but at the same time, diffuse inputs must not be ignored.

How to cite: Liu, M., Saracevic, E., Krlovic, N., Zoboli, O., Kittlaus, S., Rab, G., Obeid, A., Oudega, T., Derx, J., and Zessner, M.: Comparative assessment of PFAS concentrations in emission pathways, surface and groundwater in the upper Danube Basin, EGU General Assembly 2023, Vienna, Austria, 23–28 Apr 2023, EGU23-2267, https://doi.org/10.5194/egusphere-egu23-2267, 2023.

EGU23-2642 | ECS | Orals | HS2.3.3

Chemical characterization of urban waters aimed for managed aquifer recharge in the Hesbaye chalk aquifer (Liège, Belgium) 

Robin Glaude, Nataline Simon, Philippe Orban, and Serge Brouyère

Managed Aquifer Recharge (MAR) is a viable method that has gained recognition for storing alternative waters in aquifers for subsequent recovery or environmental benefits. It has the potential to increase the supply of fresh water and protect aquifers from overexploitation and degradation, but it might also carry the risk of contaminating groundwater since the recharge water used may contain a wide range of organic and inorganic contaminants. Therefore, it is important to carefully assess the quality of these alternative sources of water (such as runoff water) used for MAR and implement appropriate treatment measures to remove or neutralize any contaminants that may be present. The purpose of this research is to conduct a preliminary feasibility study of MAR as a potential mitigation measure in the Hesbaye chalk aquifer since this major source of drinking water for the region of Liège (Belgium) is threatened both in terms of quantity and quality. In the first phase of the study, the quality of runoff waters collected from stormwater basins along national roads and in a national airport area was analysed and certain contaminants of emerging concerns were detected at concentrations close to drinking water limits or environmental safety guidelines. In particular, contaminations with PFAS compounds have been detected in stormwater basins in the airport area with maximum values reaching up 490, 330 and 250 ng/L for PFECHS, PFPeA and 6:2 FTS respectively. Other contaminants of emerging concerns such as alkylphenols and organophosphate flame retardants have been detected as well. In a second phase, estimates of expected recharge rates were determined through in-situ experimentation using a small infiltration pond with a pressure sensor and innovative active-DTS measurements with buried optical fiber cables to monitor the infiltration of water into the loess (eolian loam) sediments overlaying the Hesbaye chalk aquifer. Finally, these input data have been used to perform 1D transport modelling simulations in order to make a preliminary evaluation of the risk of groundwater deterioration in the case where these raw runoff waters are infiltrated without pre-treatment. Column infiltration tests are planned to get a better estimation of the soil attenuation capacity in the unsaturated zone. This study is unique in that i) it explores the feasibility of MAR in a country in which the method is not well-developed yet, ii) the use of airport runoff water as a potential source of recharge water is novel and has not been widely examined in previous MAR studies and iii) aquifer-soil treatment in loess sediments overlaying a chalky fractured aquifer is a unique hydrogeological setting to perform MAR operations.

How to cite: Glaude, R., Simon, N., Orban, P., and Brouyère, S.: Chemical characterization of urban waters aimed for managed aquifer recharge in the Hesbaye chalk aquifer (Liège, Belgium), EGU General Assembly 2023, Vienna, Austria, 23–28 Apr 2023, EGU23-2642, https://doi.org/10.5194/egusphere-egu23-2642, 2023.

Oxytetracycline (OTC) is frequently detected antibiotic in surface water because it is widely used for both humans and animals; however, it is difficult to be completely removed by conventional wastewater treatment due to its recalcitrant nature. By using photo-Fenton-like process, OTC could be degraded or transformed, while only a few studies were conducted to detect its transformation products (TPs). In this study, a UHPLC (Ultra-high-performance liquid chromatography) system coupled with a Triple TOF 5600+ mass spectrometer (AB SCIEX Co., Redwood City, CA, USA) was used to identify the TPs of OTC during the heterogeneous photo-Fenton process. The heterogeneous photo-Fenton-like process was performed with MIL-100(Fe) and 50 mg/L of H2O2 under visible light, then 12 kinds of TPs were observed. The peak area of OTC (m/z 461) decreased immediately as the reaction wend, and 8 kinds of TPs were observed only after 1 min-reaction. OTC transformed initially and mainly by decarbonylation of C1 (m/z 433), hydroxylation of the aromatic ring (m/z 477a) and C11a (m/z 477b), and demethylation at low N-C bonds (m/z 447). m/z 477a and 475 were predominantly observed because the aromatic ring is one of the most favorable target site to be oxidized by ·OH. Additionally, keto/enol at C11a-C12 is another favorable oxidation site forming m/z 477b; further hydroxylation generated m/z 493, and additional secondary alcohol oxidation led to the formation of m/z 491. A methyl group at C4 abstraction (m/z 447) was degraded further into m/z 429 by dehydration of C6-C5a, abstraction of hydrogen at C5 turned into m/z 459, and m/z 441 was formed by dehydration at C6.

How to cite: Park, J.-A.: Transformation products of oxytetracycline by heterogeneous photo-Fenton-like process, EGU General Assembly 2023, Vienna, Austria, 23–28 Apr 2023, EGU23-3028, https://doi.org/10.5194/egusphere-egu23-3028, 2023.

Modelling environmental concentrations of pesticides at landscape-level is of growing interest for pesticide registration and product stewardship, including higher-tier studies in risk assessment, mitigation measures, monitoring support and decision making. Typically, processes such as runoff, drainage, and leaching are well represented in existing modelling concepts at point and landscape scale. However, the modelling of off-target spray drift is often neglected or simplified at the landscape-level scale due to its high computational costs. Attempts at implementing spray drift into landscape-level modelling often rely on an external calculation of drift curves with pesticide masses added directly to the channel network. Although this approach enables the estimation of drift entries based on the proximity of source areas to water bodies, it may be insufficient in representing the spatial distribution of spray drift depositions in the landscape.

Our modelling approach aims to enable computationally efficient landscape-level spray drift predictions, which account for short term and local weather conditions. Therefore, a spray drift model for ground application was developed, by combining a mechanistic droplet model with a 3D Gaussian puff model. The mechanistic droplet model predicts the trajectory and mass balance of individual representative droplets, based on environmental conditions and application operations. This trajectory is then combined with a 3D Gaussian puff model to predict pesticide concentrations in the landscape, which are used to predict pesticide deposition rates. The model considers important spray drift predictors such as weather conditions, drop size distribution, physio‑chemical properties of the active ingredient, and operational conditions. The model showed realistic and expected behavior for variations in important input parameters (e.g., different nozzle types, wind speed). Furthermore, validation against two spray drift field studies showed good agreement between simulated and observed values.

To increase the understanding of pesticide transport pathways at the landscape-level, it is planned to combine the spray drift model in a modular fashion with a high-resolution SWAT+ (Soil and Water Assessment Tool) model of an agriculturally dominated catchment in Germany. Moreover, the spray drift model is expected to be a useful tool in the elucidation of monitoring data and the assessment of ecotoxicological risks for non-target organisms.

How to cite: Fuchs, M., Gebler, S., and Lorke, A.: Estimating high resolution exposure at landscape-level – on the development of a 3‑dimensional Gaussian puff droplet drift model, EGU General Assembly 2023, Vienna, Austria, 23–28 Apr 2023, EGU23-5361, https://doi.org/10.5194/egusphere-egu23-5361, 2023.

Water and sediment transport minerals, micro-plastics, heavy-metals, pathogens, DNA, RNA, and emerging contaminants through river networks. We would like to use point observations of these concentrations to determine where and how much of these are entering the network. However, downstream samples are mixtures of all the potential upstream sources. Separating out the contribution of an individual source requires "unmixing" the network's waters or sediments.

Here, we describe a very efficient approach to perform such an unmixing, identifying the contribution from each nested sub-catchment in a drainage basin. First, we abstract the sub-catchments defined by our sampling sites into a directed acyclic graph. Each node (sub-catchment) in the graph is defined as having an upstream area, which we know, and a tracer source concentration, whose value we want to find. If we assume that when two rivers meet their tracers' fluxes are combined conservatively then downstream concentrations are the mixture of all upstream concentrations, weighted by upstream area.

To solve for the source concentration of each sub-catchment we define a convex optimisation problem, minimising the relative difference in the predicted and observed tracer concentration at each sample site. Due to its convexity, this optimisation problem can be solved in less than a second for networks of a 100 nodes. Uncertainties can be estimated using a Monte-Carlo style approach. We have made an open-source, Python implementation of this algorithm available on GitHub. This implementation requires as input (1) a spreadsheet containing sample site locations and observed tracer concentrations and (2) a D8 flow-direction raster map. This is a powerful approach for locating and quantifying the sources of conservatively mixed tracers or pollutants in drainage networks.

How to cite: Lipp, A. and Barnes, R.: Identifying tracer and pollutant sources in drainage networks from point observations using an efficient convex unmixing scheme, EGU General Assembly 2023, Vienna, Austria, 23–28 Apr 2023, EGU23-5368, https://doi.org/10.5194/egusphere-egu23-5368, 2023.

Atrazine is one of the most frequently found pesticides in groundwater and surface water. Under natural light, the half-life of this herbicide in aqueous medium is around 250 days. Atrazine has shown the potential to alter food webs, decrease diversity, and can interfere with species composition. In the current study, electrocoagulation powered by solar energy was used to eliminate atrazine from the aqueous solution. Aluminum and copper electrodes were used to investigate the effect of different operating parameters such as contact time (10-60 min), applied voltage (5-25 V), initial pH (3-11) of the feed water, types and concentration of supporting electrolyte like NaCl, Na2SO4 (100-500 mg/L) on the removal of atrazine. The loss of electrode mass and sludge generation were also evaluated. The effect of the initial concentration of atrazine was observed in the range of 3-15 mg/L. The pH of feed water solutions in all the experiments increased, indicating the necessity for neutralization after electrocoagulation.

The possible mechanisms of atrazine removal were explored using several techniques such as X-ray Diffraction (XRD), Fourier Transform Infra-Red (FTIR) spectroscopic analysis. The particle size, surface structure, and shape of dried sludge particles were analyzed using a scanning electron microscope. The energy consumption and operating cost calculations of the electrocoagulation process infer that this technique is not energy-demanding. Kinetic analysis demonstrated that atrazine removal followed first-order rate kinetics. Removal of atrazine from real river water matrices was also assessed in the current research. Current work indicated that solar-powered electrocoagulation is a promising approach for the elimination of atrazine in the treatment of water and wastewater in decentralized mode. 

How to cite: Biswas, B. and Goel, S.: Atrazine removal from river water using direct current and solar-powered electrocoagulation, EGU General Assembly 2023, Vienna, Austria, 23–28 Apr 2023, EGU23-6156, https://doi.org/10.5194/egusphere-egu23-6156, 2023.

EGU23-6590 | ECS | Posters on site | HS2.3.3

Multi-element compound-specific isotope analysis of chlordecone during abiotic transformation reactions 

Maria Prieto-Espinoza, Laure Malleret, and Patrick Höhener

Chlordecone (CLD; C10Cl10O) is an organochlorine pesticide extensively used between 1960s and 1990s in the French West Indies (FWI). Its massive use led to soil and river pollution which prompted its ban in 1993. CLD has a bis-homocubane structure and various chlorine atoms making it highly recalcitrant in the environment. To date, several environmental compartments of the FWI continue facing the legacy of CLD pollution. This study aims at improving the monitoring of the degradation (or recalcitrance) extent of CLD in the soils of the FWI following in situ chemical reduction (ISCR). Multi-element compound-specific isotope analysis (ME-CSIA) was used to identify changes of stable isotopes of CLD (i.e., 13C/12C and 37Cl/35Cl) produced during distinct abiotic reductive transformation reactions. Reductive transformation of CLD was tested in abiotic microcosms in the presence of either zero-valent iron, ascorbic acid, vitamin B12, or persulfate activated by microwave irradiation. CLD transformation was evidenced by the detection of several hydrochlordecones (after losses of one or two chlorine atoms) under all conditions. Enrichment of the 13C isotopes of CLD relative to 12C revealed distinct signatures during transformation reactions of CLD to maximum Δδ13C of +7.2 ‰. A novel stable Cl isotope analysis was performed by liquid chromatography quadrupole time-of-flight mass spectrometry (LC-QToF-MS). Ongoing Cl isotope analysis may establish a multi-element assessment in which abiotic CLD degradation pathways may be distinguished based on stable C-Cl signatures. Altogether, our results may provide an improved strategy to elucidate CLD degradation in contaminated soils of the FWI.

How to cite: Prieto-Espinoza, M., Malleret, L., and Höhener, P.: Multi-element compound-specific isotope analysis of chlordecone during abiotic transformation reactions, EGU General Assembly 2023, Vienna, Austria, 23–28 Apr 2023, EGU23-6590, https://doi.org/10.5194/egusphere-egu23-6590, 2023.

EGU23-6720 | ECS | Posters on site | HS2.3.3

Trends in pit-latrine usage in Malawi and their unintended impacts on groundwater quality 

Rebekah Hinton, Limbikani Banda, Christopher Macleod, Mads Troldborg, and Robert Kalin

Providing adequate and equitable sanitation to all by 2030 is central to achieving Sustainable Development Goal 6 (SDG6). Pit-latrines provide a low-cost, accessible form of sanitation, there has, therefore, been a significant increase in the rapidly growing Malawian population using pit latrines, largely driven by a reduction in open defecation. Whilst open defecation reduction is critical in managing waterborne pathogens and other contaminants, pit latrines can also result in both microbial and nutrient contamination of groundwater; faecal contamination of groundwater, resulting in contaminated boreholes, has already been documented in Malawi.

To forecast the level of pit-latrine usage in Malawi, we evaluate the trends in Malawian sanitary provision using linear modelling to estimate that currently 500,000 people gain access to sanitation in Malawi every year, requiring approximately 93,000 new pit-latrines to be constructed annually to accommodate this shift. The associated increase in pit-latrine density creates a heightened threat of borehole contamination and a key public health concern.

We also examine the nature of pit-latrine management and usage, presenting the results of a national survey of over 200,000 sanitary facilities. Whilst pit-latrines are usually associated with faecal contaminants, we found that 82.3% of pit-latrines had materials other than faecal waste deposited including rubbish, plastics, and oils; these present a danger of micropollutant contamination. Furthermore, we find that sustainable practises to manage waste deposited in pit-latrines, such as pit-latrine emptying, have low adoption.

Pit-latrine usage is already causing groundwater contamination in Malawi, this will only be exacerbated by our projected increase in pit-latrine usage as Malawi manages a growing population and actively pushes to eliminate open defecation.

This research is thanks to research and collaboration with the Government of Malawi with funding by the Scottish Government under the Scottish Government. Climate Justice Fund Water Futures Programme.

How to cite: Hinton, R., Banda, L., Macleod, C., Troldborg, M., and Kalin, R.: Trends in pit-latrine usage in Malawi and their unintended impacts on groundwater quality, EGU General Assembly 2023, Vienna, Austria, 23–28 Apr 2023, EGU23-6720, https://doi.org/10.5194/egusphere-egu23-6720, 2023.

EGU23-7315 | ECS | Orals | HS2.3.3

Predicting multi-species disinfection byproduct formation at small catchment scale using fluorescence spectroscopy data analyzed by machine learning 

Boris Droz, Elena Fernandez-Pascual, Goslan Emma, Jean O'Dwyer, Simon Harrison, Connie O'Driscoll, and John Weatherill

In Ireland, 82% of public water supplies originate from surface water sources which often contain elevated concentrations of dissolved organic matter (DOM) from a range of allochthonous (e.g., leaf leachate, manure) and autochthonous (e.g., macrophytes, biofilms, algae) catchment sources. During disinfection, this DOM may react with chlorine to produce potentially carcinogenic disinfection byproducts (DBPs) such as trihalomethanes (THMs), haloacetic acids (HAAs) and a range of nitrogen-containing species such as haloacetonitriles (HANs) and halonitromethanes (HNMs). As a result, Ireland has the highest reported number of total THM exceedances, (e.g., concentrations in excess of 100 μg L-1) in potable water across European Union member states. Removal of DOM precursors from raw water prior to chlorination has shown to be effective in mitigating DBP formation. However, significant infrastructural challenges remain in Ireland with many small treatment plants requiring costly upgrades. Hence, there is an urgent need for low-cost proactive monitoring tools to quantify DOM composition and concentration of source water to aid in the production of safe drinking water.

The overall aim of the present study is to better understand the spatiotemporal dynamics of DOM precursors and associated DBP formation at the scale of small river catchments (e.g., <50 km2) typical of drinking water source areas. To achieve this, we investigated two sub-catchments (34 km2 and 18 km2) of the River Lee basin, Republic of Ireland, which serve water treatment plants known to be at risk of THM exceedances. High resolution field sampling and measurement of DBP precursors (DOC, DIC, DON, NH4+, Cl and Br) and DOM optical properties using UV-vis and fluorescence excitation−emission matrix (EEM) spectroscopy were combined with 214 three-day batch chlorination experiments from 36 monitoring points (including 12 groundwater) from February to November 2021. A machine learning ensemble including bagging tree, generalized boosted regression and neural networks models was developed to explore and predict DBP formation potential using EEM parameters, including parallel factor analysis (PARAFAC) components and the measured DBP concentrations from the batch chlorination experiments. Therefore, we could predict with on average of 13% and 6% precision and error, respectively, the concentration of twenty DBPs produced from chlorination including four THMs, nine HAAs, four HANs, one HNM and two haloketone species. In addition, DOM molecular size distribution was measured on 25 samples by size exclusion – organic carbon – nitrogen detection (LC-OCD-OND) to explore the composition of DOM sources. Our findings highlight potential opportunities for DBP risk reduction through proactive online monitoring of source water using fluorescence EEM spectroscopy. This knowledge will help to organize appropriate mitigation strategies at the catchment level as well as aid in treatment process optimization using fluorescence EEM spectroscopy which surpasses the capabilities of traditional online UV-vis spectroscopy. Overall, the findings of our research will help to decrease the number of total THM exceedances in Ireland and better protect consumer health in relation to drinking water chemical quality around the world.

How to cite: Droz, B., Fernandez-Pascual, E., Emma, G., O'Dwyer, J., Harrison, S., O'Driscoll, C., and Weatherill, J.: Predicting multi-species disinfection byproduct formation at small catchment scale using fluorescence spectroscopy data analyzed by machine learning, EGU General Assembly 2023, Vienna, Austria, 23–28 Apr 2023, EGU23-7315, https://doi.org/10.5194/egusphere-egu23-7315, 2023.

EGU23-7659 | ECS | Posters on site | HS2.3.3

Agropollutants fate in the fields scale 

Shulamit Nussboim, Orah F. Rein Moshe, Johnathan B. Larrone, Elazar Volk, Chaya Sud-Tesler, and Lea Wittenberg

Pesticides are used worldwide to support food security for the growing world population. In Israel thousands of tons of pesticides are applied every year and find their way to the entire catchment: soil, surface water, interflow and groundwater. In addition, the treated waste water applied for irrigation convey pharmaceuticals that are distributed in the catchments as well. Previous studies focused one or a few pollutants, which limit the scope of the chemical features on the pollutants fate. Other research focused a certain flowpaths: the stream and tributaries, or groundwater pollutants. This study provides a wide scope of the all 3 main flowpaths (surface water, interflow, groundwater) and the fate of over 70 pesticides in the field scale, including time series in short temporal resolution for groundwater and interflow.

The study took place during irrigation (Apr 2021) and during winter 2022, focusing two winter storms (Jan 2022). The study fields border the Kishon, the 2nd largest coastal stream in Israel. Both fields have subsurface drainage system to address high water level and bad drainage soils. The subsurface drainage system provides direct approach to the subsurface water. Water collected from the pipe outlet of the system represent subsurface, but also from manholes, which are the approach to the subsurface system. Groundwater was collected from piezometers to deep and shallow aquifers in both fields, according to accepted protocol for ground water sampling, utilizing a metal bailor. Surface water was collected from field surface, applying RCU-Runoff Collector Units and also from secondary and primary surface drainage trenched in the field. All water were collected in glass bottles, and were analyzed by LC/MS.

In this study the spatial distribution in the field scale was demonstrated, including the vertical direction. Samples that were collected from surface water, interflow and groundwater show the dominant flowpath of each compound, where the chemical characteristics were critical to obtain the compound pathway. For example, imidacloprid was applied only a few weeks before the storm and found in high concentration in surface water. Interflow water collected from subsurface drainage system show imidacloprid concentrations which are order of magnitude lower for the entire winter. On the other hand, diflufenican was applied more than two years ago was found in high concentration in surface water, as a result of low degradability and low mobility, yet subsurface concentrations were negligible. Both compounds were in high concentration near the application area (onion section of the field).  Time series (interflow, groundwater) were key data, where taken before, during and after water enter soil column during irrigation or a rain event. All data clustering analysis, showing pairs of compounds vs each other was operated. A clear clustering, in most cases, fit the spatial distribution establishing 4 groups: 1. surface runoff from field and all trenches 2. Subsurface water pipe (and manholes in most cases) 3. Groundwater 4. Stream

This research provides a large data base, including temporal and spatial point of view which are innovative and provide a comprehensive scope for field-scale processes.

How to cite: Nussboim, S., Rein Moshe, O. F., Larrone, J. B., Volk, E., Sud-Tesler, C., and Wittenberg, L.: Agropollutants fate in the fields scale, EGU General Assembly 2023, Vienna, Austria, 23–28 Apr 2023, EGU23-7659, https://doi.org/10.5194/egusphere-egu23-7659, 2023.

EGU23-7699 | Orals | HS2.3.3 | Highlight

Pesticide transformation product occurrences in surface waters as ground water pollution risk indicators in the context of an extended residence time aquifer 

Tom Gallé, Michael Bayerle, Denis Pittois, Viola Huck, and Julien Farlin

Luxembourgish groundwater aquifers have recently been impacted by high concentrations of several pesticide transformation products (TP) that led to regulatory issues for about 1/3 of the drinking water supplies (Luxembourg considers all transformation products to be relevant and applies the 100 ng/L legal threshold). The consequent application restrictions or complete bans of certain pesticides triggered switches in compound uses in several cultures. A leaching risk analysis had been conducted to orient agricultural counselling on the least impacting parent compounds and transformation products. However, since the leaching simulations relied on literature environmental property data of the pesticides (like fraction of TP generated), there was some uncertainty on the true impact of the identified TPs. Residence times of groundwaters in the main aquifer spanning on average between 10 and 20 years (with proportional recovery times once these waters are contaminated), a faster validation approach was needed. The hypothesis was established that the interflow component in surface waters would be a good indicator to estimate the amount of transformation products available for groundwater leaching. In that perspective passive sampling campaigns were established on four river basins of distinct hydrogeology to quantify the masses of parent compounds and transformation products transported during an entire year and supported by grab sampling in the descending limbs of seasonal flood waves. Additional parameters included conductivity, DOC, Abs280 and macro-anions. All the predicted transformation products were identified and their occurrence varied in amount and timing in the different catchments according to their application, metabolization in soils and hydrogeological setting. This contribution discusses the influences of spatial use variability and hydrological connectivity of agricultural source plots to the magnitude of the occurrences as well as its potential link to the leaching modelling and its parametrization.

How to cite: Gallé, T., Bayerle, M., Pittois, D., Huck, V., and Farlin, J.: Pesticide transformation product occurrences in surface waters as ground water pollution risk indicators in the context of an extended residence time aquifer, EGU General Assembly 2023, Vienna, Austria, 23–28 Apr 2023, EGU23-7699, https://doi.org/10.5194/egusphere-egu23-7699, 2023.

EGU23-9553 | ECS | Orals | HS2.3.3

Evaluating trends and risks of aquatic pesticide pollution in the Western Cape, South Africa 

Reynold Chow, Emma Davies, Samuel Fuhrimann, and Christian Stamm

South Africa is the leading user of pesticides in Sub-Saharan Africa. Consequently, there is an urgent need to improve our understanding of which pesticides persist in the environment and how they are being transported to non-target environments. The presence of pesticides in non-target environments, such as surface water or groundwater, could be detrimental to aquatic ecosystems and human health.

Our research focuses on monitoring for pesticides in the rivers of three agricultural catchments (Grabouw, Hex River Valley, and Piketberg) within the Western Cape, South Africa. Passive samplers are being deployed from March 2022 to March 2023, adding to a pre-existing dataset of analytical and pesticide application data from 2017 to 2019. Laboratory methods are being developed and validated at Stellenbosch University (SU) to analyze for pesticides using Liquid Chromatography-Mass Spectrometry. Duplicate samples were analyzed at the Swiss Federal Institute of Aquatic Research (Eawag), as a quality control step. Limits of Quantification were lower at Eawag and measured concentrations were typically higher compared to SU. These differences are likely due to variations in the instrument used and sample extraction procedure. 

Results from 2017-2019 indicate that 83% of samples contained five or more pesticides. In every year of sampling, total pesticide concentrations were typically attributable to a single/few compounds per catchment. Six pesticides exceeded Environmental Quality Standard (EQS) values in at least one of the sampling periods. Imidacloprid was highlighted as a pesticide of concern since it consistently exceeded EQS values over all sampling periods. Detection/exceedances of pesticides generally coincided with their application and rainfall events, except for imidacloprid and terbuthylazine. This suggests that alternate transport pathways, such as storage and input from groundwater, may be relevant. Recent results from 2022 sampling indicate that the concentrations of imidacloprid are decreasing; however, they are still exceeding EQS values. Lastly, expansion of the analytes in 2022 led to the detection of two new pesticides, dimethomorph and diphenylamine.

Our results suggest that establishing a long-term data set regarding aquatic pesticide pollution in the Western Cape will lead to a better understanding of the trends and risks of pesticide use. This improved knowledge will lead to the development of targeted mitigation measures for more sustainable agricultural practices in South Africa and beyond.

How to cite: Chow, R., Davies, E., Fuhrimann, S., and Stamm, C.: Evaluating trends and risks of aquatic pesticide pollution in the Western Cape, South Africa, EGU General Assembly 2023, Vienna, Austria, 23–28 Apr 2023, EGU23-9553, https://doi.org/10.5194/egusphere-egu23-9553, 2023.

EGU23-11046 | ECS | Posters virtual | HS2.3.3

Effect of seawater intrusion on human health risk and toxicity of disinfection by-products 

Naseeba Parveen and Sudha Goel

Around the world, coastal groundwater is increasingly subject to seawater intrusion (SWI). The quality and characteristics of such waters differ from those of surface and groundwater. In the current study, trihalomethane (THM) formation under varying levels of SWI, its human health risks, and toxicity were evaluated. Various levels of SWI were simulated by mixing deionized water synthetic seawater (SSW) by varying seawater volumes from 0% to 3%. Chlorination of these samples was carried out as per uniform formation condition (UFC). Chlorine demand increased with increasing SWI.  THM concentration increased from 12.64 μg/L to 105.34 μg/L after 24 h and to 115.8 μg/L after 48 h for an increase from 0% to 3% volume of seawater. Human health risks due to THMs were determined using probabilistic risk assessment models considering ingestion, dermal contact, and inhalation as three exposure routes. Risk assessment was carried out using 1,00,000 iterations of Monte Carlo simulations. Total cancer risk increased 4 times for an increase of SWI from 0% to 0.25%. Further, the toxicity of THMs to mammalian cells due to increasing degrees of SWI was calculated. For this, the lethal concentration that reduced the Chinese hamster ovary (CHO) cell density by 50% (LC50) by all four THMs reported in the literature was considered. The highest total toxicity value of 1.07 × 10-04 was observed at SWI = 1% by volume. In general, an increase in SWI of up to 1% resulted in maximum health risk and toxicity. The results of the current study are useful for coastal water utilities and treatment plants to reduce human health risks due to disinfection by-products.

How to cite: Parveen, N. and Goel, S.: Effect of seawater intrusion on human health risk and toxicity of disinfection by-products, EGU General Assembly 2023, Vienna, Austria, 23–28 Apr 2023, EGU23-11046, https://doi.org/10.5194/egusphere-egu23-11046, 2023.

EGU23-11841 | ECS | Posters on site | HS2.3.3

Modeling large-scale biocide transfer to urban groundwater 

Felicia Linke, Felix Zimmermann, and Jens Lange

Biocides used as film protection in paints and renders wash off from facades and enter the urban water cycle. They can also reach urban groundwater, diffusely or at specific locations via urban stormwater infiltration systems (SIS). Up to now, there is limited knowledge to estimate biocide input to urban groundwater at larger scales. This study focuses on an urban area of 38ha and models biocide input to groundwater, including SIS. The aim is to determine preferential input locations, SIS retention capacities, transport and degradation of biocides in the saturated zone. The study area is located in southwestern Germany in the city of Freiburg. Due to a contamination site with chlorinated hydrocarbons (CHC), numerous urban groundwater monitoring wells exist. Hence existing monitoring data is substantial, including groundwater levels, biocide and CHC samples over a time period of at least seven years. The biocide terbutryn is chosen as a model biocide, as it is commonly used in paint and renders and was previously detected in the study area. The present study uses a model chain to reproduce biocide emission and transfer. First, terbutryn leaching is estimated using the model COMLEAM. Then, the urban water balance and groundwater recharge are calculated by the model Roger_WB_Urban. Coupling the estimated terbutryn emissions with groundwater recharge patterns provides an estimation of terbutryn inputs to groundwater over time. This pattern is finally used as input for a groundwater model (MODFLOW), which is calibrated with the help of the CHC plume development. First model results confirm groundwater monitoring data and indicate that retention capacities of the investigated SIS are limited, mainly because of shallow groundwater levels. This is reflected by simulated terbutryn concentrations in groundwater which are apparently higher downgradient of the SIS. However, also other input pathways exist. Overall, our model chain helps to understand biocide emission and transfer pathways in urban environments at larger scales and stresses the fact that measures to prevent groundwater contamination are most efficient at the source.

How to cite: Linke, F., Zimmermann, F., and Lange, J.: Modeling large-scale biocide transfer to urban groundwater, EGU General Assembly 2023, Vienna, Austria, 23–28 Apr 2023, EGU23-11841, https://doi.org/10.5194/egusphere-egu23-11841, 2023.

EGU23-11979 | Posters on site | HS2.3.3

Spatially distributed analysis of heavy metal pollution in the upper catchment of the river Oker, Germany 

Paul Wagner, Daniel Rosado, Vanessa Rincón, and Nicola Fohrer

Heavy metals are still found in the rivers of the Harz Mountains in Germany as a result of mining. In the EXDIMUM research project (Extreme Weather Management with Digital Multiscale Methods) a spatially distributed measurement campaign was carried out in the catchment of the river Oker upstream of the gauge at Schladen. The focus was on the rivers Gose and Abzucht upstream of the city of Goslar. The objectives of this research were to quantify the deposition of heavy metals in the sediment and to identify source areas of heavy metal pollution in the catchment. To this end, sediment samples were taken from the river bed of the main and tributary rivers upstream of each confluence, so that it was possible to determine from which sub-catchments heavy metals entered the main channel. The sediment samples were analyzed for various heavy metals in the environmental laboratory of the Christian-Albrechts-Universität zu Kiel using Inductively Coupled Plasma Optical Emission Spectroscopy (ICP-OES). Total content of lead and zinc were above reference values like the threshold effect concentrations (TEC) and the probable effect concentrations (PEC) and the effects range-low (ERL) and the effects range-median (ERM) in several sediments. The spatial analysis shows that elevated levels of contamination occur particularly in the vicinity of former mine pits, smelter sites, and mine dumps. Within the EXDIMUM project, further campaign measurements during and after a flood event are planned, which, together with the modeling of runoff and sediment discharge in the study area, should allow to draw conclusions on the potential influence of extreme events on the export of heavy metals.

How to cite: Wagner, P., Rosado, D., Rincón, V., and Fohrer, N.: Spatially distributed analysis of heavy metal pollution in the upper catchment of the river Oker, Germany, EGU General Assembly 2023, Vienna, Austria, 23–28 Apr 2023, EGU23-11979, https://doi.org/10.5194/egusphere-egu23-11979, 2023.

EGU23-12891 | ECS | Posters on site | HS2.3.3

Chemistry of snow cover under industrial pressure in the forest ecosystem surrounding the HCM zinc smelter 

Justyna Likus-Cieślik, Bartłomiej Woś, Marta Szostak, Marcin Pietrzykowski, and Marek Pająk

The industry is the main source of pollutant emissions and is responsible for 63% of Pb emissions and 58% of Cd emissions. One of the oldest and most polluted places related to the mining and processing of non-ferrous metals in Europe is the Silesia-Cracow region (southern Poland). Currently, this region is also the only one where zinc and lead smelting plant are active (HCM) in this part of Europe. Processing of zinc-lead ores and recycled waste materials generates trace elements emission to the environment. Imperial Smelting Process (ISP) used at the HCM zinc smelter generates eg. trace elements, forms of sulfur oxide, and alkali dust. Despite the introduction of protection programs and the implementation of installations preventing the release of pollutants into the environment developed in the last decade by the plant, still, the area surrounding the smelter is characterized by elevated contamination of trace elements.

The work aimed to capture the impact of an industrial plant (HCM zinc and lead smelter) on forest ecosystems, based on physicochemical analyzes of short-term snow cover. The research area was located in the Scots pine (Pinus sylvestris L) stands adjacent to the zinc and lead smelter. The sampling points were selected in directions: N, S, W, and E from the middle point (emitter of HCM) with a 1-kilometer distance interval. There were selected 22 points with distances in values 0-8 km from the middle point. The samples were collected in February 2021. The snow samples were analyzed for pH, EC, SO42-, Cd, Pb, and Zn concentration. Cd ranged from 0.001 to 2.47 mg L-1, Zn from 12.10 to 0.05 mg L-1, Pb from 2.47 to 0.001 mg L-1, and SO42- ranged from 1.08 to 19.38 mg L-1 in the snow. The Cd was concentrated next to the emitter (up to 1 km), similarly to Zn and SO42-, but still high values of Zn and SO42- reached further – up to about 2-3 km from the emitter. The highest Pb pollution was also found near the emitter, but the pollution spread along with the direction of the winds. Pb pollution did not decrease with distance - higher values were found at spots, e.g., about 2 (0.19 mg L-1) and 4 km (0.13 mg L-1) away from the emitter on the east. The pH varies from 5.4 to 7.0, and the highest pH occurred just near the emitterand decreased with the direction of the wind.High values of researched pollution in the snow and their distribution indicated the impact of the emitter on the nearest environment, however, these amounts are not harmful to plants, except for point 0 (closest to the emitter). Unorganized emissions (i.e. emissions resulting from technological processes) caused much greater pollution visible at the point closest to the emitter. Organized emission pollution, released through stationary point-sources, i.e.chimneys, discharge air vents, etc., was significantly lower.

How to cite: Likus-Cieślik, J., Woś, B., Szostak, M., Pietrzykowski, M., and Pająk, M.: Chemistry of snow cover under industrial pressure in the forest ecosystem surrounding the HCM zinc smelter, EGU General Assembly 2023, Vienna, Austria, 23–28 Apr 2023, EGU23-12891, https://doi.org/10.5194/egusphere-egu23-12891, 2023.

European beaver (Castor fiber) significantly affects hydrogeomorphological processes, mostly due to its ability to build and maintain dams on rivers. Changes in flow regime, water storage and rates of sediment deposition lead to alterations in chemical composition of water and accumulated material. Recent findings suggest that beaver dams can be considered as a factor in river self-cleaning process in European lowlands (Puttock et al., 2017).

In order to examine beaver impact on mountainous rivers along a N-S transect through the Western Carpathians, selected sections of river valleys from the foothills through the Beskids in Poland to the southern slope of the Western Carpathians in Slovakia were surveyed. Study was conducted on 21 sites on 19 rivers. Each site consisted of three sampling points: above and below the beaver cascade or pond (if there was only one) and by the largest dam in the system. Water samples were taken in the summer and autumn of 2022, at normal water levels, and sediment samples were taken during field surveys in the autumn of 2022. The heavy metal content in sediments and the ionic composition in water  were determined using an ICP MS TOF spectrometer (Optimass 9500 GBC) and  Dionex ICS3000 ion chromatograph.

Beaver populations considerably increased in Western Carpathians in recent years and their contemporary occurrence is relatively new in the area where they were extirpated probably ca. 400 years ago (Żurowski, 1986). Reintroduction program was conducted in some Carpathian catchments in Poland in the 2nd part of the XX century (Kasperczyk, 1987). Release sites acted as dispersion centers not only for Polish but also Slovak populations in the analyzed mountain range. High migration rates and inhabitation of various habitats (from semi-natural to highly anthropogenically modified) catchments makes the research on this ecosystem engineer in Carpathians particularly important.

This study covers preliminary results of the Polish National Science Centre PRELUDIUM BIS 2 research project No. 2020/39/O/ST10/01354, entitled "Impact of European beaver (Castor fiber L.) activity on the environment and human economy along the N-S transect through the Western Carpathians (Poland-Slovakia)".

References

Kasperczyk B. (1987). Rozprzestrzenianie się bobra europejskiego (Castor fiber L.) w Europie w XX wieku. Przegląd Zoologiczny 31(2), 181-193. (in Polish)

Puttock A., Graham H. A., Cunliffe A. M., Elliott M., Brazier R. E. (2017). Eurasian beaver activity increases water storage, attenuates flow and mitigates diffuse pollution from intensively‐managed grasslands. Science of the Total Environment, 576, 430–443. 10.1016/j.scitotenv.2016.10.122 

Żurowski W. (1986). Bobry w górach. Przyroda Polska, 6, 10-11. (in Polish)

How to cite: Wąs, J. and Kijowska-Strugała, M.: Impact of beaver (Castor fiber) activity on chemical composition of water and sediment in Polish and Slovakian Carpathian rivers – preliminary studies, EGU General Assembly 2023, Vienna, Austria, 23–28 Apr 2023, EGU23-13846, https://doi.org/10.5194/egusphere-egu23-13846, 2023.

EGU23-14108 | Orals | HS2.3.3

Persistence of S-metolachlor at the catchment scale investigated by compound-specific isotope analysis (CSIA) 

Sylvain Payraudeau, Boris Droz, Guillaume Drouin, Jenna Lohmann, Benoît Guyot, and Gwenaël Imfeld

Pesticide pollution of agriculturally impacted ground and surface water is ubiquitous with concentrations exceeding drinkable water limits or environmental quality standards (EQS). In this context, Compound-Specific Isotope Analysis (CSIA) opens novel opportunities to follow-up pesticide persistence and degradation from agricultural soil to rivers at the catchment scale. While CSIA has been used for decades to investigate in situ degradation of legacy compounds at contaminated aquifers, its application to evaluate pesticide degradation and transport in soil and surface water is mostly lacking due to analytical and conceptual challenges. Here we show that degradation estimates of the herbicide S-metolachlor at the catchment scale based on a classical mass balance, accounting for the different catchment’s compartments, were similar to those based on CSIA data. S-metolachlor CSIA based on carbon isotope ratios was carried out from soil samples collected monthly across the 120-km² Souffel catchment (Bas-Rhin, East of France) and from flow-proportional river samples collected at the outlet of the catchment from March 1 to October 1 2019. Based on CSIA data, 98% ± 20% of the S-metolachlor was degraded over agricultural season. This converged with estimates of S-metolachlor degradation (98.9 ± 4.7%; mean ± SD) obtained using the classical mass balance. Interestingly, degradation mainly occurred in soil, while only 12.3 ± 3.1% of S-metolachlor degraded in river on a total river length of 79 km. The wastewater treatment plants (WWTPs) contributed to 52 ± 18% of the total input mass of S-metolachlor in river. However, similar isotope signatures of S-metolachlor for diffuse and WWTP sources hampered the identification of pesticide sources. From 0.04 to 0.12% of the S-metolachlor applied was exported from the catchment during the agricultural season, which is similar to previous S-metolachlor exports estimated in other catchments. Although a little fraction of S-metolachlor was exported, 81% and 93% of the river samples exceeded the drinkable water limit (0.1 µg.L-1) and the EQS for S-metolachlor (0.07 µg.L-1), respectively. Overall, we anticipate that pesticide CSIA deployed systematically in agricultural catchments could help water managers to estimate pesticide persistence and sources to address regulatory and monitoring strategies. 

How to cite: Payraudeau, S., Droz, B., Drouin, G., Lohmann, J., Guyot, B., and Imfeld, G.: Persistence of S-metolachlor at the catchment scale investigated by compound-specific isotope analysis (CSIA), EGU General Assembly 2023, Vienna, Austria, 23–28 Apr 2023, EGU23-14108, https://doi.org/10.5194/egusphere-egu23-14108, 2023.

EGU23-14583 | ECS | Orals | HS2.3.3 | Highlight

Emissions of the urban biocide terbutryn from facades to soil and stormwater system estimated over three decades 

Sereni Laura, Junginger Tobias, Payraudeau Sylvain, and Imfeld Gwenael

Urban biocides, such as terbutryn, are widely used in facade paints and renders to reduce algae growth and are released with each rain event. Cities are increasingly adopting sustainable stormwater management associated to the sponge city concept, involving infiltration and retention systems and less water in sewer systems. Although biocides and their transformation products have been detected in groundwater, knowledge of the distribution and the infiltration of biocides and transformation products on the district scale is currently missing. Here we aimed at comparing classical and sustainable stormwater management (i.e., infiltration trench and pond) in terms of distribution and hot spots of biocide infiltration at the district scale (2.4 ha). In addition, we assessed the transport of biocides and their transformation products (TP) from facades to soil and stormwater retention systems. We combined a field campaign (6 months), including regular soil and water sampling and description of the water balance using hydroclimatic parameters and land use data, with a modelling approach to estimate and predict biocides leaching and degradation over three decades. The concentrations of terbutryn and TP (from 3 to 300 ng.L-1)in water regularly exceeded the predicted no effect concentrations (PNEC) of terbutryn. Our modelling approach underscored prevailing (27-73%) biocide infiltration towards groundwater close to facades while a smaller biocide fraction (7-39%) reached the infiltration trench and the pond. The model enabled estimating the distribution of biocides and transformation products among urban compartments, i.e., topsoil close to facades, infiltration and retention systems and deeper soils toward groundwater, for various urban surface-soil interfaces. The interfaces included infiltration through gravel layer close to facade, pavements and vegetated soils and infiltration through trenches, ponds and wells. By comparing integrated scenarios of water management and painting of facades, our results are a first step to evaluate the chronic emission of biocides and TP from facades to evaluate risks and benefits of transition scenarios towards a biocide-free city.

How to cite: Laura, S., Tobias, J., Sylvain, P., and Gwenael, I.: Emissions of the urban biocide terbutryn from facades to soil and stormwater system estimated over three decades, EGU General Assembly 2023, Vienna, Austria, 23–28 Apr 2023, EGU23-14583, https://doi.org/10.5194/egusphere-egu23-14583, 2023.

EGU23-16181 | Posters on site | HS2.3.3

Occurrence, distribution and behaviour of contaminants of emerging concern and regulated organic pollutants. Case study: the endorheic catchment of Fuente de Piedra Lagoon (Southern Spain) 

Iñaki Vadillo, Marta Inés Llamas, Joaquín Jiménez-Martínez, Pablo Jiménez-Gavilán, Carmen Corada-Fernández, and Pablo Lara-Martín

Contaminants of Emerging Concern (CECs) and regulated organic pollutants pose a serious threat to water quality and their spatial distribution is challenging to assess as it can be driven by several factors (e.g., location of pollution sources, speciation, hydrophobicity, degradability, hydro(geo)logical features).

In the current work, we focus on the distribution of a wide range of regulated and non-regulated organic contaminants in groundwater of the Fuente de Piedra lagoon catchment, in Southern Spain. The collected groundwater samples were analyzed for (i) 185 organic contaminants, (ii) water ions and (iii) stable isotopes (δ2H, δ18O and δ13C). Target organic contaminants included pharmaceuticals, personal care products, polyaromatic hydrocarbons, pesticides, flame retardants and plasticizers.

The Fuente de Piedra lagoon is a hypersaline wetland located in an endorheic basin (150 km2) in which three main aquifer types, with an hydraulic connection, can be distinguished: (i) unconfined carbonate aquifers with low mineralized water corresponding to two mountain ranges; (ii) an unconfined porous aquifer formed by Quaternary and Miocene deposits, more exposed to pollution from anthropogenic activities; and (iii) a karstic-type confined aquifer developed in a massive accumulation of evaporites and gypsum (Upper Triassic). 

In total, 32 organic contaminants were detected, at least once. An attempt to evaluate the importance of the different factors affecting the spatial distribution of the organic contaminants have been conducted. Attention has been paid to the main physical-chemical properties of the pollutants (hydrophobicity and speciation), distribution of pollution sources and anthropogenic pressures in the area (including water management practices) and hydrogeological characteristics of the different aquifers. A geochemical model has been built to characterize water mixing processes in order to better understand transport and fate of these organic contaminants. The results obtained suggest that some contaminants may accumulate and be more present in sampling points more affected by longer residence water fluxes.

How to cite: Vadillo, I., Llamas, M. I., Jiménez-Martínez, J., Jiménez-Gavilán, P., Corada-Fernández, C., and Lara-Martín, P.: Occurrence, distribution and behaviour of contaminants of emerging concern and regulated organic pollutants. Case study: the endorheic catchment of Fuente de Piedra Lagoon (Southern Spain), EGU General Assembly 2023, Vienna, Austria, 23–28 Apr 2023, EGU23-16181, https://doi.org/10.5194/egusphere-egu23-16181, 2023.

EGU23-16407 | ECS | Orals | HS2.3.3

Optimized flux estimation of a sulfonamide contaminant plume discharging to a stream using fluorescence screening  

Gregory G. Lemaire, Laila Vinther, Britt B. Thrane, Dorte Harrekilde, Cecilie B. Ottosen, Josefine L. Hansen, Mette M. Broholm, Poul L. Bjerg, Lone Dissing, and Jørn K. Pedersen

Sulfonamides are widely used antiobiotics and a threat to water resources and related ecosystems. While the direct discharge from untreated sewer or wastewater to surface water is a well-known pathway to the aquatic environment, only a limited number of studies have looked at the discharge and fate of sulfonamides from a contaminant plume to surface water so far.

In this study, we investigated a sulfonamide contaminant plume discharging to a stream in Denmark. The sulfonamides (originating from a former production facility), are transported through a multilayered sandy aquifer and discharge to a groundwater-fed stream located down gradient. Our objectives were to evaluate if a screening using fluorescence properties could be used to delineate the sulfonamide contaminant plume and support the contaminant mass discharge estimation (both by transect method and in-stream measurements).

Direct push technics in combination with a fluorescence screening allowed a relatively unexpensive coarse delineation of high concentrations areas (as opposed to laboratory analysis) down to 15 m.b.g.s. and ergo optimization of monitoring wells / screen locations in the transect. Chemical analyses were combined with slug test and hydraulic gradient estimates via continuous monitoring to quantify the sulfonamide flux and its temporal variations in a 2 km-long transect along the stream (24 monitoring wells with 3 - 6 screens).

The estimated sulfonamide mass discharge (transect based) is in good agreement with the mass discharge calculated from in-stream measurements, highlighting the relevance of the screening approach to select appropriate measurement point locations. Furthermore, the comparison between the flux in both stream and groundwater compartments shows that the degradation of sulfonamides seems relatively limited in the near-stream and hyporheic zone, with the exception of the sulfanilic acid. The results of this study will be used for the prioritization of remedial actions along the main discharge zones.

How to cite: Lemaire, G. G., Vinther, L., Thrane, B. B., Harrekilde, D., Ottosen, C. B., Hansen, J. L., Broholm, M. M., Bjerg, P. L., Dissing, L., and Pedersen, J. K.: Optimized flux estimation of a sulfonamide contaminant plume discharging to a stream using fluorescence screening , EGU General Assembly 2023, Vienna, Austria, 23–28 Apr 2023, EGU23-16407, https://doi.org/10.5194/egusphere-egu23-16407, 2023.

EGU23-72 | Orals | HS2.3.4

UV-driven fragmentation of plastics in an aquatic environment: laboratory studies 

Milica Velimirovic, Géraldine Dumont, Jef De Wit, Kristof Tirez, Stefan Voorspoels, and Frank Vanhaecke

Plastic is considered one of the most practical inventions of the 20th century, providing us with a range of very practical materials. However, due to mismanaged waste the plastic pollution has become persistent in aquatic environments. As the plastic products undergo environmental weathering once released in the aquatic environment, they degrade and are fragmented into a highly heterogeneous group of particles with different sizes (i.e., from centimeter over millimeter and micrometer to nanometer scale), shapes, densities, and chemical compositions. However, due to the lack of suitable analytical methodology, knowledge on degradation and/or fragmentation of plastics to nanoplastics (NPs, 1-1000nm), especially in the aquatic environments is still largely lacking.

In the framework of the MS4Plastics project, 15 different plastic materials, including a surgical face mask, different polymer pellets, rubber dust, and plastic powders as common examples of plastics expected to be present in the aquatic system were added to  Milli Q water and exposed to UV-light for 120 hours to better understand plastic degradation and/or fragmentation into NPs. Finally, for detection and size determination of NPs formed after accelerated UV-driven plastic fragmentation in water, dynamic light scattering was used. For a fraction of the samples, asymmetric flow field-flow fractionation (AF4) hyphenated to multi-angle light scattering (MALS) was used as a complementary analytical technique for characterization of NPs.

This project has received funding from the European Union’s Horizon 2020 research and innovation programme under the Marie Skłodowska-Curie grant agreement No 101023205.


How to cite: Velimirovic, M., Dumont, G., De Wit, J., Tirez, K., Voorspoels, S., and Vanhaecke, F.: UV-driven fragmentation of plastics in an aquatic environment: laboratory studies, EGU General Assembly 2023, Vienna, Austria, 23–28 Apr 2023, EGU23-72, https://doi.org/10.5194/egusphere-egu23-72, 2023.

EGU23-530 | ECS | Posters on site | HS2.3.4 | Highlight

Urban water systems as entry points for river plastic pollution 

Paolo Tasseron, Finn Begemann, Nonna Joosse, Martine van der Ploeg, Joppe van Driel, and Tim van Emmerik

Accumulation of plastic in aquatic environments negatively impacts ecosystems and human livelihood. Urban areas are assumed to the main source of plastic pollution in these environments, because of high anthropogenic activity. Yet, the drivers of plastic emissions, abundance and retention within these systems and subsequent transport to river systems is poorly understood. In this study, we demonstrate that urban water systems function as major contributors to river plastic pollution, and explore the potential driving factors contributing to the transport dynamics. Monthly visual counting of floating litter at six outlets of the Amsterdam water system results in an estimated 2.7 million items to enter the closely connected IJ river annually, ranking it among the most polluting systems measured in the Netherlands and Europe. Subsequent analyses of environmental drivers (including rainfall, sunlight, wind speed and tidal regimes) and litter flux showed no strong correlations (r = -0.19 - 0.16), implying additional investigation of potential drivers is required. High frequency observations at various locations within the urban water system and advanced monitoring using novel technologies could be explored to harmonize and automate monitoring. Once litter type and abundance are well-defined with a clear origin, communication of the results with local communities and stakeholders could help co-develop solutions and stimulate behavioural change geared to reduce plastic pollution in urban environments.

How to cite: Tasseron, P., Begemann, F., Joosse, N., van der Ploeg, M., van Driel, J., and van Emmerik, T.: Urban water systems as entry points for river plastic pollution, EGU General Assembly 2023, Vienna, Austria, 23–28 Apr 2023, EGU23-530, https://doi.org/10.5194/egusphere-egu23-530, 2023.

To date, we know little about depth-resolved distributional patterns of microplastic particles (<630 µm) of streambed sediments. Reports in literature about the abundance of considerable amounts of microplastic particles in fluvial sediments indicate that the transport follows naturally occurring flow vectors into streambed sediments. We hypothesize, that locally occurring hydraulic conditions at the water-sediment interface which are characteristic for various naturally occurring riverbed morphological structures might influence the evolution of microplastic depth profiles.

As a first step of identifying morphologic feature specific microplastic depth profiles, we have carried out a series of six freeze core sampling campaigns at the centre of the longitudinal axis of two riffles located in a fourth order gravelbed river (Ruwer) contributing to the Moselle River in Trier, West Germany. The setup allows for sampling a 50 cm long undisturbed sediment freeze-core. Using dry ice as coolant and a diamond saw blade we obtained ten undisturbed sediment cube samples (125 ccm) cut from the vertical axis up to 50 cm depth from each freeze-core. Over the range from 5000 – 25 μm five size fractions were analysed with regard to mineralic sediment and microplastic particle distribution. In all sediment cube samples microplastic particles and fibres could be detected without showing distinct distributional patterns related to its depth. Although the samples represent only a small surface area (25 sq. cm), we could qualify and quantify 81 microplastic items plus 606 suspected items mainly composed of transparent fibres using Raman microspectroscopy. Furthermore, we observe an exponentially increase in microplastic abundance with decreasing size fraction by three orders of magnitude. Dominant plastic types are polypropylene, polyethylene, nitrile and polyether terephthalate representing 85% of our findings. Our first results imply that in riffle heads downward directed transport within the sediment layer affects rather the shape and size of the plastic than the absolute abundance. As a next step, typical depth patterns of microplastic at the upstream and downstream end of streambed riffles have to be identified.

How to cite: Utecht, S. and Schuetz, T.: A depth-resolved snapshot of microplastic abundances in riffle heads in a gravelbed river, EGU General Assembly 2023, Vienna, Austria, 23–28 Apr 2023, EGU23-673, https://doi.org/10.5194/egusphere-egu23-673, 2023.

EGU23-1182 | ECS | Orals | HS2.3.4 | Highlight

Exploring Macroplastic Transport and Retention Dynamics in Country-Wide River Networks 

David Mennekes, Yvette Mellink, Tim van Emmerik, and Bernd Nowack

Over the last years macroplastic has been increasingly monitored not only in oceans but also in freshwaters. Despite the ongoing discussion of linking plastic masses in rivers with masses in oceans, multiple studies showed a highly complex transport of plastic debris from in land-based sources towards the oceans. However, current modeling and monitoring studies mostly focused on specific processes in single rivers or used highly simplified approaches. While such studies may be helpful to identify the fate mechanisms, they are less suitable to predict macroplastic flows in a large river network on country-scale. The aim of our work was therefore to develop a macroplastic fate model for a whole country which was parameterized based on measurements in specific rivers. For the macroplastic modelling we considered four different states: (1) in suspension, (2) temporally stored (3) long term burial or accumulated and (4) removal / cleaning from in suspension or temporally stored masses. The model considers a high spatial resolution with river sections of few meters to kilometers in length which are connected to the overall river network. As input data we used macroplastic emissions predicted by a material flow analysis model on the same spatial resolution. The model was applied before to predict macroplastic masses on a river level.

Using our model we found that the considered transport and fate processes for macroplastics must clearly differ from processes considered for microplastics. As possible influencing fate and transport factors we compared the influence of parameters such as sinuosity of rivers, the land use in close river distance, the discharge or impact of weirs with macroplastic removals. Each parameter was identified by other studies as potential factor for macroplastic retention. Here, we explore their influence on the output on a country-scale. We conclude that based on our modelling a high retention of macroplastics must occur within the system to match monitoring data with predicted macroplastic releases. While we assume that high amounts of macroplastics will be temporally stored until the next flooding event, it remains challenging to predict the long term in-situ accumulation. As a first step, we simulated different parameter settings to mimic "normal" discharge conditions in comparison with flooding events.

Overall our results bring existing concepts and understanding in a wider context by coupling emission modelling with fate modeling and monitoring results from literature. Moreover, we are able to predict macroplastic masses in rivers and temporally stored in river banks and compare predicted values with first available measurements. Especially, predicting microplastic masses is of high importance for policy makers to manage plastic pollutions along riversides.

How to cite: Mennekes, D., Mellink, Y., van Emmerik, T., and Nowack, B.: Exploring Macroplastic Transport and Retention Dynamics in Country-Wide River Networks, EGU General Assembly 2023, Vienna, Austria, 23–28 Apr 2023, EGU23-1182, https://doi.org/10.5194/egusphere-egu23-1182, 2023.

EGU23-1300 | Posters on site | HS2.3.4

Classifying polymers with mid-IR spectra and machine learning: From monitoring to detection 

Xin Tian, Patrick Bäuerlein, and Frederic Beén

Monitoring and identifying environmental microplastics is of great importance for the scientific world, environmental agencies, and water authorities, to estimate the environmental impact and increase efforts to decrease emissions. As one of the infrared spectroscopy techniques, Laser Directed Infrared (LDIR) imaging can observe various microplastics, in terms of spectroscopical signals. Such signals are useful for follow-up analyses, particularly, identification by machine learning (ML) algorithms. Based on medium or large-sized datasets, past studies applied a variety of ML models to detect microplastics from their LDIR spectra. To tackle it, we first propose a practical data augmentation technique to generate synthetic samples when only a few samples are available. Then a comprehensive comparison of multiple models, including both machine learning and deep learning models, is presented. Our results show that the ensemble ML model, compared to neural network models, can take the least training time to achieve the best performance, i.e., a classification accuracy of 99.5%, even with a small dataset (210 samples collected from aquatic systems). This study provides a generic framework for monitoring and detecting microplastics by combining LDIR and ML.

How to cite: Tian, X., Bäuerlein, P., and Beén, F.: Classifying polymers with mid-IR spectra and machine learning: From monitoring to detection, EGU General Assembly 2023, Vienna, Austria, 23–28 Apr 2023, EGU23-1300, https://doi.org/10.5194/egusphere-egu23-1300, 2023.

EGU23-2987 | ECS | Orals | HS2.3.4

Microplastic emission characteristics of stormwater runoff in an urban area: Intra-event variability and influencing factors 

Youna Cho, Won Joon Shim, Sung Yong Ha, Gi Myung Han, Mi Jang, and Sang Hee Hong

Stormwater runoff is considered a major pathway for land-based microplastic transportation to aquatic environments. By applying time-weighted stormwater sampling at stormwater outlets from industrial and residential catchments, we investigated the emission characteristics and loads (number- and mass-based) of microplastics to aquatic environments through urban stormwater runoff during rainfall events. Microplastics were detected in stormwater runoff from industrial and residential catchments in the concentration range of 68-568 n/L and 54-639 n/L, respectively. Polypropylene and polyethylene were found as major polymers accounting for around 60% of total microplastics. The fragment was the dominant shape of microplastics, and the most common size class were 20-100 μm or 100-200 μm. The microplastic load emitted from industrial and residential catchments were estimated to be 1.54 - 46.1 x 10⁸ and 0.63 - 28.5 x 10⁸ particles, respectively. The discharge characteristics of microplastics inter– and intra–event were affected by the land-use pattern and rainfall characteristics. The concentration of microplastics did not significantly differ between industrial and residential catchments, but the composition of polymer types reflected the land-use pattern. The microplastics in stormwater were more concentrated when the number of antecedent dry days (ADDs) was higher; the concentration of microplastics was generally peaked in the early stage of runoff and varied according to rainfall intensity during a rainfall event. The contamination level and load of microplastics were heavily affected by the total rainfall depth. Most microplastics were transported in the early stage of runoff (19–37% of total runoff time), but the proportion of larger and heavier particles increased in the later period of runoff. The microplastic emission via stormwater runoff was significantly higher than that through the discharge of wastewater treatment plant effluent in the same area, implying that stormwater runoff is the dominant pathway for transporting microplastics to aquatic environments.


How to cite: Cho, Y., Shim, W. J., Ha, S. Y., Han, G. M., Jang, M., and Hong, S. H.: Microplastic emission characteristics of stormwater runoff in an urban area: Intra-event variability and influencing factors, EGU General Assembly 2023, Vienna, Austria, 23–28 Apr 2023, EGU23-2987, https://doi.org/10.5194/egusphere-egu23-2987, 2023.

EGU23-6474 | Posters on site | HS2.3.4

Monitoring macroplastic waste sources along the Umgeni River using unmanned aerial vehicles 

Thomas Mani, Tadiwanashe Gutsa, Cristina Trois, Robin de Vries, Asanda Qadi, and Muthukrishnavelaisamy Kumarasamy

Rivers are major contributors of plastic waste entering the oceans. The Umgeni River in Kwazulu-Natal, South Africa, runs through the densely populated city of Durban, with 3.5 million inhabitants and is estimated to emit 400 tons of plastic waste annually into the Indian Ocean. The banks of the Umgeni River are lined with plastic waste accumulations, derived from accidental, intentional, and natural accumulation. This study uses high-resolution aerial imagery and several hydrometeorological measuring sensors in the catchment to (1) locate, monitor, and quantify macroplastic waste hotspots along the Umgeni River; and (2) investigate the influence of hydrometeorological factors driving the spatio-temporal evolution of the hotspots. This novel attempt to map and monitor plastic waste sources along the Umgeni River could assist waste managers and communities with a framework for developing targeted waste removal practices and mitigation measures.

How to cite: Mani, T., Gutsa, T., Trois, C., de Vries, R., Qadi, A., and Kumarasamy, M.: Monitoring macroplastic waste sources along the Umgeni River using unmanned aerial vehicles, EGU General Assembly 2023, Vienna, Austria, 23–28 Apr 2023, EGU23-6474, https://doi.org/10.5194/egusphere-egu23-6474, 2023.

EGU23-6498 | ECS | Posters on site | HS2.3.4

Testing the use of sodium polytungstate for an efficient extraction of microplastic particles from river sediments 

Francesca Uguagliati, Massimiliano Ghinassi, and Massimiliano Zattin

Rivers are the primary pathways for microplastic (MP) particles from terrestrial sources to the sea, but they can also be temporary reservoirs of MPs, that can be easily stored in alluvial sediments. Knowing the MPs content in sediments is critical for i) understanding where and how they accumulate over time, ii) assessing their toxic effects, and iii) developing mass balance models based on their fate and fluxes. Given the rapid growth of the research field and the lack of standardized methods, extraction strategies for MP particles from sediments have become inconsistent, and new techniques are constantly being developed. Several studies highlight that density separation using high-density concentrated saline solutions is one of the most reliable and efficient separation methods. In this study, we tested the efficiency of sodium polytungstate (ρ = 3.1 g · cm-3), diluted with distilled water to a density of 1.6 g · cm-3, as a density separation agent. Sodium polytungstate has an intermediate density between that of sediments and plastic and has also been used successfully for the gravity separation of minerals and rocks. Furthermore, it is non-toxic, it is stable in the pH range of 2-14 and can be easily recovered and reused. In this study, artificial sediment samples were created by adding 50 MP items into 25 grams of plastic-free sand. MPs-free sediments were sampled from Pleistocene alluvial deposits of the Upper Valdarno Basin (Italy) after removing the surficial layer to avoid contamination. Sediments were divided into three different particle size ranges (i.e., 250-63 μm, <63 μm, <250 μm). Different shapes of MPs were used in the experiments: i) fibres obtained by cutting 500 μm long segments of a nylon drawstring, ii) fragments created by cutting PVC pipes, and iii) PET glitters used as films. A total of 45 experiments were performed. Before applying the procedure for density separation, samples were prepared using Wet Peroxide Oxidation (WPO) to remove the organic matter. Successively, a sodium polytungstate saline solution was used for the extraction technique and the suspended solids were collected and transferred to filters. The MP particles were counted using a stereomicroscope. Results highlight the very high efficiency of the system, although some variance is present and related to the different shapes of MPs and the sediment particle size.

How to cite: Uguagliati, F., Ghinassi, M., and Zattin, M.: Testing the use of sodium polytungstate for an efficient extraction of microplastic particles from river sediments, EGU General Assembly 2023, Vienna, Austria, 23–28 Apr 2023, EGU23-6498, https://doi.org/10.5194/egusphere-egu23-6498, 2023.

EGU23-6634 | ECS | Orals | HS2.3.4

Linking macroplastic deposition to riverbank characteristics 

Rahel Hauk, Tim H.M. van Emmerik, Martine van der Ploeg, Marijke Boonstra, Winnie de Winter, and Adriaan J. Teuling

Rivers transport, and store a large share of the global plastic pollution. Riverbanks are one of the river compartments where macroplastic litter is deposited and retained. Different factors influence macroplastic deposition on riverbanks. Retention related factors such as riverbank features, and supply related factors, such as hydrometeorology or land-use. Riverbank macrolitter along the Dutch Meuse has been quantified, characterized, and removed biannually since 2017. At each monitored riverbank, macroplastic and other litter items were collected along a 100 m section and classified in over 100 specific litter categories. We assume that after each monitoring round all litter is removed, and that the litter sampled in the following round has accumulated in the time between rounds. This monitoring dataset is analyzed to identify riverbanks with plastic accumulation rates continuously below or above average, and the specific characteristics of these identified riverbanks. Furthermore, correlations are investigated between macroplastic deposition and individual riverbank features and river morphology, such as types of riparian vegetation, or curvature of the river. These correlations are tested for the total amount of plastic litter, but also categories grouped by plastic characteristics such as potential source, density, size, or flexibility. This is done based on the hypothesis that plastic litter items with different characteristics are associated to different processes of plastic emission and deposition. For example, items with low or high density, or different levels of flexibility. Items with low and high densities are transported differently, because their density is lower or higher than the density of water. Items with a high level of flexibility, such as soft plastic foils, have a higher potential for entanglement in vegetation, and a lower potential for remobilization, compared to items with a low level of flexibility. The aim of this study is to identify riverbank characteristics that explain high plastic accumulation rates.

How to cite: Hauk, R., van Emmerik, T. H. M., van der Ploeg, M., Boonstra, M., de Winter, W., and Teuling, A. J.: Linking macroplastic deposition to riverbank characteristics, EGU General Assembly 2023, Vienna, Austria, 23–28 Apr 2023, EGU23-6634, https://doi.org/10.5194/egusphere-egu23-6634, 2023.

EGU23-6918 | ECS | Posters on site | HS2.3.4 | Highlight

Reducing uncertainty of floating plastic transport estimates in rivers using the visual counting method 

Yvette Mellink, Simone van Langen, Paul Vriend, Nadieh Kamp, Anne de Weme, and Tim van Emmerik

Macroplastics have been found in many compartments of freshwater systems amongst which floating at the water surface. To quantify the floating macroplastic flux in rivers, the visual counting method was developed. This method is based on visual observations from bridges, and has already been applied in various river systems across the world, including the Rhine-Meuse delta. A two-year dataset of monthly field measurements on ten bridges across the Rhine, Meuse, and IJssel rivers has been collected. This dataset revealed the high variability of the floating macroplastic flux in both time and space. Except for extreme flooding events, the fluctuations are not always simply related to the discharge or season. This finding raises the questions of how to assure representative field observations. Representative field observations are important, as they are typically inter- and extrapolated in time and space. If the timing or location of the measurement is not representative of the ‘normal’ condition, then the extrapolation of that measurement will be associated with a large uncertainty range, resulting in over- or underestimations of the total floating macroplastic flux in the river. As field observations play a major role in calibrating and validating river plastic transport and emission models, it is essential to minimize the uncertainty of field-based floating plastic transport estimates. To optimize the visual counting method and explore its limits, we executed three experiments. The first experiment demonstrated that the temporal variability at bridge level is high, but can be attenuated by repeated measurements. The second experiment showed how many observation points on the bridge are sufficient to account for the spatial variability of the macroplastic flux across the river cross profile. The third experiment determined that the size limit of the visible macroplastics is 1 cm2 on bridges that are up to 5 meter above water level and 4 cm2 for bridges up to 15 meter above water level. The findings of these experiments endorse the effectiveness of the visual counting method and allow for a substantiated implementation of this method in floating macroplastic monitoring campaigns across river networks worldwide.

How to cite: Mellink, Y., van Langen, S., Vriend, P., Kamp, N., de Weme, A., and van Emmerik, T.: Reducing uncertainty of floating plastic transport estimates in rivers using the visual counting method, EGU General Assembly 2023, Vienna, Austria, 23–28 Apr 2023, EGU23-6918, https://doi.org/10.5194/egusphere-egu23-6918, 2023.

EGU23-7893 | Orals | HS2.3.4

Macroplastic concentrations in the water column of rivers increase with higher discharge 

Paul Vriend, Margriet Schoor, Mandy Rus, Stephanie B. Oswald, and Frank P. L. Collas

Riverine macroplastic pollution (>0.5 cm) negatively impacts ecosystems and human livelihoods. Monitoring data are crucial for understanding this issue and designing effective interventions. Macroplastic pollution floating on the river surface and plastic deposited on riverbanks are studied relatively often. Data on riverine plastics in the water column remain scarce. In this study we utilize trawl nets at different depths to sample plastic pollution in the water column at the entry point of the river Rhine to the Netherlands. We show that plastic concentrations in the water column increased during higher discharge. The combination of higher macroplastic concentrations and higher discharge leads to considerably higher plastic transport during high discharge events. Moreover, the results indicate that the vertical distribution of macroplastic pollution changes during different flow conditions. Significantly higher concentrations of macroplastic can be seen near the riverbed during low discharge conditions, while no significant differences in concentration are observed between the bottom, middle and surface samples during high discharge conditions. These findings provide first insights into the key role of hydrology in explaining macroplastic transport in the water column. These insights can be used to improve future monitoring and intervention strategies. 

How to cite: Vriend, P., Schoor, M., Rus, M., Oswald, S. B., and Collas, F. P. L.: Macroplastic concentrations in the water column of rivers increase with higher discharge, EGU General Assembly 2023, Vienna, Austria, 23–28 Apr 2023, EGU23-7893, https://doi.org/10.5194/egusphere-egu23-7893, 2023.

EGU23-8216 | Posters on site | HS2.3.4

Plastic routing through the Odaw catchment 

Rose Boahemaa Pinto, Linda Bogerd, Tim van Emmerik, Martine van der Ploeg, Kwame Anhwere Duah, and Remko Uijlenhoet

River catchments are important to consider when investigating the fate of plastics once introduced into the environment. However, plastic transport at the river catchment scale is rarely quantified. In this study, we present a catchment-scale field assessment of macroplastic litter in the Odaw (270 km2). The catchment was sub-divided into non-urban riverine, urban riverine and urban tidal zones based on the urbanisation level and riverine transport across the catchment. The riverine (river and riverbank) and terrestrial environments at ten locations along the catchment were monitored on three days in December, 2021. Floating litter items in the river were monitored by visual counting. At the riverbank and terrestrial environments, litter items were sampled in a designated area (5 x 2 m2) and categorised according to the River-OSPAR list (Schone-Rivieren, 2018). Results showed a high plastic flux (1125 items/h) in the urban riverine zone, which was higher by a factor of 16 and 2 to the plastic flux at the non-urban riverine and urban tidal zones, respectively. Terrestrial and riverbank plastic density was highest closest to the river mouth (urban tidal). The factor increase between the most upstream (non-urban riverine) and downstream (urban tidal) was larger for terrestrial than for riverbank. This shows the influence of urbanisation on the generation of mismanaged plastics in the catchment. Top three plastic polymer types observed in the catchment were PO soft, EPS and Multilayer. However, at each zone, the top three plastic polymer types varied with PO Soft as the most dominant at each zone. The highest abundance of PO soft, EPS and multilayer was found at the urban riverine (56%), urban tidal (31%) and non-urban riverine (24%) zones respectively. Our findings provide information on the spatial variation of plastic transport in the Odaw catchment and therefore can help create better strategies to manage the plastic pollution problem in this catchment. Future work will further explore the potential sources and temporal sink zones in the catchment.

Reference

Schone-Rivieren (2018). Handleiding voor monitoring, pp. 1–3.

How to cite: Pinto, R. B., Bogerd, L., van Emmerik, T., van der Ploeg, M., Anhwere Duah, K., and Uijlenhoet, R.: Plastic routing through the Odaw catchment, EGU General Assembly 2023, Vienna, Austria, 23–28 Apr 2023, EGU23-8216, https://doi.org/10.5194/egusphere-egu23-8216, 2023.

Standardized sampling methods and protocols are essential to facilitate the comparison of studies on plastic pollution and to advance knowledge of this environmental issue. Several protocols for sampling microplastics in oceanic and coastal waters have been developed, compared and even harmonized for this purpose. However, these protocols may be not adapted for the study of estuarine environments, characterized by strong vertical, horizontal and temporal gradients.  In this work, microplastic sampling methods and strategies are discussed in relation to estuarine hydrodynamic processes. The analogies between the dynamical behaviour of microplastics and sediments make it possible to draw out recommendations for sampling microplastics based on several decades of research in estuarine hydro-sedimentary dynamics. In particular, we will discuss when, where, and how to sample microplastics in order to capture the most representative picture of microplastic pollution in these highly dynamic systems subject to strong anthropogenic pressures.  

How to cite: Defontaine, S. and Jalon-Rojas, I.: Sampling microplastics in estuarine environments: lessons learned from suspended sediment dynamics and perspectives., EGU General Assembly 2023, Vienna, Austria, 23–28 Apr 2023, EGU23-8819, https://doi.org/10.5194/egusphere-egu23-8819, 2023.

EGU23-10261 | Orals | HS2.3.4 | Highlight

Understanding the overland transport of microplastics from agricultural soils to freshwater systems 

John O'Sullivan, Michael Bruen, Linda Heerey, Annemarie Mahon, Heather Lally, Sinead Murphy, James O'Connor, Ian O'Connor, and Roisin Nash

The increasing recognition that significant amounts of plastic are disposed of and accumulating in agricultural soils has highlighted the need for increased research in the study area.  Once on soils, MP may be transported through vertical migration and/ or overland surface runoff, with processes governing the overland runoff pathway to freshwater systems being poorly understand.   Here we present a study of MP transport from soils through overland flow processes.  The research utilised a medium-scale, laboratory based, rainfall simulator that facilitated experimental testing of multiple variables that influence MP mobilisation and export from field settings under controlled conditions.  A total of 15 experiments were conducted across four separate test series in which differences in MP characteristics (including particle shape, size and density), rainfall regime (including intensity and duration), catchment topography (slope), time lag between MP seeding in the soil surface and rainfall event, together with the catchment condition in the progression of a growing cycle (bare soil to grassland), were tested to capture an extensive and realistic set of MP and environmental test conditions.

Each test followed an identical procedure to ensure consistency across all test series. For each test, a soil sample (particle size distribution of 21.1%, 40.9% and 37.8% clays, silts and sands, respectively) was prepared in a free draining test box (measuring 3.3 x 1.2 x 0.1 m (length x width x depth)) and compacted to achieve a soil bulk density of 1.36 ± 0.2 g/cm3, a value typical for soils in standard agricultural settings.  MP were then seeded in the soil surface with the soil sample being exposed to the test rainfall regime. MP in runoff samples, collected every ten-minutes from a single point drainage system mounted on the test box, were filtered and dried, microscopically and manually separated into their three polymer groups (PP, HDPE and PVC). Mean size for each polymer was recorded as was the overall MP mass in each sample.

Among all parameters examined in this study, rainfall intensity was observed to be one of the most influential in exporting MP from the test catchments.  However, a statically significant difference was not observed when comparing MP export and the timing of a rainfall event following MP seeding.  Increasing catchment slope was also shown to be driver of MP transport in overland runoff with values being higher for bare (simulating recently tilled conditions) soils as opposed to soils with grass swards. Smaller MP particles were shown to be more mobile across all experiments, with larger particles only increasing in mobility with an increase in rainfall intensity. Average MP size in collected samples for low intensity rainfall events (8.4 mm/h) was 0.89 mm, 0.63 mm and 1.67 mm for PP, HDPE, and PVC respectively, increasing to 1.15 mm, 0.89 mm and 1.74 mm for the same polymers during the high intensity event (18 mm/h). Increases in MP mobility were shown to be shape specific, with the strongest correlations noted for PP and HDPE, while no significant correlation was found for PVC particles.

How to cite: O'Sullivan, J., Bruen, M., Heerey, L., Mahon, A., Lally, H., Murphy, S., O'Connor, J., O'Connor, I., and Nash, R.: Understanding the overland transport of microplastics from agricultural soils to freshwater systems, EGU General Assembly 2023, Vienna, Austria, 23–28 Apr 2023, EGU23-10261, https://doi.org/10.5194/egusphere-egu23-10261, 2023.

EGU23-10476 | ECS | Posters on site | HS2.3.4

A Deep Learning Method for Detecting Floating Garbage in Urban Rivers 

Maiyatat Nunkhaw and Hitoshi Miyamoto

In recent years, plastic pollution in the ocean has become a global environmental problem, deeply affecting the ecosystem as well. In fact, 80 percent of ocean plastic was reported to come from terrestrial river basins, therefore it would be extremely important to recognize how much plastic waste runoff from rivers around the world was. In response to this global environmental problem, an image analysis method for monitoring river waste transport has recently been started to propose. However, this image analysis indicated a difficulty to fully detect plastic waste in various types of waters because it needed to use a color difference in each water to classify the type of waste.

This paper tried to develop an automated detection system based on a modified convolutional neural network (CNN) for detecting and counting floating river waste. The CNN used in this research was You Only Look Once (YOLO) architecture with a fine-tuning for adjusting it to the waste detection. The proposed model has further been improved its accuracy through the enlarged image processing. As for the waste counting, an object tracking method, e.g., deep SORT, could be used with the proposed model in video frames of flowing water.  

The results showed that the proposed YOLO model with enlarged image processing achieved the evaluation values of mean average precision mAP (%) of can, carton, plastic bottle, foam, glass, paper, and plastic were 95, 89, 94, 97, 92, 71, and 81, respectively. Moreover, the proposed mode with deep SORT has achieved the F1-score (%) of 80, 80, 75, 85, 100, 100, and 50, in each waste type. Consequently, the proposed model could be feasible for identifying and counting flowing river waste accurately. The future research work should improve the counting accuracy and further develop an automated model implementation method.

How to cite: Nunkhaw, M. and Miyamoto, H.: A Deep Learning Method for Detecting Floating Garbage in Urban Rivers, EGU General Assembly 2023, Vienna, Austria, 23–28 Apr 2023, EGU23-10476, https://doi.org/10.5194/egusphere-egu23-10476, 2023.

Microbeads in personal care and cosmetic products (PCCPs) such as facial scrubs and face washes are added to provide mechanical exfoliation while washing one’s face. Such abrasive scrub cleansers have gained global acceptance from consumers, some of these microbeads are made up of plastics. Plastic beads are used because of their round and smooth surfaces, which impart painless exfoliation. These microbeads in turn act as a primary source of microplastics (MP) in wastewater systems. Ten facewashes containing MP beads that are popularly available in the Indian market were analysed to detect the presence of microplastics. MP beads were found in 4 out of 10 facial scrubs and ranged in size from 220 to 600 µm. Based on the Fourier Transformed Infrared spectrophotometer (FTIR) analysis, the MP beads were made of cellophane, polyethylene (PE), or polypropylene (PP). India generates approximately 72,368 MLD of sewage of which about 60% is untreated. In India, it was estimated that 4.7 x 10¹⁰ microbeads are released into the environment through untreated sewage every year, which amounts to 3.8 tonnes of microbeads being released into the environment annually. The study indicates that massive annual release of MPs in the form of microbeads into the water bodies through facial scrubs and other similar personal care products is inevitable. These microplastic beads are small and can easily escape wastewater treatment systems. Hence, their presence in aquatic ecosystems can lead to the adsorption of contaminants and pollutants like heavy metals, synthetic organic compounds, and other pathogens. The microbeads along with the contaminants can potentially bio-accumulate and bio-magnify within different trophic levels, thus increasing the toxicity at each level.

How to cite: Joseph, A. and Goel, S.: Microbead nuisance: Estimation of microplastic release into water bodies through personal care and cosmetic products, EGU General Assembly 2023, Vienna, Austria, 23–28 Apr 2023, EGU23-10819, https://doi.org/10.5194/egusphere-egu23-10819, 2023.

EGU23-11175 | Posters on site | HS2.3.4

Field experiment on transport and deposition of plastic bottles along mountain river 

Maciej Liro, Paweł Mikuś, Zielonka Anna, and Mateusz Kieniewicz

Information on the transport and deposition of riverine macroplastic is crucial for selecting proper locations for river cleaning actions and for trapping infrastructure installation. Obtaining such information for mountain rivers is of particular importance because their specific characteristics make them particularly prone to illegal dumping, plastic litter input from slope to the river channel, and an increased rate of secondary microplastic production in the river channel (1).

To shed some light on the patterns of macroplastic transport and deposition along mountain rivers we have performed a field experiment utilizing tracked plastic (PET) bottles injected to the channel of the mountainous Skawa River in the Polish Carpathians. After 50-57 days of low-flow conditions, we documented transport distances (n=64) which were non-normally distributed and reached from 0.37 km to 16.27 km (median=1.73 km, quartile range=5.29 km). Most of the tracked bottles were deposited on woody debris (71.9%, n=46) (Photo 1) at elevations ranging from 0 to 1.2 m (median=0.4 m, quartile range=0.45 m) above the low-flow water level. Surprisingly, the straight and narrow channelized reach of the studied river trapped 15.3 % of the plastic bottles transported through it, while the highly sinuous, wide unregulated one only 8.7 %, which is probably related to the more frequent contact of woody debris (present in both reaches) with the flowing water, occurring during low-flow conditions within the narrower, channelized reach.

Our initial results suggest that places of woody debris deposition along rivers can be a good location for river cleaning actions. 

Photo 1. The deposition of plastic bottles on wood jam
(the Skawa River, S Poland) (photo by M. Liro)


References

(1) Liro, M., van Emmerik, T.H., Zielonka, A., Gallitelli, L., Mihai, F.C., 2023. The unknown fate of macroplastic in mountain river. Sci. Total Environ. 865, 161224.

How to cite: Liro, M., Mikuś, P., Anna, Z., and Kieniewicz, M.: Field experiment on transport and deposition of plastic bottles along mountain river, EGU General Assembly 2023, Vienna, Austria, 23–28 Apr 2023, EGU23-11175, https://doi.org/10.5194/egusphere-egu23-11175, 2023.

EGU23-12092 | ECS | Orals | HS2.3.4

An open source dataset for Deep Learning-based visual detection of floating macroplastic litter 

André Vallendar, Tianlong Jia, Rinze de Vries, Zoran Kapelan, and Riccardo Taormina

Plastic pollution of water bodies is a major environmental issue, as it can have harmful effects on marine life, riverine ecosystems and society as a whole. To mitigate the impacts of plastic pollution, accurate detection and quantification of macroplastic litter (plastic items > 5 mm) is of particular importance. In recent years, researchers and engineers have developed Deep Learning methods showing promising performances for detecting riverine macroplastic litter. However, there are several outstanding issues hindering the advancement of the field, including the lack of available data sources for training such models.

Here, we present a new open source dataset for the detection of floating macroplastic litter. We generated the dataset from controlled experiments carried out in a small drainage canal on the TU Delft campus. The dataset features 626 different litter items including plastic bottles, bags and other plastic objects, as well as metal tins and paper litter. These items include household waste as well as litter recovered from canals in the Netherlands. We captured images with a resolution of 1080p and a linear field of view using two different action cameras and a phone, mounted on a bridge. The dataset consists of 10000 images, taken from two different heights (2.7 and 4.0 meters), two different inclinations (0 and 45 degrees from the horizontal), and two different weather conditions (sunny and cloudy sky).

In this presentation, we provide information on the dataset and the experiments carried out to generate it. We also discuss the results of benchmark Deep Learning models for multi-class classification trained on the dataset, and their out-of-sample generalization ability to other case studies. While labels are currently available only for image classification, we aim to release annotations for object detection and image segmentation tasks in the future.

How to cite: Vallendar, A., Jia, T., de Vries, R., Kapelan, Z., and Taormina, R.: An open source dataset for Deep Learning-based visual detection of floating macroplastic litter, EGU General Assembly 2023, Vienna, Austria, 23–28 Apr 2023, EGU23-12092, https://doi.org/10.5194/egusphere-egu23-12092, 2023.

EGU23-12701 | Posters on site | HS2.3.4 | Highlight

Microplastics retention in different types of Mangrove forest in Xuan Thuy National Park, Vietnam 

Uwe Schneidewind, Sophie Comer-Warner, Lee Haverson, Anna Kukkola, Holly Nel, and Stefan Krause

Mangrove forests provide important ecosystem services with regards to carbon storage and nutrient removal in coastal areas. They have also been found to retain emerging contaminants such as microplastics. However, in many parts of the world, mangrove forests are severely affected by deforestation and transformation into areas of intense agriculture/aquaculture. To restore their original ecosystem functions, mangrove forests are increasingly being targeted in small-scale conservation and restoration efforts, which often results in the coexistence of a variety of mangrove forest types with respect to tree age and vegetation density. This might have a severe impact on their retention capacity of fine particulate matter including microplastics (MP).

Here, we study Mangrove sediment samples from Xuan Thuy National Park, Vietnam located in the Red River Delta with respect to microplastics. Sediment samples were taken from four types of landcover, i.e., (i) completely deforested area, (ii) 5–7-year-old naturally regenerated forest, (iii) eight-year-old replanted forest, and (iv) 15 year-old naturally regenerated forest. Surface samples and 50 cm-long cores were collected using mini augers and dried at 50°C. Subsamples were used to extract microplastics by means of density separation with ZnCl2 and digestion with Fenton reagent. Extracted MP were stained with Nile Red for florescence microscopy to determine MP concentration and shape. Additionally, microFTIR was used to identify the respective polymer type.

Microplastics concentrations (>64 µm) range from 64 to 2141 particles/kg dry weight (n=568) with the vast majority being fragments. Higher concentrations were found in the naturally regrown forests (ii and iv) than in deforested or reforested areas. Although no depth-dependent trends were visible, high concentration spikes in 30 cm depth at sites (ii) and (iii) have been identified. Future analyses will relate particle concentration to sediment grain size distribution and carbon/nutrient data from the same locations.

How to cite: Schneidewind, U., Comer-Warner, S., Haverson, L., Kukkola, A., Nel, H., and Krause, S.: Microplastics retention in different types of Mangrove forest in Xuan Thuy National Park, Vietnam, EGU General Assembly 2023, Vienna, Austria, 23–28 Apr 2023, EGU23-12701, https://doi.org/10.5194/egusphere-egu23-12701, 2023.

EGU23-12840 | ECS | Orals | HS2.3.4 | Highlight

Lost in the river: the plastic vegetation index for detecting plastics within vegetation 

Luca Gallitelli, Maurizio Cutini, and Massimiliano Scalici

Plastics are a well-known problem that accumulates in the environment causing detrimental effects on ecosystems. Macroplastics in rivers are only recently studied, with most studies focusing on the transport of plastics to the sea. However, most plastics are retained in the fluvial system. To date, only abiotic factors have been considered in the transport process, but recently vegetation has proven to block plastics from having a pivotal role in influencing plastic riverine drift. Given that little is known on the biotic component affecting riverine plastic transport, we aimed at investigating further on (i) the three-dimensionality structure of riparian vegetation in trapping plastics along watercourses and (ii) to develop a vegetation index to describe vegetation structure and to understand the plastic entrapment service provided by plants. To do so, we sampled field data from central Italy rivers along the three riverine zones considering riparian vegetation in relation to river width. Data on plastics within vegetation has been recollected. Also, data on plant structures (i.e. the number of individuals and the number and height of branches per species) was sampled and then used to develop the 3D vegetation index (i.e. 3D Vegetation Index, 3DVI) considering the tridimensionality and diversity index. As result, plastics occurring in vegetation were significantly related to vegetation structure with the 3DVI correlated with the number of plastics (R2 = 0.36, p = 0.0086, Y = 0.007157*X + 2.562). Furthermore, the most dense and diverse community block more plastics. Considering different vegetation heights in all the rivers, there is a significant linear regression between the 3DVI in vegetation branches (0.5<r<2.0 m, and r>2.0 m, respectively R2 = 0.38, p = 0.007, Y = 0.007662*X + 2.711 and R2 = 0.45, p = 0.0023, Y = 0.2522*X + 2.696). With regards to the three riverine zones, only in the lower river zone there was a significant regression between 3DVI and plastics in vegetation (R2 = 0.94, p = 0.001, Y = 108.0*X-143.7). Biotic factors (i.e. vegetation structure) most correlate to the occurrence of plastics in vegetation driving the plastic entrapment process more than the environmental abiotic factors (i.e. hydrology). Overall, we developed for the first time a vegetation index to describe the structure and diversity of the plant community related to the plastic entrapment service. The higher the 3DVI value, the more complex the vegetation (i.e. characterised by a lot of individuals and branches). We emphasized that plant structures are important variables for understanding the entrapment efficiency of macrolitter, highlighting that the complexity of vegetation structure is key for the trapping net effect. As vegetation retain plastics efficiently in all the zones providing us the ecosystem service of trapping macrolitter, the 3DVI could be applied for future solution to plastic pollution – also detecting plastic hotspot areas for mitigation and clean-up activities.

How to cite: Gallitelli, L., Cutini, M., and Scalici, M.: Lost in the river: the plastic vegetation index for detecting plastics within vegetation, EGU General Assembly 2023, Vienna, Austria, 23–28 Apr 2023, EGU23-12840, https://doi.org/10.5194/egusphere-egu23-12840, 2023.

EGU23-12960 | ECS | Orals | HS2.3.4

Visualization of Buoyant MP motion in response to different flow velocities and bed types 

Marziye Molazadeh, Guilherme Calabro, Fan Liu, Rachid Dris, Cedric Chaumont, Lorenzo Rovelli, Andreas Lorke, Bruno J. Lemaire, Johnny Gasperi, Bruno Tassin, and Jes Vollersten

The widespread use of plastic has made it a widely dispersed product with a high impact on the environment. Through fragmentation of larger pieces or direct discharge, microplastic particles (MP) are present in almost every aquatic ecosystem. MPs based on polymers of lower density than water (ρ < 1.0 g cm−3), such as polyethylene (PE), are among the MPs most commonly found in the sediments of freshwater systems which is counterintuitive. Different mechanisms and theories may explain the dynamics of buoyant positive MP motion and their deposition in water systems. Thus, examining the behavior of MP particles carried in suspension is particularly relevant to assess this contaminant fate. The experimental approach is an important way to help to fill the knowledge gap exist on the transport of these particles in natural flows. In this study, Particle Image Velocimetry (PIV) has been deployed to investigate how turbulent water regime contribute affect the dynamics of buoyant particles and if it drives them towards the bed . Different sets of experiments with different flow velocities and non-cohesive bed types were conducted in a 200 cm long, 30 cm wide, 22 cm deep, rectangular, re-circulating, tilting flume. The PIV measurements were done in the centerline of the flume. A camera framed and recorded images in the laser sheet at 15 Hz to follow fast turbulence fluctuations. Pristine PE particles of around 47µm were used. A particle tracking technique was used to record, to follow the trajectory and to calculate de velocity of the particles. The analyzed images clearly show that turbulence homogenizes the particles in the water column. Also, a substantial quantities of PE particles were subject to downward vertical transport which in its turn increase the chance of particles coming in contact with the bed. Turbulent energy is an important driver in the dynamics of buoyant positive particles, and under more realistic environmental conditions, as biofilm presence on the sediment, would enlighten the trapping of these particles by the sediment.

How to cite: Molazadeh, M., Calabro, G., Liu, F., Dris, R., Chaumont, C., Rovelli, L., Lorke, A., Lemaire, B. J., Gasperi, J., Tassin, B., and Vollersten, J.: Visualization of Buoyant MP motion in response to different flow velocities and bed types, EGU General Assembly 2023, Vienna, Austria, 23–28 Apr 2023, EGU23-12960, https://doi.org/10.5194/egusphere-egu23-12960, 2023.

EGU23-13061 * | ECS | Posters on site | HS2.3.4 | Highlight

Tidal plastic recycling: net river plastic transport limited by tidal dynamics 

Louise Schreyers, Tim van Emmerik, Khiet Bui, Khoa Van Le Thi, Bart Vermeulen, Hong-Q. Nguyen, and Martine van der Ploeg

The processes controlling the transport in tidal rivers and estuaries, the interface between fluvial and marine systems, remain largely unresolved. For this reason, current estimates of riverine plastic pollution and export into the ocean remain highly uncertain. Hydrodynamics in tidal rivers and estuaries are influenced by tides and freshwater discharge. As a consequence, flow velocity direction and magnitude can change diurnally. In turn, this impacts the transport dynamics of solutes and pollutants, including plastics. 

Plastic transport dynamics in tidal rivers and estuaries remain understudied, yet the few available observations suggest that plastics can be retained here for long time periods, especially during periods of low net discharge. Additional factors such as riparian vegetation and riverbank characteristics, in combination with bidirectional flows and varying water levels, can lead to even higher likelihood of long-term retention.

Here, we provide a first observation-based estimation of net plastic transport on daily time scales in tidal rivers. For this purpose, we developed a simple Eulerian approach using sub-hourly observations of floating plastic transport and discharge during full tidal cycles. We applied our method to the Saigon river, Vietnam, throughout six full tidal cycles in May 2022.

We show that the net plastic transport is about 27-32% of the total plastic transport. We found that plastic transport and river discharge are positively and significantly correlated (Pearson's r = 0.87, R2= 0.75). The net plastic transport is higher than the net discharge (27-32% and 18%, respectively), suggesting that plastic transport is governed by other factors than water flow. Such factors include wind, plastic concentrations in the water, and entrapment of plastics downstream of the measurement site. The net plastic transport rates per tidal cycle alternate between positive (seaward) net transport and negative (landward) net transport, as a result of the diurnal inequality in the tidal cycles. We found that soft and neutrally buoyant items had considerably lower net transport rates than rigid and highly buoyant items (11-17% vs 31-39%), suggesting the retention time strongly depends on item characteristics.

Our results demonstrate the crucial role of tidal dynamics and bidirectional flows in net plastic transport. We emphasize the importance of understanding fundamental transport dynamics in tidal rivers and estuaries to ultimately reduce the uncertainties of plastic emission estimates into the ocean.

How to cite: Schreyers, L., van Emmerik, T., Bui, K., Van Le Thi, K., Vermeulen, B., Nguyen, H.-Q., and van der Ploeg, M.: Tidal plastic recycling: net river plastic transport limited by tidal dynamics, EGU General Assembly 2023, Vienna, Austria, 23–28 Apr 2023, EGU23-13061, https://doi.org/10.5194/egusphere-egu23-13061, 2023.

EGU23-13804 | Orals | HS2.3.4 | Highlight

What can global hydrological models tell us about sources and flows of riverine plastics? 

Alena Bartosova, Fanny Jeppsson Stahl, Conrad Brendel, Johan Temnerud, Jan Havelka, and Berit Arheimer

Plastic pollution is one of the major global water quality issues. Yet the lack of consistent data and standardized monitoring and assessment methods leads to a wide range of uncertainties in estimating the plastic load that is being delivered to marine environments. At the same time, continental and global dynamic hydrological models are becoming more available for large-scale estimation of time-dynamic water fluxes into sea basins. One such tool is a dynamic process-based rainfall-runoff and water quality model Hydrological Predictions for Environment (HYPE) and its global application, World-Wide HYPE (WWH, Arheimer et al., 2020).

Here, we present the first results from simulating global riverine plastic pollution using WWH. The model development is based on the results of the global literature review of sources of microplastics through the lens of a hydrological modeler. Traditional model calibration techniques may not be appropriate in this case due to insufficient number of data points, large variability in plastic characteristics and sampling techniques applied in the collected monitoring studies, as well as large uncertainty and a lack of current knowledge of transport and transformation processes in water bodies. Thus, an ensemble of WWH model setups was developed where the model structure and hydrology is the same and the model parameters that affect generation, transformation, and transport of plastic from various land uses, sanitation categories, and in rivers are varied to explore the defined parameter space. Collected data together with other global estimates were then used to evaluate the ensemble with a weight of evidence approach, highlighting sources and processes of major significance and focusing the ensemble towards a realistic set. Further model error analyses indicate which sources and processes play an important role in transport of riverine plastics as well as how different monitoring approaches can affect the results.

References:

Arheimer, B., Pimentel, R., Isberg, K., Crochemore, L., Andersson, J. C. M., Hasan, A., and Pineda, L., 2020. Global catchment modelling using World-Wide HYPE (WWH), open data and stepwise parameter estimation, Hydrol. Earth Syst. Sci. 24, 535–559, https://doi.org/10.5194/hess-24-535-2020

How to cite: Bartosova, A., Jeppsson Stahl, F., Brendel, C., Temnerud, J., Havelka, J., and Arheimer, B.: What can global hydrological models tell us about sources and flows of riverine plastics?, EGU General Assembly 2023, Vienna, Austria, 23–28 Apr 2023, EGU23-13804, https://doi.org/10.5194/egusphere-egu23-13804, 2023.

EGU23-13885 | ECS | Orals | HS2.3.4

Detection of suspended macroplastics in the field using acoustic backscatter 

Anouk Boon, Tim van Emmerik, and Bart Vermeulen

Suspended plastic transport is one of the big unknowns in present plastic research. It is either neglected or measured using expensive and labour-intensive underwater net-measurements. In search for additional measurement methods, the Acoustic Doppler Current Profiler (ADCP) has recently been explored as a tool for detecting plastic debris. ADCPs emit a high-frequency acoustic signal, which is scattered back to the transducer by particles in the water column. The frequency shift and the strength of the returned signal (backscatter) are used for respectively flow velocity and suspended sediment concentration estimates. Large objects like fish and organic material can be recognised in the acoustic signal by a strong local increase in backscatter. It has been shown that ADCPs can also detect plastic debris during controlled tests. The characteristics of the acoustic signal of plastics in an uncontrolled setup under varying conditions is still understudied.

To develop knowledge on in situ plastic detection, we first deployed an ADCP in a small flowing system into which we introduced plastic litter varying in size, composition and shape. Secondly, a test was undertaken with a simultaneous ADCP and net measurement in a large Dutch river. The uncontrolled plastic transport of the river is estimated based on ADCP data, and calibrated and validated using the net measurement. The tests gave novel insight into the signature of flowing plastics in the backscatter signal, and the present possibilities and challenges of in situ plastic detection using ADCPs. Overall, plastic detection using ADCPs has the potential to provide valuable information about the spatial and temporal variability of suspended macroplastic transport in rivers, aiding efforts to mitigate the negative impacts of plastic pollution. More research is needed to create a complete overview of backscatter characteristics of litter and to develop effective automated algorithms and methods for accurately distinguishing plastic.

How to cite: Boon, A., van Emmerik, T., and Vermeulen, B.: Detection of suspended macroplastics in the field using acoustic backscatter, EGU General Assembly 2023, Vienna, Austria, 23–28 Apr 2023, EGU23-13885, https://doi.org/10.5194/egusphere-egu23-13885, 2023.

EGU23-14433 | ECS | Orals | HS2.3.4

Aquatic Aggregates as “Vector” for Microplastics 

Nan Wu, Stuart Grieve, Andrew Manning, and Kate Spencer

Easily transportable microplastics (plastic particles < 5 mm) have become an increasingly important component of suspended particulate matter (SPM) in the aquatic environment, and their fate is significantly influenced by aggregation and flocculation. Aggregation modifies particle properties (e.g., size) controlling the hydrodynamics of SPM in the aquatic environment. Hence, understanding and quantifying aggregation is key to predicting the behaviour of both SPM and associated microplastics. However, quantifying the aggregation degree of microplastics with complex parameters in various water environments is very difficult.

Here, an extensive range of microplastics including 8 polymer types, 3 shapes, different weathering conditions and different sizes (10-300 µm for fragments and microbeads, and 10-1500 µm in length for microfibers, respectively), were used to explore the aggregation dynamics of microplastics. Over 4000 measurements of incorporated microplastics were collected, and we found microplastic size (MinFeret diameter of fragments, diameter of microfibers) is the key parameter to determining the aggregation behavior. Our results simplified the aggregation of microplastics with a wide range of properties in various water ecosystems into two parameters, the size of microplastics and the size of aggregates. A boundary curve for microplastics was fitted based on size relationships between microplastics and aggregates to divide microplastics into aggregable and un-aggregable groups. This study can aid better understanding the fate of microplastics in various aquatic environments at multiple scales.

How to cite: Wu, N., Grieve, S., Manning, A., and Spencer, K.: Aquatic Aggregates as “Vector” for Microplastics, EGU General Assembly 2023, Vienna, Austria, 23–28 Apr 2023, EGU23-14433, https://doi.org/10.5194/egusphere-egu23-14433, 2023.

Mismanaged plastic waste continually accumulates in the marine environment. A large amount of its emission to the ocean originates on land and is transported by rivers, streams and artificial drains. However, monitoring efforts and knowledge building on the dynamics and quantification of these emissions based on field research is scarce and subject to local catchment scale.

Here, we present an experimental study of plastic waste transport and retention dynamics in artificial drains (gullies) subject to flash floodings in short drainage areas of Kingston, Jamaica. We developed a novel plastic waste piles survey using UAV and field measurements. The offered investigation has the potential for estimation of plastic waste piles (i) volumes and composition, (ii) transport-retention-remobilization cycles and (iii) correlation with local hydro-meteorology, especially during peak events, where most of the plastic waste is transported.

Until now, monitoring efforts were carried out on the lower stretch (1km) of three gullies flowing to Kingston Harbour and the Caribbean Sea during 90 days in the hurricane season of 2021 on a bi-weekly basis. The current dataset includes 24 orthorectified images of the gullies and plastic waste piles. Direct samples of the plastic waste piles are being collected for ground-truth validation. We observe that plastic waste piles are more prominent when large objects (such as refrigerators, tree branches or tyres) are present, forming a base for greater accumulation and affecting remobilization cycles.

These results are essential for understanding macroplastic transport processes and the development of innovative technological solutions preventing plastics inflow into the ocean. It has the potential to provide insights into the operational performance before and after the implementation of interception solutions or mitigation measures. Furthermore, it serves as baseline data to strengthen local policy-making on initiatives assessing harmful effects in surrounding ecosystems.

How to cite: Correia, R., Assumpção, T., Buchanan, L., Fletcher, D., and Maxam, A.: Understanding plastic waste dynamics, correlations with hydrological extremes and its contributions to the development of innovative interception and mitigation solutions within Kingston Harbour, Jamaica, EGU General Assembly 2023, Vienna, Austria, 23–28 Apr 2023, EGU23-14632, https://doi.org/10.5194/egusphere-egu23-14632, 2023.

EGU23-14841 | ECS | Orals | HS2.3.4

A new methodological approach for the assessment of plastic pollution in estuarine waters: Guadalquivir River (SW Spain) 

Rocío Quintana Sepúlveda, Daniel González-Fernández, Andrés Cózar, Sandra Manzano-Medina, Lucía Pérez-López, and Carmen Morales-Caselles

Rivers and estuaries are a key transport pathway for plastics from inland to the sea. These systems are subject to fluctuations depending on sources of plastics and local environmental factors, causing variation in the plastic concentration up to several orders of magnitude within limited time ranges. Due to this large variability, in freshwater systems, it is challenging to obtain representative monitoring data. This study presents a new methodological approach to determine the number of plastic particles needed to obtain representative data for plastic pollution characterization in estuarine waters. The method used monthly in situ observations during a period of two years in the Guadalquivir River estuary (SW Spain). The data allowed the characterization of plastic concentrations across all size categories (micro-, meso- and macroplastics). The items were categorized into different size classes (<5 mm, 5-25 mm, 2.5-5 cm, 5-10 cm and >10 cm) and a resampling simulation was applied to generate 95% confidence intervals for plastic concentration variability. Our results suggest that, when using a limited number of samples, there is an underestimation of all size classes, e.g., up to three quarters of the samples could underestimate the average number of particles. Differences up to 3 orders of magnitude can be established between the lower (<5 mm) and the higher (>10 cm) size class in terms of number of particles sampled. This approach will help to optimize time and define sample size for specific particle size classes to improve plastic monitoring in freshwater environments.

How to cite: Quintana Sepúlveda, R., González-Fernández, D., Cózar, A., Manzano-Medina, S., Pérez-López, L., and Morales-Caselles, C.: A new methodological approach for the assessment of plastic pollution in estuarine waters: Guadalquivir River (SW Spain), EGU General Assembly 2023, Vienna, Austria, 23–28 Apr 2023, EGU23-14841, https://doi.org/10.5194/egusphere-egu23-14841, 2023.

EGU23-14876 | Posters on site | HS2.3.4 | Highlight

Microplasic measurements at the Danube river using a multi-level approach 

Marcel Liedermann, Sebastian Pessenlehner, Philipp Gmeiner, Johannes Mayerhofer, Ionut Procop, and Helmut Habersack

Microplastics are already part of our environment - even in the most inaccessible and remote places we find plastic particles that also remain there due to their longevity. The finer the scale at which we analyse samples, the more particles we find. It also became clear in the recent years, that rivers transport microplastics and that they also represent a principal pathway for plastic transport from land to the sea.

Initial measurements with benthic nets on the Austrian Danube have shown that the plastic particles are not only found on the surface, but are distributed unevenly with maximum concentrations partly near the bottom, partly on the surface and partly concentrated on one side of the river. Given the spatial and temporal distribution, a multipoint method seems inevitable and was chosen for further measurements, in which three measuring points each are distributed over the depths of several measuring verticals along a cross-section. Furthermore, it was found that the microplastic concentration also strongly depends on the discharge conditions and that by far the largest quantities of microplastics are mobilized and then transported during flood events.

After the first comprehensive measurements on the Austrian Danube between 2014 and 2015, further samplings were carried out in Hungary, Serbia and at 3 locations in Romania over the recent years. Despite the limitations of the data set, regarding the longitudinal, cross-sectional and hydrological representation of the micro plastic transport in the Danube River, an attempt is made to describe its characteristics on a basin wide scale. The measurements, reaching from impounded sections in the Upper Danube all the way down to the Danube delta, have shown, that the concentrations fluctuate strongly longitudinally according also to the discharge level. Therefore, at least at certain times, the Danube – and river systems with their inundation areas in general – are not only pathways, but can also be regarded as a microplastic sink. However, to increases process understanding and derive reliable statements, more data are needed.

How to cite: Liedermann, M., Pessenlehner, S., Gmeiner, P., Mayerhofer, J., Procop, I., and Habersack, H.: Microplasic measurements at the Danube river using a multi-level approach, EGU General Assembly 2023, Vienna, Austria, 23–28 Apr 2023, EGU23-14876, https://doi.org/10.5194/egusphere-egu23-14876, 2023.

EGU23-14892 | ECS | Posters on site | HS2.3.4

Risk of re-release of microplastics from sewage fertilisers into the environment 

Jagoda Worek, Ewa Gawlak, Kamil Kawoń, Joanna Chwiej, Wioleta Bolesta, and Katarzyna Styszko

Microplastics found in sewage are mainly microparticles from cosmetics (peelings, toothpaste) and fibres from fabrics (which get into the sewage during washing). Microplastics removed from wastewater accumulate primarily in raw sludge, which it ends up in the sludge processing sector. Due to their low susceptibility to biodegradation, microplastics together with stabilised sewage sludge end up in the soil or are otherwise processed together with the sludge.

The purpose of the research was to analyze the content of microplastics in stabilised sewage sludge, of which up to 90% is used to produce fertilizers. The analysis was based first on the oxidation of the matrix with peroxide and then density separation with a saturated solution of zinc chloride (ZnCl2). The second stage consisted of the analysis of separated microplastic fractions. For this purpose, the ATR FTIR and FTIR microscope were used. A complementary apparatus was also used, which was a confocal Raman microscope. Stabilised sewage sludge was analyzed depending on the day of its collection. The highest amount of microplastics was found in the samples from Monday, Friday and Saturday. This was due to the increased release of hygiene products containing plastic microbeads. Qualitative analysis, which showed the highest amount of LDPE microplastic fraction. The highest amount of microplastics per 100 grammes of dry weight was 1,084 fragments and 1,128 fibres, for a total of 2,212 microplastic particles. If 90% of the stabilised sewage sludge was used for the production of fertiliser, the emission would be about 1990 particles per 100 grammes. The study showed that the use of sewage sludge to create fertilisers will contribute to the emission of a significant amount of microplastics into the environment.


Acknowledgments: A Research project financed by program “Initiative for Excellence – Research
University” for the AGH University of Science and Technology. The research was supported by
Research Subsidy AGH 16.16.210.476.

How to cite: Worek, J., Gawlak, E., Kawoń, K., Chwiej, J., Bolesta, W., and Styszko, K.: Risk of re-release of microplastics from sewage fertilisers into the environment, EGU General Assembly 2023, Vienna, Austria, 23–28 Apr 2023, EGU23-14892, https://doi.org/10.5194/egusphere-egu23-14892, 2023.

Kimitsuki et al (SIL 2022; EGU 2023, this session) have reported near-surface microplastic particle concentrations from 26 quasi-monthly sampling dates over three years in Lake Biwa, Japan.  The concentrations show a high degree of intermittency, both in the shallow South Basin and the deep North Basin.  Kimitsuki et al have suggested that the dates of high particle concentrations followed relatively strong wind events, which are hypothesized to stir up bottom sediments together with deposited microplastic particles. In the South Basin, which has an average depth of 4 m, this hypothesis seems very natural.  However the sampling point in the North Basin was located in waters well exceeding 60 m depth.  If the sampled microplastic particles there originated from wind-induced resuspension events, it seems likely that the resuspension occurred at shallower bottom depths close to shore.

Through well-resolved hydrodynamic simulations, combined with particle tracking, the current work considers how resuspension at shallow depths, followed by advection during the days preceding sampling, might explain the two highest spikes in Kimitsuki et al’s sampled concentrations in the North Basin.  These spikes occurred on June 20, 2021 and July 4, 2021, when measured particle concentrations were respectively 54 and 46 particles/m3, as may be compared to the median value over the three-year campaign of 6.5 particles/m3.  Preceding both dates, both forward and time-reversed particle tracking suggest that the sampled microplastic particles could have been resuspended from the lakebed at depths of around 10 meters, near to the shore about 5 km northwest of the sampling point. At this location and depth, internal waves, associated with vertical undulations of the thermocline, were predicted to induce strong water currents near the lake bottom.  The simulated near-surface currents were then predicted to transport such resuspended particles offshore toward the sampling location.

How to cite: Wells, J. C.: On the hypothesis of microplastics resuspension by internal waves in a deep stratified lake., EGU General Assembly 2023, Vienna, Austria, 23–28 Apr 2023, EGU23-14971, https://doi.org/10.5194/egusphere-egu23-14971, 2023.

Considerable amounts of plastic waste that flow into rivers and the ocean have become a major environmental problem. This is especially true for microplastics (MPs: Plastic particles less then 5mm in size) and different organizations are investigating their impact on the environment. While a lot of related research has focused on oceans and coastal seas, investigations of MPs in lakes and rivers remain sparse. Lake Biwa, the largest and the oldest lake in Japan is no exception. In order to better understand the situation, we conducted quasi-monthly sampling on Lake Biwa (26 times total from March 2019 to July 2022) by filtering one cubic meter of water from the lake surface at a specified location in the North Basin (average depth <d>= 43m) and a second location in the South Basin (<d>= 4m). FT-IR and Nile Red staining were used to evaluate the quantity and quality of MPs in the two locations.

We found that the particle concentrations were highly intermittent in both basins. Median particle concentrations were low: 2.5 particles/m3 in the South Basin, and 6.6 particles/m3 in the North Basin. But a few “spikes” in concentration were observed. Notably, more than 100 Small MPs (plastic particles sized less than 1mm, per m3) were observed on Nov. 29th and Dec. 27th, 2020, and on June 20th, 2022, in the South Basin. We suggest that it is related to the weather that occurred in Lake Biwa. Within the 3 days preceding these sampling days, strong winds of more than 10m/s were observed. Because the South Basin is much shallower, it is more likely that the sediment on the bottom was lifted up by wind-driven waves, and deposited MPs were resuspended into the water column.

Overall, the median number of MPs was clearly higher in the North Basin. We suggest that it happened because of the gyre that exist during the stratified season in North Basin. There are 3 gyres in the North Basin which create a non-uniform distribution in plastic particles. In addition, we have to note that the residence time in the North and the South Basin are quite different. The residence time in the North Basin is 5.5 years, whereas in the South Basin, it is only about 15 days. Due to the presence of the gyre, the residence time in the North Basin will be longer (19 years to be precise). Therefore, we can presume that many MPs stayed in the North Basin.

Concerning the composition of MPs in Lake Biwa, Polyethylene (PE) and Polypropylene (PP) were dominant, together accounting for 90%. Since PE and PP are low-cost, light, easy to process, etc., they are the most commonly used type of plastics. Similar results for the composition of MPs have been obtained by other research groups as well.

How to cite: Kimitsuki, M.: The abundance and composition of Micro Plastics in the North and South Basins of Lake Biwa, Japan, EGU General Assembly 2023, Vienna, Austria, 23–28 Apr 2023, EGU23-15136, https://doi.org/10.5194/egusphere-egu23-15136, 2023.

EGU23-15187 | ECS | Orals | HS2.3.4

Plastic transport and retention around river bifurcations 

Khoa Thi, Tim van Emmerik, Ton Hoitink, Bart Vermeulen, and Nhan Pham Quy

The transport of plastic in rivers is affected by a wide variety of factors, such as river discharge, wind drag, and tides. These dynamic processes include the travelling time or distance, retention time or location, and remobilization rate of plastic items, which can be quantified by using GPS-based trackers. However, these properties are still unknown in some specific locations, including river bifurcations where the changes in river discharge, flow velocity, and river morphology are significant. Here, we demonstrate the behaviour of plastic transport in a river bifurcation area not influenced by tides during flood season in the Red River system of Vietnam. While all trackers retained somewhere in the river after hours or days, we found that after 10.5 kilometers downstream of the bifurcation, 9 out of 10 trackers followed the main channel retained in the same approximately 6-kilometer-long river segment. Meanwhile, 50% of the 6 trackers that left the main channel to enter the tributary also retained in the same 2.5-kilometer-long river segment 9 kilometers downstream of the bifurcation. These findings are linked to the concept of rivers as plastic reservoirs, as none of the trackers that stranded on the riverbanks for several days was remobilized. Furthermore, the retention of trackers in the same area after leaving the bifurcation clearly indicates shared driving factors on plastic transport, which are likely the river discharge, wind direction or velocity, and river morphology. Our results underscore the need for future research on delineating exact accumulation zones of the plastics in riverbanks considering the effects of wind, river discharge, and river morphology.

How to cite: Thi, K., van Emmerik, T., Hoitink, T., Vermeulen, B., and Pham Quy, N.: Plastic transport and retention around river bifurcations, EGU General Assembly 2023, Vienna, Austria, 23–28 Apr 2023, EGU23-15187, https://doi.org/10.5194/egusphere-egu23-15187, 2023.

Since microplastics are an obstinate pollutant in terrestrial environments, posing a risk to the subsurface soil matrix and entering inland waters via erosion pathways, it is necessary to understand their transport behaviours. The morphological descriptors used to characterize microplastic particles are usually highly subjective. This study explores the transport and retention behaviour of 125 – 200 μm Polyvinyl chloride (PVC) plastic fragments in saturated quartz sand (1.6 – 2.0 mm) columns. Retention profiles at different ultrapure water flow rates (2.0 – 3.5 ml/min) were compared and analysed. At the beginning and end of each column test, the microplastic particles were scrutinized, identified, and quantified by light microscopy. Each particle was characterized by dimensionless 3D morphological descriptors that can describe any particle shape. The results showed that the transport distance of microplastic particles increased with decreasing diameter of the microplastic particles. PVC microplastic particles, whose morphology was more 1-dimensional, were more susceptible to degradation and fragmentation within the column, promoting migration. Microplastic degradation into fragments appeared to play an important role in improving the movement of particles. This study offers initial indications of infiltration depths and morphology-dependent fragmentation of secondary microplastics in coarse sand, outlining the limitations of 2D projected images conventionally used to study the transport of microplastics.

How to cite: Tumwet, F., Serbe, R., and Scheytt, T.: Morphology-dependent degradation and fragmentation of PVC microplastic particles influence their transport in saturated quartz sand columns, EGU General Assembly 2023, Vienna, Austria, 23–28 Apr 2023, EGU23-15273, https://doi.org/10.5194/egusphere-egu23-15273, 2023.

EGU23-16732 | ECS | Orals | HS2.3.4

Microplastics transport during Managed Aquifer Recharge – A potential cause of groundwater contamination? 

Daniele la Cecilia, Christian Moeck, Ralf Kägi, Matthias Philipp, and Mario Schirmer

Managed Aquifer Recharge (MAR) belong to the nature-based engineering approaches poised to play an increasingly positive role in climate change adaptation. In fact, the increased groundwater availability thank to MAR can buffer future temporal water shortages driven by forecast longer droughts. However, one concern of MAR regards the quality of the infiltrating water as it affects groundwater quality.

There is growing concern about groundwater contamination by microplastics (MP) delivered by the infiltrated surface water. Indeed, MPs have been found in rivers globally. Groundwater contamination by MPs could then have direct detrimental consequences on groundwater management and availability for human uses.

In this study, we measured MPs larger than 20 µm in the different important stages of a major MAR-water supply system in Switzerland. The MAR system has been diverting an average of 95,000 m3/day of Rhine water through channels and ponds since 1958. Samples of filtered water were taken in triplicates from the Rhine River near Basel, the treatment stages before the managed infiltration outlets, the pumped groundwater, before and after the activated carbon filters. The methodology involved the analysis of the filters by means of micro-Fourier Transform InfraRed (FTIR) spectroscopy and MPs identification by means of the machine-learning model developed by the Purency company. The possible contamination by MPs smaller than 20 µm could not be assessed due to practical challenges for water filtration in the field and quantification (reliable micro-FTIR measurements down to 20 µm). Before analyses, we added surrogate particles of polyethylene with an average size of 60 µm for quality assurance and quality control.

The measurements revealed satisfactory MPs reduction along the MAR system. While the number of MPs in the raw Rhine River had to be quantified still, MPs average concentration decreased from about 9.75 particles/l in the treatment stage to about 1.3 particle/l after the activated carbon filter. MPs average concentration increased to 7 particles/l between the pumped groundwater and the activated carbon filters. The increase was driven by a high count of polypropilene MPs in one of the triplicates. Our study could not exclude a possible MPs contamination by construction materials used in the facility. The measured concentrations referred to a randomised scan of about 50% of the area of the filters encompassing the centre and the edges of the filters. Most of the surrogate particles accumulated along the edges. Yet, we only considered particles with a value of the Relevance and Similarity metrics greater than 0.3.

Acknowledgements: We thank our colleague Reto Britt who supported with the sampling campaign and laboratory measurements and the drinking water supplier for allowing us to carry out the study within their premises.

How to cite: la Cecilia, D., Moeck, C., Kägi, R., Philipp, M., and Schirmer, M.: Microplastics transport during Managed Aquifer Recharge – A potential cause of groundwater contamination?, EGU General Assembly 2023, Vienna, Austria, 23–28 Apr 2023, EGU23-16732, https://doi.org/10.5194/egusphere-egu23-16732, 2023.

EGU23-16958 | Orals | HS2.3.4

Microplastics in Urban Watersheds, Southern California, USA 

Andrew Gray, Win Cowger, Samiksha Singh, and Clare Murphy-Hagan

Globally, fluxes of microplastics to marine environments are thought to be dominated by stormflow from urban environments, which may be moderated by storage in estuaries. Fluvial transport of microplastics is primarily a supply-limited phenomenon, but flow field and particle characteristics can result in a wide range of transport modes, from surface load to bedload, with potential ramifications for estuarine transport and fate. Here we report preliminary findings from microplastic monitoring campaigns conducted in a number of streams draining urban watersheds in Southern California, and estuarine wetland and benthic sediment deposits. These studies will serve as the basis for microplastic flux, accretion, and composition evaluation, and inform the optimization of microplastic monitoring in urban systems.

How to cite: Gray, A., Cowger, W., Singh, S., and Murphy-Hagan, C.: Microplastics in Urban Watersheds, Southern California, USA, EGU General Assembly 2023, Vienna, Austria, 23–28 Apr 2023, EGU23-16958, https://doi.org/10.5194/egusphere-egu23-16958, 2023.

Ecological responses are key indicators of river water quality. Ecological responses to changing riverine flows are often evaluated by describing the relationship between river discharge and response. However, aquatic organisms experience the hydraulics (i.e. velocity, shear stress, depth) of a river, not its discharge. Hydraulic characterizations of riverine habitats may improve our ability to predict ecological responses. We used two-dimensional hydraulic models to translate river discharge into reach-averaged velocity. Combining these flow data with water temperature and 8 years of field observations of fish spawning, we developed a Bayesian hierarchical model to predict the spawning of golden perch (Macquaria ambigua) in the lower Goulburn River, south-east Australia. The model suggested that probability of spawning was positively related to both discharge and reach-averaged velocity. The model also identified the critical water temperature above which both discharge and velocity start to affect spawning. Antecedent flows prior to spawning had a weak positive effect on spawning.  Against expectations, there was little difference in predictive uncertainty for the effect of flows when reach-averaged velocity was used as the main predictor rather than discharge. The lower Goulburn River has a relatively simple channel and so discharge and velocity are monotonically related over most flows. We expect that in a more geomorphically complex environment, improvement in predictive ability would be substantial. This research only explores one example of a hydraulic parameter being used as a predictor of ecological response; many others are possible. The extra effort and expense involved in hydraulic characterization of river flows (e.g., velocity) is only justified if our understanding of flow-ecology relationships is substantially improved. Further research to understand which environmental responses might be best understood through different hydraulic parameters, and how to better characterize hydraulic characteristics relevant to riverine biota, would help inform decisions regarding investment in hydraulic models. 

How to cite: Guo, D., Webb, J. A., Koster, W., Arrowsmith, C., and Vietz, G.: Can hydraulic measures of river conditions improve our ability to predict ecological responses to changing flows? Flow velocity and spawning of an iconic native Australian fish, EGU General Assembly 2023, Vienna, Austria, 23–28 Apr 2023, EGU23-1927, https://doi.org/10.5194/egusphere-egu23-1927, 2023.

EGU23-2144 | ECS | PICO | HS2.3.5

Comparison between numerical and parametrical uncertainty in the application of simplified water quality models 

Joana Postal Pasqualini and Fernando Mainardi Fan

Simplified models based on the complete stirring tank reactor (CSTR) theory can be helpful in preliminary water quality assessments. The uncertainties of these tools should be considered for better decision-making. The research aimed to answer the following question: Is the uncertainty of the parameters or is the uncertainty of the numerical methods that generate the greatest range of possibilities for a simple water quality model? Two opposite hydrological conditions of lentic environments were investigated. Numerical uncertainty was estimated through an ensemble of six different numerical methods for solving the ordinary differential equation (ODE). Monte Carlo simulations were employed to quantify the parametric uncertainty. Uncertainty sources were compared based on the generated interquartile range for each case study. The numerical uncertainty was equivalent to the parametric uncertainty for low reservoir volumetric oscillation, whereas the numerical uncertainty prevailed over the parametric uncertainty for high volumetric ascension. The parametric uncertainty collaborated to consider the uncertainties in the definition of parameters that are not necessarily static. The results demonstrated that these considerations are relevant in situations of seasonal effects of water storage, which can be observed in drought scenarios, and even as an effect of climate change. Suggestion is in favor of the ensemble approach, as considering the variability of results through numerical and parametric uncertainties in simplified models could help build trust on the decision-making process concerning the preliminary assessment of water quality in lentic environments.

How to cite: Postal Pasqualini, J. and Mainardi Fan, F.: Comparison between numerical and parametrical uncertainty in the application of simplified water quality models, EGU General Assembly 2023, Vienna, Austria, 23–28 Apr 2023, EGU23-2144, https://doi.org/10.5194/egusphere-egu23-2144, 2023.

EGU23-2747 | ECS | PICO | HS2.3.5

Testing the transferability of a Bayesian Belief Network to diverse agricultural catchments using high-resolution hydrology and land management data sets 

Camilla Negri, Nicholas Schurch, Andrew J. Wade, Per-Erik Mellander, and Miriam Glendell

Phosphorus (P) pollution from agriculture is a major pressure on maintaining and improving water quality worldwide. In Ireland, the Agricultural Catchments Programme (ACP) was created to evaluate the Good Agricultural Practice measures implemented under the EU Nitrates Directive. Considerable monitoring and research have been done into the drivers of, and controls on, nutrient loss in these catchments.

Managing P pollution in agricultural catchments requires informed decisions about the pollution risks using catchment-scale understanding which, in turn, requires a systemic modelling and assessment approach. Bayesian Belief Networks (BBNs) support system-level thinking as they can represent complex systems (such as rivers and catchments) and integrate disparate information sources while representing uncertainty. In a previous study, a BBN was developed using the ‘source-mobilisation-transport-continuum’ and parameterized for a 12 km2 agricultural catchment with flashy hydrology on poorly drained soils and grassland as the dominant land use. Seven years of hourly turbidity and discharge measurements at catchment outlet, and mapped soil P content were used to inform parameterization. Literature data and expert opinion were included to complement the dataset when information on point-source pollution (farmyard and septic tank nutrient losses) was lacking.

In the current study, the BBN is developed further and is parameterized using a monthly time-step for three additional diverse ACP catchments: two arable land-dominated catchments with contrasting hydrology (well-drained vs poorly drained) and a well-drained grassland catchment to test model transferability. In a step forward from the previous model, we quantify P losses from a sewage treatment plant in one of the arable catchments, and we consider biota in-stream P removal as an additional process. Lastly, the observed TRP concentrations were bootstrapped to obtain monthly TRP distributions which are compared to predictions from the BBN to validate the model.

Results showed that the model performs well for the target catchment but applying it to other catchments is key to assessing its generalizability and utility. Here, preliminary results explore whether the BBN can capture the differences in P loss risk between catchments and the reasons for this.

In addition, testing the model transferability to other catchments is important to (a) inform on the differences in P loss between catchments, and (b) inform model testing in data-sparse catchments. Future research will be focussed on integrating climate change scenarios in the model to inform the targeting of mitigation measures under future change, foster discussion with stakeholders, and provide support to decision-makers.

How to cite: Negri, C., Schurch, N., Wade, A. J., Mellander, P.-E., and Glendell, M.: Testing the transferability of a Bayesian Belief Network to diverse agricultural catchments using high-resolution hydrology and land management data sets, EGU General Assembly 2023, Vienna, Austria, 23–28 Apr 2023, EGU23-2747, https://doi.org/10.5194/egusphere-egu23-2747, 2023.

EGU23-6890 | ECS | PICO | HS2.3.5

Patterns and drivers of nutrient trends in flood-impacted surface waters: Insights from Bayesian modeling approaches 

Emine Fidan, Ryan Emanuel, Brian Reich, Angela Harris, and Natalie Nelson

Extreme events, including regional floods caused by hurricanes, have the potential to mobilize and transport nutrients across the landscape, creating public and environmental health concerns. Several studies have characterized the contaminants in floodwaters, but few studies offer insights into which watershed characteristics explain flood water quality signatures. To address lack of understanding on flood water quality descriptors, we aimed to explain floodwater nutrient concentrations as a function of different environmental variables. Specifically, we quantified nitrogen and phosphorus concentrations in floodwaters across the Atlantic Coastal Plain of North Carolina (USA) after Hurricane Florence, a major tropical storm that delivered up to 700 mm of rainfall to the region during September 2018. We also constructed a multivariate, spatial Bayesian model to explain nutrient responses as a function of different hydroclimatic factors, land use classifications, and nearby pollution point sources. Nutrient samples were collected at 51 different sites at four different time points spanning a year after Hurricane Florence impact: during major flood conditions and after floodwaters had receded. Samples were assessed for total Kjeldahl nitrogen, total ammonia nitrogen, nitrate and nitrites, total phosphorus, and orthophosphate. Results from this analysis show that nutrient concentrations were very low in floodwaters, with the exception of several sites that exhibited excessively high total Kjeldahl nitrogen, total phosphorus, and orthophosphate concentrations. Furthermore, modeling results indicate that swine production facilities (concentrated animal feeding operations; CAFOs), wastewater treatment plant (WWTP) proximity, and precipitation variables were important in explaining nutrient concentrations in floodwaters. This research suggests that swine CAFOs and WWTPs were likely sources of nutrient exports associated with Hurricane Florence, with rainfall amount being a primary driver. 

How to cite: Fidan, E., Emanuel, R., Reich, B., Harris, A., and Nelson, N.: Patterns and drivers of nutrient trends in flood-impacted surface waters: Insights from Bayesian modeling approaches, EGU General Assembly 2023, Vienna, Austria, 23–28 Apr 2023, EGU23-6890, https://doi.org/10.5194/egusphere-egu23-6890, 2023.

EGU23-7414 | ECS | PICO | HS2.3.5

Expert elicitation for parameterisation of a Bayesian Network model designed to simulate Faecal Indicator Organism (FIO) losses from septic tank systems in rural catchments 

Chisha Mzyece, Miriam Glendell, Richard S Quilliam, Ian Jones, Eulyn Pagaling, Lisa Avery, and David M Oliver

Bayesian Networks (BNs) are a modelling approach increasingly used in landscape management, e.g., to predict microbial water pollution risk and inform ecological risk assessment. BNs are widely acknowledged for their ability to integrate multiple data types in their structure, including expert knowledge derived through structured elicitation approaches and are therefore, advantageous when empirical evidence or large-scale datasets are scarce. Expert elicitation is a useful technique for quantifying and characterising expert knowledge regarding an uncertain quantity in situations where empirical data are missing, or additional information is required to augment available data. In this study, an expert elicitation approach utilising the Sheffield Elicitation Framework (SHELF) was employed to obtain expert judgements of an uncertain quantity included in a BN model designed to quantify faecal indicator organism (FIO) losses from septic tank systems by modifying an existing phosphorus risk BN model. The aim of the study was to quantify expert judgements on the proportions of FIOs likely to be delivered to a surface watercourse from septic tank systems based on soil hydrological properties, septic tank distance to watercourse and slope. The specific objectives were to:

  • Solicit expert feedback on the structure of the BN conceptual model developed to identify key factors influencing FIO pollution from septic tank systems;
  • Use the SHELF elicitation protocol to obtain individual expert judgements on FIO delivery coefficients in form of percentiles for a series of soil type, slope and distance to watercourse scenarios;
  • Fit probability density curves to individual expert judgements and derive consensus from across the range of expert judgements using facilitated group discussion.

The structure of the BN model including identification and justification of model variables, approaches to expert elicitation and consensus expert judgements are presented. The study demonstrates effective use of expert opinion in BN model parameterisation and BN FIO modelling to inform on options for addressing microbial pollution originating from septic tank systems in the Tarland catchment in North Eastern Scotland.

How to cite: Mzyece, C., Glendell, M., Quilliam, R. S., Jones, I., Pagaling, E., Avery, L., and Oliver, D. M.: Expert elicitation for parameterisation of a Bayesian Network model designed to simulate Faecal Indicator Organism (FIO) losses from septic tank systems in rural catchments, EGU General Assembly 2023, Vienna, Austria, 23–28 Apr 2023, EGU23-7414, https://doi.org/10.5194/egusphere-egu23-7414, 2023.

EGU23-7955 | PICO | HS2.3.5

Spatial pattern oriented optimization of regional scale hydrological models 

Simon Stisen, Mehmet Cüneyd Demirel, Mohsen Soltani, and Julian Koch

Regional scale hydrological models are often constrained by a group of observation stations, typically for discharge, which each represent a lumped catchment response. While multi-station calibration greatly improves model fidelity, other sources of data and different calibration objectives are often required to improve models for other variables and increase robustness for ungauged areas. Satellite data has often been utilized as an additional source of information for multi-objective optimization. However, in many cases satellite-based data for other variables, such as soil moisture, AET, snow cover, storage change etc. has been applied as timeseries of catchment averages, thereby underutilizing the unique spatial pattern information they carry.

In a series of studies a simple alternative approach has been developed to capitalize on the benefits of combining spatial pattern information from satellite data with classical discharge and groundwater head observations for model optimization. By limiting the constraint by the satellite data to pattern information only a very limited tradeoff with other observations is achieved. Meanwhile, the approach ensures realistic spatial patterns of parameter fields and simulations leading to improved transferability to ungauged basins.

In light of equifinality, which is often encountered for regional scale models constrained by multiple discharge stations, the approach can as such also be seen as an efficient way of identifying spatially consistent and realistic solutions among a large sample of plausible parameter sets.

Here we present two cases, one across six central-European basins using a mesoscale hydrological model (mHM) and another using a national scale groundwater-surface model (MIKE-SHE).

How to cite: Stisen, S., Cüneyd Demirel, M., Soltani, M., and Koch, J.: Spatial pattern oriented optimization of regional scale hydrological models, EGU General Assembly 2023, Vienna, Austria, 23–28 Apr 2023, EGU23-7955, https://doi.org/10.5194/egusphere-egu23-7955, 2023.

Phosphorus (P) inputs from anthropogenic activities are subject to riverine (hydrologic) P export, causing water quality problems in lakes and coastal systems. Nutrient budgets have been used as a quantitative means of assessing the amount of nutrients imported to and exported from a system. However, at large spatial scales, estimates of hydrologic P losses are usually not available or assumed as a fixed fraction of the budget terms. In addition, fluxes in nutrient budgets are generally not quantified at regular intervals. In this study, we estimate P losses across 150 US watersheds at an approximately 4-digit Hydrologic Unit Code (HUC 4) watershed scale from 1997-2017. To explain the spatio-temporal variability in these estimates, we develop a Bayesian model based on various anthropogenic P inputs (e.g., fertilizer, animal manure, point sources, and atmospheric deposition) and outputs (crop removal) from national inventories, climatic factors, background soil P content, and watershed characteristics. In addition, a hierarchical approach accounts for additional sources of variability across different regions. Model results help us identify hot spots of P loss, along with the primary factors contributing to these losses. Results indicate that the greatest P losses (per unit area) occur in the Mid-Atlantic and Great Lakes regions, mainly due to high anthropogenic inputs. Additionally, the Upper Colorado region is found to have the highest temporal variability in P loss, whereas the Lower Mississippi region has the lowest.

How to cite: Karimi, K. and Obenour, D.: Bayesian hierarchical modeling characterizes spatio-temporal variability in phosphorus export across the contiguous United States, EGU General Assembly 2023, Vienna, Austria, 23–28 Apr 2023, EGU23-8609, https://doi.org/10.5194/egusphere-egu23-8609, 2023.

EGU23-8832 | ECS | PICO | HS2.3.5

Non-parametric Bayesian modeling for risk-based management of Bathing Water Quality 

Wolfgang Seis, Pascale Rouault, David Steffelbauer, Marie-Claire Ten Veldhius, and Gertjan Medema

Bayesian non-parametric models are rarely used for predictive modeling of recreational waters. In the present study, we use a Dirichlet Process Gaussian Mixture Model (DPMM) for model-based clustering of hydrologic data collected at three river bathing sites (3 rivers, N = 256, N = 281, N = 1170). The three sites differ in their climatic conditions. Rivers 1 and 3 are continentally influenced (highly unbalanced dataset with few but severe contamination episodes); River 2 is more maritime-influenced (regular rainfall leads to balanced data set with regularly occurring pollution episodes); DP models can be used for model-based clustering, where the number of clusters does not have to be pre-defined but is inferred from the dataset itself. For each new observation x­I, the probability of belonging to an already existing cluster as well as the probability of belonging to a new cluster is calculated. We used this property to identify unknown, i.e. high-risk situations, at the individual river sites.

We first applied the DPMM to the available hydraulic training data for model training before conditionally updating a predefined lognormal prior for each cluster, representing the E.coli concentration in the river. For prediction, we first evaluated whether a new observation belongs to an existing cluster or whether it constitutes a new cluster. Based on this evaluation, we used either the posterior predictive distribution or the prior predictive distribution for cases where a new cluster was identified. The water quality assessment was subsequently based on the 90th and 95th percentiles of the individual predictive distribution. Model performance was evaluated by means of calculating four criteria: (i) the root mean squared error (RMSE), (ii) the percentage coverage of predictive intervals in relation to the test data (80%), (iii) the detection rate of confirmed contaminations (E.coli > 1800 MPN/100 mL), and (iv) the number of predicted bathing days in the test data. The ratio between training and test data was incrementally altered from 10-70%. We compared the DPMM model with four alternative data-driven algorithms: (i) an intercept-only model (zero model), (ii) a multiple linear regression based on stepwise variable selection (stepwise), (iii) a quantile random forest (QRM) and (iv) a Bayesian updating approach, where individual clusters were predetermined manually based on hydrologic characteristics instead of being inferred by the DPMM. The results show that especially for River 1 and 3, only the Bayesian models could predict over 90% of observed contaminations. Through its ability to identify unknown hydraulic situations and its combination with a prior predictive distribution, the DPMM algorithm can predict high-risk periods without the need to be trained on a dataset that includes this specific contamination information. This is achieved as it identified new hydrologic information as anomalies related to the training set. Thereby, the approach is especially suitable as a precautionary approach for recreational waters, where information-rich datasets are often missing.

How to cite: Seis, W., Rouault, P., Steffelbauer, D., Ten Veldhius, M.-C., and Medema, G.: Non-parametric Bayesian modeling for risk-based management of Bathing Water Quality, EGU General Assembly 2023, Vienna, Austria, 23–28 Apr 2023, EGU23-8832, https://doi.org/10.5194/egusphere-egu23-8832, 2023.

EGU23-10477 | ECS | PICO | HS2.3.5

Applying a Bayesian Framework to Track Binational (Canada-USA) Loads and Sources 

Felix Ouellet, Agnes Richards, Alexey Neumann, Glenn Benoy, and George Arhonditsis

The Red-Assiniboine River Basin (RARB) spans the Canada-USA border and discharges into Lake Winnipeg via the Red River. Recurrent harmful algal blooms caused by nutrient runoff coined Lake Winnipeg as “Canada’s sickest lake” and “most threatened in the World”. Invasive species such zebra mussels and spiny-water fleas have disrupted the aquatic ecosystem.

SPAtially Referenced Regression On Watershed Attributes (SPARROW) is a watershed model that follows a stream network and relates water quality conditions to nutrient sources, landscape delivery factors, nutrient transport, and losses in streams and reservoirs/lakes. We ported components of the first binational SPARROW model (deterministic calibrations) for RARB to a Bayesian framework to account for the main sources of uncertainty: errors resulting from loading estimates, parametric uncertainty (incorporated with prior distributions based on literature values), and model structural error. Open-source languages were used: Python, R, and WinBUGS. The limits of the computational capacity of WinBUGS were tested, with a total of over 70,000 catchments across the RARB.

We identified hot spots in Canada and USA at a sub-watershed scale, where wastewater treatment plants and agricultural inputs were the main contributors of Total Phosphorus (TP) to Lake Winnipeg. Within those hot spots, we looked at hot spots at the catchment scale, where wastewater treatment plants were contributing to nearly 100% of the TP loading.

We will present various scenarios testing hypotheses on different TP sources, such as the inclusion of urban areas, the subdivision of selected source variables, and the variation of wastewater treatment plant loadings.

How to cite: Ouellet, F., Richards, A., Neumann, A., Benoy, G., and Arhonditsis, G.: Applying a Bayesian Framework to Track Binational (Canada-USA) Loads and Sources, EGU General Assembly 2023, Vienna, Austria, 23–28 Apr 2023, EGU23-10477, https://doi.org/10.5194/egusphere-egu23-10477, 2023.

EGU23-11347 | ECS | PICO | HS2.3.5

Data-driven streamflow forecasting analysis leveraging multiple meteorological providers 

Daniele Dalla Torre, Andrea Menapace, Ariele Zanfei, and Maurizio Righetti

In the last years, different providers (e.g. NOAA, MeteoFrance, ECMWF, DWD) produced meteorological gridded global and regional data sets. These model outputs are now reanalysis and operative forecasts distributed as open data, with different spatial and temporal resolutions. The aim of this contribution is the comparison of short-term streamflow forecasting outputs using different meteorological data sets as forcing.

The use of the above-predicted weather time series as input for the hydrological models allows the evaluation of the streamflow at the catchment closure. Hourly data sets of temperature and precipitation from the different providers were selected for this contribution and the evaluation of the short-term streamflow forecasting results on three small catchments in the Alps was carried out.

A data-driven forecasting procedure with the Support Vector Regression machine learning algorithm as a tool for hydrological modeling was implemented. For each provider, training and testing phase were performed using as forcing the weather model outputs of the same provider, in this way the simulations are consistent. The training phase takes advantage of reanalysis data sets when available, otherwise historical forecasting products are used as an alternative. Instead, the testing period is forced by lags of the temperature, precipitation and streamflow metered data for the past. The number of lag hours is defined in the training stage with a grid search approach. Moreover, the actual temperature and precipitation forecasting data sets cover the prediction lead time. The training was carried on for each day of the training period and the output of each run is the hourly short-term streamflow prediction.

The use of multiple data sources as input allows us to emphasize the differences between global and local meteorological forcing. Moreover, the simulation ensembles outputs allow the identification and quantification of uncertainty that lead to a better interpretation of the prediction. These results are promising in hydrological modeling to increase the final accuracy of the streamflow predictions and the decision-making under uncertainty.

How to cite: Dalla Torre, D., Menapace, A., Zanfei, A., and Righetti, M.: Data-driven streamflow forecasting analysis leveraging multiple meteorological providers, EGU General Assembly 2023, Vienna, Austria, 23–28 Apr 2023, EGU23-11347, https://doi.org/10.5194/egusphere-egu23-11347, 2023.

EGU23-12757 | ECS | PICO | HS2.3.5

Emission potential estimation in landfill by coupled particle filter 

Liang Wang and Timo Heimovaara

The emission potential, represented by the total chloride mass in a landfill waste body in this paper, is a key factor in controlling long-term pollutant emissions from landfills. However, the direct measurement of pollutant mass in subsurfaces is usually hard to perform. Traditional model optimization methods use history matching to get the initial emission potential, which gives the best fit for the whole measurement series. However, the estimation at the latest time step is not as reliable as sequential data assimilation, which is a recursively updating method. This study investigates the feasibility of using a weakly coupled particle filtering approach to estimate emission potential. A flow-concentration coupled travel time distribution model is used to simulate the flow transport in the landfill. The weekly coupled particle filter framework assimilates leachate outflow volume and concentration measurements separately to estimate corresponding states in the landfill. The mass states are the product of the evaluated leachate volume and concentration states. Our results show that the uncertainty in chloride mass is quantified with less uncertainty, and the prediction results are also improved. These results indicate that it's promising to use outflow measurement series for emission potential estimation.

How to cite: Wang, L. and Heimovaara, T.: Emission potential estimation in landfill by coupled particle filter, EGU General Assembly 2023, Vienna, Austria, 23–28 Apr 2023, EGU23-12757, https://doi.org/10.5194/egusphere-egu23-12757, 2023.

EGU23-14448 | PICO | HS2.3.5

Optimizing low flow predictions in river systems: a multi-objective, multi-gauge calibration approach for process-based hydrological models 

Annika Künne, Louise Mimeau, Claire Lauvernet, Alexandre Devers, Flora Branger, and Sven Kralisch

Understanding the variations of streamflow is critical for studying the ecology of river systems. Low flow periods can pose significant pressures to river ecosystems, including flow intermittence, drying, increasing water temperature or pollutant concentration. Process-based spatially distributed hydrological models, can be used to simulate streamflow along river networks and provide valuable insights to study river ecology. However, until now, the use of these models to simulate streamflow at a high resolution, with a focus on low flow periods, has been limited. Therefore, traditional calibration techniques need to be adapted and refined to effectively address the challenges of sustainable river system management.

In this study, we present a new approach to calibrate a process-based spatially distributed hydrological model (JAMS/J2000) to optimize the simulation of low flows in river systems. This approach combines traditional efficiency criteria (KGE, NSE, pBias, RMSE, etc.) with hydrological signatures specific to low flows (KGE(sqrt(Q)), 10th quantile, base flow index, etc.) to optimize the model at multiple gauging stations. In order to select the optimized parameter set, simulated ensembles of different parameter sets were generated using Latin Hypercube sampling and an objective function developed that combines the efficiency criteria at each gauging station. This allowed us to evaluate the performance of multiple potential parameter sets and select the one that optimizes the simulation of low flows in the river system.

This calibration method was applied in 6 mesoscale catchments in different European countries (Croatia, Spain, Finland, France, Hungary, Czech Republic), which cover different ecoregions in Europe. The study was conducted as part of the Horizon 2020 DRYvER project (Datry et al. 2021). Our results show that the integration of hydrological signatures in the objective function has a strong impact on the calibration procedure and improves model performance during low flow periods.

Datry et al. (2021) Securing Biodiversity, Functional Integrity, and Ecosystem Services in Drying River Networks (DRYvER). Research Ideas and Outcomes. https://doi.org/10.3897/rio.7.e77750

How to cite: Künne, A., Mimeau, L., Lauvernet, C., Devers, A., Branger, F., and Kralisch, S.: Optimizing low flow predictions in river systems: a multi-objective, multi-gauge calibration approach for process-based hydrological models, EGU General Assembly 2023, Vienna, Austria, 23–28 Apr 2023, EGU23-14448, https://doi.org/10.5194/egusphere-egu23-14448, 2023.

EGU23-15057 | PICO | HS2.3.5

Blueprint for a digital twin of a river basin 

Debasish Pal, Pertti Ala-Aho, Anna-Kaisa Ronkanen, Hannu Marttila, Ellisa Lotsari, Marie Korppoo, Jari Silander, Linnea Blåfield, Petteri Alho, Cintia Uvo, Maria Kämäri, and Harri Kaartinen

Digital twins are part of ongoing digital transformation to test, monitor, and maintain physical environments virtually. The collaboration of smart measurement sensors, advanced communication networks, cloud data storage capacity, and cutting-edge computing techniques has the potential to create a digital twin of a river basin with greater physical, spatial, and temporal scalability. The digital twin is defined as a realistic virtual representation of the physical river basin that aids in improved decision-making through real-time data connectivity, association, and relationship. Because of the continuous bidirectional interactions between virtual and physical entities, the digital twin is unique to the physical river basin. The digital twin has the advantage of adapting to changing real-time river basin characteristics, resulting in increased operational efficiency, better uncertainty quantification, early warning detection, and identification of emergency management. By imagining smart river basin management via the digital twin concept, we are venturing into uncharted territory, with the goal of improving the ecological status of a river basin by balancing environmental and socioeconomic interdependence while minimizing natural resource depletion. This poster provides an overview of the concept, framework, methodology, and challenges involved in developing a digital twin of a river basin. The framework’s six dimensions are river basin, data, modeling, infrastructure, service, and connectivity. The methodology emphasizes the digital twin’s purpose identification, maturity spectrum, workflow architecture, technical core, data layers, model simulations, knowledge creation, and effective application. We discuss the key services provided by the digital twin for the river basin, as well as its future prospects for autonomous control in the physical river basin.

How to cite: Pal, D., Ala-Aho, P., Ronkanen, A.-K., Marttila, H., Lotsari, E., Korppoo, M., Silander, J., Blåfield, L., Alho, P., Uvo, C., Kämäri, M., and Kaartinen, H.: Blueprint for a digital twin of a river basin, EGU General Assembly 2023, Vienna, Austria, 23–28 Apr 2023, EGU23-15057, https://doi.org/10.5194/egusphere-egu23-15057, 2023.

EGU23-16749 | PICO | HS2.3.5

Recent trends on the Bayesian approach for simultaneous recognition of contaminant sources in groundwater resources 

Jürgen Mahlknecht, Juan Antonio Torres-Martinez, and Abrahan Mora

Understanding diffusive pollution plays a key role in providing an appropriate management plan for protecting water resources. Controlling the diffusive contamination in water is hindered by a wide range of source-mixing processes. Accurate source apportionment is required for controlling harmful pollutants in water. Environmental tracers can be used for the source apportionment of pollutants. They inevitably exhibit diverse uncertainties stemming from measurement errors, spatiotemporal variability of sources, biochemical transformation, and dynamic mixing. To reflect the uncertainties involved in source apportionment, a statistical approach, the Bayesian mixing model has been actively adopted. Our contribution presents different recent cases regarding the application of the Bayesian mixing approach to track pollution sources and transformations in agricultural, urban and coastal aquifer environments using multiple isotope approaches (nitrate, sulfate and boron isotopes). The results demonstrate that current Bayesian mixing model studies are mostly limited to understanding the spatiotemporal diversity of water contamination, which is similar to previous deterministic calculations. Considering the nature of these models, which is capable of printing estimation uncertainty, the course of future research should focus on improving the precision of the current designs of source apportionment analysis.

How to cite: Mahlknecht, J., Torres-Martinez, J. A., and Mora, A.: Recent trends on the Bayesian approach for simultaneous recognition of contaminant sources in groundwater resources, EGU General Assembly 2023, Vienna, Austria, 23–28 Apr 2023, EGU23-16749, https://doi.org/10.5194/egusphere-egu23-16749, 2023.

EGU23-1161 | ECS | Orals | HS2.3.6

Modelling global surface water quality under uncertain climate and socio-economic change 

Edward R. Jones, Marc F.P. Bierkens, Peter J. T. M. van Puijenbroek, and Michelle T. H. van Vliet

Human activities greatly impact surface water quality due to the emission of various pollutants associated with different water use sectors (e.g. irrigation, livestock, domestic, energy and manufacturing)1,2. In-stream concentrations are also strongly dependent on the dilution capacity of receiving waters, which is related to both the hydrological regime and surface water abstractions. Pollutant emissions, hydrological regimes and surface water abstractions are all projected to change into the future as a result of both (uncertain) climate change and socio-economic developments. Yet, quantitative projections of future surface water quality are sparse, particularly at the global scale.

In this work, we apply a new high-resolution global surface water quality model (DynQual)3 to project water temperature (Tw) and total dissolved solids (TDS), biological oxygen demand (BOD) and fecal coliform (FC) concentrations for the time period 2005-2100, considering multiple scenarios that combine Representative Concentration Pathways (RCPs) with Shared-Socioeconomic Pathways (SSPs). Input from five general circulation models (GCMs) is used to force PCR-GLOBWB2, the hydrological model coupled to DynQual, to account for the large range of uncertainties inherent in the climatological projections.

The mechanisms that drive patterns in future surface water quality are a complex balance between changes in pollutant emissions, the dilution capacity of streams and in-stream decay processes, which are strongly driven by water temperature, under global change. Patterns of both water quality improvement and deterioration exist, which vary greatly across world regions. Reductions in pollutant emissions across most of Western Europe, North America and East Asia drive trends towards surface water quality improvements, irrespective of climate and socio-economic scenario. Conversely, developing countries are more sensitive to (uncertain) climate and socio-economic changes, with surface water quality typically improving under SSP1-RCP2.6, a mixed response under SSP5-RCP8.5 and strong degradation under SSP3-RCP7.0. Changes to the hydrological cycle are particularly important for surface water quality in the Amazon basin, with substantial reductions in discharge projected under SSP3-RCP7.0 and SSP5-RCP8.5. These changes result in reduced dilution capacities of rivers and thus higher in-stream concentrations, for instance of TDS.

Surface water quality deterioration occurs across Sub-Saharan Africa under all scenarios, albeit to different magnitudes, which substantially increases the number of people that are exposed to poor water quality. Under SSP3-RCP7.0, the “worst-case” scenario for all constituents considered in our study, 4.2 billion people will be exposed to surface water with unsafe levels of organic (BOD) pollution by 2100. With 1.5 billion (36%) of these people located in Sub-Saharan Africa, compared to 290 million (11%) in the historical reference period, we conclude that Sub-Saharan Africa will become the new hotspot of water quality issues.  


References

1. Jones, E. R. et al. Current wastewater treatment targets are insufficient to protect surface water quality. Communications Earth & Environment 3, 221, doi:10.1038/s43247-022-00554-y (2022).

2. van Vliet, M. T. H. et al. Global water scarcity including surface water quality and expansions of clean water technologies. Environmental Research Letters 16, 024020, doi:10.1088/1748-9326/abbfc3 (2021).

3. Jones, E. R. et al. DynQual v1.0: A high-resolution global surface water quality model. Geosci. Model Dev. Discuss. 2022, 1-24, doi:10.5194/gmd-2022-222 (2022).

How to cite: Jones, E. R., Bierkens, M. F. P., van Puijenbroek, P. J. T. M., and van Vliet, M. T. H.: Modelling global surface water quality under uncertain climate and socio-economic change, EGU General Assembly 2023, Vienna, Austria, 23–28 Apr 2023, EGU23-1161, https://doi.org/10.5194/egusphere-egu23-1161, 2023.

EGU23-1721 | ECS | Posters on site | HS2.3.6

Potential variations in groundwater quality for household and irrigation applications as affected by climate change 

Abdulaziz G. Alghamdi, Anwar A. Aly, and Hesham M. Ibrahim

Groundwater quality is being deteriorated as a result of climate change, overuse, and decreased precipitation, consequently impacting both agricultural productivity and human health. Thus, to investigate the potential variations in groundwater quality for irrigation and household applications, groundwater samples were collected from 88 different sites in Sarat Al-Baha region, Saudi Arabia. The Al-Baha region is characterized by a fragile agro-ecosystem, which is extremely susceptible to climate change. The collected samples were subjected to hydrochemical analyses to determine whether groundwater was suitable for irrigation and household consumption. Results showed that concentrations of nitrate and heavy metals were within maximum permissible limits for drinking purposes in 91% of the collected samples. However, because of elevated levels of arsenic and nitrate, 8% of the collected groundwater samples were deemed to be of poor or very poor quality for drinking purposes. The estimated saturation index revealed that the majority of the minerals in the samples were under-saturated, suggesting a higher possiblity of salinity owing to the dissolution of under-saturated minerals, conseqently increasing iron, calcium, magnesium, sodium, chloride, and sulfate concentrations. No sodicity risks were anticipated, despite of medium to higher salinity hazard. More than 90% of the collected groundwater samples had unsatisfactory quality for irrigation purposes due to the presence of salts in higher amounts, which could be due to lower precipitation and higher temperature in the study area. Hence, employing suitable management strategies to maximize groundwater utilization is recommended to avoid further groundwater quality deterioration. Groundwater discharge must be ristricted, cropping patterns should be altered to boost water productivity, and grounwater quality must be monitored on regular basis.

How to cite: Alghamdi, A. G., Aly, A. A., and Ibrahim, H. M.: Potential variations in groundwater quality for household and irrigation applications as affected by climate change, EGU General Assembly 2023, Vienna, Austria, 23–28 Apr 2023, EGU23-1721, https://doi.org/10.5194/egusphere-egu23-1721, 2023.

EGU23-1994 | ECS | Orals | HS2.3.6

Drivers and inter-seasonal trends of nutrient losses from contrasting agricultural river catchments in Ireland and UK 

Golnaz Ezzati, Per-Erik Mellander, Simon Pulley, and Adrian Collins

Current multi-stressor pressures on water quality in agricultural catchments will be exacerbated by the more frequent occurrence of extreme weather events resulting in multi-stressor environments. Managing surface water under future climatic conditions will require adaptations and targeted mitigation strategies that consider individual catchment characteristics. Assessing the impacts of recent extreme weather events can allow for the better understanding of, and insight into, the key drivers of elevated pollutant losses and point to the possible future challenges for water quality management.

As a part of the Irish EPA funded WaterFutures project, changes in the impact of climatic drivers on nutrient losses from field to small stream scale catchments of different typologies are being investigated using long-term and high-frequency water quality datasets. The trends of daily nitrate-N, and phosphorus (TP) concentrations and loads over 11 years were interrogated in two agriculturally-dominated catchments in Ireland, and in both a permanent pasture and arable field in the southwest UK (ca. 0.38– 12 km2). The trends in nutrient losses and the significance of discharge, precipitation, potential evapotranspiration (PET), soil moisture deficit, air temperature, and soil temperature, were investigated using Mann-Kendall Trend and Generalised Additive Model, respectively.

Significant inter-seasonal trends were identified in both countries and similar fluctuations of nutrient concentrations and loads in October and November 2018 were observed following an exceptional summer drought. All study sites responded to daily rainfall exceeding 10mm, although in different ways due to the different site characteristics. The soil and air temperature in the two geographically-close Irish catchments revealed a significant upward trend from June to September. During this period, these two drivers, along with discharge and PET, were key drivers of N-losses in the well-drained and arable dominated catchment. The increasing trend of monthly average N-concentrations were significant in April and November (from 5.6 in 2009 to 8.9 nitrate-N mg L-1 in 2018, Kendall-tau= 0.424). On the other hand, a catchment dominated by poorly-drained grassland showed an increasing trend in TP concentrations during January, May, September, and October (from 0.79 in 2009 to 6.72 TP mg L-1 in 2020, Kendall-tau= 0.455). Here, changes in air temperature, precipitation, and discharge were the key drivers for P losses.

Changing weather patterns, consequent changes in nutrient concentrations and load trends, and precipitation-discharge responses can be detected using long-term water quality records and should be considered for future climate smart mitigation strategies.


How to cite: Ezzati, G., Mellander, P.-E., Pulley, S., and Collins, A.: Drivers and inter-seasonal trends of nutrient losses from contrasting agricultural river catchments in Ireland and UK, EGU General Assembly 2023, Vienna, Austria, 23–28 Apr 2023, EGU23-1994, https://doi.org/10.5194/egusphere-egu23-1994, 2023.

EGU23-2336 | ECS | Posters on site | HS2.3.6

Future coastal water pollution under global change: multi-pollutant modeling 

Ilaria Micella, Carolien Kroeze, and Maryna Strokal

Coastal waters receive multiple pollutants, such as nutrients, plastics, and chemicals. Rivers transport these pollutants often from rural and urban areas to seas. Many pollutants have common sources and cause multiple impacts (e.g., eutrophication and toxicity), decreasing the availability of clean water. Meanwhile, the global change adds to coastal water pollution. For example, cities are expected to expand in size and numbers, increasing future urban pollution. In addition, agriculture may intensify to satisfy the food demand for a growing global population. This intensification may, in turn, increase agricultural pollution in river export to coastal waters. In addition, climate change is expected to result in more floods and droughts. Floods may transport more pollutants from urbanised and agricultural areas to the seas. The effects of global change will likely differ among river basins depending on their characteristics.

Existing scenarios, such as the Representative Concentrative Pathways (RCPs) and Shared Socio-economic Pathways (SSPs), address global change challenges. However, these scenarios have yet to be implemented for a global multi-pollutant assessment of coastal waters. In addition, large-scale assessments of coastal water pollution are often for single pollutants, overlooking synergies and trade-offs in pollution control for multiple pollutants. Sustainable Development Goal (SDG) 14 (clean marine waterways) may be supported by considering multiple pollutants and sources, yet additional research in the field is needed.

Our study aims to better understand the influence of global change on the river export of multiple pollutants to coastal waters by source and sub-basins. To this end, we develop the MARINA-Multi (Model to Assess River Inputs of pollutaNts to the seAs) model for more than 10,000 sub-basins and for nutrients, chemicals, and plastics to estimate future pollution trends. For these pollutants, we consider point (such as sewage systems and open defecation) and diffuse (such as agriculture and improperly managed solid waste on land) sources. Finally, we consider the SGD coastal water quality targets and develop optimistic and pessimistic futures under global change.

Our model results show that, in 2010, more than 50% of the population lived in river basins where coastal waters experienced multi-pollution problems. Rivers exported considerable amounts of nutrients, chemicals, and plastics to coastal waters globally, two-thirds reaching the Atlantic and Pacific seas. Diffuse sources contributed by over 70% to nitrogen and macroplastics in global seas. Point sources contributed by 70- 90% to phosphorus and microplastics in global seas. Multi-pollution hotspots are often found in urbanised areas. Global change will alter those pollution hotspots. First, the pollution patterns are expected to shift due to climate change affecting temperature and the water cycle. Second, changes in socioeconomic drivers are expected. Our optimistic scenarios are associated with, for example, the technological progress that enhances waste collection and treatment. The MARINA-Multi model is useful for understanding the sources and spatial variability of the multiple pollutants in rivers and coastal waters under global change. Our model can support decision-makers and water managers in implementing mitigation and adaptation policies to achieve sustainable targets for the marine environment (SDG 14).

How to cite: Micella, I., Kroeze, C., and Strokal, M.: Future coastal water pollution under global change: multi-pollutant modeling, EGU General Assembly 2023, Vienna, Austria, 23–28 Apr 2023, EGU23-2336, https://doi.org/10.5194/egusphere-egu23-2336, 2023.

Long-term climate change and increased frequency and intensity of hydroclimatic extremes (e.g. droughts, heatwaves, floods) pose serious challenges for water management, not only in terms of water quantity, but also for securing suitable water quality for human use and ecosystems. Recent droughts, heatwaves and floods have been illustrative in showing major challenges due to exceeded water quality thresholds for sectoral use (e.g. inlet stops for drinking water production, irrigation). However, compared to water quantity, a limited number of studies have focused on water quality impacts, which are prevalent in many river basins of the world.

This presentation provides a synthesis of the potential impacts of climate change and extremes (droughts, heatwaves and floods) on global river water quality considering various water quality constituents relevant for different sectoral uses and ecosystems. This synthesis is based on: 1) an extensive literature review of local, regional to global river water quality studies; 2) statistical analyses of water quality monitoring data in various river basins over the last 40 years; and 3) global river water quality projections generated by process-based global water quality models forced with bias-corrected climate change scenarios. Comparison of results over various river basins show overall consistent responses for some general water quality constituents (e.g. water temperature, dissolved oxygen, salinity) due to the predominance of generic mechanisms (e.g. lower dissolved oxygen solubility under warming). However, mixed responses are overall found for nutrients, pathogens and pharmaceuticals due to different counterbalancing mechanisms. In addition, water quality responses vary due to differences in constituent forms (e.g. dissolved vs. particulate nutrient forms) and persistence in surface waters (e.g. for pharmaceuticals). Furthermore, geographic, environmental and socio-economic (e.g. pollution management and infrastructure) conditions conspire, showing substantial impacts on the magnitude of water quality responses under climatic change and extreme events.

How to cite: van Vliet, M. T. H.: River water quality under climate change and extremes: a synthesis of impacts for river basins globally (Invited), EGU General Assembly 2023, Vienna, Austria, 23–28 Apr 2023, EGU23-2361, https://doi.org/10.5194/egusphere-egu23-2361, 2023.

EGU23-3312 | ECS | Posters on site | HS2.3.6

Attribution of climate change imprint on riverine nutrient export from diffuse pollution sources to African coastal waters 

Albert Nkwasa, Celray James Chawanda, and Ann van Griensven

Nutrient pollution derived from anthropogenic activities impacts both inland and coastal waters, altering the aquatic ecosystem and resulting in serious environmental issues. As climate change is affecting most of the hydroclimatic variables across the world, a fundamental concern in river ecology is therefore to understand the degree to which the spatial patterns and variations of nutrient concentration and loading in rivers during the last decades can be associated with climate change. This study detects and attributes the impact of historical climate change on long-term changes in the flux of nutrients from diffuse pollution sources into the coastal waters of Africa. An impact attribution approach is employed by forcing a continental process-based water quality model (Soil and Water Assessment Tool – SWAT+) for Africa with a set of observational and counterfactual climate data from the impact attribution setup of the Inter-Sectoral Impact Model Intercomparison Project (ISIMIP3a). The nonparametric Mann–Kendall test is used to identify trends while long-term mean annual river nutrient simulation differences between a model setup with observational and counterfactual climate data are calculated to allow for quantification of the climate change attribution. Results show spatial differences with climate change reasonably contributing to both an increase and decrease of both riverine Total Nitrogen and Total Phosphorus to African coastal waters. However, the climate change imprint on the riverine nutrient export is starting to emerge within the 21st century years for most rivers. These findings show spatial differences in the sensitivity of impacts of climate on riverine TP and TN export to coastal waters while highlighting the most impacted rivers in Africa.

How to cite: Nkwasa, A., Chawanda, C. J., and van Griensven, A.: Attribution of climate change imprint on riverine nutrient export from diffuse pollution sources to African coastal waters, EGU General Assembly 2023, Vienna, Austria, 23–28 Apr 2023, EGU23-3312, https://doi.org/10.5194/egusphere-egu23-3312, 2023.

EGU23-3700 | ECS | Posters on site | HS2.3.6

Coupling artificial intelligence techniques and remote sensing data for water quality simulation of lakes 

Farkhondeh Khorashadi Zadeh, Saeed Khorashadizadeh, Albert Nkwasa, and Ann van Griensven

Freshwater lakes are a major resource for human populations. To support water quality (WQ) management for lakes, both WQ monitoring and WQ modeling are essential. Conventional approaches, such as process-based models, are usually used for WQ modelling, however, these approaches require a large number of data (meteorological, topographical, hydrological, and WQ data) with high computational demands. Recently, artificial intelligence (AI) techniques are increasingly recommended in WQ modelling to tackle these challenges. In this study, the application of AI techniques for simulating/predicting water quality for large lakes using remote sensing (RS) is investigated. Specifically, the study aims to develop a robust AI model for turbidity in Lake Victoria, using the lake basin precipitation data and the sediment concentrations of the inflow rivers. To develop the AI model, the freely available remote sensing turbidity data for the lake is used as a reference data. Two models using a multi-layer perceptron neural network (MLPNN) and least square support vector regression (LSSVR) have been trained based on three different scenarios. Some performance indices such as mean absolute relative error and percent bias have been selected for model evaluation. According to the obtained results, LSSVR is more accurate than MLPNN in both training and testing phases of all scenarios. The results indicate that AI-based models are potential tools that can be adopted for WQ simulations of large lakes. Additionally, this study illustrates the potential of the use of remote sensing data to support model development, as an alternative to in-situ measurements, especially in data-scarce regions.

Keywords: Water quality, artificial intelligence, remote sensing, sediment concentration, turbidity

How to cite: Khorashadi Zadeh, F., Khorashadizadeh, S., Nkwasa, A., and van Griensven, A.: Coupling artificial intelligence techniques and remote sensing data for water quality simulation of lakes, EGU General Assembly 2023, Vienna, Austria, 23–28 Apr 2023, EGU23-3700, https://doi.org/10.5194/egusphere-egu23-3700, 2023.

EGU23-5239 | Orals | HS2.3.6

Reservoir water quality deterioration due to deforestation emphasizes the indirect effects of global change 

Michael Rode, Xiangzhen Kong, Salman Ghaffa, Maria Determann, Kurt Friese, Seifeddine Jomaa, Chenxi Mi, Tom Shatwell, and Karsten Rinke

Deforestation is currently a widespread phenomenon and a growing environmental
concern in the era of rapid climate change. In temperate regions, it is challenging to
quantify the impacts of deforestation on the catchment dynamics and downstream
aquatic ecosystems such as reservoirs and disentangle these from direct climate
change impacts, let alone project future changes to inform management. Here, we
tackled this issue by investigating a unique catchment-reservoir system with two
reservoirs in distinct trophic states (meso- and eutrophic), both of which drain into the
largest drinking water reservoir in Germany. Due to the prolonged droughts in 2015-
2018, the catchment of the mesotrophic reservoir lost an unprecedented area of forest
(exponential increase since 2015 and ca. 17.1% loss in 2020 alone). We coupled
catchment nutrient exports (HYPE) and reservoir ecosystem dynamics (GOTM-WET)
models using a process-based modelling approach. The coupled model was validated
with datasets spanning periods of rapid deforestation, which makes our future
projections highly robust. Results show that in a short-term time scale (by 2035),
increasing nutrient flux from the catchment due to vast deforestation (80% loss) can
turn the mesotrophic reservoir into a eutrophic state as its counterpart. Our results
emphasize the more prominent impacts of deforestation than the direct impact of
climate warming in impairment of water quality and ecological services to downstream
aquatic ecosystems. Therefore, we propose to evaluate the impact of climate change
on temperate reservoirs by incorporating a time scale-dependent context, highlighting
the indirect impact of deforestation in the short-term scale. In the long-term scale (e.g.
to 2100), a guiding hypothesis for future research may be that indirect effects (e.g., as
mediated by catchment dynamics) are as important as the direct effects of climate
warming on aquatic ecosystems.

How to cite: Rode, M., Kong, X., Ghaffa, S., Determann, M., Friese, K., Jomaa, S., Mi, C., Shatwell, T., and Rinke, K.: Reservoir water quality deterioration due to deforestation emphasizes the indirect effects of global change, EGU General Assembly 2023, Vienna, Austria, 23–28 Apr 2023, EGU23-5239, https://doi.org/10.5194/egusphere-egu23-5239, 2023.

EGU23-6793 | Orals | HS2.3.6

Stress testing the impacts of climate change on water quality permitting across England 

Barry Hankin, Tony Heaney, Paul Eccleston, Paul Simmons, Alex Garratt, and Changgui Wang

This presentation reports on the results of simulating 17 regulatory SIMCAT water quality models for England based on using the CEH Future Flows dataset. The de-biased uplifts were generated across 140 flow gauges comparing 2060-2080 with 2000-2020 for 11 ensembles, and kriged across the country to capture the gradients and apply river reach-specific uplifts in headwater and along-reach flows (for mean and 95 percentile exceedance flows). The resulting uplifts were applied using a recently developed UKWIR workbook and the statistical water quality models were simulated for a range of sanitary and chemical determinands (BOD, ammonia, dissolved oxygen, total and soluble phosphorus, nitrate, PFOS, cadmium and cypermethrin) to assess the potential change to Sewage Treatment Work permits.

Failure of target EQS and 10% deterioration of quality are analysed, computing the necessary adjustment to water quality permits to meet the water quality standards in the future. Ensemble uplifts representative of upper, lower and mid flows were used (focussing on the low flows) and their predicted annual average reduction. The sensitivity of the results to travel time, seasonality and temperature are investigated, and outputs are compared with recent process-based modelling using the EA HYPE model of England.

How to cite: Hankin, B., Heaney, T., Eccleston, P., Simmons, P., Garratt, A., and Wang, C.: Stress testing the impacts of climate change on water quality permitting across England, EGU General Assembly 2023, Vienna, Austria, 23–28 Apr 2023, EGU23-6793, https://doi.org/10.5194/egusphere-egu23-6793, 2023.

Lake chlorophyll-a (Chl-a) is one of the important components of the lake ecosystem. The Chl-a concentration of global water has generally increased in recent decades due to climate change and intensified anthropogenic activity. However, few researches have been done on the lake Chl-a variations in remote areas with less disturbance by human activities such as the Tibet Plateau (TP). Here, we combined 95 in situ measured lake Chl-a concentration data and Landsat reflection spectrum to establish an inversion model of Chl-a concentration through the backpropagation (BP) neural network prediction method, by which the mean annual Chl-a concentration in the past 35 years (1986–2021) of 318 lakes with an area of > 10 km2 in the TP have been retrieved. Meteorological and hydrological data, measured water quality parameters and glacier change in the lake basin were used to elucidate the driving factors of the Chl-a concentration changes in the TP lakes, with the help of geographic information system (GIS) technology and by spatial statistical analysis. The results showed that the mean annual Chl-a in the 318 lakes performed overall decrease during 1986-2021, but 63%, 32% and 5% of the total number exhibited no significant change, significant decrease and significant increase, respectively. After a slight increase during 1986–1995 (0.05 μg/L/y), the mean annual lake Chl-a significantly decreased during 1995–2004 (–0.18 μg/L/y). Further, after a slight increase during 2004–2011 (0.07 μg/L/y), it decreased slightly during 2011–2021 (–0.04 μg/L/y). The mean annual lake Chl-a concentration was significantly negatively correlated with precipitation (R2 = 0.48, P < 0.01), air temperature (R2= 0.31, P < 0.01), lake surface water temperature (LSWT) (R2 = 0.51, P < 0.01), lake area (R2= 0.42, P < 0.01) and lake water volume change (R2 = 0.77, P < 0.01). The decrease in mean annual Chl-a was in consistant to the decrease in that of salinity (R2= 0.69, P < 0.01) and increase in that of transparency (R2= 0.55, P < 0.01). The Chl-a concentrations of non-glacial meltwater-fed lakes were higher than those of glacial meltwater-fed lakes, except during higher precipitation period. Our result of lake Chl-a inversion and their variation reason analyses is able to further deeply understand the climate change impacts on Chl-a changes in the TP lakes.

How to cite: Zhu, L., Pang, S., Liu, C., and Ju, J.: The decreasing Chlorophyll-a in Tibet Plateau lakes during 1986–2021 based on Landsat image inversion and their impact causes, EGU General Assembly 2023, Vienna, Austria, 23–28 Apr 2023, EGU23-6888, https://doi.org/10.5194/egusphere-egu23-6888, 2023.

EGU23-7260 | ECS | Posters on site | HS2.3.6

Modelling the efficacy of catchment remediation measures for reducing sediment & nutrient exports under future climate trajectories 

Maarten Wynants, Lukas Hallberg, and Magdalena Bieroza

The European Green Deal has the ambition to reduce nutrient losses from agricultural catchments with 50%. In the context of a changing climate, there is an increasing need to evaluate the efficacy of catchment remediation measures and reduction in fertilisation. In this study, we set-up a daily discharge and nutrient load model for two Swedish agricultural headwater catchments using Hydrological Predictions for the Environment (HYPE). The daily model was calibrated and validated using high-frequency sensor data and flow-proportional samples analysed for nutrient and sediment concentrations. Multiple catchment remediation scenarios were run under three downscaled climate models and three Representative Concentration Pathways (RCP 2.6, RCP 4.5, and RCP 8.5). The model predicted that Inorganic Nitrogen loads will decrease in the latter half of the 21st century under RCP 4.5 and RCP 8.5 driven by increased denitrification under higher temperatures. Moreover, under all RCPs, an increase in Particulate Phosphorous and sediment loads is forecasted due to increased rainfall intensity. Decreasing the amount of mineral fertilisation only resulted in decreased Inorganic Nitrogen loads, but had no effect on Total Phosphorous loads. Catchment remediation measures were most effective for reducing Total Phosphorous loads. However, large portions of agricultural catchments will need to be converted to floodplains or wetlands in order to achieve significant load reductions and offset the predicted increases under future climatic trajectories.

How to cite: Wynants, M., Hallberg, L., and Bieroza, M.: Modelling the efficacy of catchment remediation measures for reducing sediment & nutrient exports under future climate trajectories, EGU General Assembly 2023, Vienna, Austria, 23–28 Apr 2023, EGU23-7260, https://doi.org/10.5194/egusphere-egu23-7260, 2023.

EGU23-7565 | Posters on site | HS2.3.6

Recent advancement in water quality indicators for eutrophication in global freshwater lakes 

Keerthana Suresh, Ting Tang, Michelle T.H. van Vliet, Marc F.P. Bierkens, Maryna Strokal, Florian Sorger-Domenigg, and Yoshihide Wada

Excessive nutrient (nitrogen and phosphorus) loadings to freshwater lakes cause eutrophication, which is a global water quality issue. Anthropogenic activities in lake basins emit nutrients, either as point- (e.g., sewage) or diffuse sources (e.g., agricultural runoff). Their typical impacts on lake water quality include the occurrence of harmful algal blooms, hypoxia and fish kills. These impacts are likely to worsen due to climate change, population growth and economic development. The response of lakes to a change in nutrient inputs depends on their interactions with the climate, land-use, hydrology and socio-economic conditions of a lake basin. These feedback mechanisms, however, are not often included in the eutrophication assessments for lakes. In this study, we present a new causal network of the drivers-pressure-state-impact-response (DPSIR) framework using a total of 58 sub-indicators to characterize all the DPSIR elements and systematically conceptualize the complex interactions of nutrients in freshwater lake basins. The network provides a holistic perspective on nutrient dynamics of multiple indicators and their interactive effects on water quality in lake basins, which is key to improving water quality management. Furthermore, we disentangle the complex eutrophication mechanisms using drivers and pressures, that represent different sources and nutrient pathways. The study highlights coupling of lake systems in water quality modeling frameworks and assessments which is required to understand its impact on water quality from human activities in the basin. The drivers and pressures can be used as proxies to provide meaningful information on nutrient emissions and biogeochemical pathways, that can fill the gap in water quality monitoring data, especially in data scarce regions such as Asia and Africa. These indicators can be used to set realistic water quality targets, and are, therefore, beneficial in long-term policy making and sustainable water quality management.

How to cite: Suresh, K., Tang, T., T.H. van Vliet, M., F.P. Bierkens, M., Strokal, M., Sorger-Domenigg, F., and Wada, Y.: Recent advancement in water quality indicators for eutrophication in global freshwater lakes, EGU General Assembly 2023, Vienna, Austria, 23–28 Apr 2023, EGU23-7565, https://doi.org/10.5194/egusphere-egu23-7565, 2023.

EGU23-7598 | ECS | Posters on site | HS2.3.6

Joint temporal trends in river discharge and temperature over the past 57 years in a large European basin: implications for diadromous fish 

Hanieh Seyedhashemi, Hilaire Drouineau, Anthony Maire, and Florentina Moatar

Stream temperature and discharge are two fundamental triggers of key periods of the life cycle of aquatic organisms such as the migration of diadromous fish. However, the increase in stream temperature, more frequent and severe droughts, and asynchronous evolution of stream temperature and discharge due to climate change can modify the duration and frequency of favorable temperature-flow associations for the realization of species’ ecological processes.

In this study, we investigated the influence of changes in favorable temperature-flow velocity associations for the upstream migration of Atlantic salmon, Alis shad and Sea lamprey at the scale of the Loire River basin ( km²). First, we used a physically-based thermal model (T-NET), coupled with a semi-distributed hydrological model (EROS) to reconstruct continuous daily times series over the 1963-2019 period (Seyedhashemi et al., 2022). Current velocity (V) was estimated using discharge through a hydraulic geometry model (Morel et al., 2020). We identified suitable water temperature-flow velocity associations for the migration of the three studied species based on (1) the literature and (2) observed migration recorded at fish passage stations. Using the “Choc method” (Arevalo et al., 2020), we then quantified the changes in frequency of occurrence of these suitable environmental windows over the past six decades across the hydrographic network of the Loire River basin.

Our results showed that the greatest increases in stream temperature were associated with the greatest decreases in flow velocity over the past six decades. We also found that the frequency of suitable temperature-velocity associations for upstream migration of Atlantic salmon has significantly reduced, mainly in the southern part of the basin. In contrary, the frequency of suitable associations for upstream migration of the two other species has mainly increased.

These results highlighted strong disparities in the consequence of global changes on fish migratory processes among species and in space. This work provides operational results for the management of these threatened diadromous species and the prioritization of management measures in a context of climate change.

Key words: climate change, hydrological change, water temperature, temporal trends, fish migration, long-term, large scale, Loire basin


Seyedhashemi, H., Vidal, J.P., Diamond, J.S., Thiéry, D., Monteil, C., Hendrickx, F., Maire, A. and Moatar, F., 2022. Regional, multi-decadal analysis on the Loire River basin reveals that stream temperature increases faster than air temperature. Hydrology and Earth System Sciences, 26(9), pp.2583-2603.

Morel, M., Booker, D.J., Gob, F. and Lamouroux, N., 2020. Intercontinental predictions of river hydraulic geometry from catchment physical characteristics. Journal of Hydrology, 582, p.124292.

Arevalo, E., Lassalle, G., Tétard, S., Maire, A., Sauquet, E., Lambert, P., Paumier, A., Villeneuve, B. and Drouineau, H., 2020. An innovative bivariate approach to detect joint temporal trends in environmental conditions: Application to large French rivers and diadromous fish. Science of the Total Environment, 748, p.141260.

How to cite: Seyedhashemi, H., Drouineau, H., Maire, A., and Moatar, F.: Joint temporal trends in river discharge and temperature over the past 57 years in a large European basin: implications for diadromous fish, EGU General Assembly 2023, Vienna, Austria, 23–28 Apr 2023, EGU23-7598, https://doi.org/10.5194/egusphere-egu23-7598, 2023.

EGU23-7683 | Orals | HS2.3.6

Evolution of discharge and stream temperature from past to future in a large European River basin 

Florentina Moatar, Hanieh Seyedhashemi, Jean-Philippe Vidal, Jacob Diamond, Dominique Thiery, Frédéric Hendrickx, and Anthony Maire

Both discharge (Q) and stream temperature (Tw) are the key factors affecting water quality and the suitability of instream habitats, which are expected to experience substantial evolutions due to climate change. However, the absence of continuous and long-term data of Tw at a large scale limits our understanding of the spatio-temporal variations of Tw and their control factors, like riparian vegetation, strahler order, hydroclimate.

The present study used a physically-based thermal model (T-NET), coupled with a semi-distributed hydrological model (EROS) using SAFRAN meteorological reanalysis data provided of Météo-France to reconstruct past daily Q and Tw over the 1963-2019 period for 52 000 hydrographic reaches of the Loire basin (100 000 km²), France. Three regionalized climate projections under several future emissions scenarios (available on the DRIAS portal: www.drias-climat.fr) were used to project future daily time series of these variables over the 2005-2100 period.

The results over the 1963-2019 period showed that the increase of the Tw was higher than those air temperature (Ta) in spring, summer and autumn for the majority of the reaches of the basin. Indeed, Tw increased for almost all reaches and all seasons (average = +0.38°C/decade) with the largest increase in the spring (Mar-May) (range=+0.11 to +0.76°C per decade) and in summer (Jun-Aug) (+0.08 to +1.02°C per decade). Highest spring and summer increases were generally found in the south of the basin (Massif Central and Limousin plateau) and in higher Strahler order where a larger increase in Ta (up to 0.67 °C/decade) and a larger decrease in Q (up to -16%/decade) occurred jointly.  

Depending on climate models, scenarios and seasons,future projections showed changes in seasonal flow and water temperature. Seasonal median flow over the basin would be between -40% and +35% for the middle of the 21st century (2040-2079) compared to the 1990-2019 period. For the end of the century (2070-2099), flow change would be between -53% and +73%. A clear increase in future Tw was also found with seasonal  median increases of +0.7 to +2.7°C in the middle (2040-2079) and of +0.8°C to +5.0°C,  at the end of the century (2070-2099).

These climate-induced changes in Q and Tw could help us to explain shifts in the phenology and geographical distribution of cold-water species. Moreover, they highlight that we should take vital actions for both adaptation and mitigation strategies. In this regard, we found that some of these climate change-induced impacts on Tw can be mitigated through the restoration and maintenance of riparian shading specially in small streams.

How to cite: Moatar, F., Seyedhashemi, H., Vidal, J.-P., Diamond, J., Thiery, D., Hendrickx, F., and Maire, A.: Evolution of discharge and stream temperature from past to future in a large European River basin, EGU General Assembly 2023, Vienna, Austria, 23–28 Apr 2023, EGU23-7683, https://doi.org/10.5194/egusphere-egu23-7683, 2023.

EGU23-11247 | ECS | Posters on site | HS2.3.6

Modeling the impacts of climate change on streamflow and nitrate export in a Mediterranean agricultural watershed in Spain 

Brian Omondi Oduor, Miguel Ángel Campo-Bescós, Noemí Lana-Renault, and Javier Casalí

Nitrate pollution adversely affects water quality, making it unsafe for human consumption and contributing to increased eutrophication. Nitrate exportation in agricultural areas is inevitable; however, climate change introduces great uncertainty into an already very complex problem. Thus estimating the effects of climate change on streamflow and nitrate dynamics would significantly contribute to the management of the affected areas. This research aimed to predict the impacts of climate change on streamflow and nitrate exportation in a Mediterranean rainfed agricultural watershed using the Soil Water Assessment Tool (SWAT). The model was first evaluated for its suitability to simulate streamflow and nitrate loads under rainfed agricultural conditions in the 477 km2 Cidacos River Watershed in Navarre, Spain. The model was then used to analyze the climate change impacts on streamflow and nitrate load in the short-term (2011-2040), medium-term (2041-2070), and long-term (2071-2100) climate projections compared to a historical baseline period (1971-2000) using the RCP4.5 and RCP8.5 CO2 emission scenarios. The model evaluation showed a good model performance during calibration (2000-2011) and validation (2011-2020) for streamflow (NSE = 0.82/0.83) and nitrates load (NSE = 0.71/0.68), indicating its suitability for adoption in the watershed. The climate change projection results showed a steady decline in streamflow and nitrate load for RCP4.5 and RCP8.5 in all the projections, with the long-term projection scenario of RCP8.5 significantly affected. Autumn and winter saw the greatest seasonal declines compared to spring and summer. The decline in streamflow was attributed to the projected decrease in precipitation and increase in actual evapotranspiration due to increasing temperatures, while the nitrate load decline was consistent with the projected streamflow decline. Based on these projections, the long-term projection scenarios of RCP8.5 indicate severe situations requiring urgent policy changes and management interventions to minimize and mitigate the negative consequences. Therefore, better agricultural management practices are needed to ensure sustainable water resource utilization and efficient nitrogen fertilizer application rates in the watershed to reduce pollution.

How to cite: Oduor, B. O., Campo-Bescós, M. Á., Lana-Renault, N., and Casalí, J.: Modeling the impacts of climate change on streamflow and nitrate export in a Mediterranean agricultural watershed in Spain, EGU General Assembly 2023, Vienna, Austria, 23–28 Apr 2023, EGU23-11247, https://doi.org/10.5194/egusphere-egu23-11247, 2023.

The increase of human interventions and developments is modifying the land use/land cover (LULC) of the global landscape, thus affecting the water quality of rivers and lakes severely. Lake Titicaca and Lake Nicaragua (also known as Lake Cocibolca) are the largest lakes in Latin America. Despite Bolivia and Nicaragua being countries with a vast richness of natural resources, they face unsustainable practices ranging from over-exploitation of resources to drastic LULC changes that have created environmental problems that consequently affect human well-being and health. Additionally, climate change (CC) is exacerbating these problems and causing new ones. Therefore, it is also necessary to consider the effects that it will have on water quality, either by changes in temperature or by changes in precipitation (floods or droughts) that affect river flows and sediment transport.

Environmental sustainability means securing adequate management of natural resources in all human productive and livelihood activities. Monitoring and assessing the quality of surface waters are fundamental for managing and ensuring the improvement of its state. A good understanding of the LULC change and CC dynamics is crucial to develop efficient strategy assessment, pollution management, and land use planning for the promotion of sustainable development. For these case studies, the integrated use of remote sensing products; especially considering the scarcity of data, enables a comprehensive understanding of the cause-effect relations in the water system, which assists policymakers in developing management plans for a variety of natural resource management applications.

How to cite: Baltodano Martínez, A. and van Griensven, A.: How remote sensing can identify land cover and climate change impacts on lake water quality: Lake Nicaragua and Lake Titicaca case studies., EGU General Assembly 2023, Vienna, Austria, 23–28 Apr 2023, EGU23-11416, https://doi.org/10.5194/egusphere-egu23-11416, 2023.

EGU23-12024 | Orals | HS2.3.6

Towards realizing the EU 2050 Zero Pollution Vision for Nitrogen Export 

Rohini Kumar, Tam V. Nguyen, Fanny J. Sarrazin, Pia Ebeling, Christian Schmidt, Arthur Beusen, Lex Bouwman, Jan H. Fleckenstein, Sabine Attinger, and Andreas Musolff

The European Union has adopted an ambitious long-term, zero pollution vision for 2050  aiming for EU’s  “air, water and soil pollution to be reduced to levels no longer considered harmful to health and natural ecosystems …” [1]. However, the extent to which such a goal can be realistically realized for legacy contaminants like nitrogen (N) is not yet properly understood. Herein, we provide a comprehensive assessment of nitrogen retention and export across the European landscapes to receiving waterbodies using a suite of climate, hydrology, and future socioeconomic scenarios. We establish a chain of hydroclimate and nitrogen export scenarios, comprising climate simulations from global climate models (CMIP) under different emission pathways (RCPs) and shared socioeconomic pathways (SSPs) to force a coupled hydrology and water quality model (mHM-N [2]) that characterizes the N retention and export dynamics over the period 1971-2070. SSPs consider balancing options for agricultural land management and technical innovations, taking into account future food, economic growth, and environmental demands; and provide N input trajectories from both diffuse (agricultural) and point (wastewater) sources. Our analysis shows a higher degree of improvement with substantially lower N levels in all European surface water bodies by the 2050s, compared to current levels (2010s). Eastern European rivers may benefit from technological improvements by reducing point source inputs, while in the Western European region, lower N levels can be noticed due to a reduction in diffuse N inputs. Despite these improvements, there are areas of concern where some European water bodies may still suffer from N levels exceeding critical thresholds (e.g., 2-3 mg N/l) in 2050. This may be related to continued N exports that slowly deplete legacy storages (e.g., soil and groundwater). Overall, this requires more proactive measures, particularly aiming at reducing N inputs while harvesting/utilizing and attenuating the built-up storage, to achieve the zero-pollution goal.

References

[1] https://environment.ec.europa.eu/strategy/zero-pollution-action-plan_en

[2] https://doi.org/10.1029/2008WR007327; https://doi.org/10.1029/2022GL100278

How to cite: Kumar, R., V. Nguyen, T., J. Sarrazin, F., Ebeling, P., Schmidt, C., Beusen, A., Bouwman, L., H. Fleckenstein, J., Attinger, S., and Musolff, A.: Towards realizing the EU 2050 Zero Pollution Vision for Nitrogen Export, EGU General Assembly 2023, Vienna, Austria, 23–28 Apr 2023, EGU23-12024, https://doi.org/10.5194/egusphere-egu23-12024, 2023.

EGU23-14799 | Orals | HS2.3.6

Precipitation driven river catchment changes - how the climate models determine the results (the example from Polish Carpathians) 

Agnieszka Wypych, Paweł Wilk, Ewa Szalińska, and Paulina Orlińska-Woźniak

Precipitation is one of the essential driving factors of natural processes influencing the structure and functioning of river catchment ecosystems. Changes in precipitation conditions have a significant impact on surface runoff and consequently the intensity of sediment transport, and its deposition especially in mountain catchments exposed to frequent rainfalls and prone to erosion. Therefore, insightful information about future precipitation regional projections seems to be crucial for ecosystem services management, including dammed reservoirs and fresh water resources.

In general, precipitation is projected to change its annual structure over Central Europe in relation to enhanced atmospheric moisture, moisture convergence and extratropical cyclone activity. Although new generations of climate models focus on improved simulation of water cycle, precipitation projections still become a challenge as key processes driving precipitation changes at local and hemispheric scale remain significantly sensitive to model resolution.

The aim of the study is to indicate the differences between particular precipitation projections for the exemplary Carpathian mountains catchment (Raba River, Poland) and their further evaluation   towards the impact of the chosen climate model on the environmental modelling results (sediment load variability). The outcomes of High Resolution Model Intercomparison Project (HighResMIP) - CMIP6 and higher-resolution regional data for Europe from the Coordinated Regional Climate Downscaling Experiment (EURO-CORDEX) will be taken into account. Absolute and relative changes in annual precipitation structure will be examined for the whole period of 2026-2100 with short-term (2026-2050) and long-term (2051-2100) perspectives.

The research conducted so far revealed that both sediment yields from the exemplary catchment and the sediment loads from the studied river could be greatly altered due to the predicted changes in precipitation and temperature. Since such changes can have a pronounced impact on vital ecological processes ongoing in the catchment the utmost attention should be paid to assessment of differences between climate change scenarios applied in such studies. 

How to cite: Wypych, A., Wilk, P., Szalińska, E., and Orlińska-Woźniak, P.: Precipitation driven river catchment changes - how the climate models determine the results (the example from Polish Carpathians), EGU General Assembly 2023, Vienna, Austria, 23–28 Apr 2023, EGU23-14799, https://doi.org/10.5194/egusphere-egu23-14799, 2023.

EGU23-16167 | ECS | Posters on site | HS2.3.6

Including water quality in the water-energy-food nexus: An Upper White Nile case study 

Annika Schlemm, Mark Mulligan, and Ann van Griensven

The Upper White Nile basin plays a critical role in supporting essential ecosystem services and the livelihoods of millions of people in East Africa. The basin has been exposed to tremendous environmental pressures following extensive population growth, urbanisation, and land use change, all of which are compounded by the threats posed by climate change. The water-energy-food (WEF) nexus provides an integrated solution to sustainable development by minimising the trade-offs between water, energy, and food resources. We apply quantitative and qualitative methods to understand the most pressing WEF nexus challenges within the Upper White Nile basin, how these can be represented in indicators, and how existing WEF nexus modelling tools could address this. This research combines semi-structured stakeholder interviews with a Co$tingNature analysis in order to map the greatest environmental pressures within the basin and disentangle the likely drivers. The findings from these highlight the importance of declining water quality, aquatic and terrestrial ecosystem health, and fish populations as a result of deforestation, growing human population, intensifying pollution, and increasing agricultural intensity within the basin, with most stakeholders expressing concerns for the uncertain impacts from climate change. Furthermore, a review of current WEF nexus modelling tools reveals how existing tools are insufficient in addressing the most pressing environmental challenges within the basin, with a significant gap regarding the inclusion of nuanced water quality and aquatic ecosystem indicators. Subsequently, these findings are combined in order to guide the development of holistic WEF nexus indicators that have the potential to spatially model the trade-offs within the WEF nexus in the Upper White Nile basin under climate change and land use change scenarios. This work demonstrates the use of a novel decision framework for WEF nexus indicator development, which ensures that outputs are fit-for-purpose and respond to the actual needs of stakeholders and policymakers. The outputs aim to strengthen water management decisions that enhance water quality, energy production, food production, and aquatic biodiversity within the Upper White Nile basin.

How to cite: Schlemm, A., Mulligan, M., and van Griensven, A.: Including water quality in the water-energy-food nexus: An Upper White Nile case study, EGU General Assembly 2023, Vienna, Austria, 23–28 Apr 2023, EGU23-16167, https://doi.org/10.5194/egusphere-egu23-16167, 2023.

HS2.4 – Hydrologic variability and change at multiple scales

EGU23-2989 | ECS | Posters on site | HS2.4.1

A framework for attributing runoff changes based on a monthly water balance model: An assessment across China 

Yufen He, Hanbo Yang, Ziwei Liu, and Wencong Yang

During the last decades, significant changes in runoff (Q) have been reported in many regions, and attributing the changes is of great significance for water resource management. The conventionally used elasticity method based on the Budyko hypothesis neglects the impacts of climate seasonality on annual Q change (ΔQ), and it is not yet well understood how the climate change and anthropogenic activities influence seasonal Q. Therefore, we propose a framework based on the ABCD model to explicitly identify the effects of climate change and anthropogenic disturbance on annual and seasonal ΔQ, and further apply it in 191 catchments across China from 1960 to 2000. The trend in annual Q exhibits a significant (α= 0.05) decreasing trend in most northern catchments and increasing trend in some catchments of the lower reaches of Yangtze River and Southeast Basin. The trend in seasonal Q in the northern catchments shows decreasing trend during all seasons, while most in the southern catchments shows increasing trend especially in summer. Regarding the causes for annual ΔQ, climate change has positive and negative effects in 60 % and 40 % catchments, respectively, and is the dominant factor in the catchments of the Yangtze River Basin, Southeast Basin and Pearl River Basin. Human activities have positive and negative effects in 20 % and 80 % catchments, respectively, and are the dominant factor in north China. Precipitation is the dominant climatic driver in 72 % catchments. For the causes for seasonal ΔQ, climate change increases Q in southeastern catchments during all seasons, while it decreases Q in northern catchments during autumn and winter. Human activities decrease Q in more than half of the catchments except in winter. The climate seasonality cannot be ignored and our proposed framework is superior to the elasticity method in capturing the impacts of climate seasonality on ΔQ. The elasticity method causes more than 5 % deviation of the contribution ratio of climate change to ΔQ in 48 catchments. In addition, this framework is reliable on multi-annual timescales and provides important reference for water resource management.

How to cite: He, Y., Yang, H., Liu, Z., and Yang, W.: A framework for attributing runoff changes based on a monthly water balance model: An assessment across China, EGU General Assembly 2023, Vienna, Austria, 23–28 Apr 2023, EGU23-2989, https://doi.org/10.5194/egusphere-egu23-2989, 2023.

EGU23-3535 | ECS | Orals | HS2.4.1

Local vs regionalised deep learning models for groundwater level simulations in the Seine basin. 

Sivarama Krishna Reddy Chidepudi, Nicolas Massei, Abel Henriot, Abderrahim Jardani, and Delphine Allier

This study aims to investigate the use of deep learning techniques, with or without data pre-processing for simulating groundwater levels. Two approaches are compared: (1) a single (local) station approach, where a separate model is trained for each station, and (2) a multi-station approach, where a single model is trained using data from multiple stations in the study area. In the latter approach, static catchment attributes and dynamic meteorological (precipitation and temperature) and climate (sea level pressure, etc) inputs are used to model groundwater levels in the Seine basin. By including static variables corresponding to (hydro)geological or geomorphologic watershed characteristics in the deep learning model, we aim to improve the accuracy of simulations and better understand the factors that influence groundwater levels in the Seine basin. Additionally, we are assessing the potential of using MODWT as a pre-processing method in both approaches. For both single-station and multi-station approaches, without including static variables, results show that MODWT pre-processing helps the models in extracting the relevant information which in turn improves the simulations. Additional ongoing works are being conducted including static/watershed characteristics to assess whther these could help improving the modeling results.

How to cite: Chidepudi, S. K. R., Massei, N., Henriot, A., Jardani, A., and Allier, D.: Local vs regionalised deep learning models for groundwater level simulations in the Seine basin., EGU General Assembly 2023, Vienna, Austria, 23–28 Apr 2023, EGU23-3535, https://doi.org/10.5194/egusphere-egu23-3535, 2023.

Rainfall on an infiltrating microcatchment or hillslope will trigger overland flow, if it is long and intense enough. It is, naturally, of interest to know, what 'enough' means in quantitative terms, i.e. with respect to a given soil and an intensity-duration-frequency (IDF) relationship of selected return interval.

Fully impervious surfaces excepted, an initial phase of the process exists, during which detention storage will be filled and water infiltrates into the soil. The end of that phase (if any) marks the lower limit to the overland flow generating rainfall 'window'. Further to the right of the IDF-curve longer events causing overland flow follow, until a point is reached, where no more overland flow forms, this time because the rainfall intensity has become too low to overcome infiltration. The interval between these two end points has been termed the 'rainfall window'. A closed form expression for its length is given subsequently, and its response to rainfall events subject to Clausius-Clapeyron scaling will be discussed. 

An IDF relationship of the form

is assumed, with r the rainfall intensity, td the storm duration and f the Clausius-Clapeyron scaling factor (parameters s = 0.0597 m and  b = 540 s in the examples below). Using a Green-Ampt type infiltration model and assuming p = 1, the following closed form expression has been derived:

with Ksv vertical saturated permeability and Sav averaged suction at the wetting front.

The Clausius-Clapeyron relationship, i.e. a 7% increase in rainfall depth per additional degree centigrade of warming, may yield an order of magnitude of what to expect from climate change. Here, f = 1.07 will be assumed for 1 K increase in temperature, and f = 1.14 for 2 K.

The examples given here use a present-day IDF relationship of 20 years' return interval (roughly valid in the Austrian Alps) and initial loss of 0.5 mm. The rainfall window was computed using soil data from Columbia sandy loam, Guelph loam and Ida silt loam. Future warming was assumed as 1.0 and 2.0 K, resp.

In the case of the most pervious soil of the three (Columbia sandy loam, vertical saturated permeability Ksv = 0.0139 mm/s) the (short) rainfall window showed a length of 22 min (present), 27 min (1 K warming) and 31 min (2K), an increase of 22% and 43%, resp.

The 'medium' soil, Guelph loam (Ksv = 0.00367 mm/s), started from a window length of 109 min (present), rising to 123 min and 138 min for 1K and 2K resp. (increases of 13% and 26%).

In case of the finest soil, Ida silt loam (Ksv = 0.000292 mm/s), the overland flow generating window of rainfall was longest and amounted to 44 h (present), 48 h (1K: 9% increase) and 52 h (17% increase).

In conclusion it may be stated that notable increases in the overland flow generating rainfall window are to be expected due to future warming. Overland flow events tend to become more frequent as more storms will qualify as triggers.

How to cite: Schmid, B.: How does the 'window' of overland flow generating rainfall react to Clausius-Clapeyron scaling?, EGU General Assembly 2023, Vienna, Austria, 23–28 Apr 2023, EGU23-3659, https://doi.org/10.5194/egusphere-egu23-3659, 2023.

EGU23-3708 | Posters on site | HS2.4.1

Development of Dynamic Drought Vulnerability Assessment Considering Global Climate Change and Regional Water Demand-Supply Networks 

Tae-Woong Kim, Min Ji Kim, Jang-Gyeong Kim, and Jiyoung Yoo

Globally, drought affects different types of regions and countries, making it one of the most devastating natural disasters in terms of impacts on agriculture and food security, ecosystems, human health, and water resources. As the importance of integrated drought management including disaster risk reduction, climate change adaptation strategies, and national water policies is emphasized internationally, it is important to develop an effective water management technology for proactive drought response rather than reactive drought management to cope with drought disaster. In this study, we propose an approach to dynamic drought vulnerability assessment that can be used to secure elasticity for water demand and supply during drought event and further respond to a preemptive drought. Drought response and management based on this dynamic drought vulnerability assessment technology has consistency in that it promotes an internationally pursued convergence strategy for climate change adaptation and disaster risk reduction. The dynamic drought vulnerability assessment is based on the water demand-supply linkage assessment in various types of droughts. In other words, this is a technology for improving the ability to respond to drought through flexible water supply in the actual drought events. Dynamic drought vulnerability assessment produces various types of drought vulnerability map considering various scenarios of drought occurrence and socio-economic pathways according to climate change. For example, when combining hydrological drought scenarios considering climate change (25 types), water demand scenarios according to social/economic/environmental changes (3 types), water supply scenarios of drought damage/sensitivity by region (4 types), storage ratio scenarios of dam and reservoir (12 types), at least 2100 scenarios are produced as database. In the future, these results can be used as a basis for scientific decision-making in preparing countermeasures to improve resilience to drought.

Acknowledgement: This work was supported by the Korea Environment Industry & Technology Institute (KEITI) through Water Management Innovation Program for Drought (No. 2022003610001) funded by Korea Ministry of Environment.

How to cite: Kim, T.-W., Kim, M. J., Kim, J.-G., and Yoo, J.: Development of Dynamic Drought Vulnerability Assessment Considering Global Climate Change and Regional Water Demand-Supply Networks, EGU General Assembly 2023, Vienna, Austria, 23–28 Apr 2023, EGU23-3708, https://doi.org/10.5194/egusphere-egu23-3708, 2023.

EGU23-3771 | Posters on site | HS2.4.1

Lagged correlation between soil water content and evapotranspiration along recent decades and across different land cover types of Europe 

Mehdi Rahmati, Alexander Graf, Bagher Bayat, Carsten Montzka, Christian Poppe, Jan Vanderborght, Harrie-Jan Hendricks-Franssen, and Harry Vereecken Harry Vereecken

The link between soil water content (SWC) and evapotranspiration (ET) is of great importance in ecohydrology, agroecosystem management, and land-atmosphere interaction of earth-system analysis. There is still a need to understand the key processes linking SWC and ET in different vegetated ecosystems, especially at larger scales. Therefore, in this work, we used wavelet coherence analysis to explore the long-term relationship between SWC and ET among the predominant land use types (cropland, evergreen needleleaf forest, mixed forest, open shrubland, wooden tundra, grassland, and mixed tundra) in Europe during the last four decades (1980-2020). To this end, first a principal component analysis was performed among the SWC and ET data from GLDAS, GLEAM, and ERA5-land, and the first component was then used for further analyses when the target variable was in demand. Using the first component, then, we averaged SWC and ET data over the pixels covered by each land use type. Then, for each land-use types, we averaged the data daily for each decade to account for a representative decadal year of daily data. Then, wavelet coherence analysis was conducted between those averaged data of SWC and ET for each land-use type. The results showed a negative correlation between ET and SWC for all land use types, with ET lagging behind SWC, with an average phase shift value of 134 days for grassland (the minimum) and 168 days for mixed tundra (the maximum). Converting the phase shift values to a time lag [lag = n/2 - phase shift for the case phase shift < -n/4 where n represents the period (1/frequency) of the signals] shows (Fig. 1) that ET controls SWC with a lag of 15 days in mixed tundra (the minimum) and 48 days in grassland (the maximum). Moreover, we applied Mann-Kendall trend analysis test and found that the lag between SWC and ET decreases in mixed and wooden tundras with a slope value of -2.4 days/year, while it increases in cropland and grassland with a slope value of 1.6 days/year. Although there is a significant downward trend in evergreen needleleaf forests (with a slope value of -0.3 days/year) and an increasing trend in mixed forests and open shrublands (with a slope value of 0.4 days/year), the lower slope values in these land use types indicate that the change is slower compared to grasslands, croplands, and tundras.


Figure 1- Temporal evolution of the lag between soil water content and evapotranspiration in the annual cycle in different land use types in Europe 

How to cite: Rahmati, M., Graf, A., Bayat, B., Montzka, C., Poppe, C., Vanderborght, J., Hendricks-Franssen, H.-J., and Harry Vereecken, H. V.: Lagged correlation between soil water content and evapotranspiration along recent decades and across different land cover types of Europe, EGU General Assembly 2023, Vienna, Austria, 23–28 Apr 2023, EGU23-3771, https://doi.org/10.5194/egusphere-egu23-3771, 2023.

EGU23-4242 | Orals | HS2.4.1

Projected Changes in Peak Discharge Across the Contiguous United States 

Gabriele Villarini and Hanbeen Kim

Floods affect many aspects of our lives, and our improved understanding of the processes driving the historical changes in this natural hazard can provide basic information to enhance our preparation and mitigation efforts. Here we analyze thousands of long-term streamgages across the contiguous United States and attribute the changes in flood extremes to precipitation and temperature. We then leverage these physical insights to assess the future changes in flooding using outputs from global climate models part of the Coupled Model Intercomparison Project Phase 6. We find that flood peaks are projected to change across the contiguous United States. This is true even when flood changes are not detected in the more recent decades, highlighting the current needs for incorporating climate change in the future infrastructure designs and management of the water resources.

How to cite: Villarini, G. and Kim, H.: Projected Changes in Peak Discharge Across the Contiguous United States, EGU General Assembly 2023, Vienna, Austria, 23–28 Apr 2023, EGU23-4242, https://doi.org/10.5194/egusphere-egu23-4242, 2023.

EGU23-4663 | ECS | Posters on site | HS2.4.1

Effect of Snow on Streamflow Variability 

Juntai Han and Yuting Yang

With the ongoing climate warming, changes in intra-annual distribution, annual volume, and their inter-annual variability of streamflow have been key research topics of ever-increasing interest. For settling the question of how changing climate shapes streamflow dynamics, here, we used long-term (1950-2010) observations of monthly streamflow (Q) for 2960 global unimpaired catchments, combined with snowfall (SF) and precipitation (P) estimates from ERA5-Land to provide a global assessment of effect of snowfall on streamflow variability. Results showed that precipitation was the main control of intra-annual and inter-annual streamflow variability while the propagation process of variability would be regulated by snow. As the snowfall fraction (sf) decreased, the annual runoff coefficient decreased, while the timing of streamflow got advanced and the intra-annual distribution became more even. Besides, the inter-annual variability of streamflow shows a negative relationship with snowfall fraction. The negative relationship between streamflow inter-annual variability and snowfall fraction may result from the asymmetric hydrological effects of snowfall in the wet and dry years.

How to cite: Han, J. and Yang, Y.: Effect of Snow on Streamflow Variability, EGU General Assembly 2023, Vienna, Austria, 23–28 Apr 2023, EGU23-4663, https://doi.org/10.5194/egusphere-egu23-4663, 2023.

EGU23-4717 | ECS | Posters on site | HS2.4.1

Low resilience of fractured groundwater systems to climate change and human activities 

Jintao Su, Xin Luo, and Jimmy Jiao

Groundwater, as an essential and dynamic part of hydrosphere, sustains the water demands and livelihoods in diverse landscapes and ecosystems. Currently, understanding on groundwater responses to climate variability is less addressed in IPCC reports yet important for future projections of water resources and management. Recent studies demonstrate that aridity index and likely hydrogeological setting jointly control the climate resilience of groundwater regionally and globally. However, most of these studies are bounded to quaternary sedimentary aquifers (i.e., North China plain, U.S. plains, Nubia plains) subject to intensive agricultural activities. Compared with quaternary aquifers which is dominated by porous media, groundwater in fractured bedrocks flows faster because of smaller effective porosities. The discharge and recharge processes are therefore expected to be more sensitive to climate variability and anthropogenic activities (i.e., pumping, urbanization, and reclamation) in fractured aquifer, but the underlying mechanism remains unclear, mainly limited by the lack of mature theory to delineate the interplays between fractured aquifers, climatic processes and human forcings, and the scarcity of long-term observation in the fractured bedrock aquifers.

In this study, we leveraged the decadal weekly monitoring (1971-2000) of rainfall, potential evapotranspiration, groundwater table, and stream discharge the headwater catchments dominated by fractured aquifers. with and without major human disturbance. We identified the significantly lower resilience of these fractured groundwater systems to change climates and human activities. By examining the variations and phases of recharge and discharge (baseflow to the river channel), we concluded that the rapid recharge-discharge in the fractured bedrock groundwater might serve as an effective push-pull process to significantly lower the resilience of fractured groundwater systems to climate changes and human disturbance. Topographic metrics i.e., slopes and concavity, are not likely to influence the interplay between fractured groundwater system and climate/human forcings. Our results also highlight the potential teleconnections between the fractured groundwater system and long-term climate changes (i.e., El Niño-Southern Oscillation/Asian summer monsoon/ Asian winter monsoon). This study advances the understanding the role and behaviors of fractured groundwater systems under changing climate and human disturbance and pave the way for a sustainable groundwater management in the fractured groundwater systems from local to global scales.

How to cite: Su, J., Luo, X., and Jiao, J.: Low resilience of fractured groundwater systems to climate change and human activities, EGU General Assembly 2023, Vienna, Austria, 23–28 Apr 2023, EGU23-4717, https://doi.org/10.5194/egusphere-egu23-4717, 2023.

EGU23-5094 | ECS | Orals | HS2.4.1

Past and future changes toward earlier timing of streamflow over Pakistan from bias-corrected regional climate projections (1962–2099) 

Shahid Ali, Kam Jonghun, Kim Byeong-Hee Kim, and Akhtar Taimoor

Streamflow has fluctuated seasonally in Pakistan and surface warming has caused its seasonal change, sometimes resulting in a lack of water resources for agriculture. However, little is known about how the seasonal changes in the hydrologic regimes over Pakistan has been and will be persisted. Using daily streamflow records from four gag stations data and bias-corrected hydrological projections, this study assessed the past and future changes in streamflow timing along four major river basins of Pakistan (Upper Indus, Kabul, Jhelum, and Chenab). First, we simulated the VIC-river routing model to generate past and future daily streamflow data forced by simulated daily surface and base runoff data from six CORDEX-South Asia regional climate models (1962–2099). Second, we corrected minimum and seasonality bias in simulated daily streamflow data against the daily observational records. Third, we calculated half of the annual cumulative streamflows (HCSs) and center-of-volume dates (CVDs) of observed and bias-corrected simulated streamflow data to quantify seasonal changes in the hydrologic regime. Except for the Chenab River basin, observational records revealed a significant decreasing trend in CVD (i.e., an earlier onset of the wet season) over Pakistan basins over 1962–2019. Bias-corrected hydrologic projections revealed a decrease in CVD of 4.2 to 6.3 days across the four study river basins over the overlapped period. The average decrease in CVDs ranged from 5 to 20 days and 11 to 37 days in the near future (the 2050–2059 average) and the far future (the 2090–2099 average), respectively. We found that the hydrologic responses of all four basins are diverse with different magnitudes of CVDs despite a similar magnitude of near-surface temperature across the basins, highlighting the need for basin-specific water resources management and climate change adaptation policies.

How to cite: Ali, S., Jonghun, K., Byeong-Hee Kim, K., and Taimoor, A.: Past and future changes toward earlier timing of streamflow over Pakistan from bias-corrected regional climate projections (1962–2099), EGU General Assembly 2023, Vienna, Austria, 23–28 Apr 2023, EGU23-5094, https://doi.org/10.5194/egusphere-egu23-5094, 2023.

EGU23-5627 | ECS | Posters on site | HS2.4.1

Parameter Estimation to Penman Combination Equation in Stream Using Latent Heat Flux and Hydrometeorological Data 

Minwoo Park, Yoon-Jeong Kwon, Jae-Ung Yu, and Hyun-Han Kwon

Recently, floods and droughts have become more frequent due to climate change and climate variability, leading to an increase in uncertainty regarding water resources management. For reliable water resources management, it is necessary to estimate available water through the water budget analysis accounting for hydrologic circulation. However, evaporation loss in the stream is not fully considered in the water budget analysis for water resources planning in South Korea. Evaporation is a critical component of the hydrological cycle that is affected by energy exchange between the water surface and the atmosphere. Therefore, we used latent heat flux data obtained from the flux tower system to quantify evaporation. This study formulated a stream evaporation formula based on PCE(Penman combination equation) equation and estimated the associated parameters in the Bayesian modeling framework that can effectively consider evaporation loss in the entire water budget analysis. We expect that this study will contribute to water management planning by adopting the regionally calibrated PCE formula in the estimation of available water more effectively.

Acknowledgement : This work was supported by the National Research Foundation of Korea(NRF) grant funded by the Korea government(MSIT). (No. 2019R1A2C2087944)

How to cite: Park, M., Kwon, Y.-J., Yu, J.-U., and Kwon, H.-H.: Parameter Estimation to Penman Combination Equation in Stream Using Latent Heat Flux and Hydrometeorological Data, EGU General Assembly 2023, Vienna, Austria, 23–28 Apr 2023, EGU23-5627, https://doi.org/10.5194/egusphere-egu23-5627, 2023.

EGU23-6461 | ECS | Orals | HS2.4.1

Moisture sources and pathways of annual maximum precipitation in the Lancang-Mekong River Basin 

Shuyu Zhang, Junguo Liu, Deliang Chen, Guoqing Gong, and Gengxi Zhang

Extremely heavy precipitation leads to increasingly frequent floods, landslides, debris flow, storm surges, and other natural hazards in the Lancang-Mekong River basin (LMRB) that causes large amounts of economic loss and affected millions of residences. This study analyzed the spatial-temporal characteristics of the annual maximum precipitation (R1X) of the LMRB and identified the moisture sources and pathways conducive to the occurrences of these extreme precipitation events during 1965-2021. Results show that the R1X of the upstream region concentrated in July, while that of the downstream region mainly occurred from August to September. The regional mean R1X shows an increasing trend, especially after 2010. The moisture pathways of the historical R1X were identified through a Lagrangian back trajectory model and were classified into three clusters by the Self-Organize Map: West Pacific Ocean (WP), local evapotranspiration, and Bay of Bengal (BOB). BOB provided the main moisture source to the R1X of the LMRB which contributes 68.3% of the trajectories, while the local evapotranspiration and WP account for 20.4% and 11.3%, respectively. For most areas downstream of LMRB, the moisture from the BOB transported through the cross-equator flow is the main moisture pathways patterns. For the upstream of LMRB, the evapotranspiration from the local and neighboring terrestrial and oceanic surfaces provides the main moisture sources. For the east area of the downstream, R1Xs are high and mainly resulted from tropical cyclones bringing large amounts of moisture from the WP to the LMRB. As tropical cyclones moved northward under climate change, more extreme precipitation over the LMRB was fed by the moisture from WP, while those from the BOB is decreasing with the slowdown of cross-tropical flows.

How to cite: Zhang, S., Liu, J., Chen, D., Gong, G., and Zhang, G.: Moisture sources and pathways of annual maximum precipitation in the Lancang-Mekong River Basin, EGU General Assembly 2023, Vienna, Austria, 23–28 Apr 2023, EGU23-6461, https://doi.org/10.5194/egusphere-egu23-6461, 2023.

Drought events are influenced by a combination of both climatic and local catchment characteristics. In Great Britain the North Atlantic Oscillation (NAO) has long been recognised as the leading mode of climate variability, and studies have also noted the role of the East Atlantic Pattern (EA) as a secondary mode. This study aimed to develop an understanding of the combined influence of the NAO and EA on rainfall distribution and magnitude and the variable nature of meteorological to hydrological drought propagation. Initially, this study explores correlations between teleconnection indices and standardised precipitation and streamflow indices for 291 catchments across Great Britain, before focusing on nine case study catchments for further analysis. For each case study catchment, we use quantile regression and an analysis of drought frequency to explore the combined influence of the NAO and EA on drought conditions.

Through a convergence of evidence from these analyses we make three observations. Firstly, in the winter months both the NAO and EA exert an influence on drought conditions, however there is spatial variability in the relative influence of the NAO and EA; the NAO has a stronger influence in the north-west, whilst the EA has a stronger influence in the southern and central regions. Secondly, in the summer months, less distinctive spatial differences were found, with higher probability of drought conditions under NAO+ phases, which however can be enhanced or moderated by the EA. Finally, as a result of catchment characteristics there is spatio-temporal variability in the propagation of meteorological to hydrological drought. Our findings suggest that by considering the NAO and EA in combination, we can better describe climate and drought variability. We conclude by noting the potential implications our study has on the role of monthly teleconnection forecasts in water management decision making in Great Britain, and acknowledge the current limitations associated with incorporating such understanding.

How to cite: West, H., Quinn, N., and Horswell, M.: Atmospheric Circulations and Drought Conditions in British Catchments: Highlighting the Role of the East Atlantic Pattern, EGU General Assembly 2023, Vienna, Austria, 23–28 Apr 2023, EGU23-8150, https://doi.org/10.5194/egusphere-egu23-8150, 2023.

EGU23-10846 | ECS | Orals | HS2.4.1

Time of emergence of extreme floods and droughts over the north-eastern United States 

Mina Faghih and François Brissette

Natural climate variability is known to be an important source of uncertainty in climate risk assessment. This can pose a substantial obstacle to the implementation of adaptation strategies because it may mask the signal of climate change. In this study, the authors investigate how extreme flows in 133 catchments in the eastern and northeastern United States are affected by internal climatic variability. They evaluate the ratio of internal climate variability to anthropogenic climate change on projected future extreme streamflow using temperature and precipitation data from a single model initial-condition large ensemble (SMILE) at high spatial and temporal resolution. To better understand the role of internal climate variability and its impacts on the climate change signal, the authors use three different parametric and non-parametric tests to evaluate the time of emergence (TOE) of the climate change signal. The results are presented for three classes of catchment area: small (500 km2), medium (500-1000 km2), and large (>1000 km2). The findings suggest that the future intensity of both floods and droughts will gradually increase, with the expected increases in flood and drought signals being strongly influenced by catchment size. Small catchments are likely to see higher increases in flooding than the other catchment sizes, but weaker increases in extremely severe droughts. The size of the catchment also affects TOEs, with smaller catchments seeing earlier TOE for floods and later ones for droughts. These findings provide significant information on adaptation timelines.

How to cite: Faghih, M. and Brissette, F.: Time of emergence of extreme floods and droughts over the north-eastern United States, EGU General Assembly 2023, Vienna, Austria, 23–28 Apr 2023, EGU23-10846, https://doi.org/10.5194/egusphere-egu23-10846, 2023.

EGU23-12267 | Posters on site | HS2.4.1

Hydrological variability of Finnish free-flowing rivers 

Karoliina Lintunen, Cintia Bertacchi Uvo, Petteri Alho, and Elina Kasvi

River discharges and ice cover strongly impact biotic and abiotic processes in fluvial environments. Hydrometeorological circumstances affect discharges and under climate change, they are changing in high-latitude areas of the globe. During the past decades, spring snowmelt has started earlier in Northern Europe, leading to a shift in the timing of floods and discharge peaks. Also, higher wintertime discharges have been measured. However, little is known about how these changes in the variability and trends have occurred during the past decades (up to 100 y.) and how they will evolve in the future.

The goal of this paper is to understand how the hydrological variability of free-flowing rivers has changed from the past to the present in Finland. To achieve the goal, long-term data on flood magnitude, frequency, and timing are statistically analyzed to identify the hydrological variability of Finnish free-flowing rivers. Previous works showed that discharge parameters work as reliable indicators for assessing long-term changes caused by climate change when combined with weather parameters, teleconnection patterns, and river ice data. Open-access data from 45 gauging stations in 25 different watershed areas were used. The timespan of datasets varies between 40 and 100 years. The results of this paper can be applied when future changes and adaptation methods related to river discharges are considered in the boreal-subarctic climate region.

How to cite: Lintunen, K., Bertacchi Uvo, C., Alho, P., and Kasvi, E.: Hydrological variability of Finnish free-flowing rivers, EGU General Assembly 2023, Vienna, Austria, 23–28 Apr 2023, EGU23-12267, https://doi.org/10.5194/egusphere-egu23-12267, 2023.

EGU23-13655 | ECS | Posters on site | HS2.4.1

Heat transfer in the Southern Baltic Sea 

Daniel Rak, Lidia Dzierzbicka-Głowacka, Waldemar Walczowski, and Anna Bulczak

The balance of energy supplied to the sea surface in the Baltic Sea proper is positive, which means that this region absorbs more energy than it releases to the atmosphere. Further transport of this energy in the form of heat is transported deep into the water column. It has been shown that differences between individual basins of the Baltic Proper appear along with the depth. The temperature signal, resulting from seasonal changes in the amount of solar energy supplied to the sea surface and the conditions of energy exchange between the sea and the atmosphere, propagates the fastest into the water column in the Gdańsk Deep, where it takes 37 days to a depth of 50 meters. In the Bornholm Basin, the speed of this signal is 71 days.

How to cite: Rak, D., Dzierzbicka-Głowacka, L., Walczowski, W., and Bulczak, A.: Heat transfer in the Southern Baltic Sea, EGU General Assembly 2023, Vienna, Austria, 23–28 Apr 2023, EGU23-13655, https://doi.org/10.5194/egusphere-egu23-13655, 2023.

African countries are highly vulnerable to floods, with several studies reporting an increase in mortality rate and exposure in recent decades. Therefore, to improve flood forecasting and associated resilience to such natural hazards, a better understanding of the dominant flood-generating mechanisms and their evolution across Africa is of paramount importance. According to a recent study, excess rains on saturated soils in western Africa, and long rains for catchments in northern and southern Africa, are the two dominant mechanisms, contributing to more than 75% of all flood events. While the dominance of flood-generating mechanisms was not reported to change significantly in recent decades, the magnitude of those events may have changed in response to changing rainfall patterns (wetter or drier average conditions) across Africa. Here, we first estimate how much the magnitude of events with excess rainfall on saturated soils and long rains have changed over the last 65 years, before examining the statistical relationship between these changes, globally warming temperatures, and “natural” modes of decadal climate variability (e.g., Atlantic Multidecadal Variability [AMV], Pacific Decadal Variability [PDV]). To do so, we use a non-linear extreme value modelling approach with multiple covariates, applied to multiple observational datasets (e.g., ERA5, REGEN) and large ensembles from the Sixth Phase of the Coupled Model Intercomparison Project (CMIP6). This study, therefore, contributes to further the understanding of recent flood hazards in Africa, and identifies regions that will likely become more vulnerable to climate change and its decadal variability over the decades to come.

How to cite: Eden, J., Dieppois, B., Tramblay, Y., and Villarini, G.: Recent Changes in the Magnitude of Flood-Generation Mechanisms across Africa: Relative Contributions of Climate Change and Decadal Variability, EGU General Assembly 2023, Vienna, Austria, 23–28 Apr 2023, EGU23-15586, https://doi.org/10.5194/egusphere-egu23-15586, 2023.

We compare spectral decomposition of flood data from three sites in Australia (south-east coast, east-inland, east-central) with the Southern Oscillation Index (SOI), and with those from the Brahmaputra River (Bangladesh) and Nile River (Egypt). All show clear evidence of spectral maxima at medium periods approximating 50, 85, 130 and 200 years, which correspond closely to the maxima in the power spectra of the cosmogenic 10Be and 14C observations obtained from ice cores with ages covering the past 10000 years.  We find that the Gleissberg cycle (85 yr period) for Australian sites is out of phase with that for the Brahmaputra River.   All sites also show spectral maxima at short periods 6-20 yr as expected from the ENSO cycle; flood associations varying over these short periods are generally accepted. We explore the possibility that the medium periods can be used to assist in the prediction of flood and drought activity several decades into the future.  We consider   the hypothesis of a correlation or causal relationship existing between solar activity (including its effects on the intensity of galactic cosmic rays   on the Earth) and flood cycles for the medium periods. 


The Australian SE coast and east-inland sites, and the Brahmaputra River, show strong medium-period maxima.  The phase of the medium periods is obtained by optimized fitting of multiple sine curves with periods obtained from the spectra; the Australian SE coast and east-inland sites show summed sine curves with high correlation.  The Brahmaputra River shows similar correlation at medium periods (in particular the Gleissberg 85-year period) but in opposite phase.


The Australian east-central site (Murray-Darling Basin) and the Nile River (Egypt) show only weak evidence for the medium-period maxima which suggests ocean proximity is a factor for these influences.  The short duration SOI record shows   weaker evidence for medium-period spectral maxima, and the Southern Annular mode (SAM) and Indian Ocean Dipole (IOD) show no obvious correlation with observed medium-period flood patterns at the selected sites.  We speculate that the strong medium-period flood patterns are associated with the solar and/or cosmic ray cycles, observed in the cosmogenic record, where the causative mechanisms are yet to be established.  We conclude that the association of floods in medium-period cycles in addition to the association with the better-known short period variations associated with the ENSO cycle, provides opportunity for empirical predictions of flood patterns over ~80 years, and for the further investigation of possible causative mechanisms linking solar phenomena to oceanic indices and multi-decadal flood patterns.

How to cite: Asten, M. and McCracken, K.: Is multidecadal prediction of flood patterns possible for infrastructure planning purposes using the 10000 year cosmogenic isotope (10Be and 14C) record?, EGU General Assembly 2023, Vienna, Austria, 23–28 Apr 2023, EGU23-15726, https://doi.org/10.5194/egusphere-egu23-15726, 2023.

EGU23-15739 | ECS | Orals | HS2.4.1

Large-Scale Climatic Drivers of Flood Frequency across Sub-Saharan Africa 

Job Ekolu, Bastien Dieppois, Jonathan Eden, Yves Tramblay, Gabriele Villarini, Simon Moulds, Louise Slater, Gil Mahé, Jean-Emmanuel Paturel, Moussa Sidibe, Pierre Camberlin, Benjamin Pohl, and Marco van de Wiel

Sub-Saharan Africa is affected by a high level of temporal and spatial climate variability, with large impacts on water resources, human lives, and economies, notably through hydrological extremes such as floods. Nevertheless, the key climatic factors driving interannual variability in flood frequency remain poorly documented and understood. To address this research gap, we first compile information on large-scale climate drivers that may potential affect sub-Saharan African hydroclimate (e.g., El Niño–Southern Oscillation, Atlantic Multidecadal Variability). Then, using a new 65-year long daily streamflow dataset of over 600 stations in sub-Saharan Africa, a bootstrapped stepwise regression and relative importance analysis is applied to quantify the relative contribution of different ocean basins to interannual variability in flood frequency between 1950 and 2014. Results show that interannual variations in the frequency of flood events are significantly linked to different modes of climate variability in the Pacific, Indian, and Atlantic Oceans. These modes of climate variability together explain around 60% of observed interannual variation in seasonal flood frequency. The relative influence of each ocean basin, however, differs from one region to another. The Indian and Pacific Oceans, for instance, have significant influences on interannual variations in the frequency of floods between December and May across much of southern and eastern Africa. In western Africa, the Mediterranean and Atlantic Oceans appear to have a dominant influence between September and November. In central Africa, the relative influence of different oceans basins is seasonally variable. Using the best combination of Sea-Surface Temperature predictors, we then examine projected future trends using a large ensemble of climate models from the CMIP6 experiments.

How to cite: Ekolu, J., Dieppois, B., Eden, J., Tramblay, Y., Villarini, G., Moulds, S., Slater, L., Mahé, G., Paturel, J.-E., Sidibe, M., Camberlin, P., Pohl, B., and van de Wiel, M.: Large-Scale Climatic Drivers of Flood Frequency across Sub-Saharan Africa, EGU General Assembly 2023, Vienna, Austria, 23–28 Apr 2023, EGU23-15739, https://doi.org/10.5194/egusphere-egu23-15739, 2023.

EGU23-16848 | Posters on site | HS2.4.1

Atmospheric and oceanic influences on the hydrological scenarium southern Brazil in relation to extreme events observed in 2022 

Douglas Paulek, Cassia Paranhos, Camila Freitas, and Camila Carpenedo

After a long period of drought experienced in South America, which began in 2019 and lasted until 2021 for the southern region of Brazil, the hydrological scenario of this region presented positive precipitation anomalies throughout the year 2022. That anomalies resulted in the increase in the flow observed in the main river basins of the southern region of Brazil, which wanted to recover the storage volume of the reservoirs and social activities and ingestion, in addition to the occurrence of extreme events at Iguaçu Falls. Precipitation in the southern region of South America, especially in Brazil, is the result of different climatic phenomena. Its latitudinal (tropical) location means that this region is influenced by frontal systems, polar masses, Mesoscale Convective Complex (MCC) systems, and South Atlantic Convergence Zones (SACZ). In addition to also being influenced by the El Niño-Southern Oscillation (ENSO) phenomenon, which is associated with changes in the normal patterns of Sea Surface Temperature and trade winds in the Equatorial Pacific region, the Madden-Julian Oscillation (MJO), and others atmospheric and oceanic systems on global scales. This work presents a discussion about the anomalies in the atmosphere (geopotential height 250 hPa) and an analysis of the climatic phenomena that may have contributed to the precipitation anomalies observed during the months of May to October 2022.

How to cite: Paulek, D., Paranhos, C., Freitas, C., and Carpenedo, C.: Atmospheric and oceanic influences on the hydrological scenarium southern Brazil in relation to extreme events observed in 2022, EGU General Assembly 2023, Vienna, Austria, 23–28 Apr 2023, EGU23-16848, https://doi.org/10.5194/egusphere-egu23-16848, 2023.

EGU23-1851 | ECS | Orals | HS2.4.2

Projection of China’s future runoff based on the CMIP6 mid-high warming scenarios 

Jiayue Zhou, Hui Lu, Kun Yang, Ruijie Jiang, Yuan Yang, Wei Wang, and Xuejun Zhang

The latest Coupled Model Intercomparison Project Phase 6 (CMIP6) proposes new shared pathways (SSPs) that incorporate socioeconomic development with more comprehensive and scientific experimental designs; however, few studies have been performed on the projection of future multibasin hydrological changes in China based on CMIP6 models. In this paper, we use the Equidistant Cumulative Distribution Function method (EDCDFm) to perform downscaling and bias correction in daily precipitation, daily maximum temperature, and daily minimum temperature for six CMIP6 models based on the historical gridded data from the high-resolution China Meteorological Forcing Dataset (CMFD). We use the bias-corrected precipitation, temperature, and daily mean wind speed to drive the variable infiltration capacity (VIC) hydrological model, and study the changes in multiyear average annual precipitation, annual evapotranspiration and total annual runoff depth relative to the historical baseline period (1985–2014) for the Chinese mainland, basins and grid scales in the 21st century future under the SSP2-4.5 and SSP5-8.5 scenarios. The study shows that the VIC model accurately simulates runoff in major Chinese basins; the model data accuracy improves substantially after downscaling bias correction; and the future multimodel-mean multiyear average annual precipitation, annual evapotranspiration, and total annual runoff depth for the Chinese mainland and each basin increase relative to the historical period in near future (2020–2049) and far future (2070–2099) under the SSP2-4.5 and SSP5-8.5 scenarios. The new CMIP6-based results of this paper can provide a strong reference for extreme event prevention, water resource utilization and management in China in the 21st century.

How to cite: Zhou, J., Lu, H., Yang, K., Jiang, R., Yang, Y., Wang, W., and Zhang, X.: Projection of China’s future runoff based on the CMIP6 mid-high warming scenarios, EGU General Assembly 2023, Vienna, Austria, 23–28 Apr 2023, EGU23-1851, https://doi.org/10.5194/egusphere-egu23-1851, 2023.

EGU23-2248 | ECS | Orals | HS2.4.2

Decreased inter-annual streamflow variability are found in snow-affected catchments by using the second-order Budyko framework 

Ziwei Liu, Taihua Wang, Juntai Han, Wencong Yang, and Hanbo Yang

With persistent global warming, more precipitation will land on the earth's surface as rainfall instead of snowfall. Here, based on observations from hundreds of catchments, we proposed a framework (the second-order Budyko framework) to investigate hydro-climatic relationships between annual streamflow and snowfall fraction. Results show that in addition to the mean annual streamflow, the inter-annual streamflow variability will also decrease with lower snowfall fraction in the context of warming. The positive relationship between streamflow variability and snowfall fraction may result from the asymmetric hydrological effects of snowfall in the wet and dry years. To our knowledge, it is the first attempt to detect the role of snowfall on the streamflow variability. This study provides new way and understandings of the second-order hydro-climatic effects, and these findings will facilitate decisions for water resource management in a changing climate.

How to cite: Liu, Z., Wang, T., Han, J., Yang, W., and Yang, H.: Decreased inter-annual streamflow variability are found in snow-affected catchments by using the second-order Budyko framework, EGU General Assembly 2023, Vienna, Austria, 23–28 Apr 2023, EGU23-2248, https://doi.org/10.5194/egusphere-egu23-2248, 2023.

EGU23-2954 | ECS | Posters on site | HS2.4.2

Process-Based Estimates of Seasonal Streamflow for Ungauged Catchments 

Zeqiang Wang, Ross Woods, Nicholas Howden, and Wouter Berghuijs

The seasonal water balance is at the core of overall catchment responses, but current methods to simulate seasonal water availability at ungauged locations are unreliable. Here we enhance two simple models from Woods (2003 and 2009, Advances in Water Resources) to estimate actual evaporation, changes in storage, and streamflow, using summary statistics of precipitation, temperature, and potential evaporation from the CAMELS-US dataset. Specifically, we first use sinusoidal functions to simulate observed precipitation, temperature, and potential evaporation to quantify several parameters (e.g., climate dryness index). We then use these variables and parameters to force our simple model representing the main hydrological processes to generate estimated streamflow. We then assess the model’s ability to simulate the seasonal flow regime across many catchments worldwide. Finally, we identify the dominant variables and processes controlling the seasonal water balance and discuss the limitations of our model. This allows finding in which situations we can reliably estimate seasonal variation in catchment streamflow without flow measurements, and other cases where model refinement is needed. Our study is important to improve our understanding of seasonal catchment hydrology and for predicting the seasonal hydrological differences between various hydro-climatic conditions or catchments, especially in locations with sparse measurements.

How to cite: Wang, Z., Woods, R., Howden, N., and Berghuijs, W.: Process-Based Estimates of Seasonal Streamflow for Ungauged Catchments, EGU General Assembly 2023, Vienna, Austria, 23–28 Apr 2023, EGU23-2954, https://doi.org/10.5194/egusphere-egu23-2954, 2023.

EGU23-3103 | ECS | Orals | HS2.4.2

Hydrological feedback from projected Earth greening in the 21st century 

Jie Wu, Dashan Wang, Laurent Z.X. Li, and Zhenzhong Zeng

Earth satellites have observed continuous increasing vegetation growth during the past four decades, a phenomenon called Earth greening. Nearly all Earth System Models (ESMs) participated in Coupled Model Intercomparison Project (CMIP) for Intergovernmental Panel on Climate Change (IPCC) project a continuous greening of the planet during the 21st century. To investigate the hydrological feedback from projected Earth greening, we prescribed the increase in leaf area index (LAI) in the 21st century as projected by CMIP5 ESMs into a state-of-the-art ESM (IPSLCM), and simulated equilibrium climates for current CO2 and LAI, an increase of CO2 alone, an increase of LAI alone, and increases of both CO2 and LAI, respectively. We find that the greening simultaneously intensifies evapotranspiration and precipitation over land. In terms of soil moisture content, the spatial difference between the responses of evapotranspiration and precipitation causes a hydrological response of the "dry gets drier, wet gets wetter" (DDWW) paradigm. Increasing LAI significantly decreases soil moisture content over dry regions, including Western North America, Southern South America, East Siberia, Central Asia, South Asia, Northern China, Sahel, Southern Africa and Australia. Over wet regions particularly Amazon and Congo rainforests, the greening-induced increase of terrestrial evapotranspiration favors more convective precipitation, so that the new equilibrium does not decrease soil moisture content. The DDWW paradigm in terms of P-ET response does not hold over wet areas. To mitigate climate with forestry, policymakers should prevent degradation of existing forests, support afforestation over wet regions, and avoid planting trees in dry regions.

How to cite: Wu, J., Wang, D., Li, L. Z. X., and Zeng, Z.: Hydrological feedback from projected Earth greening in the 21st century, EGU General Assembly 2023, Vienna, Austria, 23–28 Apr 2023, EGU23-3103, https://doi.org/10.5194/egusphere-egu23-3103, 2023.

EGU23-3753 | ECS | Orals | HS2.4.2

Recession constants are not constant: the impacts of multi-annual drought on recession behaviour and catchment storage. 

Luca Trotter, Margarita Saft, Murray Peel, and Keirnan Fowler

We studied changes in the recession behaviour of catchments that experienced multi-annual drought conditions to explore their relationship with previously observed drought-induced shifts in catchments’ hydrological response (as measured by annual rainfall-runoff relationships). We found that recession behaviour can change significantly during persistent drought, highlighting the role of subsurface storage dynamics and catchment conductivity in determining catchments’ hydrological response to prolonged dry periods.

Analysis of streamflow recessions is commonly used to characterise catchment behaviour, and to explore the role that catchment storage plays in streamflow production. Recession techniques characterise average catchment behaviour over sufficiently long periods of recorded data, making them generally unsuitable for analysis of nonstationary hydrological conditions. Nevertheless, in the context of long-term drought, where nonstationarity arises over decadal periods, analysis of changes in catchment recession behaviour over time is possible. For this study, we consider nonstationarities in the catchment-level annual rainfall-runoff relationships induced by prolonged drought. These have been observed during multi-annual droughts worldwide and often persist long after the end of the dry spell. In this context, recession analysis is a useful tool to study the effects of persistent drought on catchment processes.

We applied recession analysis methods to assess changes in average recession behaviour of catchments affected by multi-annual drought in Sout-Eastern Australia. We compare recession behaviour before the drought to a 10-year period straddling the end of the drought. We focussed on how significant changes in recession behaviour over time correlate to drought-induced shifts in annual rainfall-runoff relationships. We apply two distinct methods, drawn from the vast methodological literature on recession analysis. These were chosen specifically for their different data requirements (hourly or daily) and approaches to recession analysis (one based on a master recession curve and the other based on recession plots).

Despite the differences, results from both methods are consistent. We found that recession behaviour changed significantly in the majority of the catchments studied, with recessions becoming faster late in the drought compared to the pre-drought period. These changes, in particular, affected catchments that were shown to exhibit significant shifts in rainfall-runoff relationship during the extended drought. Conversely, in the catchments whose rainfall-runoff relationship had remained stable, the changes in recession behaviour are much smaller and largely limited to the low-flow portion of the recession curve. This suggests that the widespread increase in recession rates observed in shifted catchments is only in small proportion attributable to increased evaporative demand (which is comparable between the two sets of catchments) and is instead likely caused by a combination of decreased connectivity between catchment surface water and subsurface storage and increased transmission losses through the streambed.

How to cite: Trotter, L., Saft, M., Peel, M., and Fowler, K.: Recession constants are not constant: the impacts of multi-annual drought on recession behaviour and catchment storage., EGU General Assembly 2023, Vienna, Austria, 23–28 Apr 2023, EGU23-3753, https://doi.org/10.5194/egusphere-egu23-3753, 2023.

The Murray-Darling Basin in south-eastern Australia is one of the world’s largest rivers, draining an area of just over 1 million square kilometres. The basin drains about one-seventh of the Australian land mass and is the 16th longest river in the world. However, being located on the driest continent on Earth, its discharge is relatively small, averaging just 767 m3/s, far smaller than the discharge from any other similarly sized river worldwide.

Despite the relative lack of water, the Murray-Darling Basin is one of the most significant agricultural areas in Australia. In order to manage the water in the basin, in 2008 the Murray-Darling Basin Authority was formed with a mandate to manage the Murray-Darling Basin in an integrated and sustainable manner. Water reform in the basin has been a world-first in terms of the scale of intervention, but it has led to numerous conflicts in terms of access to water. The ability to manage the basin adequately relies on appropriate research being carried out in order todetermine how much water is currently available, where it is currently being used, and how water availability and use are likely to change into the future.

Like much of southern Australia, the Murray-Darling Basin is already feeling the impacts of climate change, with more hotter days, fewer cold days, and a reduction in cool-season precipitation. These changes are only likely to increase over the coming decades and adaptation options to cope with less water availability are needed.

Additionally, the Murray-Darling Basin Plan which was brought into force in 2012 is due for evaluation in 2025 and review in 2026. CSIRO is carrying out research across multiple disciplines in order to assist in this evaluation and review. This presentation will summarise the management of the basin to date, review likely climate change impacts and assess potential adaptation options moving forward.

How to cite: Post, D.: Adapting to reductions in water availability under climate change in the Murray-Darling Basin, Australia, EGU General Assembly 2023, Vienna, Austria, 23–28 Apr 2023, EGU23-3871, https://doi.org/10.5194/egusphere-egu23-3871, 2023.

In light of the complex interactions of multiple biotic and abiotic processes acting at different spatio-temporal scales and the high spatial variability in their biophysical features, our ability to describe catchment dynamics is still limited. Such a limitation stems, on one side, from the mismatch of scales between key small-scale processes and their current parameterization and the large scales of many modeling applications, and, on the other, from the challenge of considering the spatial configurations in an explicit manner. As a motivating example, we will discuss here the issue of representing the effect of biologically-induced soil structure in the parameterization of soil hydraulic properties (SHPs) for large scale applications. Currently available parameterizations based on soil pedotransfer functions (PTFs) do not account for the effects of soil structure, thus limiting their applicability in vegetated areas in which macropores are expected to significantly increase soil saturated hydraulic conductivity. Considering the strong links between vegetation and soil structure, we propose a systematic approach for incorporating structural effects on PTF-derived SHPs. We will show that, under certain soil and climatic conditions, small scale soil structure features prominently alter the hydrologic response emerging at larger scales and that upscaled parameterizations must explicitly consider the spatial variability of soil and vegetation attributes. Lastly, opportunities in the representation of multiple small‐scale ecohydrological processes for regional and global applications will be discussed. Progress on this front is key for establishing more complete causal links between landscape attributes and heterogeneities in physical properties, thus providing a mechanistic strategy for model parameterization and process description across scales and a path forward for more reliable large-scale modeling under future scenarios.

How to cite: Bonetti, S. and Or, D.: On the representation of small-scale soil biophysical features for large-scale applications, EGU General Assembly 2023, Vienna, Austria, 23–28 Apr 2023, EGU23-4099, https://doi.org/10.5194/egusphere-egu23-4099, 2023.

EGU23-5234 | ECS | Posters on site | HS2.4.2

Characterizing hydrologic similarity of precipitation and catchment wetness using repeating patterns in runoff 

Adriane Hövel, Heye Bogena, Andreas Lücke, Christine Stumpp, and Michael Stockinger

Understanding the reasons why a certain combination of precipitation event and catchment wetness condition causes a particular runoff response serves as the basis for a sustainable water resources management. Runoff responses at the catchment scale are highly variable in space and time due to numerous influencing factors, e.g., topography, land use, geology, and climatic conditions. Yet, despite previous studies having investigated these interdependencies, it remains difficult to differentiate between the various impacts on the runoff response and to determine which driving factors dominate under which conditions. Assuming that similar precipitation and catchment wetness (e.g. in terms of soil water content or groundwater level) lead to similar runoff responses, reoccurring patterns of these hydrological flux and state variables may be useful to assess the causes for similar or different runoff responses. Therefore, we compared precipitation and catchment wetness conditions and classified them as hydrologically similar if they lead to a similar runoff response. In this study, the similarity of runoff responses was assessed for the 38.5 ha, partly forested Wüstebach catchment in Western Germany using the goodness-of-fit (GOF) criteria Nash-Sutcliffe-Efficiency and Volumetric Efficiency. If the GOF exceeded a pre-defined threshold, the runoff responses were classified as similar and grouped together. Subsequently, for similar runoff responses, the corresponding rainfall and wetness conditions were compared calculating the Spearman’s rank correlation coefficient and descriptive statistics. A total of 22 similar out of 73 runoff events were identified for the Wüstebach catchment over a period of nearly 12 years and classified into seven groups with the largest group including in total eight events. Results show that for similar runoff responses in this representative group, soil water content as well as groundwater levels in the riparian zone are well correlated with r = 0.815 and r = 0.840, respectively, indicating a possible dominant control on runoff responses. However, rainfall patterns show overall weak correlations (r = 0.406), implying that the precipitation temporal pattern control on the runoff response might be limited for these types of runoff events in the Wüstebach catchment. In a next step, the here defined hydrologically similar precipitation and wetness conditions will be searched in the data of the Wüstebach catchment to compare the corresponding runoff responses, and hydro-meteorological variables will be used to explain similar or different runoff responses. 

How to cite: Hövel, A., Bogena, H., Lücke, A., Stumpp, C., and Stockinger, M.: Characterizing hydrologic similarity of precipitation and catchment wetness using repeating patterns in runoff, EGU General Assembly 2023, Vienna, Austria, 23–28 Apr 2023, EGU23-5234, https://doi.org/10.5194/egusphere-egu23-5234, 2023.

EGU23-6555 | ECS | Orals | HS2.4.2

Elasticity curves describe streamflow sensitivity to precipitation across the entire flow distribution 

Bailey Anderson, Manuela Brunner, Louise Slater, and Simon Dadson

The rainfall-runoff relationship is often simplistically represented through “elasticity”, defined most frequently as the proportional change expected in average streamflow associated with a 1% change in precipitation over a given time period. Elasticity is typically estimated from the average annual streamflow, but may differ along the flow duration curve, indicating, for instance, that precipitation change has less of an effect on low flows as compared to high flows when particular catchment characteristics are present. We estimate elasticity at multiple points across the annual and seasonal streamflow distributions of 805 river gauging locations in the United States to create elasticity curves which graphically represent the responsiveness of low to high streamflow to precipitation. We show that elasticity curve type (the overall shape of the curve) corresponds closely with water storage and catchment flashiness; curve shape varies independently of the magnitude of response; and that the elasticity curves exhibit a regional pattern. We are further investigating whether elasticity curve shape and elasticity magnitude change over time. This assessment suggests that historical changes in water storage, and groundwater-surface water interaction may have led to substantial shifts in elasticity curves over time. This implies probable underestimation of future streamflow under climate change, unless relevant catchment characteristics are adequately considered 

How to cite: Anderson, B., Brunner, M., Slater, L., and Dadson, S.: Elasticity curves describe streamflow sensitivity to precipitation across the entire flow distribution, EGU General Assembly 2023, Vienna, Austria, 23–28 Apr 2023, EGU23-6555, https://doi.org/10.5194/egusphere-egu23-6555, 2023.

EGU23-6687 | ECS | Orals | HS2.4.2

Method to identify and quantify the effect of climatic and non-climatic drivers on river discharge in Europe 

Julie Collignan, Jan Polcher, Pere Quintana Seguí, and Sophie Bastin

To predict and manage the evolution of water resources is a high stake for society in the context of climate change and largely managed rivers. A first step in this endeavour is to be able to determine in the past records which of both processes has dominated changes.
We propose an innovative way to detect and quantify the changes in river discharge due to climate processes or to non climatic factors over the past century for European catchments. The Land surface model (LSM) ORCHIDEE forced with a century long climate data set is used to simulate the complex hydrological response of natural catchments to change in climatic variables. The Budyko framework is applied with a time-moving window to decompose the direct discharge response to changes in precipitation P and potential evapotranspiration PET and the indirect response due to climate induced changes in the evaporation efficiency of the watersheds. We then apply the same methodology to discharge observations from gauging stations over Europe. It enables to highlight the areas where the model misrepresents (or omits) important catchment processes and where non-natural changing factors impacting the watershed’s apparent evaporation efficiency significantly contribute to trends in the observed discharge over the century. Results over Europe show that long-term changes and variability in discharge due to climate processes are dominated by changes in P. The second main climatic driver is PET except over the Mediterranean area where water is more limiting and where intra-annual changes in the distribution of P outweigh the effect of PET trends on discharge changes. Over most catchments however and mostly in southern Spain, the changes due to factors not accounted for in the "natural" system dominate over the  century. When the focus is on decadal periods, the effect of non-climatic factors is still significant but small compare to the high effect of climate variability. Attempts to attribute non-climatic changes in the catchments evaporation efficiencies are presented. For instance, good correlations are found  between changes in the evaporation efficiency of Spain catchment with the evolution of water stored in dams showing that it is a reliable indicator of the effect of human activities on the hydrological changes of watersheds in that area. Adding the effect of land-use and land-cover changes in the current implementation of the LSM has no significant effects on the hydrological behaviour of the watersheds at the studied scale of this study. Many processes especially related to human factors impact the watershed’s apparent evaporation efficiency, often with complex and inter-correlated feedback effects and further studies are needed to better attribute the non-climatic trends detected. Further developments in LSM would allow to better include these factors. 

How to cite: Collignan, J., Polcher, J., Quintana Seguí, P., and Bastin, S.: Method to identify and quantify the effect of climatic and non-climatic drivers on river discharge in Europe, EGU General Assembly 2023, Vienna, Austria, 23–28 Apr 2023, EGU23-6687, https://doi.org/10.5194/egusphere-egu23-6687, 2023.

EGU23-7424 | ECS | Orals | HS2.4.2

Understanding the hydrological response of groundwater discharge from freezing soils to a warming climate 

Élise Devoie, Jeffrey McKenzie, Pierrick Lamontagne-Hallé, and Audrey Woo

Objective: Estimate the error introduced by the misrepresentation of soil freezing characteristic curves (SFCCs) in hydrological models and propose an improved method for modelling freezing soils.

Key Findings

  • Most SFCCs used in numerical modelling studies are chosen based on convergence behaviour as opposed to physical soil properties.
  • The choice of SFCC affects model outcomes, including governing the ice content of soils, which in turn controls the permeability and the discharge from a hydrogeologic model.

Abstract

More than half of the global terrestrial surface is subject to freezing processes, either as seasonally frozen soils or as permafrost. Soil freezing processes are represented by the soil freezing characteristic curve (SFCC) that relates soil temperature to its unfrozen water content. Unfortunately, SFCCs are frequently misrepresented in models, and often chosen based on ease of model convergence behavior as opposed to physical soil properties. With climate change and increased frequency of midwinter melt, SFCCs are becoming increasingly important in accurately predicting the hydrological response of catchments.

Two synthetic hillslopes, one for a permafrost system and one for a permafrost-free system affected by seasonal freezing, are simulated using SUTRA-ice and a selection of widely accepted SFCCs. SFCCs are drawn from literature values as well as a repository of collected SFCC data: "A Repository of 100+ Years of Measured Soil Freezing Characteristic Curves". The resulting discharge is compared for each simulation, showing that the choice of SFCC is important in controlling streamflow generation in these landscapes, and the choice of SFCC may be a previously overlooked controlling process in the hydrological behaviour of catchments with freezing soils. Further work upscaling these results to catchment and larger scales is needed.

How to cite: Devoie, É., McKenzie, J., Lamontagne-Hallé, P., and Woo, A.: Understanding the hydrological response of groundwater discharge from freezing soils to a warming climate, EGU General Assembly 2023, Vienna, Austria, 23–28 Apr 2023, EGU23-7424, https://doi.org/10.5194/egusphere-egu23-7424, 2023.

EGU23-7555 | ECS | Posters on site | HS2.4.2

Feedback between Water Availability and Crop Growth using a Coupled Hydrological – Crop Production Model 

Sneha Chevuru, Michelle T.H van Vliet, Rens L.P.H van Beek, Bram Droppers, Jerom P.M. Aerts, and Marc F.P. Bierkens

Climate change and increases in extremes, such as heatwaves and droughts, threaten crop production and food security in various regions worldwide. Irrigation is increasingly used to secure stable yields, increasing the competition for available water resources with other sectors. To assess the vulnerability of crop production under present and future drought and heatwave events, the two-sided interactions between crop growth and hydrology should be represented by a coupled model system, combining the strength of both a crop model and a global water resource model.

Our main objective, therefore, is to quantify the mutual feedback between crop production and hydrology under climate extremes (i.e., droughts and heatwaves) in various regions globally over the historical period 1990-2019. To this end, we have developed a coupled hydrological-crop model framework, coupling the PCR-GLOBWB2 water resources model to the WOFOST crop model. The coupled model framework operates on high spatiotemporal resolution (daily time step up to 5 arc minutes) to assess the two-way interaction between hydrology and crop production (maize, wheat, rice, and soybean) for irrigated and rainfed agriculture. We first established a one-way coupling to evaluate the effect of the simulated water availability in terms of soil moisture of PCR-GLOBWB2 on crop production in WOFOST. Next, we established a two-way coupling in which the vegetation dynamics of WOFOST determine the evapotranspiration, which is fed back into PCR-GLOBWB2 and affects the soil moisture status. The individual WOFOST and PCR-GLOBWB2 runs and the coupled one-way and two-way model runs were compared in terms of crop production, dynamic vegetation growth, and hydrological response. The results of our simulations will be corroborated with reported yield statistics, observed discharge data, soil moisture, evaporation data obtained from satellite remote sensing, and reported annual irrigation withdrawals to assess their validity. In addition, we will evaluate the additional variance that can be explained by the more complete process description in the coupled hydrological – crop production model framework. For example, we hypothesize that the one-way coupling overestimates the crop yields under drought-heatwave events.

How to cite: Chevuru, S., van Vliet, M. T. H., van Beek, R. L. P. H., Droppers, B., Aerts, J. P. M., and Bierkens, M. F. P.: Feedback between Water Availability and Crop Growth using a Coupled Hydrological – Crop Production Model, EGU General Assembly 2023, Vienna, Austria, 23–28 Apr 2023, EGU23-7555, https://doi.org/10.5194/egusphere-egu23-7555, 2023.

It is almost axiomatic that catchment response to precipitation is nonlinear and nonstationary, implying that each drop of rain may affect streamflow differently, depending on how it fits into the sequence of past and future precipitation.  But do most catchments exhibit similar patterns of nonlinearity and nonstationarity, or not?  If not, which ones are more nonstationary (i.e., more sensitive to antecedent precipitation)?  Which ones are more nonlinear?  And why? 

Understanding catchments’ nonlinear and nonstationary behavior requires widely applicable tools for characterizing and quantifying that behavior in the first place. Here show how catchment nonstationarity and nonlinearity can be quantified using Ensemble Rainfall-Runoff Analysis (ERRA), a data-driven, model-independent method for quantifying rainfall-runoff relationships across a spectrum of time lags.  ERRA is superficially similar to classical unit hydrograph methods, but whereas unit hydrographs assume linearity (runoff response is proportional to precipitation) and stationarity (runoff response to a given unit of rainfall is identical, regardless of when it falls), ERRA can explicitly quantify the nonlinearity and nonstationarity in rainfall-runoff relationships, directly from data.  This approach combines least-squares deconvolution (to un-scramble each input's temporally overlapping effects) with demixing techniques (to separate the effects of individual inputs, or inputs occurring under different antecedent conditions) and broken-stick regression (to quantify nonlinear dependencies). 

Not only can this approach quantify the impulse response of streamflow to precipitation, it can also quantify how this impulse response changes with rainfall rates (nonlinearity), how it varies with catchment wetness (nonstationarity), and how it differs for rain falling on different parts of the landscape (heterogeneity), even if these signals are all overprinted on one another at the catchment outlet.  Results from this approach may be informative for catchment characterization and runoff forecasting; they may also lead to a better understanding of short-term storage dynamics and landscape-scale connectivity.  Applications of these methods will be illustrated using large multi-catchment data sets from Switzerland and North America.

How to cite: Kirchner, J.: Signatures of catchment nonlinearity and nonstationarity, quantified using Ensemble Rainfall-Runoff Analysis, EGU General Assembly 2023, Vienna, Austria, 23–28 Apr 2023, EGU23-9794, https://doi.org/10.5194/egusphere-egu23-9794, 2023.

In order to investigate how annual precipitation amount (P) and potential evapotranspiration (ETp) influence the partitioning of water fluxes into flow, evaporation and transpiration, we employed the physically-based spatially explicit 3D model HydroGeoSphere in a virtual catchment running 100 scenarios with different combinations of catchment and climate properties. In addition, we looked at the changes in the transit times of the different fluxes.

Unsurprisingly, the fraction of flow increases with larger P and decreases with stronger ETp. Both transpiration and evaporation fractions generally decrease with larger P and increase with stronger ETp. However, the increase in the evaporation fraction ends for dryness indices (ETp/P) larger than 1 while the increase in the transpiration fraction continues. With regard to the transit times we found that on the one hand transpiration becomes younger in catchments with more P while it becomes older when ETp increases (vegetation has to resort to all potential water sources, also the ones deeper down and older). Evaporation and flow on the other hand become younger with larger P but become older with weaker ETp (basically, the decrease in transpiration leaves water longer in the system which is then available for older evaporation and streamflow).

This also means that an acceleration of the hydrologic cycle can be caused both by an increase or decrease in the dryness index – depending on whether this change is caused by a change in P or ETp. This can have significant impacts for predicting catchment response and solute transport in light of future climate variability.

How to cite: Heidbüchel, I., Yang, J., and Fleckenstein, J. H.: The impact of precipitation and potential evapotranspiration on water flux partitioning and transit times at the catchment scale – a modeling study, EGU General Assembly 2023, Vienna, Austria, 23–28 Apr 2023, EGU23-9827, https://doi.org/10.5194/egusphere-egu23-9827, 2023.

EGU23-10029 | ECS | Orals | HS2.4.2

Role of vegetation responses in hydrological shifts under multiyear droughts 

Hansini Gardiya Weligamage, Keirnan Fowler, Margarita Saft, Dongryeol Ryu, Tim Peterson, and Murray Peel

Drought-induced vegetation responses are often hypothesized as one of the key drivers of hydrological changes under multiyear droughts. However, until now, this hypothesis has not been systematically tested on areas that experienced significant drought-induced reductions in streamflow generation. Our results do not support this hypothesis and suggest that vegetation changes are unlikely to be the main driver of observed hydrological changes.

We employed multiple remotely sensed vegetation indices (AVHRR NDVI & fPAR, MODIS NDVI & EVI, and Ku-VOD from multiple microwave satellite sensors) and rainfall-runoff shift indicators to investigate vegetation responses and their influences on streamflow generation during the Millennium Drought (from 1997 to 2009) in 156 catchments in Victoria, Australia. Many of these catchments experienced significant shifts in their rainfall-runoff relationship by severely reducing streamflow generation during the Millennium Drought. However, we show that vegetation indices are statistically similar or higher in many catchments during the Millennium Drought compared to pre-drought, consistent with published literature. Moreover, the spatial pattern of increase in vegetation indices does not match the spatial distribution of hydrological shifts, measured by significant streamflow reductions for a given rainfall. We argue that vegetation response is unlikely to be a primary driver of the observed hydrological shifts, although they are regarded as crucial in determining hydrological behaviour more generally. This finding has important implications for better understanding and modelling hydrological responses under future climate changes.

How to cite: Gardiya Weligamage, H., Fowler, K., Saft, M., Ryu, D., Peterson, T., and Peel, M.: Role of vegetation responses in hydrological shifts under multiyear droughts, EGU General Assembly 2023, Vienna, Austria, 23–28 Apr 2023, EGU23-10029, https://doi.org/10.5194/egusphere-egu23-10029, 2023.

The Soyang Dam is a main multi-purpose dam for preventing floods and supplying water to the metropolitan area, including Seoul, located in the Han River basin. This research explored the predictability of streamflow that plays a critical role in the reservoir operation of the Soyang Dam in South Korea. A novel stochastic approach was used to offer skillful season-ahead streamflow forecasting during the monsoon season (June-July-August, JJA) using climate state variables (e.g., SST, SLP, and wind anomalies) and dynamic climate forecasts simulated from global climate models (GCMs), as predictors. Further, we employes autoregressive exogenous stochastic volatility(ARXSV) model for streamflow prediction with the predictors that were identified within a Hierarchical Bayesian modeling framework. A cross-validation experiment under different synoptic patterns is performed to test the efficacy of the proposed modeling process. Finally, this study will investigate the effectiveness of streamflow forecasts as a precursor of the hydrological drought condition for the upcoming season.


Acknowledgement

This research was supported by a grant(2022-MOIS63-001) of Cooperative Research Method and Safety Management Technology in National Disaster funded by Ministry of Interior and Safety(MOIS, Korea). This work was partially funded by the Korea Meteorological Administration Research and Development Program under Grant KMI 2018-07010.

How to cite: Cho, H., Sofia, P., Kang, S., and Kwon, H.-H.: Streamflow prediction and drought index production based on the Bayesian autoregressive exogenous stochastic volatility model using climate factor, EGU General Assembly 2023, Vienna, Austria, 23–28 Apr 2023, EGU23-10340, https://doi.org/10.5194/egusphere-egu23-10340, 2023.

EGU23-11729 | ECS | Posters on site | HS2.4.2

Effect of antecedent rainfall on daily flow forecasting using a soil moisture accounting algorithm  

Zahra Eslami, Khodayar Abdollahi, and James W Kirchner

Studies have shown both rainfall and soil moisture have a noticeable impact on daily runoff generation. In many cases, measured soil moisture data are unavailable, and soil moisture is instead estimated by various proxies, including the sum of precipitation over a number of days. Here we test the predictive value of antecedent rainfall for daily flow forecasting, using the Kuhesookhteh Watershed in Iran as a test case. A 20-year runoff time series was simulated using the Soil Moisture Accounting Algorithm of HEC-HMS. The results showed a Nash-Sutcliffe Efficiency of 0.67 for the calibration period (2000-2015) and 0.53 for the validation period (2015-2020).

Comparisons of daily simulated and observed flows show that the soil moisture accounting algorithm did not forecast the high values of streamflow well. We found a non-linear relationship between antecedent precipitation and the residuals of the flow simulation. Flow simulations substantially improved (i.e., residuals substantially decreased) when up to 4-5 days of antecedent rainfall were used as soil moisture proxies; further extending this antecedent rainfall interval to 7 days resulted in only minor further improvement. Since antecedent rainfall can be considered as a proxy for soil moisture, we infer that soil moisture acts as a system memory that retains information for at least 4-5 days. This inference is also supported by a data-driven, model-independent technique (Ensemble Rainfall-Runoff Analysis), applied to quantify the nonstationary runoff response of the Kuhesookhteh Watershed under different levels of antecedent rainfall

Keywords: soil water balance, surface abstraction, effective rainfall, water budget


How to cite: Eslami, Z., Abdollahi, K., and Kirchner, J. W.: Effect of antecedent rainfall on daily flow forecasting using a soil moisture accounting algorithm , EGU General Assembly 2023, Vienna, Austria, 23–28 Apr 2023, EGU23-11729, https://doi.org/10.5194/egusphere-egu23-11729, 2023.

EGU23-11953 | ECS | Orals | HS2.4.2

An Integrated Health Assessment of an Agriculture-Dominated River Basin in India 

Lingaraj Dhal and Mitthan Lal Kansal

Watersheds are geographically distinct landscape features with complex webs of interactions among physical, ecological, and social factors. Thus, watersheds are complex and dynamic systems. In addition, watersheds offer various ecosystem services that are crucial for society. Their ability to deliver these services is determined by the current state of the watershed. Therefore, the watershed health assessment is essential for the efficient management of the watershed. The purpose of this research is to comprehensively evaluate the watershed health using a risk-based (Reliability-Resilience-Vulnerability) framework for the 30 watersheds of the Budhabalanga River basin in India. To accomplish this hydrological modelling with Soil & Water Assessment Tool (SWAT), a remote sensing approach and field data have been used. The SWAT model is calibrated from 1995 to 2009 and validated from 2010 to 2017 with NSE > 0.65, R2 > 0.70, and PBIAS < ±10.  To determine the three most important sub-indicators of watershed health i.e., reliability, resilience and vulnerability (R-R-V), suitable criteria and acceptable thresholds are taken into account.  Using the sub-indicators an Integrated Watershed Health Index is developed for all watersheds during the period 2000 to 2020.  Further, the change detection approach is used to study the temporal variation of watershed health during the last two decades. The study revealed that the upstream watersheds are healthier than the other watersheds. In addition, the study will be useful for the watershed managers of the Budhabalanga River basin to prepare a strategic road map for sustainable watershed management. The proposed method can be used as a handy tool for watershed health assessment for any other watershed.

How to cite: Dhal, L. and Kansal, M. L.: An Integrated Health Assessment of an Agriculture-Dominated River Basin in India, EGU General Assembly 2023, Vienna, Austria, 23–28 Apr 2023, EGU23-11953, https://doi.org/10.5194/egusphere-egu23-11953, 2023.

EGU23-11988 | Orals | HS2.4.2

Identifying hydrological regularities via perceptual models at the regional scale 

Fabrizio Fenicia and Jeffrey J. McDonnell

Identifying hydrological regularities, such as patterns and laws that explain the observed variability in catchment response, is an important objective of catchment hydrology. These insights could contribute regional knowledge that can be exploited in catchment classification studies and improve model realism and parsimony. But how to infer such regularities, and to what extent are they generalizable, in view of the evidence of uniqueness of place? In this presentation, we propose the development of a regional scale perceptual model as a framework to stimulate the search of hydrological regularities and to represent them visually. Our approach is intended for nested catchments, a scale that we consider is sufficiently large to provide an interesting contrast in hydrological responses, but sufficiently small to encompass local dominant process that may be different elsewhere. Our perceptual model development approach is demonstrated in the 27,000 km2 Moselle catchment, using streamflow data at 26 nested subcatchments, and commonly available data of landscape properties, including topography, vegetation, geology and soil. The identified signatures of streamflow spatial variability highlighted the role of precipitation, geology and topography, which affected, respectively the average flows, base runoff and lag time. Soil and vegetation, on the other hand, were not found to be a dominant cause of hydrograph variability, which might appear surprising, considering that soil properties are one of the key ingredients of many distributed models. The framework undertaken in this study may be useful to develop perceptual models in other basins at regional scale, and to map and regularize the variety of dominant hydrological processes.

How to cite: Fenicia, F. and McDonnell, J. J.: Identifying hydrological regularities via perceptual models at the regional scale, EGU General Assembly 2023, Vienna, Austria, 23–28 Apr 2023, EGU23-11988, https://doi.org/10.5194/egusphere-egu23-11988, 2023.

EGU23-12779 | ECS | Orals | HS2.4.2

Reach-scale streamflow projections in intermittent riversthrough a multivariate dowscaling method and a distributed hydrologcal model 

Alexandre Devers, Louise Mimeau, Annika Künne, Jean-Philippe Vidal, Claire Lauvernet, Flora Branger, and Sven Kralisch

Global bias-adjusted daily climate projections have been recently set up as part of the Inter-Sectoral Impact Model Intercomparison Project (ISIMIP) phase 3 based on CMIP6 projections (Lange et Büchner., 2021). This dataset is aimed at being used as input to global hydrological models, and their coarse resolution however prevents them to be used for catchment-scale and reach-scale applications.

This work proposes to downscale these global climate projections through multivariate analog downscaling method and to derive catchment-scale streamflow time series through a fully-distributed hydrological model. The final objective is to produce future daily streamflow series over a high-resolution hydrographic network of 6 European catchment case studies for the DRYvER project (Datry et al., 2021). The method is applied on precipitation, temperature, and potential evapotranspiration serving as input to the distributed JAMS-J2K model (Krause et al., 2006).

This setup led to the creation of daily hydrological projections at high spatial resolution over the 1985-2100 period. These experiments are conducted using one run from 5 different global climate models and 3 emission/socio-economic scenarios (SSP1-RCP2.6, SSP3-RCP7.0 and SSP5-RCP8.5) from the CMIP6 experiments. This methodology allows to grasp the range of future changes in daily streamflow over the entire catchments. The comparison between the historical period (1985-2014) and future periods is used to describe possible changes over seasonal discharge and low flow characteristics.

This approach provides hydrological projections with a spatial resolution sufficiently high to apply flow intermittence detection, thus allowing to study plausible futures for European intermittent rivers in terms of hydrology, biodiversity, ecosystem functioning and services, and adaptive management. Future steps will refine such futures using an innovative downscaling approach combining global and catchment-scale transient projections to better grasp the joint influence of climate change and climate variability on reach-scale intermittence.


Datry et al. (2021) Securing Biodiversity, Functional Integrity, and Ecosystem Services in Drying River Networks (DRYvER). Research Ideas and Outcomes. https://doi.org/10.3897/rio.7.e77750.

Krause et al. (2006) Multiscale investigations in a mesoscale catchment: hydrological modelling in the Gera catchment. Advances in Geosciences. doi:10.5194/adgeo-9-53-2006.

Lange et Büchner (2021) ISIMIP3b bias-adjusted atmospheric climate input data (v1.1), ISIMIP Repository. doi:10.48364/ISIMIP.842396.1.

Clemins et al. (2019) An analog approach for weather estimation using climate projections and reanalysis data. Journal of Applied Meteorology and Climatology. doi:10.1175/JAMC-D-18-0255.1

How to cite: Devers, A., Mimeau, L., Künne, A., Vidal, J.-P., Lauvernet, C., Branger, F., and Kralisch, S.: Reach-scale streamflow projections in intermittent riversthrough a multivariate dowscaling method and a distributed hydrologcal model, EGU General Assembly 2023, Vienna, Austria, 23–28 Apr 2023, EGU23-12779, https://doi.org/10.5194/egusphere-egu23-12779, 2023.

EGU23-13271 | Posters on site | HS2.4.2

The effect of land use on hydrological processes in the Svratka river basin 

Tomáš Ghisi, Milan Fischer, Jana Bernsteinová, Jakub Bohuslav, Zdeněk Žalud, Evžen Zeman, and Miroslav Trnka

The Svratka river basin represents an important water resource in the South Moravian Region of the Czech Republic. Due to its relatively low aridity index (the ratio of precipitation to potential evapotranspiration), it belongs to river basins sensitive to climate change. This is also supported by significant negative runoff trends over the past 40 years. The aim of this study is to evaluate the impacts of a hypothetical land use change on the hydrological processes of the Svratka river basin. We used a physically based and spatially distributed hydrological model Mike SHE. The Mike SHE model was calibrated and validated using measured river discharge data in the three hydrological profiles in the Svratka basin for the period 1981–2020. Several land use scenarios were tested against the reference scenario (i.e. current land use) to analyze the impacts of land use change. The land use scenarios encompassed the following hypothetical extreme changes where the entire basin in the model was changed to (i) grassland, (ii) mixed deciduous-coniferous forest, (iii) deciduous forest, or (iv) cropland. These extreme land use scenarios were tested for the baseline period 1981–2020 and also for several CMIP6 downscaled climate models and different socioeconomic pathways (emissions scenarios) up to the end of the 21st century. The results showed that the evapotranspiration was the highest for mixed deciduous-coniferous forest while the lowest was the grassland scenario and cropland . The lowest total runoff from the river basin was simulated for both forest scenarios (mixed forest and deciduous forest). The results also demonstrated that the dominant loss component for all scenarios of the water balance in the Svratka river basin is evapotranspiration. The sensitivity of the hydrological balance in the Czech landscape was also demonstrated, where a slight increase in the evapotranspiration value in the basin has a significant effect on the total runoff from the Svratka basin. The climate change scenarios additionally suggest further exacerbating the water balance and runoff decline in the region. The results of this study are a first step towards evaluating and designing nature-based adaptation measures to climate change in the Svratka river basin.


Acknowledgment:
The research infrastructure and CzechGlobe team was financially supported by the SustES - Adaptation strategies for sustainable ecosystem services and food security under adverse environmental conditions (CZ.02.1.01/0.0/0.0/16_019/0000797). The study was also supported by the Internal Grant Agency of the AgriSciences faculty at Mendel University in Brno (AF-IGA2023-IP-031).

How to cite: Ghisi, T., Fischer, M., Bernsteinová, J., Bohuslav, J., Žalud, Z., Zeman, E., and Trnka, M.: The effect of land use on hydrological processes in the Svratka river basin, EGU General Assembly 2023, Vienna, Austria, 23–28 Apr 2023, EGU23-13271, https://doi.org/10.5194/egusphere-egu23-13271, 2023.

EGU23-13465 | ECS | Orals | HS2.4.2

Uncertainty in representation of ecosystem processes in Europe by the Community Land Model v5 

Christian Poppe Terán, Bibi S. Naz, Harrie-Jan Hendricks-Franssen, and Harry Vereecken

Understanding hydrological and biogeochemical ecosystem process variability in response to a changing climate is important to improve land surface models and assess current and future states of ecosystem functioning. However, the representation of spatial heterogeneity of ecosystem processes in state-of-the-art land-surface models has not been evaluated thoroughly until today. Here we compare gross primary production (GPP) and evapotranspiration (ET) simulated by the Community Land Model version 5 (CLM5) for the period 1995-2018 over the Euro-CORDEX domain with in-situ data from eddy-covariance sites as well as remote sensing and reanalysis data. Additionally, we conducted a parameter sensitivity analysis to identify the impact of uncertainty coming from ecosystem parameters (in particular default parameters for given plant functional types) for selected sites in Europe. 


Our results show that GPP and ET variation across hydroclimates show in general a good agreement between CLM5 and remote sensing and reanalysis products. However, both GPP and ET simulated by CLM5 show large differences with measured in-situ data, depending on the ecosystem type. Further, we identify sensitive parameters that will be adjusted to improve ecosystem representation in CLM5 in a future study. This work is important to improve land surface models and parameterization of plant functional types to understand and improve predictions of ecosystem functioning.

How to cite: Poppe Terán, C., S. Naz, B., Hendricks-Franssen, H.-J., and Vereecken, H.: Uncertainty in representation of ecosystem processes in Europe by the Community Land Model v5, EGU General Assembly 2023, Vienna, Austria, 23–28 Apr 2023, EGU23-13465, https://doi.org/10.5194/egusphere-egu23-13465, 2023.

Hydrological models are now widely used to simulate the impacts of global warming on water resources. They are therefore credited with the ability to represent the evolution of the hydrological cycle under the effect of the increase in temperature, and in particular that of the evapotranspiration term. However, the analysis of recent hydrological trends in a large number of French basins already highlights the effect of the increase in temperature and evapotranspiration on river runoff. We are therefore seeking to evaluate and understand the climatic sensitivity of the MORDOR-SD hydrological model developed and used at EDF (Garavaglia et al. 2017). The capacity of the model to reproduce the hydrological trends observed over a large catchment dataset is analysed for different calculations and formulations of potential evapotranspiration. The results obtained suggest that, beyond the choice of formulation (very simplified as a function of temperature or complete as a function of all the climatic variables), it is the consideration of trends in solar radiation and surface albedo that makes it possible to explain the evolution of evapotranspiration and flows in France. The evolution of vegetation cover also appears to be a sensitive factor, rarely taken into account and promising for future studies.

How to cite: Le Lay, M. and Gailhard, J.: Climate sensitivity of hydrological models. Impact of evapotranspiration calculation on the simulation of recent hydrological trends in France., EGU General Assembly 2023, Vienna, Austria, 23–28 Apr 2023, EGU23-13805, https://doi.org/10.5194/egusphere-egu23-13805, 2023.

EGU23-14354 | ECS | Posters on site | HS2.4.2

Influence of evapotranspiration formulation on long-term trends (1980-2022) of the Adige river basin hydrological water budget. 

Senna Bouabdelli, Martin Morlot, Christian Massari, and Giuseppe Formetta

The Adige river basin (~11000 square kilometers) is the second longest in Italy and affects the population living in the Trentino-Alto Adige and Veneto region. It is an example of hydrological complex river basin because it includes high anthropization causing intensive and often conflicting water uses, presence of seasonal snow cover with runoff delayed from snow falling season to late Spring and Summer, glaciers, and irrigated areas, which are important for food production of the region.

In this work, we model the hydrological cycle of the Adige river basin over the period 1980-2022, investigating the effect of three evapotranspiration formulations on the long term trends of each hydrological compartments, i.e. soil moisture, groundwater storage, and river runoff. The modeling part is implemented by exploiting the potential of the open-source, semi-distributed, component-based hydrological modeling system GEOframe modeling system, which is applied at daily time-step and at a high spatial resolution (<5 km²).

The model, together with the different evapotranspiration formulations, has been validated against river runoff and satellite retrieved soil moisture data. Results, which have been analyzed also in the context of the 2022 drought which hit Northern Italy, show that increasing the complexity of the evapotranspiration formulation improved model performances for all the simulated hydrological components.

How to cite: Bouabdelli, S., Morlot, M., Massari, C., and Formetta, G.: Influence of evapotranspiration formulation on long-term trends (1980-2022) of the Adige river basin hydrological water budget., EGU General Assembly 2023, Vienna, Austria, 23–28 Apr 2023, EGU23-14354, https://doi.org/10.5194/egusphere-egu23-14354, 2023.

EGU23-15133 | ECS | Orals | HS2.4.2

Hydrological response to bias-corrected global climate projections data 

Joost Buitink and Frederiek Sperna Weiland

Global climate models (GCMs) provide potential climate scenarios and are used to understand effects of future climate change. A large number of GCMs is included in the sixth phase of the Coupled Model Intercomparison Project (CMIP6), and these models simulated both the historical and future climate. For the future climate, multiple scenarios are simulated based on different shared socioeconomic pathways and representative concentration pathways. The daily output from these models can be used to force hydrological models, to understand how the hydrological system responds to a changing climate. For this study we focus on the use of the available state-of-the-art ensemble of GCMs to obtain a first climate change signal for the changes in mean and extreme flows of the river Rhine.

However, as the CMIP6 models are all global models, they are known to contain biases at regional scales. Yet, by directly using the GCMs we can obtain the full projection space of the CMIP6 models. Output from the CMIP6 models is often bias-corrected to ensure accurate values for regional applications. For an application in the Netherlands, we investigated the role of bias correction on the hydrological response of the Rhine and Meuse river basins, as these basins play a vital role for the Dutch water safety and security. The hydrological model wflow_sbm is used to simulate both basins and is forced with the CMIP6 data for both the historical and future climate (following the SSP5-8.5 pathway). The results from these simulations highlight the role of bias-corrected forcing data on the simulated discharge characteristics for both the Rhine and Meuse river basins. In the near future the work will be extended with RCM simulations.

How to cite: Buitink, J. and Sperna Weiland, F.: Hydrological response to bias-corrected global climate projections data, EGU General Assembly 2023, Vienna, Austria, 23–28 Apr 2023, EGU23-15133, https://doi.org/10.5194/egusphere-egu23-15133, 2023.

EGU23-16055 | Orals | HS2.4.2

Re-assessing PET regularities at the global scale 

Berit Arheimer, Rafael Pimentel, Louise Crochemore, Jafet Andersson, Ilias Pechlevanidis, and David Gustafsson

The importance of evapotranspiration (ET) for hydrology, agriculture, and meteorology has long been recognized. In fact, most of our current understanding of the physics of evaporation originated in early experiments during the past two centuries. Potential ET (PET) is a concept extendedly used for predicting ET and defined as the evaporation in case of an unlimited amount of water available. Different potential evapotranspiration (PET) formulas were developed for different purposes and are currently applied far beyond their origin. Accordingly, these formulas also result in different PET estimates due to their different assumptions and inputs requirements; hence, the regularities of the formulas should be re-assessed when applied for new scales or environmental conditions.

In the current study, we experimented with three simplified PET models over the globe: Jensen-Haise, Hargreaves, and Priestly-Taylor. The World-Wide HYPE (WW-HYPE) global catchment hydrological model is applied as a virtual laboratory where we keep all other hydrological predictors constant except for PET to examine its influence on the model performance in term of streamflow and ET. 15 years of observations from 5,338 streamflow gauges and global evapotranspiration from Earth-observations (MOD16) were used as independent datasets. We tested model performance in a multi-process approach to select the best formula for catchments covering the global landmass. Catchment physiography and a classification in the Budyko space were used to explain differences in the model results.

From comparing the results with land-cover, climate classification, water-energy limitations, we found that climate is the main driver behind the spatial patterns in model performance. We found a strong connection between the five main Köppen regions and the PET formulas, further supported by landcover analysis. The selection of a PET formula seems to be more critical in tropical regions close to the equator, where the differences in performance are above 50%. This is also where PET is highest. Hargreaves was the best PET formula in 50% of the catchments, most of them located in the Amazonas, central Europe, and Oceania. Jensen-Haise was better for catchments in northern latitudes (36%). Finally, Priestly-Taylor was the best formula for India and latitudes above 65⁰ N. Hence, the PET formulas differed in their capacity to provide useful input to the water balance modelling, with complex formulas only giving improved predictions in temperate and polar regions; however, for the rest of the globe simpler formulas were better. We thus recommend applying different PET formulas based on climatic regions world-wide.


References:

Arheimer et al., 2020: Global catchment modelling using World-Wide HYPE (WWH), open data and stepwise parameter estimation, HESS 24, 535–559, https://doi.org/10.5194/hess-24-535-2020   

Pimentel et al., 2023: Which Evapotranspiration Formula to Use in Hydrological Modelling World-wide? WRR (in review)

How to cite: Arheimer, B., Pimentel, R., Crochemore, L., Andersson, J., Pechlevanidis, I., and Gustafsson, D.: Re-assessing PET regularities at the global scale, EGU General Assembly 2023, Vienna, Austria, 23–28 Apr 2023, EGU23-16055, https://doi.org/10.5194/egusphere-egu23-16055, 2023.

EGU23-16897 | Orals | HS2.4.2

Climatic origin of hydrological response 

Basudev Biswal and Prashant Istalkar

Hydrological processes leading to flow in river channels are extremely complex, which is why hydrologists have not yet found any fundamental law to explain river flow dynamics at basin-scale. Hydrological models generally keep a set of free parameters that need to be calibrated using observed discharge time series data. The underlying assumption is that each catchment is unique and that each model parameter represents certain catchment characteristics. Thus, prediction in ungauged basins is a challenge. In this study, it is argued that we should focus on developing calibration-free hydrological models. In other words, we hypothesize that hydrological response is primarily determined by climatic inputs. We compared the dynamic Budyko (DB) rainfall-runoff model with the HBV model considering a global dataset. The two models showed very similar performance across geographical regions, supporting our hypothesis. We conclude that more efforts should be made to develop rainfall-runoff models that exploit climatic information for explaining streamflow variation.

How to cite: Biswal, B. and Istalkar, P.: Climatic origin of hydrological response, EGU General Assembly 2023, Vienna, Austria, 23–28 Apr 2023, EGU23-16897, https://doi.org/10.5194/egusphere-egu23-16897, 2023.

EGU23-2835 | ECS | Orals | HS2.4.3

Common streamflow dynamics unraveled the heavy-tailed flood distributions 

Hsing-Jui Wang, Ralf Merz, Soohyun Yang, and Stefano Basso

Flood frequency distributions with heavy-tailed indicate a sizable chance of the occurrence of extreme floods. When heavy-tailed flood behavior is reliably identified, flood hazards caused by the unexpected can be reduced. However, for cases with limited or varying record lengths it is challenging to robustly estimate tail behavior with currently used indices, which rely solely on the graphical or mathematical performance of limited observations and are regardless of the physical processes.

In this work, we start by analyzing runoff generation processes and show that the hydrograph recession is a proper descriptor of the emergence of heavy-tailed behavior of flood frequency distributions. We then examine it in a large set of seasonal case studies, which encompasses a variety of climate and physiographic conditions across Germany. Our results show that the newly proposed approach can detect cases with heavy-tailed behavior, and compare severity across cases by evaluating their tail heaviness. Remarkably, it displays robust identification of heavy/nonheavy-tailed behavior for cases with short data records, benchmarked against two other frequently used metrics for heavy tails in hydrological studies, i.e., the upper tail ratio and the shape parameters of generalized extreme value distributions.

We highlight that the proposed method leverages the information of common discharge dynamics for inferring heavy-tailed flood behavior, which addresses the main limitations of currently used metrics and provides information on the characteristic flood hazard of river basins.

This study summarizes results of the DFG-funded project "Propensity of rivers to extreme floods: climate-landscape controls and early detection - PREDICTED" (Deutsche Forschungsgemeinschaft - German Research Foundation, Project Number 421396820).

How to cite: Wang, H.-J., Merz, R., Yang, S., and Basso, S.: Common streamflow dynamics unraveled the heavy-tailed flood distributions, EGU General Assembly 2023, Vienna, Austria, 23–28 Apr 2023, EGU23-2835, https://doi.org/10.5194/egusphere-egu23-2835, 2023.

EGU23-2938 | Posters virtual | HS2.4.3

Spatio-temporal flood inundation modeling in the Andes Huallaga basin in Peru 

Waldo Lavado-Casimiro, Jonathan Qquenta, Cristian Montesinos, Henry Asencios, and Oscar Felipe

The present research focuses on evaluating the prediction capacity of the hydrological flood model called Rainfall-Runoff-Inundation (RRI), using observed data and satellite remote sensing in order to produce flood maps of the Alto Huallaga basin in Peru. The RRI model required as input data the topographic map of the region (we use FABDEM product), information on vegetation cover and land use obtained from FAO-UNESCO, and precipitation and evapotranspiration data from the Peruvian Interpolation data of the SENAMHI's Climatological and Hydrological observations (PISCO).

The RRI model was evaluated for the 2014-2019 period, previously carrying out a sensitivity analysis process of the parameters and estimating the geometric parameters of the RRI model using information from satellite altimetry and remote sensing. The hydrological part of the model is calibrated at 2 hydrological stations on the Huallaga River (Tingo María and Tocache), obtaining acceptable results with Kling-Gupta (KGE) coefficients above 0.7 for both stations during the calibration and validation period. In addition, satellite images of the MODIS product were used for the part of flood maps, compared with the results of the RRI (flood areas), obtaining acceptable statistics when comparing the resulting images.

This work is part of the results of the Enandes project (Enhancing Adaptive Capacity of Andean Communities through Climate Services) implemented in Peru that seeks to improve climate services in Peru with an emphasis on disaster risk management in Andean basins regarding floods.

How to cite: Lavado-Casimiro, W., Qquenta, J., Montesinos, C., Asencios, H., and Felipe, O.: Spatio-temporal flood inundation modeling in the Andes Huallaga basin in Peru, EGU General Assembly 2023, Vienna, Austria, 23–28 Apr 2023, EGU23-2938, https://doi.org/10.5194/egusphere-egu23-2938, 2023.

EGU23-3382 | Posters on site | HS2.4.3

Recent Developments in the Application of the Derived Distribution Approach to Flood Frequency 

Ross Woods, Yanchen Zheng, Roberto Quaglia, Yiming Yin, Giulia Giani, Gemma Coxon, Dawei Han, Miguel Rico-Ramirez, and Rafael Rosolem

Flood estimation in ungauged basins is important for flood design, and for improving our understanding of the sensitivity of flood magnitude to changes in climate and land cover. Flood estimates by current methods (e.g. statistical regression, unit hydrograph) have high uncertainty, even in places with dense observing networks (e.g. +/- 50-100% in the UK). Reductions in this uncertainty are being sought by using alternative methods, such as continuous simulation using hydrological models (spatially-distributed or lumped), and event-scale derived distribution approaches. There are very significant challenges for reliable application of continuous simulation models to extreme events in ungauged catchments.

The event-scale derived distribution approach also has challenges, which we explore below. The derived distribution approach at the event scale typically combines the following elements: a stochastic rainfall model, an event-scale rainfall-runoff model (including “losses” and a “baseflow” component), and a runoff routing model. In principle, every element of this approach may be considered as a (seasonally varying) random variable. The flood peak distribution is obtained by integrating over joint distributions of the model elements.

First challenge: what is the physical basis for estimating the event runoff coefficient? In the 1970s, this was addressed using infiltration theory, but other runoff generation mechanisms are often more important. We suggest: (i) begin with locations which are dominated by a small number of runoff generation mechanisms (ii) make use of existing theory on links between climate, catchment characteristics and seasonal water balance (iii) exploit large samples of data where available. I will briefly summarise our progress on this topic in the UK, using a largely empirical approach, though with an eye to later exploring a process-based explanation.

Second challenge: how do we parsimoniously quantify the impacts of within-storm temporal and spatial rainfall patterns on the flood hydrograph? Existing approaches use stochastic rainfall models to explicitly generate (hourly) time series (or fields) of rainfall; since catchments damp out high frequency forcing, these rainfall series often contain excessive detail and obscure the most informative interactions between rainfall and catchment response. We propose stochastic models that can generate hydrologically relevant attributes of rainfall events (e.g. intensity/depth/duration, spatial and temporal moments), and then apply rainfall-runoff transformations which operate on rainfall moments, and do not require excess detail in temporal (or spatial) patterns of rainfall. I will present recent results showing that it is feasible to summarise rainfall characteristics in this way, and that spatial patterns in rainfall do play a role in determining flood magnitude, but only in some events.

Third challenge: How well does existing theory (Woods & Sivapalan et al 1999, Viglione et al 2010, Gaál et al, 2012) combine the spatial and temporal moments of a rainfall event with catchment characteristics, in order to predict the hydrograph temporal characteristics, especially the temporal variance, a measure of temporal dispersion? Successful applications of this theory (which depends ultimately on geomorphological dispersion) will require (i) neglect of some covariance terms (ii) a strategy for estimating hillslope travel times relevant to floods (iii) reasonable estimates of the characteristic river network celerity for ungauged catchments.

How to cite: Woods, R., Zheng, Y., Quaglia, R., Yin, Y., Giani, G., Coxon, G., Han, D., Rico-Ramirez, M., and Rosolem, R.: Recent Developments in the Application of the Derived Distribution Approach to Flood Frequency, EGU General Assembly 2023, Vienna, Austria, 23–28 Apr 2023, EGU23-3382, https://doi.org/10.5194/egusphere-egu23-3382, 2023.

EGU23-5152 | ECS | Posters on site | HS2.4.3

Improving estimation of space-time dynamics of floods in Europe by combining modelled and observed flood impact data 

Dominik Paprotny, Alois Tilloy, Michalis I. Vousdoukas, Simon Treu, Luc Feyen, Heidi Kreibich, Belinda Rhein, and Matthias Mengel

Long-term trends in flood losses are regulated by multiple factors including climate variation, demographic dynamics, economic growth, land-use transitions, reservoir construction and flood adaptation measures. Attributing losses to any of those factors for historical flood events would require the ability to recalculate reported impacts (such as area inundated, fatalities, persons affected or economic loss) under counterfactual scenarios. Here, we present how observed flood impacts that have occurred in 42 European countries since 1950 can be compared with model simulations as a step towards climate change attribution of flood losses. Firstly, we reconstructed the potential footprints and inundation depths of individual riverine and coastal flood events. This was made possible by combining continuous simulations of river discharges (based on the LISFLOOD model) and storm surge heights (based on the Delft3D model) with flood hazard maps derived through hydrodynamic modelling. Then, the flood footprints were intersected with a set of time-varying, high-resolution exposure maps of land use, population and asset values in Europe since 1950 (based on the HANZE-Exposure v2.0 model). Modelled potential flood damage can then be evaluated against historical records of flood occurrences and their impacts. To this end, we are collecting dates, locations and, where available, impact statistics of floods in an updated HANZE-Events database. By comparing which potential floods did cause impacts, in which locations and to what magnitude, and which floods were prevented by flood protection, it will be possible to infer flood vulnerability and preparedness across time and space. Available preliminary results enable presenting the space-time dynamics of European flood damages under different exposure scenarios.

How to cite: Paprotny, D., Tilloy, A., Vousdoukas, M. I., Treu, S., Feyen, L., Kreibich, H., Rhein, B., and Mengel, M.: Improving estimation of space-time dynamics of floods in Europe by combining modelled and observed flood impact data, EGU General Assembly 2023, Vienna, Austria, 23–28 Apr 2023, EGU23-5152, https://doi.org/10.5194/egusphere-egu23-5152, 2023.

EGU23-5335 | ECS | Orals | HS2.4.3

Long-term trends in European extreme floods from 1950 to 2020 

Aloïs Tilloy, Dominik Paprotny, Lorenzo Mentaschi, Simon Treu, Stefan Lange, Alessandra Bianchi, Peter Salamon, Stefania Grimaldi, Goncalo Gomes, Matthias Mengel, and Luc Feyen

Hydrological extremes are non-stationary, displaying long-term trends and natural oscillations. These changes in extremes can be driven by multiple factors including climatic (climate variability, climate change) and socio-economic (land use changes, water management changes) factors. In this work, we analyse extreme river flows in Europe for the period 1950-2020. We aim to identify long-term trends in extreme floods and estimate the contribution of the two aforementioned factors in these trends. The assessment is performed with modelled streamflow data generated with the spatially distributed physically based model LISFLOOD. We force the model with bias-corrected and statistically downscaled climate data derived from the ERA5-Land climate reanalysis and the EMO-5 dataset. We also created a variant of the climate dataset with the global warming effect removed statistically from the data. Return periods of extreme flood events are estimated through a non-stationary extreme value analysis for each river point with an upstream area greater than 100 km2. To disentangle the influence of the different factors driving changes in extreme flows, the hydrological model is run under various scenarios: (i) historical (historical climate and dynamic socio-economic) (ii) static society (historical climate and static socio-economic), (iii) counterfactual climate (historical climate without global warming and dynamic socio-economic). Available preliminary results enable presenting long-term space-time dynamics of European floods.

How to cite: Tilloy, A., Paprotny, D., Mentaschi, L., Treu, S., Lange, S., Bianchi, A., Salamon, P., Grimaldi, S., Gomes, G., Mengel, M., and Feyen, L.: Long-term trends in European extreme floods from 1950 to 2020, EGU General Assembly 2023, Vienna, Austria, 23–28 Apr 2023, EGU23-5335, https://doi.org/10.5194/egusphere-egu23-5335, 2023.

EGU23-5507 | ECS | Orals | HS2.4.3

Heavy tail controls along the flood process cascade 

Elena Macdonald, Bruno Merz, Björn Guse, Viet Dung Nguyen, Xiaoxiang Guan, and Sergiy Vorogushyn

Many observed precipitation and streamflow time series show heavy tail behaviour. This means that the occurrence probability of extreme events is higher than for distributions with an exponentially receding tail. Neglecting heavy tail behaviour can therefore lead to an underestimation of rarely observed, high-impact events. Using long time series and a better understanding of the relevant process controls can help with more robust estimation of upper tail behaviour. Here, a conceptual rainfall-runoff model is used to analyse how precipitation and runoff generation characteristics affect the upper tail of flood peak distributions. Long, synthetic precipitation time series with different tail behaviour are produced by a stochastic weather generator and used as input for a rainfall-runoff model. In addition, catchment characteristics linked to a threshold process in the runoff generation are varied between model runs. The upper tail behaviour of the simulated discharge times series is characterized with the shape parameter of the generalized extreme value distribution (GEV).

Our analysis shows that the rainfall distributions asymptotically govern the flood peak distributions above a certain, catchment-specific return period. Below this return period, threshold processes in the runoff generation lead to heavier tails of flood peak distributions. We conclude that, for return periods that are mostly of interest to flood risk management, runoff generation is often a more pronounced control of flood heavy tails than precipitation.

How to cite: Macdonald, E., Merz, B., Guse, B., Nguyen, V. D., Guan, X., and Vorogushyn, S.: Heavy tail controls along the flood process cascade, EGU General Assembly 2023, Vienna, Austria, 23–28 Apr 2023, EGU23-5507, https://doi.org/10.5194/egusphere-egu23-5507, 2023.

EGU23-5595 | ECS | Orals | HS2.4.3 | Highlight

Flood changes in Europe: from detection to attribution 

Miriam Bertola, Alberto Viglione, David Lun, and Günter Blöschl

Floods are the most frequent natural disaster in Europe, and there is evidence of changes in their magnitude and frequency during the last decades. Previous studies typically analysed trends in mean annual flood discharges. However, changes in larger and less frequent floods (e.g., the 100-year flood) as well as their causes have not yet been assessed in a quantitative and consistent way. This contribution describes the journey from the detection to the attribution of flood changes in Europe though a collection of data-based studies. A unique pan-European database of annual maximum discharges is used for the analyses. This presentation will answer the following three questions: (i) are changes in small and big floods different? (ii) what are the main drivers of those changes? and (iii) do small and large floods have the same drivers of change? In the first part of this research, regional trends in flood quantiles are assessed across Europe as a function of their return period, using a non-stationary regional flood frequency approach. Results show dependency of flood trends on their return period in all regions except north-eastern Europe. In the second part, a data-based approach for the attribution of flood changes to atmospheric, catchment and river drivers at the catchment scale is developed and applied to a case study in Upper Austria, where flooding has become more intense during the last 50 years. Flood trends here are attributed to long-term changes in extreme precipitation. Finally, the attribution approach is extended to the regional scale and used to assess the contribution of climatic drivers to the observed trends in flood quantiles at the European scale. Findings show that extreme precipitation caused changes in both small and big floods in north-western Europe. Antecedent soil moisture is the main contributor to changes in the median flood in southern Europe, while the contribution of the two drivers to changes in larger floods are comparable. In eastern Europe, snowmelt drives changes in both the median and the 100-year flood. These results provide an improved understanding of decadal changes in flood magnitudes at the regional scale and are useful for informing flood management strategies.

How to cite: Bertola, M., Viglione, A., Lun, D., and Blöschl, G.: Flood changes in Europe: from detection to attribution, EGU General Assembly 2023, Vienna, Austria, 23–28 Apr 2023, EGU23-5595, https://doi.org/10.5194/egusphere-egu23-5595, 2023.

EGU23-5694 | ECS | Posters on site | HS2.4.3

Non-stationary flood frequency analysis: case study in the Po river basin 

Luigi Cafiero, Paola Mazzoglio, Irene Monforte, Pierluigi Claps, Alberto Viglione, and Francesco Laio

Traditional regionalization methods allow estimating hydrological variables in stationary conditions: in the context of climate change new techniques are sought, which take into account the non-stationarity of climate variables. As part of a project in collaboration between universities and the Po basin authority, different approaches including regionalization procedures are used to characterize the hydrological extremes in the Po River basin. In particular, we use the Spatially Smooth Regional Estimation method, which is based on multiregressive estimation of L-moments that do not require the definition of homogeneous regions. The regression models are based on morpho-climatic descriptors including climate variables such as the mean annual precipitation, and the coefficients of a model for the  IDF  curves. By analyzing the multi-year variability of the climatic variables in each basin, with this work we aim at: (i) comparing the trends of the climatic variables and the trend of discharges associated with different return periods, (ii) analyzing the sensitivity of the regression equations to changes in time of these variables. Moreover, we compare the rainfall and flood quantiles for each sub-basin, to evaluate the percentage change of the standardised flood discharge for the percentage change in extreme rainfall. This approach allows us to investigate the effects of rainfall mechanisms and catchment characteristics on flood probabilities in the Po River basin.

How to cite: Cafiero, L., Mazzoglio, P., Monforte, I., Claps, P., Viglione, A., and Laio, F.: Non-stationary flood frequency analysis: case study in the Po river basin, EGU General Assembly 2023, Vienna, Austria, 23–28 Apr 2023, EGU23-5694, https://doi.org/10.5194/egusphere-egu23-5694, 2023.

EGU23-6716 | ECS | Orals | HS2.4.3

Combining runoff generating mechanisms and the Metastatistical Extreme Value approach to predict extreme floods in catchments with strong discontinuities in the flood frequency curve 

Sumra Mushtaq, Arianna Miniussi, Ralf Merz, Larisa Tarasova, Francesco Marra, and Stefano Basso

River floods are the most common natural hazards worldwide and accurate flood estimation is crucial for reducing flood risk. Traditional flood frequency analysis relies on the assumption of homogeneity of the analysed floods. However, floods arise from multiple generating mechanisms, such as rainfall on wet and dry soils, rain-on-snow and snow-melt events. Streamflow records may therefore comprise mixtures of events. Ignoring this may cause significant errors in the estimation of flood frequency. The problem is particularly evident in catchments with a discontinuity in the flood frequency distribution, where the rarest floods are significantly larger than the rest of the events in the record. These situations cannot be represented by traditional frequency analyses. Extreme floods may thus occur unexpectedly and produce disproportionate losses and casualties. Here, we propose a practical method to handle the problem of flood frequency estimation in catchments with strong discontinuities in the flood frequency curves.

In this work, we focus on rivers among 160 case studies in Germany which show a marked discontinuity in the empirical flood frequency distribution and we use the simplified Metastatistical Extreme Value (SMEV) approach to separately include floods with different generating mechanisms in the estimation of the flood frequency distribution. We extract all the independent ordinary events from daily streamflow records and organize them into two groups according to the key runoff generation processes (rain-on-dry, mixture of rain-on-wet and snowmelt processes). We fit a statistical distribution (either power law or log normal based on the statistical properties of the ordinary events) to each group. Then, we use SMEV to calculate the emerging frequency distribution.

Our results show that the proposed approach improves the estimation of the magnitude of floods with long return periods. Considering the mixture of generating processes allows to reproduce the observed discontinuities in the flood frequency curves. Comparison with the standard Generalized Extreme Value distribution shows that the proposed method reduces the estimation bias, especially for large quantiles.

This study summarizes the results of the DFG-funded project "Propensity of rivers to extreme floods: climate-landscape controls and early detection - PREDICTED" (Deutsche Forschungsgemeinschaft - German Research Foundation, Project Number 421396820).


How to cite: Mushtaq, S., Miniussi, A., Merz, R., Tarasova, L., Marra, F., and Basso, S.: Combining runoff generating mechanisms and the Metastatistical Extreme Value approach to predict extreme floods in catchments with strong discontinuities in the flood frequency curve, EGU General Assembly 2023, Vienna, Austria, 23–28 Apr 2023, EGU23-6716, https://doi.org/10.5194/egusphere-egu23-6716, 2023.

EGU23-6891 | ECS | Posters on site | HS2.4.3

A Spatiotemporal hydrological response of extreme urban floods in Ha Noi – Vietnam. 

Ha Do Minh, Gerald Corzo Perez, Wilmer Barreto, and Chris Zevenbergen

Urban flood mostly is pluvial flood, caused by high rainfall intensities combined with the unsuitable drainage system and land cover. Because of the heterogeneous drainage system and the storm distribution dynamics, urban floods are rapid and spontaneous in space and time. Flood risk analysis was created to understand and assess the flood behavior, manage and mitigate the flood damage. However, flood risk assessments recently only have focused on the spatial distribution of the flood while temporal flood evolution in urban area is still an open question. This research aims to provide a spatio-temporal analysis of the urban flood by implementing the simplified model-based representation of flood evolution/development in space and time (spatiotemporal patterns) including time to flood the manhole, the location, spatial and temporal sequences of flood.

To specify, 3 precipitation distribution patterns were collected from rainfall incidents in 2008, 2019, 2020, then extrapolated to create 21 scenarios following the return periods (i.e. 1.25-year, 2-year, 2.5-year, 5-year, 10-year, 20-year, 50-year). In each scenario, the dynamics of flood was estimated using the urban drainage system by SWMM5. Case study (Do Lo, Yen Nghia, Ha Dong, Ha Noi, Viet Nam) was divided into 115 sub-catchtments based on the Digital Elevation Model (DEM) and the drainage system map of this area. Land cover was created based on the LANDSAT images. Domestic waste water distribution was included in the model. The model is validated with the extreme events in 2020 and 2022.

A spatio-temporal risk map was generated to show the flooding spatio-temporal sequences and non-flood region. Flood evolution on the time scale was shown in this map. The rate of flood change diagrams shows the flood responses from urban areas which vary from 1 to 107 mins in different scenarios.

Rain gauge distribution sensitivity is examined under ranges of rain gauge distribution combinations in term of space and time.

How to cite: Do Minh, H., Corzo Perez, G., Barreto, W., and Zevenbergen, C.: A Spatiotemporal hydrological response of extreme urban floods in Ha Noi – Vietnam., EGU General Assembly 2023, Vienna, Austria, 23–28 Apr 2023, EGU23-6891, https://doi.org/10.5194/egusphere-egu23-6891, 2023.

EGU23-7769 | ECS | Posters on site | HS2.4.3

Effects of space-time dynamics of precipitation on timing and shape characteristics of runoff events 

Larisa Tarasova, Safae Aala, Lars Ribbe, and Rohini Kumar

The observed variability in shape and timing characteristics of event hydrographs emerges from the variability in the types and structure of the corresponding hydrometeorological events and their interaction with the variable catchment states. The increasing temporal resolution of available hydrometeorological data provide a possibility for deciphering the effect of space-time dynamics of precipitation on the characteristics of event hydrographs and might provide useful insights into the differences on the controls of small and large runoff events. In this study, we comprehensively analysed the effects of the spatio-temporal dynamics of precipitation on the characteristics of hourly event hydrographs using the analytical framework of Viglione et al. (2010). We examined eight properties reflecting the shape and timing characteristics of 2026 hourly event hydrographs and 20 indicators describing the spatio-temporal structure of precipitation and pre-event wetness states in seven contrasting catchments in the Bode River basin, located in central Germany, using random forests and Accumulated Local Effects (ALE) techniques.

We found that the steepness of the rising limbs of event hydrographs is controlled by the intensity of precipitation, its temporal dispersion, and the catchment-averaged storm velocity. The contribution of these indicators is even more apparent for large runoff events (i.e., events with larger peak discharges). Instead, the event time scale of the hydrographs is rather affected by the volume of precipitation and antecedent base flow in combination with the spatial properties of precipitation (its spatial spread and proximity to the catchment outlet). Moreover, we found that the duration of precipitation events plays a major role in defining the response time of catchments. Finally, our results demonstrate that the effects of spatio-temporal structure of precipitation for the shape and timing characteristics of hydrographs are especially prominent for larger events, indicating the potential importance of these features for accurate flood forecasting and constructing of design synthetic hydrographs. The future effort will focus on examining the validity of identified controls for a larger and more diverse set of catchments in Germany.

References

Viglione, A., Chirico, G. B., Komma, J., Woods, R., Borga, M., and Blöschl, G. (2010). Quantifying space-time dynamics of flood event types. Journal of Hydrology, 394 (1-2):213–229.

How to cite: Tarasova, L., Aala, S., Ribbe, L., and Kumar, R.: Effects of space-time dynamics of precipitation on timing and shape characteristics of runoff events, EGU General Assembly 2023, Vienna, Austria, 23–28 Apr 2023, EGU23-7769, https://doi.org/10.5194/egusphere-egu23-7769, 2023.

EGU23-9947 | Orals | HS2.4.3

Investigation of factors leading to extreme floods by space-time simulation of rainfall and runoff 

Uwe Haberlandt, Luisa-Bianca Thiele, and Ashish Sharma

Extreme floods are caused by special meteorological conditions matching critical space-time scales of flood generation processes in a catchment. Fortunately for most of the floods these conditions are not meet. However, it is hypothesized that for many events reasonable changes on the flood producing storms would lead to exceptional floods. In order to investigate which factors are most relevant for the maximisation potential of floods a simulation study has been carried out. Event based conditional space-time simulation of short-time step rainfall is applied. So, mainly the space-time patterns and the rainfall intensities are modified conditioned on observed rainfall data. The space-time rainfall is generated by sequential Gaussian simulation with and without considering temporal correlation and advection. The intensities are modified considering the observed saturation deficit. Many space-time rainfall realisations are produced and used as input for a rainfall-runoff model with varying initial conditions. This case study uses data from the Mulde river catchment in Germany and applies the methodology to a set of selected large flood events. The results will reveal how extreme the floods could have become and how much increased rainfall intensities, pattern modification or initial catchment conditions contribute each to the total maximisation potential of the floods.

How to cite: Haberlandt, U., Thiele, L.-B., and Sharma, A.: Investigation of factors leading to extreme floods by space-time simulation of rainfall and runoff, EGU General Assembly 2023, Vienna, Austria, 23–28 Apr 2023, EGU23-9947, https://doi.org/10.5194/egusphere-egu23-9947, 2023.

EGU23-11194 | ECS | Posters on site | HS2.4.3

Drivers of Widespread Flooding in Indian River Basins 

Nanditha J Sobhana and Vimal Mishra

Widespread riverine flood events wherein most subbasins simultaneously experience flooding have relatively higher socio-economic implications relative to localized flooding within a river basin. Extreme precipitation covering a large area, favourable antecedent soil moisture conditions and unique atmospheric characteristics are often associated with these rare extreme events. Notwithstanding the huge death toll and economic consequences of flooding, there exists only a couple of studies that explore the causative factors of riverine flooding in India. Here, we identify widespread flooding in seven major river basins in India using streamflow simulations from a well-calibrated Variable Infiltration Capacity (VIC) hydrological model. We use an area-weighted threshold to determine the occurrence of widespread flooding. We estimated the probability of widespread flooding In Indian river basins during the observational period from 1959 to 2020. We find a high probability of widespread flooding  (>10% of high flow events in all subbasins) in the peninsular river basins, while the transboundary rivers of Ganga and Brahmaputra exhibit a low probability. Further, using the VIC simulated top layer soil moisture, gridded precipitation observations from India Meteorological Department (IMD) and ERA5 atmospheric variables; we investigate the antecedent soil moisture conditions and atmospheric characteristics associated with widespread flooding. The study results further our understanding of the causes of widespread flooding in Indian river basins and hence have major implications in managing these extreme events. 

How to cite: Sobhana, N. J. and Mishra, V.: Drivers of Widespread Flooding in Indian River Basins, EGU General Assembly 2023, Vienna, Austria, 23–28 Apr 2023, EGU23-11194, https://doi.org/10.5194/egusphere-egu23-11194, 2023.

In flood events, in order to evaluate the hydrological dam safety, it should be assessed the frequency curve of maximum reservoir water levels. For this purpose, a large set of inflow hydrographs are routed through the reservoir. In this approach, the result will depend on several variables, such as flood peak and hydrograph volume frequency curves and the dependence structure between variables. In addition, for this process several hydrometeorological simulations are performed in order to characterise the catchment response in flood events, obtaining hydrograph shapes that can be generated in the catchment. However, first, the hydrological model calibration requires, as input data, given hyetograph shapes.

This study presents the application of a bivariate analyses to assess the hydrological safety of dams based on hydrometeorological simulations. The analysis is carried out in the Cuerda del Pozo Dam in central Spain. In this catchment, flood hydrographs associated with annual maximum peak flows are usually generated by storms with a duration of several days. Consequently, hyetographs of several days obtained from intensity-duration-frequency curves are required, in order to obtain the runoff volumes given by the univariate frequency curve of hydrograph volumes. However, hydrological simulations with such long hyetographs present different problems. If a small time step is considered in the design hyetographs of several days, sharp hydrographs will be generated with peak flows greater than required. Unreasonable model parameters would be used to smooth the concentration and diffusion processes, reducing simulated flood peaks. On the other hand, if a large time step is considered, smooth hydrographs could be obtained with flood peaks smaller than quantiles in the flood frequency curve. Therefore, a detailed analysis is carried out to calibrate both flood peaks and hydrograph volumes, obtaining an appropriate hyetograph shape that will lead to acceptable values of the hydrological model parameters.

The calibrated rainfall-runoff model is used to generate a set of possible synthetic hydrograph shapes. A bivariate analysis is performed to generate random pairs of peak flow and hydrograph volume that fit the univariate frequency curves and keep the dependence structure between variables. A given synthetic hydrograph shape is assigned to each pair of peak flow and hydrograph volume. A long set of 500 000 inflow hydrographs is used. Hydrological safety of the Cuerda del Pozo Dam is assessed by using the frequency curve of maximum reservoir water levels.

How to cite: Carril-Rojas, D. and Mediero, L.: Selection of hyetograph shapes for generating synthetic hydrographs in a bivariate analysis for hydrological dam safety assessment., EGU General Assembly 2023, Vienna, Austria, 23–28 Apr 2023, EGU23-12146, https://doi.org/10.5194/egusphere-egu23-12146, 2023.

EGU23-12799 | ECS | Posters on site | HS2.4.3

Model-based flood attribution over Poland: the roles of precipitation, snowmelt and soil moisture excess 

Nelson Venegas-Cordero, Cyrine Cherrat, Zbigniew W. Kundzewicz, Jitendra Singh, and Mikołaj Piniewski

Poland is characterized by hydrometeorological variability, where conditions such as snowmelt, extreme precipitation, or soil moisture excess could be the main natural mechanisms causing fluvial flooding. The interplay of these factors may be additionally modified by climate change. Therefore, it is of high interest to attribute the occurrence of floods over Poland to single or multiple drivers as well as to analyse how this attribution evolved over time.

To meet this objective in the present study, we used the dataset covering components of the water balance with a daily time step at the sub-basin level over Poland for the period 1951-2020. The data set was derived from the previously calibrated and validated Soil & Water Assessment Tool (SWAT) model for over 4,000 sub-basins. The high spatial and temporal resolution of the dataset as well as its temporal continuity allowed us to comprehensively analyse the flood drivers over the country and their evolution over time. We used a method based on the circular statistics approach, using dates of occurrence of annual maximum floods and flood-generating mechanisms to estimate the relative importance of each flood driver. In addition, two sub-periods (1952-1985 and 1986-2020) were considered in order to detect the climate change signal.

The analysis of the relative importance of flood drivers showed that snowmelt is the most important cause of flooding throughout the country, followed by soil moisture excess and precipitation. The latter appeared to be the dominant driver only in a small, mountain-dominated region in the south. Soil moisture excess gained importance mainly in the northern part, although not in a uniform way, suggesting that the spatial pattern of flood generation mechanisms is also governed by other features. We also found a strong signal of climate change in large parts of northern Poland, where snowmelt is losing importance in the second sub-period in favor of soil moisture excess, which can be explained by the temperature warming and the diminishing role of snow processes. This study for the first time quantified the importance of different flood generating mechanisms over Poland, suggesting that more attention should be paid to soil moisture excess. This work also shows the potential of using high-resolution simulated water balance data sets in flood attribution studies.

How to cite: Venegas-Cordero, N., Cherrat, C., W. Kundzewicz, Z., Singh, J., and Piniewski, M.: Model-based flood attribution over Poland: the roles of precipitation, snowmelt and soil moisture excess, EGU General Assembly 2023, Vienna, Austria, 23–28 Apr 2023, EGU23-12799, https://doi.org/10.5194/egusphere-egu23-12799, 2023.

EGU23-13489 | ECS | Posters on site | HS2.4.3

Representation of different flood types in rainfall-runoff modelling 

Luisa-Bianca Thiele, Golbarg Salehfard, Germán Enrique Spadari, and Uwe Haberlandt

Flood characteristics vary due to different processes causing the floods. Classifying flood events according to their causative processes can help to improve the estimation accuracy of flood probabilities. Hydrological models can be used for derived flood frequency analyses when the length of observed climate and runoff data is insufficient. This also allows the estimation of uncertainties due to variable catchment characteristics, climate conditions, and runoff regimes. The aim of this work is to investigate whether rainfall-runoff models are capable of reproducing different flood types. Observed flood events of the period 1980 - 2020 are classified according to the approaches of Fischer et al. (2019) and Tarasova et al. (2020). The conceptual rainfall-runoff model HBV-IWW is operated for 120 meso- and macroscale (30km² - 1500km²) catchments in Germany. Observed and simulated flood events are compared to assess the model performance separately for different flood types. In addition, the model performance is evaluated for the pre-event phase to determine whether the preconditions of the flood event are met.  The results indicate that the model reproduces certain flood types better than others. The model performance is in particular poor for snow dominated flood events both for the pre-event phase and during the flood event. The outcome of these investigations should help to find and improve the deficits of the hydrological modelling.

How to cite: Thiele, L.-B., Salehfard, G., Spadari, G. E., and Haberlandt, U.: Representation of different flood types in rainfall-runoff modelling, EGU General Assembly 2023, Vienna, Austria, 23–28 Apr 2023, EGU23-13489, https://doi.org/10.5194/egusphere-egu23-13489, 2023.

EGU23-14465 | Orals | HS2.4.3

Assessing expected changes in flood losses produced by fluvial floods in urban areas in climate change 

Enrique Soriano Martín, Kai Shröter, David Santillan, Luis Cueto-Felgueroso, Marco Lompi, Stefano Bagli, and Luis Mediero

Floods are the natural hazard that causes the highest economic and human damages in Europe. Flood patterns will be modified in the future due to climate change. In addition, extent and density of urban areas have increased during the last decades. We propose a methodology to quantify the impact of climate change on river flood losses in urban areas. The methodology is applied to the metropolitan area of Pamplona in northern Spain. In this study, climate change projections are considered, a distributed hydrological model is used to obtain flood hydrographs, a two-dimensional (2D) hydrodynamic model to obtain flood extents, and finally a flood loss model to quantify direct flood damages.

The effect of climate change on flooding in the Arga river catchment has been estimated by combining the distributed hydrological model RIBS (Real time Interactive Basing Simulator) with delta changes in daily precipitation quantiles obtained from climate change projections in previous studies. 12 climate models, seven return periods, two representative concentration pathways (RCP 4.5 and RCP 8.5), and three periods (2011–2040, 2041–2070, and 2070–2100) are considered (Garijo and Mediero, 2019; Lompi et al., 2021). 33 %, 50 %, and 67 % percentiles of flood quantiles in climate change are considered.

The 2D hydrodynamic IBER model has been calibrated by using 15-minute streamflow data recorded at four gauging stations that belong to the real-time SAIH system of the River Ebro Basin Authority. Flood extents simulated with IBER are compared with flood extents in real flood events supplied by the Regional Government of Navarre. A high resolution digital terrain model (DTM) with a cell size of 1 meter has been used. as input data of the IBER model. For each climate change scenario, flood extent and water depth in each DTM cell in the metropolitan area of Pamplona are obtained with the calibrated IBER hydrodynamic model.

The Safer_DAMAGE algorithm developed by the SaferPlaces project has been used to estimate direct flood losses to residential and commercial buildings in urban areas (Paprotny et al., 2021). Safer_DAMAGE uses the occupancy data provided by OpenStreetMap Buildings and average water depths in buildings to estimate flood losses at the building scale. The Safer_DAMAGE algorithm has been benchmarked in the Pamplona metropolitan area by using the insurance database of observed flood losses in the period 1996-2019 supplied by the Spanish Consorcio de Compensación de Seguros. In this database, data are aggregated by postal codes. Flood losses are estimated for each synthetic flood event with the calibrated Safer_DAMAGE. Total direct damages have been obtained in selected neighbourhoods that are prone to flooding. In addition, expected changes in direct damages due to climate change have been assessed in terms of building type. Finally flood losses are expected to be smaller in the future for low return periods (2-50 years). However, an increase in flood losses is expected for high return periods (50-1000 years).

The methodology proposed in this study can be useful for assessing the impact of climate change on flood losses in urban areas. 

How to cite: Soriano Martín, E., Shröter, K., Santillan, D., Cueto-Felgueroso, L., Lompi, M., Bagli, S., and Mediero, L.: Assessing expected changes in flood losses produced by fluvial floods in urban areas in climate change, EGU General Assembly 2023, Vienna, Austria, 23–28 Apr 2023, EGU23-14465, https://doi.org/10.5194/egusphere-egu23-14465, 2023.

EGU23-14526 | Posters on site | HS2.4.3

A Study On Applicability Of Flood Risk Maps For Flood Risk Assessment 

YuJin Kang, Hoyong Lee, Soojun Kim, and Hung Soo Kim

Regarding existing qualitative evaluations for flood risks, the researcher is to use the food risk map made by the flood risk map made by applying extreme rainfall to national, local, and small rivers. The submerged range is the same regardless of rainfall intensity. Therefore, this study prepares a flood risk map by frequency and conducted IBA (Indicator-Based Approach) flood risk assessment from 2016 to 2020 for metropolitan cities. In addition, by calculating climate change through the future flood risk index, the researcher will analyze this trend with the Mann-Kendall method. This study individually prepares a flood risk map according to rainfall intensity by calculating the design flood discharge by frequency. In this case, not only hazard but also changes in the exposure and vulnerability indexes as the area of the flood risk map changes. In the case of exposure and vulnerability, extracted and calculated flood risk map includes the population and the number of buildings, so the index of the relevant items changes according to the area of the flood risk map. This study conducts a future flood risk assessment using the climate change scenario when flood risks for future metropolitan cities can be analyzed and used to cope with environmental changes. In addition, if there is a trend towards increasing at specific rainfall observatories around metropolitan cities through trend analysis, it can be shown as evidence that the probability of rainfall by future frequency is extensively estimated given these characteristics. Using these results, a local government can make a plan to manage flood risks.

How to cite: Kang, Y., Lee, H., Kim, S., and Kim, H. S.: A Study On Applicability Of Flood Risk Maps For Flood Risk Assessment, EGU General Assembly 2023, Vienna, Austria, 23–28 Apr 2023, EGU23-14526, https://doi.org/10.5194/egusphere-egu23-14526, 2023.

EGU23-14527 | Posters on site | HS2.4.3

Analysis of Climate Change Mitigation and Flood Reduction Effects of Nature-based Solutions 

Hoyong Lee, Yujin Kang, Hung Soo Kim, Soojun Kim, and Kyunghun Kim

Due to climate change, rainfall occurs at a higher frequency than the design frequency, and flood damage has occurred in excess of the river design standard. Currently, river management in general is gray infrastructure such as embankments and weirs for irrigation and flood control. However, the river management plan through the gray infrastructure emits carbon dioxide, increasing the occurrence of extreme weather due to climate change and intensifying flood damage, causing a vicious cycle to repeat. Therefore, since the river management method by gray infrastructure cannot be adopted as a sustainable solution, the concept of Nature-based Solutions(NbS), which seeks to solve environmental and social problems through ecosystem services, is attracting attention recently. Therefore, in this study, the flood reduction effect of river management using NbS was quantitatively analyzed for the Hwang River, which is directly downstream of Hapcheon Dam. In addition, using the climate change scenarios of the IPCC 6th Assessment Report, the study tried to confirm the ability to respond to climate change through NbS. We used SSP5-8.5(Shared Socioeconomic Pathways5-8.5) and SSP2-4.5 scenarios for future precipitation, and the design flood discharge was calculated through HEC-HMS. Floodplain excavation and dyke relocation, which are included in the NbS, were applied to the flood risk area of the Huang River. As a result of analyzing the flood level of the river through the unsteady flow analysis of HEC-RAS, it was possible to confirm the effect of reducing the flood level by 5 to 7 cm for each scenario at the confluence of the Nakdong River. The results of this study can be expected to be sufficiently utilized as a basis for use as a management plan through NbS rather than the river management with grey infrastructure.

How to cite: Lee, H., Kang, Y., Kim, H. S., Kim, S., and Kim, K.: Analysis of Climate Change Mitigation and Flood Reduction Effects of Nature-based Solutions, EGU General Assembly 2023, Vienna, Austria, 23–28 Apr 2023, EGU23-14527, https://doi.org/10.5194/egusphere-egu23-14527, 2023.

EGU23-15155 | Posters on site | HS2.4.3

Flooding in marsh areas caused by climate change – sensitivity to the accuracy of sea level projections and bias correction procedure 

Ida K. Seidenfaden, Maria R. Skjerbæk, Torben O. Sonnenborg, Hans Jørgen Henriksen, Mark R. Payne, Jian Su, Colgan William, and Kristian Kjellerup Kjeldsen

One of the most sensitive areas to climate change impacts are coastal-near and low-relief areas. While these coastal zones often are places of high population density and important infrastructure, they are also particularly exposed to multiple future climate change hazards such as sea level rise, intensified storm surges, rising groundwater and high-intense precipitation events. Thus, elevated risks of overbank spilling, dam breaks and flooding events are expected in a future climate in temperate wet regions such as Denmark. To mitigate and adapt to such elevated risks, prediction of future flooding events is vital, and here hydrological modelling is an essential tool. However, such impact evaluations are subject to a range of uncertainties such as emission, climate and sea level prediction uncertainties as well as impact model uncertainty.

In this study, we investigate the uncertainties of predicted flooding from a river course and the groundwater system using a hydrodynamic model coupled with a 3D groundwater model. The model is forced with different climate scenarios and inputs from two different approaches of downscaled global sea level rise implemented using an indirect and direct bias correction procedure. The indirect procedure uses a simple delta change approach perturbing future climate and sea level change on observations, while the direct method uses bias-corrected climate model data, corresponding ocean model run data (for internal oceanic response to climate change), combined with global sea level change. This approach makes it possible to investigate the relative importance (sensitivity) of the flood prediction of sea level projection and bias correction procedure as well as the identification of past and future origin (surface or groundwater) of flooding events.

How to cite: Seidenfaden, I. K., Skjerbæk, M. R., Sonnenborg, T. O., Henriksen, H. J., Payne, M. R., Su, J., William, C., and Kjeldsen, K. K.: Flooding in marsh areas caused by climate change – sensitivity to the accuracy of sea level projections and bias correction procedure, EGU General Assembly 2023, Vienna, Austria, 23–28 Apr 2023, EGU23-15155, https://doi.org/10.5194/egusphere-egu23-15155, 2023.

There is a global consensus in the scientific community that urbanization and climate change are posing high uncertainty and challenges for the 21st century, exacerbating the flood risk in different cities or urban sub-catchments which also hinders resilience building. Land Use/Land Cover (LULC) change as a result of anthropogenic activity such as complex urban growth, is a critical aspect to study due to its main role on the hydrological response of river basins. Therefore, it is crucial to understand a basin response during hydrological extremes and how shifts in urban extension or any other complex LULC change impact on it, in order to make informed decisions and deploy strategies for mitigating flood risk. This research is aimed to implement a multi-scenario hazard assessment approach which couples GeoSOS-FLUS (Cellular Automata + Markov chains), a event-based hydrological model (HEC-HMS) and a 2D hydrodynamic model (HEC-RAS) simulations including multi-type natural and urban land uses in 3 Peruvian catchments which flow into the Pacific Ocean. Here, several cities currently face a lack of capacity and scientific understanding to respond to hydrological extremes and deal effectively with the uncertainty of complex LULC transitions and urbanization. HEC-HMS modelling system incorporates spatially varied land use parameters and simulates key hydrologic processes at sub-catchment scale which are impacted by LULC transitions. Flood events are studied in experiments for different return periods. The assessment was carried out using daily downscaled CMIP6 meteorological datasets under Shared Socioeconomic Pathways (SSPs) scenarios at 0.25° of resolution from 2030 to 2050. According to the predicted flood extension, new built-up zones are also exhibiting a significant flood exposure. The rising flood hazard data generated by model simulations aids in our comprehension of future distribution of flood-prone zones at sub-catchment and city level. Our work and its ongoing improvements are pointed to be a promising method in several flood risk studies in Peru. The findings also encourage rethinking urban development and measures in high hazard intensity areas, overcoming the lack of scientific understanding and quantifiable evidence of climate change and urbanization effects.

How to cite: Montenegro Gambini, J. I.: Urban flood hazard assessment in Pacific Peruvian catchments: Coupling hydrological, hydrodynamic and future land use modelling under climate change., EGU General Assembly 2023, Vienna, Austria, 23–28 Apr 2023, EGU23-15996, https://doi.org/10.5194/egusphere-egu23-15996, 2023.

Several processes and mechanisms affect flood frequency curves at different spatial and temporal scales, such as the operation of reservoirs. In this work we present a new framework to estimate the peak discharge reduction for every possible spatial configurations of reservoirs, by introducing the novel concept of Reservoir-influenced Instantaneous Unit Hydrograph (RIUH). The RIUH represents the probability distribution of the travel time of an area, influenced (i.e. typically increased) by the presence of reservoirs. The results show the impact of single and multiple reservoirs on peak discharge reduction by varying their location and storage coefficients. Mainly, the reservoirs located in series reduce the peak discharge at the outlet; on the contrary, reservoirs located on the tributaries of the main river, which drain a smaller area, do not show a strong effect. This framework is exemplified for a real catchment (Central Italy) by investigating different configurations of reservoirs.

How to cite: Cipollini, S., Volpi, E., and Fiori, A.: Reservoir-Instantaneous-Unit-Hydrograph: the reservoirs effect on travel time distribution and peak discharge reduction, EGU General Assembly 2023, Vienna, Austria, 23–28 Apr 2023, EGU23-17114, https://doi.org/10.5194/egusphere-egu23-17114, 2023.

Over the past decades, the increasing frequency and intensity of extreme events due to climate change and anthropogenic climate change have greatly increased the threat to the production and livelihood of people along the riverbank. Hence, it is crucial to analyze the extreme variations of streamflow and sediment load observed in large rivers to better predict future changes in the world's water resources and hydrological extremes. In this study, we show the spatiotemporal variations of streamflow extremes and sediment load extremes in the mainstream of the Yellow River based on the daily streamflow and sediment load data from 1956 to 2019 and multiple mathematical and statistical methods. Then, we identify the main factors related to human activities and climate change by establishing quantitative relationships to figure out how these factors altered extreme streamflow and sediment load. Our results reveal that extreme streamflow and sediment load have decreased significantly since the 1950s (p < 0.05) except for the Yellow River source. However, the extreme streamflow increased significantly (p < 0.05) during 2000-2019, likely due to increased precipitation, and the extreme sediment load at most stations tended to stabilize. The contribution of extreme streamflow to the annual streamflow declines remarkably in the middle-upper reaches and increases significantly in the Lower reaches. While the contribution of extreme sediment load to the annual sediment load decreased significantly in the middle-lower reaches. Besides, the occurrence dates of extreme streamflow and sediment load showed an overall trend to disperse from the flood season to the four seasons of a year. We also have evidence that the fundamental cause of extreme water-sediment yield is extreme precipitation. Yet the extremity and hazard of water-sediment extremes are strongly affected by anthropogenic activities. Among them, mainstream dams can artificially change the water-sediment extremes, relationship, and synchronization, while anthropogenic engineering and vegetation measures can reduce the maximum possible peak of water-sediment extremes. Changes in the water-sediment relationships across the basin also confirm that changes in sediment source availability or erosive power dominate sediment reduction in each sub-basin. This study provides a scientific basis for risk management and water resources development and utilization in complex watersheds.

How to cite: Yin, S., Gao, G., and Fu, B.: Significantly reduced extreme streamflow and sediment load in the Yellow River Basin: Impacts of climate change and human activities, EGU General Assembly 2023, Vienna, Austria, 23–28 Apr 2023, EGU23-247, https://doi.org/10.5194/egusphere-egu23-247, 2023.

EGU23-266 | ECS | Orals | HS2.4.4

Exploring the seasonal divergence among SPI, SPEI and SNEPI 

Gauranshi Raj Singh, Dhanya Chandrika Thulaseedharan, and Aniket Chakravorty

The realistic assessment of drought is subjected to substantial uncertainty in the presence of a multitude of drought indicators owing to their mutually exclusive methodologies, variant data sources employed, and changing variable behavior. Though temperature-driven divergence analyses among drought indicators are not unknown, in this study the authors attempt to unravel the quantum of disagreements the newly developed Standardized Net Precipitation Distribution Index (SNEPI) possesses with its contemporary counterparts. The inherent aim of the authors is to highlight that (1) climate change impacts propagating to drought dynamics are not solely driven by increasing global temperatures, but also by changing precipitation characteristics, (2) identify regions where the operational use of SNEPI is maximum, and (3) identify various physical processes that govern the evolution of index divergences through an attribution analysis. We found a persistent negative disagreement or an enhanced occurrence of dry extremes in the annual divergence of SPEI with SPI and SNEPI, which questions the reliability on the traditional drought indices. However, the seasonal dispersion of this annual divergence revealed a strong spatiotemporal signal of monsoon droughts by SNEPI, which the traditional SPEI neglected. Further, the attribution analysis revealed that the radiative fluxes governed the evolution of SPEI-SPI divergence. Consequently, the divergence between SPEI and SNEPI is driven by the characteristics of wet spells, with the relationship strengthening in the monsoon season and tropical climate zones. The authors suggest an expansion in the operational value of SNEPI in the tropical regions where these discrepancies/disagreements are profound.


How to cite: Singh, G. R., Chandrika Thulaseedharan, D., and Chakravorty, A.: Exploring the seasonal divergence among SPI, SPEI and SNEPI, EGU General Assembly 2023, Vienna, Austria, 23–28 Apr 2023, EGU23-266, https://doi.org/10.5194/egusphere-egu23-266, 2023.

EGU23-430 * | ECS | Orals | HS2.4.4 | Highlight

Drought influence on flood dynamics: a global overview 

Alessia Matano, Wouter Berghuijs, Marleen de Ruiter, Philip Ward, Maurizio Mazzoleni, and Anne Van Loon

Floods and drought affect millions of people each year, but what if a riverine flood rapidly follows or occurs during a hydrological drought?

The 2022 summer drought in Europe, for instance, was punctuated by flash floods, affecting societies, economies and the environment already impacted by the persistent drought. In the same summer, in Iran and Afghanistan, devastating riverine floods followed a severe drought, causing displacement and human losses. Although the abrupt transitions between opposite hydrological extremes can pose huge risks for societies, the processes behind and effects of drought-flood interactions remain largely unknown, as most studies address droughts and floods separately. This research provides the first global study of compound and consecutive drought-flood events, shedding light on the underlying hydrological interactions between opposite hydrological extremes.

By analysing timeseries of hydro-meteorological and other biophysical variables for 8255 catchments globally, we reconstruct the propagation of droughts and floods through the hydrological cycle, thereby identifying and characterizing flood events that follow or compound with drought conditions. We use variable and fixed threshold-level approaches to detect extreme dry and wet conditions, and seasonality statistics to analyse the timing of riverine floods. Our results show that close succession between drought and flood occurs mainly during the transition between seasons: from winter to spring in mid-latitude areas and from dry to wet at the equator and polar regions. Although these events are rare, they have increased over time, especially in countries such as France and Germany, southern Brazil, and India. Furthermore, drought conditions often shift the flood timing, resulting in later winter floods in Europe, in the north-eastern coast of the United States and western Canada, and earlier summer floods in Central America and Northern Brazil.

This study shows that although drought and flood events evolve from different hydrological processes and atmospheric dynamics, these hydrological extremes interact with the same hydrological system, resulting in system alterations that may modify flood dynamics.

How to cite: Matano, A., Berghuijs, W., de Ruiter, M., Ward, P., Mazzoleni, M., and Van Loon, A.: Drought influence on flood dynamics: a global overview, EGU General Assembly 2023, Vienna, Austria, 23–28 Apr 2023, EGU23-430, https://doi.org/10.5194/egusphere-egu23-430, 2023.

Projections indicate that agricultural and hydrological droughts' frequency, severity, and duration are expected to increase globally in the twenty-one century. A better understanding of droughts drivers is key to creating preparedness and resilience to projected events. Typically, droughts are caused by lower precipitation and/or higher evaporation than normal in a region. The region's characteristics and anthropogenic influences may enhance or alleviate the drought events. Evaluating the multiple factors influencing droughts is complex and requires innovative approaches. To address this complexity, this study applies a multivariate approach to evaluate the relationship between ten hydroclimatic characteristics and the severity of agricultural and hydrological droughts. A process-based model (Soil Water Assessment Tool) is used for hydrological modeling. The model outputs (soil moisture and streamflow) are used to calculate the indicators for the drought's analysis: Soil Moisture Deficit Index for agricultural droughts and the Standardized Streamflow Index for hydrological droughts. Then, the Multivariate decision tree approach is applied to evaluate the relevance and relationship between the hydroclimatic characteristics and the agricultural and hydrological drought severity at each subbasin. The approach is applied in the Cesar River basin (Colombia, South America), an area of ecological interest declared RAMSAR site.

Study outcomes indicate that evapotranspiration, precipitation, and percolation are the primary drivers of agricultural droughts. Other hydroclimatic parameters such as the curve number, water yield, solid yield, and slope play a relevant role in the subbasin's exposure to agricultural droughts. Subbasins with precipitation lower than 1318 mm, evapotranspiration higher than 1191 mm, percolation higher than 648 mm, and soil yield higher than 101 mm experienced more severe agricultural drought conditions during the period of analysis Regarding hydrological droughts; findings show that evapotranspiration and water yield are principal drivers. Results indicate that precipitation, percolation, and surface runoff also influence the severity of hydrological droughts. Most severe drought conditions during the evaluation period are observed in subbasins with evapotranspiration higher than 826 mm, water yield higher than 9 mm, and precipitation higher than 1398 mm. The outcomes of our analysis indicate that seven out of ten hydroclimatic characteristics evaluated influence the severity of agricultural and hydrological droughts. In addition, the results demonstrate that capturing the non-linear relationships between drivers of droughts and severity allows examining the hydroclimatic characteristics that influence droughts in a region.

How to cite: paez, A., Corzo, G., and Solomatine, D.: Multivariate regression tree approach to evaluate relationship between hydroclimatic characteristics and agricultural and hydrological droughts, EGU General Assembly 2023, Vienna, Austria, 23–28 Apr 2023, EGU23-587, https://doi.org/10.5194/egusphere-egu23-587, 2023.

EGU23-1349 | ECS | Orals | HS2.4.4

Scale Dependence of Stochastic-Deterministic Flood Statistics 

Svenja Fischer and Andreas Schumann

Scale dependencies are a core element of hydrological sciences. The inclusion of deterministic aspects in flood statistics requires a cross-scale approach that takes into account the differences in flood generation and, in particular, the importance of local and regional processes as well as the interdependencies of flood waves at different spatial scales. The interaction of meteorological drivers with the spatially and temporally variable catchment conditions, e.g. antecedent soil moisture, snow cover or confluences, determines a variety of flood events that are scale-dependent. For example, heavy rainfall floods usually lead to extremely large flood peaks if the catchment is small and has a critical size relative to the spatial extent of the rain cell. The situation is different for synoptic rainfall, where large basins are affected and the total rainfall and the superposition of floods from tributaries can lead to extreme events. Thus, the consideration of flood generation becomes more complex when large river basins are considered instead of small catchments. In addition to the meteorological and catchment-specific factors, the interaction between the individual sub-catchments must also be taken into account. In particular, the superposition of flood waves from tributaries can critically alter the flood hydrograph. How such differences can be determined statistically-deterministically and how the individual factors can be taken into account in a statistical model for estimating design floods is presented here. Univariate mixture models for local floods as well as multivariate statistical models for regional floods help to better understand floods and their development. Their relevance on different spatial scales is discussed here. The result forms the basis for improved flood modelling that extends the classical peak-based flood frequency analysis by essential spatial aspects.


How to cite: Fischer, S. and Schumann, A.: Scale Dependence of Stochastic-Deterministic Flood Statistics, EGU General Assembly 2023, Vienna, Austria, 23–28 Apr 2023, EGU23-1349, https://doi.org/10.5194/egusphere-egu23-1349, 2023.

EGU23-1409 | Orals | HS2.4.4

Hydrological model calibration in high streamflow extremes climate change studies 

Diego Avesani, Aldo Fiori, Alberto Bellin, and Bruno Majone

Studies on the effects of climate change on hydrological extremes frequently use hydrological models whose parameters are determined through calibration techniques utilizing observed meteorological data as input force. However, when climate models are applied, this procedure result in a biased evaluation of the probability distribution of high streamflow extremes. As an alternative, we present a methodology called "Hydrological Calibration of eXtremes" (HyCoX), which involves maximizing the likelihood that the predicted and observed high streamflow extremes belong to the same statistical population by means of hydrological model calibrations driven by climate model output.

The application of HYPERstreamHS, a distributed hydrological model, to the Adige River watershed (southeastern Alps, Italy), shows that this technique retains statistical coherence and produce accurate quantiles of the yearly maximum streamflow.

How to cite: Avesani, D., Fiori, A., Bellin, A., and Majone, B.: Hydrological model calibration in high streamflow extremes climate change studies, EGU General Assembly 2023, Vienna, Austria, 23–28 Apr 2023, EGU23-1409, https://doi.org/10.5194/egusphere-egu23-1409, 2023.

EGU23-1856 | ECS | Orals | HS2.4.4

Connecting flood trends to groundwater 

Wouter Berghuijs and Louise Slater

Soil moisture is increasingly recognized as shaping fluvial flood trends, but it only represents a fraction of subsurface water storage. In contrast, groundwater in the saturated zone often contributes a significant proportion of river flow, but its effects on large-scale flood trends are poorly understood. We analyzed streamflow and climate records of thousands of catchments to show that baseflow (i.e., groundwater-sustained river flows) affects the magnitude of annual flooding at time scales from days to decades. Annual floods almost always arise through the co-occurrence of high precipitation (rainfall + snowmelt) and elevated baseflow. Consequently, trends and variations of flood magnitudes are often more strongly coupled to antecedent baseflow conditions than antecedent soil moisture and extreme precipitation. This reveals the importance of groundwater in shaping river floods and can decouple flood trends from shifting precipitation extremes and soil moisture.

How to cite: Berghuijs, W. and Slater, L.: Connecting flood trends to groundwater, EGU General Assembly 2023, Vienna, Austria, 23–28 Apr 2023, EGU23-1856, https://doi.org/10.5194/egusphere-egu23-1856, 2023.

EGU23-1867 | Orals | HS2.4.4

Do droughts and floods pose similar risks to Sahel staple food crop? 

Nadir A. Elagib, Marwan M.A. Ali, and Karl Schneider

With its arid and semi-arid climate, the African Sahel is a region highly drought-prone and vulnerable given its reliance on meagre natural resources for food security. However, the region recently also experienced flood occurrences. Against the background of food security, effects of floods and drought upon crop yield requires thorough investigation. To investigate the risk that flood and droughts pose to food crop we considered: 1) the case of the Sudanese Sahel in the eastern part of the region given its representation of one-third of the total area of the region, 2) traditional rainfed farming systems as the most fragile system in terms of marginality and regular experiences of challenges, including weather shocks and 3) sorghum as a main staple crop in the area. To identify risk and quantify its magnitude during the years when yield losses were encountered, we used gridded climate datasets, dynamic (yearly) land-use datasets and an unusually long national sorghum statistics for the last half a century. We expressed risk in % as hazard x vulnerability x 100%. Using a drought index for the growing season based on the ratio of rainfall to potential evapotranspiration, hazard is expressed here as a function of: i) severity of drought, ii) dry spell and iii) time frequency of drought. For the 51-year period from 1970 – 2020, 26 risk years were identified representing both hydrological extremes – floods and droughts. A risk year is defined here as a year with yield loss below the detrended yield data. In the decade 2011-2020, seven years were identified risk years. Four of those (2011, 2012, 2013 and 2015) were drought years and three (2017, 2019 and 2020) were exceptionally wet years. Sorghum yield varied significantly as a function of risk. Variations in the risk index explain 97.5% of the variation in sorghum yield, with a 1% increase in the risk leading to a decline of yield by 14.5 kg/ha. Nevertheless, the traditional farming sector achieved several high yield levels during the 26 risk years, namely 2020, 2019, 2017 and 2015 were years with the 3rd, 4th, 5th and 7th highest yield levels. Our findings show that: a) the traditional farming system experienced a high degree of vulnerability to hydrological extremes during the decade 2011-2020 and b) drought remains the most relevant hydrological risk whereas floods cause a small risk and may even favor yield.

How to cite: Elagib, N. A., Ali, M. M. A., and Schneider, K.: Do droughts and floods pose similar risks to Sahel staple food crop?, EGU General Assembly 2023, Vienna, Austria, 23–28 Apr 2023, EGU23-1867, https://doi.org/10.5194/egusphere-egu23-1867, 2023.

EGU23-2443 | ECS | Orals | HS2.4.4

Understanding drought conditions and impacts on key ecosystem services in a low-mountain watershed in Germany 

Abdulhakeem Amer Abdulhafed Al-Qubati, Lulu Zhang, and Karim Pyarali

Europe has experienced increasing frequency of climate extremes which caused negative impacts on the ecosystems and various socioeconomic sectors. In this research, we examined the drought conditions and impacts in Weisse Elster, a low-mountain watershed, in Central Germany. First, we studied the temperature and precipitation trends in the watershed. We found that seasonal and annual temperatures had an increasing trend. Precipitation had a decreasing trend during summer and an increasing trend in the winter and annual scales. By using drought indices, namely standardised precipitation-evapotranspiration index (SPEI) and standardised precipitation index (SPI), we found that drought conditions have been worsening. We used the Water Supply Stress Index (WaSSI), an integrated ecosystem services model developed by U.S. Forest Services, to simulate two key ecosystem services: surface water flow and carbon sequestration. The model showed satisfactory performance when evaluated against discharge, evapotranspiration and gross primary productivity (GPP) observations. To understand the drought vulnerability of different areas and ecosystems, we compared water yield (WY), net ecosystem productivity (NEP), and soil moisture (SM), averaged for the five most intense drought events, to the averages of the total study period (57 years). We found that droughts caused a significant reduction in WY (54%), NEP (18%), and SM (13%) in the region, with some areas being more affected than others. Urban landcover saw a 41% reduction in water flow, while agriculture and grasslands landcovers experienced significant reductions in generated water flow (63% and 60%, respectively). Deciduous forests had a 53% reduction in water flow and coniferous forests experienced a loss of around 37%. All landcover types saw a similar impact on carbon sequestration during droughts. Coniferous forests sequestered 21% less carbon while deciduous forests, grasslands, and agriculture landcover sequestered 18%, 17%, and 17% less carbon, respectively. We emphasise that there is an urgent need to improve climate resilience in the region and to reduce drought risks in different sectors to adapt to climate change.

How to cite: Al-Qubati, A. A. A., Zhang, L., and Pyarali, K.: Understanding drought conditions and impacts on key ecosystem services in a low-mountain watershed in Germany, EGU General Assembly 2023, Vienna, Austria, 23–28 Apr 2023, EGU23-2443, https://doi.org/10.5194/egusphere-egu23-2443, 2023.

EGU23-2697 | ECS | Posters on site | HS2.4.4

Impact of Climate Change on Non-stationarity of Extreme Streamflows in Godavari River Basin, India 

Ananthula Rishika, Gowri Reghunath, and Pradeep P. Mujumdar

The frequency analysis and risk assessment of extreme precipitation and streamflow at basin scales are essential for effective hydrologic design and water resource management activities. Processes that generate streamflow are influenced by both catchment characteristics and environmental conditions. As a result of climate change, human-induced changes in land use patterns (urbanization, deforestation, encroachment of flood plains), and faulty reservoir operations, the stationarity of streamflow assumption is questionable in flood frequency analysis. The changing climate has continued to alter the intensity, duration, and frequency of extreme events in the region, and the current status of climate change impacts on hydrology calls for the evaluation of a non-stationarity approach for extremes to enhance effective planning. This study aims to investigate the non-stationarity of streamflow and hydrologic sensitivity of catchments of the Godavari River basin located in peninsular India to changing climatic circumstances using a multi-model ensemble based on CMIP6 climate models. Firstly, Mann Kendall (MK) test is performed to detect the presence of temporal trends in the observed annual maximum streamflow series at 14 gauging stations distributed across the basin. Then peak flow series are analyzed using stationary and non-stationary models assuming invariant shape parameters and linear functions as location and scale parameters with time as a covariate. A generalized extreme value (GEV) distribution coupled with downscaled climate projections is employed to assess the probability distribution of extreme events. Results show that only 2 out of 14 streamflow series show temporal trends, suggesting that using physically based covariates instead of time can provide a better fitting. The return period can be shortened by more than one-tenth of its length, and flood risk is projected to increase significantly between the historical and future periods. These findings provide insights into non-stationary extreme streamflow behaviour, emphasizing the importance of identifying dominant drivers for changes in flooding under climate change.

How to cite: Rishika, A., Reghunath, G., and P. Mujumdar, P.: Impact of Climate Change on Non-stationarity of Extreme Streamflows in Godavari River Basin, India, EGU General Assembly 2023, Vienna, Austria, 23–28 Apr 2023, EGU23-2697, https://doi.org/10.5194/egusphere-egu23-2697, 2023.

EGU23-3018 | Orals | HS2.4.4

Investigating Characteristics of Drought-Flood Abrupt Alternation Events in South Korea for Comprehensive Disaster Management 

Ho-Jun Son, Sung Ho Byun, Hyeon-Cheol Yoon, Joo-Heon Lee, and Tae-Woong Kim

Recently, due to the climate change, the frequency of extreme hydrological disasters such as drought and flood is increasing worldwide. Especially, sudden change in precipitation cause drought and flood often occur alternately in a short period of time, which is defined as a drought-flood abrupt alternation event. In this study, daily Standardized Precipitation Index (SPI) for the entire basin of South Korea is used to analysis the characteristics of the short-term abrupt alternation events of drought and flood, focusing on the short-term perspective rather than the monthly SPI. When the SPI value is less than –1.5 for 10 consecutive days, a drought event begins, whereas when the SPI value is more than 0.5 for 7 consecutive days, a drought event ends. On the contrary, when the SPI value is more than 1.5 for 10 consecutive days, a flood event begins, whereas when the SPI value is less than –0.5 for 7 consecutive days, a flood event ends. When the time interval between the end of drought event and the start of flood event is less than five days, a drought-flood abrupt alternation event is identified. The severity of drought-flood abrupt alternation event is defined similarly to the severity of drought using the SPI. We classified the severity into two types: SW(severity of whole period) and ST(severity of transition period). We used the additional statistical risk grade analysis. Nackdong River basin (southeastern region of Korea) has most severe grade of the SW rather than the other basins and the ST is lower than other basins. On the contrary, Yeongsan River basin (southwestern region of Korea) has most severe grade of ST rather than the other basins and the SW is lower than other basins. In conclusion, using daily SPI can determine the risk-prone areas through evaluating the frequency and severity of drought-flood abrupt alternation events. Due to climate change, increasing variability of precipitation, and frequent flood abrupt alternation events in the future, our results will cornerstone to predict the vulnerable and risk-prone region or preventing disasters.

Acknowledgement: This research was supported by a grant(2022-MOIS63-001) of Cooperative Research Method and Safety Management Technology in National Disaster funded by Ministry of Interior and Safety(MOIS, Korea).

How to cite: Son, H.-J., Byun, S. H., Yoon, H.-C., Lee, J.-H., and Kim, T.-W.: Investigating Characteristics of Drought-Flood Abrupt Alternation Events in South Korea for Comprehensive Disaster Management, EGU General Assembly 2023, Vienna, Austria, 23–28 Apr 2023, EGU23-3018, https://doi.org/10.5194/egusphere-egu23-3018, 2023.

EGU23-3144 | Orals | HS2.4.4

Regional flood frequency in North Africa 

Yves Tramblay, El Mahdi El Khalki, Mahrez Sadaoui, Lahcen Benaabidate, Tayeb Boulmaiz, Hamouda Boutaghane, Hamouda Dakhlaoui, Lahoucine Hanich, Mohamed Meddi, Wolfgang Ludwig, Mohamed Elmehdi Saidi, and Gil Mahé

The Maghreb countries located in North Africa are strongly impacted by floods, causing extended damage and numerous deaths. Up to now, the lack of accessibility of river discharge data prevented regional studies on potential changes in flood hazards or the development of regional flood frequency estimation methods. A database of daily river discharge data from 55 basins located in Algeria, Morocco and Tunisia, has been recently compiled, with on average 32 years of complete records over the time period 1970-2017. A peaks-over-threshold sampling of flood events is considered, first to detect trends on the annual frequency and the magnitude of floods. The trend analysis results indicated no significant changes in flood frequency nor magnitude, with only a few spurious trends detected in cases of isolated extreme or clustered events. Then, two regional estimation methods for flood quantiles were compared, based either on spatial proximity or catchment characteristics. The regional estimation from multiple catchment characteristics (including soil types, land use, elevation, geology, extracted from global databases) was performed comparing two multiple linear regression methods, Stepwise regression and Lasso regression, and two machine learning algorithms, Random Forests and Support Vector Machines. Results indicate a better performance of the regional estimation of flood quantiles with catchments characteristics than with spatial proximity, with a mean absolute error in cross-validation close to 40%. These encouraging results open the perspective of operational applications of these methods, in particular by increasing the number of basins considered.

How to cite: Tramblay, Y., El Khalki, E. M., Sadaoui, M., Benaabidate, L., Boulmaiz, T., Boutaghane, H., Dakhlaoui, H., Hanich, L., Meddi, M., Ludwig, W., Saidi, M. E., and Mahé, G.: Regional flood frequency in North Africa, EGU General Assembly 2023, Vienna, Austria, 23–28 Apr 2023, EGU23-3144, https://doi.org/10.5194/egusphere-egu23-3144, 2023.

EGU23-3255 | ECS | Orals | HS2.4.4

Recent European drying and its link to prevailing large-scale atmospheric patterns 

Sigrid Jørgensen Bakke, Monica Ionita, and Lena Merete Tallaksen

The European continent has been struck by several extreme droughts over the last decades, associated with wide ranging societal, environmental and economic impacts. Changes in large-scale atmospheric circulation are vital for understanding the spatial patterns of changes in seasonal meteorological drought. The study presented herein is based on Bakke et al. (in review) and we begin by demonstrating the coherent pattern in the development of extreme meteorological drought and high-pressure systems during the extreme 2018 and 2022 drought events in Europe. Next, we investigate the relation between changes in large-scale atmospheric patterns and meteorological drought, as indicated by the geopotential height at 500mb (Z500) and the Standardised Precipitation-Evapotranspiration Index (SPEI), respectively. Calculations are done separately for four climate regions (North, West, Central-East and Mediterranean) over the growing season (March-September). Overall, the results show a low sensitivity to the Z500 data sets used (NCEP, ERA5, ERA20C and 20C), and the SPEI data sets (CRU and EOBS) at the regional level. We find coherent spatial patterns in 1979–2021 trends in seasonal and monthly Z500 and SPEI, with hot spots of significant changes towards higher pressure (increasing Z500) and drier conditions (decreasing SPEI) over West in spring and Central-East in summer. Strong correlations (at 1% significance level) between the variables are found for all regions throughout the growing season. A strong relation between high-pressure systems and meteorological drought is confirmed by a high degree of co-occurring regional anomalies since the beginning of the 20th century. The strongest links are detected in West, and the weakest links in North. Finally, we investigate projected Z500 according to a low-end (SSP126) and a high-end (SSP585) emission scenario. According to the projected changes, anomalously high-pressure systems will be the new normal regardless of scenario, and well exceeding the 2018 and 2022 levels in the case of the high-end emission scenario. The ability of the model ensemble to represent the spatial heterogeneity in historical Z500 variability and trends is limited. Thus, projected changes in large-scale circulation are highly uncertain. Consequently, due to the strong link between Z500 and SPEI, high uncertainties are associated with projected changes in drying trends and meteorological drought across Europe.

Bakke, S.J., Ionita, M. and Tallaksen, L.M.: Recent European drying and its link to prevailing large-scale atmospheric patterns. npj Climate and Atmospheric Science (in review). https://doi.org/10.21203/rs.3.rs-2397739/v1

How to cite: Bakke, S. J., Ionita, M., and Tallaksen, L. M.: Recent European drying and its link to prevailing large-scale atmospheric patterns, EGU General Assembly 2023, Vienna, Austria, 23–28 Apr 2023, EGU23-3255, https://doi.org/10.5194/egusphere-egu23-3255, 2023.

EGU23-3569 | Orals | HS2.4.4 | Highlight

Disentangling human influences on hydrological drought 

Gemma Coxon, John P Bloomfield, Hilary McMillan, Louisa Oldham, Francesca Pianosi, Saskia Salwey, Doris Wendt, and Yanchen Zheng

Human influences can both intensify or mitigate hydrological droughts significantly altering their severity, duration, and frequency via non-linear and dynamic feedbacks. Despite their large influence, current understanding of when, where and to what degree, human-water interactions modify hydrological drought is lacking. One of the key reasons for this is the scarce availability of quantitative human water use data as they are typically considered commercially sensitive and hard to obtain. Consequently, we often rely on static, low-resolution indicators of human water use (such as global water use databases) or qualitative information on human water use, when in reality human-water interactions are highly place-specific and non-stationary over time due to changes in water management and policies.

In this study, we will disentangle human influences on hydrological droughts using observational hydro-meteorological and groundwater data and a unique dataset of spatially explicit, time-varying abstractions and discharges for a large sample of catchments across England. Building on recent work to quantify and detect human influences, we will use a suite of hydrological signatures to characterise deviations in droughts and low flows from a large sample of benchmark (i.e. near-natural) catchments. We will link these deviations to different characteristics of the abstractions data (e.g. seasonal catchment averages, abstraction purpose) and to key water management schemes (e.g. low flow alleviation schemes). In doing so, we will advance our current understanding of how humans influence hydrological droughts and how we can improve the collection of human-water use data for future environmental analyses.

How to cite: Coxon, G., Bloomfield, J. P., McMillan, H., Oldham, L., Pianosi, F., Salwey, S., Wendt, D., and Zheng, Y.: Disentangling human influences on hydrological drought, EGU General Assembly 2023, Vienna, Austria, 23–28 Apr 2023, EGU23-3569, https://doi.org/10.5194/egusphere-egu23-3569, 2023.

EGU23-3664 | ECS | Orals | HS2.4.4

Advancing Ice-jam Flood Risk: Integrating Dynamic Adaptive Behavior into Agent-based Model of Fort McMurray 

Mohammad Ghoreishi, Apurba Das, and Karl-Erich Lindenschmidt

Human behaviors have changed as ice-jam flooding has become more prevalent, impacting both flood hazard and vulnerability as a function of flood risk. These dynamic adaptations can be developed by both governments (e.g., artificial breakup and dike installation) and individuals (e.g., flood-proofing and elevating houses). The interaction between these top-down and bottom-up measures provides a complex socio-hydrological system. However, the traditional assessment of ice-jam flood risk lacks an appropriate consideration of evolving human behaviors and their interactions with static assumptions on human adaptations. We build an agent-based model to assess the ice-jam flood risk with top-down and bottom-up adaptive strategies (artificial breakup and flood-proofing). The individuals’ behaviors are influenced by the possible reduction in flood risk at the individual level by artificial breakage over time. Also, the government’s behavior is influenced by the possible reduction in total flood risk by the dynamic adaptive behavior of individuals (flood-proofing). Thus, micro levels’ behavior can dynamically lead to macro phenomena, and macro phenomena define micro levels’ behavior over time. This model is applied to Fort McMurray along the Athabasca River, Canada, with a long history of ice-jam flooding. Also, we perform a variance-based global sensitivity analysis to investigate the individual effect of model factors and their joint effects on ice-jam flood risk. The results show that although the artificial breakage by the government leads to a regime shift and a considerable decrease in the ice-jam flood risk, it decreases the number of the newly adapted residents to flood-proofing and the role of residents in ice-jam flood risk. This study can provide a good understanding of the important role of dynamic adaptive behavior in ice-jam flood risk and pave the way for better Building flood resilience.


How to cite: Ghoreishi, M., Das, A., and Lindenschmidt, K.-E.: Advancing Ice-jam Flood Risk: Integrating Dynamic Adaptive Behavior into Agent-based Model of Fort McMurray, EGU General Assembly 2023, Vienna, Austria, 23–28 Apr 2023, EGU23-3664, https://doi.org/10.5194/egusphere-egu23-3664, 2023.

EGU23-4046 | ECS | Orals | HS2.4.4

Flood frequency analysis integrated with unprecedented flood samples and mixed probability distribution 

Abinesh Ganapathy, David M Hannah, and Ankit Agarwal

Different flood-generating mechanisms are responsible for high flows in different catchments. This mixture of generating mechanisms could violate the homogeneity assumption of the extreme value distribution used often in flood frequency analysis. Thus, this study aims to classify flood samples into homogenous process-based groups and estimate the flood quantiles for different return periods. Furthermore, this study also deals with the sample inadequacy in the flood classification by pooling ensemble reforecast datasets based on the UNprecedented Simulated Extreme ENsemble (UNSEEN) approach. The Dresden gauge in the Elbe River is selected as the study site. Daily discharge data are extracted from the GRDC, and flood events are separated based on our proposed ‘Peak-identification flood separation algorithm’, which follows four steps: 1. Identification of peaks, i.e., points with a higher streamflow value than its prior and next values, 2. Pruning based on 90th percentile threshold value, 3. Application of independence criterion, 4. Identification of flood starting and ending position. After flood separation, hydrograph features-based flood grouping and ensemble data pooling are performed. We observe the difference in the distribution characteristics of the observed in comparison to the pooled datasets. A relative difference of 0.25 (cumecs/cumecs) is noticed for the 100-year return level between observed and pooled data. As our key contribution, we address the sample mixing problem using the flood classification technique and establish the importance of data pooling.

How to cite: Ganapathy, A., Hannah, D. M., and Agarwal, A.: Flood frequency analysis integrated with unprecedented flood samples and mixed probability distribution, EGU General Assembly 2023, Vienna, Austria, 23–28 Apr 2023, EGU23-4046, https://doi.org/10.5194/egusphere-egu23-4046, 2023.

EGU23-4154 | ECS | Posters on site | HS2.4.4

Flood Frequency Analysis in an ephemeral river in Spain: inference from instrumental and historical data 

Alberto Viglione, Carlos Sánchez-García, and Lothar Schulte

The aim of this study is to evaluate the probability of flood discharges for the Almanzora River (SE Iberian Peninsula) which has a short instrumental series but information on historical events. The maximum peak discharge of the instrumental records that affected the Almanzora River occurred in 1973 and was over 5.000 m3s-1. This extreme event can be considered the most important of the 20th century, but not of history. The main questions we aim to answer are: what is the 100-yr flood for the Almanzora River if we ignore or account for historical events? And, what is the return period of the extreme 1973 flood in the area? We reconstruct the flow rates of the maximum historical floods using the descriptions retrieved from four historical archives within the Almanzora catchment since 1500. To perform the frequency analysis, we establish several thresholds: a) we assume that in the period 1500 -- 1850, no other flood exceeded the perception threshold of 3600 m3s-1, apart those reconstructed; b) during the period 1850 -- 1962, no other flood exceeded the perception threshold of 1300 m3s-1, apart those reconstructed; and c) in the instrumental period, 1963 -- 2016, we just consider as exactly known maximum annual discharges higher than 30 m3s-1. Bayesian inference is applied to fit a GEV distribution and calculate the return periods of flood discharges in the Almanzora watershed. The results show that the Q100 is 3560 m3s-1, with 95% credible bounds ranging from 2700 to 5800 m3s-1. There were at least two flood discharges (much) higher than Q100 from 1500 to 1900, in 1580 and in 1879. In both cases, the descriptions from historical sources support this assumption. Also, we estimate the return period of the 1973 flood as 250 years (with 95% credible bounds from 100 to more than 1000 years). Comparing the results using or ignoring historical floods we obtain that when the analysis is done using just instrumental data, the return period is rather underestimated: Q50 is estimated as 661 m3s-1, while with historical data is over 2000 m3s-1. FFA with historical data gives us better knowledge about the possible hazard in the area, and future river management should consider these new results.

How to cite: Viglione, A., Sánchez-García, C., and Schulte, L.: Flood Frequency Analysis in an ephemeral river in Spain: inference from instrumental and historical data, EGU General Assembly 2023, Vienna, Austria, 23–28 Apr 2023, EGU23-4154, https://doi.org/10.5194/egusphere-egu23-4154, 2023.

EGU23-4249 | Posters on site | HS2.4.4

On the attribution of annual maximum discharge across the conterminous United States 

Gabriele Villarini and Hanbeen Kim

Floods affect many aspects of our lives, and our improved understanding of the processes driving the historical changes in this natural hazard can provide basic information to enhance our preparation and mitigation efforts. Here we analyze 3,885 streamgages across the conterminous United States and attribute the inter-annual variability in annual maximum discharge to precipitation and temperature. This is accomplished by first developing gamma regression models to describe the seasonal maximum discharge in terms of basin-averaged precipitation, temperature, and antecedent wetness (i.e., the basin-averaged precipitation for the season prior to the one of interest, and used as a proxy for antecedent soil moisture conditions). These seasonal models are then mixed through a Monte Carlo approach to obtain the annual maximum discharge distribution. Despite its simplicity, our results show that the developed statistical attribution approach can describe very well the inter-annual variability in annual maximum discharge across the conterminous United States.

How to cite: Villarini, G. and Kim, H.: On the attribution of annual maximum discharge across the conterminous United States, EGU General Assembly 2023, Vienna, Austria, 23–28 Apr 2023, EGU23-4249, https://doi.org/10.5194/egusphere-egu23-4249, 2023.

EGU23-4272 | Orals | HS2.4.4

Understanding the role of precipitation intermittency on changes in extreme flooding 

Ben Livneh, Nels Bjarke, Parthkumar Modi, and Alex Furman

Extreme precipitation is projected to increase in many parts of the world, leading to concern over flooding and associated hazards. Despite the intuitive causal link between extreme precipitation and extreme flooding, observations and models suggest that other factors, in particular, low antecedent moisture may obscure or offset this relationship. Low antecedent soil moisture can arise through evaporation—driven by atmospheric warming that is projected to continue—but moisture is also reduced through an increase in the length of the time between storms, i.e., ‘storm intermittency’, which has been less studied and which can be derived directly from precipitation data. In this presentation, we focus on the modulating role of storm intermittency on the relationship between extreme precipitation and both flood potential, i.e., both flood peaks and volumes. We create an observation-based historical baseline of storm intermittency, 1950-2015, from a set of case-study basins to understand the relationship across a range of hydrometeorological settings. Next, the storm intermittency from a set of 16 CMIP6 climate models is evaluated relative to the baseline, and the evaluation is used to project future intermittency and likely outcomes on flood potential for the period 2016-2100. This projected flood potential is compared with hydrologic simulations from downscaled land surface models forced by the same CMIP6 models and differences between the projected and modeled outcomes are assessed in the context of simulated soil moisture and other hydrologic factors. Overall, we seek to understand the utility of storm intermittency as a predictor of flood potential and to understand the impacts of projected intermittency on future flood hazards.

How to cite: Livneh, B., Bjarke, N., Modi, P., and Furman, A.: Understanding the role of precipitation intermittency on changes in extreme flooding, EGU General Assembly 2023, Vienna, Austria, 23–28 Apr 2023, EGU23-4272, https://doi.org/10.5194/egusphere-egu23-4272, 2023.

EGU23-4444 | Posters on site | HS2.4.4

Historical flood classification system. Study cases obtained from the AMARNA database (CE 1035-2022) 

Jordi Tuset, Mariano Barriendos, Josep Barriendos, Josep Carles Balasch, Xavier Castelltort, Salvador Gil-Guirado, Jordi Mazón, Alfredo Pérez-Morales, and David Pino

Extreme precipitation events are characteristic of regions with a Mediterranean climate. In the framework of the current climate change, precipitation behaviours are different from those that occurred during the 20th century (instrumental period). The possibility that climate change may induce alterations in the patterns of this type of phenomena makes it desirable to prepare and analyse episode chronologies broader than those of the instrumental period. The availability of more extraordinary episodes is relativized by their qualitative information. Pre-instrumental sources of information hardly provide numerical data comparable to the flow records of river floods of modern period.

The analysis of high-severity and low-frequency episodes requires the development of specific methodologies for cataloguing and classifying the qualitative information. This work aims to show a proposal for a classification system for flood events on a historical scale. The key aspect of this methodology is the capacity to collect qualitative information on different variables of these events and convert them into numerical indices. The proposal consists of considering a total of three different variables on scales from 0 to 3:

            - First, the hydrological behaviour of the event (pluvial floods, fluvial floods or river overflows).

- Second, the impact on infrastructures, from minor damages to the destruction of built elements.

- Third, human vulnerability, from effects on mobility and transport to loss of human lives.

This methodology has been applied to the floods catalogued in the AMARNA flood database (from original language, Multidisciplinary Database for Natural Risk Analysis). This database was created after two Spanish research projects, PREDIFLOOD and MEDIFLOOD (2013-2019) to preserve flood information from Spanish Mediterranean basins.

Along with the development of this methodology, we present some examples of the application of this classification system with flood episodes from the AMARNA database. These examples are a selection of historical and instrumental period flood episodes that are cartographically represented using GIS tools. 

How to cite: Tuset, J., Barriendos, M., Barriendos, J., Balasch, J. C., Castelltort, X., Gil-Guirado, S., Mazón, J., Pérez-Morales, A., and Pino, D.: Historical flood classification system. Study cases obtained from the AMARNA database (CE 1035-2022), EGU General Assembly 2023, Vienna, Austria, 23–28 Apr 2023, EGU23-4444, https://doi.org/10.5194/egusphere-egu23-4444, 2023.

EGU23-5265 | ECS | Orals | HS2.4.4

Statistical modeling of the flood hazard in a complex and non-stationary hydrological system: case study on the Niger River in Niamey 

Elisa Sauzedde, Théo Vischel, Geremy Panthou, Vieri Tarchiani, and Giovanni Massazza

Droughts are a recurring long-term problem in West Africa, but in recent years the region has also experienced a significant increase in damaging floods. Increasing trends in extreme discharges have been shown, reflected by an increase in return level magnitude since 1980s in Sahelian rivers. Our study targets flood prediction within the regional catchment of the Niger River at Niamey, the capital of Niger. The river hydrograph has changed significantly since the drought between the 1970s and 1980s, evolving from a single peak to a two-hump hydrograph: a first flood, coming mainly from three direct Sahelian tributaries of the right bank of the Niger River, and a second one, coming from the more remote Guinean basin. Predicting floods in Niamey is not straightforward because of the complexity of the hydrological system, which combines non-stationarity and the difficulty of deconvoluting the two floods and separate their own trends.

The objective of the study is to quantitatively assess the hydrological hazard on the Niger River at Niamey based on a flow data set covering the period 1950-2020 by developing a statistical modeling approach that allows to integrate both the hydrological complexity and the non-stationarity of floods. An important question addressed by the proposed approach is to evaluate the contribution of considering hydrological complexity in non-stationary statistical modeling. This is achieved by defining several flood samples and proposing different non-stationary models adapted to their complexity.

How to cite: Sauzedde, E., Vischel, T., Panthou, G., Tarchiani, V., and Massazza, G.: Statistical modeling of the flood hazard in a complex and non-stationary hydrological system: case study on the Niger River in Niamey, EGU General Assembly 2023, Vienna, Austria, 23–28 Apr 2023, EGU23-5265, https://doi.org/10.5194/egusphere-egu23-5265, 2023.

EGU23-6346 | ECS | Orals | HS2.4.4

Skills in the representation of the propagation of the meteorological droughts through the eco-hydrological system by a land surface model across two Mediterranean catchments 

Sara Modanesi, Michel Bechtold, Gabriëlle J. M. De Lannoy, Domenico De Santis, and Christian Massari

Mediterranean mountainous basins provide critical water supply and ecosystem services, yet these environments are increasingly at risk due to anthropogenic stressors and competition for water across urban, agricultural and environmental demands. On the top of this, future climate projections suggest a drier and warmer Mediterranean with large increases in the frequency, duration, and severity of hydrological droughts with serious consequences for the management of water resources and natural ecosystems. So due to its vulnerability, it is crucial that land surface models (LSMs) correctly characterise these phenomena, as a first step to the provision of reliable projections of future water availability across the Mediterranean region.

As hydrological systems are intrinsically intertwined with climatological and ecological systems, the propagation of meteorological droughts (i.e., precipitation below than normal and higher temperatures) through them is modulated by a variety of mechanisms which are linked to carbon and water cycle interactions and specifically to how well LSMs represent evaporation fluxes and water storage.

The aim of this study is to analyse how Noah-MP LSM represents agricultural and hydrological droughts and in particular the propagation of the precipitation and evaporative demand anomalies to the soil moisture and streamflow anomalies in two typically and eco-hydrologically different Mediterranean catchments in the Upper Tiber River in Central Italy.

The analysis is carried out with the NASA Land Information System’s Noah-Multi Parameterization (Noah-MP) model configured with four soil layers with the layer thicknesses, varying from 0.1, 0.3, 0.6, and 1 m, from the surface and using a simple groundwater reservoir beneath the soil layer allowing for soil moisture–groundwater interaction and related runoff production. Noah-MP allows for the prognostic representation of vegetation growth in combination with a Ball–Berry photosynthesis-based stomatal resistance. The LAI is calculated from leaf carbon mass by multiplying by the specific leaf area. The model is validated with ground-based soil moisture and streamflow observations as well as with remote sensing-based products of evaporation, vegetation and soil moisture.

Results show a sub-optimal representation of runoff (magnitude) and LAI (with phase shift and magnitude) especially during some important drought events that have hit the region in 2012 and in 2022 (specifically over the more mountainous catchment) suggesting that improvements could be obtained from a better model parameterization of the vegetation and runoff schemes via calibration and assimilation techniques.

How to cite: Modanesi, S., Bechtold, M., De Lannoy, G. J. M., De Santis, D., and Massari, C.: Skills in the representation of the propagation of the meteorological droughts through the eco-hydrological system by a land surface model across two Mediterranean catchments, EGU General Assembly 2023, Vienna, Austria, 23–28 Apr 2023, EGU23-6346, https://doi.org/10.5194/egusphere-egu23-6346, 2023.

EGU23-6605 | ECS | Orals | HS2.4.4

Geological and climatic controls of low flows in Brazil 

Vinícius B. P. Chagas, Pedro L. B. Chaffe, and Günter Blöschl

Low flows are generated by the interplay of climatic variability and basin water storage dynamics, which depend on basin attributes such as geology and soil properties. Even though low flows have been predicted worldwide, their controls and generation mechanisms remain elusive in many regions, such as South America. Here, we investigate the relative importance of climate and basin attributes in the spatial variability of minimum annual 7-day streamflow magnitudes (Qmin) of 1412 river basins in Brazil. We analyze time series of observed daily streamflow, precipitation and evaporation from 1980-2020; geology such as rock type and hydraulic conductivity; topography; soil properties such as sand content and class; and land cover. We estimate Qmin with a simple conceptual model that separates the roles of climate and basin attributes in regulating low flows. For each river basin, we identify the longest annual dry spells and estimate Qmin using an exponential decay model with three components: (i) initial flow, which indicates the basin’s water storage at the dry spell onset; (ii) dry spell length (Tdry), representing climate seasonality, computed from a 31-day precipitation minus evaporation series; and (iii) flow recession rate (Qrec), indicating how quickly the basin releases the water stored. We estimate the initial flow component with the fraction (β) of mean annual precipitation minus evaporation (PEm) that recharges the aquifer. This fraction is estimated from basin attributes using model-based recursive partitioning, a method similar to regression trees, in which we found soil properties as the predominant attributes. The flow recession component is estimated likewise, in which we found rock type and composition as the predominant attributes. We found that the model explains 56% of the variance in observed Qmin. The large-scale patterns show a close match. Results show that the relative importance of climate and basin attributes depends on the spatial scale of analysis. Climate and basin attributes are similarly important at the national scale, in which changing PEm, Tdry, Qrec, and β by one spatial standard deviation change estimated Qmin on average by 41%, 57%, 66%, and 31% respectively. On the other hand, basin attributes control low flow variability on subnational scales. Analyzing blocks sized 300 by 300 km, changing PEm, Tdry, Qrec, and β by one spatial standard deviation in each block change estimated Qmin on average by 19%, 11%, 36%, and 19%. Our interpretation is that the spatial variability of low flows is regulated mainly by the basin’s water storage capacity, here driven by rock type and composition, which even compensates for the highly seasonal climate from the South American monsoons. For example, most of the highest low flows (i.e., Qmin above 1 mm/d) are located in high-storage sandstone aquifers, a common aquifer type in Brazil. These highest low flows rarely occur in low-storage aquifers, which require a combination of high annual precipitation (i.e., above 3000 mm/yr) and the absence of a dry season such as in northwestern Amazonia. These findings can contribute to water security by estimating the impacts of climate change and variability on droughts.

How to cite: Chagas, V. B. P., Chaffe, P. L. B., and Blöschl, G.: Geological and climatic controls of low flows in Brazil, EGU General Assembly 2023, Vienna, Austria, 23–28 Apr 2023, EGU23-6605, https://doi.org/10.5194/egusphere-egu23-6605, 2023.

EGU23-6681 | ECS | Orals | HS2.4.4

Improving Streamflow Prediction Using a Model Integration Approach 

Akshay Kadu and Basudev Biswal

Accurate streamflow prediction is necessary both during wet and dry periods for efficient management of water resources. However, most hydrological models mainly focus on simulating high flows and perform poorly during low-flow or recession periods. Therefore, past studies have resorted to various calibration techniques to allow rainfall-runoff (R-R) models better capture recession flow dynamics. In the present study, we propose integrating two structurally different models and utilising their relative strengths to improve overall streamflow prediction. The proposed framework integrates a conceptual rainfall-runoff model (HBV) and a simple power-law regression (PLR) such that the former is utilised for high-flow prediction and the latter for low-flow prediction. We compared the performance of this integrated model framework (HBV-PLR) with the original HBV model using data from 108 basins in the United States. It was found that the 25th, 50th, and 75th percentiles of mean absolute error (MAE) for HBV, respectively, improved from (0.47, 0.62, and 0.77) to (0.38, 0.50, and 0.67) using the HBV-PLR integrated framework. Similarly, the median Nash-Sutcliffe Efficiency (NSE) during the recession improved from 0.65 to 0.74. Here, we also argue that forcing HBV model to simulate low-flow dynamics by calibrating it using an objective function biased towards lower values may not lead to a prediction as accurate as HBV-PLR. Therefore, a model integration approach is a better option than using a single model to improve streamflow prediction during different flow regimes.

How to cite: Kadu, A. and Biswal, B.: Improving Streamflow Prediction Using a Model Integration Approach, EGU General Assembly 2023, Vienna, Austria, 23–28 Apr 2023, EGU23-6681, https://doi.org/10.5194/egusphere-egu23-6681, 2023.

EGU23-7409 | Orals | HS2.4.4

The outstanding 2022 hydrological drought in France within a 150-year historical context 

Jean-Philippe Vidal, Alexandre Devers, Claire Lauvernet, Louis Héraut, and Olivier Delaigue

The 2022 European drought affected the whole of France, leading to very severe summer low-flows. The outstanding characteristics of this event is questioned within a long-term historical context. It first makes use of 600+ daily streamflow series gauging near-natural catchments from all French regions. The historical background is provided by the 25-member ensemble hydrological reanalysis FYRE Hydro which covers the period 1871-2012 for the above stations. FYRE Hydro originates from a 25-member ensemble streamflow simulation using the GR6J lumped conceptual model. These simulations integrate three types of uncertainty: (1) the meteorological uncertainty through the use of the 25 members of the high-resolution FYRE Climate meteorological reanalysis (Devers et al., 2021) as forcings, (2) the uncertainty in streamflow measurement used to calibrate the hydrological models, and (3) the hydrological model error based on relative discrepancies between observed and simulated streamflow (Bourgin et al., 2014). An ensemble Kalman filter furthermore combined these ensemble simulations with available historical series together with their uncertainties to produce the FYRE hydro reanalysis. Streamflow observations from 2022 are compared to severe drought years in the FYRE Hydro reanalysis as identified by Caillouet et al. (2021). Results show that 150-year records were broken over a large number of stations for various low-flow indicators, confirming the exceptional nature of this hydrological drought event.


Bourgin, F., Ramos, M., Thirel, G., and Andréassian, V.: Investigating the interactions between data assimilation and post-processing in hydrological ensemble forecasting, Journal of Hydrology, 519, 2775 – 2784, 85 https://doi.org/https://doi.org/10.1016/j.jhydrol.2014.07.054, 2014

Caillouet, L., Vidal, J.-P., Sauquet, E., Devers, A., Lauvernet, C., Graff, B., and Vannier, O.: Inter-comparison of extreme low-flow events in France since 1871, LHB: Hydroscience Journal, 107, 1-9 https://doi.org/10.1080/00186368.2021.1914463, 2021

Devers, A., Vidal, J.-P., Lauvernet, C., and Vannier, O.: FYRE Climate: a high-resolution reanalysis of daily precipitation and temperature in France from 1871 to 2012, Clim. Past, 17, 1857–1879, https://doi.org/10.5194/cp-17-1857-2021, 2021

How to cite: Vidal, J.-P., Devers, A., Lauvernet, C., Héraut, L., and Delaigue, O.: The outstanding 2022 hydrological drought in France within a 150-year historical context, EGU General Assembly 2023, Vienna, Austria, 23–28 Apr 2023, EGU23-7409, https://doi.org/10.5194/egusphere-egu23-7409, 2023.

EGU23-7677 | ECS | Orals | HS2.4.4

Simulating Hydrological Extremes for different Warming Levels – combining Large Scale Climate Ensembles with local observation based Machine Learning models 

Sandra M. Hauswirth, Karin van der Wiel, Marc F. P. Bierkens, Vincent Beijk, and Niko Wanders

Climate change has a large influence on the occurrence of extreme hydrological events. In this study we take advantage of two recent developments that allow for more detailed and local estimates of future hydrological extremes. New large climate ensembles (LE) now provide more insight into the occurrence of hydrological extremes as they offer order of magnitude more realizations of the future weather and thus floods and droughts. At the same time recent developments in Machine Learning (ML) based forecasting have enabled scientists to provide this LE information to a local scale relevant to water managers.

In this study we combine LE, consisting of 2000 years of global data for scenarios representing present-day, 2 and 3 degrees warmer climate (1), together with a local, observation-based ML model framework for simulating hydrological extremes for the Netherlands (2, 3).

We developed a new post-processing approach that allows us to use LE simulation data for local applications based on historical information. We test the application of the post-processing step based on historical simulations, before implementing in the different scenario runs.

The discharge simulation results for the different scenarios show a clear seasonal cycle with increased low flow periods (both average duration and number of events) from summer till end of autumn (~45% August-October) and increased high flow periods for early spring (~43% February-April) looking at national scale, with the 3-degree warmer climate scenario showing the highest percentages for both (52.5% and 48.3% respectively). Regional differences can be seen in terms of shifts (low flows occurring earlier in the year) and range (higher/lower percentages). These trends can further be detangled into location specific results, due to the added value provided by the ML setup.

We show that by combining the wealth of information from LE and the speed and accuracy of ML models we can advance the state-of-the-art when it comes to modelling and projecting hydrological extremes. The local modelling framework allows to simulate discharge under different climate change scenarios for national, regional and local scale assessments. The historically and locally trained models provide essential information for water management to be used in  long-term planning.

1) Van der Wiel, K., Wanders, N., Selten, F. M., & Bierkens, M. F. P. (2019). Added value of large ensemble simulations for assessing extreme river discharge in a 2 °C warmer world. Geophysical Research Letters, 46, 2093– 2102.
2) Hauswirth, S. M., Bierkens, M. F., Beijk, V., & Wanders, N. (2021).
The potential of data driven approaches for quantifying hydrological extremes. Advances in Water Resources, 155, 104017.
3) Hauswirth, S. M., Bierkens, M. F., Beijk, V., & Wanders, N. (2022). The suitability of a hybrid framework including data driven approaches for hydrological forecasting. Hydrology and Earth System Sciences Discussions, 1-20.

How to cite: Hauswirth, S. M., van der Wiel, K., Bierkens, M. F. P., Beijk, V., and Wanders, N.: Simulating Hydrological Extremes for different Warming Levels – combining Large Scale Climate Ensembles with local observation based Machine Learning models, EGU General Assembly 2023, Vienna, Austria, 23–28 Apr 2023, EGU23-7677, https://doi.org/10.5194/egusphere-egu23-7677, 2023.

EGU23-8668 | ECS | Posters on site | HS2.4.4

Drought evolution in North American river basins: attribution analysis through a Lagrangian approach 

Rogert Sorí, Milica Stojanovic, Luis Gimeno-Sotelo, Albenis Pérez-Alarcón, Mojtaba Heydarizad, Marta Vázquez, José Carlos Fernández-Alvarez, Raquel Nieto, and Luis Gimeno

Drought events have become more frequent and severe across North America, threatening water availability in river basins and thus ecosystem and socio-economic development. This is why in this study, we investigate the occurrence, evolution, and attribution of drought conditions in nine major North American river basins, the Colorado, Columbia, Fraser, Mackenzie, Mississippi, Rio Grande, Saskatchewan-Nelson, St. Lawrence, and Yukon. The analysis was performed on a spatio-temporal scale for the period 1980-2018. Precipitation data from MSWEP and CRU were used, as well as terrestrial water storage from GRACE. In addition, the Lagrangian moisture contribution from oceanic and terrestrial origin to precipitation over the basins, named PLO and PLT, respectively, were used. Drought indices such as the Standardised Precipitation Index (SPI), Standardised Precipitation-Evapotranspiration Index (SPEI), and Drought Severity Index (DSI) were used to assess the occurrence of dry conditions at various temporal scales. In addition to the attribution of the occurrence and severity of drought extremes due to PLO and PLT deficits, the trend was assessed. The results show that despite the differentiated nature of precipitation origin between the western and eastern basins, in most of them, a joint coupling prevails in the occurrence of positive or negative trends of dry/wet conditions of oceanic and terrestrial origin, which ultimately modulate the evolution of dry/wet conditions in the basins.  

How to cite: Sorí, R., Stojanovic, M., Gimeno-Sotelo, L., Pérez-Alarcón, A., Heydarizad, M., Vázquez, M., Fernández-Alvarez, J. C., Nieto, R., and Gimeno, L.: Drought evolution in North American river basins: attribution analysis through a Lagrangian approach, EGU General Assembly 2023, Vienna, Austria, 23–28 Apr 2023, EGU23-8668, https://doi.org/10.5194/egusphere-egu23-8668, 2023.

EGU23-9349 | ECS | Posters on site | HS2.4.4

Historical and projected drought characteristics across different hydrological regimes in Central Chile 

Fabián Lema, Pablo Mendoza, Nicolás Vásquez, Naoki Mizukami, Mauricio Zambrano-Bigiarini, and Ximena Vargas

Drought is one of the main hydroclimatic hazards worldwide, affecting water availability, ecosystems and socioeconomic activities. Since 2010, Central Chile (30–38°S) has been experiencing a drought with unprecedented duration and severity (also known as the Central Chile megadrought), producing drastic reductions in river flows, snow cover and reservoir levels. Nevertheless, there is limited understanding of how hydrological processes have been altered and whether such variations will persist during the 21st century. In this study, we characterize the magnitude, frequency, and duration of drought events under historical conditions and future climate scenarios across different hydrological regimes in Central Chile. To this end, we generate daily time series of streamflow, evapotranspiration, soil moisture and other hydrological variables in six case study basins with little human intervention for the period 1981-2100, using the Structure for Unifying Multiple Modeling Alternatives (SUMMA) framework and the mizuRoute model. Simulations are conducted at a 0.05º x 0.05º horizontal resolution, using a combination of the CR2MET gridded product and ERA5 outputs to obtain historical meteorological forcings, and statistically downscaled global climate model (GCM) outputs from the Coupled Model Intercomparison Project Phase 6 (CMIP6) to obtain future climate time series. Finally, we characterize drought events with the Standardized Precipitation Index (SPI), Standardized Streamflow Index (SSI), and Soil Moisture Index (SMI). The calibrated hydrologic model parameters yield daily streamflow simulations with a Kling-Gupta Efficiency (KGE) greater than 0.78 and 0.61 in all basins for the calibration and evaluation periods, respectively. The drought indices estimated for the historical period enable identifying the severe events of 1998-1999 and 2010-2020 (with standardized values smaller than -1.28); however, the magnitude and duration varies depending on the event and hydrological variable analyzed. Ongoing work seeks to examine inter-basin differences in terms of drought characteristics, along with projected changes in the frequency and intensity of this type of event.

How to cite: Lema, F., Mendoza, P., Vásquez, N., Mizukami, N., Zambrano-Bigiarini, M., and Vargas, X.: Historical and projected drought characteristics across different hydrological regimes in Central Chile, EGU General Assembly 2023, Vienna, Austria, 23–28 Apr 2023, EGU23-9349, https://doi.org/10.5194/egusphere-egu23-9349, 2023.

EGU23-9541 | ECS | Orals | HS2.4.4

Mapping changes in surface-water extent during the 2022 hydrological drought in Germany using Sentinel-2 data 

Sandro Groth, Florian Fichtner, Marc Wieland, Nico Mandery, Subarno Shankar, Sandro Martinis, and Torsten Riedlinger

The 2022 hydrological drought in Europe was a significant event that resulted in widespread water shortages and economic disruption. The low water levels had significant implications for supply chains, transport capacity and water quality. In this study, we used a fully automated, neural-network based processing chain to semantically segment Sentinel-2 data. The processing chain was originally developed for flood detection. To map changes in surface-water extent during the drought, we compared reference water masks of the previous two years with the extent of summer 2022.
Our results show that the drought had a measurable impact on surface-water extents across Germany, with many rivers and lakes experiencing declines. A decline can be observed in all river basins. By providing detailed maps of these changes, our study offers valuable insights into the impact of droughts on surface water extent and can help inform future drought mitigation and management efforts in the region. The results presented in this contribution indicate, that the surface water extent in Germany 2022 declined by 3.1% compared to the previous two years. The most affected hydrological catchment area was the Weser river basin, which experienced a water extent loss of 7.4%.

How to cite: Groth, S., Fichtner, F., Wieland, M., Mandery, N., Shankar, S., Martinis, S., and Riedlinger, T.: Mapping changes in surface-water extent during the 2022 hydrological drought in Germany using Sentinel-2 data, EGU General Assembly 2023, Vienna, Austria, 23–28 Apr 2023, EGU23-9541, https://doi.org/10.5194/egusphere-egu23-9541, 2023.

EGU23-9704 | ECS | Orals | HS2.4.4

Establishing streamflow drought characteristics in an inter-Andean Mountain catchment 

Adrian Sucozhañay and Rolando Célleri

Drought is the most damaging natural phenomena for large areas and populations. Places such as the Andean tropics have not been exempt from the presence of these events. Among these, hydrological droughts play a critical role because streamflow is closely related to the development of the population living in mountains. The study of these droughts has been neglected because, most of the time water availability has exceeded the water demand. However, this has caused a high vulnerability in the region due to the lack of knowledge and preparation for these events. In addition, the intensification of the water cycle due to climate change aggravates the situation. In this context, the objective of this study was to characterize streamflow droughts in an inter-Andean catchment. The study was performed in four near-natural headwater catchments distributed in a nested approach. Catchments are located in the southern Ecuadorian Andes, between 4550 and 2500 m a.s.l. where groundwater contribution is significantly reduced. Between 25 and 44 years of daily streamflow data was used. To identify streamflow droughts, the threshold method was used on a fixed and daily basis. In addition, different threshold levels obtained from the 70th, 80th, 90th, 95th and 98th percentiles of the duration curve were used. From the events identified, the characteristics of duration, magnitude and intensity were calculated. The five percentiles identified a minimum and maximum number of 40 and 670 events, respectively. On the other hand, the fixed threshold detected on average 27% more events compared to the daily threshold. The average duration, magnitude and intensity varied between: 3.2 and 12.85 days; 0.12 and 5.31 mm; and 0.02 and 0.24 mm day-1, respectively. Despite the existence of events with more extreme characteristics, on average, the presence of events of short duration and magnitude prevail. These results are very different compared to those produced in lowlands, where the contribution of groundwater is important. Additionally, the lag between a meteorological and hydrological drought is very small, and therefore other ways to identify droughts should be studied. Results provide insight into the identification and characteristics of streamflow droughts in a poorly studied region such as the Andes. These can help to improve water resource management rules and evaluate water stress scenarios.

How to cite: Sucozhañay, A. and Célleri, R.: Establishing streamflow drought characteristics in an inter-Andean Mountain catchment, EGU General Assembly 2023, Vienna, Austria, 23–28 Apr 2023, EGU23-9704, https://doi.org/10.5194/egusphere-egu23-9704, 2023.

Assessing precipitation non-stationarity beyond the modern, instrumental record is valuable for disentangling the impacts of anthropogenic climate change from natural climate variability. This study evaluated changes in 3-month meteorological drought and pluvial extremes by merging tree-ring reconstructions, observations, and climate model simulations spanning 850 – 2100 CE across North America; to determine whether the Industrial era and projected future changes are outside the range of natural climate variability. To accomplish this, we utilized a non-stationary version of the commonly used Standardized Precipitation Index (SPI), modified to capture the slow progression of underlying statistical distributions through time. Within this non-stationary framework, multi-dimensional splines simultaneously model annually recurring seasonality and seasonally specific trends, constrained to mimic the WMO 30-year reference period, for each distribution parameter. The non-stationary SPI framework was further developed to merge tree-ring proxy data, 20th century observations, and CMIP6 climate model output into a common millennial-scale model by accounting for seasonal and data-specific biases.

Results show that many regions of North America have already experienced significant intensification of drought and pluvial extremes relative to the previous 1,000 years of presumed natural climate variability. These appear as widespread exacerbation of both extremes, especially summer drought and winter pluvials with consistent spatial signals: overall drying trends in the west and south, wetting trends in the northeast, and increased interannual variability across the east and north. Climate change projections indicate a continued intensification of these trends by 2100. These results underscore the need for reassessing severities of recent drought and pluvial events relative to a changing climatological baseline and a need for incorporating climate non-stationarity when assessing future drought and pluvial risk. 

How to cite: Stagge, J. and Sung, K.: Ongoing and projected future intensification of North American pluvial and drought extremes relative to the pre-Industrial millennium, EGU General Assembly 2023, Vienna, Austria, 23–28 Apr 2023, EGU23-10691, https://doi.org/10.5194/egusphere-egu23-10691, 2023.

Extreme floods estimation in a changing climate is a challenge facing two major methodological difficulties: extrapolation to low-probabilities events, in a non-stationary climate. Despite its complexity, such an estimation is a key input for the safety assessment,and the design of high-risk infrastructures (dam, nuclear powerplant), built for decades and supposed to withstand the future climate.

When significant, the trend on observed floods is dependent on the climatology and scale of the considered catchment and cannot be directly transposed to the high quantiles required for safety assessment. In the literature, three modeling frameworks can be distinguished to compute these estimations in a non-stationary climate:

  • Non-stationary Flood Frequency Analysis performed with time or a climate covariable.
  • Dedicated extreme flood estimation method (like those being based on rainfall-runoff stochastic simulation), integrating the time or a climate covariable.
  • Complete climate and hydrology modeling chains (combining GCM, RCM and hydrological models).

The approach proposed here falls into the second category, with the application of the SCHADEX method in an evolving climate. The SCHADEX method  it is based on a semi-continuous rainfall–runoff simulation process which allows the generation of an exhaustive set of crossings between precipitation and soil saturation hazards.

In this study a regional surface temperature, modeled by 10 different GCMs from the CMIP5 project for the RCP 4.5 and 8.5 scenarios, is used to drive a non-stationary, temperature-varying, distribution of extreme rainfall. The temperature-quantile models are calibrated season by season thanks to the observations of the 1950-2019 period where trends are statistically significant. Another method downscales the same GCM models thanks to the analog method to generate projected series of areal rainfall and basin average temperature. These series are used as future climatological input of the SCHADEX method. For several 35-years windows up to 2099, and for the RCP 4.5 and 8.5 scenarios, SCHADEX computes the estimation of extreme flood quantile based on both the projected extreme rainfall distribution and climatology. These estimations are compared to the 1985-2019 reference period to assess the evolution of estimated high quantiles.

The study is based on a dataset of seven catchments ranging from 1200 to 7000 km² located in various regions of the South-East half of France with contrasted climates. Only the significant rainfall trends are modeled, assuming a stationary extreme rainfall distribution otherwise.

The most significant changes in extreme rainfall are for basins under Mediterranean influence. Due to the non-linearity on the catchment’s response to heavy rain, the changes in extreme flood estimation are generally higher than the changes in extreme rainfall. In most catchments, drier future pre-flood conditions do not significantly dampen the increase of rainfall. For mountainous catchments, increased temperatures lead to higher rain-snow limit during intense events in autumn, and higher pre-flood snowmelt in spring, globally increasing the efficiency of heavy rainfall.

Some perspectives of this study are drawn, among them the need for another climate variable in the models, aside the surface temperature, which could account for the cyclogenesis evolutions. Some discrepancies between the two modeling chains (extreme rainfall distribution and climatology) are also to be tackled.

How to cite: Paquet, E.: Estimation of extreme flood quantiles with the SCHADEX method in projected climatic conditions, EGU General Assembly 2023, Vienna, Austria, 23–28 Apr 2023, EGU23-11938, https://doi.org/10.5194/egusphere-egu23-11938, 2023.

EGU23-12164 | ECS | Orals | HS2.4.4

Modeling extreme meteorological droughts from paleo-climatic reconstructions using a metastatistical framework 

Maria Francesca Caruso, David Johnny Peres, Antonino Cancelliere, and Marco Marani

The vulnerability of large areas to drought events emphasizes the importance of a reliable probability analysis of drought events. A drought is notoriously considered as one of the most complex natural phenomenon, which, more than other natural hazards, remains difficult to quantitatively model due to the difficulty of sampling a sufficient number of events in the historical record. In fact, due to the persistence and often long interarrival times between droughts, occurring on time scales of years to decades or more, very long observational time series are necessary to study their statistical properties. It is indeed rare that such a large amount of observational information, at appropriate space-time resolutions and consistency, are available in practical applications.

One possible approach to overcome this problem relies on the use of proxy climatic data to extend the instrumental record. Additionally, since relatively few drought events occur even within records of several hundred years, techniques which optimally use available information, such as the metastatistical framework, may be highly beneficial in these analyses.

Motivated by the above considerations, this work exploits a publicly available tree-ring based Old World Drought Atlas (OWDA; Cook et., 2015), a reconstruction of the June–August self-calibrating Palmer Drought Severity Index (sc-PDSI), to model the stochastic nature of the drought characteristics. To gain a quantitative understanding of how well tree ring-based data capture drought occurrences, we compare the sc-PDSI computed with direct observations of precipitation and temperature, with those obtained from tree-ring proxies. Furthermore, we characterize drought events and their properties using the statistical “theory of runs”. We then explore the potential of the Metastatistical Extreme Value Distribution (MEVD) to estimate the probability of occurrence of drought events and compare its performance with that obtained by the use of traditional approaches. A cross-validation scheme, dividing the available data into independent calibration and test sub-sample, is used to quantify the estimation uncertainty associated with different sample sizes and estimation methods.

The analysis of extreme droughts in two case studies in Italy suggests that the MEVD-based formulations are more robust and flexible approaches with respect to traditional ones. The comparative analysis of the predictive estimation uncertainty is site-specific, but MEVD estimates outperform, in terms of bias and uncertainty, traditional GEV estimates.

The analyses also (1) confirm the usefulness of the paleoclimate reconstructions for improving the robustness of the statistical study of extreme droughts, and (2) highlight that the metastatistical formulations allow estimations of probability of intense droughts even when observational length is too short to apply traditional methods.

How to cite: Caruso, M. F., Peres, D. J., Cancelliere, A., and Marani, M.: Modeling extreme meteorological droughts from paleo-climatic reconstructions using a metastatistical framework, EGU General Assembly 2023, Vienna, Austria, 23–28 Apr 2023, EGU23-12164, https://doi.org/10.5194/egusphere-egu23-12164, 2023.

EGU23-12440 | ECS | Posters on site | HS2.4.4

Flood frequency analysis in Nordic condition over the past decades: Cases from Finland 

Sahand Ghadimi, Ritesh Patro, Bjørn Kløve, and Ali Torabi Haghighi

Climate change and anthropogenic activities have always affected the hydrological condition of watersheds. The uniqueness of Nordic watersheds characteristics (systems of lakes and rivers dominant by cold climate) and land cover (drained and pristine forests and peatlands) results in different river regimes in these regions compared to the other parts of the world. Long extreme cold winters usually freeze the river and lakes deeply to some depth, while, during short Nordic summers, the river flows can be influenced by forest and forestry activities, especially drainage systems. In addition, the changing climate is another driver that impacts river flows, especially extreme hydrological events (floods and droughts). This study investigates the long-term flood frequency alteration in two snowmelt and rainfall-dominant seasons for several headwaters in Finland as a Nordic region. The long-term daily discharge, rainfall, snow depth, and temperature data for selected watersheds were analyzed. The monthly and annual changes in mean, maximum, and minimum of discharge and rainfall and their trends were assessed to detect the rain and snowmelt-dominated seasons. Then the flood frequencies are estimated using  EV (Extreme Value) method for both seasons in different periods. Investigating such changes provides a broad view of the current and long-term situation of the river systems, which can help for long-term water resources planning and hydrosystem developments.

How to cite: Ghadimi, S., Patro, R., Kløve, B., and Torabi Haghighi, A.: Flood frequency analysis in Nordic condition over the past decades: Cases from Finland, EGU General Assembly 2023, Vienna, Austria, 23–28 Apr 2023, EGU23-12440, https://doi.org/10.5194/egusphere-egu23-12440, 2023.

Extreme hydrological events have had several economic, ecologic, and social impacts on many regions around the world. Although the impacts of floods and droughts are equally important and severe, they are typically treated as separate phenomena due to their hydrological differences. However, in order to address and mitigate their impacts, it is important to analyse and model the interactions between the spatial and temporal characteristics of the events, not only separately but also in a joint framework. Moreover, understanding and simulating the effects of land-use land-cover changes on extreme events dynamics is crucial to improve the development of land use policies and risk management plans. The Central America Dry Corridor (CADC) is one of the regions in the world with the highest vulnerability to floods and droughts due to its marked precipitation seasonality and climate variability. Land use change is also an important variable in this mainly rural area, in which forest cover has declined rapidly during the last decades, modifying basin runoff and affecting extreme events generation. Therefore, this study proposes a methodology to analyse and represent in a joint framework the spatio-temporal characteristics of CADC’s floods and droughts, and identify their relationship with land-use land-cover change patterns. To achieve this, a hybrid modelling framework that integrates Machine Learning (ML) techniques with a spatially distributed hydrological model is presented. It is expected that the integration of ML techniques increases hydrological model capabilities to accurately simulate the effects of land-use land-cover change on floods and droughts propagation. It is also expected that the hybrid model can be used as a tool to assess the effectiveness of different risk management measures and land use policies in floods and droughts mitigation.


How to cite: Torres, E., Corzo, G., and Solomatine, D.: Spatio-temporal analysis of extreme hydrological events in a joint framework and its relationship with land-use land-cover change, EGU General Assembly 2023, Vienna, Austria, 23–28 Apr 2023, EGU23-13167, https://doi.org/10.5194/egusphere-egu23-13167, 2023.

EGU23-13284 | Orals | HS2.4.4

A new framework for drought definition, identification, and preparedness 

Pedro Henrique Lima Alencar and Eva Nora Paton

Climate change has led to new forms of extreme that until recently were not a topic of concern for the scientific community and general society. Terms such as flash droughts, megadrought, and anthropogenic droughts, among others, entered our vocabulary only recently, in the past decade or so. However, such categorizations are unclear and only come after the fact and with a considerable delay between impacts and definition, hindering preparedness potential. By the current projections and actions regarding climate change, one can only assume that extreme events of different magnitudes, multiple drivers and extensive impacts will keep surprising us. We propose in this work a novel frame to define extreme events. The aim is to allow their identification and increase preparedness against their impacts. The premise is to invert the pyramid of priorities and (1) in collaboration with stakeholders, policymakers and society, assess the potential impacts, defining different levels of “damage”. (2) From the identified levels of impact, use historical data, modelling, and projections to assess frequencies and drivers. Finally, (3) define the thresholds and patterns that lead to such impacts, supporting informed mitigation action and forecast. We present two examples of the application of this methodology regarding crop production in Germany. First, we identify what dry spell duration, thresholds, and seasonality are critical to crop yield. In the second, we identify the flashiness and intensity of flash droughts that lead to increasing crop losses, besides environmental drives to such events. This approach provides better results in identifying and defining such events. It also equips scientists with more didactic and direct measures of extreme events, facilitating communication and empowering action.

How to cite: Lima Alencar, P. H. and Paton, E. N.: A new framework for drought definition, identification, and preparedness, EGU General Assembly 2023, Vienna, Austria, 23–28 Apr 2023, EGU23-13284, https://doi.org/10.5194/egusphere-egu23-13284, 2023.

EGU23-13352 | Posters on site | HS2.4.4

Hydrological drought – processes and estimation methods for streamflow and groundwater 

Lena M. Tallaksen, Henny A.J. Van Lanen, Jamie Hannaford, Hege Hisdal, Daniel G. Kingston, Gregor Laaha, Christel Prudhomme, James H. Stagge, Kerstin Stahl, Anne F. Van Loon, and Niko Wanders

Drought is a worldwide phenomenon that originates from a prolonged deficiency in precipitation, often combined with high evaporation, over an extended region. The resultant meteorological water balance deficiency may cause a hydrological drought to develop into below normal levels of streamflow, lakes, and groundwater. Contemporary knowledge and experiences from an international team of drought experts are consolidated in a textbook (Tallaksen et al., 2023), which builds on an earlier edition (URL 1), however with significant new material added. An updated synthesis was needed because of hydrological drought-issues that has been emerged over the last 15 years, particularly when much of the topic is currently dominated by climate and climatology approaches. The textbook consists of three parts; Part I (Drought as a natural hazard) discusses the drought phenomenon, its main features, regional diversity and controlling processes. Part II (Estimation methods) presents contemporary approaches to drought estimation, including data and hydrological drought characteristics, statistical analysis of drought series, incl. frequency analysis, time series analysis and regionalization procedures, as well as process-based modelling. Part III (Living with drought) addresses aspects related to the interactions between water and people. Topics include historical and future drought, how human interventions influence drought, drought impacts and Drought Early Warning Systems. Knowledge and experiences shared in the book are from regions all over the world although somewhat biased to Europe and rivers that flow most of the year.

This presentation aims to introduce the textbook, its motivation and content to a wide audience. The textbook is supported with worked examples and self-guided tours that are elaborated more extensively on Github. Worked examples include online procedures, code, and details of the calculation procedure that enable readers to repeat calculations in a stepwise manner, either with their own data or by using online datasets, and we encourage user’s feedbacks and experiences in testing these. Self-guided tours are demonstrations of advanced methodologies that involve several calculation steps and are given as an online presentations. Four datasets are included on Github; an international, a regional and two local datasets. The international dataset illustrates the drought phenomenon and its diversity across the world, whereas regional data and local aspects of drought are studied using a combination of hydroclimatological time series and catchment information. Hopefully, the textbook will contribute to an increased awareness of one of our main natural hazards, and thereby increase the preparedness and resilience of society to drought.


References

  • URL 1: http://europeandroughtcentre.com/resources/hydrological-drought-1st-edition/
  • Tallaksen, L.M., Van Lanen, H.A.J., Hannaford, J., Hisdal, H., Kingston, D.G., Laaha, G., Prudhomme, C., Stagge, J.H., Stahl, K., Van Loon, A.F., Wanders, N., Barker, L.J., Blauhut, V., Bloomfield, J.P., Cammalleri, C., Engeland, K., Everard, N., Facer-Childs, K., Fendeková, M., Fry, M., Gauster, T., Harrigan, S., Ionita, M., Marsh, T., Muchan, K., Ngongondo, C., Parry, S., Rees, G., Sauquet, E., Vidal, J-P. and Vogt, J. (2023). Hydrological Drought. Processes and Estimation Methods for Streamflow and Groundwater. Elsevier Publisher.

How to cite: Tallaksen, L. M., Van Lanen, H. A. J., Hannaford, J., Hisdal, H., Kingston, D. G., Laaha, G., Prudhomme, C., Stagge, J. H., Stahl, K., Van Loon, A. F., and Wanders, N.: Hydrological drought – processes and estimation methods for streamflow and groundwater, EGU General Assembly 2023, Vienna, Austria, 23–28 Apr 2023, EGU23-13352, https://doi.org/10.5194/egusphere-egu23-13352, 2023.

Estimation of flood quantiles at ungauged sites is a vital aspect of the design and planning of hydraulic structures. There are various approaches such as Conventional Index Flood (CIF), Logarithmic Index Flood (LIF), and Population Index Flood (PIF), etc, that have been established to evaluate flood quantile at ungauged sites. These conventional approaches assume that the scale and shape parameters of frequency distributions remain identical for all the sites in a homogeneous region. However, this assumption may not be valid for hydrologically similar real-world catchments. Recently, a transformation-based mathematical approach to regional frequency analysis was proposed by Basu and Srinivas (2013), which ensured the assumption of having identical scale and shape parameters across the sites in a hydrologically similar homogeneous region. The approach involves (i) identification of appropriate frequency distribution representing the homogeneous region, (ii) Mapping the flood quantile (corresponding to various non-exceedance probability) from the original space to a dimensionless space, where values of parameters of distributions at sites in the region remain identical, (iii) construction of regional growth curve in dimensionless space and, (iv) Mapping of dimensionless regional growth curve to original space by applying inverse transformation equations. This study presents an application of the approach given by Basu and Srinivas (2013) for estimating the design flood estimate at ungauged catchments in the Krishna river basin. The delineation of hydrologically similar regions is performed by using a global k-means clustering algorithm. In this study, The parameters of the inverse transformation equations are obtained by using log-linear regression model (LLRM), generalized additive model (GAM), and multivariates adaptive regression spline (MARS). Finally, a comparative analysis is performed to assess the efficacy of the regression models in estimating the parameters of transformation equations. The result revealed that the Regional Flood Frequency Analysis (RFFA) using Basu and Srinivas's (2013) approach is effective for reliable prediction of design flood estimates in Indian watersheds.

How to cite: Singh, A. and Chavan, S.: Design flood estimation for ungauged catchments in Krishna River Basin using a transformation-based approach to Regional Flood Frequency Analysis, EGU General Assembly 2023, Vienna, Austria, 23–28 Apr 2023, EGU23-13415, https://doi.org/10.5194/egusphere-egu23-13415, 2023.

EGU23-13913 | Posters on site | HS2.4.4

Challenging our knowledge on flood frequency 

Martina Kauzlaric, Olivia Martius, Schick Simon, and Zischg Andreas Paul

In recent times water-related hazards have captured public attention and led to an increased interest in developing hydrologic forecasting systems, and quantifying their reliability. Despite major investments in flood forecasting and flood protection measures undertaken after recurring widespread inundations (e.g. 2002 and 2013 in Eastern Europe), heavy rainfall events led to severe flooding in Western Europe during July of the past summer, resulting in severe impacts and massive losses, including over two hundred deaths. Extreme precipitation, breaking observed records, is expected to have an increased likelihood under global warming, all the more we should question and scrutinize our knowledge about the frequency and severity of floods. Reliable estimates of these, and a better quantification of their uncertainty are key information for improving our preparedness and developing adaption measures in the future.

For this purpose we explore the potential of running pooled weather reforecasts through the flexible hydrological model framework DECIPHeR (Coxon et al.2019) in Switzerland, modified to include snow, glaciers and the effect of lakes and reservoirs on the river network. For three case studies of different climatic regions (one including regulated lakes), we compare floods generated by the 10 largest precipitation events and precipitation events of low frequency (return period >= 100 years), both extracted from the pooled data, for three accumulation periods (1, 3, 5 days) with the official flood frequency curves and flood frequency curves generated with long continuous simulation using the pooled data (> 1000 years). This analysis will show us possible deficiencies of record-based flood frequency curves, if running selected precipitation events according to a return period already gives us a representative “flood sample”, and what is the gain of running long continuous simulations (e.g. are there overlooked events, summoning hydrological extremes through particular spatio-temporal patterns? What is the effect of different initial conditions?).

Coxon G., Freer J., Lane R., Dunne T., Knoben W.J.M., Howden N.J.K., Quinn N., Wagener T. and Woods R. : DECIPHeR v1: Dynamic fluxEs and ConnectIvity for Predictions of HydRology. Geosci Model Dev.,12,2285-2306, https://doi.org/10.5194/gmd-12-2285-2019, 2019.

How to cite: Kauzlaric, M., Martius, O., Simon, S., and Andreas Paul, Z.: Challenging our knowledge on flood frequency, EGU General Assembly 2023, Vienna, Austria, 23–28 Apr 2023, EGU23-13913, https://doi.org/10.5194/egusphere-egu23-13913, 2023.

EGU23-14153 | ECS | Orals | HS2.4.4

Exploring the asymmetric dependence in hydrologic extremes 

Cristina Deidda, Sebastian Engelke, and Carlo De Michele

The issue of dependence and causality is fundamental for the study of compound events. Dependence measures are largely exploited in literature to study the interconnections among hazards and drivers. Classical dependence measures are symmetric, dependence in one direction is considered equal as the dependence in the other direction. Nevertheless, there are many situations in which there can exists a directionality on dependence. Considering the extremes in river network case study, there exists a physical link between upstream and downstream river sites, and this must be reflected in their dependence relationships. Upstream influences downstream more that in the other direction. In this work, we want to explore the concept of asymmetric dependence considering the extremes and the possible existing link with causality effects. A conditional version of the Kendall’s tau has been proposed and investigated to give some information about the directionality of the dependence.

As case study we use the UK river network considering daily discharge data and a POT analysis approach. Exploring the issue of asymmetry in the statistical pairwise dependence, it could provide a new tool/perspective to address the joint statistical behaviour of dependent variables.


How to cite: Deidda, C., Engelke, S., and De Michele, C.: Exploring the asymmetric dependence in hydrologic extremes, EGU General Assembly 2023, Vienna, Austria, 23–28 Apr 2023, EGU23-14153, https://doi.org/10.5194/egusphere-egu23-14153, 2023.

Single extreme hydrometeorological events have been highly studied around the world, however, concerns related to the spatiotemporal variations have extended the studies to look for more insight into space and time dimensions. In this context, of increasing importance are the relations of extreme events properties over multiple spatial and temporal scales. Nevertheless, the study of these relations has not been widely developed. The interaction between events, like floods and droughts with different spatiotemporal characteristics, so far, has still yet to be further studied. Some studies show that there are complex relations linking between both extremes, since occurrences of both are observed in single catchment areas around the world. Furthermore, when analyzing time and space scales for concurrent or successive events, the complexity increase. Recent advances in the spatiotemporal analysis of droughts and floods include tracking approaches, data-driven probabilistic models and machine learning applications. Likewise, new studies have highlighted the usefulness of data mining techniques in extracting knowledge, identifying patterns and detecting anomalies from climate databases.

Therefore, the main objective of this research is to characterize and identify spatial and temporal patterns related to extreme hydrometeorological events generation and propagation using data mining techniques. The selected case study is the Magdalena River basin in Colombia. This basin produces most of Colombia’s Gross Domestic Production (GDP), which is highly dependent on the water resource. Because of this, extreme hydrological events such as floods or droughts have a large impact all over the basin.

ERA5-Land information (precipitation, temperature, surface pressure and wind U and V components) from 1980-2020 with a resolution of 0.1°x0.1° at multiple time scales (hourly and monthly) was collected for this study. This data was used to identify and characterize extreme hydrometeorological events for multiple time steps and indices thresholds. Temporal, spatial, climatic and geometrical properties of each extreme event region were calculated and stored in a hydrometeorological database. Unsupervised machine learning clustering algorithms (k-means, hierarchical clustering, DBSCAN and spectral) were applied on the database to cluster elements with similar property values. At last, a data mining association rules method (APRIORI) was applied to identify clear patterns between cluster elements of extreme hydrometeorological events. As a main result of this study, is expected an improved understanding of the extreme hydrometeorological events patterns and their associated hydro-climatic processes in the region. This knowledge can help to obtain more accurate and less uncertain estimations of extreme hydrological events, as these are major challenges of many water resources problems, such as monitoring and forecasting.

How to cite: Duarte, S., Corzo, G., and Solomatine, D.: Spatiotemporal Identification and Characterization of Extreme Hydrometeorological Events Patterns in the Magdalena River Basin, EGU General Assembly 2023, Vienna, Austria, 23–28 Apr 2023, EGU23-14230, https://doi.org/10.5194/egusphere-egu23-14230, 2023.

EGU23-15142 | Posters on site | HS2.4.4

Drought Propagation through the Water-Energy-Food-Ecosystem Nexus in a Future Climate – a Swedish Perspective 

Thomas Grabs, Elise Jonsson, Andrijana Todorovic, Faranak Tootoonchi, Elin Stenfors, and Claudia Teutschbein

Droughts develop slowly over time and can affect a multitude of public and private sectors. While droughts are traditionally quantified in relation to the hydrological components of the water cycle that they affect, this manuscript demonstrates a novel approach to assess future drought conditions through the lens of the water-energy-food-ecosystem (WEFE) nexus concept. To this end, a set of standardized drought indices specifically designed to represent different nexus sectors across 50 catchments in Sweden was computed based on an ensemble of past and future climate model simulations. Different patterns in the response of the four nexus sectors water, energy, food and ecosystem services to future climate change emerged, with different response times and drought durations across the sectors. These results offer new insights into the propagation of drought through the WEFE nexus in cold climates. They further suggest that future drought projections can be better geared towards decision makers by basing them on standardized drought indices that were specifically tailored to represent particular nexus sectors.

How to cite: Grabs, T., Jonsson, E., Todorovic, A., Tootoonchi, F., Stenfors, E., and Teutschbein, C.: Drought Propagation through the Water-Energy-Food-Ecosystem Nexus in a Future Climate – a Swedish Perspective, EGU General Assembly 2023, Vienna, Austria, 23–28 Apr 2023, EGU23-15142, https://doi.org/10.5194/egusphere-egu23-15142, 2023.

EGU23-15606 | ECS | Orals | HS2.4.4

National Hydrological Modelling of Climate Adaptation Impacts for the UK 

Ben Smith, Elizabeth Lewis, and Stephen Birkinshaw

Climate Change is likely to have a significant effect on river flows and associated floods and droughts in the coming decades. As such, it is key to understand the nature and severity of these changes and the potential costs and benefits of potential impact mitigation strategies at both a catchment and national scale. We have developed and demonstrated a methodology for national scale modelling of river flows under twelve climate forcing scenarios and have evaluated the impacts of potential adaptation strategies with regards to river flow.

This work forms part of the OpenCLIM project, which aims to create a scalable framework that enables users to integrate models and datasets from across a range of sectors (such as urban development, hydrology, and heat risk). This integrated, cross-sectoral approach is necessary to capture the complexities of climate response and will enable users to explore the potential impacts of climate change and adaptation strategies.

A spatially distributed, physically based hydrological model (SHETRAN-UK) has been setup for 701 catchments across Great Britain and Northern Ireland. Both uncalibrated and auto-calibrated simulations were run for historical periods and future climate scenarios (using UKCP18 regional climate projections). Strong model performance across the country allowed for analysis of the effect of climate change and storylined urban development on future river flows and the impact of potential adaptation strategies, specifically relating to floods and droughts.

Results from an urban development model were used to represent potential change in urban areas while natural flood management strategies were implemented by increasing woodland cover and storage in the model. Flows from the models were then fed into models for estimating economic flood damages.

This talk will discuss the methods and findings from the project, comparing them to other studies and will discuss the relevance of continued investigations into modelling climate/adaptation impacts as well as the lessons learnt regarding autocalibration and the high-performance computing approach (DAFNI & JASMINE).

How to cite: Smith, B., Lewis, E., and Birkinshaw, S.: National Hydrological Modelling of Climate Adaptation Impacts for the UK, EGU General Assembly 2023, Vienna, Austria, 23–28 Apr 2023, EGU23-15606, https://doi.org/10.5194/egusphere-egu23-15606, 2023.

An intensified hydrological cycle with global warming is expected to increase the intensity and frequency of extreme precipitation events. However, whether and to what extent the enhanced extreme precipitation translates into changes in river floods remains controversial. Here, we demonstrate that previously reported unapparent or even negative responses of river flood discharge (defined as annual maximum discharge) to extreme precipitation increases are largely caused by mixing the signal of floods with different generating mechanisms. Stratifying by flood types, we show a positive response of rainstorm-induced floods to extreme precipitation increases. However, this response is almost entirely offset by the concurrent decreases in snow-related floods, leading to an overall unapparent change in total global floods in both historical observations and future climate projections. Our findings highlight an increasing rainstorm-induced flood risk under warming and the importance of distinguishing flood-generating mechanisms in assessing flood changes and associated social-economic and environmental risks.

How to cite: Zhang, S.: Reconciling disagreement on global river flood changes in a warming climate, EGU General Assembly 2023, Vienna, Austria, 23–28 Apr 2023, EGU23-15900, https://doi.org/10.5194/egusphere-egu23-15900, 2023.

EGU23-16124 | Orals | HS2.4.4

The role of rivers and lakes in damping flow variability introduced by hydropower 

Maria Elenius and Göran Lindström

Hydropower regulations may significantly increase the variability of flow at especially short time scales when compared with the natural hydrological regime to which river ecosystems have evolved over long time periods. This can be detrimental for river habitats and for many organisms. Attenuation of the variability in rivers and lakes improves ecological status at some distance downstream of the introduced variability. Being able to accurately estimate this distance is critical for the evaluation of ecological status. The attenuation of introduced flow variability has only been studied previously for specific rivers and lakes, and the dominant mechanisms have not been analyzed in detail. In this work, the attenuation rate and its important drivers is studied for lakes and regulated rivers in all of Sweden by comparing the results of hydrological and hydrodynamic models with observations. We performed Fourier transformation of flow time series obtained with a) the Hydrological Predictions for the Environment (HYPE) model, b) an extracted model representing only river processes, c) the diffusion wave equation, and d) from observed flow at several hundred stations. The reduction of the amplitudes along rivers and in lakes was then analysed. This damping in rivers and lakes was further compared.

In many regulated rivers in Sweden, flow variability of periodicity 7 days is dominant among periods varying from a couple of days up to one month. The analysis further shows that variability with periodicity days to months typically attenuate with an exponential rate that is largest for short periods. Attenuation of these periods in rivers is mainly driven by processes within rivers, as opposed to catchment features such as the distribution of rain or soil properties. Further, rivers in regulated systems often resemble cascades with long stretches of rivers with low gradients in elevation between the dams. The associated attenuation in these “lake-alike” rivers can be well described by hydrological simulations with HYPE using a simple linear attenuation box. In contrast, the sometimes-used diffusion wave equation is often unable to replicate the observed attenuation here. Lakes have larger attenuation potential than rivers, especially at low flows.

Our work supports the assessment of ecological status and management decisions by improving the estimates of distances required for attenuation, and provides important insights on attenuation processes.

Elenius, M.T. and G. Lindström (2022) Introduced flow variability and its propagation downstream of hydropower stations in Sweden. Hydrology Research 53(11), 1321-1339. doi: 10.2166/nh.2022.138

How to cite: Elenius, M. and Lindström, G.: The role of rivers and lakes in damping flow variability introduced by hydropower, EGU General Assembly 2023, Vienna, Austria, 23–28 Apr 2023, EGU23-16124, https://doi.org/10.5194/egusphere-egu23-16124, 2023.

EGU23-16215 | ECS | Posters on site | HS2.4.4

Sample Uncertainty Analysis of Daily Flood Quantiles Using a Weather Generator 

Gloria Vignes, Carles Beneyto, José Ángel Aranda, and Félix Francés

Due to its potential, Synthetic Continuous Simulation (SCS) (i.e. the use of Weather Generators (WGs) coupled with Hydrological Models (HMs)) is gaining interest among the hydrological community in order to extend the available hydrometeorological records. The limitations of this approach stem from the paucity of available observations that allow obtaining the characteristics of extreme storms. This situation makes WGs struggle to obtain reliable low-frequency quantile estimates, generating uncertainties that in turn are transferred to flood discharges. The present study aims to quantify the sample uncertainty of high flood quantile estimates generated by SCS for different: (1) degrees of precipitation extremality; (2) climates; and (3) catchment hydromorphologies. Results will be compared with uncertainty of the higher flood quantile quantified as a function of a selected realistic period of the simulated flow generated by the HM.

A synthetic one-rain gauge case study was implemented in a medium-size basin (180 km2). The WG used for the experiment was GWEX, which includes the three-parameter (σ, κ, and ξ) cumulative distribution function E-GPD to model precipitation amounts, being the shape parameter ξ the one directly governing the upper tail of the distribution function. The fully-distributed HM TETIS was used to derive discharges. 

The methodology consists of a Monte Carlo simulation with packages of 50 x 60-year rainfall samples, estimating the parameters with GWEX for each and calculating the simulated flood quantiles. The considered information scenarios were studied by incorporating a Regional Study of Annual Maximum Daily Precipitation (RSAMDP) in the WG calibration process, ascertaining in a preliminary study that it yields better results. The analysis of three degree of extremality (1) was performed on both base populations, semi-arid and humid (2) and by introducing two different hydromorphologies (3). The Relative Root Mean Square Error (RRMSE), Relative Bias (RB) and the Coefficient of Variation (CV) were calculated and analysed for each package. To define the reliability of the results obtained, a sufficiently long synthetic series was selected from a realistic set of consecutive data (75-100 years) but with a random starting year. Repeating this process enough times for each of them, and fitting a distribution function, flood quantile estimates will be obtained and uncertainty will be compared with that obtained through the first methodology. 

Results show an important reduction on both RRMSE and CV of flood quantile estimates in less extreme climates, confirming that the higher the precipitation extremality, the higher the uncertainty of the estimated flood discharges, especially those associated with high return periods. These flood estimates presented much less uncertainty in a humid precipitation regime than in a semiarid climate, which remarks the importance to focus the studies on the latter. Lastly, permanent flow regimes presented lower values of both metrics, especially in terms of CV, than in the case of ephemeral conditions, but not significantly.

How to cite: Vignes, G., Beneyto, C., Aranda, J. Á., and Francés, F.: Sample Uncertainty Analysis of Daily Flood Quantiles Using a Weather Generator, EGU General Assembly 2023, Vienna, Austria, 23–28 Apr 2023, EGU23-16215, https://doi.org/10.5194/egusphere-egu23-16215, 2023.

EGU23-16486 | ECS | Orals | HS2.4.4

Participatory groundwater modelling to build resilience to hydrological extremes in the Limpopo River Basin: Potential and challenges 

Syed M. T. Mustafa, Fulvio Franchi, Alessia Matano, Anne Van Loon, Sithabile Tirivarombo, Oluwaseun Franklin Olabode, and Jean-Christophe Comte

The Limpopo River Basin (LRB) is highly vulnerable to floods and droughts, and these recurrent extreme events seriously threaten the basin's water and food security. Implementing sustainable water management practices is essential to improving resilience to future flood and drought hazards. Identification of such sustainable practices can be done through evaluating alternative management scenarios. It is increasingly recognized that scenario analysis and management strategy identification requires collaboration between scientists and a broad range of stakeholders from local to (trans-) national scales. In this study, we demonstrate and evaluate a real-world application of a basin-scale hydrological model as a decision-support tool based on a multi-sector collaborative modelling approach to co-create management strategies and identify appropriate, inclusive water governance strategies to improve resilience to hydrological extremes in the LRB. To achieve the objectives, an integrated hydro(geo)logical model (WetSpass-MODFLOW) was set up using existing (i) hydro(geo)logical and climatic information and (ii) expert and local community knowledge collected through stakeholders' workshops. After successfully evaluating the model simulation capacity using the groundwater observation datasets, the model was used for evaluating the following management scenarios identified during the stakeholders workshops with inputs from local, national and transboundary governance actors: (1) increase groundwater abstraction; (2) deforestation; (3) afforestation; and (4) managed aquifer recharge (MAR), using (4a) injection well, (4b) rainwater harvesting (local ponds), and (4c) small water reservoirs (e.g. local ponds and sand dams). Though evaluating different identified management scenarios and stakeholder feedback, our results suggest that the most effective strategy is local rainwater harvesting and storage through small-scale (household to village) water reservoirs/ponds or well recharge. It reduces the risk and impact of floods as it can capture and store the excess water during flood into the groundwater aquifer and if upscaled over the entire LRB, can significantly increase the groundwater level across the basin. Additionally, this excess water can be an essential source of water during a drought. The results also show that the multi-sector collaborative modelling approach is effective to co-create management strategies and identify the appropriate and inclusive strategy to improve resilience to hydrological extremes even in data-limiting conditions, provided that the effective stakeholder’s involvement is ensured throughout the modelling study. Finally, the proposed modelling outcomes are helpful in making informed decisions regarding appropriate water management and transboundary cooperation in the LRB. 

How to cite: Mustafa, S. M. T., Franchi, F., Matano, A., Loon, A. V., Tirivarombo, S., Olabode, O. F., and Comte, J.-C.: Participatory groundwater modelling to build resilience to hydrological extremes in the Limpopo River Basin: Potential and challenges, EGU General Assembly 2023, Vienna, Austria, 23–28 Apr 2023, EGU23-16486, https://doi.org/10.5194/egusphere-egu23-16486, 2023.

EGU23-16561 | Posters virtual | HS2.4.4

Classification of atmospheric drought on the basis of the thermohygrometric coefficient of air dryness 

Bakhtiyar Kholmatjanov, Isroiljon Makhmudov, and Sardor Begmatov

According to the sources of the World Meteorological Organization, more than twenty meteorological drought indices are currently used in practice. However, these indexes have a number of disadvantages: i) they are based either on the ratio of long-term precipitation (year, season, month) to evaporation, or vice versa, ii) some of them (for example, SPI) lose their physical meaning in the absence of precipitation during certain months, seasons and the year as a whole, iii) there are large errors in the calculation of indicators that include total evaporation, iv) they do not allow to estimate drought over short time intervals (days, decades), which is important for solving many applied problems.

Given the above circumstances, in this study we propose and justify the use of a new classification of atmospheric drought (AD) based on the thermohygrometric coefficient (THC, ‰): K=(T-τ)/T, where Т – τ = Δ – dew point temperature deficit, Т – air temperature in Kelvin. THC was calculated for the daytime period, when the values of air temperature and vapor pressure (VP) reached maximum. An analysis of the relationship between air temperature, VP and THC values for various gradations of AD intensity was performed on the basis of data between 1961 and 2008 for six meteorological stations in Uzbekistan with different physical-geographical conditions. Oppressing effect of air temperature and humidity on various crops was considered, when identifying the criterion of THC for weak, moderate, strong and very strong AD.

With a weak AD, THC lies in the range of 76-90‰, with a moderate one - 91-105‰, with a strong one - 106-120‰, with a very strong one - more than 120‰. The relationship between air temperature and VP for various AD gradations, regardless of the physical-geographical region, shows that the AD intensity for all gradations lies within the temperature range of 25-47°C, while the VP varies significantly for the same gradations. Weak and moderate AD can occur at an air temperature of about 25°C with a VP in the range of 5.3-7.5 hPa and a humidity deficit of 24-26 hPa. At a temperature of 30°C and above, AD of any intensity can be observed. Very strong AD occurs at a very low air moisture content (at 30°C, the VP is below 3.8 hPa, at 35°C it is below 5.3 hPa, and at 40°C it is below 7.5 hPa). In this case, humidity deficit is above 42 hPa, 53 hPa and 67 hPa, respectively.

Based on the data obtained, a nomogram was constructed to determine various gradations of AD intensity. Its peculiarity is that the calculation of THC values is no longer required to determine the AD intensity gradation. The AD intensity is determined by simply finding the point of intersection of the air temperature value and the value of the VP corresponding to a given moment in time.

This classification of AD makes it possible to create a ground-based monitoring system for air aridity, as well as its forecasting. The usage of this method eventually is going to lead to a rational management of water resources.

How to cite: Kholmatjanov, B., Makhmudov, I., and Begmatov, S.: Classification of atmospheric drought on the basis of the thermohygrometric coefficient of air dryness, EGU General Assembly 2023, Vienna, Austria, 23–28 Apr 2023, EGU23-16561, https://doi.org/10.5194/egusphere-egu23-16561, 2023.

EGU23-17027 | Posters on site | HS2.4.4

Drought atlas of India, 1901-2022 

Vimal Mishra

India has been considerably affected by droughts during 1901-2022. Droughts mainly occur during the summer monsoon season due to a lack of rainfall. Meteorological droughts triggered during the monsoon season propagate to hydrological and agricultural droughts. Despite the considerable impacts of droughts on agriculture and water resources, datasets to examine droughts and their consequences have been limited. Considering the need for climate change adaptation, it is essential to understand the observed droughts and their impacts. In addition, mapping of drought risk is needed to focus on the regions that need immediate attention. We use long-term observations of precipitation and temperature to reconstruct meteorological drought. We used a hydrological model to simulate runoff and soil moisture to examine hydrological and agricultural droughts. We developed a drought atlas that can provide comprehensive information on drought occurrence, impacts, and risks in India, which can be used for policy and decision-making.

How to cite: Mishra, V.: Drought atlas of India, 1901-2022, EGU General Assembly 2023, Vienna, Austria, 23–28 Apr 2023, EGU23-17027, https://doi.org/10.5194/egusphere-egu23-17027, 2023.

EGU23-17185 | ECS | Orals | HS2.4.4

Climate change impacts on IDF curves, urban flooding, and river discharge in Quito,Ecuador 

Santiago Nuñez Mejia, Santiago Mendoza Paz, Hossein Tabari, Melany Singaña-Chasi, Diego Paredes, and Patrick Willems

Quito, the capital of Ecuador, is an Andean city experiencing two water challenges: urban flooding driven by extreme precipitation events and water scarcity in the dry season. Climate change is expected to increase the probability of the occurrence of flash floods, sewer overflows, and landslides because of more intense precipitation. It might moreover reduce the river discharge in the dry season due to an increase in temperature and evapotranspiration. The previous studies in the region have used a limited number of climate models and have not focused on short-duration events, presenting biased impacts of climate change. 
To address this knowledge gap, this research employs an ensemble of 19 state-of-the-art CMIP6 general circulation models (GCMs) to analyze climate change impacts on intensity- duration-frequency (IDF) curves, urban flooding, and river discharge in Quito under four plausible future scenarios (SSP1-2.6, SSP2-4.5, SSP3-7.0, and SSP5-8.5). Daily precipitation and temperature simulations are spatially downscaled with the delta change and quantile perturbation approaches. Temporal downscaling is then applied to obtain sub-daily precipitation time series and statistics in the form of IDF curves. The uncertainty contribution of the extreme value analysis is considered by including five statistical distributions for IDF estimations. Furthermore, composite design storms are built based on historical hyetographs recorded in the city and then applied to a calibrated hydraulic model (SWMM) for a part of Quito´s combined sewer system. Climate change impacts on the urban area are expressed as changes in the IDF curves and the flood volume. 
To analyze climate change impacts on river discharge, three conceptual hydrological models (NAM, GR4J, and VHM) are calibrated in one of the water-supplying catchments of the city, the San Pedro River. Here, the impacts are expressed as changes in the peak, mean, and low river discharges. The uncertainty contribution of the different components (climate models, emissions scenarios, hydrological models, and extreme value distributions) is quantified by a variance decomposition method. 
The findings suggest an increase in the intensity of short-duration extreme precipitation events by 10-30% for the near future (2021-2050) and by 20-50% for the far future (2070- 2099). As a result of this intensification, the flood volume in the sewer network of Quito magnifies at critical points. Moreover, in the San Pedro River, the peak discharges are projected to increase by 5-20% and 10-50% in the near and far future, respectively. In contrast, the low discharges in the dry season are projected to decrease up to 13-30% as fewer wet days are expected. The uncertainty analysis reveals that climate models dominate the total projection uncertainty, although the contribution of hydrological models and extreme value distributions is not negligible. The results of this research contribute to the planning of climate change adaptation strategies and actions to reduce future risks.

How to cite: Nuñez Mejia, S., Mendoza Paz, S., Tabari, H., Singaña-Chasi, M., Paredes, D., and Willems, P.: Climate change impacts on IDF curves, urban flooding, and river discharge in Quito,Ecuador, EGU General Assembly 2023, Vienna, Austria, 23–28 Apr 2023, EGU23-17185, https://doi.org/10.5194/egusphere-egu23-17185, 2023.

Due to the climate change-related increase in extreme weather events and scenarios such as the flood disaster in Western and Central Europe in July 2021, an increased research effort is necessary in order to better predict the dynamics of such events and consequently create preventive measures. Due to a lack of water retention capacity and insufficient drainage structures, the vulnerability is high in and around of settlements where infrastructures are not sufficiently adapted for extreme precipitation. Since not only the sealed surfaces in urban areas contribute to the development of runoff processes, but the entire catchment area, the process dynamics of the outer areas of settlements must also be increasingly researched.

This study is part of the collaborative project “Urban Flood Resilience - Smart Tools (FloReST)”, which is funded by the German Federal Ministry of Education and Research and is dedicated to the exploration of measures to determine and increase the resilience of existing infrastructures.

Our scope is to analyze the effect of different flood prevention measures on an existing drainage infrastructure in the municipality of Filsch (Trier), which in the past could not fulfill the purpose of drainage and thus flood damage occurred frequently.

The connected runoff generating area is mainly used for agriculture. Despite an adapted cultivation method with the no tillage method and a 5-stage crop rotation that ensures a soil cover over the whole year several flooding events occurred due to surface runoff generation. Local farmers have reported that this slope does not always generate surface runoff throughout the year for similar heavy rainfall events. Hence, we hypothesize that not only the precipitation event, but also seasonal effects have an influence on runoff generation under heavy rainfalls. To quantify runoff generation and the causes of its occurrence, the study site will be analysed using the slope specific, physical, deterministic, hydrological model CATFLOW. Heavy rainfall simulations will be used to study the impact of current land use, alternative cultivation methods and decentralized water retention measures in order to understand potential water retention in the area. The simulation model will be calibrated using field studies such as soil sampling and irrigation tests on the study site and in addition on test fields with integrated water retention measures. Water retention measures also have the advantage of providing increased soil moisture during dry periods, thus enhancing agricultural land quality.

How to cite: Jackel, M. and Schuetz, T.: Hydrologic modelling of seasonal runoff generation during heavy rainfall: Effect of decentralized water retention measures at a flood-prone site in Trier (Germany) – A study concept, EGU General Assembly 2023, Vienna, Austria, 23–28 Apr 2023, EGU23-677, https://doi.org/10.5194/egusphere-egu23-677, 2023.

EGU23-1180 | Orals | HS2.4.6

Climate impact storylines for assessing socio-economic responses to remote events 

Bart Van Den Hurk and the RECEIPT project team

Complex interactions involving climatic features, socio-economic vulnerability or responses, and long impact transmissions are associated with substantial uncertainty. Physical climate storylines are proposed as approach to explore complex impact transmission pathways and possible alternative unfolding of event cascades under future climate conditions. These storylines are particularly useful for climate risk assessment for complex domains, including event cascades crossing multiple disciplinary or geographical borders. For an effective role in climate risks assessments, practical guidelines are needed to consistently develop and interpret the storyline event analyses.

This presentation elaborates on the suitability of physical climate storyline approaches involving climate event induced shocks propagating into societal impacts. It proposes a set of common elements to construct the event storylines. In addition, criteria for their application for climate risk assessment are given, referring to the need for storylines to be physically plausible, relevant for the specific context, and risk-informative.

A number of examples of varying scope and complexity are presented, all involving the potential climate change impact on European socio-economic sectors induced by remote climate change features occurring far outside the geographical domain of the European mainland. The storyline examples illustrate the application of the proposed storyline components. It thereby contributes to the standardization of the design and application of event-based climate storyline approaches.

How to cite: Van Den Hurk, B. and the RECEIPT project team: Climate impact storylines for assessing socio-economic responses to remote events, EGU General Assembly 2023, Vienna, Austria, 23–28 Apr 2023, EGU23-1180, https://doi.org/10.5194/egusphere-egu23-1180, 2023.

EGU23-1621 | ECS | Posters on site | HS2.4.6

Robustness experiments on simulated extreme floods over Switzerland 

Eleni Kritidou, Martina Kauzlaric, Marc Vis, Maria Staudinger, Jan Seibert, and Daniel Viviroli

Globally, floods are the most frequent natural hazard. Reliable estimates of flood characteristics are key in measures that reduce or even prevent damage. Traditionally, floods and their impacts have been studied through statistical techniques based on historical observations. Due to the relatively short available streamflow records, extrapolation techniques based on the observed hydrographs are usually implemented. Furthermore, assumptions about antecedent conditions of an event (e.g., soil moisture, snowpack, storage levels of lakes and reservoirs) and their spatiotemporal variability are made. However, these methods incorporate several limitations related to the estimation of floods, especially when the focus is on very rare flood events.

Here, we explore the robustness of an elaborate framework based on continuous simulations with a hydrometeorological modeling chain (Viviroli et al., 2022). The modeling chain starts with a multi-site stochastic weather generator, focusing on the generation of extremely high precipitation events. Then, the bucket-type hydrological model HBV (Hydrologiska Byråns Vattenbalansavdelning) is used to simulate discharge time series. Finally, the RS Minerve model is employed to implement simplified representations of river channel hydraulics, floodplain inundations and lake dynamics. To explore the robustness of simulation results and derived flood estimates, we selected the potentially most sensitive elements of the weather generator and the hydrological model and varied them across a palusible range. For the weather generator, the chosen elements include different precipitation lapse rates between 0-10%, a parameterization dependent on 4 different weather types, and 10 different parameterizations of the Extended Generalized Pareto Distribution, describing the precipitation intensities. For the hydrological model, firstly, another model structure will be tested. Then, the model’s precipitation lapse rates, distributing the mean catchment precipitation input from the weather generator to the different elevation zones, will be varied within 0–10%. Considering a set of small (a few 10 km²) to large (a few 1’000 km²) study catchments in Switzerland, we evaluate the impact of each of these changes on the simulated extreme floods and thus assess the robustness of the approach.

The robustness experiments will shed light on the applicability and feasibility of the hydrometeorological modeling chain for estimating very rare floods and help point out this approach's benefits and limitations. These findings are also expected to identify sensitive modeling decisions that should be treated carefully or for which further research would be highly beneficial. They should also provide a clearer picture of uncertainties important for hazard assessment, safety analyses and hydraulic engineering projects.


References

Viviroli D, Sikorska-Senoner AE, Evin G, Staudinger M, Kauzlaric M, Chardon J, Favre AC, Hingray B, Nicolet G, Raynaud D, Seibert J, Weingartner R, Whealton C, 2022. Comprehensive space-time hydrometeorological simulations for estimating very rare floods at multiple sites in a large river basin. Natural Hazards and Earth System Sciences, 22(9), 2891–2920, doi:10.5194/nhess-22-2891-2022

How to cite: Kritidou, E., Kauzlaric, M., Vis, M., Staudinger, M., Seibert, J., and Viviroli, D.: Robustness experiments on simulated extreme floods over Switzerland, EGU General Assembly 2023, Vienna, Austria, 23–28 Apr 2023, EGU23-1621, https://doi.org/10.5194/egusphere-egu23-1621, 2023.

EGU23-2281 | ECS | Orals | HS2.4.6

Why should structural solutions for flood control be adapted to climate change? 

Mahdi Hosseinipoor, Armin Mollaei Rudsary, Yasna Yeganeh, Zahra Kazempour, and Mohammad Danesh-Yazdi

The combined impacts of climate change and anthropogenic activities have altered runoff generation and flood regime in many regions, worldwide.  While hydraulic structures have been successfully operated to control flood for decades, their expected performance may be currently less certain under the augmented frequency of extreme precipitation events. The goal of this study was to examine the above hypothesis by utilizing both remote sensing and field data on the Imamzadeh Davood catchment in the northern Iran, which experienced a devastating flash flood in the summer of 2022. To this end, we surveyed the main river path to collect data on river morphology, structural characteristics of check dams, and sedimentation patterns. We also processed satellite imagery to extract and temporally trace back land-use land-cover change in the study area. Finally, we used recorded data from synoptic stations to explore the distinct role of extreme precipitation in intensifying the flood hazard. The results proved the occurrence of unprecedented precipitation with a return period of over 100 years, supporting the climate change effect in the region. In-situ observations revealed that all 18 check dams were destroyed between 20% and 100% during the flood event, while higher degree of destruction was observed towards upstream. The sliding and overturning stability analysis demonstrated that all check dams were stable with respect to sliding, while 30% of them were prone to overturning. Given the destruction of all check dams during the flood event, as well as the observed high deposition depth of sediment in the river corridor, we concluded that the shock imposed by the debris flow was responsible for the cascade failure of check dams from upstream to downstream. The findings of this study highlight the need for revisiting the design principles of hydraulic structures, such that they are adapted to the ongoing impacts of climate change in order to increase the resiliency of flood control systems.

How to cite: Hosseinipoor, M., Mollaei Rudsary, A., Yeganeh, Y., Kazempour, Z., and Danesh-Yazdi, M.: Why should structural solutions for flood control be adapted to climate change?, EGU General Assembly 2023, Vienna, Austria, 23–28 Apr 2023, EGU23-2281, https://doi.org/10.5194/egusphere-egu23-2281, 2023.

The Chalk is considered an important aquifer in the Southeast of the UK as it supports flows in ecologically sensitive Chalk streams, as well as significant groundwater abstractions for public water supply purposes. Based on the Water Framework Directive (EU directive) objectives, all rivers need to be in good ecological status or support good ecological potential by 2027. The environmental regulatory body (Environment Agency) have designated the area located Northwest of London as over-licensed and over-abstracted in terms of groundwater availability from the Chalk aquifer. As a result of this, a long-term management strategy has been proposed, allowing for significant groundwater abstraction reductions for implementation between now and 2050.

Whilst under a range of river flow conditions, the proposed abstraction reductions are expected to allow greater baseflow to enter the rivers, it is possible that under higher flow conditions there will be an elevated risk of flooding, especially in downstream locations. An alternative approach is presented in this case study near London, aiming to utilise the well-established river-aquifer interactions during a range of hydrological conditions to balance the effects of winter floods and low flows during droughts.

The proposal for this case study is in an unconfined Chalk aquifer setting, supporting a number of groundwater abstractions, as well as providing baseflow to a river which is also supported by an effluent discharge. A nearby surface water reservoir located on top of clay deposits, is also available but currently unused for public water supply. Groundwater abstractions in the area are known to be supported by river flows during drought conditions, via a leaky river bed. Based on river bed leakage assessments undertaken under different hydrological conditions, it was found that a certain proportion of the total river flow can recharge the unconfined chalk aquifer via the leaky river bed in a 2-3 km stretch of river.

Therefore, the idea of capturing high river flows above a certain trigger at a downstream location through the urban areas where the river is in a concrete channel and refilling the currently disused reservoir storage, has been explored. Instead of then having to treat this water as surface water before using it for public water supply, by releasing this water back into the river at the head of the catchment during times of low flows it could support both river flows and also the output of the groundwater sources via artificial leakage. This unconventional type of Managed Aquifer Recharge has been tested under various hydrological conditions and could also prove a cost-effective scheme due to the lack of additional treatment needed for the surface-derived water.

This study demonstrates that enhanced understanding of the natural processes in a river catchment can provide alternative ways of managing the effects arising from both flood and drought events, whilst creating a resilient water supply in a changing climate.

How to cite: Karapanos, I. and Powers, E.: Innovative approaches to water resources management during flood and drought periods using semi-natural processes, EGU General Assembly 2023, Vienna, Austria, 23–28 Apr 2023, EGU23-2677, https://doi.org/10.5194/egusphere-egu23-2677, 2023.

EGU23-3276 | ECS | Posters virtual | HS2.4.6

A large-scale flood modeling using geometry-adaptive physics-informed neural solver and Earth observation data 

Qingsong Xu, Yilei Shi, Jonathan Bamber, Chaojun Ouyang, and Xiao Xiang Zhu

Large-scale hydrodynamic models generally rely on fixed-resolution spatial grids and model parameters as well as incurring a high computational cost. This limits their ability to accurately forecast flood crests and issue time-critical hazard warnings. In this work, we build a fast, stable, accurate, resolution-invariant, and geometry-adaptative flood modeling and forecasting framework that can perform at scales from continental to global. We achieve this by combining continuous flow modeling of a geometry-adaptive physics-informed neural solver (GeoPINS) with the authenticity of Earth observation data. Specifically, the GeoPINS is proposed based on the advantages of no training data in physics-informed neural networks (PINNs), as well as possessing a fast, accurate, and resolution-invariant architecture through the implementation of Fourier neural operators (FNO). In particular, to adapt to complex and irregular geometries that exist in rivers, we reformulate PINNs in a geometry-adaptive space by taking full advantage of coordinate transformations and the efficiency of numerical methods in solving the spatial gradient. We validate our GeoPINS on popular partial differential equations on both regular and irregular domains, demonstrating fast, stable, and accurate performance, as well as resolution-invariant, geometry-adaptive properties. Next, due to a lack of large-scale ground truth data, time-series flood records are generated using freely available Sentinel-1 data and a SAR-based flood mapping algorithm. These flood records are used as boundary conditions and flood inundation extent verification of the proposed hydrodynamic model. Finally, we compare our GeoPINS results with a 30 m resolution, SAR-based flood record, and measured discharge from gauging stations, obtaining good agreement among the three. The experimental results for the Pakistan flood in 2022 indicate that the proposed method can maintain high-precision large-scale flood dynamics solutions at different resolutions and flood hazards can be forecast in real-time with the aid of reliable precipitation data.

How to cite: Xu, Q., Shi, Y., Bamber, J., Ouyang, C., and Zhu, X. X.: A large-scale flood modeling using geometry-adaptive physics-informed neural solver and Earth observation data, EGU General Assembly 2023, Vienna, Austria, 23–28 Apr 2023, EGU23-3276, https://doi.org/10.5194/egusphere-egu23-3276, 2023.

EGU23-4401 | ECS | Orals | HS2.4.6

Underlying farmers' storylines and behaviour on climate change to reinforce risk assessment in northern Italy 

Lisa Ferrari, Sandra Ricart, Claudio Gandolfi, and Andrea Castelletti

Agriculture is one of the most vulnerable sectors to changes in climate patterns. Moreover, climate change is a complex and interdisciplinary problem, where natural processes are closely intertwined with socio-economic aspects, especially in areas where human activities are widespread. Thus, when planning for natural resources management, it becomes essential to consider how storylines, attitudes and behaviours can influence the decision-making towards adaptation measures. In particular, when considering an agricultural system, farmers are key agents that cannot be neglected, as the decision to adapt or to change their agricultural practice is ultimately in the hands of the individuals. Understanding the reasoning behind farmer adaptation can help create a sounder framework to recognize farmers’ awareness and experiences regarding climate change, while reinforcing their resilience to face climate change scenarios. Consequently, finding patterns in attitudes and similarities between farmers is essential both to better share an overall picture of climate change effects and perspectives in a specific study area and to summarize the complex set of factors influencing farmers’ behaviours to facilitate their modelling.

Different tools and methods have been provided by the literature in the last two decades to delve into farmers’ attitudes and perspectives regarding climate change. One of the most used tools are structured surveys, mainly due to their strongly case-specific nature and the capacity to synthesize climate change scenarios in a standardized way. Here, we provide an overview of the results obtained through a survey of 460 farmers from northern Italy about climate change risk awareness, perceived impacts, and adaptive capacity. In addition to a descriptive statistical analysis to delve into farmers’ profiles and farming characteristics, this triple-loop approach was analysed through Multiple Correspondence Analysis (MCA), an interesting data analysis technique that allows to highlight underlying structures in categorical data used to recap farmers’ behaviours and define the association between dependent and independent variables. The resulting factor map allows for the identification of those variables that most explain the variance in the dataset and expected similarities and differences between respondents. The obtained results show how certain variables describing the agricultural practice of the respondents, such as farm extension or the preferred irrigation method, are key driving factors in differentiating and grouping individuals’ behaviour. In general, farmers with the same modus operandi share similar behaviour with respect to other aspects of their activity (e.g., water source). Interestingly, and contradicting similar experiences from the literature, this pattern differs among farmers with comparable demographic background, requiring more attention to farmers’ heuristics. These results can be useful in multiple ways: from creating an informative picture of farmers’ attitudes and concerns regarding climate change in a certain area, to its application in profiling farmers to identify common demands and shared worries; from helping with the creation of customized policies at the regional scale from a bottom-up approach, to the implementation of farmers’ profiles into Agent-Based Models to reinforce the human dimension in decision-making processes.

How to cite: Ferrari, L., Ricart, S., Gandolfi, C., and Castelletti, A.: Underlying farmers' storylines and behaviour on climate change to reinforce risk assessment in northern Italy, EGU General Assembly 2023, Vienna, Austria, 23–28 Apr 2023, EGU23-4401, https://doi.org/10.5194/egusphere-egu23-4401, 2023.

EGU23-5007 | ECS | Posters on site | HS2.4.6

Conceptual approach for a holistic low-flow risk analysis 

Udo Satzinger and Daniel Bachmann

The recent drought events (e.g. 2022) highlighted the impacts caused by hydrological drought and low-flow events to society and ecosystems. The consequences of low-flow events in recent years emphasizes the urgent need for a structured low-flow risk management. The DryRivers project aims to develop a software-based tool for an effective support of low-flow risk management. The low-flow risk analysis is the core of the supporting tool and will be described in detail in this work.

In the field of flood risk applications, scenario-based calculations are often performed. Due to a relative short duration of flood events between a few days to a few weeks and in general negligible hydrological interaction between temporal distant flood events, a clear distinction of such events is quite simple. However, for low-flow risk modelling, the definition of scenarios is considerably more complex due to their long-term development and occurrence. Thus, hydrological conditions from previous years can be essential for the development of a low-flow event. Due to this, the use of long-term continuous time series seems to be more suitable for low-flow risk modelling than a scenario-based approach. This continuous approach has been used in flood risk analysis by Sairam et. al. (2021). In this work it is adapted and extended for low-flow risk analysis.

The approach to low-flow risk analysis consists of four basic analyses. These include the meteorological-hydrological analysis, which generates synthetic long-term weather data - using, e.g., a stochastic weather generator - and transforms these weather data into long-term runoff time series. Therefore, a rainfall-runoff model is applied, considering the catchment-specific characteristics. The hydrodynamic analysis quantifies water levels, water temperatures and flow velocities along the river. Core of the analysis is a numerical 1D-river model, which calculates the hydraulic values using runoff time series and river characteristics (e.g., cross sections). The influence of the near-surface groundwater on the river by in-/exfiltration is considered via a bidirectionally coupled 2D-groundwater model. Water temperature is determined in a unidirectionally coupled temperature model. Weather data and hydraulic values are transformed into water temperature within the river. Based on the time series of the hydraulic values the consequences of low-flow are quantified as sum over the considered period within the analysis of consequences. Different categories of low-flow consequences are considered: socioeconomic consequences, e.g., for shipping or industrial water use, as well as ecological consequences for fish and macrozoobenthos. Threshold approaches for quantifying impacts are generally applied in both categories. Finally, in the risk analysis, the low-flow risk is calculated by dividing the damage sums per consequence category with the number of simulated years. This results in an annual low-flow risk, e.g., in €/a. The calculated low-flow risk is an essential basis for a transparent and objective decision support in low-flow risk management.

This research is funded within the research framework of WaX (Wasser-Extremereignisse) by the Federal Ministry of Education and Research of Germany.


Sairam, N., Brill, F., Sieg, T., Farrag, M., Kellermann, P. and Nguyen, V. D. (2021), Process‐Based Flood Risk Assessment for Germany, Earth's Future 9 (10), DOI: 10.1029/2021EF002259.

How to cite: Satzinger, U. and Bachmann, D.: Conceptual approach for a holistic low-flow risk analysis, EGU General Assembly 2023, Vienna, Austria, 23–28 Apr 2023, EGU23-5007, https://doi.org/10.5194/egusphere-egu23-5007, 2023.

EGU23-5999 | Posters on site | HS2.4.6

Smart-SWS: Combining flood protection and drought prevention -- Concept and site selection criteria 

Thomas Baumann, Lea Augustin, and Annette Dietmaier

Climate changes in the anthropocene lead to an increase of rainfall
intensity while the infiltration capacity of the soil is reduced
during extended dry periods. As a consequence surface runoff increases
and groundwater levels are reaching all-time lows: even close to the
alps water becomes scarce. Keeping precipitation water local is a must
and one option is to direct flood water into local aquifers
(Flood-MAR). This comes with a number of challenges, first of all, a
pronounced asymmetry of floods with very high volume flow in very
short times, and droughts requiring long-term storage. From a
hydrogeological perspective, infiltration of flood waves requires
extremely well-connected groundwater bodies with high hydraulic
conductivity contrasting with slow groundwater flow required for
long-term storage. Geotechnical measures like sheet-pile walls or sand
injections can be used to control the release of groundwater back to
the river. The infiltrated water has to be conditioned to meet
hydrochemical and sanitary criteria. In contrast to conventional
managed aquifer recharge (MAR) the time frame for treatment is
extremely limited. As floods are not occurring regularly, any treatment
system has to work autonomously and to be insensitive to long
downtimes between flooding events. The decision tree for the
selection of suitable sites starts with the occurrence and extent of
flooding events (regular flooding events with volumes less than
roughly 1 million m³), the morphology of the site (leveled with
groundwater levels below river water), and the hydrogeological
properties of the adjacent aquifers (ideally porous aquifers with high
specific yield and hydraulic conductivity). Further criteria are land
use (agriculture preferred), infrastructure (access to the site, no
subsurface installations), protection zones (groundwater, habitats,
...) and ecosystem services, and risk factors in the catchment
(hazardous substances, extended mobilization of soil during flooding,
...).  Three sites have been selected as pilot sites and will be
presented.

How to cite: Baumann, T., Augustin, L., and Dietmaier, A.: Smart-SWS: Combining flood protection and drought prevention -- Concept and site selection criteria, EGU General Assembly 2023, Vienna, Austria, 23–28 Apr 2023, EGU23-5999, https://doi.org/10.5194/egusphere-egu23-5999, 2023.

EGU23-6482 | Orals | HS2.4.6

A model ensemble-elasticity-stress test for drought impact on spring discharge and low flow 

Kerstin Stahl, Jost Hellwig, and Michael Stoelzle

Increasingly severe drought events demand a basis for prioritizing water uses and protection goals. In addition to classical methods of hydrological design, model experiments can support such aims. They can help investigate the response of hydrological systems to scenarios of exacerbated drought forcing. For known events of the past they might ask: "how much more would water resources be depleted, if forcing conditions had been more severe?". In such a stress-testing approach, this study investigated the sensitivity of low flows and low spring discharges to a range of exacerbated antecedent forcing conditions for a multi-catchment and multi-spring dataset in southwest Germany. Different model realizations for the forcing groundwater recharge, a baseflow separation and various conceptual groundwater storage and release models were combined into a model ensemble and system responses were analyzed in terms of elasticity metrics. Stress was applied as a systematic reduction in groundwater recharge with different magnitudes over different time periods preceding the main event of drought impact. All scenarios caused further reductions in low flow and spring discharge compared to the reference simulations. The presentation elaborates systematic thresholds: for example, the low-flow response of some catchments becomes maximal after a few months, and in others only after two years of stress duration. The experiments illustrate the sensitivities within the study area and allow to expand the derived 'story' as: "in a hydrological systems with (certain, e.g.) hydrogeological characteristics, low flows as in a (certain) memorable summer might be further depleted up to a (certain) maximum additional amount under (certain) drier preceding conditions". However, the importance of a specifically adapted model architecture as well as the estimation of model-related uncertainties becomes apparent from the ensemble experiment. Applied for selected well-validated model structures, the approach can help elucidate and communicate potential limits of drought stress.

How to cite: Stahl, K., Hellwig, J., and Stoelzle, M.: A model ensemble-elasticity-stress test for drought impact on spring discharge and low flow, EGU General Assembly 2023, Vienna, Austria, 23–28 Apr 2023, EGU23-6482, https://doi.org/10.5194/egusphere-egu23-6482, 2023.

EGU23-7490 | Posters on site | HS2.4.6

The role of antecedent conditions in the generation of large floods using long continuous simulations 

Maria Staudinger, Martina Kauzlaric, and Daniel Viviroli

Continuous simulation has proven to be a promising base for flood frequency analysis since it avoids some of the shortcomings of other methods, such as assumptions about antecedent conditions or omission of relevant processes. In the EXAR project (hazard information for extreme flood events on the rivers Aare and Rhine), we have elaborated long continuous simulations of streamflow using a hydrometeorological modeling chain. This chain consists of a stochastic weather generator that provides precipitation and temperature series to a hydrological model, whose outputs are finally processed with a hydrological routing system, including and emulating the effect of regulated lakes, bank overflow and floodplain retention. As a result, distinctively long (several 100’000 years) continuous simulations are available at hourly resolution.

These simulations do not only cover streamflow but also other model internal fluxes and such as snow pack and soil moisture storage. With that, they allow to infer which hydro-meteorological story lines lead to extreme floods, i.e. floods with return periods of 100 years and higher. The story lines cover the important aspects of antecedent conditions, triggering precipitation, and their spatial and temporal interaction from the sub-catchment scale up to the large basin scale. The resulting story lines already cover a very broad range of possibilities due to the recombination of observations by the stochastic weather generator and the continuous simulation. They may help to further develop targeted story lines beyond what we already observed in changing climatic conditions.

How to cite: Staudinger, M., Kauzlaric, M., and Viviroli, D.: The role of antecedent conditions in the generation of large floods using long continuous simulations, EGU General Assembly 2023, Vienna, Austria, 23–28 Apr 2023, EGU23-7490, https://doi.org/10.5194/egusphere-egu23-7490, 2023.

EGU23-7573 | Posters on site | HS2.4.6

Hydrological Modelling of Droughts and Stormwater Events to Develop Climate Resilient Water Management Strategies 

Alexandra Amann, Sven F. Grantz, Katrin Brömme, Timo M. König, Oliver Buchholz, Paul Wagner, and Nicola Fohrer

The research project KliMaWerk has been launched in 2022 in the context of the “WaX” funding measure and is a part of the federal research program on water “Wasser: N”, which contributes to the strategy “Research for Sustainability (FONA)” of the BMBF (Federal Ministry of Education and Research, Germany).

The overall aim of the project is to develop strategies to increase the hydrological and ecological resilience of rivers against droughts and floods, two extremes, being elementary problems of climate change. The project follows a fully comprehensive and interdisciplinary approach by investigating the entire river basin (system), i.e. surface and subsurface water distribution in time, physico-chemical and ecological status, and competing water uses. Based on available data and additional field campaigns (biological and morphological mapping, groundwater and soil measurements), stakeholder involvement and the analyses of coupled surface/groundwater models on different scales, the project aims at the development of a toolbox as a modular planning instrument for the selection of management strategies and measures for both urban and rural areas. In addition, recommendations for dealing with droughts and low flow periods are being developed.

The present contribution will focus on the hydrological and hydrogeological modelling. First results are presented for selected case study regions located in the Lippe River Basin, North Rhine-Westphalia. The regions differ in terms of rural and urban catchment areas. Software packages being used are the groundwater simulation software SPRING (König 2022) and the hydrological models NASIM (Hydrotec 2022) and SWAT+ (Bieger et al. 2017). Whereas the SWAT+ model is used for computations of the entire region and upscaling, SPRING and NASIM will be deployed for detailed analysis of sub-basins. NASIM is strong in describing surface runoff processes and only roughly estimates flows to and from the groundwater. Vice versa, SPRING describes all processes relevant for subsurface flow in detail while surface runoff is simplified. Coupling between the different models will yield comprehensive hydrological models, which will significantly improve knowledge about the water balance development during the last decade, a prerequisite for scenario analysis.

A first project goal is the setup of the models based on hydrologic and geologic features. Calibration is carried out for the period 2011-2021 based on available groundwater level, streamflow measurements as well as water quality data (chemistry, temperature). In a next step, coupling of the models is done via parameters describing the interaction between surface and groundwater flow, like groundwater recharge and leakage rates. In the further course of the project, the developed models will be used to determine the effects of various measures and land management strategies for increasing resilience to climate-related extremes. The modelling results of the two focus sub-catchments are used to assess the potential for upscale to the whole Lippe catchment.

Literature

Bieger et al.  (2017): Introduction to SWAT+, A Completely Restructured Version of the Soil and Water Assessment Tool. In: JAWRA Journal of the American Water Resources Association 53 (1), S. 115–130.

Hydrotec (2022): NASIM 5.3.4 Benutzerdokumentation.

König et al. (2022): SPRING Benutzerhandbuch. ISBN 978-3-00-073433-5.

How to cite: Amann, A., Grantz, S. F., Brömme, K., König, T. M., Buchholz, O., Wagner, P., and Fohrer, N.: Hydrological Modelling of Droughts and Stormwater Events to Develop Climate Resilient Water Management Strategies, EGU General Assembly 2023, Vienna, Austria, 23–28 Apr 2023, EGU23-7573, https://doi.org/10.5194/egusphere-egu23-7573, 2023.

EGU23-10897 | ECS | Orals | HS2.4.6

Challenges to and approaches for water retentive forest management in low mountain ranges in Germany 

Fabian Rackelmann, Rainer Bell, and Zita Sebesvari

The potential of healthy ecosystems in providing a multi-purpose and sustainable approach to Disaster Risk Reduction (DRR) and Climate Change Adaptation is widely acknowledged and, e.g., also highlighted in the latest Adaptation Strategy of the European Commission. However, to what extent an ecosystem can support DRR is largely determined by its condition. This holds also true for forest ecosystems. Their potential in supporting water retention and, therefore, in reducing drought and flood risk is widely recognized. However, often their potential to retain water is impaired by many stressors. Many of them are related directly to the trade-offs that come along with the forest management objectives. This is particularly the case when the ecosystem management’s target is to maximize the provision of one Ecosystem Service (ES), such as the provision of timber, which often leads to a considerable decline in the ecosystem’s ability to provide other ES, such as water retention. In alpine regions exists, for example, the concept of protective forests where financial interests in timber production are subordinate to address the trade-offs between forest ES. However, this concept has not received much attention in low mountain ranges so far even though they can already cause considerable orographic precipitation. 

Within this study, we investigated possible challenges and approaches for increased implementation of water retentive forest management in low mountain ranges. This was exemplarily done for the Rhineland-Palatinate part of the Ahr catchment. 19 investigative semi-structured expert interviews were conducted with 20 actors from the forestry, water, and nature conservations sector which included practitioners, academics, and personnel in higher and lower administrative levels and advisory centers. The qualitative analysis of the interviews has shown that the extreme 2021 floods (return period at minimum 500 years) were a warning shot that sparked interest in the water retention potential of forests at various levels, which was before majorly in the focus to reduce the drought risk on forests. However, several interacting barriers exist, ranging from rather silvicultural to socio-structural challenges. As reported by other research, a key challenge was related to finance. For example, the clearance of dead spruce stands is often financially motivated. However, research shows that this impairs the forest’s water retention capacity. Furthermore, a financial bottleneck was observed regarding infrastructural adaptations for enhanced water retention. Our work shows that due to the various potential co-benefits water retention measures in the forest can potentially profit from different funding mechanisms. Especially from the water sector, funding opportunities are available for measures that might not be covered under current funding schemes from the forest sector. However, a key prerequisite is that observed compound and cascading interactions are addressed. The limited cooperation between the different actors should be enhanced in this regard which will require improved coordination from the respective higher authorities and greater awareness locally.

How to cite: Rackelmann, F., Bell, R., and Sebesvari, Z.: Challenges to and approaches for water retentive forest management in low mountain ranges in Germany, EGU General Assembly 2023, Vienna, Austria, 23–28 Apr 2023, EGU23-10897, https://doi.org/10.5194/egusphere-egu23-10897, 2023.

EGU23-12833 | ECS | Posters on site | HS2.4.6

Large ensemble simulations for water resources planning 

Wilson Chan, Nigel Arnell, Geoff Darch, Katie Facer-Childs, Theodore Shepherd, and Maliko Tanguy

The UK has experienced recurring periods of hydrological droughts in the past, including the recent 2022 drought. Different types of large ensemble simulations such as single model initial condition climate model simulations or weather hindcasts provide a large sample of seasonal to decadal simulations. They can help overcome challenges in understanding extreme droughts presented by limited observations, the multivariate nature of individual drought events and internal variability of the climate system. Here, we demonstrate how weather reforecasts can be used to create physical climate storylines to assist water resources planning and understand plausible worst cases.

Using the 2022 drought as a case study, event-based storylines of how the drought could unfold over winter 2022/23 and beyond can be created by using the SEAS5 hindcast dataset which consists of 2850 physically plausible winters since 1982 across three lead times and 25 ensemble members. Storylines were defined based on the possible combinations of ENSO, the North Atlantic Oscillation (NAO) and the East Atlantic Pattern (EA) (e.g. La Nina/NAO+/EA-). Storylines constructed in this way provide outlooks of ongoing events and supplement traditional weather forecasts to explore a wider range of plauasible outcomes. Circulation storylines can be used in hydrological/groundwater models to explore the possible ranges of river flow, groundwater and reservoir levels. Outlooks can be periodically updated as certain storylines may become implausible over time.

How to cite: Chan, W., Arnell, N., Darch, G., Facer-Childs, K., Shepherd, T., and Tanguy, M.: Large ensemble simulations for water resources planning, EGU General Assembly 2023, Vienna, Austria, 23–28 Apr 2023, EGU23-12833, https://doi.org/10.5194/egusphere-egu23-12833, 2023.

Convective rainfall cells have a maximum prediction time of 30 to 120 minutes, which means that physically based models are usually too slow to calculate the expected flooding depths within the available time. For this reason, novel models for short-term flood and flash flood prediction are needed.

The work is being carried out as part of the WaX program and its aim is to develop a fast flood prediction model for temporal and spatial precipitation data (for example high-resolution radar forecast) and runoff-relevant soil parameters with machine learning methods for catchments with strong topography.

The developed AI model aims to predict maximum flood depths for an urban catchment (Emmendingen in Baden-Württemberg, Germany) and temporally resolved flood depths in predefined neuralgic areas. It is based on supervised learning and therefore requires a database of input and associated output for training and validation.

The effective rainfall, which is based on spatially and temporally distributed rainfall (from radar hindcast) and runoff-relevant parameters such as land use, slope, soil type and especially soil moisture, serves as the training input. The associated results for training and validation are the spatially distributed flood depth within the catchment. To build up the database both, the flood depths and effective rainfall rates, were precalculated using established hydrological respectively hydrodynamic models. To predict flood depths during real heavy rainfall events, a number of different high-resolution radar forecasts are used and combined with a range of soil moisture assumptions.

The model is a combined method, in which the hydrological processes are done by a fast and calibrated physically based model, while the time-consuming hydrodynamic calculation is replaced by machine learning methods. This leads to a utilization of the low calculation time in the range of seconds with promising accuracy compared to the results from hydrodynamic simulations. Due to the fast prognosis time it is possible to calculate a series of ensembles for different soil moisture conditions and precipitation loads as a result of the uncertain soil moisture conditions and the uncertain radar forecast. The contribution will compare preliminary AI model predictions to the physically based model results to assess the potential and limitations of the model.

How to cite: Reinecke, A. and Neuweiler, I.: Development of a flood prediction model for heavy rainfall based on spatially and temporally distributed precipitation using machine learning techniques, EGU General Assembly 2023, Vienna, Austria, 23–28 Apr 2023, EGU23-13714, https://doi.org/10.5194/egusphere-egu23-13714, 2023.

EGU23-13979 | ECS | Orals | HS2.4.6

Adaptation portfolio to combat future climate change impacts in the water sector of the Chao Phraya River Basin, Thailand 

Saritha Padiyedath Gopalan, Naota Hanasaki, and Taikan Oki

Climate change will increase the intensity and frequency of flood and drought events and the global population exposed to these extreme events, thereby enhancing economic damage. Therefore, adaptation measures should be taken to combat the inevitable consequences of climate change, particularly flooding and water scarcity. However, quantitative and concrete views on what adaptation measures should be taken have yet to be explored, especially in developing countries. Hence, in this study, the effect of several combinations of adaptation measures was examined to address both the future extremes in the Chao Phraya River in Thailand. The selected adaptation measures were (i) structural measures, which include dam construction, dam capacity enhancement, use of water-efficient irrigation equipment, and diversion channels, and (ii) non-structural measures, which include reforestation, changing the reservoir operation rules, and retention area enhancement. Future climate scenarios were constructed from the bias-corrected outputs of three general circulation models from 2080 to 2099 under RCP4.5 and RCP8.5.

Future flood and drought risk were analyzed using the number of flooding days and cumulative abstraction to demand (CAD) index, respectively. The major findings that can be drawn from this study are as follows: (i) the structural measures are capable of reducing the number of flooding days and increasing the CAD index; however, this pattern varies from region to region within the basin. (ii) the non-structural measures reduced both flooding days and CAD index, significantly impacting the basin’s water availability during the dry season. The reduction of the CAD index was mainly due to the increased evapotranspiration from the reforested land use that resulted in a decreased runoff. (iii) the adaptation portfolio (combination of structural and non-structural measures) exhibited a reduced number of flooding days and increased CAD index similar to the structural measures. The results revealed that the adaptation measures for flood or drought risk reduction could negatively impact the risk of the other hazard (i.e., reforestation reduces the flood risk but increases the drought risk). Therefore, different combinations of adaptation measures and basin-wide actions would allow us to better address the tradeoffs between these extremes and measures taken at different temporal and spatial scales.

How to cite: Padiyedath Gopalan, S., Hanasaki, N., and Oki, T.: Adaptation portfolio to combat future climate change impacts in the water sector of the Chao Phraya River Basin, Thailand, EGU General Assembly 2023, Vienna, Austria, 23–28 Apr 2023, EGU23-13979, https://doi.org/10.5194/egusphere-egu23-13979, 2023.

EGU23-15637 | Posters on site | HS2.4.6

Technical Monitoring of Smart Storm Water Storage Systems 

Wolfgang Dorner, Andreas Weber, and Rajan Paudyal

The infiltration of surface water and excess water from floods requires numerous measures to prevent and avoid side effects in the groundwater. Besides all these physical measures, intensified monitoring will be necessary. As part of the project SmartSWS, a monitoring system as a set of local sensors for quantitative and qualitative parameters combined with remote sensing data from unmanned aerial systems will be developed, to monitor test installations of small stormwater storage with infiltration capacity (SmartSWS) in Southern Germany. While current monitoring strategies are based on a thinned-out network of stationary sensors, the infiltration of excess water runoff into the groundwater layer to compensate for drought effects requires dense monitoring. While local sensor installations can only provide punctual information but on a continuous basis, remote sensing data provides spatial information for time intersects. The idea of monitoring such a SmartSWS is based on sensor fusion of these spatially and temporarily covering data with a low-cost sensor network covering the industrial communication standards to allow installations in small rural catchments. The isolated location and environmental impacts of the SmartSWS require a high degree of reliability of the installed hardware in such environments. Reliable measurements are also required so that the installations can be monitored remotely, and the systems can operate autonomously most of the time. This will provide the basis for Big Data processing methods and data analytics to efficiently prepare the data for visualization to monitor the condition of the facility in real time so that interventions and the effectiveness of the concept can be shown.

How to cite: Dorner, W., Weber, A., and Paudyal, R.: Technical Monitoring of Smart Storm Water Storage Systems, EGU General Assembly 2023, Vienna, Austria, 23–28 Apr 2023, EGU23-15637, https://doi.org/10.5194/egusphere-egu23-15637, 2023.

EGU23-16671 | Orals | HS2.4.6

Effectiveness for Drought of Nature-based Flood Measures in Headwater Streams: Evidence-Based Practise in NW-Europe 

Angelique Lansu, Charlotte Wieles-Rietveld, Nico Ruysseveldt, Borjana Bogatinoska, Jikke van Wijnen, Frank van Lamoen, and Jetse Stoorvogel

Drought is a topical issue, given extreme drought records in NW Europe, the establishment of water coordination bodies and the perceived impact of drought on society. Climate change is driving disruptions in the hydrological cycle. In North-West Europe, in recent years, solutions to counter the effects of floods and flooding have been co-designed in a participatory manner in society. The question in this study is whether these Nature-based Solutions (NbS) to adapt to flooding are also effective to mitigate the effects of drought. We studied this research question based on field expertise from some 40 water professionals involved in the co-creation and implementation of NbS in 8 headwater catchments in NW Europe (southern England, northern France, Flanders, southern Netherlands; project Interreg 2 Seas Co-Adapt (2019-2023).
Based on the concept of evidence-based practice (EBP), we combined the field expertise of these water professionals with scientific knowledge to arrive at best practices. The NbS studied were predefined by process function (geomorphological, hydrological. soil-land).  To collect and evaluate the field expertise (practical knowledge), we conducted a Consensus Decision Process. This process consisted of a brainstorming phase (collecting) and a consensus phase (evaluating). This process at two time-intervals was conducted online, in the form of synchronous, online sessions in an online collaboration tool (Mural). The scientific knowledge from a Systematic literature review on NbS as flood measures were compared in the EBP with the collected practical knowledge from the Consensus Decision Process, and evaluated based on the criteria 'effect on drought' and 'synergy/trade-off with NbS'. Obtained results have been tested on outcomes from modelling NbS and drought in catchment Aa/Weerijs (NL; H2020 EIFFEL4Climate; 2021-2024) and expertise of the water professionals of this catchment. The result is that the most effective drought mitigation measures are: storage solutions, slow the flow measures and soil processes. If the underlying steering processes (geomorphology, hydrology, soil-land) are included in the design of flood measures, it is expected that after implementation of NbS in head waters, the water storage capacity will increase and ecological drought will decrease.

How to cite: Lansu, A., Wieles-Rietveld, C., Ruysseveldt, N., Bogatinoska, B., van Wijnen, J., van Lamoen, F., and Stoorvogel, J.: Effectiveness for Drought of Nature-based Flood Measures in Headwater Streams: Evidence-Based Practise in NW-Europe, EGU General Assembly 2023, Vienna, Austria, 23–28 Apr 2023, EGU23-16671, https://doi.org/10.5194/egusphere-egu23-16671, 2023.

EGU23-17098 | ECS | Posters on site | HS2.4.6

Changes in regional and simultaneous soybean losses in the Americas due to projected global warming 

Henrique Moreno Dumont Goulart, Karin van der Wiel, Christian Folberth, Esther Boere, and Bart van den Hurk

Soybeans are globally used as the main source of protein for livestock. However, most soybean production is concentrated in regions in The United States of America, Brazil and Argentina, rendering the supply chain vulnerable to regional disruptions. In 2012, simultaneous soybean losses in these three countries led to shortages in global supplies and to record prices. The losses were linked to anomalous weather conditions in all three countries. In this experiment, we investigate how climate change may affect future events with similar or larger impacts than the one from 2012 for each country individually and simultaneously. For that, we develop a hybrid model, coupling a process-based crop model with a machine learning model, to improve the simulation of soybean production. We assess the frequency and magnitude of events with similar or larger impacts than 2012 under different future climatic forcing conditions. We also evaluate the events with respect to present day and future conditions to disentangle the impacts of (changing) climate variability from the long-term mean trends. Results indicate that long-term trends of mean climate increase the occurrence and magnitude of 2012 analogue crop yield losses. Conversely, 2012 analogue crop yield losses that are caused by changes in climate variability show an increase in frequency in each country individually, but not simultaneously across the Americas.

How to cite: Moreno Dumont Goulart, H., van der Wiel, K., Folberth, C., Boere, E., and van den Hurk, B.: Changes in regional and simultaneous soybean losses in the Americas due to projected global warming, EGU General Assembly 2023, Vienna, Austria, 23–28 Apr 2023, EGU23-17098, https://doi.org/10.5194/egusphere-egu23-17098, 2023.

EGU23-17254 | ECS | Orals | HS2.4.6

Building Storylines of Future Atmospheric River Floods 

Helen Griffith and Hannah Cloke

A storyline is defined as a physically self-consistent unfolding of past events or of plausible possible futures (Shepherd et al., 2018). It has advantages in effective risk communication and adaption, as it moves the emphasis away from probability across to plausibility (Butler et al., 2020). Working as part of the EvoFlood (Quantifying the Evolution of Flood hazard and risk across a changing world) project, this work presents a novel methodology for estimating future hydrology based on not only climatic drivers, but the wider impacts of dams, river regulation and changing land-use. Grounded in historical atmospheric river floods, storylines are extracted from the large ensemble reforecast dataset provided by the Global Flood Awareness System (GloFAS; http://www.globalfloods.eu/).

Butler, J. R. A., Bergseng, A. M., Bohensky, E., Pedde, S., Aitkenhead, M., & Hamden, R. (2020). Adapting scenarios for climate adaptation: Practitioners’ perspectives on a popular planning method. Environmental Science & Policy, 104, 13–19. https://doi.org/10.1016/j.envsci.2019.10.014

Shepherd, T. G., Boyd, E., Calel, R. A., Chapman, S. C., Dessai, S., Dima-West, I. M., Fowler, H. J., James, R., Maraun, D., Martius, O., Senior, C. A., Sobel, A. H., Stainforth, D. A., Tett, S. F. B., Trenberth, K. E., van den Hurk, B. J. J. M., Watkins, N. W., Wilby, R. L., & Zenghelis, D. A. (2018). Storylines: An alternative approach to representing uncertainty in physical aspects of climate change. Climatic Change, 151(3–4), 555–571. https://doi.org/10.1007/s10584-018-2317-9

How to cite: Griffith, H. and Cloke, H.: Building Storylines of Future Atmospheric River Floods, EGU General Assembly 2023, Vienna, Austria, 23–28 Apr 2023, EGU23-17254, https://doi.org/10.5194/egusphere-egu23-17254, 2023.

HS2.5 – Global and (sub)continental hydrology

EGU23-25 | ECS | Posters on site | HS2.5.1

HISAR: Hydrologic Indices of South American Rivers 

Larissa Ribeiro, Rodrigo Paiva, Walter Collischonn, Mino Sorribas, and Leonardo Paul

Effective water resources management for environmental conservation requires a proper understanding of the behavior of rivers. Rivers can be understood through the analysis of the flow regime synthesized by hydrologic indices. While the density of in situ river observation networks is heterogeneous across several continents, such as South America, recent advances in continental scale hydrologic modeling bring new opportunities for systematic characterizations over large domains. We build the HISAR (Hydrologic Indices of South American Rivers) dataset to study the natural flow regime of South American rivers. It is composed of 73 hydrological indices computed from observed and modeled discharge datasets. We evaluated the performance of the continental-scale hydrological model (MGB, Modelo de Grandes Bacias), comparing the hydrological indices computed from modelled and observed discharges. The results allow the identification of patterns in the flow regime of rivers and evidence relationships between climate and hydrology and between different indices. The indices of modelled discharges regarding magnitudes had more agreement with indices of observed data (e.g., mean flow and runoff ratio), while indices representing temporal variability were more different. Despite the disagreement of some indices (baseflow recession constant, hydrograph skewness, and number of hydrologic reversals), the simulated discharges dataset can be utilized in hydrologic indices for understanding rivers' flow regimes and behaviors on a continental scale. The relative error median modulus varied from approximately zero to 99.4%, with a mean of 15.4%. The HISAR dataset is freely available at https://doi.org/10.5281/zenodo.7296577.

This work has been partially supported by the Brazilian agency CAPES.

How to cite: Ribeiro, L., Paiva, R., Collischonn, W., Sorribas, M., and Paul, L.: HISAR: Hydrologic Indices of South American Rivers, EGU General Assembly 2023, Vienna, Austria, 23–28 Apr 2023, EGU23-25, https://doi.org/10.5194/egusphere-egu23-25, 2023.

EGU23-259 | ECS | Posters on site | HS2.5.1 | Highlight

Water Cycle Changes in Reanalyses 

Mijael Rodrigo Vargas Godoy and Yannis Markonis

Remote sensing data and reanalyses complement traditional surface-based measurements and offer unprecedented coverage over previously inaccessible or unmonitored regions. Even though these have improved the quantification of the global water cycle, their varying performances and uncertainties limit their applicability. Herein, we discuss how a framework encompassing precipitation, evaporation, their difference, and their sum could further constrain uncertainty by unveiling discrepancies otherwise overlooked. Ahead, we physically define precipitation plus evaporation to sustain its appropriateness to describe reanalyses. We investigated how well the global water cycle fluxes are represented in four reanalysis data sets (20CR v3, ERA-20C, ERA5, and NCEP1). Among them, we observe four different responses to the temperature increase between 1950-2010, with ERA5 showing the best agreement with the water cycle acceleration hypothesis. Our results show that implementing the framework proposed can improve the evaluation of reanalyses' performance and enhance our understanding of the water cycle changes on a global scale.

How to cite: Vargas Godoy, M. R. and Markonis, Y.: Water Cycle Changes in Reanalyses, EGU General Assembly 2023, Vienna, Austria, 23–28 Apr 2023, EGU23-259, https://doi.org/10.5194/egusphere-egu23-259, 2023.

EGU23-444 | ECS | Posters on site | HS2.5.1

The Impact of Biases in Precipitation and Evapotranspiration on Aridification Assessment over the Mediterranean Region 

Hossein Abbasizadeh, Vishal Thakur, Akbar Rahmati Ziveh, Arnau Sanz i Gil, Martin Hanel, Oldrich Rakovec, and Yannis Markonis

Aridification is one of the growing concerns in the Mediterranean region. The estimation of water availability (precipitation minus evaporation; P-E), has been widely used to assess aridification. However, the values of P and E are always associated with biases due to different methodological and observational approaches. In this study, we investigate the impact of estimation biases in assessing aridification in the Mediterranean region. To this end, we use multiple precipitation datasets (EM-Earth, GPM-IMERG, and MSWEP) and methodologies for evapotranspiration estimation. We then compare them with satellite (GRACE), reanalysis (ERA5), and hydrological simulation (mHm, Terraclimate) data products. This evaluation shows the variability in the estimated water availability corresponding to its observational counterpart and how the biases in precipitation and evaporation propagate to the value of P-E. Assessing the variance of water availability derived from different estimation methodologies and observational datasets increases our insight into assessing the aridification in the Mediterranean region.

How to cite: Abbasizadeh, H., Thakur, V., Rahmati Ziveh, A., Sanz i Gil, A., Hanel, M., Rakovec, O., and Markonis, Y.: The Impact of Biases in Precipitation and Evapotranspiration on Aridification Assessment over the Mediterranean Region, EGU General Assembly 2023, Vienna, Austria, 23–28 Apr 2023, EGU23-444, https://doi.org/10.5194/egusphere-egu23-444, 2023.

EGU23-1362 | ECS | Posters on site | HS2.5.1

Coastal aquifer, shoreline and shallow marine sediment permeability on a global scale 

Jarrid Tschaikowski and Nils Moosdorf

The world's coast is an important interface of global hydrogeology. It mediates the flow of groundwater to the oceans and the supply of fresh groundwater that much of the coastal population relies on for drinking water. The coast connects also fresh groundwater and marine seawater. For a better understanding of the global water cycle, the interaction between freshwater and seawater along the more than 2 million kilometers of global coast needs to be studied more intensively. For this, knowledge of coastal permeability is paramount.

The global coastal permeability map (GCPM) aims to represent the coastal permeability of the world's coast in 1-kilometer segments. The GCPM divides coastal permeability into three distinct views: Permeability of the landward aquifer, the shoreline, and the shallow marine sediments. Extensive GIS-based work was conducted to merge several recent global datasets which represent attributes indicating permeability with the shoreline.  Using the multiple features of these datasets, the coastline was then classified into permeability configurations.

The GCPM provides an important and useful baseline data set for local to regional coastal hydrogeology and especially for global coastal hydrogeology. Possible uses include serving as an input parameter for coastal boundary conditions for global models that integrate sea-land interactions, as a parameter for submarine groundwater discharge calculations, and as an aid in identifying areas of increased saltwater intrusion hazard. Also, pooling coastal parameters from the individual datasets will increase accessibility and allow opportunities for broader analyses. Differentiating between costal aquifer, shoreline, and shallow marine permeability will make the GCPM valuable to a broader field of coastal science and applications, as well as influence the way coastal permeability is viewed in the future.

How to cite: Tschaikowski, J. and Moosdorf, N.: Coastal aquifer, shoreline and shallow marine sediment permeability on a global scale, EGU General Assembly 2023, Vienna, Austria, 23–28 Apr 2023, EGU23-1362, https://doi.org/10.5194/egusphere-egu23-1362, 2023.

EGU23-1421 | ECS | Orals | HS2.5.1

Beyond precipitation: diversity of drivers of high river flows in European near-natural catchments 

Manal Lam'barki, Wantong Li, Sungmin Oh, Chunhui Zhan, and Rene Orth

High streamflow in rivers can lead to flooding, which may have severe impacts on economy, society and ecosystems. Therefore it is imperative to understand their underlying physical mechanisms. Previous research has illustrated the relevance of several hydrological drivers, such as precipitation, snowmelt and soil moisture. However, the relative importance of these drivers compared with each other is unclear. Moreover, the role of vegetation-related drivers is not well studied. In this study, we focus on high river flows and consider a comprehensive set of potential drivers and analyze their relative importance. This is done with streamflow observations from over 250 near-natural catchments located across Europe during 1984–2007, which are matched with driver data from various observation-based sources. Not surprisingly, we find that precipitation is the most relevant driver of high river flows in most catchments. In addition, and more interestingly, we show that next to precipitation a diversity of other drivers is relevant for high flows, including shallow soil moisture, deep soil moisture, snowmelt, evapotranspiration and leaf area index. These non-precipitation drivers tend to be even more relevant for more extreme high flows. The relative importance of most considered drivers is similar across daily, weekly and monthly time scales. The spatial patterns of the relevance of precipitation, snowmelt and soil moisture for supporting high river flows are controlled by vegetation types and terrain characteristics, while climate and basin area are less important. By analyzing a comprehensive selection of drivers of high river flow in a powerful framework which accounts for co-linearities between drivers, this study advances the understanding of flood generation processes and informs respective model development.

How to cite: Lam'barki, M., Li, W., Oh, S., Zhan, C., and Orth, R.: Beyond precipitation: diversity of drivers of high river flows in European near-natural catchments, EGU General Assembly 2023, Vienna, Austria, 23–28 Apr 2023, EGU23-1421, https://doi.org/10.5194/egusphere-egu23-1421, 2023.

EGU23-2001 | ECS | Orals | HS2.5.1

Functional relationships reveal differences in the water cycle representation of global water models 

Sebastian Gnann, Robert Reinecke, Lina Stein, Yoshihide Wada, Wim Thiery, Hannes Müller Schmid, Yusuke Satoh, Yadu Pokhrel, Sebastian Ostberg, Aristeidis Koutroulis, Naota Hanasaki, Manolis Grillakis, Simon N. Gosling, Peter Burek, Marc F. P. Bierkens, and Thorsten Wagener

Global water models are widely used for policy-making and in scientific studies, but substantial inter-model differences highlight the need for additional evaluation. Here we evaluate global water models by assessing so-called functional relationships between system forcing and response variables. The more widely used comparisons between observed and simulated fluxes provide insight into model behavior for the representative area of an observation, and can therefore potentially improve the model for that area. Functional relationships, by contrast, aim to capture how system forcing and response variables co-vary across large scales, and thus offer the potential for model improvement over large areas. Using 30-year annual averages from 8 global water models, we quantify such functional relationships by calculating correlations between key forcing variables (precipitation, net radiation) and water fluxes (actual evapotranspiration, groundwater recharge, total runoff). We find strong disagreement for groundwater recharge, some disagreement for total runoff, and the best agreement for evapotranspiration. Observation- and theory-derived functional relationships show varying agreements with models, indicating where model representations and our process understanding are particularly uncertain. Overall, our results suggest that model improvement is most important for the representation of energy balance processes, recharge processes, and generally for model behavior in dry and cold regions. We argue that advancing our ability to simulate global hydrology requires a better perceptual understanding of the global water cycle. To evaluate if our models match that understanding, we should explore alternative evaluation strategies, such as the use of functional relationships.

How to cite: Gnann, S., Reinecke, R., Stein, L., Wada, Y., Thiery, W., Müller Schmid, H., Satoh, Y., Pokhrel, Y., Ostberg, S., Koutroulis, A., Hanasaki, N., Grillakis, M., Gosling, S. N., Burek, P., Bierkens, M. F. P., and Wagener, T.: Functional relationships reveal differences in the water cycle representation of global water models, EGU General Assembly 2023, Vienna, Austria, 23–28 Apr 2023, EGU23-2001, https://doi.org/10.5194/egusphere-egu23-2001, 2023.

EGU23-2053 | ECS | Posters on site | HS2.5.1 | Highlight

The global freshwater availability and water use model WaterGAP 2.2e – features, evaluation and application within ISIMIP3 

Hannes Müller Schmied and Ezatullah Rabanizada

The availability of freshwater resources is of essential importance for humans, freshwater biota, and ecosystem functions. In this scope, global hydrological models (GHMs) are developed to improve the understanding of the global freshwater situation in a globalized world, by filling gaps in observational coverage and assessing scenarios of the future under consideration of different socioeconomic developments and climate change. The Water Global Assessment and Prognosis (WaterGAP) model calculates water use and availability and is in development since 25 years. It consists of five water use models (for irrigation, domestic, cooling of thermal power plants, manufacturing, and livestock sectors) and the WaterGAP Global Hydrology Model (WGHM). Recently, the latest model version, WaterGAP 2.2e, was finalized, containing a number of enhancements and revisions such as integrating new reservoirs, improving naturalized simulations and updating the calibration data base. Furthermore, WaterGAP2.2e is applied in the Inter-Sectoral Impact Model Intercomparison Project ISIMIP3.

This presentation provides an overview of the WaterGAP 2.2e scheme and features, assesses streamflow and total water storage anomalies against reference data, shows water balance components, and provides examples of application within ISIMIP3 with a focus on climate forcing uncertainty and selected indicators of climate change hazards. 

How to cite: Müller Schmied, H. and Rabanizada, E.: The global freshwater availability and water use model WaterGAP 2.2e – features, evaluation and application within ISIMIP3, EGU General Assembly 2023, Vienna, Austria, 23–28 Apr 2023, EGU23-2053, https://doi.org/10.5194/egusphere-egu23-2053, 2023.

EGU23-2455 | Orals | HS2.5.1

Global high-resolution climate change projection and its impacts on global hydrology and hydrological extremes 

Solomon Hailu Gebrechorkos, Julian Leyland, and Stephen Darby

Hydroclimate extremes have a large societal impact if not appropriately monitored and if site-specific adaptation measures are not developed and modified. The impact of hydroclimate extremes such as floods is projected to increase in the future, demanding site-specific adaptation measures to reduce the impacts. Assessing historical and future changes in local scale hydroclimate extremes and estimating trajectories of change requires higher resolution climate projections than those output from Global Climate Models (GCMs). To improve the coarse resolution and bias of climate data from GCMs, we used a statistical downscaling model. The statistical downscaling model, Bias Correction/Constructed Analogues with Quantile mapping reordering (BCCAQ), provides high-resolution climate data suitable for hydrological extremes. Here, we downscaled seven variables (air pressure, precipitation, air temperature, relative humidity, and maximum and minimum temperature) from 18 CMIP6 GCMs under three SSPs (Shared Socioeconomic Pathways). The downscaled global high-resolution climate data is available at The Centre for Environmental Data Analysis (CEDA, https://catalogue.ceda.ac.uk/uuid/c107618f1db34801bb88a1e927b82317).

We used the global hydrological model, WBMsed, with the downscaled climate data and future population projections and dam scenarios to assess changes in hydrology. The downscaling model is calibrated at 0.25° resolution during the historical period (1981-2014) using a high-resolution climate dataset (e.g., MSWEP for precipitation) and showed a strong correlation (>0.85) for monthly climatology of the seven downscaled variables. The climate data used to calibrate the downscaling models, particularly for precipitation, is selected after a comprehensive evaluation of multiple precipitation datasets for simulating river discharge globally. Based on data from ~2400 stations, MSWEP was found to outperform other precipitation datasets in most of the stations.  The results, based on the downscaled data and WBMsed model, shows a mixed change in river discharge in the future; an increase in the Middle East, Africa, Central and South-Eastern USA and a decrease in parts of Europe, South-western USA, and Northern South America) in the 2050s and 2080s. The global average annual river discharge will be higher than the reference period (1981-2014) in the periods 2015-2040, 2041-2070 and 2071-2100 by more than 6%, 9%, and 13%, respectively. Sediment flux, on the other hand, shows a high spatial variability dominated by a decrease in larger rivers and an increase in smaller rivers. Overall, this high-resolution global scale impact assessment study will help identify potential and risk areas for different sectors and allow the development of climate change adaptation measures at a local scale to minimize the impacts of future changes.


How to cite: Gebrechorkos, S. H., Leyland, J., and Darby, S.: Global high-resolution climate change projection and its impacts on global hydrology and hydrological extremes, EGU General Assembly 2023, Vienna, Austria, 23–28 Apr 2023, EGU23-2455, https://doi.org/10.5194/egusphere-egu23-2455, 2023.

EGU23-2649 | ECS | Orals | HS2.5.1

Input features importance to hydrological indices simulated by Land Surface and Global Hydrological Models 

João Paulo Brêda, Lieke Melsen, Martine van der Ploeg, Ioannis Athanasiadis, Vinícius Siqueira, Anne Verhoef, Yijian Zeng, and Albert van Dijk

A solid understanding of the global water cycle and how land surface processes respond to both changes in climate and pressure due to water use is essential for society. Although Land Surface Models (LSM) and Global Hydrological Models (GHM) are able to simulate the spatiotemporal variability of the water balance relatively reliably, intercomparison studies have indicated considerable differences between the models. Each LSM and GHM present a unique set of equations, parameters and configurations that contribute to the spread of simulated hydrological responses to meteorological forcings. In order to improve our understanding of modeling uncertainties, we propose a variable importance assessment for 5 LSM/GHM (JULES, HTESSEL, PCR-GLOBWB, SURFEX and ORCHIDEE) from the EartH2Observe (E2O) project. The output of the models and the meteorological forcings were collected from the Water Resources Reanalysis Tier 2 of the E2O project, which consists of a global dataset with spatial resolution of 0.25ox0.25o. We used soil texture and land cover datasets that most resemble the inputs used by each LSM/GHM during the E2O project. The models’ outputs were used to estimate 6 hydrological indices for every land cell: Evaporation-Precipitation ratio; Runoff-Precipitation ratio; Surface Runoff-Total Runoff ratio; median Soil Moisture variation caused by a Rainfall event; median Surface Runoff caused by a Rainfall event; and Soil Moisture temporal autocorrelation. Then, we evaluate the input features (meteorological, land cover, and soil texture) importance to the hydrological indices of each model using machine learning. With the analysis we aim to  examine a) How much the models differ and why? b) To what extent are the output differences related to the input features or/and to the models formulation? and c) How significant is each feature to the respective hydrological index?

How to cite: Brêda, J. P., Melsen, L., van der Ploeg, M., Athanasiadis, I., Siqueira, V., Verhoef, A., Zeng, Y., and van Dijk, A.: Input features importance to hydrological indices simulated by Land Surface and Global Hydrological Models, EGU General Assembly 2023, Vienna, Austria, 23–28 Apr 2023, EGU23-2649, https://doi.org/10.5194/egusphere-egu23-2649, 2023.

Observing basin water storage response due to hydroclimatic fluxes and human water use provides valuable insight into how a basin stores and discharges water.  Quantifying basin storage change attributed to climate and use is critical for water management yet remains a challenge globally.  Observations from the Gravity Recovery and Climate Experiment (GRACE) mission are combined with hydroclimate fluxes of precipitation and evapotranspiration to document the sensitivity of available water storage for global basins.  Our results detect substantial global water storage sensitivity to changes in hydroclimatic fluxes.  Comparison with Budyko-derived metrics substantiate our findings, demonstrating that basin water storage resilience to short-term water deficits is linked to basin partitioning predictability, and uniform seasonality of hydroclimatic fluxes.  Our study demonstrates how small shifts in hydroclimate flux may affect available water storage potentially impacting billions globally.

How to cite: Thomas, B. and Nanteza, J.: Global assessment of the sensitivity of water storage to hydroclimatic variations, EGU General Assembly 2023, Vienna, Austria, 23–28 Apr 2023, EGU23-3109, https://doi.org/10.5194/egusphere-egu23-3109, 2023.

EGU23-3410 | Posters on site | HS2.5.1

GloFAS v4.0: towards hyper-resolution hydrological modelling at global scale 

Stefania Grimaldi, Peter Salamon, Carlo Russo, Juliana Disperati, Ervin Zsoster, Corentin Carton De Wiart, Cinzia Mazzetti, Margarita Choulga, Francesca Moschini, Shaun Harrigan, Goncalo Gomes, Casado-Rodríguez Jesus, Arthur Ramos, Christopher Barnard, Eleanor Hansford, and Christel Prudhomme

The Global Flood Awareness System (GloFAS, https://www.globalfloods.eu/) is a freely available flood forecasting service that is running fully operational as part of the Copernicus Emergency Management Service since April 2018. GloFAS offers a number of products, which are tailored to give an overview of the current and future hydro-meteorological situation. The GloFAS dataset includes medium-range and seasonal discharge forecasts, as well as storages (e.g. soil moisture, snow cover, lakes volumes) and main fluxes (e.g. surface and sub-surface runoff, actual evapotranspiration).

The GloFAS dataset is generated using the open source hydrological model OS LISFLOOD (https://ec-jrc.github.io/lisflood/). OS LISFLOOD is a distributed, physically based rainfall-runoff model, which has been designed for the modelling of rainfall-runoff processes in large and transnational catchments for a variety of applications including flood simulation and forecasting; water resources assessment (drought forecast); analysis of the impacts of land use changes, river regulation measures, and other water management plans; or climate change analysis. The recent high-resolution global implementation of OS LISFLOOD allowed the delivery of the newest GloFAS set-up, namely GloFAS v4.0 which is foreseen to become operational in Q2 2023. This latest set-up has a 0.05 degrees resolution (~5km), 4 times higher than the previous version. Moreover, a crucial feature of the high-resolution implementation is the use of the latest research findings and remote sensing datasets to prepare the set of high-resolution input maps for the hydrological model. These maps allow to account more accurately for the morphological, physical, and land use characteristics of the catchments and thus enable an improved representation of the rainfall-runoff processes in different climates and socio-economic contexts at global scale.

This presentation provides an overview (i) of the GloFAS v4.0 OS-LISFLOOD high-resolution implementation, (ii) of the model calibration incorporating almost 2000 gauging stations and a pragmatic regionalization approach, and (iii) of the technological solutions adopted to limit the computational time of global high-resolution simulations.

OS-LISFLOOD, the high-resolution implementation maps, and GloFAS v4.0 are publicly available and they disclose opportunities for further analysis of the terrestrial water cycle fluxes and storages, and of the current and future state of global water resources.

How to cite: Grimaldi, S., Salamon, P., Russo, C., Disperati, J., Zsoster, E., Carton De Wiart, C., Mazzetti, C., Choulga, M., Moschini, F., Harrigan, S., Gomes, G., Jesus, C.-R., Ramos, A., Barnard, C., Hansford, E., and Prudhomme, C.: GloFAS v4.0: towards hyper-resolution hydrological modelling at global scale, EGU General Assembly 2023, Vienna, Austria, 23–28 Apr 2023, EGU23-3410, https://doi.org/10.5194/egusphere-egu23-3410, 2023.

Groundwater is the world's essential water resource, and groundwater flow is strongly linked with surface water. In some cases, groundwater can even affect precipitation through evapotranspiration. In the current Earth System Model (ESM), a fixed and constant one-dimensional vertical grid is used in the unsaturated zone. The thickness of the unsaturated zone is expected to differ in a given region under a future climate. Therefore, the representation of groundwater flow in the ESM may be insufficient. In particular, on steep slopes such as mountainous areas, it is considered that there are limitations to the runoff process. In this study, we developed a three-dimensional variably saturated flow model that was parameterized for the runoff process and validated in the mountainous area.

In mountainous areas where topographic terrain is severe, calculations at hundreds to tens of meters are necessary to better performance for groundwater flow. However, it is unrealistic to calculate the groundwater dynamics at that scale over global lands. Therefore, it is necessary to calculate on a coarse grid with parameterization. We developed the runoff parameterization using a 1-minute grid with topographic information within the grid. The parameterization validation was performed for the whole of Japan, which has a large elevation distribution. A part of the results of the land surface model, MATSIRO, was passed to the developed model to calculate runoff. The calculated runoff was input into the river routine model, CaMa-Flood, and compared to observed river discharge. As a result, the reproducibility of the river discharge was improved compared to the case without the parameterization and the MATSIRO’s results.

How to cite: Miura, Y. and Yoshimura, K.: Runoff parameterization for global scale hydrology based on a variably saturated flow model, EGU General Assembly 2023, Vienna, Austria, 23–28 Apr 2023, EGU23-3727, https://doi.org/10.5194/egusphere-egu23-3727, 2023.

EGU23-3985 | ECS | Orals | HS2.5.1 | Highlight

Sensitivity Analysis of the SUMMA Model on the Global Scale 

Hongli Liu, Martyn Clark, Guoqiang Tang, Wouter Knoben, Shervan Gharari, Jim Freer, Louise Arnal, and Dave Casson

Despite the recent advances, the identification of influential hydrologic processes and parameters of the process-based hydrologic model is still challenging. Part of the reason is the uncertain and interacting hydrologic process and the high dimensional parameter space. The motivation for this work is to effectively select an appropriate set of hydrologic processes and parameters for each basin on the globe, which is not necessarily the same everywhere. Here we evaluate the applications of the Structure for Unifying Multiple Modeling Alternatives (SUMMA) model to a large number of representative areas on the globe. Our objective is to identify the dominant hydrologic processes and sensitive model parameters for each representative area. First, sensitivity indices of the SUMMA parameters are computed using the VISCOUS global sensitivity analysis method. VISCOUS is the abbreviation of Variance-based Sensitivity Analysis using Copulas. Second, the sensitivity values are summarized per hydrologic process (e.g., snowmelt, surface runoff, infiltration, soil moisture, evapotranspiration, baseflow, and runoff) and per simulation statistic (e.g., mean, coefficient of variance, and autoregressive lag 1). The summarized sensitivity indices enable modelers to identify the most dominant hydrologic processes in each representative area. The results of this study will provide a foundation to estimate parameters in large-domain applications of process-based hydrologic models.

How to cite: Liu, H., Clark, M., Tang, G., Knoben, W., Gharari, S., Freer, J., Arnal, L., and Casson, D.: Sensitivity Analysis of the SUMMA Model on the Global Scale, EGU General Assembly 2023, Vienna, Austria, 23–28 Apr 2023, EGU23-3985, https://doi.org/10.5194/egusphere-egu23-3985, 2023.

EGU23-5190 | Orals | HS2.5.1 | Highlight

Hyper-resolution hydrological modelling over Europe: results and emerging challenges 

Rens van Beek, Jannis Hoch, Edwin Sutanudjaja, Niko Wanders, and Marc Bierkens

Performing hydrological simulations at ‘hyper-resolution’, that is at or below a spatial resolution of 1 km, was and still is a major challenge in hydrological sciences. However, as computational power and the number of readily available and open datasets at useful spatial resolutions increase, several hyper-resolution modelling efforts have been taken. Here, we present a first continental-scale application of the global hydrological model PCR-GLOBWB over Europe at 1 km spatial resolution. To isolate the effect of resolution refinement, results are compared with runs at the thus far ‘default’ resolutions of 10 km and 50 km, respectively. A range of modelled states and fluxes was evaluated against observations: discharge, evaporation, soil moisture, and terrestrial water storage. Evaluation metrics indicate increased accuracy with finer spatial resolutions for simulated discharge. For the other variables, results are mixed possibly due to the coarse resolution of the validation products: while the used validation products have the advantage of long observational records which helps establishing a robust baseline understanding, their spatial resolution may be too coarse to fully assess the accuracy of models at hyper-resolution. At that scale, more recent satellite products can be of more use but at the cost of only short observation record. We thus additionally validated 1 km model output against additional validation products at finer spatial resolution. Furthermore, 1 km output of PCR-GLOBWB is benchmarked against 1 km output over the UK indicating that additional emphasis needs to be put on model parameterization. Despite these outstanding challenges, our findings shows that large-scale hyper-resolution modelling is now feasible and that further pursuing these efforts can eventually lead to more locally-relevant hydrological information and process understanding.

How to cite: van Beek, R., Hoch, J., Sutanudjaja, E., Wanders, N., and Bierkens, M.: Hyper-resolution hydrological modelling over Europe: results and emerging challenges, EGU General Assembly 2023, Vienna, Austria, 23–28 Apr 2023, EGU23-5190, https://doi.org/10.5194/egusphere-egu23-5190, 2023.

EGU23-5534 | ECS | Posters on site | HS2.5.1

Global violations of environmentally critical groundwater discharge 

Bryan Marinelli and Inge de Graaf

Groundwater serves as a vital resource to meet global water demands, particularly for irrigation services. Unsustainable abstractions threaten extant stores and risk irreparable depletion, potentially leading to disconnects between the surface and sub-surface systems. With a growing global need for freshwater, understanding the ongoing hydrological processes is increasingly important. This study, therefore, assesses the environmentally safe operating spaces for global groundwater abstractions.

Environmentally critical groundwater discharge was calculated at the gridcell level (5 arcmin) for monthly timesteps during the period 1965-2010 using PCR-GLOBWB-MODFLOW coupled model output from a natural run, which excludes human interference. Output from a human-impacted run was then compared with these critical flow thresholds to calculate violations of the environmental flow requirements (EFR) due to groundwater abstractions. Two methods of estimating groundwater EFR – the Q901 and Presumptive Standard2 – were used. The Q90 method considers the 10th percentile (90% exceedance) of monthly flows from a 60-month moving window as the EFR threshold, while the Presumptive Standard stipulates that 90% of natural flows must be maintained to satisfy the EFR.

Results were aggregated to the river basin scale, and the frequency and severity of groundwater EFR violations were calculated. Intensively irrigation regions, such as the Upper Indus-Ganges basin, North-China Plains, and southeastern United States were among the basins with the worst groundwater EFR violations. Notably, when comparing the two groundwater violation methods, the Presumptive Standard violations tended to be more severe than the Q90 violations due to generally having a higher EFR threshold. The same river basin-scale analyses were conducted for the low-flow periods as well. These periods were isolated using the Q90 as the low-flow threshold. The biggest difference between the Q90 and Presumptive Standard violations during such periods was no longer the severity, but rather the frequency, with Presumptive Standard violations occurring more often than Q90 violations, but both being of similar magnitudes.

The findings of the groundwater EFR violation analysis will be validated with surface water EFR violations, applied using the Variable Monthly Flow3 approach. Further research into this topic will then yield insights into current and future violations of environmentally critical groundwater discharge, as well as the associated environmental impacts of such violations due to groundwater abstractions.

1. de Graaf, I. E. M., Gleeson, T., (Rens) van Beek, L. P. H., Sutanudjaja, E. H. & Bierkens, M. F. P. Environmental flow limits to global groundwater pumping. Nature 574, 90–94 (2019).

2. Gleeson, T. & Richter, B. How much groundwater can we pump and protect environmental flows through time? Presumptive standards for conjunctive management of aquifers and rivers. River Res Appl 34, 83–92 (2018).

3. Pastor, A. v., Ludwig, F., Biemans, H., Hoff, H. & Kabat, P. Accounting for environmental flow requirements in global water assessments. Hydrol Earth Syst Sci 18, 5041–5059 (2014).

How to cite: Marinelli, B. and de Graaf, I.: Global violations of environmentally critical groundwater discharge, EGU General Assembly 2023, Vienna, Austria, 23–28 Apr 2023, EGU23-5534, https://doi.org/10.5194/egusphere-egu23-5534, 2023.

EGU23-7147 | Orals | HS2.5.1 | Highlight

On advances and opportunities in estimating effective parameters for  land surface models 

Luis Samaniego, Juliane Mai, Robert Schweppe, and Stephan Thober

In 1982, Jim Dooge[1] stated that ``the parameterization of hydrological processes to the grid scale of GCMs is a problem that has not been tacked, let alone solved''. Almost a decade later, Eric Wood (1990) reported that we have not performed the right experiments to address Dooge's Problem nor to solve the scale problem in hydrology. Decades later, reviews of the state of Land Surface Models (LSM) revealed that the source codes of LSMs tend to have up to hundreds of ``hidden'' parameters, many of them exhibiting large sensitivity to key fluxes and state variables like evapotranspiration, streamflow and soil moisture [3, 4]. Most of these parameters have a physical meaning, but often they are calibrated or provided to the models as inputs from look-up tables. These practices have undesirable implications such as overparameterization, lack of transferability across time, space or resolution, artifact generation, and biased predictions [5].

LSMs are currently used for high or hyper-resolution hydrological simulations that are the core of global monitoring or seasonal forecasting systems or providing boundary conditions (state variables) and land surface fluxes to GCMs. In a few years, they will become one of the main modules of existing efforts towards Digital Twins of the Earth's water cycle. Consequently, it is time to find better solutions for the old Dooge's Problem.

The parameterization of a LSM is an ill-posed problem leading to equifinal solutions [6]. Brute force calibration using only streamflow leads to non-transferable solutions [7]. An alternative approach is to use regularisation techniques (e.g., transfer functions) to reduce the degrees of freedom together with scaling operators to estimate effective parameters at the target resolution of the LSM. Multiscale Paramater Regionalization (MPR) [8] is one possible solution following this approach. Recent research have determined that the equifinality of transfer-functions and the corresponding parameters is very large [9].

In this study, we will report new attempts to find constraints in the functional space of the transfer functions and parameters that lead to physically plausible parameter fields for the mHM and HTESSEL models, both of which are used operationally across Europe and are part of the ULYSSES project (C3S) [10]. We will start by creating a catalog of existing pedo-transfer functions (PTF) for typical physical soil parameters such as soil porosity, hydrological conductivity, field capacity among others. Using the MPR stand-alone, model agnostic tool [11] we will perform a simplified sensitivity analysis to determine limiting ranges for the parameters of existing PTFs. The Soil Grids product [12] will be used as a reference to benchmark for the different PTFs.

References

[1] Dooge, J. in Eagleson, P., Cambridge University Press, new York, N.Y., 243–288, 1982
[2] Wood, E. (Ed.): Land Surface, atmosphere interactions for climate modelling: observations. models, and analysis, Kluwer, 1990.
[3] Mendoza et al.  2014.  https://doi.org/10.1002/2014WR015820
[4] Cuntz et al.  2016. https://doi.org/10.1002/2016JD025097
[5] Samaniego et al. 2017.  https://doi.org/10.5194/hess-21-4323-2017
[6] Beven, K., 1993. https://doi.org/10.1016/0309-1708(93)90028-E
[7] Rakovec et al. 2016. https://doi.org/10.1175/JHM-D-15-0054.1
[8] Samaniego et al. WRR 2010a. doi.org/10.1029/2008WR007327
[9] Feigl et al. WRR 2021. https://doi.org/10.1029/2020WR027385
[10] www.ufz.de/ulysses
[11] Schweppe et al. GMD 2021. https://doi.org/10.5194/gmd-2021-103
[12] soilgrids.org


How to cite: Samaniego, L., Mai, J., Schweppe, R., and Thober, S.: On advances and opportunities in estimating effective parameters for  land surface models, EGU General Assembly 2023, Vienna, Austria, 23–28 Apr 2023, EGU23-7147, https://doi.org/10.5194/egusphere-egu23-7147, 2023.

EGU23-7421 | ECS | Orals | HS2.5.1

Coupling a global glacier model with a global hydrological model - benefits, challenges and limitations 

Sarah Hanus, Lilian Schuster, Peter Burek, Fabien Maussion, Jan Seibert, Ben Marzeion, Yoshihide Wada, and Daniel Viviroli

Glaciers are present in many large river basins and influence runoff variations considerably in many mountain areas. Due to climate change, annual runoff volumes originating from glaciers and the glacial melt seasonality are undergoing considerable changes. These changes can affect water availability in basins with glacier cover. Nevertheless, glaciers have been largely neglected in large-scale hydrological models so far, which is a crucial limitation in global climate impact studies on water resources.

To include glacier runoff in large-scale hydrological studies, we have coupled two open-source and well-documented models: a global glacier model (OGGM, Maussion et al., 2019) and a large-scale hydrological model (CWatM, Burek et al., 2020). The coupling offers an explicit inclusion of glacier runoff in large-scale hydrological modeling, and thanks to the dynamic modelling of glaciers, changes in glacier area and volume are explictly considered.

The coupling has been evaluated for selected large river basins, namely the Rhine, Rhone, Fraser and Gloma basins on 5arcmin resolution (~9km) and globally on 30arcmin (~50km) resolution, and differences in simulation results with and without coupling have been assessed. Simulations were run for the recent past (1990–2019) and for two scenarios (SSP1-2.6, SSP5-8.5) for the 21st century.

Including glaciers explicitly in climate impact modelling of large river basins simulates larger future changes in summer discharge. Therefore, it is especially important to include glaciers in studies focusing on changes in summer water availability and its impacts. For the recent past, the contribution of glaciers to discharge at downstream stations of the selected river basins ranges from 7 to 37% for one month and between 2 and 8% annually. For the period 2070–2099, the projected contribution of glaciers drastically decreases to 2 to 13% for one month and 0.2 to 1.3% annually even under the low-emission scenario.

Issues to tackle during the model coupling include precipitation data correction, different spatial and temporal resolutions in the models,  different snow process representations, and the model calibration.

Here, we give an overview of the benefits, challenges and limitations of coupling a global glacier model with a global hydrological model and focus on future discharge projections in large river basins.


References

Burek, P., Satoh, Y., Kahil, T., Tang, T., Greve, P., Smilovic, M., Guillaumot, L., Zhao, F., and Wada, Y.: Development of the Community Water Model (CWatM v1.04) – a high-resolution hydrological model for global and regional assessment of integrated water resources management, Geosci. Model Dev., 13, 3267–3298, https://doi.org/10.5194/gmd-13-3267-2020, 2020.

Maussion, F., Butenko, A., Champollion, N., Dusch, M., Eis, J., Fourteau, K. et al..: The Open Global Glacier Model (OGGM) v1.1, Geosci. Model Dev., 12, 909–931, https://doi.org/10.5194/gmd-12-909-2019, 2019.

How to cite: Hanus, S., Schuster, L., Burek, P., Maussion, F., Seibert, J., Marzeion, B., Wada, Y., and Viviroli, D.: Coupling a global glacier model with a global hydrological model - benefits, challenges and limitations, EGU General Assembly 2023, Vienna, Austria, 23–28 Apr 2023, EGU23-7421, https://doi.org/10.5194/egusphere-egu23-7421, 2023.

EGU23-7440 | ECS | Posters on site | HS2.5.1

Baseline data as source of uncertainty in large-scale hydrology - a case study 

Jenny Kupzig and Martina Flörke

Global hydrological models (GHMs) supply key information for international stakeholders and policymakers, simulating the impacts of the water cycle associated with climate change. Uncertainty in simulation, e.g., linked to climate models, model structure and parameters, jeopardizes valuable decision support. Various scenario data sets have been used, and model‑intercomparison studies have been performed in climate change studies to account for uncertainty linked to climate models and model structure, respectively (Kundzewicz et al., 2018). However, uncertainty in baseline data, used (1) for parameter adjustment of GHMs, and (2) assessment of relative changes in future, has rarely been addressed. Here we show that neglecting the uncertainty related to baseline data can mislead decision-making when assessing the impacts of climate change. We found that three different calibrated versions of the GHM WaterGAP3 (using three different sources of baseline data, namely EWEMBI2b, E-OBS and German Weather Service) reveal contradicting results regarding future streamflow for the German part of the Danube basin. Whereas one data set shows a decreasing 90th percentile of streamflow, indicating less heavy flood occurrence, the other datasets show an increasing 90th percentile of streamflow, indicating the opposite. Although the impact of baseline data (and consecutive parameter estimation) is already present at the mesoscale (Remesan & Holman, 2015), it is often overlooked in climate change studies using GHMs. Our results demonstrate that the choice of baseline data must be considered a source of uncertainty for climate change studies using calibrated GHMs. We anticipate that our study will increase awareness of baseline data's importance and contribute to valuable decision support for international policy related to floods, drought, and human water management.

How to cite: Kupzig, J. and Flörke, M.: Baseline data as source of uncertainty in large-scale hydrology - a case study, EGU General Assembly 2023, Vienna, Austria, 23–28 Apr 2023, EGU23-7440, https://doi.org/10.5194/egusphere-egu23-7440, 2023.

High-resolution continental scale hydrological modelling often requires distributed computing to solve the model equations. Developing and maintaining these models is an enormous challenge as current approaches require knowledge about parallel and distributed computing. A solution to the problem followed here is the development of a modelling framework that deals with parallelization of model equations under the hood. Using such a framework allows hydrologists who are not familiar with low level software development and high-performance computing to develop models.

Our modelling framework, called LUE (de Jong et al. 2022, 2021), allows models that are large in terms of data set size and the number of calculations used, to use all hardware available to them efficiently. LUE models can be written in Python or C++, and can be executed unchanged on laptops and computer clusters.

In the implementation of LUE model operations we use the asynchronous many-tasks (AMT) approach, as implemented in the HPX C++ library. This makes it possible for model developers to express their models using simple algebraic expressions, while all details related to scheduling computations on parallel and distributed hardware are hidden from view. Executing LUE models results in a relative large collection of tasks that are ready to be scheduled for execution on the available hardware. This, in turn, results in models that are finished sooner and that can use additional hardware efficiently, automatically.

We are currently busy porting the PyCatch modelling suite (Lana-Renault and Karssenberg 2013), which is an integrated set of process-based hydrological and soil-vegetation models, to LUE. PyCatch is implemented in terms of generic modelling operations inspired by map algebra (local, focal, zonal, global operations) and flow routing operations like flow accumulation and the kinematic wave.

In our presentation we will further explain the LUE modelling framework, including the operations that are specifically targeted at hydrological modelling, and show results of applying the PyCatch model to Africa at 3 arc-second resolution (~90 m at the equator) using the MERIT Hydro high resolution raster data set.

References
de Jong, K., D. Panja, D. Karssenberg, and M. van Kreveld. 2022. “Scalability and Composability of Flow Accumulation Algorithms Based on Asynchronous
Many-Tasks.” Computers & Geosciences. https://doi.org/10.1016/j.cageo.2022.105083.
de Jong, K., D. Panja, M. van Kreveld, and D. Karssenberg. 2021. “An Environmental Modelling Framework Based on Asynchronous Many-Tasks: Scalability and Usability.” Environmental Modelling & Software. https://doi.org/10.1016/j.envsoft.2021.104998.
Lana-Renault, N., and D. Karssenberg. 2013. “PyCatch: Component Based Hydrological Catchment Modelling.” Cuadernos de Investigación Geográfa. https://doi.org/10.18172/cig.1993.

How to cite: de Jong, K. and Karssenberg, D.: The LUE software framework: develop scalable global hydrological models without having to think about high-performance computing, EGU General Assembly 2023, Vienna, Austria, 23–28 Apr 2023, EGU23-7717, https://doi.org/10.5194/egusphere-egu23-7717, 2023.

EGU23-9545 | ECS | Orals | HS2.5.1

HYPE model workflow – a “bottom-up” approach to community large-domain hydrological modelling 

Dayal Wijayarathne, Kasra Keshavarz, Tricia Stadnyk, Alain Pietroniro, Martyn Clark, and Wouter Knoben

Large-domain hydrological modelling is vital to understand and predict water resources under a changing climate. Here we summarize our efforts to develop a model configuration workflow for the Hydrological Predictions for the Environment (HYPE) model as a proof-of-concept of a “bottom-up” approach to community large-scale hydrological modelling. The initiative of Community Workflows to Advance Reproducibility in Hydrologic Modeling (CWARHM, Knoben et al. 2022) provides a blueprint of a hydrological modelling workflow, separating the model-agnostic and model-specific pre-processing tasks. We extend the CWARHM blueprint to establish an open-source and automated HYPE workflow by adding processing codes to generate geospatial fabric, climate forcing, and parametrization.

Our primary contribution is to generalize and automate the HYPE workflow to improve the reproducibility of hydrologic experiments. In this research, numerous global geographic, physiographic, and climatic datasets, covering various spatiotemporal scales are used to develop a geospatial fabric and climate forcing for the HYPE model, using the Bow River watershed in Alberta, Canada as a test case. The geographic and physiographic data are obtained through the “gistool” (https://github.com/kasra-keshavarz/gistool), while climate forcing is obtained using the “datatool” (https://github.com/kasra-keshavarz/datatool). Independent of the data source, these tools provide physiographic attributes and meteorological time series as catchment averaged quantities, enabling semi-distributed hydrological modelling with HYPE. The preliminary analysis shows that the HYPE workflow has successfully separated the model-agnostic and model-specific parts of the model workflow. It substantially reduces manual work in preparing model geospatial fabric and input datasets, saving more time for hydrological analysis. This workflow will support developing probabilistic streamflow using different input datasets and will be upgraded to create a HYPE model instantiation for the entire North American domain.

Reference: Knoben, W. J. M., Clark, M. P., Bales, J., Bennett, A., Gharari, S., Marsh, C. B., et al. (2022). Community Workflows to Advance Reproducibility in Hydrologic Modeling: Separating model-agnostic and model-specific configuration steps in applications of large-domain hydrologic models. Water Resources Research, 58, e2021WR031753. https://doi. org/10.1029/2021WR031753

How to cite: Wijayarathne, D., Keshavarz, K., Stadnyk, T., Pietroniro, A., Clark, M., and Knoben, W.: HYPE model workflow – a “bottom-up” approach to community large-domain hydrological modelling, EGU General Assembly 2023, Vienna, Austria, 23–28 Apr 2023, EGU23-9545, https://doi.org/10.5194/egusphere-egu23-9545, 2023.

EGU23-10464 | Orals | HS2.5.1

Combined impacts of climate and land-use change on future water resources in Africa 

Celray James Chawanda, Albert Nkwasa, Wim Thiery, and Ann van Griensven

Africa depends on its water resources for hydroelectricity, inland fisheries, and water supply for domestic, industrial, and agricultural operations. Anthropogenic climate change (CC) has changed the state of these water resources. Land use and land cover has also undergone significant changes due to the need to provide resources to a growing population. Yet, the impact of the Land Use and Land Cover Change (LULCC) in addition to CC on the water resources of Africa is underexplored. Here we investigate how precipitation, evapotranspiration (ET), and river-flow respond to both CC and LULCC scenarios across the entire African continent. We set up a SWAT+ model for Africa and calibrated it using the Hydrological Mass Balance calibration (HMBC) methodology detailed in Chawanda et. al., (2020). The model was subsequently driven by an ensemble of bias-adjusted global climate models to simulate the hydrological cycle under a range of CC and LULCC scenarios. The results indicate that the Zambezi and the Congo River basins are likely to experience reduced river flows under CC by up to 7% decrease, while the Limpopo will likely have higher river flows. The Niger River basin is likely to experience the largest decrease in river flows in all of Africa due to CC. The Congo River basin has the largest difference in river flows between scenarios with (over 18%% increase) and without LULCC (over 20% decrease). The projected changes have implications on agriculture and energy sectors and hence the livelihood of people on the continent. Our results highlight the need to adopt policies to halt global greenhouse gas emissions and to combat the current trend of deforestation to avoid the high combined impact of CC and LULCC on water resources in Africa.

How to cite: Chawanda, C. J., Nkwasa, A., Thiery, W., and van Griensven, A.: Combined impacts of climate and land-use change on future water resources in Africa, EGU General Assembly 2023, Vienna, Austria, 23–28 Apr 2023, EGU23-10464, https://doi.org/10.5194/egusphere-egu23-10464, 2023.

EGU23-11095 | ECS | Orals | HS2.5.1 | Highlight

Towards better identification of dominant controls in Earth system data 

Robert Reinecke, Francesca Pianosi, and Thorsten Wagener

We are in a state of simultaneous exuberance and starvation of Earth system data. Model ensembles of increasing complexity provide petabytes of output, while remote sensing products offer terabytes of new data every day. On the other hand, we lack data on processes that are more challenging to observe, like groundwater recharge, or have data heavily impacted by un-quantified anthropogenic change. These problems leave us with highly imbalanced datasets.

Our ability to produce and collect mountains of data contrasts with our progress in improving scientific process understanding. How can we harness simulated and observed data alike to enhance our knowledge and test scientific hypotheses about process relationships given poorly known uncertainties? Our contribution discusses methods to approach this problem while being agnostic to the data source (model or observation). We introduce a new strategy that allows us to interrogate given datasets to identify correlational and possibly causal relationships between the variables included. We test the method on an ensemble of complex global hydrological models and observations to demonstrate its usefulness and limitations, i.e., from the ISIMIP experiments. We show that our approach can provide powerful insights into dominant process controls while scaling with large amounts of data.

How to cite: Reinecke, R., Pianosi, F., and Wagener, T.: Towards better identification of dominant controls in Earth system data, EGU General Assembly 2023, Vienna, Austria, 23–28 Apr 2023, EGU23-11095, https://doi.org/10.5194/egusphere-egu23-11095, 2023.

EGU23-11245 | ECS | Posters on site | HS2.5.1

Multi-variable Pareto optimal calibration of the global hydrological model WaterGAP for 1500 major drainage basins around the globe 

HM Mehedi Hasan, Seyed-Mohammad Hosseini-Moghari, Petra Döll, and Andreas Güntner

Global hydrological models (GHM) are indispensable tools for understanding hydrological dynamics in natural settings as well as for analysing complex hydrological human-nature systems in critical regions of the globe and for supporting sustainable management policies in current context and future climate change scenarios. However, GHMs suffer from high predictive uncertainties which stem from input data and climate forcing uncertainties, incomplete knowledge about hydrological processes and their imprecise mathematical description, unknown initial and boundary conditions, and uncertain parameters. Reduction of these uncertainty by model calibration has almost never been performed globally for any GHM due to the high number of parameters in these models, the limited availability of observations of critical hydrological variables at a scale suitable for these models, and the high computational complexity and demand of model calibration. To address these issues, we have developed and employed a parallel and scalable multi-criterial Pareto optimal calibration framework to estimate parameters of the state-of-the-art global hydrological model WaterGAP for 1509 drainage basins with available streamflow observations. Model calibration was done against gauge-based observations of streamflow (Q) and terrestrial water storage anomalies of GRACE/GRACE-FO (TWSA). The influential parameters of each basin were identified prior to calibration by a multi-variable sensitivity analysis for the variables Q, TWSA, and percentage snow cover in the case of basins with relevant snow accumulation. We expect that our study will advance methodologies for sensitivity and calibration analyses of GHMs.

How to cite: Hasan, H. M., Hosseini-Moghari, S.-M., Döll, P., and Güntner, A.: Multi-variable Pareto optimal calibration of the global hydrological model WaterGAP for 1500 major drainage basins around the globe, EGU General Assembly 2023, Vienna, Austria, 23–28 Apr 2023, EGU23-11245, https://doi.org/10.5194/egusphere-egu23-11245, 2023.

EGU23-11733 | ECS | Orals | HS2.5.1

Calibration of a global hydrological model while simultaneously assimilating satellite-derived total water storage anomalies and in-situ streamflow observations 

Kerstin Schulze, Helena Gerdener, Olga Engels, Jürgen Kusche, and Petra Döll

Global hydrological models simulate water storages and fluxes of the water cycle, which is important for e.g. drought and flood predictions. However, model simulations are underlying uncertainties due to the inputs (e.g. climate forcing data), parameters, and model assumptions, resulting in disagreements with observations. To reduce these uncertainties, models are often calibrated against in-situ streamflow observations or compared against total water storage anomalies (TWSA) derived from the Gravity Recovery And Climate Experiment (GRACE) satellite mission. In recent years, TWSA data are integrated into some models via data assimilation.

In this study, we jointly assimilated TWSA and streamflow observations into the WaterGAP Global Hydrology Model (WGHM) applying an Ensemble Kalman Filter. Simultaneously, model parameters are calibrated via state vector augmentation. Our simultaneous calibration and assimilation (CDA) approach was tested within the Mississippi River Basin from 2003 to 2016.

First, we evaluated how the spatial resolution and study set up impact our CDA approach. Our results suggest that applying the CDA approach sequentially to all subbasins works better than applying the approach once to the entire Mississippi River Basin. Second, we compared the results of our CDA approach against uncalibrated model simulations as well as the results of the WGHM standard calibration. The CDA approach led to higher Nash-Sutcliffe efficiency (NSE) and lower root mean square error (RMSE) values (and thus a better agreement with the observations) regarding TWSA and streamflow than the uncalibrated WGHM simulations, which is in line with our expectations. In addition, it also resulted in higher NSE and lower RMSE values than the WGHM standard calibration in most subbasins. This was expected for the metrics regarding TWSA. Our expectations regarding the streamflow results were more complex: On one hand, our findings were surprising since the WGHM standard calibration approach is based on streamflow observations only and takes significantly more streamflow stations into account than the CDA approach. On the other hand, the results reflected that less parameters are calibrated and only the long-term averages of the streamflow observations are considered in the WGHM standard calibration approach.

How to cite: Schulze, K., Gerdener, H., Engels, O., Kusche, J., and Döll, P.: Calibration of a global hydrological model while simultaneously assimilating satellite-derived total water storage anomalies and in-situ streamflow observations, EGU General Assembly 2023, Vienna, Austria, 23–28 Apr 2023, EGU23-11733, https://doi.org/10.5194/egusphere-egu23-11733, 2023.

EGU23-14636 | ECS | Orals | HS2.5.1

Evaluation of a high-resolution high-performance routing scheme for regional to global scale applications within Earth System Models 

Deniz Kilic, Yann Meurdesoif, Agnès Ducharne, Jan Polcher, and Josefine Ghattas

River routing is a critical component of land surface models (LSMs), as it plays a significant role in the closure of the water balance at global scale, linking the estimation of river discharge to the one of sea level. The estimation of river discharge within LSMs also enables researchers to use widely available discharge observations to evaluate their models, and to study the human impact on discharge. However, river discharge calculation is often simplified in continental to global scale applications, as topography varies at a much smaller scale than the one of LSM grid-scales, which requires sub-grid parameterizations.

In this study, we present a revision of the current routing module of the ORCHIDEE LSM (Nguyen-Quang et al., 2018) that aims to improve the accuracy of discharge estimation in an agile way. We propose a simple, parallelized, conservative routing module that is based on principal flow directions at the digital elevation model (DEM) scale and independent of the LSM grid cell, enabling the use of routing maps at various resolutions. The influence of topography is factored in by the topographic index, i.e. a product of slope and pixel length in each routing cell. The routing can be solved directly on DEM native grid using conservative interpolations of run-off and drainage computed from LSM. To reduce the computational cost, we developed an upscaling method by aggregating DEM pixels into irregular hydrological transfer units (HTUs), which respect the basin hierarchy by construction, therefore making the computation of effective topographic index straightforward, and which is constrained by validity of the numerical stability criteria. This upscaling method drastically reduces the computational cost, by a factor depending on the targeted resolution, without compromising the discharge estimation.

We test this new routing module via offline simulations, to evaluate the discharge within 10 of the world's largest river basins, at the outlet and in upstream sub-catchments. To this end we use a 2km version of the MERIT global DEM to derive information on flow direction, slope and pixel length; and the GRDC global river discharge observation dataset to evaluate the simulated river discharge. First, using the routing at the DEM pixel scale, we will tune the lag time of reservoirs to improve the discharge estimation. Then, we will test the stability of performances when upscaling the routing over a range of HTU lengths. This work is pivotal for the use of ORCHIDEE and its routing scale at various spatial scales, either off-line or coupled to the IPSL climate model, especially with its scalable atmospheric dynamical core, which is based on a quasi-uniform icosahedral-hexagonal mesh, and can be used for both global or limited-area simulations (Dubos et al., 2015).

References:

Dubos, T., Dubey, S., Tort, M., Mittal, R., Meurdesoif, Y., and Hourdin, F.: DYNAMICO-1.0, an icosahedral hydrostatic dynamical core designed for consistency and versatility, Geosci. Model Dev., 8, 3131–3150, https://doi.org/10.5194/gmd-8-3131-2015, 2015.

Nguyen-Quang, T., Polcher, J., Ducharne, A., Arsouze, T., Zhou, X., Schneider, A., and Fita, L.: ORCHIDEE-ROUTING: revising the river routing scheme using a high-resolution hydrological database, Geosci. Model Dev., 11(12), 4965-4985, https://doi.org/10.5194/gmd-11-4965-2018, 2018.

How to cite: Kilic, D., Meurdesoif, Y., Ducharne, A., Polcher, J., and Ghattas, J.: Evaluation of a high-resolution high-performance routing scheme for regional to global scale applications within Earth System Models, EGU General Assembly 2023, Vienna, Austria, 23–28 Apr 2023, EGU23-14636, https://doi.org/10.5194/egusphere-egu23-14636, 2023.

EGU23-14715 | Orals | HS2.5.1 | Highlight

Contrasting changes in extreme rainfall and river flow as global mean temperature increases 

Nans Addor, Natalie Lord, Pete Uhe, Niall Quinn, Oliver Wing, and Chris Sampson

Air can hold more moisture as temperature increases, leading to more extreme rainfall events. Yet, this does not necessarily result in larger river floods. Here we use model projections to explore differences in the response of the atmosphere and catchments to an increase in global mean temperature. For both extreme rainfall and flow, we compute relative changes per °C, often called change factors (CFs) or scaling factors. Unlike some other studies, the multidecadal temperature mean is used instead of the temperature during the extreme event. This allows us to use CFs to produce maps of future changes for any emission scenario and future period.

We relied on rainfall projected by 4 high-resolution GCMs from CMIP6 HighResMIP post-processed using 3 levels spatial smoothing (low to high smoothing). We also used hydrological simulations from 3 global hydrological models (GHMs) forced by 4 GCMs and produced as part of the ISIMIP2b project. We computed changes in the median of annual maxima based on periods of 31 years on 0.25° (HighResMIP) and 0.5° (ISIMIP2b) global grids. Working with two 12-member ensembles enables us to assess uncertainties in future changes.

We found that whilst extreme rainfall is projected to increase over 87% of the land area (ensemble median), only 69% of the land area is projected to show an increase in extreme flow magnitude. Importantly, while there is high model agreement (at least ¾ of the models agree) that extreme rainfall will increase over 76% of the land area, high agreement that future flows will increase is only found over 40% of the land area. We show that these discrepancies are caused by changes in soil moisture and snow pack projected by the GHMs, highlighting the importance of river flood drivers other than extreme rainfall.

How to cite: Addor, N., Lord, N., Uhe, P., Quinn, N., Wing, O., and Sampson, C.: Contrasting changes in extreme rainfall and river flow as global mean temperature increases, EGU General Assembly 2023, Vienna, Austria, 23–28 Apr 2023, EGU23-14715, https://doi.org/10.5194/egusphere-egu23-14715, 2023.

EGU23-14953 | ECS | Orals | HS2.5.1

CMIP6 multi-model projections of the groundwater response to climate change during the 21st century 

Maya Costantini, Jeanne Colin, and Bertrand Decharme

Climate change will impact every component of the climate system and water cycle. It does not spare groundwater which account for approximately one third of the human fresh water withdrawals. The combined effect of climate change and groundwater pumping could lead to water scarcity and food insecurity in some regions. Therefore, it is essential to study the groundwater response to climate change to improve the development of adaptation and mitigation plans in water management.

Here, we analyze the response of groundwater recharge to climate change using an ensemble of simulations runs with 22 fully coupled ocean-atmosphere-land models participating to the CMIP6 exercise. They are run from 1850 to 2100 and follow four of the latest IPCC scenarios of greenhouse gas future evolution. This analysis is supplemented with the assessment of the climate-driven response of groundwater level given by the CNRM global climate models (which are part of the CMIP6 exercise). These models represent the hydrogeological processes involving groundwater, including the two-way water exchanges with rivers and the unsaturated soil, the lateral groundwater fluxes, and the interactions with the atmosphere. Results show that on global average, groundwater recharge is expected to increase with climate change. The changes in groundwater recharge follow those of precipitation and, to a lesser extent, evapotranspiration and thus follow the same regional patterns.

As these CMIP6 models do not represent human groundwater withdrawals, the projected changes in recharge are somewhat optimistic and could be out of step in regions with strong groundwater pumping. To address this limitation, results are put in perspective with projections of water withdrawals following the CMIP6 experiments. This analysis shows the combined effects of climate change and groundwater pumping on groundwater and help to understand the evolution of the future large scale water resource.

How to cite: Costantini, M., Colin, J., and Decharme, B.: CMIP6 multi-model projections of the groundwater response to climate change during the 21st century, EGU General Assembly 2023, Vienna, Austria, 23–28 Apr 2023, EGU23-14953, https://doi.org/10.5194/egusphere-egu23-14953, 2023.

EGU23-15182 | ECS | Orals | HS2.5.1

Improved hydrologic conditioning of the TanDEM-X dataset for HydroSHEDS v2 

Leena Warmedinger, Martin Huber, Carolin Walper, Mira Anand, Bernhard Lehner, Michele Thieme, and Achim Roth

HydroSHEDS is a well-established database containing global hydrographic information. Although being widely used, the SRTM-based version 1 of HydroSHEDS has important limitations, in particular in areas above 60° N latitude. The coverage of this region is of low quality because no underpinning SRTM elevation data were available. As most hydrological models require topographic information and hydrographic data in terms of stream networks or catchment boundaries, the increased availability of accurate remote sensing data promotes the development of a second and refined version of the HydroSHEDS database. For this reason, HydroSHEDS v2 is currently created in collaboration between the German Aerospace Center (DLR), McGill University, Confluvio Consulting and the World Wildlife Fund. Foundation of HydroSHEDS v2 is the digital elevation model (DEM) of the TanDEM-X mission (TerraSAR-X add-on for Digital Elevation Measurement). This 0.4 arc-second resolution DEM with global coverage of land surfaces was created in partnership between DLR and Airbus Defence and Space. Enhanced pre-processing techniques are applied to preserve details of the high-resolution DEM in its hydrologically conditioned version. These pre-processing steps include an infill of invalid and unreliable elevation values, an automatic coastline delineation refined with manual corrections, an AI-based water detection algorithm, and a modification of elevation data in urban and vegetated areas for improved evaluation of the flow of water. Additionally, experiences and preliminary results from processing the water body mask at global scale are outlined. The hydrologically pre-conditioned DEM and the water body mask derived from the TanDEM-X dataset are in the subsequent steps further processed with refined hydrological optimization and correction algorithms to derive flow direction and flow accumulation maps. These gridded datasets are the core products of HydroSHEDS v2 and will be complemented with secondary information on river networks, lake shorelines, catchment boundaries, and their hydro-environmental attributes in vector format. The main release of HydroSHEDS v2 is scheduled for 2023 under a free license.

How to cite: Warmedinger, L., Huber, M., Walper, C., Anand, M., Lehner, B., Thieme, M., and Roth, A.: Improved hydrologic conditioning of the TanDEM-X dataset for HydroSHEDS v2, EGU General Assembly 2023, Vienna, Austria, 23–28 Apr 2023, EGU23-15182, https://doi.org/10.5194/egusphere-egu23-15182, 2023.

EGU23-16071 | Posters on site | HS2.5.1

Development of a national-scale VIC hydrological model to project future changes of the water resources of the Philippines 

Johanna Scheidegger, Christopher Jackson, Andrew Barkwith, Lei Wang, and Maria Aileen Guzman

We applied a version of the macro-scale hydrological model VIC, into which we incorporated a 2D lateral groundwater flow model, to simulate the hydrology of the Philippines. We used global data sets to parameterise the model, which uses a ~1km grid to represent each of the country’s islands; global meteorological driving data were downscaled to this resolution. The model was calibrated over the historical period (1990-2019) against available observed river flow time-series by adjusting soil, aquifer, and riverbed hydraulic properties; Nash-Sutcliffe Efficiency scores of up to 0.53 were obtained. We applied projections of future climate for the 2050s and 2070s derived from global climate simulations undertaken by the UK Meteorological Office’s Hadley Centre – the UKCP18 projections – considering two greenhouse gas concentration pathways: RCP2.6 and RCP8.5. Projected future reductions in precipitation translate into decreases in surface runoff, groundwater recharge, and river baseflow, on average, but the simulations highlight regional differences in groundwater and surface water availability over both the historical and future periods.

How to cite: Scheidegger, J., Jackson, C., Barkwith, A., Wang, L., and Guzman, M. A.: Development of a national-scale VIC hydrological model to project future changes of the water resources of the Philippines, EGU General Assembly 2023, Vienna, Austria, 23–28 Apr 2023, EGU23-16071, https://doi.org/10.5194/egusphere-egu23-16071, 2023.

EGU23-1549 | PICO | HS2.5.2

Amazonian terrestrial water balance inferred from satellite-observed water vapor isotopes 

John Worden, Mingjie Shi, and Adriana Bailey

Atmospheric humidity and soil moisture in the Amazon forest are tightly coupled to the region’s water balance, or the difference between two moisture fluxes, evapotranspiration minus precipitation (ET-P). However, large and poorly characterized uncertainties in both fluxes, and in their difference, make it challenging to evaluate spatiotemporal variations of water balance and its dependence on ET or P. Here, we show that satellite observations of the HDO/H 2O ratio of water vapor are sensitive to spatiotemporal variations of ET-P over the Amazon. When calibrated by basin-scale and mass-balance estimates of ET-P derived from terrestrial water storage and river discharge measurements, the isotopic data demonstrate that rainfall controls wet Amazon water balance variability, but ET becomes important in regulating water balance and its variability in the dry Amazon. Changes in the drivers of ET, such as above ground biomass, could therefore have a larger impact on soil moisture and humidity in the dry (southern and eastern) Amazon relative to the wet Amazon. 

How to cite: Worden, J., Shi, M., and Bailey, A.: Amazonian terrestrial water balance inferred from satellite-observed water vapor isotopes, EGU General Assembly 2023, Vienna, Austria, 23–28 Apr 2023, EGU23-1549, https://doi.org/10.5194/egusphere-egu23-1549, 2023.

EGU23-1822 | ECS | PICO | HS2.5.2

Error Characterization and Multi-source Merging of Global Land Evapotranspiration Products: Collocation-based approach 

Changming Li, Hanbo Yang, Wencong Yang, and Ziwei Liu

Evapotranspiration (ET) is one of the key elements linking Earth’s water-carbon system. Accurate estimation of global land evapotranspiration is essential for understanding land-atmosphere interactions under a changing climate. Past decades have witnessed the generation of various ET products. However, due to a lack of observations at the global scale, inherent uncertainties limit the direct use of these data. Here, the aims of our study were as follows: (1) to employ collocation analysis methods, including single and double instrumental variable algorithms (IVS/IVD), triple collocation (TC), quadruple collocation (QC), and extended double instrumental variable algorithms (EIVD) to evaluate five widely used ET products at 0.1° and 0.25° resolutions over daily and 8-day frequencies, including ERA5, FLUXCOM, PMLV2, GLDAS, and GLEAM; (2) to design and validate a collocation-based method for ET merging and generate a long-term (1980-2022) ET product at 0.1°-8Daily and 0.25°-Daily resolutions and evaluate the performance against 68 global flux tower observations. Our results demonstrated that: (1) collocation analysis methods could be reliable tools to serve as alternatives for tower observations at the global scale, which could be helpful for further data assimilation and merging; (2) the merged product performed well over different vegetation types with Correlation of Determination () of 0.65, and 0.61 and root mean square errors () of 0.94 and 1.22 mm/d on average over 0.1° and 0.25°.

How to cite: Li, C., Yang, H., Yang, W., and Liu, Z.: Error Characterization and Multi-source Merging of Global Land Evapotranspiration Products: Collocation-based approach, EGU General Assembly 2023, Vienna, Austria, 23–28 Apr 2023, EGU23-1822, https://doi.org/10.5194/egusphere-egu23-1822, 2023.

EGU23-2246 | PICO | HS2.5.2

MSWX: Global 3-Hourly 0.1° Bias-Corrected Meteorological Data Including Near-Real-Time Updates and Forecast Ensembles 

Hylke Beck, Albert van Dijk, Pablo Larraondo, Tim McVicar, Ming Pan, Emanuel Dutra, and Diego Miralles

We present Multi-Source Weather (MSWX), a seamless global gridded near-surface meteorological product featuring a high 3-hourly 0.1° resolution, near-real-time updates (∼3-h latency), and bias-corrected medium-range (up to 10 days) and long-range (up to 7 months) forecast ensembles. The product includes 10 meteorological variables: precipitation, air temperature, daily minimum and maximum air temperature, surface pressure, relative and specific humidity, wind speed, and downward shortwave and longwave radiation. The historical part of the record starts 1 January 1979 and is based on ERA5 data bias corrected and downscaled using high-resolution reference climatologies. The data extension to within ∼3 h of real time is based on analysis data from GDAS. The 30-member medium-range forecast ensemble is based on GEFS and updated daily. Finally, the 51-member long-range forecast ensemble is based on SEAS5 and updated monthly. The near-real-time and forecast data are statistically harmonized using running-mean and cumulative distribution function-matching approaches to obtain a seamless record covering 1 January 1979 to 7 months from now. MSWX presents new and unique opportunities for hydrological modeling, climate analysis, impact studies, and monitoring and forecasting of droughts, floods, and heatwaves (within the bounds of the caveats and limitations discussed herein). The product is available at www.gloh2o.org/mswx.

How to cite: Beck, H., van Dijk, A., Larraondo, P., McVicar, T., Pan, M., Dutra, E., and Miralles, D.: MSWX: Global 3-Hourly 0.1° Bias-Corrected Meteorological Data Including Near-Real-Time Updates and Forecast Ensembles, EGU General Assembly 2023, Vienna, Austria, 23–28 Apr 2023, EGU23-2246, https://doi.org/10.5194/egusphere-egu23-2246, 2023.

EGU23-2748 | ECS | PICO | HS2.5.2

On the estimation of potential evaporation under wet and dry conditions 

Zhuoyi Tu and Yuting Yang

Potential evaporation (EP) is an important concept that has been extensively used in hydrology, climate, agriculture and many other relevant fields. However, EP estimates using conventional approaches generally do not conform with the underlying idea of EP, since meteorological forcing variables observed under real conditions are not necessarily equivalent to those over a hypothetical surface with an unlimited water supply. Here, we estimate EP using a recently developed ocean surface evaporation model (i.e., the maximum evaporation model) that explicitly acknowledges the inter-dependence between evaporation, surface temperature (Ts) and radiation such that is able to recover radiation and Ts to a hypothetical wet surface. We first test the maximum evaporation model over land by validating its evaporation estimates with evaporation observations under unstressed conditions at 86 flux sites and found an overall good performance. We then apply the maximum evaporation model to the entire terrestrial surfaces under both wet and dry conditions to estimate EP. The mean annual (1979-2019) global land EP from the maximum evaporation model (EP_max) is 1272 mm yr-1, which is 11.2% higher than that estimated using the widely adopted Priestley-Taylor model (EP_PT). The difference between EP_max and EP_PT is negligible in humid regions or under wet conditions but becomes increasingly larger as the surface moisture availability decreases. This difference is primarily caused by increased net radiation (Rn) when restoring the dry surfaces to hypothetical wet surfaces, despite a lower Ts obtained under hypothetical wet conditions in the maximum evaporation model.

How to cite: Tu, Z. and Yang, Y.: On the estimation of potential evaporation under wet and dry conditions, EGU General Assembly 2023, Vienna, Austria, 23–28 Apr 2023, EGU23-2748, https://doi.org/10.5194/egusphere-egu23-2748, 2023.

EGU23-2816 | ECS | PICO | HS2.5.2

Root zone soil moisture in over 25 % of global land permanently beyond pre-industrial variability as early as 2050 

En Ning Lai, Lan Wang-Erlandsson, Vili Virkki, Miina Porkka, and Ruud van der Ent

Root-zone soil moisture is a key variable representing water cycle dynamics that strongly interacts with ecohydrological, atmospheric, and biogeochemical processes. Recently, it was proposed as the control variable for the green water planetary boundary, suggesting that widespread and considerable deviations from baseline variability now predispose Earth System functions critical to an agriculture-based civilisation to destabilization. However, the global extent and severity of root-zone soil moisture changes under future scenarios remains to be scrutinized. Here, we analyzed root-zone soil moisture departures from the pre-industrial climate variability for a multi-model ensemble of 14 Earth System Models (ESMs) in the Coupled Model Intercomparison Project Phase 6 (CMIP6) in four climate scenarios as defined by the Shared Socioeconomic Pathways (SSP), SSP1-2.6, SSP2-4.5, SSP3-7.0, and SSP5-8.5, between 2021 and 2100. The analyses were done for 43 ice-free climate reference regions used by the Intergovernmental Panel on Climate Change (IPCC).We defined ‘permanent departures’ when a region’s soil moisture exits the regional variability envelope of the pre-industrial climate and does not fall back into the range covered by the baseline envelope until 2100. Permanent dry departures (i.e. lower soil moisture than pre-industrial variability) were found to be most pronounced in Central America, southern Africa, the Mediterranean region, and most of South America, whereas permanent wet departures are most pronounced in southeastern South America, northern Africa, and southern Asia. In the Mediterranean region, dry permanent departure may have already happened according to some models. By 2100, there is dry permanent departures in theMediterranean in 70%of the ESMs in SSP1-2.6, the most mitigated situation, and more than 90% in SSP3-7.0 and SSP5-8.5, the medium-high and worst-case scenarios. Northeastern Africa is projected to experience wet permanent departures in 64% of the ESMs under SSP1-2.6, and 93% under SSP5-8.5. The percentage of ice-free land area with departures increases in all SSP scenarios as time goes by. Wet departures are more widespread than dry departures throughout the studied timeframe, except in SSP1-2.6. In most regions, the severity of the departures increases with the severity of global warming. In 2050, permanent departures (ensemble median) occur in about 10% of global ice-free land areas in SSP1-2.6, and in 25% in SSP3-7.0. By the end of the 21st century, the occurrence of permanent departures in SSP1-2.6 increases to 34 %, and in SSP3-7.0, 45 %. Our findings underscore the importance of mitigation to avoid further degrading the Earth System functions upheld by soil moisture. An asscociate paper is available as preprint on EGUsphere: https://egusphere.copernicus.org/preprints/2022/egusphere-2022-971/

How to cite: Lai, E. N., Wang-Erlandsson, L., Virkki, V., Porkka, M., and van der Ent, R.: Root zone soil moisture in over 25 % of global land permanently beyond pre-industrial variability as early as 2050, EGU General Assembly 2023, Vienna, Austria, 23–28 Apr 2023, EGU23-2816, https://doi.org/10.5194/egusphere-egu23-2816, 2023.

EGU23-3314 | ECS | PICO | HS2.5.2

Global evaluation of runoff simulation from climate, hydrological and land surface models 

Ying Hou, Hui Guo, Yuting Yang, and Wenbin Liu

Recent advances in global hydrological modeling yield many global runoff datasets that are extensively used in global hydrological analyses. Here, we provide a comprehensive evaluation of simulated runoff from 21 global models, including 12 climate models from CMIP6, six global hydrological models from the Inter-Sectoral Impact Model Inter-Comparison Project (ISMIP2a) and three land surface models from the Global Land Data Assimilation System (GLDAS), against observed streamflow in 840 unimpaired catchments globally. Our results show that (i) no model performs consistently better in estimating runoff from all aspects, and all models tend to perform better in more humid regions and non-cold areas; (ii) the interannual runoff variability is well represented in ISIMIP2a and GLDAS models, and no model performs satisfactorily in capturing the annual runoff trend; (iii) the runoff intra-annual cycle is reasonably captured by all models yet an overestimation of intra-annual variability and an early bias in peak flow timing are commonly found; and (iv) model uncertainty leads to a larger uncertainty in runoff estimates than that induced by forcing uncertainty in ISIMIP2a, and model uncertainty in GLDAS is larger than that in ISIMIP2a. Finally, we confirm that the multi-model ensemble is an effective way to reduce uncertainty in individual models except for CMIP6 regarding mean annual magnitude and annual runoff trend. Overall, our findings suggest that assessments/projections of runoff changes based on these global outputs contain great uncertainties and should be interpreted with caution, and call for more advanced, observation-guided ensemble techniques for better large-scale hydrological applications.

How to cite: Hou, Y., Guo, H., Yang, Y., and Liu, W.: Global evaluation of runoff simulation from climate, hydrological and land surface models, EGU General Assembly 2023, Vienna, Austria, 23–28 Apr 2023, EGU23-3314, https://doi.org/10.5194/egusphere-egu23-3314, 2023.

EGU23-3326 | ECS | PICO | HS2.5.2

Insignificant but overlooked: Evaporative losses from small reservoirs in southern Europe 

Milad Aminzadeh, Noemi Friedrich, Kaveh Madani, and Nima Shokri

The application of agricultural ponds and small engineered impoundments (often < 0.1 km2 area) is growing globally to support livestock, irrigation, and local municipal and industrial demands during dry spells. However, evaporation diminishes the storage efficiency of these popular but often un-inventoried resources. This study provides a reliable framework for estimating global abundance of small reservoirs and associated evaporative hotspots under different climate change scenarios serving as a basis for future water management and planning. To show the applicability of the proposed method and the utility of the insights it provides, we use satellite data to identify spatio-temporal distribution of small reservoirs (~0.001 to 0.1 km2 area) in southern Europe (Italy, Spain, and Portugal) where irrigation heavily depends on water storage in agricultural ponds. While current estimates of evaporative water losses from small reservoirs often rely on pan measurements or Penman-type approaches with locally calibrated heat and mass transfer coefficients, we employ a physically-based model [Aminzadeh et al., 2018] that accounts for inherent reservoir characteristics (e.g., depth and light attenuation), and radiative energy storage within the water body to quantify energy balance and evaporation dynamics from small water reservoirs. Our preliminary results indicate that cumulative area of small reservoirs in the study area has increased from 518 km2 in 2000 to 614 km2 in 2020 (18.5% increase) with cumulative evaporative losses that may exceed 400 Mm3 during warm months (April to September). Although the estimated evaporative water loss looks negligible relative to the annual agricultural water use (< 2%), its significance could be gauged by societal impacts in these regions with chronic water stress problems or the cost of alternate water sources (e.g., desalinated water).

Reference

Aminzadeh, M., Lehmann, P., Or, D. (2018). Evaporation suppression and energy balance of water reservoirs covered with self-assembling floating elements. Hydrol. Earth Syst. Sci., 22, 4015–4032.

How to cite: Aminzadeh, M., Friedrich, N., Madani, K., and Shokri, N.: Insignificant but overlooked: Evaporative losses from small reservoirs in southern Europe, EGU General Assembly 2023, Vienna, Austria, 23–28 Apr 2023, EGU23-3326, https://doi.org/10.5194/egusphere-egu23-3326, 2023.

The complementary evaporation principle (CEP) could well explain the past changes in global evaporation while avoiding uncertainties in precipitation and soil data. However, it is still difficult to estimate the Priestley-Taylor coefficient (α) for the wet-surface evaporation without actual evaporation data. Here, we proposed an empirical approach that links the CEP and a traditional Budyko equation in order to determine α in locations where no actual evaporation (E) data are available. The CEP–Budyko combined framework enabled us to local climate conditions in α, producing more plausible E estimates in the ungauged locations. We also assessed latitudinal and temporal variations of the E estimates for the past 40 years. This study highlights that the optimal α for CEP is unlikely constant in space, since it needs to be conditioned by local climates.

How to cite: Kim, D. and Chun, J. A.: Changes in global evaporation for the past four decades identified by the complementary evaporation principle and the Budyko framework, EGU General Assembly 2023, Vienna, Austria, 23–28 Apr 2023, EGU23-4642, https://doi.org/10.5194/egusphere-egu23-4642, 2023.

EGU23-7545 | ECS | PICO | HS2.5.2

The quest for scalable hydrological system for reservoir modeling 

Pallav Kumar Shrestha, Luis Samaniego, Oldrich Rakovec, and Stephan Thober

Disruptive reservoirs hold back an enormous amount of water, hike evaporation loss and alter the magnitude and timing of streamflow at all scales. Thus, any hydrological model (HM) must correctly represent reservoirs in the simulation. There are two issues while representing reservoirs in the river network of a gridded system. First issue is the error in reservoir catchment area where grids containing a part of the catchment results in under-/overestimation of reservoir inflow. Hence, it is impossible to conserve the catchment area correctly as long as a grid has only one outflow (D8 routing scheme) which is the case for the state-of-the-art gridded HMs. Secondly, when multiple dams are located in the same grid only one dam can be represented to lie on the major stream and be part of the stream network. Currently, gridded HMs either i) classify reservoirs into groups ("global/local","major/minor") simulating them differently in order to conserve the reservoir set, or ii) treat all reservoirs equally but are unable to conserve the reservoir set with smaller reservoirs disappearing at coarser resolutions. So either the set of reservoirs simulated or the reservoir simulation itself gets compromised while modeling across scales. This lack of scalability in space is a prominent source of model uncertainty in HMs (Samaniego et al. 2010, Kumar et al. 2013). We introduce subgrid catchment conservation (SCC), a novel scheme for routing that conserves reservoir catchment at all scales. We hypothesise that the conservation of reservoir catchment paves the way for a scalable hydrological system for reservoir modeling.

To test this hypothesis, we developed a reservoir module in the mesoscale hydrological model (mHM, https://mhm-ufz.org). mHM is tested across seven model resolutions ranging from 1 km to 100 km. The experiment set is the GRanD database, wherein the scalability of the reservoir set is tested for the whole set (7320 reservoirs) and the scalability of reservoir inflow simulation is tested at the headwater reservoirs (approx. 1500 reservoirs). Preliminary results in 70+ headwater reservoirs show that SCC routing preserves the full reservoir set across all scales. In comparison, the classic D8 routing scheme loses 15%, 25% and 50% reservoirs at 0.125 degree, 0.25 degree and 0.50 degree model resolutions, respectively. This indicates the potential of SCC in regulating interscale discrepancies in reservoir states and fluxes, leading to virtually seamless model performance.

The dilemma for modellers using distributed HMs is to compromise in resolution  (i.e., runtime) or to compromise on the number of reservoirs to model. Based on the preliminary results, SCC is poised to solve this long-standing dilemma and complete the quest for scalable hydrological modeling with reservoirs. The findings of this study would contribute to the contemporary effort of hydrological modeling society towards improved global water balance closure, where a good representation of reservoirs and lakes is a crucial element.

How to cite: Shrestha, P. K., Samaniego, L., Rakovec, O., and Thober, S.: The quest for scalable hydrological system for reservoir modeling, EGU General Assembly 2023, Vienna, Austria, 23–28 Apr 2023, EGU23-7545, https://doi.org/10.5194/egusphere-egu23-7545, 2023.

EGU23-8334 | ECS | PICO | HS2.5.2

Improving methods to calculate the monthly water budget for Lake Velence, Hungary 

Máté Chappon and Katalin Bene

In recent years the water levels of Lake Velence - Hungary's third-largest lake - have dropped significantly due to a series of climatic and anthropogenic phenomena. Water managers calculate the lake's water budget based on a methodology established almost 50 years ago. The calculation error is determined as the difference between the computed and observed lake levels. A previous study on the calculation errors of annual water budget computations has found several uncertainties that result in predominantly negative errors; underestimating inflows and, or overestimating outflows.

This study focuses on monthly water budget computations to investigate the possible causes of the calculation errors. The monthly error distribution shows that negative calculation errors accumulate during the year's first five months. Based on this outcome, the methods for determining monthly precipitation, evapotranspiration and surface inflow are explored in more detail for the January – May period. Remote sensing data and numerical modelling were used to fill spatial and temporal data gaps.

The research will result in an improved water budget calculation method, which enhances our understanding of the main processes governing lake water levels. The new approach will give water managers a clearer picture of the effectiveness and necessity of engineering interventions to restore lake water levels.

The research is carried out within the framework of the Széchenyi Plan Plus program with the support of the RRF 2.3.1 21 2022. 00008 project.


How to cite: Chappon, M. and Bene, K.: Improving methods to calculate the monthly water budget for Lake Velence, Hungary, EGU General Assembly 2023, Vienna, Austria, 23–28 Apr 2023, EGU23-8334, https://doi.org/10.5194/egusphere-egu23-8334, 2023.

Estimating karst water resources at a global scale represents a key step towards enhancing groundwater management. Although recharge estimations at global scale exist, the special karst features leading to different recharge processes, in particular the preferential flow path, have not been adequately accounted for. Representing these special recharge processes is crucial for realistically quantifying recharge in karst regions. In this study, we present a new version of a global karst recharge model and the estimation of its model parameters using multiple observations. The updated model includes a new routine to consider eight land cover types for calculating evapotranspiration, interception and infiltration, as well as a new routine to account for snow and glacier melt. To prepare parameter estimation, six karst landscapes are defined based on the properties of karst grids (spatial resolution of 0.25°). For each of these landscapes, model parameters are found separately using a Monte Carlo uncertainty estimation framework and observations from the international soil moisture network (ISMN) and actual evapotranspiration observations from FLUXNET. With the new calibration, the updated model provides more precise estimates of groundwater recharge in athe karst regions of the world. It will therefore serve as a too  to improve water management in karst regions and identify areas potentially suffering from water shortage.

How to cite: Hartmann, A., Liu, Y., and Gomez Ospina, M.: Global groundwater recharge modeling in karst with explicit consideration of land cover and snow and glacier storage, EGU General Assembly 2023, Vienna, Austria, 23–28 Apr 2023, EGU23-8424, https://doi.org/10.5194/egusphere-egu23-8424, 2023.

EGU23-8896 | ECS | PICO | HS2.5.2

Global runoff partitioning based on Budyko and machine learning 

Shujie Cheng, Petra Hulsman, Akash Koppa, Lei Cheng, Hylke E. Beck, and Diego G. Miralles

Partitioning runoff accurately into baseflow and quickflow is crucial for our understanding of the water cycle and for the management of droughts and floods. However, global datasets of long-term mean runoff partitioning are rare, even more so datasets relying on physically-based methods. Here, we present a new global 0.25° dataset of runoff, baseflow and quickflow using a hybrid approach of Budyko-based methods and machine learning (ML). The parameters in the Budyko curve and Budyko-based baseflow curve (BFC curve) are estimated with ML (boosted regression trees, BRT) as a function of catchment characteristics. The BRT models are trained and tested in 1226 catchments worldwide, and then applied globally at grid scale. The catchment-trained models show good performance during the testing phase with R2 equal to 0.96 and 0.87 for runoff and baseflow, respectively. The dataset developed in this study shows that 30.3±26.5% (mean ± standard deviation) of the precipitation is partitioned into runoff of which 20.6±22.1% is baseflow and 9.7±10.3% is quickflow. The global long-term mean baseflow in this study (151±181 mm yr–1) is lower than that from the Global Streamflow Characteristics Dataset (GSCD, 241±321 mm yr–1) and higher than that from ERA5-Land (79±145 mm yr–1). This study provides a unique, physically and observationally constrained global dataset of the long-term runoff partitioning. The large differences among different datasets suggest that global runoff partitioning is highly uncertain and requires further investigation.

How to cite: Cheng, S., Hulsman, P., Koppa, A., Cheng, L., Beck, H. E., and Miralles, D. G.: Global runoff partitioning based on Budyko and machine learning, EGU General Assembly 2023, Vienna, Austria, 23–28 Apr 2023, EGU23-8896, https://doi.org/10.5194/egusphere-egu23-8896, 2023.

EGU23-9951 | ECS | PICO | HS2.5.2

Using observation data to improve simulation of man-made reservoirs in a global hydrological model 

Seyed-Mohammad Hosseini-Moghari and Petra Döll

Reservoir operation modeling is challenging since it directly depends on human decision-making that varies from dam to dam. Large-scale reservoir modeling is even more difficult due to the lack of observed operation data. Therefore, generic reservoir operation models are used to model large-scale reservoir operations focusing on a specific purpose, rather than real operations. One of the well-known generic schemes for reservoir operation is Hannsaki et al. (2006) algorithm which is currently used in several global hydrological models including the Water Global Assessment and Prognosis (WaterGAP) model. This algorithm improves hydrological process modeling compared to natural lake methods; however, its performance still needs to be improved, particularly for storage simulations. In this study, a new approach is implemented in the WaterGAP model to improve Hannsaki’s algorithm by using different one-parameter linear operation rules for different reservoir storage levels i.e., above 70 %, between 40 % and 70 %, and below 40 % of reservoir capacity (in total three equations). As a result, we can model each reservoir individually. In addition, we use storage at each time step for estimating the release coefficient instead of the storage at the beginning of the operational year in Hannsaki’s algorithm. The ResOpsUS dataset (historical reservoir inflow, storage, and outflow of major reservoirs across the US) is used to estimate the best parameters for each reservoir and evaluate the results over the US. The results of the new approach show an improvement compared to Hannsaki’s algorithm e.g., when the inflow has a good quality (the Kling-Gupta Efficiency (KGE) greater than 0.50), the median of KEG for storage (outflow) of the new approach reaches 0.23 (0.49) compared to -0.71 (0.25) for Hannsaki’s algorithm.

How to cite: Hosseini-Moghari, S.-M. and Döll, P.: Using observation data to improve simulation of man-made reservoirs in a global hydrological model, EGU General Assembly 2023, Vienna, Austria, 23–28 Apr 2023, EGU23-9951, https://doi.org/10.5194/egusphere-egu23-9951, 2023.

EGU23-10386 | ECS | PICO | HS2.5.2

The role of future aridification in multi-year drought persistence for global hydrologic basins 

Nels Bjarke, Ben Livneh, and Joseph Barsugli

Increasing aridity is a growing concern for many regions across the globe, primarily driven by an alteration to the balance of evaporative loss and incoming precipitation. While this is likely to drive declines in the long-term mean of surface water, interannual and decadal variability of precipitation will still produce wet and dry periods. Yet, the potential increase in the occurrence of multiple sequential drought years is of particular concern especially for basins without substantive water shortage infrastructure. In this presentation, we evaluate the enhanced likelihood of multiple consecutive , i.e. years with below 20th percentile annual runoff, occurring within large basins (25,000-150,000 km­2) across the globe that are projected to experience increasing aridity within an ensemble of 16 CMIP6 general circulation models. We use historical simulations (1950-2014) and future projections (2015-2100) from three emission scenarios to demonstrate how aridification, as measured by increases in the long-term ratio of potential evapotranspiration and precipitation, is expected to change. We examine the ways in which changes in aridity paired with projected changes to the interannual variability of precipitation can conspire to enhance the probability, magnitude, and persistence of multi-year drought.

How to cite: Bjarke, N., Livneh, B., and Barsugli, J.: The role of future aridification in multi-year drought persistence for global hydrologic basins, EGU General Assembly 2023, Vienna, Austria, 23–28 Apr 2023, EGU23-10386, https://doi.org/10.5194/egusphere-egu23-10386, 2023.

EGU23-10850 | ECS | PICO | HS2.5.2

Understanding Evapotranspiration Variability between the Eastern and Western Himalayas 

P Kedarnath Reddy, Nishan Bhattarai, and Sumit Sen

Hydrological budgeting of mountainous watersheds like the Indian Himalayan Region (IHR) is critical as they supply water for most of the Indian Sub-continent. Estimating evapotranspiration (ET), a major eco-hydrological process that returns a significant amount of terrestrial precipitation to the atmosphere, however, is a challenge in data-scare regions like IHR. This is further complicated by the geographic extent of the Indian Himalayas, which cover 13 states within the Himalayan range that possess a significant climatic and biotic gradient from east to west. This study aims to compare the applicability of various potential ET (PET) methods for the eastern and western Himalayan regions under different hydro-climatic conditions and suggest the best-fit method using easily accessible hydrometeorological data. The data for this study was obtained from 17 stations covering the IHR extensively during two study periods (1972-1982 and 2003-2009) from the Indian Meteorological Department (IMD). Four temperature-based methods (Thornthwaite, Blaney-Criddle, Kharrufa, and Hargreaves method) were tested against the modified Penman-Monteith (PM) method using reanalysis data (PM-PET). The PET estimates for the stations showed similar variations across three different elevation ranges. Further, it was observed that the Western Himalayas experienced lesser months of drier conditions (i.e., higher PET values during 2-3 months) compared to the Eastern Himalayas, which typically experienced 4-5 months of higher ET demand. It was observed that the PET values from the Hargreaves method were close to PM-PET with NSE (Nash-Sutcliffe Efficiency) values ranging from 0.75-0.92 and r2 values ranging from 0.72-0.92 (except for Jammu; NSE = 0.5, r2 = 0.41) and was found to serve as the best temperature-based method among the four methods for PET estimation in the Western and Central Himalayan region. However, no temperature-based method provided reasonable PET estimates in Eastern Himalayas, as the NSE and r2 values were less than 0.3 for all the methods.  Thus, there is a need to explore why temperature-based PET methods may not be applicable to the Eastern Himalayan region and evaluate other PET methods that are more reliable in this region.

How to cite: Reddy, P. K., Bhattarai, N., and Sen, S.: Understanding Evapotranspiration Variability between the Eastern and Western Himalayas, EGU General Assembly 2023, Vienna, Austria, 23–28 Apr 2023, EGU23-10850, https://doi.org/10.5194/egusphere-egu23-10850, 2023.

EGU23-11481 | PICO | HS2.5.2

Spatial-temporal characteristics of water storage in Africa based on GRACE and GLDAS data 

Jianmei Cheng, Kuiyuan Ding, Yiming Luo, Ying Yu, Yihang Lin, Long He, Xiaowei Zhao, Kun Zheng, and Yanxin Wang

United Nations Educational, Scientific and Cultural Organization (UNESCO) pointed out that about 300 million Africans live in poverty because of water scarcity. However, Africa does not lack natural water resources, but only makes insufficient use of them. We aim to understand the distribution of water storage in Africa and its changes for better management of these water resources. Based on the data from the GRACE gravity satellite and the GLDAS hydrological model, the changes in the total water storage (TWS), the surface water storage (SWS), and the groundwater storage (GWS) of Africa are calculated. On the hydrogeological base service platform OneGroundwater, we comprehensively analyzed the effects of rainfall, land use types, and other human activities on the water reserves. We found that the SWS decreases in the recent 15 years, which suggests that the utilization of surface water in Africa is significant. Meanwhile, the increase in the GWS indicates that the development of groundwater is not enough. Promoting the sustainable extraction of groundwater is helpful to the social development in Arica. Our analysis results show that rainfall is decisive for the changes in the GWS of Africa. The seasonal variation trend of the GWS is consistent with that of rainfall, while there is a certain lag in the yearly variations. The effects of land use types are mainly reflected in recharge and evaporation. The increase in vegetation density strengthens transpiration and reduces the recharge rate of groundwater.

How to cite: Cheng, J., Ding, K., Luo, Y., Yu, Y., Lin, Y., He, L., Zhao, X., Zheng, K., and Wang, Y.: Spatial-temporal characteristics of water storage in Africa based on GRACE and GLDAS data, EGU General Assembly 2023, Vienna, Austria, 23–28 Apr 2023, EGU23-11481, https://doi.org/10.5194/egusphere-egu23-11481, 2023.

EGU23-11945 | PICO | HS2.5.2

Global assessment of hydrological components using a seamless multiscale modelling system 

Oldrich Rakovec, Rohini Kumar, Pallav Kumar Shrestha, and Luis Samaniego

Our study provides a global assessment of water balance components accounting for the uncertainty in globally available precipitation products. This assessment is carried out consistently using a multiscale modelling framework established over more than 6000 GRDC river basins at various spatial resolutions (daily time step, period 1990-2019). The framework is based on the mesoscale Hydrologic Model (mHM; [1,2,3]) equipped with the multiscale parameter regionalization (MPR) scheme. All basins share the same parameterization and are driven with four different state-of-the-art meteorological products: ERA5 reanalysis [4], MSWEP [5], and deterministic EM-Earth v2 [6]. Additionally, the hydrological simulations are benchmarked against E-OBS [7] over Europe and against locally interpolated 1km gridded rain gauge dataset over Germany.

Our results show that EM-Earth clearly exhibits the best streamflow performance across North and South America and Asia with respect to the other products. The MSWEP is the best product in Africa, where the overall model’s performance is rather poor. In Australia, MSWEP and EM-Earth have comparable skills. In Europe, the differences get narrower, although slightly better performance is seen for EM-Earth, with a median performance of 0.5 of daily KGE (N basins=2000), mainly due to correcting the under-catch error of rain gauges which is not considered, e.g. in E-OBS. Furthermore, when we zoom into a subset consisting of medium-sized 200 German basins, the in-house high-resolution meteorologic product clearly overperformed all global products, mainly due to better captured temporal correlation and smaller biases. On the other hand, ERA5 leads to very strong positive biases over German basins using standard parameterization. Finally, our study contributes to discussions on objective quantification of the optimal spatial resolution of hydrological studies.


[1] https://doi.org/10.5281/zenodo.5119952

[2] https://agupubs.onlinelibrary.wiley.com/doi/full/10.1029/2008WR007327 

[3] https://agupubs.onlinelibrary.wiley.com/doi/full/10.1029/2012WR012195

[4] https://rmets.onlinelibrary.wiley.com/doi/10.1002/qj.3803

[5] https://hess.copernicus.org/articles/21/589/2017/hess-21-589-2017.html

[6] https://journals.ametsoc.org/view/journals/bams/103/4/BAMS-D-21-0106.1.xml

[7] https://agupubs.onlinelibrary.wiley.com/doi/full/10.1029/2017JD028200


How to cite: Rakovec, O., Kumar, R., Shrestha, P. K., and Samaniego, L.: Global assessment of hydrological components using a seamless multiscale modelling system, EGU General Assembly 2023, Vienna, Austria, 23–28 Apr 2023, EGU23-11945, https://doi.org/10.5194/egusphere-egu23-11945, 2023.

EGU23-12207 | ECS | PICO | HS2.5.2

Long-term dynamics of total water storage deficit recovery in Germany 

Friedrich Boeing, Thorsten Wagener, Andreas Marx, and Sabine Attinger
Germany experienced exceptional multi-year water storage deficits starting in 2018. Recurring years below average precipitation and above average temperatures lead to water deficits that accumulated primarily in slow-response subsurface water storages such as (deep) soil moisture or groundwater levels. Total water storage (TWS) anomalies estimated by the GRACE satellite mission show a strong decline for Germany since measurements began in 2002, but these time series began with a relatively wet period, ended in an exceptional drought situation, and are still relatively short. Therefore the resulting trends are not representative for long-term TWS dynamics and should not be used to extrapolate the development into the future (Güntner et al, 2022). In addition, the GRACE signal does not allow partitioning of the water storage and flux components. Hydrological simulations provide a suitable tool to analyse the long-term dynamics of water storages. We analyse the long-term monthly TWS anomalies estimated with the hydrological model mHM (Samaniego et al. (2010), Kumar et al. (2013)) from a data reconstruction starting in 1766 (Rakovec et al, 2022). Comparison of the monthly total water storage estimates between the hydrological simulations and two GRACE solutions (JPL RL06M MSCNv02CRI, GFZ COST-G RL01) show good agreement for both anomalies (R²=0.78-0.84) and the residuals after removing the seasonal cycle (R²=0.69-0.72) on the scale of Germany (spatial mean).
We specifically examine the periods of recovery from total water storage deficits from a water balance perspective. Besides precipitation (P) being the main driver of changes in the TWS, the progress of recovery from water storage deficits is controlled by the main water fluxes evapotranspiration (E) and runoff (Q) that are the loss terms in the water balance equation deltaTWS = P - E - Q. Decadal evaluations indicate that the water balance in Germany in recent decades has been increasingly driven by above-average E as a result of the temperature rise. While the cumulative precipitation deficits in the last decade 2011 - 2020 are less exceptional compared to other historical decades, cumulative E residuals account for a much larger part of the water deficits than in other historical decades. The results will contribute to an improved understanding how TWS deficit recovery are affected by long-term changes in the water balance.
 
References:

Güntner, A., Gerdener, H., Boergens, E., Kusche, J., Kollet, S., Dobslaw, H., Hartick, C., Sharifi, E., and Flechtner, F. (2022): Changes of water storage in Germany since 2002 observed with GRACE/GRACE-FO, GRACE/GRACE-FO Science Team Meeting 2022, Potsdam, Germany, 18–20 Oct 2022, GSTM2022-93, https://doi.org/10.5194/gstm2022-93.

Rakovec, O., Samaniego, L., Hari, V., Markonis, Y., Moravec, V., Thober, S., Hanel, M., & Kumar, R. (2022): The 2018–2020 Multi‐Year Drought Sets a New Benchmark in Europe. In Earth’s Future (Vol. 10, Issue 3). American Geophysical Union (AGU). https://doi.org/10.1029/2021ef002394

Samaniego L., R. Kumar, S. Attinger (2010): Multiscale parameter regionalization of a grid-based hydrologic model at the mesoscale. Water Resour. Res., 46,W05523, doi:10.1029/2008WR007327

Kumar, R., L. Samaniego, and S. Attinger (2013): Implications of distributed hydrologic model parameterization on water fluxes at multiple scales and locations, Water Resour. Res., 49, doi:10.1029/2012WR012195

How to cite: Boeing, F., Wagener, T., Marx, A., and Attinger, S.: Long-term dynamics of total water storage deficit recovery in Germany, EGU General Assembly 2023, Vienna, Austria, 23–28 Apr 2023, EGU23-12207, https://doi.org/10.5194/egusphere-egu23-12207, 2023.

EGU23-12394 | PICO | HS2.5.2

Two decades (2003-2021) of storage changes in the soil water and groundwater of CONUS 

nooshin mehrnegar, Maike Schumacher, Thomas Jagdhuber, and Ehsan Forootan

The climate change along with anthropogenic water use have been affecting the (re)distribution of water storage and water flux across the Continental United States (CONUS). Understanding these changes requires tools that provide a big picture of the processes that drive these changes. These processes are implemented in this study by combining remote sensing data with available modeling techniques, where the data contains a sample of hydro-climatological signals and models reflect our understanding of these processes. Time series of Terrestrial Water Storage Changes (TWSC) from the Gravity Recovery and Climate Experiment (GRACE, 2003-2017) and its Follow-on (GRACE-FO, 2018-2021) are integrated into the W3RA water balance model within CONUS, where the model is run at 9-km resolution using ERA5 forcing data. The gap in the GRACE and GRACE-FO TWSC products is filled following https://doi.org/10.3390/rs12101639. To achieve the best possible statistical combination, the Markov Chain Monte Carlo-based Data Assimilation (MCMC-DA) approach (https://doi.org/10.1016/j.scitotenv.2020.143579) is applied to use GRACE and GRACE-FO TWSC as a vertical integration constraint to update W3RA's individual water storage estimates. This approach rigorously accounts for the uncertainties of model and observations.

The outputs of MCMC-DA are evaluated using in-situ USGS groundwater level data and the European Space Agency (ESA) Climate Change Initiative (CCI) soil moisture product. The results indicate changes in trend and seasonality of water storage variations, for example, in southwestern (California and Nevada), southeastern (including Florida, South and North Carolina, Virginia, and Georgia), and south-central CONUS (including Texas, New Mexico, Colorado, Kansas, and Oklahoma). MCMC-DA improves the estimation of soil water in regions with high forest intensity, where ESA CCI and models reveal difficulties in capturing the soil-vegetation-atmosphere continuum. The representation of El Nino Southern Oscillation (ENSO)-related variability in water storage are found to be considerably improved after integrating GRACE(-FO) into W3RA. This new hybrid approach is found efficient for understanding the linkage between the climate variability and large-scale hydrological processes.

Keywords: CONU; Data Assimilation; Bayesian Method; MCMC; GRACE(-FO); W3RA; groundwater storage; soil water storage; USGS; ESA CCI.

How to cite: mehrnegar, N., Schumacher, M., Jagdhuber, T., and Forootan, E.: Two decades (2003-2021) of storage changes in the soil water and groundwater of CONUS, EGU General Assembly 2023, Vienna, Austria, 23–28 Apr 2023, EGU23-12394, https://doi.org/10.5194/egusphere-egu23-12394, 2023.

Changes in the terrestrial hydrologic cycle determine the future availability of water around the world, affecting various aspects of society. Accurate estimation of these changes is essential for effective implementation of water management policies. A major source of uncertainty in such estimates is the data products used for analysis. This study provides a global perspective of changes in water availability in terms of Precipitation minus Evapotranspiration (P-E) using three data sources, namely reanalysis (ERA5-Land), hydrological modelling (TerraClimate), and simulations of eight Global Climate Models (GCMs; CMCC-CM2, CNRM-CM6, EC-Earth3P, ECMWF-IFS, HadGEM3-GC31, IPSL-CM6A, MPI-ESM1, and MRI-AGCM3 ). The period of analysis (1960-2014) is divided into two epochs, and the magnitude of change is analyzed by the percent change in the mean and increasing/decreasing trend over the 55-year period. In general, all three data products successfully capture the climatological mean of P-E with comparatively higher values for the equatorial regions. However, when comparing the intensity of changes the results provided by the three data sources differ significantly, especially for regions at higher latitudes. Projections from various GCMs show significant rise in the precipitation for the higher latitudes, which will also affect the extent of P-E and increase the uncertainty over the changes in water availability. It is critical to find reliable data sources for the historical period to increase confidence in future projections and to successfully implement various bias correction techniques wherever necessary. 

How to cite: Dutta, R. and Markonis, Y.: Global perspective of changes in the terrestrial hydrologic cycle using different data products, EGU General Assembly 2023, Vienna, Austria, 23–28 Apr 2023, EGU23-12752, https://doi.org/10.5194/egusphere-egu23-12752, 2023.

EGU23-13105 | PICO | HS2.5.2

An evaluation of the impact of irrigation and groundwater pumping on regional climate using an improved Earth-System model 

Yusuke Satoh, Yadu Pokhrel, Hyungjun Kim, and Tokuta Yokohata

Irrigation is one of the crucial Nature-Human interactions and also an anthropogenic forcing in the Earth system. The literature has shown that artificial water supply to soil for example water exploitation from groundwater for irrigation can alter water and heat budgets at the land surface, resulting in changes in regional climate and hydrological cycles. Due to the expected increase in irrigation to meet growing food demand, the impact of irrigation is likely to increase further in the future. Therefore, it is essential to consider to better understand the irrigation-induced changes in the various components of the Earth system, today and in the future.

Our research aims to advance the quantitative understanding of the impact of irrigation and groundwater exploitation as anthropogenic drivers of regional climate and environmental changes. We developed an earth system modeling framework coupling the updated Earth system model, MIROC-ES2L (Model for Interdisciplinary Research on Climate, Earth System version 2 for Long-term simulations) and newly implemented hydrological human activity modules. This modeling framework enables to simulate a fully coupled Nature-Human system including water cycle dynamics related to irrigation.

Our preliminary results show notable differences between simulations with and without the irrigation process. Here, we show the hydrological variables affected by irrigation and identify the regions and timings of significant impact. Further, we estimate the individual contribution of groundwater and surface water use to such impacts by irrigation.

How to cite: Satoh, Y., Pokhrel, Y., Kim, H., and Yokohata, T.: An evaluation of the impact of irrigation and groundwater pumping on regional climate using an improved Earth-System model, EGU General Assembly 2023, Vienna, Austria, 23–28 Apr 2023, EGU23-13105, https://doi.org/10.5194/egusphere-egu23-13105, 2023.

EGU23-14079 | ECS | PICO | HS2.5.2

Using basin-scale physiographic attributes to improve river routing in JULES 

Athanasios Tsilimigkras, Douglas Clark, Andrew Hartley, Eleanor Burke, Manolis Grillakis, and Aristeidis Koutroulis

Land Surface Models (LSMs) simulate various biophysical processes of the terrestrial land surface. They have been developed for a variety of applications, including assessing the impact of modifying a particular process on the ecosystem as a whole, e.g., the impact of climate change on hydrology. Due to their great complexity, developing these models is a continuous and laborious process. For example, the JULES (Joint UK Land Environment Simulator) model is developed by a broad community of inter-disciplinary researchers. However, despite the high level of model development, some processes face parsimonious parameterisation. One of these processes is the routing of surface runoff as simulated by the TRIP (Total Runoff Integrating Pathways) scheme [1]. In its current global parameterisation, TRIP uses uniform velocity and meandering characteristics for the entire land surface regardless of the physiography of the actual river system.

Our work aims to improve the surface runoff's routing by optimising the effective velocity and meandering ratio parameters. In a sample of 360 global river basins, these parameters are correlated with physiographic characteristics to derive a method of extrapolation at the global scale. The development and application of the method were based on river discharge from the global GRDC database [2] and basin-scale physiographic attributes from the HydroATLAS database [3]. A factorial experiment was performed from a combination of 20 setups of effective velocity values and 12 meandering ratios, resulting in a total of 198 simulations. Two optimisation methods were developed; in the first method, the optimum routing parameters are defined for the best NSE improvement with the least deviation from the default routing parameters, whereas in the second method a uniform parameter set was assigned based on a categorisation of the basins. Neural Networks were used for regression and classification, respectively for each method, correlating the optimal routing parameters with the physiographic attributes at the river basin scale. The trained neural networks were applied to the HydroATLAS attributes to extrapolate the routing parameters at the global scale. Simulations of the newly developed river routing configuration showed improved skill in simulating river flow at the global scale (NSE increased by 0.13 on average over 360 global river basins), especially regarding the temporal response. Finally, the present work resulted in a publicly available branch of the JULES code, where spatially varying routing parameters can be introduced, contrary to the globally fixed set.


[1] Oki, T., & Sud, Y. C. (1998). Design of Total Runoff Integrating Pathways (TRIP) - A Global River Channel Network. Earth Interactions, 2(1), 1–37. https://doi.org/10.1175/1087-3562(1998)002<0001:DOTRIP>2.3.CO;2

[2] GRDC. (n.d.). The Global Runoff Data Centre, 56068 Koblenz, Germany, 56068 Koblenz, Germany. 56068 Koblenz, Germany.

[3] Linke, S., Lehner, B., Ouellet Dallaire, C., Ariwi, J., Grill, G., Anand, M., Beames, P., Burchard-Levine, V., Maxwell, S., Moidu, H., Tan, F., Thieme, M. (2019). Global hydro-environmental sub-basin and river reach characteristics at high spatial resolution. Scientific Data 6: 283. doi: https://doi.org/10.1038/s41597-019-0300-6


Acknowledgement: This work is based upon work from COST Action 19139 - PROCLIAS, supported by COST (European Cooperation in Science and Technology).

How to cite: Tsilimigkras, A., Clark, D., Hartley, A., Burke, E., Grillakis, M., and Koutroulis, A.: Using basin-scale physiographic attributes to improve river routing in JULES, EGU General Assembly 2023, Vienna, Austria, 23–28 Apr 2023, EGU23-14079, https://doi.org/10.5194/egusphere-egu23-14079, 2023.

EGU23-14177 | ECS | PICO | HS2.5.2

Sectoral water usage in the Community Earth System Model (CESM) 

Ioan Sabin Taranu, David Lawrence, Yoshihide Wada, Ting Tang, Yi Yao, Inne Vanderkelen, Steven De Hertog, and Wim Thiery

Abstract:

Climate change and human water management are the two main drivers of terrestrial water storage change, from regional to global scale. When thinking about the future, our main tools to project upcoming changes in the terrestrial water fluxes and storage are the Earth System Models (ESMs). Through the representation of physical, chemical and biological processes relevant to the climate dynamics, ESMs are the closest we got to represent the real Earth.

Despite important advancements in the development of ESMs, these models are still missing key elements relevant to the representation of the water cycle, notably anthropogenic water management (Nazemi and Howard, 2015). Through the construction of dams and the abstraction of water from surface and groundwater sources, humans can significantly alter the regional and continental water budget, including river discharge and seasonality, groundwater levels and surface evapotranspiration.

The objective of our current project is to reduce this gap, by enhancing the Community Earth System Model to support abstractions for all major water use sectors including domestic, livestock, thermoelectric, manufacturing, mining and irrigation. Some unique features of our development are: full coverage of human water usage for both historical (1971-2010) and future scenarios; a sectoral competition scheme when water availability is limited; application of consumption fluxes on surface soil to accentuate role of human water usage on land-atmosphere interactions; full coupling between routing-land-atmosphere-ocean components. At the moment, all abstractions are performed exclusively from surface water.

For the scope of this conference, we will present for the first time, the global simulation results for the historical period (1971-2010) in land only mode, including a general performance of the model in normal conditions and some case studies for known historical drought events.


References:

Nazemi, Ali, and Howard S. Wheater. "On inclusion of water resource management in Earth system models–Part 1: Problem definition and representation of water demand." Hydrology and Earth System Sciences 19.1 (2015): 33-61.


How to cite: Taranu, I. S., Lawrence, D., Wada, Y., Tang, T., Yao, Y., Vanderkelen, I., De Hertog, S., and Thiery, W.: Sectoral water usage in the Community Earth System Model (CESM), EGU General Assembly 2023, Vienna, Austria, 23–28 Apr 2023, EGU23-14177, https://doi.org/10.5194/egusphere-egu23-14177, 2023.

EGU23-14505 | ECS | PICO | HS2.5.2

Streamflow projections for Indian subcontinent river basins 

Dipesh Singh Chuphal and Vimal Mishra

Streamflow data is highly relevant for flood risk analysis, ecological assessment, and water resources management. However, high-resolution vector-based streamflow data for Indian-Subcontinent river (ISC) basins is critically lacking. The finer-scale streamlines are better represented in a vector-based river network than grid-based network. We generated continuous streamflow data from 1901 to 2100 for ISC river basins. We used observed meteorological data from India Meteorological Department (IMD) for historical and Coupled Model Intercomparison Project Phase 6 (CMIP6) climate projections for future simulations. We combined the H08 land surface model and the MizuRoute routing scheme to generate the streamflow at 9579 river segments of ISC river basins. We also examined how streamflow variability across the ISC river basins changes under a warming climate. We further investigated the river segments that are more prone to flood and drought in the future. The findings of this study may help in improving local flood and drought awareness and response more effectively than previously possible due to simulations at very fine river segments.

How to cite: Singh Chuphal, D. and Mishra, V.: Streamflow projections for Indian subcontinent river basins, EGU General Assembly 2023, Vienna, Austria, 23–28 Apr 2023, EGU23-14505, https://doi.org/10.5194/egusphere-egu23-14505, 2023.

EGU23-17281 | ECS | PICO | HS2.5.2

Climate change impact on water budget and hydrological extremes across Peru 

Carlos Antonio Fernandez-Palomino, Fred F. Hattermann, Valentina Krysanova, Fiorella Vega-Jácome, Waldo Lavado, and Axel Bronstert

Peru is already facing a number of challenges related to climate change, including retreating glaciers and more severe droughts and floods. Therefore, a countrywide analysis of current and future hydroclimatic conditions is crucial to formulate adaptation strategies in water resource development. This study aims to evaluate the effects of climate change on the distribution of water budget components and streamflow variability across Peru. For that, we bias-adjusted and statistically downscaled CMIP6 climate projections of 10 climate models under two Shared Socioeconomic Pathways (SSP1-2.6 and SSP5-8.5) to obtain a range of possible future regional climatic conditions. These selected scenarios span a range of possible future options from the sustainable pathway (SSP1-2.6, with 2.6 W/m2 by the year 2100) to fossil-fueled development (SSP5-8.5, with 8.5 W/m2 by the year 2100). The adjusted climate data were fed into the hydrological model, Soil and Water Assessment Tool (SWAT), to simulate and analyze future hydroclimatic conditions. SWAT was calibrated and validated at 72 discharge stations against mean, high and low water flows. Climate projections suggest a warmer climate and diverging changes in precipitation, with a drier response over the lowlands of the Upper Amazon related to a substantial reduction in precipitation during June-November and a wetter response over the tropical Andes due to precipitation increases during September-March. Projected changes in hydrological conditions show lower water availability over lowlands and higher water availability along the Andean basins in the future. The projections for hydrological extremes indicate that Peru might face excessive water exposure during floods along the Andean catchments and water scarcity during droughts over the Amazon lowlands in the future, particularly under the fossil-fueled development (SSP5-8.5) scenario. The results of this study provide information to planners and decision-makers for formulating adaptation strategies for sustainable water management under climate change in Peru.

Keywords: water resources, climate change, CMIP6, hydrological extremes, Peru, Andes, Amazon

How to cite: Fernandez-Palomino, C. A., Hattermann, F. F., Krysanova, V., Vega-Jácome, F., Lavado, W., and Bronstert, A.: Climate change impact on water budget and hydrological extremes across Peru, EGU General Assembly 2023, Vienna, Austria, 23–28 Apr 2023, EGU23-17281, https://doi.org/10.5194/egusphere-egu23-17281, 2023.

EGU23-1209 | ECS | PICO | HS2.5.4

A method for hydrometric data rescue: Challenges and solutions for working with archival data 

Kate de Smeth, Joanne Comer, and Conor Murphy

The availability of long, quality-controlled discharge records is crucial for hydrological research that supports water resource planning, extreme flow estimation and investigations into the effects of climate variability and anthropogenic disturbances on river flow regimes. Archival hydrometric data sources (e.g. historical staff gauge readings, autographic chart data, and historical flow measurements) provide an invaluable opportunity to extend available discharge records, however a process of transcription and digitisation known as data rescue is required to make them available to the public.

In their 2014 ‘Guidelines for Hydrological Data Rescue’, the World Meteorological Organisation (WMO) provided generalised guidance to encourage Members to engage in data rescue activities to mitigate the very real risk of data loss due to physical record deterioration. Yet few published examples exist. Our work to extend discharge records for eight river stations across Ireland provides a detailed applied example that expands the methodology outlined in the WMO guidance by addressing two core challenges encountered: i) how to collect reliable data in the face of quality issues specific to historical autographic chart data; and ii) how to effectively communicate the level of confidence in the rescued data to the end user. We present procedures for data processing, quality assurance using quality codes, and compilation of key metadata and information about each measurement station. Lessons learnt are summarised in a generalised workflow and presented to the hydrology community to assist other hydrometric data rescue efforts.

How to cite: de Smeth, K., Comer, J., and Murphy, C.: A method for hydrometric data rescue: Challenges and solutions for working with archival data, EGU General Assembly 2023, Vienna, Austria, 23–28 Apr 2023, EGU23-1209, https://doi.org/10.5194/egusphere-egu23-1209, 2023.

EGU23-6559 | ECS | PICO | HS2.5.4

Turning publications into data – imagining a world of linked hydrologic knowledge 

Lina Stein and Thorsten Wagener

As a science, hydrology faces diverse sets of interacting processes combined with a vast heterogeneity of our environment. Ideally, one would be broadly knowledgeable in all processes of the water cycle, including their variations across the planet, but taking such a holistic approach to our science has become problematic due to the vast number of hydrologic case numbers published. More than 25 000 articles were published on the topic of water resources in 2022 alone. Such publication numbers make it impossible to keep up with the current literature, not to mention the knowledge acquired over time.

But at the same time, these publications comprise a vast source of information and data that is not being utilised at the moment. For example, we are currently unable to connect our highly localised process knowledge for a broader understanding.

One solution that has been discussed in the past is to extend our article metadata to relevant hydrologic information to support search and synthesis of hydrologic knowledge. And there is a wide range of potential metadata that can be relevant: research topic, study location, models used, time period covered, data availability…. In regard to data services, it could be used to link data collections or networks with the models that use that data, the researchers who employ the models, and the publications that summarise the knowledge gained.

For this data to be useful and used by the community, it will need a collaborative platform to host this information. We discuss the use of Wikidata, a free, accessible, machine-readable, and editable by all, database, for this task. An added benefit is that Wikidata can easily link to existing data repositories and identification numbers, thus making the concept not only of interest for article metadata but also a potential interoperable approach for data services.

How to cite: Stein, L. and Wagener, T.: Turning publications into data – imagining a world of linked hydrologic knowledge, EGU General Assembly 2023, Vienna, Austria, 23–28 Apr 2023, EGU23-6559, https://doi.org/10.5194/egusphere-egu23-6559, 2023.

EGU23-12003 | ECS | PICO | HS2.5.4

Hydro-geomorphic dataset of catchments across the Tibetan Plateau 

yuhan guo, hongxing zheng, yuting yang, and yanfang sang

The Tibetan Plateau is known as the water tower of Asia, supplying water to almost 2 billion people. As a result of the unique high-elevation terrain and atmospheric circulation, this region is severely affected by floods each year. Due to global warming in recent years, the Tibetan Plateau is experiencing more extreme precipitation events, and flood disasters are more likely to occur. However, compared with other regions in China, the Tibetan Plateau is still in its early stage when it comes to flood risk assessment and prediction because of the complex topographic conditions and a lack of gauging stations. At the same time, the unclear flood occurrence mechanism and the various flood types under monsoons and upper-level westerly winds in this region lead to strong uncertainty in the storm flood simulation.

To provide support for regional-scale hydrological simulation and improve the flood risk assessment information, we produce a hydro-geomorphic unit hydrograph dataset that characterizes the rainfall and runoff response relationship in 11069 catchments across the Tibetan Plateau. More specifically, the main geomorphological features of 11069 catchments are extracted first. Then, the WFIUHs are derived from DEM and other remote sensing data combined with the empirical physical formula. Finally, the performance of the WFIUHs in hydrological simulation is assessed in several gauging catchments in this region.

How to cite: guo, Y., zheng, H., yang, Y., and sang, Y.: Hydro-geomorphic dataset of catchments across the Tibetan Plateau, EGU General Assembly 2023, Vienna, Austria, 23–28 Apr 2023, EGU23-12003, https://doi.org/10.5194/egusphere-egu23-12003, 2023.

EGU23-12340 | ECS | PICO | HS2.5.4

Groundwater Model Portal (GroMoPo) – collecting and sharing groundwater model information in a standardized open-access database 

Daniel Zamrsky, Sam Zipper, Robert Reinecke, Kevin Befus, Daniel Kretschmer, Sasha Ruzzante, Kyle Compare, Kristen Jordan, Marc Bierkens, and Tom Gleeson

The increasing number and quality of numerical groundwater models worldwide represent a great source of knowledge for local, regional, and international scientists as well as water managers and decision makers. This development is facilitated by recent advancements in computational tools and access to open software. At the same time, scientific journals stress the importance of sharing model codes and data upon publishing, setting a new publishing standard. Altogether, these developments in the groundwater modelling field create a richer and more dynamic environment, fostering model reproducibility. Such an environment calls for a global, integrated, and standardized database of groundwater models to help members of the groundwater modelling community to search, deposit, and analyse groundwater model information. Unfortunately, despite attempts in the past, such a database is not yet constructed and made available to the public. This is why multiple universities and institutes from different countries came together to create the Groundwater Model Portal (GroMoPo), where groundwater model information can be collected and shared easily. The process of building GroMoPo started by collecting information about individual groundwater models via an online form where various information was compiled by researchers from the institutes involved in the project. Apart from simple information such as names of model developers, year of model development, and country of origin, we also collected information on model implementation (e.g. software used, time and area covered, calibration and validation data availability). The collected data is stored at the Consortium of Universities for the Advancement of Hydrologic Science, Inc. (CUAHSI) HydroShare environment. The collected data are freely accessible via a web portal, which allows the user to query and visualize groundwater model information and to contribute new models. This web portal also allows new users to submit groundwater model information and explore previously collected data. Furthermore, we plan to keep GroMoPo updated in the future as an ongoing service, with CUAHSI’s help, for the hydrological community. We collected information from more than 500 groundwater models in our first phase. This number might appear large, but we estimate that it captures only a few percent of published peer-reviewed articles that include a groundwater model. Therefore, we wish to invite the groundwater modelling community to contribute to and use GroMoPo, expanding our group even further to ensure that more data is collected and shared in the future. With such community involvement, we hope to facilitate meta-analysis and comparative studies, enable broader sensitivity and uncertainty analysis, avoid duplication or replication in groundwater modelling efforts, increase the visibility of existing models and associated publications, and create a teaching tool for aspiring groundwater modelers.

How to cite: Zamrsky, D., Zipper, S., Reinecke, R., Befus, K., Kretschmer, D., Ruzzante, S., Compare, K., Jordan, K., Bierkens, M., and Gleeson, T.: Groundwater Model Portal (GroMoPo) – collecting and sharing groundwater model information in a standardized open-access database, EGU General Assembly 2023, Vienna, Austria, 23–28 Apr 2023, EGU23-12340, https://doi.org/10.5194/egusphere-egu23-12340, 2023.

EGU23-12991 | PICO | HS2.5.4 | Highlight

Hydrological Data Sharing is a key for Sustainable Development and building Early Warning Systems 

Johanna Korhonen, Washington Otieno, and Dominique Berod

There are several factors increasing pressure on water resources such as demographic, economic, social, and climatic changes, in addition to the growing demand for energy, food, and water. Water-related hazards, such as floods and droughts, are affecting millions of people’s lives and will become more frequent, and the need for early warning systems is growing and is being addressed by UN Early Warnings for All initiative. Water is the 6th of the 17 Sustainable Development Goals (SDGs) and impacts on 15 other SDGs. There is a growing demand for water by different sectors.

Responding to the above water challenges and related hazards demands hydrological data that is findable, accessible, interoperable, and reusable, sufficient, and useful. Unfortunately, in most countries and regions, management of water resources is mostly addressed without adequate consideration of the inter-sectoral and transboundary implications of planned developments or decisions on different sectors. This is due to lack or inadequate management and exchange of reliable data among various sectors. It is essential that the management and sharing of hydrological data are performed effectively to maximize the benefits of data collection and optimize data reuse, and thus get a return on investment.

Data exchange is still a challenge in hydrology from both the technological and policy perspective. The technology challenges include sparse measuring networks and lack of automatic data transmission, inadequate data quality control systems, heterogeneous and incompatible standards and protocols for data and metadata storage and exchange, and the inability to openly publish and maintain data and metadata in a publicly interoperable way. The policy challenges are often related to restrictive national legislation and financial consideration on data sharing. The WMO Unified Data Policy adopted in 2021 and the Earth System approach will help to address some of the issues, while the relevant integrated and interoperable data management and access tools, will support the technical aspects.

WMO programmes promote exchange of Earth System data. WHOS (WMO Hydrological Observing System) is the hydrological part of the WIS providing data sharing solutions. It is a system of systems supporting interoperable hydrological data exchange using open standards and web services, and harmonizing the data to meet specific user needs.

The goal of WHOS is to make hydrological data accessible through the use of open standards and free open-source tools for the harmonization of data, metadata, protocols, and vocabularies. Due to the diversity in the use of hydrological data and heterogeneous data sources, their effective exchange requires the implementation of interoperability enablers and data exchange mechanisms such as WHOS Discovery and Access Broker (DAB) technology, and development of hydrological terminologiesand Metadata Data Profiles.

The WHOS has been implemented in La Plata Basin, Arctic Region, Dominican Republic, UK, and SAVA River Basin. Those regions benefit from a platform that enables interoperable data sharing among different stakeholders and water resources management. With new countries connecting to WHOS each year, there will be a notable improvement in global, regional and national implementation of Early Warning systems and other projects.

How to cite: Korhonen, J., Otieno, W., and Berod, D.: Hydrological Data Sharing is a key for Sustainable Development and building Early Warning Systems, EGU General Assembly 2023, Vienna, Austria, 23–28 Apr 2023, EGU23-12991, https://doi.org/10.5194/egusphere-egu23-12991, 2023.

EGU23-13215 | PICO | HS2.5.4

Improving global water quality information by combining in-situ data, remote sensing and modeling 

Christian Schmidt, Ilona Bärlund, Masooma Batool, Olaf Buettner, Hans Duerr, Martina Floerke, Thomas Heege, Seifeddine Jomaa, Rohini Kumar, Hinrich Paulsen, Karsten Rinke, Jaime Rivera, Philipp Saile, and Dietrich Borchardt

Achieving good ambient water quality for rivers, lakes and groundwater is anchored in the Sustainable Development Goals (SDGs). Poor water quality has considerable impacts on ecosystem integrity, human health, and food security. Information on the state of water quality is the basis for decision-making on pollution reduction measures.

To date, water quality information has mostly relied on data from on-site sampling and, increasingly, sensor-based monitoring stations. Despite the increasing amount of in-situ data and growing efforts to make these data easily accessible, spatial coverage and temporal consistency are not sufficient to provide comprehensive water quality information worldwide. In-situ data are particularly missing in low-income countries and regions known for their lack of data sharing policy . Therefore, it is necessary to tap into additional methods to obtain water quality information worldwide.

Data from satellites can provide information on optical water quality parameters such as turbidity and chlorophyll. Water quality models integrate observational data and build on the relationships between the state of water quality and its drivers such as agricultural practices and/or the discharge of untreated municipal wastewater. Models provide spatially and temporally consistent information and are the only tool that allows forecasts and projection of possible future water quality scenarios.

Combining information from these three sources (in situ data, satellite data, modeled data) helps to overcome specific limitations of each data source; and provides complementary information on the state of water quality parameters. 

We present the outcome of the GlobeWQ project (www.globewq.info) that has developed a prototype of a web-based platform that provides access to global and regional water quality information. The platform combines data from in-situ observations, satellite-based remote sensing, and water quality modeling to provide robust and timely water quality information. GlobeWQ provides global water quality information based on the WorldQual model, data-driven approaches and by incorporating in-situ data from the GEMStat water quality database (https://gemstat.org). At European scale the long-term nitrogen surplus has been reconstructed for more than a century (1850–2019) to assist modeling of nitrogen exports in European river catchments. 

Regional case studies have been established in a co-design process so that the data products are tailored to the needs of the regional users.

We demonstrate the capability of the “ triangulation” approach that combines the best available information from in-situ data , remote sensing and water quality modeling to improve the availability of water quality for the regional case studies (e.g.: Lake Victoria, Lake Sevan, Elbe River Basin). At the global scale, water quality modeling results are used to provide spatially and temporally resolved and consistent water quality information.

How to cite: Schmidt, C., Bärlund, I., Batool, M., Buettner, O., Duerr, H., Floerke, M., Heege, T., Jomaa, S., Kumar, R., Paulsen, H., Rinke, K., Rivera, J., Saile, P., and Borchardt, D.: Improving global water quality information by combining in-situ data, remote sensing and modeling, EGU General Assembly 2023, Vienna, Austria, 23–28 Apr 2023, EGU23-13215, https://doi.org/10.5194/egusphere-egu23-13215, 2023.

EGU23-14163 | PICO | HS2.5.4

Systematic water and climate observations through Global Water Data Centres and Networks 

Stephan Dietrich and Antonio Bombelli and the Data Centres and Networks of the Global Terrestrial Network Hydrology (GTN-H)

Life on Earth is closely linked to the availability of water and its variability. However, one third of the world, including sixty percent of Africa, does not have access to early warning and climate information services. This is directly related to the fact that there are worldwide still significant data deficient areas. To fill observational gaps the Global Climate Observing System (GCOS) has published an updated Implementation Plan, which was taken up by the Sharm el-Sheikh Climate Change Conference (COP-27). This resulted in a COP cover decision, that emphasizes (a) for the first time “the importance of protecting, conserving and restoring water and water-related ecosystems” and (b) “the need to address existing gaps in the global climate observing system, particularly in developing countries”.

Global data centres often operating under the auspices of UN agencies, collect and harmonise water data worldwide to make these global data sets available to the public. Most of these relevant Global Data Centres are members of the Global Terrestrial Network of Hydrology (GTN-H) that operates under auspices of WMO and the Terrestrial Observation Panel for Climate (TOPC) of the Global Climate Observing System GCOS. GTN-H links existing networks and systems for integrated observations of the global water cycle. The network was established in 2001 as a „network of networks“ to support a range of climate and water resource objectives, building on existing networks and data centres, and producing value-added products through enhanced communication and shared development. GTN-H aims for data and knowledge transfers between data providers, scientists and decision makers as well as between the different institutional bodies on UN-level such as the WMO, UNESCO, FAO, UNEP or GCOS. GTN-H thus directly links to the aims of the COP-27 cover decision as an example of coordination of activities by the systematic observation communities.

Updates of the in-situ branch of global terrestrial water resources monitoring will be demonstrated and a picture of a global water observation architecture will be drawn. The data centres aim to provide useful and actionable water and climate information for mitigation, adaptation and early warning systems. Satellite-based remote sensing of water-related parameters and operational data-assimilation services are becoming increasingly important to assess changes of the global terrestrial water cycle as part of the Essential Climate Variables. Still, in-situ data provide long-term records of changes in the various components of the hydrological cycle and are an important basis for the validation of remote sensing data. In addition, issues and suggestions to improve sustainable financing of observational networks will be highlighted to address data policies and enhanced exchange of basic hydrological observations. Based on the assessment, gaps in existing observation systems will be discussed and guidelines for future water cycle observation strategies will be formulated. 

How to cite: Dietrich, S. and Bombelli, A. and the Data Centres and Networks of the Global Terrestrial Network Hydrology (GTN-H): Systematic water and climate observations through Global Water Data Centres and Networks, EGU General Assembly 2023, Vienna, Austria, 23–28 Apr 2023, EGU23-14163, https://doi.org/10.5194/egusphere-egu23-14163, 2023.

Microwave links from cellular communication networks have been proposed as an opportunistic source of precipitation data more than two decades ago. The first scientific studies demonstrating the potential of this ground-based remote sensing technique, in particular for areas around the world were dedicated rainfall observation networks are sparse, were published some 15 years ago. Since then, a small but dedicated community of scientists and engineers working at universities, national meteorological services, consulting companies, mobile network operators and telecommunication equipment manufacturers has been making significant progress in turning this promise into a reality. In the meantime, numerous papers and reports have been published, conference presentations have been given and courses have been delivered. However, real-time access to high-resolution rainfall information from commercial microwave link networks over large continental areas is still a dream. How far have we come after 20 years of research and development? What does the future have in stall for the hydrological and meteorological communities? What should be done to turn this dream into a reality? This presentation will attempt to provide some preliminary answers to these questions.

How to cite: Uijlenhoet, R.: Opportunistic sensing of precipitation using commercial microwave links: opportunities and challenges, EGU General Assembly 2023, Vienna, Austria, 23–28 Apr 2023, EGU23-15358, https://doi.org/10.5194/egusphere-egu23-15358, 2023.

EGU23-15454 | PICO | HS2.5.4

The Global Runoff Data Centre: A building block in the chain of reproducible hydrology 

Thomas Recknagel, Claudia Färber, Henning Plessow, and Uli Looser

The Global Runoff Data Centre (GRDC) operates under the auspices of the World Meteorological Organization (WMO) at the German Federal Institute of Hydrology (BfG). It serves an important function for the scientific community as an archive for global runoff data. In 2022, the GRDC was referenced as a data source in over 100 peer-reviewed publications. 
Awareness of the need for reproducibility in hydrologic science has grown considerably in recent years. Thus, data archives also have the responsibility to improve their infrastructure to meet these requirements. Essential measures include making data and programs available in public repositories, containerization of computational environments and the provision of application programming interfaces (APIs).
To achieve these goals, the GRDC uses web portals for data provision, develops APIs for script-based data access, and provides program libraries in R or Python, e.g. for data analysis, as open source on repositories such as Github. We show the implementation status of these measures as well as positive effects that have resulted from the implementation, but also highlight obstacles and challenges in achieving a fully open and unrestricted data world.

How to cite: Recknagel, T., Färber, C., Plessow, H., and Looser, U.: The Global Runoff Data Centre: A building block in the chain of reproducible hydrology, EGU General Assembly 2023, Vienna, Austria, 23–28 Apr 2023, EGU23-15454, https://doi.org/10.5194/egusphere-egu23-15454, 2023.

EGU23-15510 | ECS | PICO | HS2.5.4

A data service for global groundwater and terrestrial water storage variations based on satellite gravimetry 

Christoph Dahle, Andreas Güntner, Ehsan Sharifi, Julian Haas, Wouter Dorigo, Adrian Jäggi, Claudia Ruz Vargas, and Henryk Dobslaw and the G3P team

Among the Essential Climate Variables (ECVs) defined by the Global Climate Observing System (GCOS), groundwater is one of the terrestrial ECVs in the field of hydrology. As the world’s largest distributed freshwater storage, groundwater is a key resource for mankind, industrial, and agricultural demands, and for ecosystems. Very recently, in its Implementation Plan of 2022, GCOS defined terrestrial water storage (TWS) as a new hydrological ECV. The state variable TWS quantifies the net effect of climatic, hydrological and anthropogenic change on the continental water cycle and is essential for closing the terrestrial water balance.

In spite of their importance, there is no data service or product yet on the ECVs groundwater and TWS in Copernicus, the European Union’s Earth observation program. The EU-funded project G3P (Global Gravity-based Groundwater Product) recently developed a satellite-based global-scale data set of groundwater storage anomalies (GWSA) for the period 2002-2020, with monthly resolution and on a 0.5-degree global grid. We present this data service developed as a prototype for later implementation into the EU Copernicus Climate Change Service. G3P is a global data set of groundwater storage variations as a cross-cutting extension of the existing Copernicus portfolio. G3P capitalizes from the unique capability of the satellite gravimetry mission GRACE (Gravity Recovery and Climate Experiment, 2002-2017) and its successor mission GRACE-FO (GRACE-Follow-On, since 2018) being the only remote sensing techniques to monitor subsurface mass variations, and from other satellite-based water storage products to provide a data set of groundwater storage change for large areas with global coverage. G3P is obtained by using a mass balance approach, i.e., by subtracting satellite-based water storage compartments such as snow water equivalent, root-zone soil moisture, glacier mass, and surface water storage from GRACE/GRACE-FO monthly TWS anomalies. The resulting TWS and groundwater data sets are currently made available via the GravIS portal and within GGMN, the Global Groundwater Monitoring Network of IGRAC, the International Groundwater Resources Assessment Centre.

The GravIS (‘Gravity Information Service’, gravis.gfz-potsdam.de) portal is operated by the German Research Centre for Geosciences (GFZ), together with the Technische Universität Dresden and the Alfred-Wegener-Institute (AWI). It facilitates the dissemination of user-friendly products of mass variations in the Earth system, based on GRACE/GRACE-FO. In addition to TWS and GWSA data, GravIS provides ocean bottom pressure (OBP) variations from which global mean barystatic sea-level rise can be estimated, as well as mass changes of the Greenland and Antarctic ice sheets. All these data sets can be interactively displayed at the portal and are freely available for download, either provided as gridded products or as regional averages.

This study has received funding from the European Union’s Horizon 2020 research and innovation programme for G3P (Global Gravity-based Groundwater Product) under grant agreement nº 870353.

How to cite: Dahle, C., Güntner, A., Sharifi, E., Haas, J., Dorigo, W., Jäggi, A., Ruz Vargas, C., and Dobslaw, H. and the G3P team: A data service for global groundwater and terrestrial water storage variations based on satellite gravimetry, EGU General Assembly 2023, Vienna, Austria, 23–28 Apr 2023, EGU23-15510, https://doi.org/10.5194/egusphere-egu23-15510, 2023.

EGU23-16216 | PICO | HS2.5.4

Maintaining operational services to share scientific knowledge and water data for a better world 

Frida Gyllensvärd, Berit Arheimer, Jafet Andersson, Peter Berg, Miranda Gatti, and Sara Schutzer and the IAHS Task force

Water is the basis for life and ultimately the reason why our society could develop the way it did, and thus, water security is an indirect core component in all 17 UN sustainable development goals. However, scientific water data and information are rarely accessible in an easy and understandable way for managers and policy makers. Moreover, hydrological sciences are fragmented with less tradition of sharing results, data and tools between scientists than in many other disciplines. Numerous efforts from development projects have launched prototypes and demonstrators of web-based applications to overcome these issues, but without long-term maintenance most of them disappear at project end. Here we will present experience from developing, maintaining and using three non-commercial operational services to facilitate actions in water security and promote scientific engagement with stakeholders.

https://hypeweb.smhi.se/ provides readily available modelled hydrological data for continent or global scale at sub-catchment resolution of some 100 km2 (Arheimer et al., 2020), along with open source code with documentation and data compilation/visualization/training tools. The visitor can explore data for the past, present or future, download the numerical model, or order data subscriptions. SMHI has a long tradition of operational water predictions and also estimate status of water quality, design values for infrastructure, and the impact of climate change on water resources. The website is linked to an annual open (free) training course in HYPE modelling for various societal needs.

https://climateinformation.org/ offers access to three different tools to explore climate-change impact on water resources: 1) instant summary reports of climate change for any site on the globe, 2) easy access to many pre-calculated climate indicators, 3) a software package to calculate indicators by inserting local observations. The main purpose of this new service is to provide scientific data to argue for climate mitigation and adaptation investments in vulnerable countries (Photiadou et al., 2021). Pre-calculated water variables are based on a state-of-the-art production chain with global model ensembles from CMIP, Cordex, a global catchment model (WWH) and a rigorous quality assurance protocol.

https://dwg.smhi.se/dwg/ (prototype for a Digital Water Globe– address will change in February) is a brand-new platform to search and find (based on key-words) where on Earth there are: scientific results available from research projects (case-studies), monitoring programs (data repositories), publications (in HSJ, PIAHS) and researchers (personal profiles). The aim is to stimulate and facilitate engagement, interactions and dialogues among scientists and between scientists and stakeholders. The Digital Water Globe offers co-creation and re-examines the role of scientific outreach; it is a scientific community effort completely dependent on content from the users to explore networking and science communication in action.

The presentation will focus on obtained feedback, opportunities and challenges in running operational services with aim to share scientific data with a wide range of users.


References:

Arheimer et al., 2020: Global catchment modelling using World-Wide HYPE (WWH), open data and stepwise parameter estimation, HESS 24, 535–559, https://doi.org/10.5194/hess-24-535-2020   

Photiadou et al. 2021. Designing a climate service for planning climate actions in vulnerable countries. Atmosphere 12:121. https://doi.org/10.3390/atmos12010121 


How to cite: Gyllensvärd, F., Arheimer, B., Andersson, J., Berg, P., Gatti, M., and Schutzer, S. and the IAHS Task force: Maintaining operational services to share scientific knowledge and water data for a better world, EGU General Assembly 2023, Vienna, Austria, 23–28 Apr 2023, EGU23-16216, https://doi.org/10.5194/egusphere-egu23-16216, 2023.

EGU23-16890 | PICO | HS2.5.4

PO.DAAC SWOT Hydrology Data Tools and Services 

Suresh Vannan, Catalina Taglialatela, Cassandra Nickles, Nicholas Tarpinian, Frank Greguska, Victoria McDonald, Edward Armstrong, Mike Gangl, and Jack McNelis

The Physical Oceanography Distributed Active Archive Center (PO.DAAC https://podaac.jpl.nasa.gov/) is NASA’s data center for the Surface Water and Ocean Topography (SWOT) mission (https://podaac.jpl.nasa.gov/SWOT?sections=data), which has recently launched in December 2022. PO.DAAC also archives physical oceanography data, which includes winds, salinity, sea surface temperature, gravity, ocean circulation, and a growing number of terrestrial hydrology data. The SWOT mission provides a comprehensive view of Earth's freshwater bodies from space and allows scientists to determine changing volumes of fresh water across the globe. SWOT hydrology data (of rivers, lakes, and reservoirs) is expected to be made publicly available in the latter part of 2023 (exact timeframe TBD). PO.DAAC has been preparing its data archive to deliver various tools and services to the hydrologic community in support of streamlined data access and use. In anticipation for SWOT, PO.DAAC has gathered requirements from the hydrology community over the last several years. In this presentation we will cover the various information systems developed to meet the hydrology community needs. PO.DAAC has also been working on migrating all of its data to the cloud. Users now have the ability to explore SWOT hydrology data directly in the Earthdata Cloud and also interface with the data using Application Programming interfaces (API). Hydrology domain specific data search and discovery methods (such as search by pre-defined hydrologic units) have also been implemented. PO.DAAC has been focused on exposing its SWOT hydrology data through programming interfaces such that scripting tools to GIS software can easily interface with the SWOT data. PO.DAAC has also been developing new functionalities to support analysis of large data, and new, innovative science and applications. Those functionalities and services will be discussed, along with what datasets users can find on the cloud, which will remain free and open to discover and access. 

How to cite: Vannan, S., Taglialatela, C., Nickles, C., Tarpinian, N., Greguska, F., McDonald, V., Armstrong, E., Gangl, M., and McNelis, J.: PO.DAAC SWOT Hydrology Data Tools and Services, EGU General Assembly 2023, Vienna, Austria, 23–28 Apr 2023, EGU23-16890, https://doi.org/10.5194/egusphere-egu23-16890, 2023.

HS3 – Hydroinformatics

 The water distribution network (WDN), a vital component of the water supply system, is an essential urban infrastructure distributing potable water to society. Its design, a non-deterministic polynomial-hard problem, has been a widely studied complex research problem for decades, with various optimization models proposed for its optimal design. Recent advancements in enhancing the computational efficiency of stochastic optimization algorithms by introducing chaotic force have elevated the scope of formulating chaos-directed evolutionary algorithms (EAs). The present study proposes one such approach, the chaos-directed genetic algorithm (CDGA) model, to improve the search mechanism of the genetic algorithm (GA) in solving the complex optimization problem of WDN optimal design.

In one of our recent works, the influence of chaotic maps with high-dimensionality, the Henon and Lorenz maps, are explored and compared to the low-dimensional Logistic map in improving the performance of GA. With the one-dimensional Logistic map demonstrating better computational improvement of GA, the present study considers it for formulating the CDGA model. The Logistic map is a non-linear first-order difference equation. Its dynamics evolve into various possible states of system range without repetition. For the search mechanism of the optimization technique to explore different regions of search space, this particular characteristic forms the most favorable feature. Consequently, by incorporating the chaotic force of the Logistic map into GA’s evolutionary mechanism by replacing every random search phenomenon, the CDGA model is formulated. A novel method of non-sequential allocation of chaotic dynamics is employed to induce chaotic force. Notably, the method is unique, using the same initial characteristics of the Logistic equation, retaining the chaos ergodicity for the evolutionary search.

To demonstrate the computational efficiency of the CDGA model, the enormously studied benchmark problem, the Hanoi network (HN), is considered. HN is a 34-dimensional problem having a complex search space with multiple locally optimal solutions. Defining the WDN optimization problem as the single-objective design framework subjected to linear and non-linear constraints of governing laws, the principal objective is to minimize the investment cost of HN pipes. While minimizing the pipe investment cost, the constraints levied ensure that the HN is hydraulically adequate to deliver the design demands. Thus, the optimization model formulated is the integrated framework with the simulation tool to simulate the WDN's hydraulic conditions. The code for the CDGA model is written in MATLAB R2015a and combined with the simulation software, EPANET 2.0, using the EPANET-MATLAB toolkit.

The computational results demonstrate the convergence precision of the CDGA model over its traditional GA, converging to the optimal cost of 6,081,564 units, the previous best solution reported for HN in the literature. Moreover, it outperforms many stochastic optimization models reported in the literature with computational efficiency in solving HN, particularly simulated annealing, shuffled complex, shuffled frog leaping, ant colony, particle swarm, harmony search, krill herd, and cuckoo search algorithms. Hence, from the results, the study suggests formulating chaos-directed optimization algorithms to improve their traditional model's computational efficiency in solving complex optimization problems.

Keywords: Water distribution network optimal design; Evolutionary algorithms; Genetic algorithm; Chaotic maps; Logistic equation; Hanoi network


How to cite: Poojitha, S. N. and Jothiparakash, V.: Application of Enhanced Search Technique: Chaos-Directed Genetic Algorithm in Optimal Design of Water Distribution Network, EGU General Assembly 2023, Vienna, Austria, 23–28 Apr 2023, EGU23-641, https://doi.org/10.5194/egusphere-egu23-641, 2023.

EGU23-724 | ECS | Posters virtual | HS3.1

Reservoir Operation and Multi-Attribute Decision-Making – Web-based Tool 

Moola Rajasree and Roshan Srivastav

Reservoir operation plays a significant role in effectively managing water resources, especially mitigating future droughts. Several simulation, and optimization models are used to obtain optimal reservoir operation solutions based on hedging rules. These solutions are usually in the form of Pareto front and are derived to satisfy multiple objectives related to water supply measures. However, it is challenging to achieve a single solution when various performance indices such as reliability, resilience and vulnerability are considered in evaluation. Therefore, this study proposes a web-based application for reservoir operation with Multi-Attribute Decision Making (MADM) methods to evaluate and provide rankings for reservoir operation solutions. It includes two components: (i) reservoir operation module based on simulation-optimization framework with hedging policies; and (ii) decision-making module that includes evaluation and ranking of solutions obtained from first module and comparison of rankings obtained from various MADM methods. Overall the tool provides a set of solutions for different water supply reduction measures/hedging policies and ranking the solutions for performance indices which would help reservoir operators, practitioners, and researchers for optimal water allocation and decision-making.

How to cite: Rajasree, M. and Srivastav, R.: Reservoir Operation and Multi-Attribute Decision-Making – Web-based Tool, EGU General Assembly 2023, Vienna, Austria, 23–28 Apr 2023, EGU23-724, https://doi.org/10.5194/egusphere-egu23-724, 2023.

Reservoirs play a crucial role in water resources management. However, quantifying reservoir storage prediction is challenging, especially when reservoir inflow data is unavailable. In recent years, Machine Learning (ML) models have shown their successful application in hydrological predictions, although these models are criticized for their inability to follow physical constraints. On the other hand, conceptual models are applied widely in various hydrological studies due to their simplistic structure yet inclusive of various hydrological processes. However, these conceptual models show limited predictive skills. Thus, synergizing domain knowledge from a conceptual model with the predictive ability of the ML model can help for better physical consistent outputs. We developed the Physics Informed Machine Learning (PIML) model for reservoir storage predictions. This model combines the predictability of Long Short Term Memory (LSTM) with domain understanding of the conceptual (SIMHYD) model. The applicability of the PIML model is demonstrated on two United States reservoirs where reservoir inflow data is unavailable. Our results show that the PIML model outperforms the SIMHYD model in the reservoir storage predictions while being mindful that reservoir storage will not be more than the maximum storage capacity. This study may be helpful in better-informed reservoir operation in the data-scarce catchments.

How to cite: Bhasme, P. and Bhatia, U.: Synergizing Machine Learning with Conceptual Model for Daily Reservoir Storage Predictions in the Data-scarce catchments, EGU General Assembly 2023, Vienna, Austria, 23–28 Apr 2023, EGU23-774, https://doi.org/10.5194/egusphere-egu23-774, 2023.

EGU23-844 | ECS | Posters on site | HS3.1

Streamflow Estimation in Ungauged Catchments in Brazil using Machine Learning Approaches 

Rafael Barbedo, Mino Sorribas, and Walter Collischonn

Knowing river flows in space and time is fundamental for several hydrological and environmental applications. One of the greatest challenges in hydrology, however, is having this information at every river stretch, as we can only focus our resources in obtaining measurement at particular sites. Several research initiatives have been developed over the next years to address this problem, a notorious one being the prediction in ungauged basins (PUB) by the International Association of Hydrological Sciences (IAHS).

One of the most used approaches for PUB is using catchment descriptors – such as elevation, slope, land cover, and soil types – in statistical (data-driven) models to estimate hydrological signatures – such as mean annual streamflow, flow-duration curves, and high/low flows. There is a wide range of statistical methods that can be used in this regard, either by grouping catchments of similar characteristics and applying regression equations, using geospatial interpolation techniques, among others. In recent years, regression techniques based on Machine Learning (ML) approaches have been extensively developed, presenting great results in all areas of knowledge. In hydrological sciences, particularly for PUB, the potential of using these techniques is enormous, and yet, they have not been much explored.

In this context, we’ve built a ML regression modelling pipeline to estimate mean annual flows and low flows, and tested it in several different catchments covering the whole of Brazil, using different models to compare the results. The pipeline consists in (1) collecting environmental data for the catchments, (2) selecting the best descriptors, (3) tunning the hyperparameters of the ML model, (4) evaluating the performance of the model, (5) computing the importance of the predictors, and (6) assessing the uncertainty of the estimations. Also, the pipeline is model-independent, i.e., it can be applied to any ML regression model.

We evaluated results against consistent streamflow data from 1069 gauges spread across the country that cover distinct characteristics, using 100-fold cross validation, obtaining R2 scores of ~0.8 for mean annual flows and ~0.7 for low flows, for all ML models except multiple linear regression, which didn’t present good results. Average and low precipitations were the main drivers for predicting both flow variables, although using these alone didn’t yield in good metrics. Other important predictors were linked to soil types, land cover, wetlands, and drainage density. We extrapolated the results to all catchments in Brazil, along with uncertainty estimations.

Acknowledgement: 

The authors would like to acknowledge the financial support provided by the Brazilian Coordination for the Improvement of Higher Education Personnel (CAPES) and the Brazilian National Water and Sanitation Agency (ANA), the latter in the context of the project "Technological Cooperation for Hydrological Assessments in Brazil" (grant number: TED-05/2019-ANA). Additional acknowledgements to the Google LLC for making available the Google Earth Engine (GEE) platform, and all data providers for the global products used in this study.

How to cite: Barbedo, R., Sorribas, M., and Collischonn, W.: Streamflow Estimation in Ungauged Catchments in Brazil using Machine Learning Approaches, EGU General Assembly 2023, Vienna, Austria, 23–28 Apr 2023, EGU23-844, https://doi.org/10.5194/egusphere-egu23-844, 2023.

EGU23-1143 | ECS | Posters on site | HS3.1

Reconstructing floods from large-scale atmospheric variables with neural networks in high latitude climates 

Jenny Sjåstad Hagen, Ramin Hasibi, Etienne Leblois, Deborah Lawrence, and Asgeir Sorteberg

Climate change is expected to alter the occurrence of floods in high latitude countries; evidence of earlier spring floods and more frequent rainfall-driven floods has already been detected in Norway. While the state-of-the-art hydrological climate-impact model chain embeds explicit assumptions about stationarity, machine learning offers a complementary approach to hydrological climate-impact modelling by facilitating direct downscaling from large-scale atmospheric variables to streamflow, thus making downscaling and bias-correction implicit. While applications of machine learning algorithms for streamflow and flood modelling are well documented in the scientific literature, few studies have linked large-scale atmospheric variables directly to streamflow without including observed streamflow as part of the input variable selection. Such autoregressive models have limited application for climate-impact studies, as future streamflow is yet to observe. Furthermore, most studies linking large-scale atmospheric forcing to catchment response have focused on monthly, seasonal, or annual streamflow. This study presents the application of feed-forward and recurrent neural networks for daily streamflow and flood reconstruction from atmospheric reanalysis data with comparable spatiotemporal resolution to global climate model outputs. Two widely applied neural network types, namely multilayer perceptron (MLP) and long short-term memory (LSTM), were benchmarked against gradient boost regression tree models. Catchment-specific, physically-based input variable selections representing the dominant flood-drivers were identified for 27 catchments in Norway. The selected catchments have low degrees of basin development and anthropogenic influence so that the established statistical links only reflect the forcing-response relationship between the atmosphere and the catchments. Overall, the LSTM obtained the highest accuracy, with a median Nash Sutcliffe Efficiency (NSE) of 0.88 on the training set (1950-2000) and 0.76 on the testing set (2006-2010). However, the MLP proved more robust, with a smaller drop in NSE from training (0.76) to testing (0.72), indicating that further restricting the input variables based on hydrological theory and physical interpretability may increase the robustness of neural networks in the context of daily streamflow modelling. The median NSE of the regression tree models was lower on both the training set (0.73) and the testing set (0.66). The results point to the potential of neural networks for hydrological climate-impact modelling in catchments where both snowmelt and rainfall constitute flood-drivers in the present climate. This research provides a springboard for future studies employing neural networks for hydrological climate-impact modelling in high latitude countries. Future research should assess the potential for regionalization by including catchment characteristics through clustering techniques like Kohonen Self-Organizing Maps.

How to cite: Hagen, J. S., Hasibi, R., Leblois, E., Lawrence, D., and Sorteberg, A.: Reconstructing floods from large-scale atmospheric variables with neural networks in high latitude climates, EGU General Assembly 2023, Vienna, Austria, 23–28 Apr 2023, EGU23-1143, https://doi.org/10.5194/egusphere-egu23-1143, 2023.

EGU23-1160 | ECS | Orals | HS3.1

Global streamflow modelling using process-informed machine learning 

Michele Magni, Edwin H. Sutanudjaja, Youchen Shen, and Derek Karssenberg

Hydrological models include errors when reproducing real-world observations, due to uncertainties in their components that inevitably propagate to the simulated variable. A large body of research in streamflow prediction blends statistical learning into the hydrological sciences, modelling river discharge using meteorological variables and catchment attributes as predictors of observed streamflow.

We developed a novel hybrid framework that integrates information from the process-based global hydrological model PCR-GLOBWB to reduce prediction errors in streamflow simulations. Our statistical methodology employs simulated streamflow and state variables from PCR-GLOBWB as additional predictors of observed river discharge. These model outputs provide supplemental information that is effectively used in a random forest, trained on a global database of streamflow measurements, to improve estimates of simulated river discharge across the globe. PCR-GLOBWB was run for the years 1979-2019 at 30arcmin and daily resolution, and the simulated state variables were then aggregated to monthly time steps. A single random forest model was trained with these state variables, meteorological data and catchment attributes, as predictors of observed streamflow from 2286 stations worldwide.

Results based on cross-validation show that the model is capable of discerning between a variety of hydro-climatic conditions and river flow dynamics, improving KGE of PCR-GLOBWB simulations at more than 80% of testing locations and increasing median KGE from -0.02 in uncalibrated runs to 0.52 after post-processing. Performance boosts are usually independent of availability of streamflow data at a particular station, thus making our method a potential candidate in addressing prediction in poorly gauged and ungauged basins.

Further research is still needed to test the potential influence of additional predictors describing catchment and time-series behaviour. Cluster analysis is required to understand why the post-processing framework still performs poorly at some stations. For prediction purposes, future efforts should also be directed at testing the model at higher spatial resolutions globally, and at finer temporal resolutions.

How to cite: Magni, M., Sutanudjaja, E. H., Shen, Y., and Karssenberg, D.: Global streamflow modelling using process-informed machine learning, EGU General Assembly 2023, Vienna, Austria, 23–28 Apr 2023, EGU23-1160, https://doi.org/10.5194/egusphere-egu23-1160, 2023.

EGU23-1540 | ECS | Posters on site | HS3.1

Predicting estuarine salt intrusion with a long short-term memory model 

Bas Wullems, Claudia Brauer, Fedor Baart, and Albrecht Weerts

Estuarine salt intrusion causes problems with freshwater availability in many deltas. For water managers to mitigate and adapt to salt intrusion, they require timely and accurate forecasts. Data-driven models derived with machine learning can help with this, as they can mimic complex non-linear systems and are computationally very efficient. We set up such a model for salt intrusion in the Rhine-Meuse delta. The model predicts chloride concentrations at Krimpen aan den IJssel, an important location for freshwater provision. As input features, we selected observations of water level, discharge, chloride concentration and wind speed. We then used the Boruta algorithm to select a subset of relevant features. We set up a Long Short-Term Memory network (LSTM) to make predictions of chloride concentrations one day ahead and ran the resulting model multiple times to simulate a multi-day forecast. This model predicts baseline concentrations and peak timing well, but peak height is underestimated, a problem that gets worse with increasing lead time. Because this model is reasonably successful, we aim to extend it to other locations in the delta. We also expect a similar setup can work in other deltas, especially those with a similar or simpler geometry. A more complete version of this model should finally be made suitable for use in an operational forecasting system.

How to cite: Wullems, B., Brauer, C., Baart, F., and Weerts, A.: Predicting estuarine salt intrusion with a long short-term memory model, EGU General Assembly 2023, Vienna, Austria, 23–28 Apr 2023, EGU23-1540, https://doi.org/10.5194/egusphere-egu23-1540, 2023.

EGU23-1672 | ECS | Orals | HS3.1

An open source library for environmental isotopic modelling using machine learning techniques 

Ashkan Hassanzadeh, Sonia Valdivielso, Enric Vázquez-Suñé, Rotman Criollo, and Mercè Corbella

Stable isotopic composition modelling of water is an important part of resource management studies. We present a tool that estimates water stable isotope compositions using discontinuous inputs in time and space through machine learning algorithms. This tool has a multi-stage coupled algorithm that firstly calculates the parameters defined by the user that potentially affect the isotopic composition such as meteorological parameters, then, integrates the results of different parameters and generates the isotopic composition models for each time window. Isocompy time windows can be defined flexibly based on the amount of spatial-temporal properties of the available data. A variety of decision-making algorithms are implemented in this tool as an optional support to the user in different stages: from dataset preprocessing, outlier detection, statistical analysis, feature selection, model validation and calibration to postprocessing. Reports, figures, datasheets and maps could be generated in each step to clarify the underlying processes.

All in all, this tool aims (1) to offer an integrated, open-source Python library that is dedicated to the water isotopic composition statistical-regression modelling (2) to potentially improve our understanding of the precipitation stable isotopes by implementing novel machine-learning tools; and (3) to ensure reproducible research in environmental studies.

How to cite: Hassanzadeh, A., Valdivielso, S., Vázquez-Suñé, E., Criollo, R., and Corbella, M.: An open source library for environmental isotopic modelling using machine learning techniques, EGU General Assembly 2023, Vienna, Austria, 23–28 Apr 2023, EGU23-1672, https://doi.org/10.5194/egusphere-egu23-1672, 2023.

Enhanced geothermal systems are essential to provide sustainable and long-term geothermal energy supplies and reduce carbon emissions. Optimal well-control scheme for effective heat extraction and improved heat sweep efficiency plays a significant role in geothermal development. However, the optimization performance of most existing optimization algorithms deteriorates as dimension increases. To solve this issue, a novel surrogate-assisted level-based learning evolutionary search algorithm (SLLES) is proposed for heat extraction optimization of enhanced geothermal systems. SLLES consists of classifier-assisted level-based learning pre-screen part and local evolutionary search part. Specifically, the classifier-assisted level-based learning strategy employs probabilistic neural network as the classifier to classify the offspring into pre-set number of levels. The offspring in different levels uses level-based learning strategy to generate more promising and informative candidates pre-screened by classifier to conduct real simulation evaluations. In the local evolutionary search part, a surrogate model is constructed at the local promising area. The optimum of the surrogate model obtained by the optimizer is selected to conduct real simulation evaluations. The cooperation of the two parts is able to achieve balance between the exploration and exploitation during the optimization process. After iteratively sampling from the design space, the robustness and effectiveness of the algorithm are proven to be improved significantly. To the best of our knowledge, the proposed algorithm holds state-of-the-art simulation-involved optimization framework. Comparative experiments have been conducted on benchmark functions, a two-dimensional fractured reservoir and a three-dimensional enhanced geothermal system. The proposed algorithm outperforms other five state-of-the-art surrogate-assisted algorithms on all selected benchmark functions. The results on the two heat extraction cases also demonstrate that SLLES can achieve superior optimization performance compared with traditional evolutionary algorithm and other surrogate-assisted algorithms. This work lays a solid basis for efficient geothermal extraction of enhanced geothermal system and sheds light on the model management strategies of data-driven optimization in the areas of energy exploitation.

How to cite: Chen, G., Jiao, J. J., and Luo, X.: Classifier-assisted level-based learning evolutionary search for heat extraction optimization of enhanced geothermal systems, EGU General Assembly 2023, Vienna, Austria, 23–28 Apr 2023, EGU23-1819, https://doi.org/10.5194/egusphere-egu23-1819, 2023.

EGU23-2110 | ECS | Posters on site | HS3.1

Satellite gravimetry helps monitor the operation of large reservoirs 

Jessica Besnier, Augusto Getirana, Nishan Biswas, and Venkataraman Lakshmi

All over the world, water levels are constantly changing. From lakes, to rivers, to oceans, the patterns of the water levels change due to different factors. With hydrological extremes increasing in intensity and duration around the world, it is important to understand what changes these levels in order to better predict and mitigate the negative impacts of changing water levels.

The goal of this study is to use estimates of terrestrial water storage (TWS) variability from the Gravity Recovery and Climate Experiment (GRACE) satellite mission to predict reservoir operation in Brazil. To do this, reservoir water elevations are derived from multi-satellite radar altimetry (RA) data and used as a proxy of their operation. 30 reservoirs in Southern Brazil are considered. For each reservoir, the Pettitt test was used to identify the point break within the TWS data, and the Mann-Kendall test was used to identify trends before and after these breaks.

A machine learning approach was used to reconstruct RA-based water elevations using GRACE data. The approach considered numerous geomorphologic and meteorologic characteristics of reservoirs, including reservoir area, volume, location, extent, depth, drainage area, and elevation, in addition to precipitation and temperature. Break points of time series and trends were also computed for each reservoir to explain why some reservoirs present a better fit than others. The findings of this study will give insight into what variables affect the relationship between TWS and RA height in the Parana Basin in Southern Brazil.

How to cite: Besnier, J., Getirana, A., Biswas, N., and Lakshmi, V.: Satellite gravimetry helps monitor the operation of large reservoirs, EGU General Assembly 2023, Vienna, Austria, 23–28 Apr 2023, EGU23-2110, https://doi.org/10.5194/egusphere-egu23-2110, 2023.

EGU23-2328 | ECS | Posters on site | HS3.1

Real-time gradual leakage detection system for water distribution networks based on MIMO-ANN 

Xi Wan, Raziyeh Farmani, and Edward Keedwell

Leakage detection is a critical issue in water management for water distribution systems (WDSs). With the availability of real-time monitoring data, leakage detection for WDSs based on data-driven methods has received increasing attention in recent years. Current data-driven leakage detection methods are based on a single-step prediction model that only focuses on burst events that are characterized by sudden changes in flow or pressure data in a very short time. However, gradual leakage events that develop from small seeps to noticeable leaks could last for weeks or even months, and these gradual events will cause more water loss and do more harm to the WDS. Furthermore, the gradual leakage events are more challenging to be detected due to its slowly changing pattern. Therefore, this work presents an early warning system for gradual leakage events based on a multistep forecasting strategy. A multi-input multi-output (MIMO) artificial neural network (ANN) is developed to capture the diurnal, weekly and seasonal patterns in the flow monitoring data. The generated forecasting vector is further compared with the observed measurements based on the cosine distance. The residual vector is further analyzed by exponential weighted moving average (EWMA) to smooth the spikes and noises. The final statistics are then used to raise alarms for the monitoring data. The method has been applied to a hypothetical town called L-Town to demonstrate its applicability. The results showed that the proposed method is capable of detecting gradual leakage events with a very small growth rate. In addition, all gradual leakage events are detected with short detection time, high detection accuracy, and low false alarms.

How to cite: Wan, X., Farmani, R., and Keedwell, E.: Real-time gradual leakage detection system for water distribution networks based on MIMO-ANN, EGU General Assembly 2023, Vienna, Austria, 23–28 Apr 2023, EGU23-2328, https://doi.org/10.5194/egusphere-egu23-2328, 2023.

An intensified hydrological cycle due to climate change is expected to increase precipitation extremes, but how river flood magnitudes will respond to this change remains disputed. Historically, there is only limited observational evidence that increasing precipitation extremes directly translate into systematically increased flood magnitudes. The incongruence between extreme precipitation and flooding is likely related to the compounding nature of various flooding drivers such as snowmelt and antecedent soil moisture. This complex interplay between flooding drivers makes it challenging to predict flood risks under warming. In order to better understand how precipitation extremes affect river floods in a warming climate, it is essential to disentangle the impacts of different drivers and conditions in flood generation. In this study, we employ an interpretable machine learning approach together with a large-sample hydrological dataset to identify the impact of various drivers in flood generation across a myriad of globally distributed catchments. We analyze how these impacts change with warmer temperatures and how – in response – their relationships with flood occurrence and magnitude change. The results indicate that increases in precipitation extremes have indeed contributed increasingly to flood generation in many regions over the historical period. The fact that flood magnitudes did not necessarily increase is likely a result of decreasing contributions of other drivers. We further investigate how future floods may change given the continuously rising trend of precipitation extremes. Overall, the study emphasizes the value of interpretable machine learning in helping understand how flood risks are likely to change in a warming climate.

How to cite: Jiang, S. and Zscheischler, J.: Revealing how precipitation extremes impact river floods in a warming climate with interpretable machine learning, EGU General Assembly 2023, Vienna, Austria, 23–28 Apr 2023, EGU23-2343, https://doi.org/10.5194/egusphere-egu23-2343, 2023.

EGU23-2543 | ECS | Orals | HS3.1

Urban non-point source pollution modelling: A physics-informed neural network approach 

Sijie Tang, Yin Wan, Fangze Shang, Shuo Wang, and Jiping Jiang

Over the past decades, urban non-point source (NPS) pollution has been the most severe threat to the urban water environment. The sharp increase of impervious surface and the high level of particulate matter from massive human activities exacerbated the water quality of surface runoff, leading to the significant urban NPS pollution globally whereby it is of importance to have a deep knowledge on the accumulation and transport of pollutants. A series of traditional physical models have been developed to simulate the runoff generating as well as the NPS pollution. However, a disadvantage of process-based modelling is its great demand for a large amount of field data which may normally be inaccessible, as well as the demand for the expertise in applying appropriate modelling method on specific study area. Empirical models do not characterize complex physical processes of NPS pollution and thus require fewer data and modelling skills. Nevertheless, the limitation is that these modelling approaches are region-sensitive and spatially untransferable. It is challenging to fill the gap between the requirement of urban water environment management and existing modelling performance on NPS pollution, in the absence of a more effective model with high accuracy, easy employment, and spatial transferability.

Machine learning approach has been utilized in environmental studies for decades, and was originally believed to be a black box that can barely provide any physical insight into environmental processes. However, an approach named physics-informed neural networks (PINN) was proposed lately and then applicated in dynamical system. This approach embeds differential equations of priori knowledge into neural network to make modelling interpretable and generalizable. In this study, a physical process embedded LSTM network was proposed to formulate the cumulation and transport of urban NPS pollution in rainfall runoff, based on the coupling of LSTM and differential equations of classic exponential build-up/wash-off processes. Water quality data of urban runoff from sampling and continuous real-time monitoring campaigns distributed in China, USA and New Zealand were collected and fed into proposed network to model the primary NPS pollutant TSS. The results revealed that the hybrid PINN model excels the vanilla LSTM approach and auto-calibrated SWMM approach in accuracy and convenience. The interpretable model also enhanced the cross-catchment transferability of model for urban water management in data-poor area. In addition, the trained parameters of network units were found consistent with the prior knowledge of accumulation and transport of NPS pollutants, indicating the deep coupling of neural network and physical process. As a very early case of hybrid AI modelling in urban NPS pollution, this study provided a new perspective on water quality modelling and can help in improving the standards of urban environment governance.

How to cite: Tang, S., Wan, Y., Shang, F., Wang, S., and Jiang, J.: Urban non-point source pollution modelling: A physics-informed neural network approach, EGU General Assembly 2023, Vienna, Austria, 23–28 Apr 2023, EGU23-2543, https://doi.org/10.5194/egusphere-egu23-2543, 2023.

EGU23-2666 | ECS | Posters on site | HS3.1

Hybrid Multi Models Ensemble Framework Based on Clustering Algorithms  for Runoff Reconstruction 

Ujjwal Singh, Petr Maca, and Martin Hanel

Runoff is the key hydrological process, which is vital to the sustaining of human life on earth in examining
the climate change scenario. There are a lot of hydrological models available to simulate the runoff, but
these models’ outputs have biases due to uncertainty. Most machine learning algorithms cannot capture
the runoff generated by the real-world complex hydrological system accurately. The hybrid model combines
the efficiency of hydrological, machine learning, and ensemble modeling to minimize the bias of output [1],
[2]. The recent development of evolutionary computation in hybrid modelling frameworks combines the
efficiency of different components such as hydrological models, spatial autocorrelation, machine learning,
and machine learning ensemble to estimate robust and less biased runoff [1]. However, these components
need to significantly capture the heterogeneity and similarity of the catchment properties, which are highly
linked with the spatial variation of various hydrological patterns. Clustering is a technique that can group
similar types of hydrological patterns, which can be integrated within a hybrid modeling framework.
However, there is rarely found literature on the hybrid framework, which consists of different clustering
techniques and their ensemble. These clustering algorithms are based on different categories. We proposed
the hybrid ensemble framework based on extended input data, hydrological models, different clustering
algorithms, deep learning, and an ensemble of deep learning to reconstruct the minimum biased surface
runoff. We tested our proposed hybrid framework, which is robust compared to previously developed
frameworks. This proposed hybrid framework methodology will help to develop a new hybrid algorithm
to estimate the less biased surface runoff using various available climate data to understand the dynamics
of surface runoff for different spatial-temporal scales and climates.


[1] U. Singh, P. Maca, M. Hanel, et al., “Hybrid multi-model ensemble learning for reconstructing gridded
runoff of europe for 500 years,” vol. Available at SSRN: doi: 10 . 2139 / ssrn . 4188518. [Online].
Available: http://dx.doi.org/10.2139/ssrn.4188518.
[2] S. M. Hauswirth, M. F. Bierkens, V. Beijk, and N. Wanders, “The suitability of a hybrid framework
including data driven approaches for hydrological forecasting,” Hydrology and Earth System Sciences
Discussions, pp. 1–20, 2022.


How to cite: Singh, U., Maca, P., and Hanel, M.: Hybrid Multi Models Ensemble Framework Based on Clustering Algorithms  for Runoff Reconstruction, EGU General Assembly 2023, Vienna, Austria, 23–28 Apr 2023, EGU23-2666, https://doi.org/10.5194/egusphere-egu23-2666, 2023.

EGU23-2910 | ECS | Orals | HS3.1

Thermodynamic integration via Replica Exchange Hamiltonian Monte Carlo for faster sampling and model comparison 

Damian M. Ndiwago, Remko Nijzink, Christophe Ley, Stanislaus J. Schymanski, and Jack S. Hale

Hydrologists often need to choose between competing hypotheses or weight the predictions of different models when averaging models. Several criteria for choosing and weighting models have been developed, which balance model complexity and goodness of fit by penalising the number of model parameters. The penalty is explicit for information theory approaches or implicit for Bayesian model selection based on marginal likelihood and, by extension, the Bayes factor. The Bayes factor is the ratio of the marginal likelihoods of two competing models. Also, the Bayes factor can be used for non-nested models in contrast to information-theoretic approaches. However, marginal likelihood estimation is computationally intensive and slow for dynamic models with multiple modes. This study uses Replica Exchange Hamiltonian Monte Carlo and thermodynamic integration for fast, simultaneous calculation of marginal likelihood and parameter identification of dynamic rainfall-runoff models. Using synthetic data, the method selected the true model in our numerical experiments. The technique was also applied to real data from Magela Creek in Australia. The selected model was not the model with the highest or lowest number of parameters for real data. The method is implemented using the differentiable programming software ''TensorFlow Probability". This implementation can be applied to other types of models for fast simultaneous parameter estimation and model comparison.

How to cite: M. Ndiwago, D., Nijzink, R., Ley, C., J. Schymanski, S., and S. Hale, J.: Thermodynamic integration via Replica Exchange Hamiltonian Monte Carlo for faster sampling and model comparison, EGU General Assembly 2023, Vienna, Austria, 23–28 Apr 2023, EGU23-2910, https://doi.org/10.5194/egusphere-egu23-2910, 2023.

EGU23-3296 | ECS | Posters on site | HS3.1

Large-scale comparison of machine and statistical learning algorithms for blending gridded satellite and earth-observed precipitation data 

Georgia Papacharalampous, Hristos Tyralis, Anastasios Doulamis, and Nikolaos Doulamis

An established way for improving the accuracy of gridded satellite precipitation products is to “correct” them by exploiting ground-based precipitation measurements, together with machine and statistical learning algorithms. Such corrections are made in regression settings, where the ground-based measurements are the dependent variable and the satellite data are predictor variables. Comparisons of machine and statistical learning algorithms in the direction of obtaining the most useful precipitation datasets by performing such corrections are regularly conducted in the literature. Nonetheless, in most of these comparisons, a small number of machine and statistical learning algorithms are considered. Also, small geographical regions and limited time periods are examined. Thus, the results provided tend to be of local importance and to not offer more general guidance. To provide results that are generalizable, we compared eight state-of-the-art machine and statistical learning algorithms in correcting satellite precipitation data for the entire contiguous United States and for a 15-year period. We used monthly data from the PERSIANN (Precipitation Estimation from Remotely Sensed Information using Artificial Neural Networks) gridded dataset and the Global Historical Climatology Network monthly database, version 2 (GHCNm). Our results suggest that extreme gradient boosting (XGBoost) and random forests are more accurate than the remaining algorithms, which can be ordered as follows from the best to the worst ones: Bayesian regularized feed-forward neural networks, multivariate adaptive polynomial splines (poly-MARS), gradient boosting machines (gbm), multivariate adaptive regression splines (MARS), feed-forward neural networks, linear regression.

How to cite: Papacharalampous, G., Tyralis, H., Doulamis, A., and Doulamis, N.: Large-scale comparison of machine and statistical learning algorithms for blending gridded satellite and earth-observed precipitation data, EGU General Assembly 2023, Vienna, Austria, 23–28 Apr 2023, EGU23-3296, https://doi.org/10.5194/egusphere-egu23-3296, 2023.

EGU23-3299 | ECS | Orals | HS3.1

A Framework for Water Supply Regulation in Coastal Areas by Avoiding Saltwater Withdrawal Considering Upstream Streamflow Distribution 

Haiou Wu, Xinjun Tu, Xiaohong Chen, Vijay P Singh, Leonardo Alfonso, Kairong Lin, Zhiyong Liu, and Rongbiao Lai

Freshwater availability in coastal areas depends on the withdrawal from tidal rivers and is severely threatened by saltwater intrusion, especially in the dry season. Freshwater availability is associated with natural factors and human activities. Although analyses of freshwater availability under saltwater intrusion is problematic, it has received limited attention in the literature. We propose a new framework, i.e. regulation by avoiding saltwater withdrawal (RASW), where the relationships among saltwater intrusion, upstream streamflow, and water supply are established, using hybrid data-driven method coupling wavelet transform and random forest, and considering data on streamflow, tide, wind, salinity of withdrawal stations, capacities of withdrawal projects and reservoirs, and water demand. RASW contains three phases, i.e. estuary salinity-exceedance simulation, upstream streamflow distribution design, and local water supply security analysis. The method is tested on the water supply for Zhuhai-Macao of the Guangdong-Hong Kong-Macao Great Bay Area, South China. Results demonstrate that the salinity-exceedance simulation model using a hybrid data-driven method is quite accurate. The meta-Gaussian copula efficiently simulates the six-dimensional distribution of upstream monthly streamflow and is appropriate for streamflow distribution scenario design. Water supply security benefits greatly from the joint river-reservoir regulation mode. But for a given exceedance frequency of average streamflow, the modes and security situations are diverse, due to various streamflow distributions, i.e. extremely low streamflow and its occurrence time. The proposed framework facilitates integrated decision-making for water supply security in coastal areas. Moreover, the capacities of facilities should be carefully considered according to local conditions, and streamflow distribution design can be utilized as a management tool to regulate water supply system. 

How to cite: Wu, H., Tu, X., Chen, X., Singh, V. P., Alfonso, L., Lin, K., Liu, Z., and Lai, R.: A Framework for Water Supply Regulation in Coastal Areas by Avoiding Saltwater Withdrawal Considering Upstream Streamflow Distribution, EGU General Assembly 2023, Vienna, Austria, 23–28 Apr 2023, EGU23-3299, https://doi.org/10.5194/egusphere-egu23-3299, 2023.

EGU23-3320 | Posters on site | HS3.1

Fusion of satellite precipitation products and ground-based measurements using LightGBM with a focus on extreme quantiles 

Hristos Tyralis, Georgia Papacharalampous, Anastasios Doulamis, and Nikolaos Doulamis

Satellite precipitation products are not accurate in representing the actual precipitation measured by gauges. To improve their accuracy, machine learning algorithms are applied in regression settings with ground-based measurements as dependent variables and satellite precipitation data as predictor variables. Here we examine the case of light gradient-boosting machine (LightGBM) for correcting daily IMERG (Integrated Multi-satellitE Retrievals for GPM) and PERSIANN (Precipitation Estimation from Remotely Sensed Information using Artificial Neural Networks) precipitation data using daily precipitation measurements in the contiguous US. Our demonstration especially focuses on the estimation of quantiles of the conditional probability distribution of daily precipitation at given points, with emphasis on extreme values.

How to cite: Tyralis, H., Papacharalampous, G., Doulamis, A., and Doulamis, N.: Fusion of satellite precipitation products and ground-based measurements using LightGBM with a focus on extreme quantiles, EGU General Assembly 2023, Vienna, Austria, 23–28 Apr 2023, EGU23-3320, https://doi.org/10.5194/egusphere-egu23-3320, 2023.

EGU23-3428 | ECS | Orals | HS3.1

Calibration of the SWAT Hydrological Model with the Particle Swarm Optimization Technique 

Fatmanur Çakır, Alper Elçi, and Melis Somay-Altaş

Hydrological models are important tools for management of water resources at the basin scale. However, the outputs of these models might come with significant inaccuracies, often due to uncertainties in model parameters. One of the biggest challenges in working with a hydrological model is that these models require rigorous calibration, validation, and uncertainty analysis. In recent years, there has been an increase in the use of heuristic optimization techniques in water resources research. These techniques can yield more accurate and more reliable modeling results by searching the global optimum of multiple model parameter sets.

This study describes the application of a heuristic optimization method, the Particle Swarm Optimization (PSO), on a hydrological model, the Soil and Water Assessment Tool (SWAT). The model is applied to the Fetrek Stream watershed in western Turkiye, which is under environmental stress due to excessive groundwater abstraction and pollution from numerous wastewater discharges. The model includes data related to 41 point sources, and two inflowing tributaries. The model is configured with 8 sub-basins, and 484 hydrologic response units. Hydrological fluxes are obtained for a 30-year simulation period. The sensitivities of the model parameters and uncertainties of model results are investigated. PSO is used to calibrate sensitive model parameters, followed by a comparison with the calibration outcome using the SUFI-2 (Sequential Uncertainty Fitting) algorithm, which is the usual choice in calibrating SWAT models. The performances of both optimization approaches are evaluated with the Kling-Gupta Efficiency (KGE), the regression coefficient (R2), and the bias percentage  (PBIAS) Model results are presented with their associated prediction uncertainties in the form of the so-called p-factor and r-factor statistics, which represent envelopes of good model solutions. The results show that the PSO approach can achieve satisfactory results on a monthly time-scale thereby offering an alternative calibration with less parameters and a wider interval of the 95% prediction uncertainty.

This study is supported by the PRIMA program under grant agreement No: 2024 Project TRUST (management of industrial Treated wastewater ReUse as mitigation measures to water Scarcity in climaTe change context in two Mediterranean regions). The PRIMA program is supported by the European Union.

How to cite: Çakır, F., Elçi, A., and Somay-Altaş, M.: Calibration of the SWAT Hydrological Model with the Particle Swarm Optimization Technique, EGU General Assembly 2023, Vienna, Austria, 23–28 Apr 2023, EGU23-3428, https://doi.org/10.5194/egusphere-egu23-3428, 2023.

EGU23-3575 | ECS | Orals | HS3.1

Hybrid modelling in hydrology by Neural Network-based prediction of conceptual model parameters 

Eduardo Acuna, Uwe Ehret, Nicole Bäuerle, and Ralf Loritz

In recent years data-driven techniques, specifically LSTMs, have outperformed conceptual hydrological models for rainfall-runoff prediction. However, even though great progress has been made to explain the internal functioning of the model ((Kratzert, et al., 2019); (Lees, et al., 2022)), their interpretation is still not as straightforward as conceptual models. Additionally, latent variables, different from the target quantity, need postprocessing methods to be extracted. One way to combine the flexibility of data-driven techniques with the interpretability of conceptual models is the use of hybrid models. In our contribution,  we will present results from applying a similar technique as (Kraft, Jung, Korner, & Reichstein, 2020) and (Feng, Liu, Lawson, & Shen, 2022), in which an artificial neural network dynamically calculates the parameters of the conceptual model. This approach increases the model flexibility, allows the inclusion of multiple information sources, and compensates for model uncertainty, while maintaining the straightforward interpretability of the conceptual part. In this contribution, we will look at the performance of the hybrid model, analyze the parameter variation over time, and present a technique to avoid parameter cross-compensation.


References

Feng, D., Liu, J., Lawson, K., & Shen, C. (2022). Differentiable, learnable, regionalized process-based models with multiphysical outputs can approach state-of-the-art hydrologic prediction accuracy. Water Resources Research. doi:https://doi.org/10.1029/2022WR032404

Kraft, B., Jung, M., Korner, M., & Reichstein, M. (2020). HYBRID MODELING: FUSION OF A DEEP LEARNING APPROACH AND A PHYSICS-BASED MODEL FOR GLOBAL HYDROLOGICAL MODELING. The International Archives of the Photogrammetry, Remote Sensing and Spatial Information Sciences, 1537--1544. doi:https://doi.org/10.5194/isprs-archives-XLIII-B2-2020-1537-2020

Kratzert, F., Herrnegger, M., Klotz, D., Hochreiter, S., & Klambauer, G. (2019). NeuralHydrology--Interpreting LSTMs in Hydrology. In W. Samek, G. Montavon, A. Vedaldi, L. Hansen, & K.-R. Müller, Explainable AI: Interpreting, Explaining and Visualizing Deep Learning (pp. 347--362). Springer.

Lees, T., Reece, S., Kratzert, F., Klotz, D., Gauch, M., De Bruijn, J., . . . Dadson, S. (2022). Hydrological concept formation inside long short-term memory (LSTM) networks. Hydrology and Earth System Sciences, 3079-3101. doi:https://doi.org/10.5194/hess-26-3079-2022

How to cite: Acuna, E., Ehret, U., Bäuerle, N., and Loritz, R.: Hybrid modelling in hydrology by Neural Network-based prediction of conceptual model parameters, EGU General Assembly 2023, Vienna, Austria, 23–28 Apr 2023, EGU23-3575, https://doi.org/10.5194/egusphere-egu23-3575, 2023.

This article reports the findings of a recent study by Das and Chanda (2022), wherein a Bayesian Network (BN) approach was applied to analyze the influence of large-scale climate modes and local hydro-meteorological variables on streamflow and rainfall in four river basins in India. Bayesian Networks (BN) offers a thorough conditional independence structure that can improve comprehension and forecasting of hydroclimatic systems. This served as the main impetus for the work, which explored the relative contributions of large-scale climate modes and local hydro-meteorological variables for the prediction of rainfall and streamflow at the basin scale. Once the conditional independence structure is developed, variables possessing a ‘directed arc’ from the target variable were selected as the potential predictors for developing the prediction models. The results showed that the most important predictors for streamflow were rainfall, u-wind, and soil moisture, while the most important predictors for rainfall were u-wind, air temperature, geo-potential height, precipitable water, vertical velocity, and relative humidity. The analysis also revealed that the influence of large-scale climate modes on the target variables was generally insignificant, except for the Pacific Decadal Oscillation and El-Niño Southern Oscillation. Furthermore, the network structure showed that about 87 and 97% of the initial inputs are redundant. The accuracy of the prediction models are comparable across all of the basins and is higher for rainfall (Refined index of agreement (MD) ranging from 0.61 to 0.81) than for streamflow (MD ranging from 0.61 to 0.78). The study also found that dry, intermediate, and wet months can be satisfactorily classified using two drought indices, the Standardized Drought Index (SDI) for streamflow and the Standardized Precipitation Anomaly Index (SPAI) for rainfall.

Keywords: Large-scale climate modes, local hydro-meteorological variables, Bayesian Networks (BN), Standardized Drought Index (SDI), Standardized Precipitation Anomaly Index (SPAI)

Reference:

Das P, Chanda K (2022) A Bayesian network approach for understanding the role of large-scale and local hydro-meteorological variables as drivers of basin-scale rainfall and streamflow. Stoch Environ Res Risk Assess 2:. https://doi.org/10.1007/s00477-022-02356-2

How to cite: Das, P. and Chanda, K.: Influence of large-scale climate modes and local hydrometeorological factors in predicting basin scale rainfall and streamflow: A Bayesian network approach, EGU General Assembly 2023, Vienna, Austria, 23–28 Apr 2023, EGU23-3826, https://doi.org/10.5194/egusphere-egu23-3826, 2023.

EGU23-4028 | ECS | Orals | HS3.1

The spatial-temporal variations of rainfall-streamflow linkage across North America: A functional data analysis approach 

Ali Ameli, Joseph Janssen, Shizhe Meng, Jiguo Cao, and William Welch

Achieving improved predictions in ungauged-basins or inferring the effects of climate and land-use changes on streamflow requires hydrologists to first learn the underlying mechanisms behind streamflow generation in gauged-basins. One way to characterize streamflow generation is by quantifying how catchments filter rainfall into streamflow. A simple and popular technique that displays the rainfall-streamflow linkage is the unit hydrograph. Though one could characterize and classify catchments based on their unit hydrographs, this approach implicitly implies that the function and response-time that link rainfall to streamflow are time-invariant. The celerity, and the function that links rainfall to streamflow in a given catchment, could vary from catchment to catchment as well as from season to season. This is primarily due to variations in antecedent wetness, temperature, vegetation transpiration and the ways climatic factors interact with biophysical factors, over time and over space. In this study, we utilize sparse historical functional linear models to quantify the time-variant rainfall-streamflow response function, across hundreds of catchments in North America. The function reflects the temporally varying relationship between rainfall and streamflow and can be used to infer temporally varying response times. We then attempt to relate catchment characteristics such geology, climate, and topography to the characteristics of rainfall-streamflow response function and response time, spatially and temporally.  We argue that our study extracts generalizable and robust process understanding in a novel data-driven manner.

How to cite: Ameli, A., Janssen, J., Meng, S., Cao, J., and Welch, W.: The spatial-temporal variations of rainfall-streamflow linkage across North America: A functional data analysis approach, EGU General Assembly 2023, Vienna, Austria, 23–28 Apr 2023, EGU23-4028, https://doi.org/10.5194/egusphere-egu23-4028, 2023.

EGU23-4297 | ECS | Orals | HS3.1

Investigating the change of hydrological patterns of streamflow by using  HDCE method 

ChunTa Wen and Jiing-Yun You

The change of streamflow patterns is one of the important information to water resources management. Especially, in the last few years, climate changes have not only caused increases in the intensity and frequency of extreme hydrological events, but also disrupted the monotony of climate which could lead to unexpected consequences and economic losses to our society. However, only a little research has paid attention to the change in patterns or schemes of the hydrological cycle. The issue is even more serious in Taiwan due to the uneven spatial-temporal distribution of rainfall. This research aims to discover the change in patterns in Taiwan. We proposed a HDCE framework which is composed of Hierarchical cluster, Dynamic time warping, Change point detection, and Empirical mode decomposition. With this framework, we apply the hierarchical cluster with different distance matrices, and obtain the optimal clustering number and linkage method according to clustering valid indexes. Dynamic time warping is used as the measure of distance to investigate the pattern of time series By this way, this framework determines the optimal cluster of patterns for the historical inflow data. After clustering, the AMOC (At Most One Change) is used to analyze the structure of the pattern. With AMOC, the change time point in each period is examined under the structure of each cluster. In the end, the empirical mode decomposition is adopted to determine the trend of the pattern change. With the proposed framework, this research applies these schemes to main inflow observation gage stations in Taiwan, and the results demonstrate that the groups and activities of positions of the stations indirectly affect the pattern of the inflow values, instead, the clusters formed are mainly affected by the region and geographical area of the locations. Furthermore, we will explain the results showing the different trends in changing time in each region and the correlation of breaks at each station. In this way, the results of HDCE not only examine the occurrence of droughts but provide information that is useful to develop the strategy to reduce the loss through better water management.

How to cite: Wen, C. and You, J.-Y.: Investigating the change of hydrological patterns of streamflow by using  HDCE method, EGU General Assembly 2023, Vienna, Austria, 23–28 Apr 2023, EGU23-4297, https://doi.org/10.5194/egusphere-egu23-4297, 2023.

This study investigated a deep learning method for fluvial land cover classification using aerial imagery of the UAV (Unmanned Aerial Vehicles). The deep learning used in this study was the CNN-Supervised Classification (CSC) developed by Carbonneau et al. (Remote Sensing of Environment, 2020). The analysis was based on 51 river sections of RGB orthorectified images taken aerially in 2015-2019 in several river channels of the Kinu River in Japan. They were obtained by applying the SfM (Structure from Motion) processing to the UAV aerial images acquired during field observations. The spatial resolution of the images was approximately 4 cm per pixel. The seven land cover types classified by CSC were water surface, gravel, sand, grass, tree, farmland, and artificial land. The deep learning algorithm CSC in this study was a classification model combining two-stage Convolution Neural Networks (CNNs). The first stage of the CSC classified the input image into 200 x 200-pixel image tiles and created a training dataset to be used in the second stage. Then, the training dataset was used to train a second-stage small-scale CNN (hereafter called mini-CNN) to optimise the model hyper-parameters. Finally, the trained CSC performed pixel-based land cover classification of the RGB orthoimages. In the first stage, this study used an existing CNN architecture, VGG16. The fine-tuning dataset had more than 2,500 images for each land cover class, resulting in a total of 85,800 through data augmentation. The hyper-parameters examined were the learning rate, patch size and the number of frozen layers. The F-measures for the CSC first stage with the optimised parameters were 99.1, 96.9, 92.6, 91.4, 93.6, 95.7 and 96.1% for water surface, gravel, sand, grass, tree, farmland, and artificial land, respectively. Then, the architecture of the mini-CNN, learning rate, patch size, patch number and filter size were optimised for the CSC second stage. The weighted average F-measure for the optimised CSC model was 90.4%. This confirmed that the optimised CSC could reproduce the land cover classes with enough accuracy. The CSC application to the RGB orthorectified images of the Kinu River in Japan showed that the CSC deep learning method could accurately classify temporal changes in fluvial geomorphologies such as gravel beds and sandbars as well as riparian vegetation, including the significant differences before and after the severe floods in 2015 and 2019. Future work would be needed to verify the applicability of the proposed CSC deep learning method to other rivers with different fluvial characteristics.

How to cite: Miyamoto, H. and Ishii, R.: Fluvial land cover classification by using CSC deep learning method with UAV airborne images, EGU General Assembly 2023, Vienna, Austria, 23–28 Apr 2023, EGU23-4367, https://doi.org/10.5194/egusphere-egu23-4367, 2023.

Intermittent streams, where water ceases to flow during some time, are a unique habitat for freshwater biota that are adapted to these conditions and provide many ecosystem services. Shifts in intermittency patterns, for example due to climate change, are problematic. To quantify streamflow intermittency in all of Europe at a spatial resolution of 15 arc-sec (approx.. 500 m), we developed a machine learning approach that combines daily streamflow observations, the output of a global hydrological model as well as other physiogeographic data to estimate monthly time series of the number of no-flow days.

Daily streamflow observations at initially a selection of initially close to 2000 stations gauging stations across Europe from the SMIRES, GRDC and GSIM databases were used as target for training the ML model. We selected those stations with at least 18 complete (no day is missing) monthly records in the period 1980-2019. Predictors include monthly time series of simulated hydrological indicators at two spatial resolutions, 15 arc-sec (high resolution HR) and 0.5 arc-deg (approx. 50 km, low resolution LR) as well as static HR environmental indicators (e.g. drainage area).  The hydrological indicators were derived from the global hydrological model WaterGAP 2.2e. Its native LR output including surface runoff, and groundwater discharge was used for computing HR time series of monthly streamflow across all of Europe. A comparison of streamflow observations shows a reasonable fit to observations. HR hydrological indicators include specific streamflow in current and previous months.  Examples for LR hydrological predictors include the groundwater recharge to total runoff ratio and daily streamflow variability with each month.

We considered a sequential statistical modeling approach (in the first stage: binary classification, and in the second stage: multiclass classification) owing to the zero-inflated and imbalanced data issues. In the first stage, a Random Forest (RF) model is built up to classify a binary classification of each month as either intermittent (with at least one no-flow day) or perennial. Then, by taking into account only those stations that were in the first step either predicted or observed to be intermittent, we developed another model to predict four classes of intermittency (e.g. with 1-2, 3-15, 16-27, 28-31 of no-flow days per month). A random oversampling of non-perennial gauging stations was implemented for both stages in order to address the biases in the RF model caused by the class imbalance in the training data. Three cross-validation techniques were applied for estimating the model performance, hyperparameter tuning, and model selection, including non-spatial, spatial, and spatial-temporal cross-validations. Balanced class accuracy, sensitivity, specificity, and precision supported the model selected. The most important predictors for streamflow intermittency will be presented as well as the spatial distribution of the four intermittency classes in Europe (without Russia).

How to cite: Abbasi, M., Trautmann, T., and Döll, P.: Developing a random forest model to quantify streamflow intermittency in Pan-Europe at a spatial resolution of 15 arc-sec, EGU General Assembly 2023, Vienna, Austria, 23–28 Apr 2023, EGU23-4440, https://doi.org/10.5194/egusphere-egu23-4440, 2023.

Climate change has a considerable impact on socioeconomic fields as well as on the natural environment. To effectively respond and adapt to climate change, we should analyze the long-term climate change trends and future impacts according to plausible climate scenarios. For this, the production of high-quality and high-resolution gridded meteorological data based on observation is essential, which is important for developing high-quality downscaled future projections. However, South Korea lacks the long term gridded meteorological data because a dense network from ASOS (Automated Synoptic Observing System) and AWS (Automated Weather System) Stations was available only after 2000. To address this problem, this study aims to produce high quality gridded meteorological data for a historical period (1973-1999), which could have been generated if a dense network existed. Specifically, we reconstruct spatial variations and features of meteorological variables for the historical (1973-1999) period by relating the gridded products for more recent period (2000-21) to that for preceding period (1973-1999) based on a deep learning algorithm. For this, MK-PRISM, an interpolation method for quantifying the effects of meteorological factors based on elevation in South Korea was applied to produce two different version of gridded products based on two different observation networks: a sparse network (ASOS) and a dense network (ASOS+AWS) over the recent 22 years (2000-2021). Then, we develop the Long-Short Term Memory (LSTM) for each grid cell using the gridded products by the sparse network as input and the denser network as output layer. Finally, we generate meteorological variables for the period of 1973-1999 using gridded product by a sparse network as input of the developed LSTM model for each grid cell. Our preliminary results showed that Nash-Sutcliffe Efficiency (NSE) was higher than 0.9 in most grid climate prediction models. Therefore, our development in this study has a potential to calculate high-quality and long-term meteorological data which can be used as important data to analyze the long-term climate trends and variability.

Acknowledgement:

This work was supported by the National Research Foundation of Korea (NRF) grant funded by the Korea government (MSIT) (No. NRF-2022R1A4A3032838).

How to cite: Jeong, Y. and Byun, K.: A Development of High-Resolution Long-Term Gridded Meteorological Data for South Korea using Deep Learning, EGU General Assembly 2023, Vienna, Austria, 23–28 Apr 2023, EGU23-5096, https://doi.org/10.5194/egusphere-egu23-5096, 2023.

EGU23-5491 | ECS | Orals | HS3.1

Assessing water observation network settings by hydro-geological sub-sampling of a large data set for Sweden 

Ellen Gute, Luisa Ickes, and Ilias Pechlivanidis

Developing cost-effective methods for hydrological observations is an identified research objective of the WMO Hydrological Research Strategy 2022-2030. Network settings of hydrological observational networks are central for data collection and monitoring efforts to fulfill observation needs. In this work, we ask the question: Where and how densely (location and time) measurement stations need to be placed to gain sound scientific insights into hydro-meteorological conditions of a region?  

We address this question through information theory concepts and calculate entropy, joint entropy, and mutual information for an existing large dataset of hydro-meteorological parameters. The dataset spans 36 years (1981-2017) of daily data for Sweden based on the national S-HYPE hydrological model. Hydrological data include runoff, inflow, and streamflow as computed values and meteorological data encompass temperature and precipitation as measured and corrected data. We chose Sweden as a study domain to look at a Nordic region with a large number of water basins and an overall well-sampled region allowing to assess interesting network settings through sub-sampling.  

Sub-sampling and analysis for potential network settings is done for the seven hydrological clusters across Sweden as they are defined in Girons Lopez et al. (2021). Random sub-sampling (by 10%, 25%, 50%, 75%, and 90%) of each of the seven clusters shows a narrow range of (Shannon) entropy indicating excellent assignment of catchments to the seven clusters.  

Focusing on three clusters, which span Sweden’s North-South extend and mainly feature forested areas and a cluster covering mostly coastal lakes, we assess how much information remains in the data set if sub-sampled by hydro-geological parameters, such as baseflow and flashiness. Such tests allow us to determine ideal and minimum network settings with respect to observational and computational efforts based on different criteria relevant to scientific investigations and decision-making needs. 


Girons Lopez, M., Crochemore, L., and Pechlivanidis, I. G.: Benchmarking an operational hydrological model for providing seasonal forecasts in Sweden, Hydrol. Earth Syst. Sci., 25, 1189–1209, https://doi.org/10.5194/hess-25-1189-2021, 2021 

How to cite: Gute, E., Ickes, L., and Pechlivanidis, I.: Assessing water observation network settings by hydro-geological sub-sampling of a large data set for Sweden, EGU General Assembly 2023, Vienna, Austria, 23–28 Apr 2023, EGU23-5491, https://doi.org/10.5194/egusphere-egu23-5491, 2023.

EGU23-5841 | ECS | Posters on site | HS3.1

B-AMA: a new Python protocol for hydrological predictions using data-driven models 

Alessandro Amaranto and Maurizio Mazzoleni

The objective of this interactive poster session is to show the main features of B-AMA (Basic dAta-driven Models for All), an easy, flexible, fully coded Python-written protocol for the application of data-driven models (DDM) in hydrology. The protocol is specifically tailored for early career scientists with little background in coding, to foster them through the development of DDMs for hydrological forecasting while ensuring that none of the fundamental methodological steps is overlooked.

While a Jupyter notebook is already available online to guide the users through the protocol employment, during the session the interested audience can learn the main features of the software (data splitting, feature selection, hyperparameter optimization, and performance metrics) by running several practical hydrological workflows. The session will couple the visual representation B-AMA’s methodology with some laptop-based experiments, including rainfall-runoff, hydropower, and groundwater forecasts. We also allow loading customized csv data to deliver a first-hand experience of the protocol forecasting ability on the user’s specific case study, thanks also to the embedded visualization tools, which facilitate the efficient investigation and communication of results.


How to cite: Amaranto, A. and Mazzoleni, M.: B-AMA: a new Python protocol for hydrological predictions using data-driven models, EGU General Assembly 2023, Vienna, Austria, 23–28 Apr 2023, EGU23-5841, https://doi.org/10.5194/egusphere-egu23-5841, 2023.

EGU23-6685 | Posters virtual | HS3.1

Improving sub-seasonal drought forecasting via machine learning to leverage climate data at different spatial scales 

Francesco Bosso, Claudia Bertini, Matteo Giuliani, Dimitri Solomatine, and Schalk Jan van Andel

Droughts are one of the most dangerous natural hazards that are affecting societies, with an economic impact amounting to over 9 billion euros per year in Europe. Drought events usually originate from a precipitation deficit, which can then cause water shortages, agricultural losses, and environmental degradation. Despite the numerous efforts and recent advances in predicting weather and extreme weather events, accurately forecasting rainfall remains a challenge, especially at sub-seasonal lead-times. In this case, the reference period is short enough for the atmosphere to retain a memory of its initial conditions, but also long enough for oceanic variability to affect atmospheric circulation. However, the relative contribution of climate teleconnections and local atmospheric conditions to the genesis of total precipitation at sub-seasonal scale remains unclear. In this work, we aim to address this gap by advancing the Climate State Intelligence (CSI) framework to examine the impact of both teleconnection patterns and local atmospheric conditions on monthly total precipitation. We then use the information gained to forecast total precipitation with a one-month lead time, and we test three different Machine Learning (ML) models: (i) Extreme Learning Machine (ELM); (ii) Fully Connected Neural Network; (iii) Convolutional Neural Network (CNN). We finally assess the skill of our ML-based precipitation forecasts in predicting the Standardized Precipitation Index (SPI), using the ECMWF Extended Range forecasts as a benchmark. Our framework is developed within the CLImate INTelligence (CLINT) project and applied in the Rhine Delta area, in the Netherlands. Initial findings indicate that combining global and local climate contexts into ML-based models significantly improves state-of-the-art drought forecast accuracy, thus representing a promising option to timely prompt anticipatory drought management measures.

How to cite: Bosso, F., Bertini, C., Giuliani, M., Solomatine, D., and van Andel, S. J.: Improving sub-seasonal drought forecasting via machine learning to leverage climate data at different spatial scales, EGU General Assembly 2023, Vienna, Austria, 23–28 Apr 2023, EGU23-6685, https://doi.org/10.5194/egusphere-egu23-6685, 2023.

Machine learning has been used in hydrological applications for decades. Recent studies, after a systematic comparison, have shown that machine learning models (more precisely, deep learning with thousands of nodes) can outperform even the most sophisticated physically based models. Furthermore, one of the basic criticisms, that machine learning produces black box models, has been addressed by researchers, who have indicated how this black box can be made transparent to obtain explainable/interpretable results. However, the main disadvantage of the machine learning approaches (especially deep learning, which may employ hundreds of thousands of parameters) remains the CPU-intensive training process. This disadvantage can be overcome by employing hybrid modelling frameworks that combine simple machine learning models with parsimonious hydrological models. The drawback of these parsimonious approaches is the susceptibility of the latter to conditional systematic errors, which propagate through the modelling framework and cannot be eliminated by simple machine learning networks (employing complex networks would nullify the sought benefit of reduced CPU times). In this study, we suggest methods to cope with this kind of error and achieve a modelling performance close to the best achievable with the available data.

How to cite: Rozos, E.: A hybrid method to tackle conditional systematic errors of hydrological models, EGU General Assembly 2023, Vienna, Austria, 23–28 Apr 2023, EGU23-8499, https://doi.org/10.5194/egusphere-egu23-8499, 2023.

EGU23-8534 | Posters on site | HS3.1

ML approaches to flood susceptibility mapping at the country scale 

Geoffrey Dawson, Junaid Butt, Paolo Fraccaro, and Anne Jones

Flooding is one of the most costly disasters in the UK, and its impact is projected to increase under climate change. Detailed, accurate and high resolution modelling and mapping of flood hazards are therefore essential to enable climate change adaptation. However, high resolution physics-based flood inundation models are extremely computationally intensive to run, presenting a challenge when mapping flood risk at the country scale, especially when working with ensembles of driving scenarios to account for uncertainty. Furthermore, efficient physical modelling for a target location and/or event required a priori categorisation of dominant flood type (for example fluvial or pluvial), which determines the selection and configuration of appropriate models. In reality, floods at scales beyond a local level are often a combination of multiple flood types. In recent years, machine learning approaches to mapping flood susceptibility have grown in popularity, enabled by large volumes of geospatial and weather/climate data from which explanatory flood factors can be derived. In this study, we develop a pluvial/fluvial flood susceptibility model for England, using high quality open datasets (elevation, land use, soil type, location of water bodies, rainfall) to derive hydrologically-meaningful features, and an open flood inventory dataset to sample flooded/non-flooded points. We train and test the model with grouped cross-validation hyper-parameter tuning for repeated samples of the data on a regular grid, where testing is carried out on unseen grid squares. We discuss the relative performance of different machine learning algorithms, including Random Forest and XG Boost, and assess the computational intensity and scalability of the model across training and inference phases. We also consider the potential of machine learning approaches to provide uncertainty estimates and, via explainable AI techniques, the sensitivity of the predicted flood probability to explanatory flood factors at any given location. Finally, we reflect on the part the modelling approach can play as part of a range of tools to meet the needs of consumers of flood risk information across multiple economic sectors.

How to cite: Dawson, G., Butt, J., Fraccaro, P., and Jones, A.: ML approaches to flood susceptibility mapping at the country scale, EGU General Assembly 2023, Vienna, Austria, 23–28 Apr 2023, EGU23-8534, https://doi.org/10.5194/egusphere-egu23-8534, 2023.

EGU23-8698 | ECS | Posters on site | HS3.1

Long-Short Term Memory networks as observation operator for the states in a conceptual hydrological model 

Olivier Bonte, Hans Lievens, and Niko Verhoest

During the last decades, data assimilation has demonstrated its merit for updating hydrological models with remotely sensed observations. Generally, physically-based models are used as these contain model states that can effectively be observed. Yet, remote sensing data, such as microwave backscattering, often needs to be converted to these model states using an observation operator, which often is a physically-based retrieval algorithm. When using conceptual models, the problem becomes more complicated as the model states cannot be related to actual physical properties in the field. Because of this, the observation operator is often an empirical relation between a hydrological (state) variable and a model state. In this poster presentation we demonstrate the use of a Long-Short Term Memory (LSTM) network as alternative observation operator that allows to convert remotely sensed observations into model state estimations of the Probability Distributed Model (PDM). Therefore, Sentinel-1 observations averaged at the catchment scale and for each land use type within the catchment, along with other data sources (such as LAI, precipitation, …)  are fed to an LSTM in order to estimate a critical capacity of the probability distributed soil moisture reservoir. These data are then used to update the PDM through a classical data assimilation method (i.e. the ensemble Kalman Filter).

How to cite: Bonte, O., Lievens, H., and Verhoest, N.: Long-Short Term Memory networks as observation operator for the states in a conceptual hydrological model, EGU General Assembly 2023, Vienna, Austria, 23–28 Apr 2023, EGU23-8698, https://doi.org/10.5194/egusphere-egu23-8698, 2023.

EGU23-8968 | ECS | Orals | HS3.1

SnoDRI: A Machine Learning Based Index to Measure Snow Droughts 

Sinan Rasiya Koya, Kanak Kanti Kar, Shivendra Srivastava, and Tirthankar Roy

Snow plays a significant role in the hydrology of numerous regions across the globe. A major portion of precipitation above 45O N latitude falls as snow. The accumulated snow melts slowly and contributes to infiltration and runoff processes. Therefore, studying the quantity and fate of water from snowmelt is essential. Reduced snow storage would lead to snow droughts, which can have an enormous impact on the water resources of snow-dominated catchments, such as those in the western United States. For that reason, it is essential to identify the time and severity of snow droughts efficiently. This study proposes SnoDRI, a new index that could identify and measure snow drought events. SnoDRI is a machine learning-based index estimated from several snow-related variables utilizing novel machine learning algorithms. The model uses a combination of mutual information and a self-supervised learning algorithm of an autoencoder. We use random forests for feature extraction for SnoDRI and to assess the importance of each variable. We use NLDAS-2 reanalysis data from 1981 to 2021 for the Western United States to study the efficacy of the new snow drought index. The results are validated by verifying the coincidence of actual snow drought events and the interpretation of our new index. We will discuss how well the new drought index performs and help in better identification of snow droughts.

How to cite: Rasiya Koya, S., Kanti Kar, K., Srivastava, S., and Roy, T.: SnoDRI: A Machine Learning Based Index to Measure Snow Droughts, EGU General Assembly 2023, Vienna, Austria, 23–28 Apr 2023, EGU23-8968, https://doi.org/10.5194/egusphere-egu23-8968, 2023.

EGU23-9056 | ECS | Orals | HS3.1

Information entropy for assisting decision-making for critical events in surface water quality management 

Tianrui Pang, Jiping Jiang, Leonardo Alfonso, Peng Wang, and Tong Zheng

The information entropy method, based on mass sampling data processing, has been widely applied in environment monitoring and management. However, previous efforts have been mainly limited to the optimization of stations in discrete space with no association to critical events and their associated temporal scale. In particular, further research on integrating water quality monitoring under critical events (such a spillway accident) and the related cost-benefit analysis of environment management decisions are needed. In this study, we give an entropy-based paradigm of water quality reaction criteria R, which is analogous to the definition of Gibbs free energy (ΔG) in thermodynamics. Then we propose a systematic framework of entropy prisms (HPrisms) with four entropy indexes: dilution index (E), flux index (F), spatial entropy index (Gx) and temporal entropy index (Gt). They describe the pollutants transport process in water bodies from different perspectives, facing different water environmental management decisions. The corresponding reaction criteria of these four entropy indexes for different water quality management scenarios are defined for different spatiotemporal scales where different criteria are applicable. The method has value in emergency monitoring in rivers and lakes, useful for anomaly detection, key point identification and other water environment management scenarios. This study is a generic theoretical framework so far, and we will present specific critical cases for management reaction criteria to find the quantitative relationship between reaction criteria with information entropy indexes.

How to cite: Pang, T., Jiang, J., Alfonso, L., Wang, P., and Zheng, T.: Information entropy for assisting decision-making for critical events in surface water quality management, EGU General Assembly 2023, Vienna, Austria, 23–28 Apr 2023, EGU23-9056, https://doi.org/10.5194/egusphere-egu23-9056, 2023.

EGU23-9409 | ECS | Posters virtual | HS3.1

Interpolation of hydrological time series via Dynamic Mode Decomposition 

Giulia Libero and Valentina Ciriello

The distribution and availability of water resources all around the world are strongly affected by climate change. To deal with any negative impact, the research community is asked to provide accurate information to guide adaptation and mitigation strategies. The effort is supported by the increasing availability of data, which is fueling studies about climate-related phenomena. A massive contribution comes from satellite technologies, which have evolved rapidly in the past few decades, and now provide data with improved spatial coverage and time resolution. However, an important issue related to this type of product is still represented by missing data. The gap between data, especially if long-lasting, breaks the continuity of the observations and limits further application of the time series. Different data-driven methods have been tested to bridge these gaps, and even to reconstruct the series in the past. A new viable approach could be represented by the dynamic mode decomposition (DMD), a data-driven model reduction technique that originated in the fluid dynamics community, capable of extracting coherent structures directly from spatiotemporal complex system data. The DMD method allows to automatically embed seasonal variations and capture trends in the data, for this reason, it is used for the detection of patterns, the extraction of reduced order models, and the prediction of time series based on previous observations. A suite of DMD algorithms is available to handle different applications. Here, we use different DMD algorithms and analyze their capability to reconstruct and interpolate time series of total water storage anomalies as provided by the Gravity Recovery and Climate Experiment (GRACE) satellite mission. The mission is focused on monitoring mass distribution changes on Earth through the measurement of Earth’s gravity field variations. Changes in gravity detected by GRACE can be used to derive estimates of water distribution on the planet and hence provide pioneering data to draw an integrated global view of how Earth’s water cycle is evolving. GRACE data are freely available and provided to the users as global matrices of centimeters of equivalent water thickness anomalies relative to a baseline mean. The native resolution is 3 degrees, but a matrix of scale factors can be applied to adapt the data on a global regular grid at a resolution of 0.5 degrees in both latitude and longitude. Data are available from April 2002 to the present, on a monthly scale, but the series is affected by some short-term gaps and a major interruption of approximately 1 year, due to the transition between the first GRACE mission, flown from March 2002 to October 2017, and the GRACE Follow-On (GRACE‐FO) mission launched in May 2018. In this study, the DMD method is applied to capture the hidden information embedded in the large amount of data collected by GRACE missions and then to use them to interpolate the short-term gaps and bridge the larger one-year gap.

How to cite: Libero, G. and Ciriello, V.: Interpolation of hydrological time series via Dynamic Mode Decomposition, EGU General Assembly 2023, Vienna, Austria, 23–28 Apr 2023, EGU23-9409, https://doi.org/10.5194/egusphere-egu23-9409, 2023.

EGU23-9790 | ECS | Posters virtual | HS3.1

Deep Learning for Probabilistic Forecasts Using Features from Rainfall Objects:  A Case Study in the Amazon Basin 

Omesh Persaud, Gerald Corzo Perez, Dimitri Solomatine, Eliana Torres, Vinícius Alencar Siqueira, and Ingrid Petry

Hydrological forecasting is of global importance, especially with the spotted increasing trend of flood-related disasters as seen in the last two decades.  The causative rainfall events of these extreme events are primarily analysed in a one-dimensional method. However, through an object-based approach, more data on these rainfall fields can be generated and studied to link them to the hydrological response observed. Through an object-based methodology ST-CORA, features from rate of change of rain intensity in space and time can be extracted by simple visual inspection. Every side of an object provides time variations that can be used as images that contain features not easy to extract. In general, rainfall events in previous studies have used aggregated information, like the duration, area, volume, maximum intensity, and the centroid. In this work, more information is captured that describes the spatial and temporal properties of the event. The main objective of this research is to use these 3D objects and their features with a deep learning model to produce a 15-day hydrological probabilistic forecast for flood prediction.

A calibrated version of a large-scale hydrological model (MGB) is used to study an Amazon subbasin. The model is forced with the 50-member perturbed forecast from the TIGGE dataset for the period 2006 to 2014 (from ECMWF). The purpose of using the large-scale model is to better capture the spatio-temporal characteristics over a wider area in an effort to reduce the uncertainty in the analysis. For data-driven models, there is a need for sufficiently large databases, in this case for both the causative rainfall events and the observed hydrological responses. As such, the first two steps relate to the data generation. The first database is developed from the daily streamflow which is generated from the calibrated hydrological model at specific locations of interest with the known higher performance metrics. Second, the ST-CORA methodology is applied to extract the features from the rainfall events in order to develop a database of the rainfall objects. Third, an analysis on the statistics of the features of the objects to understand the rainfall which occurs within the study area. The final part of the research involves the effective use of these features and objects with a deep learning model. From the average annual rainfall from 2001 to 2020, three distinct precipitation patterns are observed. For the streamflow, the subbasin shows a relatively fast response which is captured within a 15-day window.

A convolutional LSTM deep learning model is developed to handle 3D rainfall objects as sequences of images representing space time sequences. The outcome of this research contributes to the end-to-end deep learning model which receives the forecasted rainfall as objects and generates a corresponding hydrograph at the area of interest for which it has been trained. A potential contribution of this Conv-LSTM network is that it may provide an efficient and automated approach for streamflow forecasting in basins where there is known complexity and non-linearity, which is especially useful for early warning systems.

How to cite: Persaud, O., Corzo Perez, G., Solomatine, D., Torres, E., Siqueira, V. A., and Petry, I.: Deep Learning for Probabilistic Forecasts Using Features from Rainfall Objects:  A Case Study in the Amazon Basin, EGU General Assembly 2023, Vienna, Austria, 23–28 Apr 2023, EGU23-9790, https://doi.org/10.5194/egusphere-egu23-9790, 2023.

EGU23-9962 | Posters on site | HS3.1

Refining linear interpolation of water level data with the use of autoregressive models 

Tomasz Niedzielski and Michal Halicki

Although linear interpolation is the simplest method for inputing hydrograph data, there are evidences for its efficiency in hydrology. It works well at edges of no-data gaps because the inputation is limited by bounds. However, it does not reconstruct the hydrologic variability of water levels recorded before and after a no-data gap. 

In this paper, we combine linear interpolation with autoregressive models in order to account for both controlling bounds as well as anticipating irregular variation of hydrograph. We check the performance of this approach using hourly water level time series collected between 2016 and 2022 at 28 gauges located in the Odra/Oder River basin in Poland. For the purpose of validation, we produce missing data gaps artificially, using the moving window approach. By considering root mean square errors (RMSE) of interpolation as a function of gap length and investigating differences between these RMSE values computed using linear interpolation with/without autoregression, we identify cases in which the postulated approach refines purely linear interpolation. Initial studies suggest that the combination of methods reveals slightly better skills than the linear interpolation itself for short no-data gaps, the length of which does not exceed 24 hours.

The research has been conducted in frame of the project no. 2020/38/E/ST10/00295 within the Sonata BIS programme of the National Science Centre, Poland.

How to cite: Niedzielski, T. and Halicki, M.: Refining linear interpolation of water level data with the use of autoregressive models, EGU General Assembly 2023, Vienna, Austria, 23–28 Apr 2023, EGU23-9962, https://doi.org/10.5194/egusphere-egu23-9962, 2023.

EGU23-10575 | Orals | HS3.1

Machine learning and hydrological sciences: A systematic overview  of review papers 

Nilay Dogulu, Adeyemi Oludapo Olusola, and Georgia Papacharalampous

Water sciences have greatly contributed to the proliferation of machine learning in the twenty-first century, especially through engineering hydrology. This process has consequently necessitated transfer of core theory and knowledge of machine learning to the domain of hydrological sciences. In this regard, it is noteworthy that published academic literature played a substantial role in supporting development and learning of hydrologists. Specifically, research articles (and book sections) that review machine learning concepts and algorithms along with their applications in hydrology bolster progress of science by presenting encapsulated information (e.g, in the form of literature synthesis). Despite the rapid increase in the number and scope of such research articles, a systematic understanding of how this line of research publications has evolved with respect to their scientific context, objectives, and methods is still lacking. Hereby, we present an analysis of review papers in hydrology and machine learning based on a  systematic search strategy. The overview includes analysis of bibliographic information, review types (objective, focus theme, etc.), review methodologies (narrative, systematic, etc.) as well as thematic context (hydrology subjects and machine learning topics). We believe that our analysis can provide important insights into topics and discussions in hydrology and machine learning that need further exploration by hydrologists. Furthermore, the public online library on Zotero (https://www.zotero.org/groups/4828386/machine_learning_hydrology_review_papers/library) might encourage more participation towards sustainable literature search and active reading on this subject at the intersection of two fundamental disciplines, machine learning and hydrology.

How to cite: Dogulu, N., Olusola, A. O., and Papacharalampous, G.: Machine learning and hydrological sciences: A systematic overview  of review papers, EGU General Assembly 2023, Vienna, Austria, 23–28 Apr 2023, EGU23-10575, https://doi.org/10.5194/egusphere-egu23-10575, 2023.

EGU23-11925 | ECS | Orals | HS3.1

Forecasting soil moisture on a spatial and temporal scale using machine learning algorithms 

Efthymios Chrysanthopoulos, Christos Pouliaris, Ioannis Tsirogiannis, and Andreas Kallioras

While the observations from earth-observing satellites and in-situ weather meteorological and monitoring stations continue to expand, researchers are to deal with an abundance of data and, consequently, with a long modeling procedure. Machine learning algorithms, as universal nonlinear function approximation tools, are effective in analyzing and modeling spatio-temporal environmental data, more efficiently, either in time or in terms of the availability of various variables, than physically-based models.

Soil moisture is an essential climatic parameter, especially for understanding and forecasting variations in surface temperature, precipitation, drought, flood, and the effects of climate change. As a parameter with high spatial and temporal variability, it is a strong necessity for predictive models that embed spatially irregular measurements, which stand for spatially distributed weather meteorological and monitoring stations. To date, most approaches, that have been documented in the literature, model environmental data only at the discrete locations of the monitoring stations.

This research aims to employ a recently proposed methodology, for spatio-temporal prediction of environmental data (Amato et al., 2020), and to propose a new methodology for spatio-temporal prediction of soil moisture in lowland areas, making use of the basic hydrologic premise that precipitation and temperature strongly hinge on topography. The features of the machine learning models used to predict soil moisture within the research area are the meteorological parameters of several agro-meteorological weather stations that have been installed at the site.

The study area is the plain of Arta, located in the Epirus region (NW Greece), and includes the lower part of the watersheds of rivers Aracthos and Louros. The final receptor for upstream surface water and groundwater is a sensitive and complex system of wetlands, the marine ecosystem of Amvrakikos. The research area is receiving a lot of attention because of its agricultural characteristics and water infrastructures (extensive irrigation and drainage network, pumping stations, and hydroelectric dam).

Acknowledgments: This research has been co-financed by the European Union and Greek national funds through the Operational Program Competitiveness, Entrepreneurship and Innovation, under the call SUPPORT OF REGIONAL EXCELLENCE (project code MIS: 5047059).

Amato, F., Guignard, F., Robert, S., & Kanevski, M. (2020). A novel framework for spatio temporal prediction of environmental data using deep learning. Scientific Reports, 10(1), Article 1. https://doi.org/10.1038/s41598-020-79148-7


How to cite: Chrysanthopoulos, E., Pouliaris, C., Tsirogiannis, I., and Kallioras, A.: Forecasting soil moisture on a spatial and temporal scale using machine learning algorithms, EGU General Assembly 2023, Vienna, Austria, 23–28 Apr 2023, EGU23-11925, https://doi.org/10.5194/egusphere-egu23-11925, 2023.

Efficient estimation and forecast of reference evapotranspiration (ETO) is crucial for water resources management and for developing an efficient irrigation practice that will help better utilization of scanty water resources. This is a more challenging task in data scarce regions. This study aimed at multi-step ahead prediction of ETO across different cropping seasons and agro-climatic regions in India with six Machine learning (ML) based techniques using globally available fifth-generation European Centre for Medium-Range Weather Forecasts (ECMWF) gridded reanalysis products (ERA5). For real-time, one-day, two-day, and seven-day ahead prediction of ETO, this study evaluates and compares the capability and prediction accuracy of deep learning algorithms, i.e., Support Vector Regression (SVR), Multivariate Adaptive Regression Splines (MARS), Random Forest (RF), Multi-Layer Perceptron (MLP), one-dimensional Convolutional Neural Network (CNN) and Long Short-Term Memory (LSTM). ML based models were developed using meteorological observations along with ERA5 inputs at three meteorological stations: Nagpur, Hyderabad and Bhubaneswar. The results indicate that MLP, SVR and CNN outperform other ML algorithms. High performing models, one each (MLP and SVR) from neural network-based models and kernel-based models respectively, are further utilized to scale up the analysis for gridwise ETO forecasting across the whole of India. The Global Land Evaporation Amsterdam Model (GLEAM) dataset has been used as reference to evaluate gridwise ETO forecasts. ETO predicted by MLP model shows better agreement with GLEAM ETO values during the Rabi cropping season (October-March) (MAE = 0.103 mm/day and NRMSE = 3.9 %) than during the Kharif season (June-September) (MAE = 0.151 mm/day and NRMSE = 4.5 %). As expected, the accuracy of the models drops with increase in the prediction horizon from real-time to seven-day; for instance, with MLP, MAE = 0.146 mm/day, R2 = 0.955 for real-time and MAE = 0.173 mm/day, R2 = 0.939 for seven-day ahead prediction over arid agro-climatic zone during Rabi season. However, even the minimum forecast performance observed in the semi-arid tropics region during Rabi season is reasonably good (MAE = 0.396 mm/day, R2 = 0.704 for real-time evaluation and MAE = 0.445 mm/day, R2 = 0.56 for seven-day ahead). This strengthens the potential of the proposed models for multi-step ahead ETO forecasting across varied cropping seasons and agro-climatic regions without depending on meteorological station data.

How to cite: Mandal, N. and Chanda, K.: Comparison of Neural network based and Kernel based Machine Learning approaches for daily forecasting of reference evapotranspiration in data scarce regions, EGU General Assembly 2023, Vienna, Austria, 23–28 Apr 2023, EGU23-11950, https://doi.org/10.5194/egusphere-egu23-11950, 2023.

High temporal resolution (i.e., sub-daily) stable isotope concentrations of multiple stream and groundwater sources reveal small-scale, rapid transport and mixing processes that are not discernible at coarser resolution. However, long-term, routine sampling of multiple water sources at high temporal resolution is far from widespread. In recent years, the rise of deep learning offers the opportunity to further improve the prediction accuracy of infrequently measured data owing to its capability to efficiently abstract interrelationship patterns in complex and non-linear systems. In this research, we explore the potential of a Long Short-Term Memory (LSTM) deep learning model to predict high-resolution (3 h) isotope concentrations of multiple stream and groundwater sources in the Schwingbach Environmental Observatory (SEO), Germany. The key objective of this study is to examine the predictive performance of the LSTM that is simultaneously trained on multiple sites with a set of explanatory data that are more convenient and less expensive to collect in comparison to the stable water isotopes. The explanatory data comprise meteorological data, soil moisture, and natural tracers (i.e., water temperature, pH, and electrical conductivity). A sensitivity analysis is applied to investigate the model performance under different input data and sequence lengths. A Bayesian optimization algorithm is employed to optimize the hyperparameters of the LSTM to ensure an efficient model performance. The main outcome of our study shows that the LSTM enables the prediction of stable isotopes in streams and groundwater by using only a short sequence (6 hours) of recorded water temperature, pH, and electrical conductivity. The best performing LSTM reached on average an RMSE of 0.7‰, MAE of 0.4‰, R2 of 0.9, and NSE of 0.7. The proposed model can be used to predict continuous time series of stable water isotope concentrations, either for gap filling or in cases when continuous data collection is not possible. This is very worthwhile in practice since measurements of tracers used in our LSTM are still much cheaper than those of stable water isotopes and can be carried out continuously with relatively low associated maintenance. In future research, the pre-trained LSTM should be applied through transfer learning to other catchments at which the length and resolution of available data are not sufficient to build a standalone model.

How to cite: Sahraei, A., Houska, T., and Breuer, L.: A deep learning approach based on Bayesian optimization for prediction of stable isotope concentrations in stream and groundwater, EGU General Assembly 2023, Vienna, Austria, 23–28 Apr 2023, EGU23-11973, https://doi.org/10.5194/egusphere-egu23-11973, 2023.

EGU23-13200 | ECS | Orals | HS3.1

Adaptive Mesh Refinement of 3D saturated-unsaturated hydrological and transport models 

Gillien Latour, Pierre Horgue, Romain Guibert, François Renard, and Gérald Debenest
Unsaturated water flows at watershed scale or Darcy-scale are generally described by the Richardson-Richards equation. This equation is highly non-linear and simulation domains are limited by computational costs. The porousMultiphaseFoam toolbox, is a Finite Volume tool capable of modeling multi-phase flows in porous media, including the solving of the Richardson-Richards equation combined with the transport equation. As it has been developed using the OpenFOAM environment, the software is natively fully parallelized and can be used on super computers. Despite all its perks, the toolbox still suffer from expensive computational cost in 3D, highlighted by a calibration method developed last year to validate the 3D model against the historic 2D and 1D+2D models. In an attempt to reduce those, Adaptive Mesh Refinement (AMR) method has been included into the toolbox. The main issue faced by the method is the highly anisotropic mesh, with cells having horizontal characteristic lengths up to 100 times bigger than the vertical one. We present here the results obtained using the AMR, and tools to evaluate its efficiency on anisotropic meshes. Particularly, we take interest in the total CPU time, the mesh size and the number of linear iteration required to solve the problem. We show results using both 3D hydrological and transport solvers.

How to cite: Latour, G., Horgue, P., Guibert, R., Renard, F., and Debenest, G.: Adaptive Mesh Refinement of 3D saturated-unsaturated hydrological and transport models, EGU General Assembly 2023, Vienna, Austria, 23–28 Apr 2023, EGU23-13200, https://doi.org/10.5194/egusphere-egu23-13200, 2023.

EGU23-13411 | ECS | Posters virtual | HS3.1

A novel approach for predicting spring locations using machine learning algorithms in Indian Himalayan Region 

Pradeep Gairola, Arabinda Maiti, Srikanta Sannigrahi, Anand Bhatt, Soban Singh Rawat, Sudhir Kumar, Deepak Singh Bisht, and Sandeep Bhatt

Due to the concerning effects of climate change, groundwater will be one of the significant sources of water for both primary and secondary use in the future. Therefore, identifying the spatial patterns of groundwater distribution might help implement practical water resources management projects. Springs are a potential source of groundwater in the Indian Himalayan Region. The main objective of the current study is to explore a novel methodological approach that utilizes the Variance Inflation factor (VIF) to perform a feature selection procedure and most used machine learning (ML) algorithms, including Random Forest (RF), Gradient Boosting Machine (GBM), and Neural Network (NN) for generating a groundwater spring potential map of the Ravi Basin in Himachal Pradesh, India. Used, 1834 spring and non-spring locations were selected from the field and split into two groups. Of 1834 samples, 70% (1283) were used for model training, and 30% (551) were used for model validation. The model’s overall accuracy of 0.89, 0.87, and 0.88 for RF, GBM, and NN, respectively, around 10% area, has a very high potential for spring occurrence. The novel methodology can be employed to find the initial information for GW exploitation for inaccessible areas and the lack of data sources in this area.

How to cite: Gairola, P., Maiti, A., Sannigrahi, S., Bhatt, A., Singh Rawat, S., Kumar, S., Singh Bisht, D., and Bhatt, S.: A novel approach for predicting spring locations using machine learning algorithms in Indian Himalayan Region, EGU General Assembly 2023, Vienna, Austria, 23–28 Apr 2023, EGU23-13411, https://doi.org/10.5194/egusphere-egu23-13411, 2023.

EGU23-14421 | ECS | Orals | HS3.1

Modelling and reforecasting real-time reservoir operation and outflow with neural networks: case study of the multi-purpose Sirikit reservoir in Thailand 

Chanoknun Wannasin, Claudia Brauer, Remko Uijlenhoet, and Albrecht Weerts

Real-time reservoir operations are highly dependent on decisions made by reservoir operators, which are difficult to simulate accurately with process-based hydrological models. Data-driven models, particularly those based on machine learning (ML), have been shown to be able to overcome the limitations typically encountered in process-based models. Despite a large number of ML studies in reservoir operation modelling, only few studies have focused on ML model performance in real-time reservoir operation and outflow forecasting. This study aims to investigate the capabilities of the Recurrent Neural Network (RNN), Long Short-Term Memory (LSTM) and Gated Recurring Unit (GRU) in simulating and reforecasting real-time (daily) reservoir operation and outflow, considering uncertainties in input data, training-testing periods and different algorithms. A major, multi-purpose reservoir, namely the Sirikit reservoir, in the upper Chao Phraya River basin Thailand was used as the case study. The main inputs for the ML operation models included the daily reservoir outflow, inflow, storage and the month of the year. We applied the distributed wflow_sbm model for inflow simulation (using MSWEP precipitation data) and inflow reforecasting (using ECMWF precipitation data). Daily reservoir storage was obtained from observations and real-time recalculation based on the reservoir water balance. The ML operation models were trained and tested with 10-fold cross-validation. Results show that RNN, LSTM and GRU can reconstruct real-time reservoir operation and provide accurate outflow when training data cover both regular and extreme conditions. For multi-day reforecasting, the model performances are appropriate for the current day up to 2-day lead times for low outflows and up to 6-7 days for high outflows. GRU is potentially the most accurate, robust and convenient model to be used in practice. We conclude that with some further improvements, the ML operation models can be effective and applicable tools to support decision-making for real-time operational water management.

How to cite: Wannasin, C., Brauer, C., Uijlenhoet, R., and Weerts, A.: Modelling and reforecasting real-time reservoir operation and outflow with neural networks: case study of the multi-purpose Sirikit reservoir in Thailand, EGU General Assembly 2023, Vienna, Austria, 23–28 Apr 2023, EGU23-14421, https://doi.org/10.5194/egusphere-egu23-14421, 2023.

Groundwater potential mapping (GWPM) in the coastal areas is central for the decion making and development of the society and the environment. The current study endeavours the delineation of the groundwater potential zones of Korba coastal aquifer in the Cap-Bon Peninsula in the North East of Tunisia, using three different machine Learning techniques : random forest (RF), boosted regression tree (BRT), and the ensemble of RF and support vector machine (SVM). In order to achieve the objective, 17 groundwater influencing factors including elevation, slope, aspect, slope length (LS), profile curvature, plan curvature, topographical wetness index (TWI), distance from streams, distance from lineaments, lithology, geomorphology, soil, land use, normalized difference vegetation index (NDVI),Stream Power Index,Drainage Density and rainfall were considered for inter-thematic correlations and overlaid with wells locations and Transmissivity data in a spatial database. A total of 225 wells locations were identified, which had been divided into two classes: training and validation, at the ratio of 70:30, respectively. The RF, BRT, and RF-SVM ensemble models have been applied to delineate the groundwater potential zones. These models were validated with area under the receiver operating characteristics (AUROC) curve. The accuracy of RF (92%) and hybrid model (89.2%) was more efficient than BRT (85.6%) model. The results of the study will help the decision-makers, government agencies, and private sectors for sustainable planification of  groundwater resources in the study area.

How to cite: Khammessi, I. and omar, H.: Application of machine learning techniques in groundwater potential mapping in the Korba coastal aquifer Cap Bon Peninsula, EGU General Assembly 2023, Vienna, Austria, 23–28 Apr 2023, EGU23-14581, https://doi.org/10.5194/egusphere-egu23-14581, 2023.

EGU23-16266 | ECS | Posters on site | HS3.1

Meta-learning for water level prediction 

Asma Slaimi, Michael Scriney, Susan Hegarty, Fiona Regan, and Noel E. O’Connor

In the Artificial intelligence (AI) sense, meta-learning is the ability of an artificially intelligent machine first to learn how to conduct different complex tasks, taking the principles it utilised to learn one task and applying them to other different tasks. Hence, the general concept of "learning how to learn". Machine learning provides capabilities to learn from past data and generates models for future prediction, which can be helpful for multiple catchment management tasks, such as water elevation monitoring and flood prediction.

Our initial studies focused on predicting and evaluating the ML-based hydrologic time-series models based on their predictive performance. We used eight machine learning algorithms to predict river water levels, including Baseline, Linear, Dense, MultiDense, CNN, RNN, GRU and LSTM techniques. The eight models were employed for one hour ahead of river water level forecasting in 70 hydrometric stations in Ireland. The results show that the NN-based models generally performed well in predicting the water level, with some differences in each model's performance for different stations. These results suggest that a single machine learning model may be sufficient for forecasting river water levels in one location and perform poorly in another. Hence, there is no overall best model; and the selected model may significantly impact the desired results.

This study's main goal was to investigate a meta-learning-based approach for water level prediction. The proposed Meta-learning approach comprises two phases; Learning and meta-learning. The meta-learning process uses the outcomes of the previous experiments to accomplish the Learning Training and Practising phases of the meta-learner. Later the outcome of the previous step will be the Databases to create the learner (learning about learning phase). 

Creating meta-learning models can help AI models to generalise learning methods and acquire new skills more quickly. We expect the meta-learning model to adjust well when generalising to previously unknown datasets and environments that have never been encountered during training.

Keywords: Machine learning (ML), meta-learning,  water-level prediction,  hydrologic time-series forecasting.

How to cite: Slaimi, A., Scriney, M., Hegarty, S., Regan, F., and E. O’Connor, N.: Meta-learning for water level prediction, EGU General Assembly 2023, Vienna, Austria, 23–28 Apr 2023, EGU23-16266, https://doi.org/10.5194/egusphere-egu23-16266, 2023.

EGU23-16641 | ECS | Orals | HS3.1

Predicting Terrestrial Water Storage Anomalies at the Global Scale with a Machine-Learning Model 

Irene Palazzoli, Serena Ceola, and Pierre Gentine

Changes in the level of the world freshwater storage, the Terrestrial Water Storage Anomalies (TWSA), may be induced by natural variability, climate change, and human activities. Since 2002 the Gravity Recovery and Climate Experiment (GRACE) has been measuring the Earth’s gravity field providing estimates of the TWSA at the global scale.

Here, we aim to develop a machine learning model that can reproduce the GRACE monthly time series covering the period between 2002 and 2017 from climate data, identifying to what extent the TWS fluctuations have been caused by climate variability. We used a Long Short-Term Memory (LSTM) neural network trained with meteorological variables (precipitation, air temperature, solar net radiation, snow cover, relative humidity, and leaf area index) and soil properties data (soil porosity, soil texture, and clay, sand, and silt fractions). Our results show that the model is able to consistently reconstruct the observed freshwater anomalies, especially in the humid regions. Furthermore, we observed that as climate change trends are removed from input data, the bias between model predictions and observed data becomes larger, proving the influence of climate change on TWSA.

How to cite: Palazzoli, I., Ceola, S., and Gentine, P.: Predicting Terrestrial Water Storage Anomalies at the Global Scale with a Machine-Learning Model, EGU General Assembly 2023, Vienna, Austria, 23–28 Apr 2023, EGU23-16641, https://doi.org/10.5194/egusphere-egu23-16641, 2023.

Satellite precipitation estimation provides crucial information for those places lacking rainfall observations from ground–based sensors, especially in terrestrial or marine areas with complex climatic or topographic conditions. This is the case over much of Western China, including Upper and Middle Lancang River Basin (UMLRB), an extremely important transnational river system in Asia (the Lancang–Mekong River Basin) with complex climate and topography that has limited long–term precipitation records and high–elevation data, and no operational weather radars. In this study, we evaluated three GPM IMERG satellite precipitation estimation (IMERG E, IMERG L and IMERG F) over UMLRB in terms of multi–year average precipitation distribution, amplitude consistency, occurrence consistency, and elevation–dependence in both dry and wet seasons. Results demonstrated that monsoon and solid precipitation mainly affected amplitude consistency of precipitation, aerosol affected occurrence consistency of precipitation, and topography and wind–induced errors affected elevation dependence. The amplitude and occurrence consistency of precipitation were best in wet seasons in the Climate Transition Zone and worst in dry seasons in the same zone. Regardless of the elevation–dependence of amplitude or occurrence in dry and wet seasons, the dry season in the Alpine Canyon Area was most positively dependent and most significant. More significant elevation–dependence was correlated with worse IMERG performance. The Local Weighted Regression (LOWERG) model showed a nonlinear relationship between precipitation and elevation in both seasons. The amplitude consistency and occurrence consistency of both seasons worsened with increasing precipitation intensity and was worst for extreme precipitation cases. IMERG F had great potential for application to hydroclimatic research and water resources assessment in the study area. Further research should assess how the dependence of IMERG’s spatial performance on climate and topography could guide improvements in global precipitation assessment algorithms and the study of mountain landslides, floods, and other natural disasters during the monsoon period.

How to cite: Lu, C.: Assessment of GPM IMERG Satellite Precipitation Estimationunder Complex Climatic and Topographic Conditions, EGU General Assembly 2023, Vienna, Austria, 23–28 Apr 2023, EGU23-16938, https://doi.org/10.5194/egusphere-egu23-16938, 2023.

EGU23-16978 | ECS | Orals | HS3.1

A new software for spatio-temporal analysis of gridded data sources 

Mauricio Zambrano-Bigiarini and Sebastián Bernal Vallejos

Several long-term gridded datasets have become available in the last decades on a global scale, at increasing spatial and temporal resolution, with low latency times. These datasetshave opened new opportunities to advance Earth Sciences modelling studies at different spatial and temporal scales, especially in poorly gauged areas. However, working with (hundreds of) thousands of raster time series (e.g., for (sub)daily precipitation), usually in different vectorial and raster formats, impose high computational challenges to efficiently analyse all the gridded datasets.

In this work we introduce a new R package for easy processing and analysis of raster time series, to bring the use of gridded data closer to the Earth Sciences community. This package expands the large number of spatial functions provided by the terra package by taking advantage of the time attribute of raster objects. A particular emphasis of the package is exploring and comparing gridded datasets of hydrological variables with different time frequencies (e.g., sub-hourly, hourly, daily, monthly, seasonal, annual).

General purpose functions include temporal subsetting, resampling, cropping, extracting time series for points or polygons, comparing two datasets using summary statistics, and exporting a raster time series as a collection of daily/monthly/annual files, each one of them with several layers of a higher temporal frequency. Also, temporal aggregation is possible from sub-hourly to hourly/daily/weekly/monthly/annual, among others. Most functions can take advantage of multi-core computers and network clusters, to reduce the computational burden.

To illustrate the use of this new package, we compared different state-of-the-art gridded precipitation products (CHIRPSv2, CMORPH v1.0, IMERGv06B, MSWXv1.0, ERA5, ERA5-Land, CR2METv2.5), all of them with different data formats and spatial resolutions, using continental Chile as a case study. However, based on the package's flexibility and ease of use, we hope the broader community of hydro-scientists and water-engineers will use it to visualise the spatio-temporal variation of key hydrological/environmental variables,to carry out time series analysis, to combinedifferent types of models and data sources, and to improve our integrated knowledge of the water cycle.

How to cite: Zambrano-Bigiarini, M. and Bernal Vallejos, S.: A new software for spatio-temporal analysis of gridded data sources, EGU General Assembly 2023, Vienna, Austria, 23–28 Apr 2023, EGU23-16978, https://doi.org/10.5194/egusphere-egu23-16978, 2023.

EGU23-16995 | Posters on site | HS3.1

Multi-period and multi-variable calibration of SWAT+ using gridded input datasets and a novel R package 

Rodrigo Marinao and Mauricio Zambrano-Bigiarini

For more than two decades, multi-objective optimisation (MOO) has imposed a new paradigm in the calibration of hydrological models, and over the years different algorithms and calibration approaches have been developed that aim to obtain consistent parameters for some specific hydrological model. However, the development of flexible multi-objective calibration tools has been scarce, making it difficult to spread these approaches to a wide range of researchers. 

The objective of this work is to show the application of a new multi-objective and multi-platform R package (hydroMOPSO) for the calibration of SWAT+, a widely used semi-distributed hydrological model. In particular, in this work hydroMOPSO is used beyond the traditional adoption of multiple objective functions. Instead, a multi-period (dry and wet years), and multi-variable (point streamflows and gridded soil moisture and evapotranspiration) are used as objectives, to illustrate the flexibility of hydroMOPSO to be linked with different model input and outputs, both with different file formats and temporal frequencies. Similar approaches could be applied with other hydrological models available in R (e.g., TUWmodel, airGR, topmodel) or any other model that can be run from the system console (e.g., Raven, MODFLOW, WEAP).

How to cite: Marinao, R. and Zambrano-Bigiarini, M.: Multi-period and multi-variable calibration of SWAT+ using gridded input datasets and a novel R package, EGU General Assembly 2023, Vienna, Austria, 23–28 Apr 2023, EGU23-16995, https://doi.org/10.5194/egusphere-egu23-16995, 2023.

An LSTM-based distributed hydrologic model for an urban watershed of Korea was developed. The input of the model is the time series of the 10-minute radar-gauge composite rainfall data and 10-minute temperature data at the 239 model grid cells, and the output of the model is the 10-minute flow discharge at the watershed outlet. The Nash-Sutcliffe Efficiency (NSE) coefficients of the calibration period (2013-2016) and validation period (2017-2019) were 0.99 and 0.67, respectively. Normal events were better predicted than the extreme ones. Further in-depth analyses revealed that: (1) the model composes the watershed outlet flow discharge by linearly superimposing multiple time series created by each of the LSTM units. Unlike conventional hydrologic models, most of these time series greatly fluctuated in both positive and negative domain; (2) the runoff to rainfall ratio of each of the model grid cells does not reflect its counterpart parameters of the conceptual hydrologic models  revealing that the model simulates the watershed responses in a unique manner; (3) the model successfully reproduced the soil-moisture dependent runoff processes, which is an essential prerequisite of continuous hydrologic models; (4) Each of the LSTM units have different temporal sensitivity to a unit rainfall stimulus, and the LSTM units that is sensitive to rainfall input have greater output weight factors nearby the watershed outlet, and vice versa. This means that the model learned a mechanism to separately consider the hydrologic components with distinct response time such as direct runoff and the low frequency baseflow. 

Acknowledgement

This research was supported by the Basic Science Research Program (Grant Number: 2021R1A2C2003471) and the Basic Research Laboratory Program (Grant Number: 2022R1A4A3032838) through the National Research Foundation of Korea (NRF) funded by the Ministry of Science and ICT.

How to cite: Kim, D. and Lee, Y.: Machines simulate hydrologic processes using a simple structure but in a unique manner – a case study of predicting fine scale watershed response on a distributed framework, EGU General Assembly 2023, Vienna, Austria, 23–28 Apr 2023, EGU23-245, https://doi.org/10.5194/egusphere-egu23-245, 2023.

This study developed a distributed hydrologic model based on Long Short-Term Memory (LSTM) to predict flow discharge of Joongrang stream located in a highly urbanized area in Seoul, Korea. The model inputs are the time series of 10-minute radar-gauge composite precipitation data at 239 grid cells (1km2) in the watershed and the Normalized Difference Vegetation Index (NDVI) data derived from Landsat 8 images and the model output is the 10-minute flow discharge at the watershed outlet as output. The model was trained for the calibration period of 2013-2016 and was validated for the period of 2017-2019. The NSE value over the validation period corresponding to the optimal model architecture (256 LSTM hidden layers) with and without NDVI input data was 0.68 and 0.52, respectively, which suggests that the machine can learn dynamic processes of soil infiltration and plant interception from the remotely sensed information provided by satellite.

This work was supported by the National Research Foundation of Korea(NRF) grant funded by the Korea government(MSIT) (No. NRF-2022R1A4A3032838). 

How to cite: Lee, J. and Kim, D.: Effectiveness of Satellite-based Vegetation Index for Simulating Watershed Response Using an LSTM-based model in a Distributed Framework, EGU General Assembly 2023, Vienna, Austria, 23–28 Apr 2023, EGU23-339, https://doi.org/10.5194/egusphere-egu23-339, 2023.

EGU23-1218 | Posters on site | HS3.3

Exploring the Value of Natural Language Processing for Urban Water Research 

Ina Vertommen, Xin Tian, Tessa Pronk, Siddharth Seshan, Sotirios Paraskevopoulos, and Bas Wols

Natural Language Processing (NLP), empowered by the most recent developments in Deep Learning, demonstrates its potential effectiveness for handling texts. Urban water research  benefits from both subfields of NLP, namely, Natural Language Understanding (NLU) and Natural Language Generation (NLG). In this work, we present three recent studies that use NLP for: (1) automated processing and responding to registered customer complaint within Dutch water utilities, (2) automated collection of up-to-date water-related information from the Internet, (3) extraction of key information about chemical compounds and pathogen characteristics from scientific publications. These applications, using the latest NLP models and tools (e.g., Rasa, Spacy), take into account studies on both water quality and quantity for the water sector. According to our findings, NLU and rule-based text mining are effective in extracting information from unstructured texts. In addition, NLU and NLG can be integrated to build a human-computer interface, such as a value-based Chabot to understand and address the demands made by customers of water utilities.

How to cite: Vertommen, I., Tian, X., Pronk, T., Seshan, S., Paraskevopoulos, S., and Wols, B.: Exploring the Value of Natural Language Processing for Urban Water Research, EGU General Assembly 2023, Vienna, Austria, 23–28 Apr 2023, EGU23-1218, https://doi.org/10.5194/egusphere-egu23-1218, 2023.

EGU23-1278 | ECS | Orals | HS3.3

Evaluating Machine Learning Approach for Regional Flood Frequency Analysis in Data-sparse Regions 

Nikunj K. Mangukiya and Ashutosh Sharma

Accurate flood frequency analysis is essential for developing effective flood management strategies and designing flood protection infrastructure, but it is challenging due to the complex, nonlinear hydrological system. In regional flood frequency analysis (RFFA), the flood quantiles at ungauged sites can be estimated by establishing a relationship between interdependent physio-meteorological variables and observed flood quantiles at gauge sites in the region. However, this regional approach implies a loss of information due to the prior aggregation of hydrological data at gauged locations and can be difficult for data-sparse regions due to limited data. In this study, we evaluated an alternate approach or path for RFFA in two case studies: a data-sparse region in India and a data-dense region in the USA. In this approach, daily streamflow is predicted first using a deep learning-based hydrological model, and then flood quantiles are estimated from the predicted daily streamflow using statistical methods. We compared the results obtained using this alternate approach to those from the traditional RFFA technique, which used the Random Forest (RF) and eXtreme Gradient Boosting (XGB) algorithms to model the nonlinear relationship between flood quantiles and relevant physio-meteorological predictor variables such as meteorological forcings, topography, land use, and soil properties. The results showed that the alternate approach produces more reliable results with the least mean absolute error and higher coefficient of determination in the data-sparse region. In the data-dense region, both traditional and alternate approaches produced comparable results. However, the alternate approach has the advantage of being flexible and providing the complete time series of daily flow at the ungauged location, which can be used to estimate other flow characteristics, develop flow duration curves, or estimate flood quantiles of any return period without creating a separate traditional RFFA model. This study shows that the alternate approach can provide accurate flood frequency estimates in data-sparse regions, offering a promising solution for flood management in these areas.

How to cite: Mangukiya, N. K. and Sharma, A.: Evaluating Machine Learning Approach for Regional Flood Frequency Analysis in Data-sparse Regions, EGU General Assembly 2023, Vienna, Austria, 23–28 Apr 2023, EGU23-1278, https://doi.org/10.5194/egusphere-egu23-1278, 2023.

EGU23-1526 | ECS | Orals | HS3.3

Extrapo… what? Predictions beyond the support of the training data 

Ralf Loritz and Hoshin Gupta

Neural networks belong to the best available methods for numerous hydrological model challenges. However, although they have shown to outperform classical hydrological models in several applications there is still some doubt whether neural networks are, despite their excellent interpolation skills, capable to make predictions beyond the support of the training data. This study addresses this issue and proposes an approach to infer the ability of neural network to predict unusual, extreme system states. We show how we can use the concept of data surprise and model surprise in a complementary manner to assess which unusual events a neural network can predict, which it can predict but only with additionally data and which it cannot predict at all hinting toward the wrong model choice or towards an incomplete description of the data.

How to cite: Loritz, R. and Gupta, H.: Extrapo… what? Predictions beyond the support of the training data, EGU General Assembly 2023, Vienna, Austria, 23–28 Apr 2023, EGU23-1526, https://doi.org/10.5194/egusphere-egu23-1526, 2023.

Having a continuous and complete karst discharge data record is necessary to understand hydrological behaviors of the karst aquifer and manage karst water resources. However, caused by many problems such as equipment errors and failure of observation, lots of hydrological and research dataset contains missing spring discharge values, which becomes a main barrier for further environmental and hydrological modeling and studies. In this work, a novel approach that integrates deep learning algorithms and ensemble empirical mode decomposition (EEMD) is developed to reconstruct missing karst spring discharge values with the local precipitation. EEMD is firstly employed to decompose the precipitation data, extract useful features, and remove noises. The decomposed precipitation components are then fed as input data to various deep learning models for performance comparison, including convolutional neural network (CNN), long short-term memory (LSTM), and hybrid CNN-LSTM models to reconstruct the missing discharge values. Root mean squared error (RMSE) and Nash–Sutcliffe efficiency coefficient (NSE), are calculated to evaluate the reconstruction performance as metrics. The models are validated with the spring discharge and precipitation data collected at Barton Spring in Texas. The reconstruction performance of various deep learning models with and without EEMD are compared and evaluated. The main conclusions can be summarized as: 1) by using EEMD, the integrated deep models significantly improve reconstruction performance and outperform the simple deep models; 2) among three integrated models, the LSTM-EEMD model obtains the best reconstruction results among three deep learning algorithms; 3) For models with monthly data, the reconstruction performance decreases greatly with the increase of missing rate: the best reconstruction results are obtained when the missing rate is low. If the missing rate was 50%, the reconstruction results become notably poorer. For models with daily data, the reconstruction performance is less impacted by the missing rate and the models can obtain satisfactory reconstruction results when missing rates range from 10% to 50%.

How to cite: Zhou, R. and Zhang, Y.: Reconstruct karst spring discharge data with hybrid deep learning models and ensemble empirical mode decomposition method, EGU General Assembly 2023, Vienna, Austria, 23–28 Apr 2023, EGU23-2382, https://doi.org/10.5194/egusphere-egu23-2382, 2023.

Machine Learning and Deep Learning have been proving their potential for streamflow modelling in various studies. In particular, long short-term memory (LSTM) models showed exceptionally good results. However, machine learning models often are considered “black boxes” with limited interpretability. Explainable artificial intelligence (XAI) comprise methods that analyze the internal processes of the machine learning network and allow to have a glance in the “black box”. Most proposed XAI techniques are designed for the analysis of images, and there is currently only limited work on time series data available.

In our study, we applied various XAI algorithms including gradient-based methods (Saliency, InputXGradient, Integrated Gradient, GradientSHAP) but also perturbation-based methods (Feature Ablation, Feature Permutation) to compare their applicability for reasonable interpretation in the hydrological context. To our knowledge, only Integrated Gradient has been applied to a LSTM in hydrology so far. Gradient-based methods analyze the gradient of the output with respect to the input feature. Whereas perturbation-based methods gain information by altering or masking specific input features. The different methods were applied to a LSTM trained for the low-land Ems catchment in Germany, which has a major baseflow share of total streamflow.

We analyzed the results regarding their “timestep of influence”, which describes the amount of past days having importance for the prediction of streamflow at a particular day. All of the algorithms applied result in a comparable annual pattern, characterized by relatively small timesteps of influence in spring (wet season) and increasing timesteps of influence in summer and autumn (dry season). However, the range of the absolute days of attribution varies between the methods. In conclusion, all methods produces reasonable results and appear to be suitable for interpretation purposes.

Furthermore, we compare the results to ERA-5 reanalysis data and gained evidence that the LSTM recognizes soil water storage as the main driver for streamflow generation in the catchment: we found an inverse seasonality of soil moisture and timestep of influence.

How to cite: Ley, A., Bormann, H., and Casper, M.: Exploring different explainable artificial intelligence algorithms applied to a LSTM for streamflow modelling, EGU General Assembly 2023, Vienna, Austria, 23–28 Apr 2023, EGU23-3125, https://doi.org/10.5194/egusphere-egu23-3125, 2023.

EGU23-4137 | ECS | Orals | HS3.3

Sequential optimization of temperature measurements to estimate groundwater-surface water interactions 

Robin Thibaut, Ty Ferré, Eric Laloy, and Thomas Hermans
The groundwater-surface water (GW-SW) exchange fluxes are driven by a complex interplay of subsurface processes and their interactions with surface hydrology, which have a significant impact on the water and contaminant exchanges. Due to the complexity of these systems, the accurate estimation of GW-SW fluxes is important for quantitative hydrological studies and should be based on relevant data and careful experimental design. Therefore, the effective design of monitoring networks that can identify relevant subsurface information are essential for the optimal protection of our water resources. In this study, we present novel deep learning (DL)-driven approaches for sequential and static Bayesian optimal experimental design (BOED) in the subsurface, with the goal of estimating the GW-SW exchange fluxes from a set of temperature measurements. We apply probabilistic Bayesian neural networks (PBNN) to conditional density estimation (CDE) within a BOED framework, and the predictive performance of the PBNN-based CDE model is evaluated by a custom objective function based on the Kullback-Leibler divergence to determine optimal temperature sensor locations utilizing the information gain provided by the measurements. This evaluation is used to determine the optimal sequential sampling strategy for estimating GW-SW exchange fluxes in the 1D case, and the results are compared to the static optimal sampling strategy for a 3D conceptual riverbed-aquifer model based on a real case study. Our results indicate that probabilistic DL is an effective method for estimating GW-SW fluxes from temperature data and designing efficient monitoring networks. Our proposed framework can be applied to other cases involving surface or subsurface monitoring and experimental design.

How to cite: Thibaut, R., Ferré, T., Laloy, E., and Hermans, T.: Sequential optimization of temperature measurements to estimate groundwater-surface water interactions, EGU General Assembly 2023, Vienna, Austria, 23–28 Apr 2023, EGU23-4137, https://doi.org/10.5194/egusphere-egu23-4137, 2023.

Rainfall-runoff (RR) modeling remains a challenging task in the field of hydrology especially when it comes to regional scale hydrology. Recently, the Long Short-Term Memory (LSTM) - which is known for its ability to learn sequential and temporal relations - has been widely adopted in RR modeling. The Convolutional Neural Networks (CNN) have matured enough in computer vision tasks, and trials were conducted to use them in hydrological applications. Different combinations of CNN and LSTM have proved to work; however, questions remain about suitability of different model architectures, the input variables needed for the model and the interpretability of the learning process of the models for regional scale.


In this work we trained a sequential CNN-LSTM deep learning architecture to predict daily streamflow between 1980 and 2014, regionally and simultaneously, over 86 catchments from CAMELS dataset in the US. The model was forced using year-long spatially distributed (gridded) input with precipitation, maximum temperature and minimum temperature for each day, to predict one day streamflow. The model takes advantage of the CNN to encode the spatial patterns in the input tensor, and feed them to the LSTM for learning the temporal relations between them. The trained model was further fine-tuned to predict for 3 local sub-clusters of the 86 stations. This was made in order to test the significance of fine-tuning in the performance and model learning process. Also, to interpret the spatial patterns learning process, a perturbation was introduced in the gridded input data and the sensitivity of the model output to the perturbation was shown in spatial heat maps. Finally, to evaluate the performance of the model, different benchmark models were trained using -as possible- a similar training setup as for the CNN-LSTM model. These models are CNN without the LSTM part (regional model), LSTM without CNN part (regional model), simple single-layer ANN (regional model), and LSTM trained for individual stations (considered as state of the art). All of these benchmark models have been fined-tuned for the 3 clusters as well.


CNN-LSTM model, after being fine-tuned, performed well predicting daily streamflow over the test period with a median Nash-Sutcliffe efficiency (NSE) of 0.62 and 65% of the 86 stations with NSE > 0.6 outperforming all benchmark models that were trained regionally using the same training setup. The model also achieved a comparable performance as for the -state of the art- LSTM trained for individual stations. Fine-tuning improved the performance for all of the models during the test period. The CNN-LSTM model, was shown to be more sensitive to input perturbations near the stations in which the prediction is intended. This was even clearer for the fine-tuned model, indicating that the model is learning spatially relevant information from the input gridded data, and fine tuning is helping on guiding the model to focus more on the relevant input.  


This work shows the potential of CNN and LSTM for regional Rainfall-runoff modeling by capturing spatiotemporal patterns involved in RR process. The work, also, contributes toward more physically interpretable data-driven modeling paradigm.

How to cite: Mohammed, A. and Corzo, G.: Evaluation of regional Rainfall-Runoff modelling using convolutional long short-term memory:  CAMELS dataset in US as a case study., EGU General Assembly 2023, Vienna, Austria, 23–28 Apr 2023, EGU23-4177, https://doi.org/10.5194/egusphere-egu23-4177, 2023.

EGU23-4179 | Orals | HS3.3

Improving Data-Driven Flow Forecasting in Large Basins using Machine Learning to Route Flows 

David Lambl, Mostafa Elkurdy, Phil Butcher, Laura K Read, and Alden Keefe Sampson

Producing accurate hourly streamflow forecasts in large basins is difficult without a distributed model to represent both streamflow routing through the river network and the spatial heterogeneity of land and weather conditions. HydroForecast is a theory-guided deep learning flow forecasting product that consists of short-term (hourly predictions out to 10 days), seasonal (10 day predictions out to a year), and daily reanalysis models. This work focuses primarily on the short-term model which has award winning accuracy across a wide range of basins.

In this work, we discuss the implementation of a novel distributed flow forecasting capability of HydroForecast, which splits basins into smaller sub-basins and routes flows from each subbasin to the downstream forecast points of interest. The entire model is implemented as a deep neural network allowing end-to-end training of both sub-basin runoff prediction and flow routing. The model's routing component predicts a unit hydrograph of flow travel time at each river reach and timestep allowing us to inspect and interpret the learned river routing and to seamlessly incorporate any upstream gauge data. 

We compare the accuracy of this distributed model to our original flow forecasting model at selected sites and discuss future improvements that will be made to this model.

How to cite: Lambl, D., Elkurdy, M., Butcher, P., Read, L. K., and Sampson, A. K.: Improving Data-Driven Flow Forecasting in Large Basins using Machine Learning to Route Flows, EGU General Assembly 2023, Vienna, Austria, 23–28 Apr 2023, EGU23-4179, https://doi.org/10.5194/egusphere-egu23-4179, 2023.

EGU23-4801 | Posters on site | HS3.3

Improving Streamflow Predictions over Indian Catchments using Long Short Term Memory Networks 

Bhanu Magotra, Manabendra Saharia, and Chandrika Thulaseedharan Dhanya

Streamflow modelling plays a critical role in water resource management activities. The “physically based" models require high computation resources and large amounts of input meteorological data which results in high operating costs and longer running times. On the other hand, with advancements in deep-learning techniques, data-driven models such as long short-term memory (LSTM) networks have been shown to successfully model non-linear rainfall-runoff relationships through historically observed data at a fraction of computation cost. Moreover, using physics-informed machine learning techniques, the physical consistency of data-driven models can be further improved. In this study, one such method is applied where we trained a physics-informed LSTM network model over 278 Indian catchments to simulate streamflow at a daily timestep using historically observed precipitation and streamflow data. The ancillary data included meteorological forcings, static catchment attributes, and Noah-MP simulated land surface states and fluxes such as soil moisture, latent heat, and total evapotranspiration. The LSTM model's performance was evaluated using error metrics such as Nash-Sutcliffe Efficiency (NSE), Kling-Gupta Efficiency (KGE) and its components, along with skill scores based on 2x2 contingency matrix for hydrological extremes. The trained LSTM model shows improved performance in simulating streamflow over the catchments compared to the physically based model. This will be the first study over India to generate reliable streamflow simulations using a hybrid state-of-the-art approach, which will be beneficial to policy makers for effective water resource management in India. 

How to cite: Magotra, B., Saharia, M., and Dhanya, C. T.: Improving Streamflow Predictions over Indian Catchments using Long Short Term Memory Networks, EGU General Assembly 2023, Vienna, Austria, 23–28 Apr 2023, EGU23-4801, https://doi.org/10.5194/egusphere-egu23-4801, 2023.

EGU23-4842 | ECS | Orals | HS3.3

Introducing DL-GLOBWB: a deep-learning surrogate of a process-based global hydrological model 

Bram Droppers, Myrthe Leijnse, Marc F.P. Bierkens, and Niko Wanders

Process-based global hydrological models are an important tool for sustainable development and policy making in today’s water-scarce world. These models are able to inform national to regional scale water management with basin-scale accounting of water availability and demand and project the impacts of climate change and adaptation on water resources. However, the increasing need for better and higher resolution hydrological information is proving difficult for these state-of-the-art process-based models as the associated computational requirements are significant.

Recently, the deep-learning community has shown that neural networks (in particular the LSTM network) can provide hydrological information with an accuracy that rivals, if not exceeds, that of process-based hydrological models. Although the training of these neural networks takes time, prediction is fast compared to process-based simulations. Nevertheless, training is mostly done on historical observations and thus projections under climate change and adaptation are uncertain.

Inspired by the complementary strengths and weaknesses of the process-based and deep-learning approaches, we present DL-GLOBWB: a deep-learning surrogate of the state-of-the-art PCR-GLOBWB global hydrological model. DL-GLOBWB predicts all water-balance components from the process-based model, including human water demand and abstraction, with a nRSME of 0.05 (range between 0.0001 and 0.32). The DL-GLOBWB surrogate is orders of magnitudes faster than its process-based counterpart, especially as surrogates trained at low resolutions (e.g. 30 arc-minute) can effectively be downscaled to higher resolutions (e.g. 5 arc-minute).

In addition to introducing DL-GLOBWB, our presentation will explore future applications of this deep-learning surrogate, such as (1) improving model calibration and performance by comparing DL-GLOBWB outputs with ins-situ data and satellite observations; (2) training DL-GLOBWB on  future model projections to include global change; and (3) the implementation of DL-GLOBWB to dynamically, and at high resolution, visualize the impact of climate change and adaptation to stakeholders.

How to cite: Droppers, B., Leijnse, M., Bierkens, M. F. P., and Wanders, N.: Introducing DL-GLOBWB: a deep-learning surrogate of a process-based global hydrological model, EGU General Assembly 2023, Vienna, Austria, 23–28 Apr 2023, EGU23-4842, https://doi.org/10.5194/egusphere-egu23-4842, 2023.

IMERG is a global satellite-based precipitation dataset, produced by NASA. It has provided valuable rainfall information to facilitate the design or the operation of the disaster and risk management worldwide. In operation, NASA offers three types of IMERG Level 3 (L3) products, with different levels of trade-offs in terms of time latency and accuracy. These are Early run (4-hour latency), Late run (14-hour latency) and Final run(3.5-month latency). The final-run product integrates multi-sensor retrievals and provides the highest-quality precipitation estimates among three IMERG products. It however suffers from a long processing latency, which hinders its applicability to near real-time applications. In the past 10 years, deep learning techniques have made significant breakthroughs in various scientific fields, including short-term rainfall forecasting. Deep learning models have shown to have the potential to learn the complex variations in weather systems and to outperform the Numerical Weather Prediction (NWP) in terms of short lead-time predictability and the required computational resources for operation.


In this research, we would like to explore the potential of deep learning (DL) in generating high-quality satellite-based precipitation product with low latency. More specifically, we investigate if DL models can learn the difference between Final- and Early-run products, and thus predict a Final-run-like product using Early-run product as input. Low-latency yet high-quality IMERG precipitation product can be therefore obtained. Various DL techniques are being tested in this work, including Auto-Encoder(AE), ConvLSTM and Deep Generative model. IMERG data between 2018 and 2020 over a rectangular area centred in the UK is used for model training and testing, and ground rain gauge records will be used to evaluate the performance of the original and predicted products. This pilot includes both ocean and land regions, which enables the comparison of the model performance between two different surface conditions. Preliminary analysis suggests that given patterns do exist in the differences between Early- and Final-run products, and the capacity of the selected DL models to learn the differences will be further investigated. The proposed work is of great potential to improve the applicability of IMERG products in an operational context.

How to cite: Hung, H. T. and Wang, L.-P.: IMERG Run Deep: Can we produce a low-latency IMERG Final run product with a deep learning based prediction model?, EGU General Assembly 2023, Vienna, Austria, 23–28 Apr 2023, EGU23-4887, https://doi.org/10.5194/egusphere-egu23-4887, 2023.

EGU23-4970 | ECS | Posters on site | HS3.3

Use of Long-Short Term Memory network (LSTM) in the reconstruction of missing water level data in the Seine River. 

Imad Janbain, Julien Deloffre, Abderrahim Jardani, Minh Tan Vu, and Nicolas Massei

Missing data is the first major problem that appears in many database fields for a set of reasons. It has always been necessary to fill them, which becomes unavoidable and more complicated when the missing periods are longer. Several machine-learning-based approaches have been introduced to deal with this problem. 

The purpose of this paper is to discuss the effectiveness of a new methodology added prior to the LSTM deep learning algorithm to fill in the missing data in the hourly surface water level time series of some stations installed along the Seine River in Normandy-France. In our study, due to a lack of data, a challenging situation was faced where only the water level data in the same station, which contain many missing parts, were used as input and output variables to fill the station itself in a self-learning approach. This contrasts with the common work on imputing missing data, where several features are available to take advantage of in a multivariate and spatiotemporally way, e.g.: using the same variable from other stations or exploiting other physical variables and metrological data, etc. The reconstruction accuracy of the proposed method depends on both the size of the available/missing data and the parameters of the networks. Therefore, we performed sensitivity analyses on both the properties of the networks and the structuring of the input and output data to better determine the appropriate strategy. During this analysis process, a data preprocessing method was developed and added prior to the LSTM model. This data processing method was discovered by presenting many scenarios, each of which was an updated version of the last one. Along with these scenarios, limitations were also addressed and overcome. Finally, the last model version was able to impute missing values that may reach one year of hourly data with high accuracy (One-year RMSE = 0.14 m) regardless of neither the location of the missing part in the series nor its size.  

How to cite: Janbain, I., Deloffre, J., Jardani, A., Vu, M. T., and Massei, N.: Use of Long-Short Term Memory network (LSTM) in the reconstruction of missing water level data in the Seine River., EGU General Assembly 2023, Vienna, Austria, 23–28 Apr 2023, EGU23-4970, https://doi.org/10.5194/egusphere-egu23-4970, 2023.

The objective function plays an important role in the training process for deep learning models, since it largely determines the trained values of the model parameters and influences the model performance. In this study, we establish two application-orientated objective functions, namely high flow balance error (HFBE) and transformed mean absolute percentage error (MAPE*), for the forecasts of high flows and low flows, respectively, in the LSTM model. We examine the strength and weakness of these streamflow forecast models trained on HFBE, MAPE* and mean square error (MSE) based on multiple performance metrics. Furthermore, we propose the objective function-based ensemble model (OEM) framework that integrates the models trained on different objective functions, so as to take advantages of the trained models focusing on different aspects of streamflow and thus achieve a better overall performance. Our results in 273 catchments over USA show that the models trained on HFBE can alleviate underestimation in high flows existing in the models trained on MSE, and perform remarkably better for high flows. It is also found that the models trained on MAPE* outperform the other two models in low flow forecast, no matter what algorithm is used for the model establishment. By incorporating the three models trained on HFBE, MAPE* and MSE, respectively, our proposed OEM performs well in the forecasts of both high flows and low flows, and realistically capture the mean and the variability of the observational streamflow under different scenarios under a variety of hydrometeorological conditions. This study highlights the necessity of applying application-orientated objective functions for given projects and the great potential of the ensemble learning methods for multi-optimization in hydrological modeling.

How to cite: Wang, D.: The role of ensemble learning in multi-optimization for streamflow prediction, EGU General Assembly 2023, Vienna, Austria, 23–28 Apr 2023, EGU23-5044, https://doi.org/10.5194/egusphere-egu23-5044, 2023.

EGU23-5199 | ECS | Posters virtual | HS3.3

How do machine learning models deal with inter-catchment groundwater flows? 

Nicolas Weaver, Taha-Abderrahman El-Ouahabi, Thibault Hallouin, François Bourgin, Charles Perrin, and Vazken Andréassian

Machine learning models have recently gained popularity in hydrological modelling at the catchment scale, fuelled by the increasing availability of large-sample data sets and the increasing accessibility of deep learning frameworks, computing environments, and open-source tools. In particular, several large-sample studies at daily and monthly time scales across the globe showed successful applications of the LSTM architecture as a regional model learning of the hydrological behaviour at the catchment scale. Yet, a deeper understanding of how machine learning models close the water balance and how they deal with inter-catchment groundwater flows is needed to move towards better process understanding. We investigate the performance and behaviour of the LSTM architecture at a monthly time step on a large sample French data set coined CHAMEAU – following the CAMELS initiative. To provide additional information to the learning step of the LSTM, we use the parameter sets and fluxes from the conceptual GR2M model that has a dedicated formulation to deal with inter-catchment groundwater flows. We see this study as a contribution towards the development of hybrid hydrological models.

How to cite: Weaver, N., El-Ouahabi, T.-A., Hallouin, T., Bourgin, F., Perrin, C., and Andréassian, V.: How do machine learning models deal with inter-catchment groundwater flows?, EGU General Assembly 2023, Vienna, Austria, 23–28 Apr 2023, EGU23-5199, https://doi.org/10.5194/egusphere-egu23-5199, 2023.

EGU23-5445 | ECS | Posters on site | HS3.3

Physics-Informed Neural Networks for Statistical Emulation of Hydrodynamical Numerical Models 

James Donnelly, Alireza Daneshkhah, and Soroush Abolfathi

The application of numerical models for flood and inundation modelling has become widespread in the past decades as a result of significant improvements in computational capabilities. Computational approaches to flood forecasting have significant benefits compared to empirical approaches which estimate statistical patterns of hydrological variables from observed data. However, there is still a significant computational cost associated with numerical flood modelling at high spatio-temporal resolutions. This limitation of numerical modelling has led to the development of statistical emulator models, machine learning (ML) models designed to learn the underlying generating process of the numerical model. The data-driven approach to ML involves relying entirely upon a set of training data to inform decisions about model selection and parameterisations. Deep learning models have leveraged data-driven learning methods with improvements in hardware and an increasing abundance of data to obtain breakthroughs in various fields such as computer vision, natural language processing and autonomous driving. In many scientific and engineering problems however, the cost of obtaining data is high and so there is a need for ML models that are able to generalise in the ‘small-data’ regime common to many complex problems. In this study, to overcome extrapolation and over-fitting issues of data-driven emulators, a Physics-Informed Neural Network model is adopted for the emulation of all two-dimensional hydrodynamic models which model fluid according the shallow water equations. This study introduces a novel approach to encoding the conservation of mass into a deep learning model, with additional terms included in the optimisation criterion, acting to regularise the model, avoid over-fitting and produce more physically consistent predictions by the emulator.

How to cite: Donnelly, J., Daneshkhah, A., and Abolfathi, S.: Physics-Informed Neural Networks for Statistical Emulation of Hydrodynamical Numerical Models, EGU General Assembly 2023, Vienna, Austria, 23–28 Apr 2023, EGU23-5445, https://doi.org/10.5194/egusphere-egu23-5445, 2023.

EGU23-5736 | ECS | Orals | HS3.3

A Novel Workflow for Streamflow Prediction in the Presence of Missing Gauge Observations 

Rendani Mbuvha, Peniel Julien Yise Adounkpe, Mandela Coovi Mahuwetin Houngnibo, and Nathaniel Newlands

Streamflow predictions are a vital tool for detecting flood and drought events. Such predictions are even more critical to Sub-Saraharan African regions that are vulnerable to the increasing frequency and intensity of such events. These regions are sparsely gauged, with few available gauging stations that are often plagued with missing data due to various causes, such as harsh environmental conditions and constrained operational resources. 

This work presents a novel workflow for predicting streamflow in the presence of missing gauge observations. We leverage bias correction of the GEOGloWS ECMWF streamflow service (GESS) forecasts for missing data imputation and predict future streamflow using the state-of-the-art Temporal Fusion transformers at ten river gauging stations in the Benin Republic.

We show by simulating missingness in a testing period that GESS forecasts have a significant bias that results in poor imputation performance over the ten Beninese stations. Our findings suggest that overall bias correction by Elastic Net and Gaussian Process regression achieves superior performance relative to traditional imputation by established methods such as Random Forest, k-Nearest Neighbour, and GESS lookup. We also show that the Temporal Fusion Transformer yields high predictive skill and further provides explanations for predictions through the weights of its attention mechanism. The findings of this work provide a basis for integrating Global streamflow prediction model data and state-of-the-art machine learning models into operational early-warning decision-making systems (e.g., flood/ drought alerts) in resource-constrained countries vulnerable to drought and flooding due to extreme weather events.

How to cite: Mbuvha, R., Adounkpe, P. J. Y., Houngnibo, M. C. M., and Newlands, N.: A Novel Workflow for Streamflow Prediction in the Presence of Missing Gauge Observations, EGU General Assembly 2023, Vienna, Austria, 23–28 Apr 2023, EGU23-5736, https://doi.org/10.5194/egusphere-egu23-5736, 2023.

EGU23-6313 | ECS | Posters on site | HS3.3

Moving away from deterministic solutions: A probabilistic machine learning approach to account for geological model uncertainty in groundwater modelling 

Mathias Busk Dahl, Troels Norvin Vilhelmsen, Rasmus Bødker Madsen, and Thomas Mejer Hansen

Decision-making related to groundwater management often relies on results from a deterministic groundwater model representing one ‘optimal’ solution. However, such a single deterministic model lacks representation of subsurface uncertainties. The simplicity of such a model is appealing, as typically only one is needed, but comes with the risk of overlooking critical scenarios and possible adverse environmental effects. Instead, we argue, that groundwater management should be based on a probabilistic model that incorporates the uncertainty of the subsurface structures to the extent that it is known. If such a probabilistic model exists, it is, in principle, simple to propagate the uncertainties of the model parameter using multiple numerical simulations, to allow a quantitative and probabilistic base for decision-makers. However, in practice, such an approach can become computationally intractable. Thus, there is a need for quantifying and propagating the uncertainty numerical simulations and presenting outcomes without losing the speed of the deterministic approach.

This presentation provides a probabilistic approach to the specific groundwater modelling task of determining well recharge areas that accounts for the geological uncertainty associated with the model using a deep neural network. The results of such a task are often part of an investigation for new abstraction well locations and should, therefore, present all possible outcomes to give informative decision support. We advocate for the use of a probabilistic approach over a deterministic one by comparing results and presenting examples, where probabilistic solutions are essential for proper decision support. To overcome the significant increase in computation time, we argue that this problem can be solved using a probabilistic neural network trained on examples of model outputs. We present a way of training such a network and show how it performs in terms of speed and accuracy. Ultimately, this presentation aims to contribute with a method for incorporating model uncertainty in groundwater modelling without compromising the speed of the deterministic models.

How to cite: Busk Dahl, M., Norvin Vilhelmsen, T., Bødker Madsen, R., and Mejer Hansen, T.: Moving away from deterministic solutions: A probabilistic machine learning approach to account for geological model uncertainty in groundwater modelling, EGU General Assembly 2023, Vienna, Austria, 23–28 Apr 2023, EGU23-6313, https://doi.org/10.5194/egusphere-egu23-6313, 2023.

EGU23-6466 | ECS | Orals | HS3.3

Neural ODE Models in Large-Sample Hydrology 

Marvin Höge, Andreas Scheidegger, Marco Baity-Jesi, Carlo Albert, and Fabrizio Fenicia

Neural Ordinary Differential Equation (ODE) models have demonstrated high potential in providing accurate hydrologic predictions and process understanding for single catchments (Höge et al., 2022). Neural ODEs fuse a neural network model core with a mechanistic equation framework. This hybrid structure offers both traceability of model states and processes, like in conceptual hydrologic models, and the high flexibility of machine learning to learn and refine model interrelations. Aside of the functional dependence of internal processes on driving forces, like of evapotranspiration on temperature, Neural ODEs are also able to learn the effect of catchment-specific attributes, e.g. land cover types, on processes when being trained over multiple basins simultaneously.


We demonstrate the performance of a generic Neural ODE architecture in a hydrologic large-sample setup with respect to both predictive accuracy and process interpretability. Using several hundred catchments, we show the capability of Neural ODEs to learn the general interplay of catchment-specific attributes and hydrologic drivers in order to predict discharge in out-of-sample basins. Further, we show how functional relations learned (encoded) by the neural network can be translated (decoded) into an interpretable form, and how this can be used to foster understanding of processes and the hydrologic system.


Höge, M., Scheidegger, A., Baity-Jesi, M., Albert, C., & Fenicia, F.: Improving hydrologic models for predictions and process understanding using Neural ODEs. Hydrol. Earth Syst. Sci., 26, 5085-5102, https://hess.copernicus.org/articles/26/5085/2022/

How to cite: Höge, M., Scheidegger, A., Baity-Jesi, M., Albert, C., and Fenicia, F.: Neural ODE Models in Large-Sample Hydrology, EGU General Assembly 2023, Vienna, Austria, 23–28 Apr 2023, EGU23-6466, https://doi.org/10.5194/egusphere-egu23-6466, 2023.

EGU23-7347 | ECS | Orals | HS3.3

Deep learning for mapping water bodies in the Sahel 

Mathilde de FLEURY, Laurent Kergoat, Martin Brandt, Rasmus Fensholt, Ankit Kariryaa, Gyula Mate Kovács, Stéphanie Horion, and Manuela Grippa

Inland surface water, especially lakes and small water bodies, are essential resources and have impacts on biodiversity, greenhouse gases and health. This is particularly true in the semi-arid Sahelian region, where these resources remain largely unassessed, and little is known about their number, size and quality. Remote sensing monitoring methods remain a promising tool to address these issues at the large scale, especially in areas where field data are scarce. Thanks to technological advances, current remote sensing systems provide data for regular monitoring over time and offer a high spatial resolution, up to 10 metres.  

Several water detection methods have been developed, many of them using spectral information to differentiate water surfaces from soil, through thresholding on water indices (MNDWI for example), or classifications by clustering. These methods are sensitive to optical reflectance variability and are not straight forwardly applicable to regions, such as the Sahel, where the lakes and their environment are very diverse. Particularly, the presence of aquatic vegetation is an important challenge and source of error for many of the existing algorithms and available databases.  

Deep learning, a subset of machine learning methods for training deep neural networks, has emerged as the state-of-the-art approach for a large number of remote sensing tasks. In this study, we apply a deep learning model based on the U-Net architecture to detect water bodies in the Sahel using Sentinel-2 MSI data, and 86 manually defined lake polygons as training data. This framework was originally developed for tree mapping (Brandt et al., 2020, https://doi.org/10.1038/s41586-020-2824-5).   

Our preliminary analysis indicate that our models achieve a good accuracy (98 %). The problems of aquatic vegetation do not appear anymore, and each lake is thus well delimited irrespective of water type and characteristics. Using the water delineations obtained, we then classify different optical water types and thereby highlight different type of waterbodies, that appear to be mostly turbid and eutrophic waters, allowing to better understand the eco-hydrological processes in this region.  

This method demonstrates the effectiveness of deep learning in detecting water surfaces in the study region. Deriving water masks that account for all kind of waterbodies offer a great opportunity to further characterize different water types. This method is easily reproducible due to the availability of the satellite data/algorithm and can be further applied to detect dams and other human-made features in relation to lake environments. 

How to cite: de FLEURY, M., Kergoat, L., Brandt, M., Fensholt, R., Kariryaa, A., Kovács, G. M., Horion, S., and Grippa, M.: Deep learning for mapping water bodies in the Sahel, EGU General Assembly 2023, Vienna, Austria, 23–28 Apr 2023, EGU23-7347, https://doi.org/10.5194/egusphere-egu23-7347, 2023.

EGU23-7828 | ECS | Posters on site | HS3.3

Sub-seasonal daily precipitation forecasting based on Long Short-Term Memory (LSTM) models 

Claudia Bertini, Gerald Corzo, Schalk Jan van Andel, and Dimitri Solomatine

Water managers need accurate rainfall forecasts for a wide spectrum of applications, ranging from water resources evaluation and allocation, to flood and drought predictions. In the past years, several frameworks based on Artificial Intelligence have been developed to improve the traditional Numerical Weather Prediction (NWP) forecasts, thanks to their ability of learning from past data, unravelling hidden relationships among variables and handle large amounts of inputs. Among these approaches, Long Short-Term Memory (LSTM) models emerged for their ability to predict sequence data, and have been successfully used for rainfall and flow forecasting, mainly with short lead-times. In this study, we explore three different multi-variate LSTM-based models, i.e. vanilla LSTM, stacked LSTM and bidirectional LSTM, to forecast daily precipitation for the upcoming 30 days in the area of Rhine Delta, the Netherlands. We use both local atmospheric and global climate variables from the ERA-5 reanalysis dataset to predict rainfall, and we introduce a fuzzy index for the models to account for seasonality effects. The framework is developed within the H2020 project CLImate INTelligence (CLINT), and its outcomes have the potential to improve forecasting precipitation deficit in the study area.

How to cite: Bertini, C., Corzo, G., van Andel, S. J., and Solomatine, D.: Sub-seasonal daily precipitation forecasting based on Long Short-Term Memory (LSTM) models, EGU General Assembly 2023, Vienna, Austria, 23–28 Apr 2023, EGU23-7828, https://doi.org/10.5194/egusphere-egu23-7828, 2023.

Terrestrial water storage (TWS) anomalies from Gravity Recovery and Climate Experiment (GRACE) and its follow on GRACE-FO satellite missions provide a unique opportunity to measure the impact of different climate extremes and human intervention on water use at regional and continental scales. However, temporal gaps within GRACE and GRACE-FO mission (GRACE: 20 months, between GRACE and GRACE-FO: 11 months and GRACE-FO: 2 months) pose difficulties in analyzing spatiotemporal variations in TWS. In this study, Convolutional Long Short-Term Memory Neural Networks (CNN-LSTM) model was developed to fill these gaps and reconstruct the TWS for the Indian subcontinent (April 2002-July 2022). Various meteorological and climatic variables, such as precipitation, temperature, run-off, evapotranspiration, and vegetation, have been integrated to predict GRACE TWS. The performance of the models was evaluated with the help of Pearson’s correlation coefficient (PR), Nash-Sutcliffe efficiency (NSE), and Normalised Root Mean Square Error (NRMSE). Results indicate that the CNN-LSTM model yielded a mean PR of 0.94 and 0.89, NSE of 0.87 and 0.8, and NRMSE of 0.075 and 0.101 on training and testing, respectively. Overall, the CNN-LSTM achieved good performance except in the northwestern region of India, which showed a relatively poor performance might be due to high anthropogenic activity and arid climatic conditions. Further reconstructed time series were used to study the Spatiotemporal variations of TWS over the Indian Subcontinent.

Keywords: GRACE; Deep Learning; TWSA; Indian subcontinent

How to cite: Moudgil, P. S. and Rao, G. S.: Filling Temporal Gaps within and between GRACE and GRACE-FO Terrestrial Water Storage Changes over Indian Sub-Continent using Deep Learning., EGU General Assembly 2023, Vienna, Austria, 23–28 Apr 2023, EGU23-8218, https://doi.org/10.5194/egusphere-egu23-8218, 2023.

Recent years have seen an increase of deep learning applications for flow forecasting. Large-sample hydrological (LSH) studies typically try to predict the runoff of a catchment using some selection of hydrometeorological features from the respective catchment. One aspect of these models that has received little attention in LSH is the effect that data from upstream catchments has on model performance. The number of available and stations and distance between stations is highly variable between catchments, which creates a unique modelling challenge. Existing LSH studies either use some form of linear aggregation of upstream flows as input features or omit them altogether. The potential of upstream data to improve the performance of real-time flow forecasts has not yet been systematically evaluated on a large scale. The objective of our study is to evaluate methods for integrating upstream features for real-time, data-driven flow forecasting models. Our study uses a subset of Canadian catchments (n>150) from the HYSETS database. For each catchment, long-short term memory networks (LSTMs) are used to generate flow forecasts for lead times of 1 to 3 days. We evaluate methods for identifying, selecting, and integrating relevant upstream input features within a deep-learning modelling framework, which include using neighbouring upstream stations, using all upstream stations, and using all stations with embedded dimensionality reduction. Early results indicate that while the inclusion of upstream data often yields improvements in model performance, including too much upstream information can easily have detrimental effects.

How to cite: Snieder, E. and Khan, U.: A large sample study of the effects of upstream hydrometeorological input features for LSTM-based daily flow forecasting in Canadian catchments, EGU General Assembly 2023, Vienna, Austria, 23–28 Apr 2023, EGU23-8746, https://doi.org/10.5194/egusphere-egu23-8746, 2023.

EGU23-9726 | ECS | Posters on site | HS3.3

Flood Forecasting with Deep Learning LSTM Networks: Local vs. Regional Network Training Based on Hourly Data 

Tanja Morgenstern, Jens Grundmann, and Niels Schütze

Floods are among the most frequently occurring natural disasters in Germany. Therefore, predicting their occurrence is a crucial task for efficient disaster management and for the protection of life, property, infrastructure and cultural assets. In recent years Deep Learning methods gained popularity on the research field on flood forecasting methods – Long Short-Term Memory (LSTM) networks being part of them.

Efficient disaster management needs a fine temporal resolution of runoff predictions. Past work at TU Dresden on LSTM networks shows certain challenges when using input data with hourly resolution, such as systematically poor timing in peak flow prediction (Pahner et al. (2019) and Morgenstern et al. (2021)). At times, disaster management even requires flood forecasts for hitherto unobserved catchments, so in total a regionally transferable rainfall-runoff model with a fine temporal resolution is needed. We derived the idea for a potential approach from Kratzert et al. (2019) and Fang et al. (2021): they demonstrate that LSTM networks for rainfall(R)-runoff(R)-modeling benefit from an integration of multiple diverse catchments in the training dataset instead of a strictly local dataset, as this allows the networks to learn universal hydrologic catchment behavior. However, their training dataset consists of daily resolution data.

Following this approach, in this study we train the LSTM networks using single catchments ("local network training") as well as combinations of diverse catchments in Saxony, Germany ("regional network training"). The training data (hourly resolution) consist of area averages of observed precipitation as well as of observed discharge at long-term observation gauges in Saxony. The gauges belong to small, fast-responding Saxon catchments and vary in their hydrological and geographical properties, which in turn are part of the network training as well.

We show the preliminary results and investigate the following questions:

  • With a finer temporal resolution than daily values, characteristics of flood waves become more pronounced. Concerning the detailed simulation of flood waves, do regional LSTM-based R-R-models enable more accurate and robust flow predictions compared to local LSTM-based R-R-models – especially for rare extreme events?
  • Are regional LSTM-based R-R-models – trained at this temporal resolution – able to generalize to unobserved areas or areas with discharge observations unsuitable for network training?


References

Fang, K., Kifer, D., Lawson, K., Feng, D., Shen, C. (2022). The Data Synergy Effects of Time-Series Deep Learning Models in Hydrology. In: Water Resources Research (58). DOI: 10.1029/2021WR029583

Kratzert, F., Klotz, D., Shalev, G., Klambauer, G., Hochreiter, S., Nearing, G. (2019). Towards learning universal, regional, and local hydrological behaviors via machine learning applied to large-sample datasets. Hydrology and Earth System Sciences (23), S. 5089–5110. DOI: 10.5194/hess-23-5089-2019

Morgenstern, T., Pahner, S., Mietrach, R., Schütze, N. (2021): Flood forecasting in small catchments using deep learning LSTM networks. DOI: 10.5194/egusphere-egu21-15072

Pahner, S., Mietrach, R., Schütze, N. (2019): Flood Forecasting in small catchments: a comparative application of long short-term memory networks and artificial neural networks. DOI: 10.13140/RG.2.2.36770.89286.

How to cite: Morgenstern, T., Grundmann, J., and Schütze, N.: Flood Forecasting with Deep Learning LSTM Networks: Local vs. Regional Network Training Based on Hourly Data, EGU General Assembly 2023, Vienna, Austria, 23–28 Apr 2023, EGU23-9726, https://doi.org/10.5194/egusphere-egu23-9726, 2023.

EGU23-10317 | ECS | Posters on site | HS3.3

A convolutional LSTM model with high accuracy to predict extreme precipitation space-time fields 

Hyojeong Choi and Dongkyun Kim

Precipitation forecast models based on meteorological radar data using machine learning architectures accurately predict spatio-temporal progress of precipitation. However, these data-driven forecasting models tend to underestimate magnitude of extreme precipitation events because the training of them is based on the observed precipitation data in which the normal precipitation events are included significantly more than the rare extreme events. This study proposes a ConvLSTM-based precipitation nowcasting model that can accurately predict space-time field of extreme precipitation. First, precipitation events were classified into 5 subsets using the k-means clustering algorithm based their statistical properties such as mean, standard deviation, skewness, duration, and the calendar month at which the precipitation event occurred. Then, a ConvLSTM-based neural network was trained based on the subset containing extreme precipitation events (events with large mean, variance, and duration occurred in summer months). The model was trained and tested based on the 4km-10minute resolution radar-gauge composite precipitation field of central part of South Korea (200km x 200km) for the period of 2009-2015 and 2016-2020, respectively. The NSE of the model that was trained based on the whole precipitation data was 0.55 while the one trained based on the subset of extreme precipitation was 0.78 showing a significant improvement.

This work was supported by the National Research Foundation of Korea(NRF) grant funded by the Korea government(MSIT) (No. NRF-2021R1A2C2003471). 

How to cite: Choi, H. and Kim, D.: A convolutional LSTM model with high accuracy to predict extreme precipitation space-time fields, EGU General Assembly 2023, Vienna, Austria, 23–28 Apr 2023, EGU23-10317, https://doi.org/10.5194/egusphere-egu23-10317, 2023.

EGU23-12315 | Posters on site | HS3.3

Meta-modeling with data-driven methods in hydrology 

Tobias Krueger, Mark Somogyvari, Ute Fehrenbach, and Dieter Scherer

Process-based models are the standard tools today when trying to understand how physical systems work. There are situations however, when system understanding is not a primary focus and it is worth substituting existing process-based models with computationally more efficient meta-models (or emulators), i.e. proxies designed for specific applications. In our research we have explored potential data-driven meta-modeling approaches for applications in hydrology, designed to solve specific research questions.

In order to find a suitable meta-modeling approach, we have experimented with a set of different data-driven methods. We have employed a multi-fidelity modeling approach, where we gradually increased the complexity of our models. In total five different approaches were investigated: linear model with ordinary least squares regression, linear model with two different Bayesian methods (Hamiltonian Monte Carlo and transdimensional Monte Carlo) and two machine learning approaches (dense artificial neural network and long short-term memory (LSTM) neural network).

For method development the project case study of the Groß Glienicker Lake was used. This is a glacial lake near Berlin, with a strong negative trend in water levels in the last decades. Supported by the observation model from the Central European Refined analysis, we had a daily, high resolution meteorological dataset (precipitation and actual evapotranspiration) and lake level observations for 16 years.

All of the used models are designed similarly: they predict lake level changes one day ahead using precipitation and evapotranspiration data from the previous 70 days. This interval was selected after an extensive parameter test with the linear model. By predicting the change in stored water, we linearize the problem, and by using a longer time interval we allow the methods to automatically compensate for any lag or memory effects inside the catchment. The different methods are evaluated by comparing the fits between the observed and the reconstructed lake levels.

As expected, increasing the model and inversion complexity improves the quality of the reconstruction. Especially the use of nonlinear models was advantageous, the artificial neural network outperformed every other method. However, in the used example these improvements were relatively small – meaning that in practice the simplest linear method was advantageous due to its computational efficiency and robustness, and ease of use and interpretation.

In this presentation we discuss the challenges of data preparation and optimal model design (especially the memory of the hydrological system), while finding the hyperparameters of the specific methods themselves was relatively straight forward. Our results suggest that problem linearization should be a preferred first step in any meta-modeling application, as it helps the training of nonlinear models as well. We also discuss data requirements, because we found that the size of our dataset was too small for the most complex LSTM method, which yielded unstable results and learned spurious background trends.

How to cite: Krueger, T., Somogyvari, M., Fehrenbach, U., and Scherer, D.: Meta-modeling with data-driven methods in hydrology, EGU General Assembly 2023, Vienna, Austria, 23–28 Apr 2023, EGU23-12315, https://doi.org/10.5194/egusphere-egu23-12315, 2023.

EGU23-12952 | ECS | Orals | HS3.3

On the generalization of hydraulic-inspired graph neural networks for spatio-temporal flood simulations 

Roberto Bentivoglio, Elvin Isufi, Sebastian Nicolaas Jonkman, and Riccardo Taormina

The high computational cost of detailed numerical models for flood simulation hinders their use in real-time and limits uncertainty quantification. Deep-learning surrogates have thus emerged as an alternative to speed up simulations. However, most surrogate models currently work only for a single topography, meaning that they need to be retrained for different case studies, ultimately defeating their purpose. In this work, we propose a graph neural network (GNN) inspired by the shallow water equations used in flood modeling, that can generalize the spatio-temporal prediction of floods over unseen topographies. The proposed model works similarly to finite volume methods by propagating the flooding in space and time, given initial and boundary conditions. Following the Courant-Friedrichs-Lewy condition, we link the time step between consecutive predictions to the number of GNN layers employed in the model. We analyze the model's performance on a dataset of numerical simulations of river dike breach floods, with varying topographies and breach locations. The results suggest that the GNN-based surrogate can produce high-fidelity spatio-temporal predictions, for unseen topographies, unseen breach locations, and larger domain areas with respect to the training ones, while reducing computational times.

How to cite: Bentivoglio, R., Isufi, E., Jonkman, S. N., and Taormina, R.: On the generalization of hydraulic-inspired graph neural networks for spatio-temporal flood simulations, EGU General Assembly 2023, Vienna, Austria, 23–28 Apr 2023, EGU23-12952, https://doi.org/10.5194/egusphere-egu23-12952, 2023.

EGU23-13493 | ECS | Posters on site | HS3.3

Comparison of  a conceptual rainfall-runoff  model with an artificial neural network model for streamflow prediction 

fadil boodoo, carole delenne, Renaud hostache, and julien freychet

Accurate streamflow forecasting can help minimizing the negative impacts of hydrological events such as floods and droughts. To address this challenge, we explore here artificial neural networks models (ANNs) for streamflow forecasting. These models, which have been proven successful in other fields, may offer improved accuracy and efficiency compared to traditional conceptually-based forecasting approaches.

The goal of this study is to compare the performance of a traditional conceptual rainfall-runoff (hydrological) model with an artificial neural network (ANN) model for streamflow forecasting. As a test case, we use the Severn catchment in the United Kingdom. The adopted ANN model has a long short-term memory (LSTM) architecture with two hidden layers, each with 256 neurons. The model is trained on a 25-year dataset from 1988 to 2013 and tested on a 3-year dataset (from 2014 to 2016). It is also validated on a 3-year dataset (from 2017 to 2020, 2019 being a particularly wet year), to assess its performance in extreme hydrological conditions. The study focuses on daily and hourly predictions.

To conduct this study, the conceptual hydrological model called Superflex is used as a benchmark. Both models are first evaluated using the Nash-Sutcliffe Efficiency (NSE) score. To enable a fair and accurate comparison, both models share the same inputs (i.e. meteorological forcings: total precipitation, daily maximum and minimum temperatures, daylight duration, mean surface downward short wave radiation flux, and vapor pressure). The ANN model was implemented using the Neuralhydrology library developed by F. Kratzert.

In our study, we found that LSTM model is able to provide more accurate one-day forecasts than the  hydrological model Superflex. For the daily predictions, the average NSE score using the LSTM model is 0.85 (with an average NSE score of 0.99 for training period, and 0.85 for validation period), which is higher than the NSE score of 0.74 achieved by the Superflex model (with a score of 0.84 for training period).

The hourly prediction using NSE with the superflex model had a score of 0.88, with a score of 0.7 during training. The LSTM model had an average NSE score of 0.87, with an average score of 0.99 during training and an average score of 0.85 during validation.

These results were obtained without adjusting the hyperparameters and by training the model only on data from the Severn watershed.The ANN model has demonstrated promising results compared to a state-of-the-art conceptual hydrological model in our studies. We will further compare both models using different training dataset periods, and different catchements. These additional tests will provide more information on the capabilities of the LSTM model and help to confirm its effectiveness.

How to cite: boodoo, F., delenne, C., hostache, R., and freychet, J.: Comparison of  a conceptual rainfall-runoff  model with an artificial neural network model for streamflow prediction, EGU General Assembly 2023, Vienna, Austria, 23–28 Apr 2023, EGU23-13493, https://doi.org/10.5194/egusphere-egu23-13493, 2023.

EGU23-14399 | ECS | Orals | HS3.3

LSTMs for Hydrological Modelling in Swiss Catchments 

Christina Lott, Leonardo Martins, Jonas Weiss, Thomas Brunschwiler, and Peter Molnar

Simulation of the catchment rainfall-runoff transformation with physically based watershed models is a traditional way to predict streamflow and other hydrological variables at catchment scales. However, the calibration of such models requires large data inputs and computational power and contains many parameters which are often impossible to constrain or validate. An alternative approach is to use data-driven machine learning for streamflow prediction.

In the past few years, LSTM (long short-term memory) models and its variants have been explored in rainfall-runoff modelling. Typical applications use daily climate variables as inputs and model the rainfall-runoff transformation processes with different timescales of memory. This is especially useful as delays in runoff production by snow accumulation and melt, soil water storage, evapotranspiration, etc., can be included. In contrast to feed-forward ANNs (artificial neural networks), LSTMs are capable of maintaining the sequential temporal order of inputs, and compared to RNNs (recurrent neural networks), of learning the long-term dependencies. [1]

However, current work on LSTMs mostly focuses on the USA, the UK and Brazil, where CAMELS datasets are available [1, 2, 3]. Catchments at higher altitudes with snow-driven dynamics and sometimes glaciers are present in small number in these datasets (if at all). Systematic applications of LSTMs for streamflow prediction in climates where a significant part of the catchments are snow and ice dominated are missing. In this work, an FS-LSTM (fast slow-LSTM) previously applied in Brazil is adapted for Swiss catchments to fill this gap [3]. The FS-LSTM explored builds on the work of Hoedt et al. (2021) that imposed mass constraints on an LSTM, called MC-LSTM [4]. FS-LSTM adds a fast and slow part for streamflow, containing rainfall and soil moisture respectively. We will discuss benchmark results against an existing semi-distributed conceptual model widely used in Switzerland for streamflow simulation [5].


References:

[1]: Kratzert et al., Rainfall-runoff modelling using Long Short-Term Memory (LSTM) networks, 2018.

[2]: Lees et al., Hydrological concept formation inside long short-term memory (LSTM) networks, 2022.

[3]: Quinones et al., Fast-Slow Streamflow Model Using Mass-Conserving LSTM, 2021.

[4]: Hoedt et al., MC-LSTM: Mass-Conserving LSTM, 2021.

[5]: Viviroli et al., An introduction to the hydrological modelling system PREVAH and its pre- and post-processing-tools, 2009.

How to cite: Lott, C., Martins, L., Weiss, J., Brunschwiler, T., and Molnar, P.: LSTMs for Hydrological Modelling in Swiss Catchments, EGU General Assembly 2023, Vienna, Austria, 23–28 Apr 2023, EGU23-14399, https://doi.org/10.5194/egusphere-egu23-14399, 2023.

Improving the understanding of processes is vital to hydrological modeling. One key challenge is how to extract interpretable information that can describe the complex hydrological system from the growing number of observation data to advance our understanding of processes and modeling. To address the problem, we propose a data-driven framework to discover coordinate transformation, which transfers original observations to a reduced-dimension system. The framework combines deep learning method with sparse regression to approximate the specific hydrological process: deep learning methods have a rich representation to promote generalization, and sparse regression can sparsely identify parsimonious models to promote interpretability. By doing so, we can identify the essential latent variables under a physically meaning-wise coordinate system where the hydrological processes are linearly and sparsity represented to capture the behavior of the system from observations. To demonstrate the framework, we focus on the evaporation process. The relationships between potential evaporation and climate variables including long/short wave radiation, air temperature, air pressure, relative humidity, and wind speed are quantified. The connection between the climate variables and coordinates components extracted are evaluated to capture the pattern of climate variables in the component space. The robustness and statistical stability of the framework is examined based on distributed observations from FluxNet towers over North America. The resulting modeling framework shows the potential of deep learning methods for improving our knowledge of the hydrological system.

How to cite: Hu, X., Tuo, Y., and Disse, M.: Deep learning based coordinates transformations for improving process understanding in hydrological modeling system, EGU General Assembly 2023, Vienna, Austria, 23–28 Apr 2023, EGU23-14631, https://doi.org/10.5194/egusphere-egu23-14631, 2023.

EGU23-15575 | Orals | HS3.3

Application of deep convolutional neural networks for precipitation estimation through both top-down and bottom-up approaches 

Hamidreza Mosaffa, Paolo Filippucci, Luca Ciabatta, Christian Massari, and Luca Brocca

Reliable and accurate precipitation estimations are a crucial hydrological parameter for various applications, including managing water resources, drought monitoring and natural hazard prediction. The two main approaches for estimating precipitation from satellite data are the top-down and bottom-up. The top-down approach uses data from Geostationary and Low Earth Orbiting satellites to infer precipitation from atmosphere and cloud information, while the bottom-up approach estimates precipitation using soil moisture observations, e.g.  the SM2RAIN algorithm. The main difference between these approaches is that the top-down approach is a more direct method of measuring precipitation that estimates it instantaneously, which may lead to underestimation, while the bottom-up approach measures accumulated rainfall with more reliable precipitation estimation between two consecutive SM measurements. In this study, we develop the deep convolutional neural networks (CNN) algorithm to combine the top-down and bottom-up approaches for estimating precipitation using the satellite level 1 products including the satellite backscatter information from the Advanced SCATterometer (ASCAT), infrared (IR) and water vapor (WV) channels from geostationary satellites. This algorithm is assessed at 0.1° spatial and daily temporal resolution over Italy for the period of 2019-2021. The results show that the developed model improves the accuracy of precipitation estimation. Additionally, it indicates that there is a significant potential for global precipitation estimation using this model.

How to cite: Mosaffa, H., Filippucci, P., Ciabatta, L., Massari, C., and Brocca, L.: Application of deep convolutional neural networks for precipitation estimation through both top-down and bottom-up approaches, EGU General Assembly 2023, Vienna, Austria, 23–28 Apr 2023, EGU23-15575, https://doi.org/10.5194/egusphere-egu23-15575, 2023.

EGU23-15604 | ECS | Posters on site | HS3.3

Forecasting discharges through explainable machine learning approaches at an alpine karst spring 

Anna Pölz, Julia Derx, Andreas Farnleitner, and Alfred Paul Blaschke

Karst springs provide drinking water for approximately 700 million people worldwide. Complex subsurface flow processes lead to challenges for modelling spring discharges. Machine learning (ML) models possess the ability to learn non-linear patterns and show promising results in forecasting dynamic spring discharge. We compare the performance of three ML models of varying complexity in forecasting karst spring discharges: the multivariate adaptive regression spline model (MARS), a feed-forward neural network (ANN) and a long short-term memory model (LSTM). The well-studied alpine karst spring LKAS2 in Austria is used as test case. We provide model explanations including feature attribution through Shapley additive explanations (SHAP), a method based on Shapley values. Our results show that the higher the model complexity, the higher the accuracy, based on the evaluated symmetric mean absolute percentage error of the three investigated models. With SHAP every prediction can be explained through each feature in each input time step. We found seasonal model differences. For example, snow influenced the model mostly in winter and spring. Analyzing the combinations of input time steps and features provided further insights into the model performance. For instance, the SHAP results showed that a high electrical conductivity in recent time steps, which indicates that the karst water is less diluted with precipitation, leads to a reduced discharge forecast. These feature attribution results coincide with physical processes within karst systems. Therefore, the introduced SHAP method can increase the confidence in ML model forecasts and emphasizes the raison d’être of complex and accurate deep learning models in hydrology. This allows the operator to better understand and evaluate the model’s output, which is essential for drinking water management.

How to cite: Pölz, A., Derx, J., Farnleitner, A., and Blaschke, A. P.: Forecasting discharges through explainable machine learning approaches at an alpine karst spring, EGU General Assembly 2023, Vienna, Austria, 23–28 Apr 2023, EGU23-15604, https://doi.org/10.5194/egusphere-egu23-15604, 2023.

EGU23-15629 | ECS | Posters virtual | HS3.3

Peak Hydrological Event Simulation with Deep Learning Algorithm 

Nicole Tatjana Scherer, Muhammad Nabeel Usmann, Markus Disse, and Jingshui Huang

Most floods are caused by heavy rainfall events, including the disaster in the Simbach catchment in 2016. For the Simbach catchment, a study was already carried out using the conceptual Hydrologiska Byråns Vattenbalansavdelning (HBV) model to simulate the extreme event of 2016. While the calibration model performance is classified as very good, the overall validation is classified as unsatisfactory. Recent studies showed that data-driven models outperform benchmark rainfall-runoff models. A widely used data-driven model is the Long-Short-Term-Memory algorithm (LSTM). The main advantage of this algorithm is the ability to learn short-term as well as long term dependencies.

The objective of this work is to determine if a data-driven model outperforms the conceptual model. For this purpose, in a first step a LSTM model is setup and its results are compared with the results of the HBV model. It is assumed that the LSTM model outperforms the HBV model in training and validation but is not able to simulate the extreme event, because the extrapolation capabilities of Neuronal Networks are poor if they operate outside of their training range. In a second step, it is studied if the model performance can be improved by providing more features to the model. Therefore, different feature combinations are provided to the model. Furthermore, it is assumed that providing more data to the model will improve its performance. Therefore, in a third step more events are used for training and validation.

It was concluded that the LSTM model is able to simulate the rainfall-runoff process. A satisfactory overall model performance can be achieved using only precipitation as input data and a small training dataset of four events. But, as the HBV model, the LSTM model is not able to simulate the extreme event, because no extreme event is present within the training dataset. However, the LSTM model outperforms the HBV model, because the LSTM generalizes better. Furthermore, the model performance of the LSTM model using six events can be improved by providing additionally the soil moisture class as input data. Whereas providing more features to the model results in worse model performance. Providing more events to the model does not significantly improve its performance. However, the model improved especially for the event in June 2015. If the model is trained with more events having higher magnitude than the 2015 event, the event in 2015 is no longer classified as an out-of-sample event, resulting in better model performance. Providing the model more events and more input features does not significantly improve the model performance. 

The results show the potential and limitations using the LSTM model in modeling extreme events.

How to cite: Scherer, N. T., Usmann, M. N., Disse, M., and Huang, J.: Peak Hydrological Event Simulation with Deep Learning Algorithm, EGU General Assembly 2023, Vienna, Austria, 23–28 Apr 2023, EGU23-15629, https://doi.org/10.5194/egusphere-egu23-15629, 2023.

EGU23-16658 | ECS | Orals | HS3.3

Improving large-basin streamflow simulation using a modular, differentiable, learnable graph model for routing 

Tadd Bindas, Wen-Ping Tsai, Jiangtao Liu, Farshid Rahmani, Dapeng Feng, Yuchen Bian, Kathryn Lawson, and Chaopeng Shen

Differentiable modeling has been introduced recently as a method to learn relationships from a combination of data and structural priors. This method uses end-to-end gradient tracking inside a process-based model to tune internal states and parameters along with neural networks, allowing us to learn underlying processes and spatial patterns. Hydrologic routing modules are typically needed to simulate flows in stem rivers downstream of large, heterogeneous basins, but obtaining suitable parameterization for them has previously been difficult. In this work, we apply differentiable modeling in the scope of streamflow prediction by coupling a physically-based routing model (which computes flow velocity and discharge in the river network given upstream inflow conditions) to neural networks which provide parameterizations for Manning’s river roughness parameter (n). This method consists of an embedded Neural Network (NN), which uses (imperfect) DL-simulated runoffs and reach-scale attributes as forcings and inputs, respectively, entered into the Muskingum-Cunge method and trained solely on downstream discharge. Our initial results show that while we cannot identify channel geometries, we can learn a parameterization scheme for roughness that follows observed n trends. Training on a short sample of observed data showed that we could obtain highly accurate routing results for the training and inner, untrained gages. This general framework can be applied to small and large scales to learn channel roughness and predict streamflow with heightened interpretability. 


How to cite: Bindas, T., Tsai, W.-P., Liu, J., Rahmani, F., Feng, D., Bian, Y., Lawson, K., and Shen, C.: Improving large-basin streamflow simulation using a modular, differentiable, learnable graph model for routing, EGU General Assembly 2023, Vienna, Austria, 23–28 Apr 2023, EGU23-16658, https://doi.org/10.5194/egusphere-egu23-16658, 2023.

Although deep learning (DL) models have shown extraordinary performance in hydrologic modeling, they are still hard to interpret and not able to predict untrained hydrologic variables due to lacking physical meanings and constraints. This study established hybrid differentiable models (namely the delta models) with regionalized parameterization and learnable structures based on a DL-based differentiable parameter learning (dPL) framework. The simulation experiments on both US and global basins demonstrate that the delta models can approach the performance of the state-of-the-art long short-term memory (LSTM) network on discharge prediction. Different from the pure data-driven LSTM model, the delta models can output a full set of hydrologic variables not used as training targets. The evaluation with independent data sources showed that the delta models, only trained on discharge observations, can also give decent predictions for ET and baseflow. The spatial extrapolation experiments showed that the delta models can surpass the performance of the LSTM model for predictions in large ungauged regions in terms of the daily hydrographic metrics and multi-year trend prediction. The spatial patterns of the parameters learned by the delta models remain remarkably stable from the in-sample to spatial out-of-sample predictions, which explains the robustness of the delta models for spatial extrapolation. More importantly, the proposed modeling framework enables directly learning new relations between intermediate variables from large observations. This study shows that the model performance and physical meanings can be balanced with the differentiable modeling approach which is promising to large-scale hydrologic prediction and knowledge discovery.

How to cite: Feng, D. and Shen, C.: A differentiable modeling approach to systematically integrating deep learning and physical models for large-scale hydrologic prediction and knowledge discovery, EGU General Assembly 2023, Vienna, Austria, 23–28 Apr 2023, EGU23-16947, https://doi.org/10.5194/egusphere-egu23-16947, 2023.

EGU23-16974 | Orals | HS3.3

From Hindcast to Forecast with Deep Learning Streamflow Models 

Grey Nearing, Martin Gauch, Daniel Klotz, Frederik Kratzert, Asher Metzger, Guy Shalev, Shlomo Shenzis, Tadele Tekalign, Dana Weitzner, and Oren Gilon

Deep learning has become the de facto standard for streamflow simulation. While there are examples of deep learning based streamflow forecast models (e.g., 1-5), the majority of the development and research has been done with hindcast models. The primary challenge in using deep learning models for forecasting (e.g., flood forecasting) is that the meteorological input data are drawn from different distributions in hindcast vs. forecast. The (relatively small) amount of research that has been done on deep learning streamflow forecasting has largely used an encoder-decoder approach to account for forecast distribution shifts. This is, for example, what Google’s operational flood forecasting model uses [4]. 

In this work we show that the encoder-decoder approach results in artifacts in forecast trajectories that are not detectable with standard hydrological metrics, but which can cause forecasts to have incorrect trends (e.g., rising when they should be falling and vice-versa).  We solve this problem using regularized embeddings, which remove forecast artifacts without harming overall accuracy. 

Perhaps more importantly, input embeddings allow for training models on spatially and/or temporally incomplete meteorological inputs, meaning that a single model can be trained using input data that does not exist everywhere or does not exist during the entire training or forecast period. This allows models to learn from a significantly larger training data set, which is important for high-accuracy predictions. It also allows large (e.g., global) models to learn from local weather data. We demonstrate how and why this is critical for state-of-the-art global-scale streamflow forecasting. 


  • Franken, Tim, et al. An operational framework for data driven low flow forecasts in Flanders. No. EGU22-6191. Copernicus Meetings, 2022.
  • Kao, I-Feng, et al. "Exploring a Long Short-Term Memory based Encoder-Decoder framework for multi-step-ahead flood forecasting." Journal of Hydrology 583 (2020): 124631.
  • Liu, Darong, et al. "Streamflow prediction using deep learning neural network: case study of Yangtze River." IEEE access 8 (2020): 90069-90086.
  • Nevo, Sella, et al. "Flood forecasting with machine learning models in an operational framework." Hydrology and Earth System Sciences 26.15 (2022): 4013-4032.
  • Girihagama, Lakshika, et al. "Streamflow modelling and forecasting for Canadian watersheds using LSTM networks with attention mechanism." Neural Computing and Applications 34.22 (2022): 19995-20015.


How to cite: Nearing, G., Gauch, M., Klotz, D., Kratzert, F., Metzger, A., Shalev, G., Shenzis, S., Tekalign, T., Weitzner, D., and Gilon, O.: From Hindcast to Forecast with Deep Learning Streamflow Models, EGU General Assembly 2023, Vienna, Austria, 23–28 Apr 2023, EGU23-16974, https://doi.org/10.5194/egusphere-egu23-16974, 2023.

EGU23-564 | ECS | Posters on site | HS3.4

Framework for clustering groundwater quality using Self-Organizing Maps to improve aquifer monitoring and management: a case study of the Gabros de Beja aquifer system, Portugal 

Thiago Victor Medeiros do Nascimento, Maria Teresa Condesso de Melo, and Rodrigo Proença de Oliveira

A new clustering strategy was developed and tested using Self-Organizing Maps (SOM), an unsupervised Artificial Neural Network (ANN) type, for identifying zones with similar contamination characteristics within an aquifer. The Gabros de Beja aquifer system (GBAS), located in the Alentejo region, Portugal, was selected as a case study due to its vulnerability to diffuse pollution from intensive agriculture. The proposed methodology consists of: (a) selection of the most representative groundwater contaminants in the aquifer area (i.e., nitrates, sulfates and chlorides); (b) determination of the Natural Background Level (NBL) of the selected groundwater compounds; (c) computation of the ratio between the median concentrations of the groundwater compounds being analyzed and their respective NBL concentration; and finally, (d) application of the SOM clustering technique to group homogenous contaminated areas within the aquifer. The NBL illustrates what thresholds are likely signs of anthropogenic effect by indicating how high or low a parameter's value would be expected under natural geogenic conditions and therefore was used as a first normalization of the dataset. For this methodology, the NBL was computed as the 90th percentile concentration of the selected compounds in piezometers within the study area that presented a median nitrate concentration smaller than 10 mg/L. Nitrate, sulfate and chloride concentration medians from 45 piezometers were used. The results show that the SOM network classified the piezometers into six classes (CL1 to CL6). The least contaminated clusters were CL1 (8) and CL4 (17), with all three compounds presenting median concentrations around 50 mg/L, which for nitrate is the threshold for drinking water limits. CL5 (5) reached median nitrate concentrations above 100 mg/L, while chlorides and sulfates remained below 50 mg/L. CL2 (6) showed an increase in chloride concentration to 100 mg/L, with the other two compounds' concentrations below 65 mg/L. CL3 (3) presented the highest salinization levels reaching chloride concentrations above 180 mg/L, with sulfates around 80 mg/L and nitrates around 50 mg/L. Finally, CL6 (6) presented median levels of the three compounds above 80 mg/L. The most contaminated groups (CL3, CL5 and CL6) were present in sedimentary and weathered metamorphic lithologies, which present high hydraulic conductivities, coinciding either with urban or agricultural areas associated with large-scale irrigation schemes, reinforcing the anthropogenic source of the contaminants. Hence, this study presented a clustering framework that, by reducing the dimensionality of the original dataset, helps to establish a priority list of polluted areas with different degrees of contamination, which is indeed essential for implementing monitoring and management measures for attenuating groundwater pollution.  

How to cite: Medeiros do Nascimento, T. V., Condesso de Melo, M. T., and Proença de Oliveira, R.: Framework for clustering groundwater quality using Self-Organizing Maps to improve aquifer monitoring and management: a case study of the Gabros de Beja aquifer system, Portugal, EGU General Assembly 2023, Vienna, Austria, 23–28 Apr 2023, EGU23-564, https://doi.org/10.5194/egusphere-egu23-564, 2023.

EGU23-1049 | ECS | Orals | HS3.4

A data-driven classification of meander bends based on their energy spectrum. 

Sergio Lopez Dubon, Alessandro Sgarabotto, and Stefano Lanzoni

Meandering planforms are commonly observed in fluvial systems. A meander consists of a series of two alternate bends connected at the points of inflexion by relatively short, almost straight crossings. The presence of single-thread meandering rivers exhibiting a continuous sequence of such curves is widespread in alluvial floodplains. The study of river meanders has thus fascinated the scientific community, which, for a long time, has tried not only to classify them but also to quantify the complexity of meandering planforms and model their morphodynamic evolution.

The idea of classifying meandering rivers has a long history. It has produced a series of non-dimensional parameters to identify a meander (i.e., half-meander amplitude, asymmetry index, half-meander sinuosity). Nevertheless, two main problems arise from the existing methodologies. They are too complicated to encompass as many shapes as possible or lack physical insight into hydraulic and sedimentological parameters.

We propose a data-driven approach to address this classification issue, mixing physics-based information and machine-learning algorithms. In our approach, we consider the spatial distribution of meander curvatures and analyse it using different continuous wavelet transforms, getting the energy spectrum for each meander. This physics-based information is then firstly processed as an unsupervised visual classification problem using a neural-network autoencoder mix with cluster algorithms. The output of this first step analysis consists of two pre-trained algorithms that can classify the energy spectrum of pictures of planform curvatures and, therefore, the meander planform shape.

The algorithms will be trained with a series of dimensionless, synthetically generated meanders and t subsequently tested with both natural and simulated meanders. The final aim is to identify automatically which type of meanders characterise a given river reach at a certain time. This methodology also has the potential to be extended to Spatiotemporal distributions of channel-axis curvature, thus unravelling key aspects of meandering dynamics, as well as identifying similarities between reaches of different rivers or between observed and synthetically generated river planforms.

How to cite: Lopez Dubon, S., Sgarabotto, A., and Lanzoni, S.: A data-driven classification of meander bends based on their energy spectrum., EGU General Assembly 2023, Vienna, Austria, 23–28 Apr 2023, EGU23-1049, https://doi.org/10.5194/egusphere-egu23-1049, 2023.

EGU23-1737 | ECS | Posters on site | HS3.4

Evaluation of Water Contamination in the East Kazakhstan Mining Area Using Multivariate Geostatistics 

Aidyn Tileugabylov and Nasser Madani

The East Kazakhstan region is one of the most industrialised regions in the country producing considerable amounts of mineable copper, zinc, and gold due to mining activities. Development of metallurgical and mining industries has been increasing the pollution of surface waters by toxic chemical elements, particularly Cu, Mn, and Zn. We assessed the extent of these metal contaminations in surface waters in this region, by multivariate geostatistical analyses of the concentrations of the above-mentioned heavy metals over the five year periods (2017-2022). The dataset consists of element concentrations and sampling locations, for which it was provided by the Republican State Enterprise “Kazhydromet”. Principal Component Analysis (PCA) coupled with Simple Cokriging have been incorporated to characterise the local distribution of the heavy metals in surface waters in the East Kazakhstan region. The first component of PCA is used for further analysis since it qualifies for 74% of the total variation in the data. Then, a Simple Cokriging over the four continuous variables (PC1, Cu, Mn, and Zn) has been carried out to map their spatial distribution. Furthermore, the estimation map of PC1 is categorised, linking it to Cu, Mn, and Zn estimated maps; where the high, medium and low concentration areas of above-mentioned heavy metals are recognised over the entire region. The results are then interpreted by superimposing the river network into the estimation maps of elements.  

According to estimation maps, variations in concentrations of Cu, Mn, and Zn depend on the season and resulted in a distinct pattern. The surface waters in the region are mostly contaminated in spring and winter seasons due to snowfall and subsequent melting, whereas they are least contaminated during the summer and autumn. Moreover, it was observed that Cu shows the most mobility among the three toxic elements. A significant amount of Cu is discharged to the surface waters in Spring periodically, when snow melting activities are enhanced in Ust’-Kamenogorsk city, and transported to downstream regions. Therefore, higher concentrations of Cu near Semey city are observed during summer. The same effect has not been observed for Mn and Zn elements, which indicates that their overall mobility is lower.

Generally, observed Cu and Mn concentrations are exceeding the Maximum Allowable Concentration (MAC) by 5 times in the vicinity of Ust-Kamenogorsk and Ridder cities, while Zn exceeded its MAC by 10 times in the same region. One possible source of such high concentrations of heavy metals in this region is linked to the mining operations, especially to the Tailings Storage Facilities (TSF) that have been driving surface water contamination since the 1960s. After every relevant TSF has been superimposed on the estimated maps, the relationship between high metal concentration and TSF was investigated, leading to a conclusion that both active and closed Tailings Storage Facilities are the primary sources of surface water contamination in the study region. This shows that the situation of the study region in terms of surface water pollution is deplorable and needs urgent remediation actions.

Keywords: Multivariate Geostatistics, Water Contamination, Tailings Storage Facilities.

How to cite: Tileugabylov, A. and Madani, N.: Evaluation of Water Contamination in the East Kazakhstan Mining Area Using Multivariate Geostatistics, EGU General Assembly 2023, Vienna, Austria, 23–28 Apr 2023, EGU23-1737, https://doi.org/10.5194/egusphere-egu23-1737, 2023.

EGU23-2761 | Posters on site | HS3.4

Modeling clod evolution under rainfall according to clod size. 

Edwige Vannier and Richard Dusséaux

Determing soil spatial variability is a key point in soil sciences either for soil preparation in precision agriculture, or because of influence on overland flow and erosion. Soil Surface Roughness (SSR) represents the undulation of the surface at small scale, due to the presence of small elevations and depressions. It results from tillage operations and changes over time due to weathering. SSR can be related to clod-size distribution. So, many research has been conducted on monitoring the size and number of clods using photogrammetry method. Nowadays, it is possible to acquire high resolution Digital Elevation Models (DEMs). This study seeks to model the evolution of clod size under rainfall impact with modeling and data processing tools.

Seedbed-like soil surface was made in the laboratory by filling a tray with loose soil of silt loam and setting upon pre-sieved clods. It was eroded by controlled laboratory rainfalls. A millimeter DEM was recorded at each stage of the surface with laser-scanner. Wavelet-based clod segmentation leaded to measurement of the volume of individual clods. Clod subsets were formed according to clod size. Normalized mean volume decrease was modelled by exponential function.

Greater clods showed swelling (volume increase) and erosion (volume decrease), with cumulated rainfall. These two phenomena being size dependent. Amplitude and slope parameters of the exponential decrease of clod volume could be modelled as a function of mean volume of the clod subset at initial stage. Results obtained with this surface strengthen those previously obtained with less data and basic segmentation. A power law is confirmed for amplitude parameter and a sigmoïd function is highlighted for slope parameter.

Modelling and data processing tools are efficient to differentiate and estimate the dynamics of clods depending on their size. Usually, clod size distribution is addressed with statistics of clod diameters obtained by real or numerical sieving. Working on 2.5 D DEMs gives also an acces to the vertical dimension of clods, which is included in their volume. This technique completes the usual roughness description and is promissing for use in precision agriculture or numerical surface generation.

How to cite: Vannier, E. and Dusséaux, R.: Modeling clod evolution under rainfall according to clod size., EGU General Assembly 2023, Vienna, Austria, 23–28 Apr 2023, EGU23-2761, https://doi.org/10.5194/egusphere-egu23-2761, 2023.

EGU23-2876 | ECS | Orals | HS3.4

Coastal groundwater pattern recognition supported by cluster analysis 

Christian Narvaez-Montoya, Jürgen Mahlknecht, Juan Antonio Torres-Martínez, Abraham Mora, and Guillaume Bertrand

In coastal zones, groundwater overexploitation reduces freshwater outflow to the sea and causes seawater to migrate toward fresh groundwater resources, increasing salinity in groundwater reservoirs. This seawater intrusion is among the world's leading causes of groundwater pollution, as salty water can affect safe drinking consumption, food production, and ecosystem services. To explore this and others contaminations sources, cluster analysis has been used for decades to aid in water resource pattern recognition in coastal aquifers around the world. 

This work shows how cluster analysis has been applied for seawater intrusion pattern recognition in coastal zonas around the world between 2000 and 2022 through a systematic review based on the PRISMA statement. After the searching and selection stages, it was carried out the bibliometric analysis of the 81 identified studies. Furthermore, it was discussed information about the number of samples, number of variables, redundant variables, sample density per area, sample density per variable, clustering principal features, limitations for sources differentiation, assembly between methods, software, and pre-processing strategies. 

The identified methods were hierarchical clustering analysis (HCA), K-means clustering, Fuzzy C-means, and self-organizing maps (SOM). While 56 studies applied Q-mode for grouping water samples with similar characteristics, 17 applied R-mode for grouping variables, and 8 applied both modes. The preferred method was HCA with Ward´s linkage and Euclidean distance, but many studies didn’t specify the linkage or the distance criteria.  Of those studies that applied Q-mode, 77% associated at least one cluster with the influence of seawater intrusion. On the other hand, this work shows that 58% of the reviewed studies did not report raw data, which presents issues for validation, replication, and socialization of the results. 

How to cite: Narvaez-Montoya, C., Mahlknecht, J., Torres-Martínez, J. A., Mora, A., and Bertrand, G.: Coastal groundwater pattern recognition supported by cluster analysis, EGU General Assembly 2023, Vienna, Austria, 23–28 Apr 2023, EGU23-2876, https://doi.org/10.5194/egusphere-egu23-2876, 2023.

EGU23-5025 | Posters on site | HS3.4

Toward prediction of land subsidence assisted by artificial intelligence approaches 

Nima Shokri, Mehdi Mahdavi Ara, Sobhan Ansari, and Mohammad Sharifi

Land subsidence referring to the lowering of Earth’s land surface poses destructive threats to buildings and infrastructures and increases vulnerability to floods. The tendency to overexploit groundwater resources due to ever-increasing demand for water in urban areas is known as one of the main drivers for land subsidence, especially in regions with compressible sediments or formations susceptible to changes in groundwater pressure. Land subsidence has been observed in many countries around the globe including but not limited to USA, Mexico, Spain, Italy, Saudi Arabia, Iran, India, Vietnam, and China.

Artificial intelligence (AI) and machine learning algorithms prove to be of great values to assess and predict a variety of hydrological and environmental dynamics and trends (Hassani et al., 2021; Mahdaviara et al., 2022). Leveraging on this opportunity, we develop a new framework, assisted by AI approaches, to quantify and predict how various environmental and climatic parameters influence the occurrence and extent of land subsidence. We show the general applicability of the proposed framework through the case of land subsidence observed in Iran, i.e. a semi-arid to arid country which strongly relies on the limited groundwater resources for a wide range of activities. The country hosts some of the fastest-sinking cities in the world. As a case study, we focused on the land subsidence observed in Varamin plain located in central Iran with an average annual precipitation of 420 millimeters and 210 millimeters of subsidence per year in the last 20 years.  A combination of the field and satellite data over the last two decades was prepared for the training of the models. In the next level, the training matrix was exposed to the AI algorithms aiming to develop models relating the land subsidence rate to a variety of environmental and climatic factors. Our preliminary analysis suggests that the groundwater withdrawal and precipitation rate are among the most important parameters affecting the rate of subsidence. The modelling tools will be used to detect the potential hotspots for land subsidence under different water management and climate change scenarios in other places. This will be helpful for preventing the forthcoming damages and devising the necessary action plans to mitigate the situation under different conditions.


References

Hassani, A., Azapagic, A., Shokri, N. (2021). Global Predictions of Primary Soil Salinization Under Changing Climate in the 21st Century, Nat. Commun., 12, 6663. doi.org/10.1038/s41467-021-26907-3.

Mahdaviara, M., Sharifi, M., Bakhshian, B., Shokri, N. (2022), Prediction of Spontaneous Imbibition in Porous Media Using Deep and Ensemble Learning Techniques, Fuel, 329, 125349.

How to cite: Shokri, N., Mahdavi Ara, M., Ansari, S., and Sharifi, M.: Toward prediction of land subsidence assisted by artificial intelligence approaches, EGU General Assembly 2023, Vienna, Austria, 23–28 Apr 2023, EGU23-5025, https://doi.org/10.5194/egusphere-egu23-5025, 2023.

EGU23-5541 | Orals | HS3.4

A data-driven framework for the reconstruction of satellite-derived wind speed image time-series 

Stylianos Hadjipetrou and Phaedon Kyriakidis

Wind assessment studies call for accurate and consistent datasets to evaluate the wind resource potential in the long term. Satellite-derived wind speed estimates have been widely employed in wind energy applications [1–3] due to their high spatial resolution. Synthetic Aperture Radar (SAR) sensors, in particular, provide image snapshots of wind fields on a (sub-) kilometer scale, although at irregular temporal intervals. Moreover, the scenes acquired are often tilted due to satellite’s orbit. The formed wind speed image time-series is, therefore, both spatially and temporally incomplete.

This study attempts to reconstruct Sentinel-1 A&B OCN Level-2 wind speed image time-series by employing a data-driven framework and using reanalysis as auxiliary data. More precisely, the methodology resembles what is generally called analog forecasting in climate studies, where past climate conditions are used to predict current weather state [4]. Although the analog method has been long used for empirical-statistical downscaling of Global Circulation Models (GCMs) [5,6], few studies address the problem of gap-filling record observations/estimates [7,8]. In the same context, Empirical Orthogonal Functions (EOF) are used in this work to classify (decompose) the data sets into classes of similar weather states and use this classification to reconstruct the missing information based on the co-registered climate variables. Once physically consistent patterns (analogs) are identified in the historical image record, synthetic wind speed images are generated to fill the data gaps.

The method is benchmarked in the offshore area around Cyprus against the probabilistic framework of Multiple-Point Statistics (MPS). Image cross-validation, in combination with statistical metrics, is used to evaluate the method’s performance. Results show that the proposed methodology can furnish a reliable framework for wind speed spatiotemporal variability reconstruction in an offshore wind resource assessment context. An illustration of the method in terms of wind power density estimation is provided over an annual period.

References

  • Nielsen, M.; Astrup, P.; Hasager, C.B.; Barthelmie, R.; Pryor, S. Satellite Information for Wind Energy Applications. 2004, 1479.
  • Medina-Lopez, E.; McMillan, D.; Lazic, J.; Hart, E.; Zen, S.; Angeloudis, A.; Bannon, E.; Browell, J.; Dorling, S.; Dorrell, R.M.; et al. Satellite Data for the Offshore Renewable Energy Sector: Synergies and Innovation Opportunities. Remote Sens. Environ. 2021, 264, 112588, doi:10.1016/j.rse.2021.112588.
  • Edwards, M.R.; Holloway, T.; Pierce, R.B.; Blank, L.; Broddle, M.; Choi, E.; Duncan, B.N.; Esparza, Á.; Falchetta, G.; Fritz, M.; et al. Satellite Data Applications for Sustainable Energy Transitions. Front. Sustain. 2022, 3, 64, doi:10.3389/frsus.2022.910924.
  • Dutton, J. What Is Analog Forecasting? - World Climate Service Available online: https://www.worldclimateservice.com/2021/09/02/what-is-analog-forecasting/ (accessed on 9 January 2023).
  • Bettolli, M.L. Analog Models for Empirical-Statistical Downscaling. Oxford Res. Encycl. Clim. Sci. 2021, doi:10.1093/acrefore/9780190228620.013.738.
  • Zorita, E.; Storch, H. von The Analog Method as a Simple Statistical Downscaling Technique: Comparison with More Complicated Methods in: Journal of Climate Volume 12 Issue 8 (1999) Available online: https://journals.ametsoc.org/view/journals/clim/12/8/1520-0442_1999_012_2474_tamaas_2.0.co_2.xml (accessed on 9 January 2023).
  • Hoeltgebaum, L.E.B.; Dias, N.L.; Costa, M.A. An Analog Period Method for Gap-Filling of Latent Heat Flux Measurements. Hydrol. Process. 2021, 35, doi:10.1002/hyp.14105.
  • Henn, B.; Raleigh, M.S.; Fisher, A.; Lundquist, J.D. A Comparison of Methods for Filling Gaps in Hourly Near-Surface Air Temperature Data. J. Hydrometeorol. 2013, 14, 929–945, doi:10.1175/JHM-D-12-027.1.

How to cite: Hadjipetrou, S. and Kyriakidis, P.: A data-driven framework for the reconstruction of satellite-derived wind speed image time-series, EGU General Assembly 2023, Vienna, Austria, 23–28 Apr 2023, EGU23-5541, https://doi.org/10.5194/egusphere-egu23-5541, 2023.

EGU23-5569 | ECS | Posters on site | HS3.4

First steps towards a data-driven groundwater vulnerability index for pesticides in Germany using probabilistic neural networks 

Anne-Karin Cooke, Sandra Willkommen, and Stefan Broda

The world largely relies on groundwater extraction for drinking water supply, which is also the case in Germany. In the EU, the Water Framework directive regulates the standards for a chemically good state of water bodies. Thresholds are often exceeded due to fertilizers and pesticides. Methods to assess groundwater vulnerability to contamination to chemical compounds are mainly index-based, GIS-overlay tools. Other approaches are process-based leaching models and statistical approaches. Commonly used index methods remain conceptual in nature and lack validation with monitoring data. Process-oriented approaches tend to focus on the soil layer. Statistical approaches remain underexplored. In the project FARM (Groundwater vulnerability assessment during authorisation procedure of pesticides), we aim to improve groundwater protection by developing a data-based vulnerability index that exploits the existing extensive data bases and covers all relevant environmental conditions and agricultural inputs.

The federal groundwater quality monitoring infrastructure and of water suppliers delivered data of about 26.000 sites which are sampled for about 500 different pesticides. For pesticide monitoring data in Germany, such an exhaustive national database is unprecedented. Given this vast data set, this project aims to apply a fully data-driven approach to identify previously unknown, relevant factors and their interactions that drive groundwater vulnerability to pesticides. We aim to investigate the complex interactions between subsurface (soil, hydrogeology) and surface (meteorology, land use, crop sequences, agricultural practices) site characteristics with the physical-chemical properties (mobility, persistence) of pesticides. The potential of this data set will be exploited by the development, testing and validation of a supervised a machine-learning (ML) model. After an initial feature selection procedure, a Bayesian convolutional neural net will be trained on groundwater quality data and the mentioned extensive catalogue of features. This set-up takes the uncertainty into account introduced by the large percentage of left-censored data (concentrations below limit of quantification of the analytical method). High interpretability of the ML-model is essential, identified factors need to be comprehensible and actionable for decision-makers. We are dealing with a highly heterogeneous, asymmetric monitoring data set and strong biases in many variables are expected. This project thus pioneers in assessing the potential and suitability, as well as limitations and pitfalls of training neural nets on the status-quo of groundwater quality monitoring in Germany. A second major outcome of the project are specific recommendations on adjustments of the national monitoring (spectra of sampled substances, sampling frequency and timings, addition or reduction of monitoring wells in specific areas).

How to cite: Cooke, A.-K., Willkommen, S., and Broda, S.: First steps towards a data-driven groundwater vulnerability index for pesticides in Germany using probabilistic neural networks, EGU General Assembly 2023, Vienna, Austria, 23–28 Apr 2023, EGU23-5569, https://doi.org/10.5194/egusphere-egu23-5569, 2023.

EGU23-6683 | ECS | Posters on site | HS3.4

SciKit-GStat Uncertainty: A software extension to cope with uncertain geostatistical estimates 

Mirko Mälicke, Alberto Guadagnini, and Erwin Zehe

We provide an extension of a well established geostatistical software to allow for effective and interactive assessment of environmental scenarios in a geostatistical context. The extension comprises a pre-built interface and a freely accessible demo application.

The heat of the approach relies on replacing a sample variogram with its uncertainty bound. Doing so enables one to fully and consistently embed various sources of uncertainties stemming from available datasets and methodological approaches employed for their interpretation. Methodological approaches included in the software include capabilities leading to: i) a statistical estimation of uncertainty bounds from residual point-pair distributions; ii) a statistical robustness test for uncertainty bounds; and iii) a Monte Carlo simulation tool to propagate a variety of aleatory uncertainties. 

We illustrate the capabilities of our approach and software through the analysis of two different datasets. We focus on manual variogram estimation to comprehensively illustrate how insights on uncertainty can be used to reject candidate variogram models or model parameter sets.

How to cite: Mälicke, M., Guadagnini, A., and Zehe, E.: SciKit-GStat Uncertainty: A software extension to cope with uncertain geostatistical estimates, EGU General Assembly 2023, Vienna, Austria, 23–28 Apr 2023, EGU23-6683, https://doi.org/10.5194/egusphere-egu23-6683, 2023.

EGU23-7160 | ECS | Orals | HS3.4

Characterization of spatial heterogeneity of geomaterials in large scale groundwater bodies through a compositional data approach 

Tomy-Minh Truong, Alberto Guadagnini, and Irina Engelhardt

Characterization of the spatial distribution of geomaterials and of the associated attributes is a key step associated with the set up of a hydrogeological model. Geological information are often used as a basis for this purpose. One of the most common sources of geological information is provided by available borehole data. However, geological and hydraulic information are often available at different scale. In most cases hydraulic parameters are only measured at point locations, e.g. based on pumping test, which cannot be directly transferred into 3D large-scale parameter fields. However, in some regions even geological information are scare. In such situations, information about aquifer facies and material groups need to be interpolated and serve then as a base to derive key hydraulic parameters, such as hydraulic conductivity, or transport parameters, such as porosity, diversity or reactive surfaces. Sedimentary descriptions are usually achieved when drilling a borehole. Classification of sediments rests on a well defined procedure and provides a preliminary assessment on particle size distributions of the samples analyzed. Based on sedimentary descriptions of the boreholes we construct synthetic particle size distribution curves. These particle size distribution curves can be used to calculate major local attributes of the system (e.g., hydraulic and some specific transport parameters). Based on these types of readily-available information this study aims at developing a procedure to assist construction of a high resolution geological model suitable to be transferred into a flow and transport model that is then used for water resources management issues. We therefore aim to estimate storage and transmissivity with a high reliability by accounting for the material composition in the interpolated space. We rely on a compositional data analysis framework and represent particle size fractions associated with a given location as a compositional vector. These vectors are then projected onto a computational grid through compositional kriging to characterize the spatial heterogeneity of the system. We compare these results against an approach that is based on clustering the ensuing information to obtain distinct geomaterial classes and then assess their spatial distribution through indicator kriging. After the 3D field of grain size distribution curves is generated, they are transferred into hydraulic parameter. Although the process of clustering and using material classes is inevitably associated with a loss in information the procedure of forming a representative particle size distribution around the compositional clusters attempts to keep this loss of information at a minimum. The benefit of interpolating the compositional data instead of directly interpolating inferred parameters is that the particle size distribution curves contain a huge set of information from hydraulic to transport and reactive parameters, which would be lost using hydraulic conductivity exclusively, while the use of material classes increases the efficiency of the calibration of the groundwater model.

How to cite: Truong, T.-M., Guadagnini, A., and Engelhardt, I.: Characterization of spatial heterogeneity of geomaterials in large scale groundwater bodies through a compositional data approach, EGU General Assembly 2023, Vienna, Austria, 23–28 Apr 2023, EGU23-7160, https://doi.org/10.5194/egusphere-egu23-7160, 2023.

Effective techniques for spatial data analysis are required to address the growing need to develop and improve management plans at regional or continental scales. The main purpose of this research is to evaluate the impact of change of spatial support on digital soil mapping. The study is based on the availability of more than 3,300 soil samples collected from the uppermost horizons of farmlands in Campania, an administrative region of southern Italy of about 13,700 km2. Each soil sample was subjected to laboratory tests to determine the following point-referenced primary soil properties: sand and clay contents, oven-dry soil bulk density, soil organic matter, pH, calcium carbonate, and rock fragments. These seven soil properties were mapped over the entire region by using as covariates the following terrain attributes, obtained from the digital terrain model (DTM; 75 m/pixel): elevation, slope, plan curvature, profile curvature, and flow accumulation. Two composite indicators of soil quality were then determined: 1) the soil organic carbon stock (SOCS) in Campania, and 2) the recharge transit time in the alluvial plain of the Sele River where information about the mean annual depth to groundwater is available.

In this study, it was crucial to evaluate the epistemic uncertainty associated with the change of support when fusing the point-referenced soil measurements with the block-based terrain attributes. A key issue of our analysis is the modification of the anamorphosis model based on a block rather than a point. Accordingly, our results show how the estimates change when a properly-corrected block Gaussian anamorphosis model is employed instead of the point Gaussian one.

By way of conclusion, when the main interest of an investigation is to obtain a map of average soil attributes, the change of support might have little influence on the final estimates, especially when working with nearly symmetrical distributions of soil properties. On the other hand, if one should infer the uncertainty of a variable, as in soil vulnerability mapping, then the change of support matters and is an issue to be adequately accounted for in the spatial analysis of environmental data.

How to cite: Romano, N., Castrignanò, A., Allocca, C., and Nasta, P.: How important is the change-of-support problem when digital soil mapping involves multi-source spatial data fusion? A real-world application of multivariate geostatistics to the regional scale of Campania (Italy)., EGU General Assembly 2023, Vienna, Austria, 23–28 Apr 2023, EGU23-7928, https://doi.org/10.5194/egusphere-egu23-7928, 2023.

EGU23-8113 | ECS | Posters on site | HS3.4

Estimating correlation lengths of aquitard hydraulic conductivity by inverse geostatistical modelling of a pumping test 

Martijn van Leer, Willem Jan Zaadnoordijk, Alraune Zech, Jasper Griffioen, and Marc Bierkens

Aquitards are common hydrogeological features in the subsurface and its properties are important for e.g. water resource management, subsidence, contamination transport and aquifer thermal energy storage. Typically pumping test are used to parameterize the hydraulic conductivity of aquitards. However, with analytical interpretation of pumping tests it is difficult to take spatial variability and uncertainty into account. Alternatively, core-scale measurements of hydraulic conductivity are used in geostatistical upscaling methods, for which their correlation lengths are needed. However, this information is extremely difficult to obtain. In this study we investigate whether a pumping test can be used to obtain the correlation lengths needed for geostatistical upscaling and  account for the uncertainty about heterogeneous aquitard conductivity. We generated random realizations from core scale data with varying correlation lengths and inserted these into a groundwater flow model which simulates the outcome of an actual pumping test. We selected the realizations which yielded a better fit to the pumping test data than the traditional pumping test result assuming homogeneous layers. Ranges of horizontal and vertical correlation lengths that fit the pumping test well are found. However, considerable uncertainty regarding the correlation lengths remains which should be considered when parameterizing a regional groundwater flow model.

How to cite: van Leer, M., Zaadnoordijk, W. J., Zech, A., Griffioen, J., and Bierkens, M.: Estimating correlation lengths of aquitard hydraulic conductivity by inverse geostatistical modelling of a pumping test, EGU General Assembly 2023, Vienna, Austria, 23–28 Apr 2023, EGU23-8113, https://doi.org/10.5194/egusphere-egu23-8113, 2023.

Improvements in large dataset availability and computing power have led to an increase in large-sample hydrological (LSH) studies. While these studies bring a breadth of new knowledge, they also introduce new challenges. One such challenge is the optimisation of model hyperparameters, which can be prohibitively computationally expensive on a large scale. Machine learning (ML)-based flow forecasting models have been steadily rising in popularity due to their high accuracy and ease of development. While traditional physics-based models have hyperparameters rooted in hydrological concepts (e.g., the number of hydraulic response units is determined based on spatial heterogeneity), ML-based models do not typically use a physical basis for selecting hyperparameters (e.g., neural network topology). Instead, ML model hyperparameters are typically determined using heuristic or exhaustive search methods.  Clustering has been previously applied to watersheds for identifying homogenous regions for flood frequency analyses. In these cases, unsupervised clustering, based on static watershed characteristics and flow statistics, is used to identify homogenous regions on which to conduct frequency analyses. We propose an application of clustering to optimise ML model hyperparameters on a large scale. The objective of this study is to determine whether grid-search optimisations are transferrable to similar catchments, identified through unsupervised clustering. Our study is conducted using a subset of Canadian catchments (n>500) from the HYSETS database. For each catchment, an LSTM is trained to forecast flow at a daily resolution using hydrometeorological input features (flow, precipitation, temperature, SWE). Grid-search hyperparameter optimisation is conducted on model architecture (number of hidden states and layers), learning rate, dropout rate, and input sequence length. We evaluate the effectiveness of cluster-based hyperparameter optimisation based on a comparison against a non-optimised baseline, for an increasing number of clusters. The impacts of this work have the potential to improve the effectiveness of ML-based flow forecasting models in cases where exhaustive hyperparameter searches are not possible. The results will also allow us to make recommendations for typical hyperparameter values based on watershed characteristics.

How to cite: Khan, U. T. and Snieder, E.: Cluster-based hyperparameter optimisation for LSTM-based flow forecasting in Canadian catchments, EGU General Assembly 2023, Vienna, Austria, 23–28 Apr 2023, EGU23-9114, https://doi.org/10.5194/egusphere-egu23-9114, 2023.

EGU23-10053 | ECS | Posters virtual | HS3.4

Machine learning-based peak flow estimation for improved flood resilience of transportation infrastructure 

Sudan Pokharel, Tirthankar Roy, and David Admiraal

Accurate and timely prediction of peak flow in streams is essential for transportation safety as these estimates can help transportation authorities implement precautionary measures (e.g., road closures, diversion, emergency routes, transportation planning, flood impact assessment, etc.) well ahead of time to mitigate the impacts of flooding on transportation. Often in practice, flow quantiles are estimated from catchment and climate attributes using simple methods such as linear regression, which overlooks the more complex nature of relationships between variables, potentially leading to errors and uncertainties in the estimates that can trickle down to engineering design. Here, we will discuss findings from our ongoing work on accurate estimation of peak flow using machine learning algorithms. The methodology involves a two-step process. First, k-means clustering is implemented to identify regions that have similarities in the mean annual runoff. Second, Random Forest is implemented to map a wide range of climate and catchment features to flow quantiles in each cluster. To assess the effectiveness of this approach in increasing transportation resilience, we will show how the peak flow estimates from this new approach compare with the estimates from the existing approach followed by the Nebraska Department of Transportation and explore the potential of these new estimates to be used for operational purposes for flood-related decision-making in the context to transportation infrastructure.

How to cite: Pokharel, S., Roy, T., and Admiraal, D.: Machine learning-based peak flow estimation for improved flood resilience of transportation infrastructure, EGU General Assembly 2023, Vienna, Austria, 23–28 Apr 2023, EGU23-10053, https://doi.org/10.5194/egusphere-egu23-10053, 2023.

EGU23-10925 | ECS | Posters virtual | HS3.4

Fitting variogram models based on estimation errors and variances using genetic algorithms 

Gaspar Salas-Ruelas, Hugo Enrique Júnez-Ferreira, Gamaliel Moreno Chavez, Julián González Trinidad, Carlos Francisco Bautista Capetillo, and Graciela Herrera Zamarrón

The hydraulic head is an important variable to determine the functioning of water in the subsoil; however, its spatial characterization is complicated due to the variability it presents in an aquifer. Measuring hydraulic head in piezometers or observation wells involves costs, so in some cases there is little data available. To obtain reliable configurations of the hydraulic head spatial distribution in an aquifer, interpolation methods that require few measurements have been used. Ordinary kriging is one of the most widely used spatial interpolation algorithms in geostatistics, which employs a theoretical variogram (circular, exponential, Gaussian, etc.). The variogram is a function whose parameters (nugget, sill and range) must be optimized because the accuracy of the estimation depends on them. As far as it has been reviewed in the literature, the adjustment of theoretical variograms has been carried out by means of genetic algorithms considering bi-objective functions where only the error in the adjustment of the variogram and the difference between the measured values and the estimated values by means of ordinary kriging are taken into account. In this paper we propose the adjustment using a new multiobjective function, where simultaneously the variogram adjustment, the accuracy of the interpolation result and the estimation error variances are considered. This nonlinear optimization problem contains three secondary objectives. The first is to obtain the best fit between the experimental variogram and the theoretical variogram function. Secondly, the aim is to minimize the difference between the measured values and the ordinary kriging estimates (measured with the mean square error) and thirdly that the error variances in the estimation are well represented by the selected model (using the standard mean square error). The tests of the proposed procedure were carried out with data measured in El Palmar aquifer located in the northern part of the state of Zacatecas, Mexico. The performance of this procedure was evaluated for different weights assigned to each of the secondary objectives. In the models where only the variogram adjustment is considered, the mean squared error and the standardized mean squared error turned out to be very large, it was also observed that when the estimation error variance is not taken into account in the objective function, the standardized mean squared error ranges from 20.94 to 56.41. It was observed that when the estimation error variance is incorporated in the objective function (even when its weight is small) the estimation errors are very close to the minimum obtained and that the variances are very reliable (with the standardized mean square error between 0.65 and 1.35).

How to cite: Salas-Ruelas, G., Júnez-Ferreira, H. E., Moreno Chavez, G., González Trinidad, J., Bautista Capetillo, C. F., and Herrera Zamarrón, G.: Fitting variogram models based on estimation errors and variances using genetic algorithms, EGU General Assembly 2023, Vienna, Austria, 23–28 Apr 2023, EGU23-10925, https://doi.org/10.5194/egusphere-egu23-10925, 2023.

EGU23-11154 | ECS | Posters on site | HS3.4

Clustering and Random Forest Analysis for the Identification of Hydrological Controls of Slope Response to Rainfall 

Daniel Camilo Roman Quintero, Pasquale Marino, Giovanni Francesco Santonastaso, and Roberto Greco

The assessment of the response of slopes to precipitations is important for various applications, from water resources management to hazard assessment due to extreme rainfall events. It is well known that the underground conditions prior to the initiation of rainfall events control the hydrological processes that occur in slopes, affecting the water exchange through their boundaries. The present study aims at identifying hydrological variables to be monitored and modelled, suitable to improve the prediction of slope response to precipitations, for the case of a slope covered with loose pyroclastic coarse-grained soil overlaying a karstic bedrock, typical of southern Apennines (Italy). Field monitoring has been carried out for three years at the slope, including stream level recordings, meteorological recordings, and soil water content and suction measurements, which allowed setting up a physically based hydrological model of the slope, coupling the unsaturated flow in the soil cover with a perched aquifer developing in the fractured bedrock. To enlarge the field dataset, a synthetic dataset has been generated, linking a previously calibrated stochastic rainfall generator to the hydrological model. In this way, a synthetic dataset of 1000 years has been obtained, containing information on rainfall, aquifer water level and soil volumetric water content at different depths. Machine Learning techniques have been used to unwrap the relationships linking the studied variables, typically non-linear. The Random Forest technique has been used to assess the importance of each variable on the slope response, and the k-means clustering technique has been used to explore the geometrical disposition of data, so to identify seasonally recurrent different conditions controlling the slope response. The results indicate that the slope response, in terms of the fraction of rainwater remaining stored in the soil cover at the end of each rainfall event, can be predicted from the underground conditions prior to the rainfall initiation, weighting the role, on one hand, of the soil moisture excess above field capacity, controlling the ease of the water to flow in and out of the soil cover and, on the other hand, of the perched aquifer water level, that gives evidence of the activation of effective slope drainage.

How to cite: Roman Quintero, D. C., Marino, P., Santonastaso, G. F., and Greco, R.: Clustering and Random Forest Analysis for the Identification of Hydrological Controls of Slope Response to Rainfall, EGU General Assembly 2023, Vienna, Austria, 23–28 Apr 2023, EGU23-11154, https://doi.org/10.5194/egusphere-egu23-11154, 2023.

EGU23-11472 | Posters on site | HS3.4

Geostatistical analysis of groundwater data in a mining area 

Emmanouil Varouchakis, Evgenia Diamantopoulou, and Andreas Pavlides

Geostatistical methods are increasingly used in earth sciences and engineering to improve space and time predictions. During mining activities, it is essential to monitor contaminant concentrations in soil and groundwater and estimate their spatial distribution in the area to guide environmental monitoring and reclamation once mining operations have been finished. In this work, we present the geostatistical analysis of the groundwater content in certain pollutants (Cd and Mn) in a group of adjacent mines. The available monitoring locations were Sixty-two. The challenge in this work is the grouped location of monitoring stations within the borders of the adjacent mines. This work aims to map the spatial distribution of Cd and Mn concentrations in groundwater in the entire mining area. The Correlation between Cd and Mn was investigated during the preliminary analysis of the data and found significant. The logarithm of the data values was used, and after removing a linear trend, the variogram parameters by means of a spherical model were estimated. In order to create the necessary contaminants concentration maps, we employed the Ordinary Kriging (OK) method and inversed the transformations. Cross-validation shows promising results (ρ = 92% for Cd and ρ = 88% for Mn, RMSE = 5.1 ppm for Cd and RMSE = 18.2 ppm for Mn), while the uncertainty was calculated in acceptable bounds.

How to cite: Varouchakis, E., Diamantopoulou, E., and Pavlides, A.: Geostatistical analysis of groundwater data in a mining area, EGU General Assembly 2023, Vienna, Austria, 23–28 Apr 2023, EGU23-11472, https://doi.org/10.5194/egusphere-egu23-11472, 2023.

EGU23-13537 | Orals | HS3.4

Clustering grid cells in a land surface model 

Elizabeth Cooper, Rich Ellis, Eleanor Blyth, and Simon Dadson

Land surface models such as JULES (Joint UK Land Environment Simulator) are usually run on a rectilinear grid, yielding gridded outputs for variables such as soil moisture and evapotranspiration. JULES also models surface and subsurface water fluxes, and these can be used as inputs to a river routing model to predict river flows. Here we investigate the effect of clustering groups of grid cells into ‘Land Response Units’ (LRUs) in JULES, using a hierarchical multivariate clustering technique to group underlying grid cells together based on characteristics including soil type, elevation and land cover. Using LRUs rather than grid cells has the potential to reduce computational expense as well as providing an alternative to tiling approaches for capturing sub-grid heterogeneity. Here, LRUs are used exclusively in the land surface part of modelling, i.e., separate from river routing.

We investigate the effect of the LRU approach on JULES soil moisture in part of the Thames catchment in the UK, and compare LRU and gridded soil moisture predictions with measurements from the UKCEH COSMOS-UK soil moisture observation network. We find that use of LRUs leads to good soil moisture prediction while reducing computational expense compared to a gridded approach, but that this is strongly dependent on the characteristics used to create the LRUs. We also consider how the LRU approach impacts predicted river flows, and compare routed JULES outputs with observed river flow from a number of NRFA gauges in the catchment. We show that less computationally expensive LRU JULES outputs give similar river flow results to standard 1 km gridded JULES outputs when routed at 1km resolution, and that the LRU approach can outperform gridded river flow predictions when routed at higher resolution.

How to cite: Cooper, E., Ellis, R., Blyth, E., and Dadson, S.: Clustering grid cells in a land surface model, EGU General Assembly 2023, Vienna, Austria, 23–28 Apr 2023, EGU23-13537, https://doi.org/10.5194/egusphere-egu23-13537, 2023.

EGU23-14743 | Orals | HS3.4

Assessing the spatio-temporal changes of groundwater parameters: a multivariate geostatistical approach 

Monica Palma, Sabrina Maggio, Claudia Cappello, Antonella Congedi, and Sandra De Iaco

Groundwater over-exploitation and environment pollution, together with rising temperatures and other climate changes, can cause a large imbalance in the soil physicochemical properties, with a negative impact on economic, social and human health conditions. Therefore, monitoring and assessing the evolution in space and time of groundwater qualitative parameters as well as quantitative status are crucial aspects for a sustainable water management.

Multivariate Geostatistics foresees dedicated tools for analyzing multivariate spatio-temporal data which are characterized by heterogeneous patterns in space-time, such as those concerning hydrogeological data. In the literature, few analyses (Jang et al., 2012; Yazdanpanah, 2016; Mastrocicco et al., 2021) have been developed on the main groundwater qualitative indicators through the use of spatio-temporal multivariate geostatistical methodologies.

This paper aims to propose a spatio-temporal multivariate analysis for some benchmark indicators describing the qualitative and quantitative status of an unconfined aquifer in Italy. By applying the fitting procedure proposed in De Iaco et al. (2019) and recalled in Cappello et al. (2022), a spatio-temporal multivariate correlation model is developed for forecasting purposes. Then, on the basis of a comparison among predicted values of the variables under study and values recorded for the same variables a decade before, hazard maps of groundwater degradation are produced by through a non-parametric approach, identifying those vulnerability areas where the aquifer system could be contamined. The empirical findings will help the policy makers to pursue effective actions aimed at safeguarding groundwater resources.


REFERENCES

- Cappello, C., De Iaco, S., Palma, M., 2022. Computational advances for spatio-temporal multivariate environmental models. Comput. Stat. 37, 651–670. https://doi.org/10.1007/s00180-021-01132-0

- De Iaco, S., Palma. M., Posa, D., 2019. Choosing suitable linear coregionalization models for spatio-temporal data. Stoch. Environ. Res. and Risk Assess. 33, 1419–1434.

- Jang, C.S., Chen, S.K., Kuo, Y.M., 2012. Establishing an irrigation management plan of sustainable groundwater based on spatial variability of water quality and quantity. Journal of Hydrology, 414-415, 201–210

- Mastrocicco, M., Gervasio, M.P., Busico, G., Colombani, N., 2021. Natural and anthro- pogenic factors driving groundwater resources salinization for agriculture use in the Campania plains (Southern Italy). Science of the Total Environment, 758, 144033.

- Yazdanpanah, N. 2016. Spatiotemporal mapping of groundwater quality for irrigation using geostatistical analysis combined with a linear regression method. Model. Earth Syst. Environ., 2, 1-18.

How to cite: Palma, M., Maggio, S., Cappello, C., Congedi, A., and De Iaco, S.: Assessing the spatio-temporal changes of groundwater parameters: a multivariate geostatistical approach, EGU General Assembly 2023, Vienna, Austria, 23–28 Apr 2023, EGU23-14743, https://doi.org/10.5194/egusphere-egu23-14743, 2023.

A clear understanding of the groundwater system plays a leading role in the effective management of water resources and sustainable development. There is, therefore, a need to consider all available datasets, collate other supplementary data and update the present hydrogeological databases as an important source of information for decision-makers. Springs could be considered as hydraulic features for characterizing the basin-scale groundwater flow when there are not wells in a study area or there is limited access to them. In this study, the springs in some river basins in Molise region (southern Italy) are investigated. Between 1 and 1556 m a.s.l. (622 m a.s.l. on average), a total of 2681 springs (1620 perennial and 1061 non-perennial springs) were identified based on the Istituto Geografico Militare topographic maps at a 1:25000 scale. In springs, the hydraulic head is almost equal to the elevation head (h≈z). Regarding that groundwater flows from high to low hydraulic head (h), it could be concluded that the groundwater body generally flows from the mountainous area in the south and southwest towards the coast of Adriatic Sea in the north and northeast.

For further investigation, 1237 springs in Fortore and Saccione river basins were considered and the following factors (as indicators of the areas with a high probability of groundwater spring presence) were obtained from the digital elevation model for spring orifices: altitude, slope degree, slope aspect, curvature, plan curvature, profile curvature, topographic wetness index (TWI), stream transport index (STI) and stream power index (SPI). Following log-transformation of altitude, slope degree, slope aspect, SPI, STI and TWI for obtaining more symmetric statistical distribution, the springs were categorized into three groups through the Grouping Analysis in ArcMap 10.8: Group 1 with 101 springs; Group 2 with 1003 springs; and Group 3 with 132 springs. The springs in Group 2, Group 3 and Group 1 occur at high (639 m), medium (475 m) and low (150 m) altitudes, respectively. The slope of spring orifices in Group 2 and Group 3 is almost similar, but steeper than that of Group 1. The SPI and STI increase from Group 1 to Group 3 while the TWI and slope aspect are not significantly different between the spring groups. The R-squared values show that altitude and slope are the most important variables for discriminating the groups. A literature study shows a greater probability of spring groundwater occurrence in areas at a higher altitude and with a steeper slope, but this should be confirmed in our study area after applying some modeling techniques and considering more complex relationships.

This study presents a general overview of groundwater hydrogeology in some river basins in Molise region. It is noteworthy that the project is still ongoing and the database will be updated with a wider range of variables (e.g., hydrogeological complexes, distance to tectonic elements, spring discharge and spring water temperature when available) to obtain a comprehensive spring database and empower researchers supporting decision-makers for groundwater management.

How to cite: Ebrahimi, P. and Matano, F.: A regional spring database for groundwater management: The preliminary results of a case study in Molise region (south Italy) and the future perspectives, EGU General Assembly 2023, Vienna, Austria, 23–28 Apr 2023, EGU23-14797, https://doi.org/10.5194/egusphere-egu23-14797, 2023.

EGU23-15612 | Orals | HS3.4

Clustering as a tool for identifying drought-prone regions: A Swedish example 

Claudia Teutschbein, Andrijana Todorovic, and Thomas Grabs

The increasing availability of large data sets has fuelled the application of clustering approaches for discovering and interpreting spatio-temporal patterns in hydroclimatic data. Clustering can be particularly powerful for grouping catchments that span across various climate zones or hydrologic regimes into homogeneous clusters of similar hydrological or climatic behavior.

Here, we provide a practical example of how clustering can facilitate comprehensive analyses of streamflow drought characteristics across 50 Swedish catchments spanning three climate zones and ranging from snow-melt driven streamflow regimes in the North to rainfall-driven regimes in the South. To this end, the k-means clustering was applied to generate homogeneous clusters of catchments based on their similarity in streamflow anomalies (detected by using the standardized streamflow index) over the past 60 years. Five geographically distinct regions emerged from the clustering, linking the streamflow anomalies to the hydroclimatic conditions (following the north-south and elevation gradients), and to landscape characteristics, which strongly affect streamflow-generating processes at the catchment scale. Each cluster also featured – in line with its geographical location – a distinct hydrological regime.

Facilitated by the clustering, a clear north-south gradient emerged for many of the analysed drought statistics, including, e.g., drought duration, annual number of drought days and number of drought days in spring and summer, as well as standardized deficit volumes. Similarly, trends and changes in streamflow anomalies over the past 60 years also varied across clusters, with clusters in northern Sweden exhibiting wetting trends and clusters in southern Sweden drying trends.

This case study serves as an illustration of how clustering can be a valuable tool for improving our understanding and potential prediction of hydrological processes. Clustering enabled us to identify drought-prone areas and illuminated various drought behaviors, prevailing drought typologies, and seasonal differences that can be linked to the underlying streamflow regimes. 

How to cite: Teutschbein, C., Todorovic, A., and Grabs, T.: Clustering as a tool for identifying drought-prone regions: A Swedish example, EGU General Assembly 2023, Vienna, Austria, 23–28 Apr 2023, EGU23-15612, https://doi.org/10.5194/egusphere-egu23-15612, 2023.

EGU23-16088 | ECS | Orals | HS3.4

Sequential multiple-point statistics simulations conditioned on arithmetic averages 

Shiran Levy, Lea Friedli, Grégoire Mariéthoz, and Niklas Linde

We seek to develop a methodology enabling fast geostatistical simulations honoring both geophysical data and a complex prior model. Particularly, we consider a multiple-point statistics (MPS) framework in which a training image (TI) describes the available prior knowledge. Accurate posterior sampling is then possible by using a so-called extended Metropolis algorithm in which proposals are drawn from the prior using sequential geostatistical resampling. Such a Markov chain Monte Carlo (MCMC) algorithm will eventually locate and sample proportionally to the posterior distribution, however, it is often exceedingly slow and typically demands millions of MCMC iterations before the posterior is sampled sufficiently. We are developing a methodology in which the MPS simulation is built up iteratively pixel-by-pixel starting from an empty grid. At each pixel, multiple proposals are generated using an MPS algorithm and the proposals are accepted proportionally to the likelihood considering conditioning data in terms of linear averages (for instance geophysical data). The likelihood function is generally intractable as it depends on the pixels that have not yet been sampled. We approximate the likelihood function using a Gaussian model in which the posterior mean and covariance are updated sequentially as the simulation builds up. The posterior statistics are approximated by running the algorithm multiple times (sequentially or in parallel). Considering crosshole first-arrival ground-penetrating radar data, we assess the accuracy of our methodology both for multi-Gaussian priors for which analytical posteriors are available and for more complex training images against the extended Metropolis method. Our approach is inherently approximate due to the use of a finite training image, a finite number of candidates for each pixel and the need to approximate intractable likelihood functions. Nevertheless, preliminary results are promising as this method allows directly obtaining a reasonable estimation at a reduced computational cost compared to MCMC.

How to cite: Levy, S., Friedli, L., Mariéthoz, G., and Linde, N.: Sequential multiple-point statistics simulations conditioned on arithmetic averages, EGU General Assembly 2023, Vienna, Austria, 23–28 Apr 2023, EGU23-16088, https://doi.org/10.5194/egusphere-egu23-16088, 2023.

EGU23-16194 | Posters virtual | HS3.4

Space-time multivariate techniques: a comparative analysis on environmental data 

Claudia Cappello, Sandra De Iaco, Monica Palma, Christoph Muehlmann, and Klaus Nordhausen

In environmental sciences, it is common to collect and analyze spatio-temporal multivariate data concerning several variables which are measured in time over a spatial domain. The spatio-temporal data are usually sparce in space, due to the high cost of the equipment, and temporal dense since the required variables are regularly sampled in time.

In the literature different methods have been proposed for the analysis of such spatio-temporal data which exhibit a correlation in space and time as well as in-between variables. Among them it is worth recalling the generalization of Blind Source Separation technique for multivariate space-time random field (stBSS) and the space-time linear coregionalization model (ST-LCM). These methods are useful to simplify the spatio-temporal multivariate analysis since by a linear transformation of the original observations only the independent components which exhibit a spatio-temporal correlation are retained (lower than the number of observed variables) and modelled.

In this paper a multivariate study regarding seven environmental variables (evapotranspiration level, minimum and maximum temperature, minimum and maximum humidity, wind speed and precipitation) measured between 2000 and 2022 in Veneto region (Italy) will be proposed.  Both the stBSS and the joint diagonalization of the empirical covariance matrix approach will be used to identify the hidden components, and properly chosen spatio-temporal models will be fitted to the latent components. Note that for the first approach a BSS model for the multivariate random field will be assumed, whereas for second one a space-time linear coregionalization model (ST-LCM) for the independent components will be fitted to the matrix-valued covariance function estimated for seven relevant environmental variables.

Finally, the fitted models have been used to predict evapotranspiration levels and a comparison of the values obtained by using the two different techniques will be provided.

How to cite: Cappello, C., De Iaco, S., Palma, M., Muehlmann, C., and Nordhausen, K.: Space-time multivariate techniques: a comparative analysis on environmental data, EGU General Assembly 2023, Vienna, Austria, 23–28 Apr 2023, EGU23-16194, https://doi.org/10.5194/egusphere-egu23-16194, 2023.

Reservoir simulations often require statistical predictions to quantify production uncertainty or assess potential risks. Most existing uncertainty quantification procedures aim to decompose the input random field into independent random variables if the correlation scale is small compared to the domain size. In this work, we develop a K-means-based aggregation model, for efficiently estimating multiphase flow performance in multiple geological realizations. This approach performs a number of single-phase flow simulations and uses K-means clustering to select only a few representatives on which multiphase flow simulations are performed. In addition, an empirical model is then employed to describe the relationship between the single-phase solution and the multiphase solution using these representatives. Finally, the multiphase solution in all realizations can be easily predicted using empirical models. The method is applicable to both 2D and 3D synthetic models and has been shown to perform well in the trusted interval of productivity, and probability distribution as indicated by the cumulative density function. It is able to capture a large number of ensemble statistical realizations of Monte Carlo simulation results with significantly reduced computational cost.

How to cite: Liao, Q.: Clustering aggregation model for statistical forecasting of multiphase flow problems, EGU General Assembly 2023, Vienna, Austria, 23–28 Apr 2023, EGU23-973, https://doi.org/10.5194/egusphere-egu23-973, 2023.

EGU23-3891 | Posters on site | HS3.5

Estimating groundwater response time in humid climate by using spectral analysis 

Mariaines Di Dato, Timo Houben, and Sabine Attinger

During dry periods, river flow comprises baseflow, which typically generates from shallow aquifers. Understanding how such aquifers respond to climate events is key to managing environmental issues related to water supply or water quality. A typical indicator of groundwater response to climate events is the characteristic response time, which indicates the rate of depletion of shallow aquifers.

The traditional method to infer the characteristic response time analyzes the slope of the hydrograph recession curve. Such a method does not account for stormwater contribution in recession analysis, thereby assuming that the catchment is dry and the only contribution to discharge originates from groundwater. As a consequence, the recession analysis might underestimate the groundwater response time, owing to the presence of faster discharge components, i.e. surface runoff or interflow, in the falling limbs.

In this work, we propose an alternative methodology to calculate the characteristic response time, which is determined by analyzing the behavior of the baseflow time series in the frequency domain. The aquifer can be conceptualized as a low-pass filter, which smooths the high-fluctuating components in the recharge signal. Such behavior causes a cut-off frequency in the baseflow spectrum, which corresponds to the aquifer characteristic time. We applied this approach to several gauging stations in Germany, whose humid climate is ideal to compare the results with the classical recession analysis.

We observed that spectral analysis yields characteristic response times systematically larger than the ones calculated with recession analysis. On average there is a factor of two between the estimates provided by the two methods. Overall our study emphasizes careful consideration of the estimation of groundwater response times, especially in humid and sub-humid river basins.

How to cite: Di Dato, M., Houben, T., and Attinger, S.: Estimating groundwater response time in humid climate by using spectral analysis, EGU General Assembly 2023, Vienna, Austria, 23–28 Apr 2023, EGU23-3891, https://doi.org/10.5194/egusphere-egu23-3891, 2023.

EGU23-3933 | Posters on site | HS3.5

Towards identification of dominant hydrological mechanisms in ungauged catchments 

Cristina Prieto, Le Vine Nataliya, Kavetski Dmitri, Fenicia Fabrizio, Scheidegger Andreas, and Vitolo Claudia

Modelling hydrological processes in ungauged catchments is a major challenge in environmental sciences and engineering. An ungauged catchment is a catchment that lacks streamflow data suitable for traditional modelling methods. Predicting streamflow in ungauged catchments requires some form of extrapolation ("regionalisation") from other "similar" catchments, with variables of interest being flow "indices" or "signatures", such as quantiles of the flow duration curve, etc.

Another major question in hydrology is the estimation of model structure that reflects the hydrological processes relevant to the catchment of interest. This question is intimately tied to process representation. To paraphrase a common saying, all models are wrong, but some model mechanisms (process representations) might be useful. Our previous study contributed a Bayesian framework for the identification of individual model mechanisms from streamflow data.

In this study we extend the mechanism identification method to operate in ungauged basins based on regionalized flow indices. Candidate mechanisms and model structures are generated, and then the "dominant" (more a posterior probable) model mechanisms are identified using statistical hypothesis testing. As part of the derivation, it is assumed that the error in the regionalization of flow indices dominates the structural error of the hydrological model.

The proposed method is illustrated with real data and synthetic experiments based on 92 catchments from northern Spain, from which 16 catchments are treated as ungauged. We use 624 model structures from the flexible hydrological model framework FUSE. Flow indices are regionalised using random forest regression in principal component (PC) space; we select the first 4 leading indices in PC space. The case study set up includes an experiments using real data (where the true mechanisms are unknown) and a set of synthetic experiments with different error levels (where the “true” mechanisms are known).

Across the real and synthetic experiments, routing is usually among the most identifiable processes, whereas the least identifiable processes are percolation and unsaturated zone processes. The precision, i.e. the probability of making an identification (whether correct or not), remains stable at around 25%. In the synthetic experiments we can calculate the (conditional) reliability of the identification method, i.e. the probability that, when the method makes an identification, the true mechanism is identified. The conditional reliability varies from 60% to 95% depending on the magnitude of the combined regionalization and hydrological error. Our study contributes perspectives on hydrological mechanism identification under data-scarce conditions; we discus limitations and opportunities for improvement.


Prieto, C., N. Le Vine, D. Kavetski, F. Fenicia, A. Scheidegger, and C. Vitolo (2022) An Exploration of Bayesian Identification of Dominant Hydrological Mechanisms in Ungauged Catchments, Water Resources Research, 58(3), e2021WR030705, doi: https://doi.org/10.1029/2021WR030705.

How to cite: Prieto, C., Nataliya, L. V., Dmitri, K., Fabrizio, F., Andreas, S., and Claudia, V.: Towards identification of dominant hydrological mechanisms in ungauged catchments, EGU General Assembly 2023, Vienna, Austria, 23–28 Apr 2023, EGU23-3933, https://doi.org/10.5194/egusphere-egu23-3933, 2023.

EGU23-5100 | ECS | Orals | HS3.5

Characterising errors using satellite metadata for eco-hydrological modelling 

Hui Zou, Lucy Marshall, and Ashish Sharma

Understanding the origin of errors in model predictions is a critical element in hydrologic model calibration and uncertainty estimation. While there exist a variety of plausible error sources, only one measure of the total residual error can be ascertained when the observed response is known. Here we show that collecting extra information a priori to characterise the data error before calibration can assist in improved model calibration and uncertainty estimation. A new model calibration strategy using the satellite metadata information is proposed as a means to inform the model prior, and subsequently to decompose data error from total residual error. This approach, referred to as Bayesian ecohydrological error model (BEEM), is first examined in a synthetic setting to establish its validity, and then applied to three real catchments across Australia. Results show that 1) BEEM is valid in a synthetic setting, as it can perfectly ascertain the true underlying error; 2) in real catchments the model error is reduced when utilizing the observation error variance as added error contributing to total error variance, while the magnitude of total residual error is more robust when utilizing metadata about the data quality proportionality as the basis for assigning total error variance ; 3) BEEM improves model calibration by estimating the model error appropriately and estimating the uncertainty interval more precisely. Overall, our work demonstrates a new approach to collect prior error information in satellite metadata and reveals the potential for fully utilizing metadata about error sources in uncertainty estimation.

How to cite: Zou, H., Marshall, L., and Sharma, A.: Characterising errors using satellite metadata for eco-hydrological modelling, EGU General Assembly 2023, Vienna, Austria, 23–28 Apr 2023, EGU23-5100, https://doi.org/10.5194/egusphere-egu23-5100, 2023.

EGU23-5635 | ECS | Orals | HS3.5

Spectral analysis of groundwater level time series reveals hydrogeological parameters 

Timo Houben, Mariaines Di-Dato, Christian Siebert, Thomas Kalbacher, Thomas Fischer, and Sabine Attinger

Groundwater resources are heavily exploited to supply domestic, industrial and agricultural water consumption. Climate and societal changes and associated higher abstraction will alter the subsurface storage in terms of quantity and quality in currently unpredictable ways. In order to ensure sustainable groundwater management, we must evaluate the intrinsic and spatially variable vulnerability of aquifers in terms of water quality issues and the resilience of groundwater volumes to external perturbations such as severe droughts in connection with intensive irrigation. For this purpose, physically based numerical groundwater models are of great importance, especially on the regional scale. The equations applied in these models must be fed with the hydrogeological parameters: The transmissivity T and the storativity S.

Both parameters are typically obtained through time consuming and cost intensive hydrogeological in-situ tests or by laboratory analysis of core samples from point information (drillings and wells), resulting in parameters with limited transferability to regional settings. Instead, we propose to determine the parameters by spectral analysis of groundwater level fluctuations using (semi-)analytical solutions for the frequency domain. We developed a fully automatized workflow, taking groundwater level and recharge time series together with little information about the geometry of the aquifer to derive T and S as well as tc (the characteristic response time). While the first two will be used for hydrogeological modelling, the latter can serve as an indication to assess the resilience of the groundwater system directly without additional modelling attempts. The methodology was tested with great success in simplified numerical environments and was applied to real groundwater time series in southern Germany. The response times and the storativities could be robustly estimated while the transmissivities inherit quantifiable uncertainties. Depending on the hydrogeological regime, the parameters represented effective and regional estimates.

How to cite: Houben, T., Di-Dato, M., Siebert, C., Kalbacher, T., Fischer, T., and Attinger, S.: Spectral analysis of groundwater level time series reveals hydrogeological parameters, EGU General Assembly 2023, Vienna, Austria, 23–28 Apr 2023, EGU23-5635, https://doi.org/10.5194/egusphere-egu23-5635, 2023.

EGU23-6986 | Orals | HS3.5

On the elaboration of a robust calibration strategy for the large-scale GEM-Hydro model 

Etienne Gaborit, Daniel Princz, Juliane Mai, Hongren Shen, Bryan Tolson, and Vincent Fortin

As part of the Great-Lakes Runoff Inter-comparison Project (GRIP-GL; Mai et al., 2022), which aims at comparing the performances of different hydrologic models over the Great-Lakes when calibrating them using the same meteorological inputs and geophysical databases, the GEM-Hydro hydrologic model used at Environment and Climate Change Canada (ECCC) to perform operational hydrologic forecasts was calibrated using different strategies. Following the calibration work related to GRIP-GL, progress has been achieved with regard to improving the calibration of the GEM-Hydro model.

The work presented here focuses on improvements achieved with regard to calibrating the GEM-Hydro model, compared to the default version of the model and to the performances obtained during the GRIP-GL project. For various reasons explained, the GEM-Hydro calibration performed as part of GRIP-GL was suboptimal. The general calibration framework remains the same as in GRIP-GL, for example by using the MESH-SVS-Raven model to speed-up simulation times and transferring the calibrated parameters into GEM-Hydro afterwards, by relying on global calibrations for each of the 6 Great-Lakes subdomains, etc. However, several important changes have been made compared to the work performed in GRIP-GL, like a new approach to represent the effect of Tile Drains, changing the set of flow stations used for calibration, revising the objective function, etc.

The proposed calibration methodology updates significantly improve GEM-Hydro streamflow performance across the Great-Lakes domain and in addition also improve or maintain similar performance levels as the default version of the model, with respect to auxiliary variables and surface fluxes: snow, soil moisture, evapotranspiration, 2m air temperature and dew point. Indeed, the model relies on 40m atmospheric forcings for wind speed, temperature and humidity, and simulates its own 2m atmospheric variables. To achieve this, it was necessary to constrain some parameter interval values during calibration, in order to prevent the calibration algorithm to choose physically-irrelevant parameter values that could allow to improve streamflow performances while degrading other hydrologic variables, due to equifinality.

Reference:

Mai, J., Shen, H., Tolson, B. A., Gaborit, E., Arsenault, R., Craig, J. R., Fortin, V., Fry, L. M., Gauch, M., Klotz, D., Kratzert, F., O'Brien, N., Princz, D. G., Rasiya Koya, S., Roy, T., Seglenieks, F., Shrestha, N. K., Temgoua, A. G. T., Vionnet, V., and Waddell, J. W. (2022). The Great Lakes Runoff Intercomparison Project Phase 4: The Great Lakes (GRIP-GL). Hydrol. Earth Syst. Sci., 26, 3537–3572. Highlight paper. Accepted Jun 10, 2022.  https://doi.org/10.5194/hess-26-3537-2022

How to cite: Gaborit, E., Princz, D., Mai, J., Shen, H., Tolson, B., and Fortin, V.: On the elaboration of a robust calibration strategy for the large-scale GEM-Hydro model, EGU General Assembly 2023, Vienna, Austria, 23–28 Apr 2023, EGU23-6986, https://doi.org/10.5194/egusphere-egu23-6986, 2023.

EGU23-8423 | Orals | HS3.5

Time-varying sensitivity analysis across different hydrological model structures, variables and time scales 

Björn Guse, Anna Herzog, Stephan Thober, Diana Spieler, Lieke Melsen, Jens Kiesel, Maria Staudinger, Paul Wagner, Ralf Loritz, Sebastian Müller, Michael Stölzle, Larissa Scholz, Justine Berg, Tobias Pilz, Uwe Ehret, Doris Düthmann, Tobias Houska, Sandra Pool, and Larisa Tarasova and the other members of the DFG Scientific network IMPRO

Temporal sensitivity analyses can be used to detect dominant model parameters at different time steps (e.g. daily or monthly) providing insights on their temporal patterns and reflecting the temporal variability in dominant hydrological processes. However, hydrological processes do not only vary in time under different hydrometeorological conditions, but also the time scales of implemented processes are different. Here, the impact of different time scales (e.g. daily vs. monthly) on sensitivity patterns is investigated.

A temporal parameter sensitivity analysis is applied to three hydrological models (HBV, mHM and SWAT) for nine catchments in Germany. These catchments represent the variability of landscapes in Germany and are dominated by different runoff generation processes. In addition to discharge, further model fluxes and states such as evapotranspiration or soil moisture are used as target variables for the sensitivity analysis.

To analyse the impact of different time scales, two approaches are compared. In a first approach, daily simulated time series are used for the sensitivity analysis and aggregated then to monthly averaged sensitivities (Post-Agg). In a second approach, the simulated time series is first aggregated to a monthly time series and than used as input for the sensitivity analysis (Pre-Agg).

Our analysis shows that monthly averaged sensitivity patterns of different model outputs vary between Post- and Pre-Aggregation approach. Model parameters that are related to fast-reacting runoff processes, e.g. surface runoff or fast subsurface flow, are more sensitive when using daily time series for the sensitivity analysis (Post-Agg). In contrast, model parameters related processes with longer time scales such as snowmelt or evapotranspiration are more emphasized in monthly time series (Pre-Agg). These differences in the sensitivity results between Post-Agg and Pre-Agg are in particularly pronounced when using the integrated value of discharge as the target variable. Instead, the differences are smaller when applying the sensitivity analysis directly to represent model fluxes.

Moreover, our analysis shows changes in dominant parameters along a north-south gradient which can be explained by the physiographic characteristics of the catchments. The differences in the sensitivity results between the models can be related to the different model structures.

Based on our analysis, we recommend to either using model outputs of the major hydrological variables or different time scales for the sensitivity analysis to derive the maximum information from the diagnostic model analysis and to understand how model parameters describe hydrological systems.

How to cite: Guse, B., Herzog, A., Thober, S., Spieler, D., Melsen, L., Kiesel, J., Staudinger, M., Wagner, P., Loritz, R., Müller, S., Stölzle, M., Scholz, L., Berg, J., Pilz, T., Ehret, U., Düthmann, D., Houska, T., Pool, S., and Tarasova, L. and the other members of the DFG Scientific network IMPRO: Time-varying sensitivity analysis across different hydrological model structures, variables and time scales, EGU General Assembly 2023, Vienna, Austria, 23–28 Apr 2023, EGU23-8423, https://doi.org/10.5194/egusphere-egu23-8423, 2023.

EGU23-10001 | Posters on site | HS3.5

Investigating the spectral analysis of groundwater level fluctuations in a numerical model of the upper Danube catchment in Germany 

Rao Ali Javed, Timo Houben, Thomas Kalbacher, and Sabine Attinger

Common in-situ methods like pumping tests, slug tests and laboratory analysis reveal aquifer parameters (that is the transmissivity and storativity) that are localized and specific to the measurement location. A need for regionally valid aquifer parameters arises when setting up regional scale physically based groundwater models. The models would help water resource managers to plan and predict the quality and quantity of groundwater resources, thus supports decision making as well as sustainable fresh water supply. A study from Houben et al. 2022 indicate that regional aquifer parameters can be obtained by analysing the frequency content of groundwater level time-series. Their work builds upon a semi-analytical solution for the groundwater head spectrum stochastically derived from the Boussinesq equation evoking the Dupuit assumptions. They found that the solution can be used to infer the transmissivity and storativity from groundwater level fluctuations and validated their hypothesis in simplified numerical environments of different complexity.

In this work, we extended the numerical experiments and applied the semi-analytical solution in homogeneous and heterogeneous 2D (x-y-plane) aquifers as well as in a complex numerical 2D (x-y-plane) model of the upper Danube catchment. We tested the hypothesis that certain locations can reveal regional aquifer parameters. In a homogeneous simulated model, the semi-analytical solution reveals effectively the model input parameters which serves as a proof-of-concept. In a heterogeneous numerical model, the obtained parameters show the complex interplay between zones of different permeability. The effects of high permeable zones can be observed on the low permeable zones which are further apart and vice versa. The obtained parameters were in the range of the model input parameters and followed the trend of the input parameters along the direction of flow. In the model of the upper Danube the obtained parameters were systematically larger than the input parameters. The shift in the obtained parameters was attributed to a violation of the assumptions of the semi-analytical solution. Thus, the complexity of model leads to a breakdown of the semi-analytical solution in some areas. Analyses on a sub-catchment scale revealed that when the assumptions of the analytical solution are met, the obtained parameters reflect the effective parameters.

How to cite: Javed, R. A., Houben, T., Kalbacher, T., and Attinger, S.: Investigating the spectral analysis of groundwater level fluctuations in a numerical model of the upper Danube catchment in Germany, EGU General Assembly 2023, Vienna, Austria, 23–28 Apr 2023, EGU23-10001, https://doi.org/10.5194/egusphere-egu23-10001, 2023.


Hydrologic models often are used to estimate streamflows at ungauged locations for infrastructure planning. These models can contain a multitude of parameters that themselves need to be estimated through calibration. Yet multiple sets of parameter values may perform nearly equally well in simulating flows at gauged sites, making these parameters highly uncertain. Markov Chain Monte Carlo (MCMC) algorithms can quantify parameter uncertainties; however, this can be computationally expensive for hydrological models. Thus, it is important to select an MCMC algorithm that is effective (converges to the true posterior parameter distribution), efficient (fast), reliable (consistent across random seeds) and controllable (insensitive to the algorithms hyperparameters). These characteristics can be assessed through algorithm diagnostics, but current MCMC diagnostics mostly focus on evaluating convergence of an individual search process, not diagnosing general problems of the algorithms. Therefore, additional diagnostics are required to represent algorithms sensitivity to their hyperparameters and to compare their performance across problems.

Here, we propose new diagnostics to assess the effectiveness, efficiency, reliability and controllability of four MCMC algorithms: Adaptive Metropolis, Sequential Monte Carlo, Hamiltonian Monte Carlo, and DREAM(ZS). The diagnostic method builds off of diagnostics used to assess the performance of Multi-Objective Evolutionary Algorithms (MOEAs), and allows us to evaluate the sensitivity of the algorithms to their hyper-parameterization and compare their performance on multiple metrics, such as the Gelman-Rubin diagnostic and Wasserstein distance from the true posterior. We illustrate our diagnostics using the simple Hydrological Model (HYMOD) and several analytical test problems. This allows us to see which algorithms perform well on problems with different characteristics (e.g. known vs. unknown posterior shapes, uni- vs. multi-modality, low- vs. high-dimensionality). Since posterior shapes and modality are often unknown for hydrological problems, it is important to calibrate them with an MCMC algorithm that is robust across a wide variety of posterior shapes, and our new diagnostics allow for this identification.

How to cite: Kavianihamedani, H., Quinn, J., and Smith, J.: New Diagnostic Assessment of MCMC Algorithms Effectiveness, Efficiency, Reliability, and Controllability in Calibrating Hydrological Models, EGU General Assembly 2023, Vienna, Austria, 23–28 Apr 2023, EGU23-10326, https://doi.org/10.5194/egusphere-egu23-10326, 2023.

EGU23-10510 | ECS | Posters on site | HS3.5

Uncertainty Quantification in Hydrological and Environmental Modeling based on Polynomial Chaos Expansion 

Zoe Li, Pengxiao Zhou, and Maysara Ghaith

There are significant uncertainties associated with the estimates of model parameters in hydrological and environmental modeling. Such uncertainties could propagate within a modeling framework, leading to considerable deviation of the predicted value from its real value. Quantifying the uncertainties associated with model parameters could be computationally exhaustive and is still a daunting challenge to hydrological and environmental engineers. In this study, a series of Polynomial Chaos Expansion (PCE) methods, which have a significant advantage in computational efficiency, is developed to assess the propagation of parameter uncertainty. The proposed approaches were applied to two hydrological/environmental modeling case studies. The uncertainty quantification results will be compared with those from the traditional Monte Carlo simulation technique, to demonstrate the effectiveness and efficiency of the proposed approaches. This work will provide an efficient and reliable alternative to assess the impacts of the parameter uncertainties in hydrological and environmental modeling.

How to cite: Li, Z., Zhou, P., and Ghaith, M.: Uncertainty Quantification in Hydrological and Environmental Modeling based on Polynomial Chaos Expansion, EGU General Assembly 2023, Vienna, Austria, 23–28 Apr 2023, EGU23-10510, https://doi.org/10.5194/egusphere-egu23-10510, 2023.

EGU23-10644 | Orals | HS3.5

Impact of Model Parameters on Runoff Sensitivities in the Community Land Model: A Study on the Upper Colorado River Basin 

Yadu Pokhrel, Ahmed Elkouk, Lifeng Luo, Liz Payton, Ben Livneh, and Yifan Cheng

Understanding how land surface models (LSMs) partition precipitation into evapotranspiration and runoff under changing climate is key to improved future hydrologic predictions. This sensitivity is rarely tuned in land models, as evidenced by prevalent biases in the sensitivity of simulated runoff to precipitation and temperature change compared to observational estimates. Here, using the Community Land Model (CLM5) over the Colorado River basin (CRB), we investigate what the informative model parameters for runoff sensitivities are and how their choices affect the sensitivities under changing temperature and precipitation. We focus on the headwater region of the CRB, motivated by inconsistent model estimates of runoff sensitivities in the region and the critical need to better understand runoff changes to address the ongoing water crises in the CRB. In each headwater basin, a set of informative parameters were identified through parameter perturbations using “one at a time” method within an adaptive surrogate-based model optimization scheme (ASMO). Results of perturbations highlight that different parameter sets with similar performance (with respect to water-year discharge) provide very different runoff sensitivities to temperature and precipitation during the 1951-2010 period. Additionally, both precipitation and temperature sensitivities of runoff show sensitivity to similar parameters across the region. The most sensitive parameters control the conductance-photosynthesis relationship, soil surface resistance for direct evaporation, the partitioning of runoff into the surface and the subsurface component, and soil hydraulic properties. We show how the importance of each parameter varies through the parameter space and derive parameter estimates by maximizing the “fit to observed sensitivities” within the ASMO scheme. Our results provide key insights regarding parameters optimization to improve long-term hydrologic sensitivities in LSMs.

How to cite: Pokhrel, Y., Elkouk, A., Luo, L., Payton, L., Livneh, B., and Cheng, Y.: Impact of Model Parameters on Runoff Sensitivities in the Community Land Model: A Study on the Upper Colorado River Basin, EGU General Assembly 2023, Vienna, Austria, 23–28 Apr 2023, EGU23-10644, https://doi.org/10.5194/egusphere-egu23-10644, 2023.

EGU23-11129 | ECS | Orals | HS3.5

Pitfalls and Opportunities in the Use of Markov-Chain Monte Carlo Ensemble Samplers for Vadose Zone Model Calibration 

Giuseppe Brunetti, Jiri Simunek, Thomas Wöhling, and Christine Stumpp

Bayesian inference has become the most popular approach to uncertainty assessment in vadose zone hydrological modeling. By combining prior information with observations and model predictions, it became popular among hydrologists as it enables them to infer parameter posterior distributions, verify model adequacy, and assess the model's predictive uncertainty. In particular, the posterior distribution is frequently the variable of interest for modelers as it describes the epistemic uncertainty of model parameters conditioned on measurements. Gradient-free Markov-Chain Monte Carlo (MCMC) ensemble samplers based on Differential Evolution (DE) or Affine Invariant (AI) strategies have been used to approximate the posterior distribution, which is frequently anisotropic and correlated in vadose zone-related problems. However, a rigorous benchmark of different MCMC algorithms to provide guidelines for their application in vadose zone hydrological model calibration is still missing. In this study, we elucidate the behavior of MCMC ensemble samplers by performing an in-depth comparison of four samplers that use AI moves or DE-based strategies to approximate the target density. Two Rosenbrock distributions, and one synthetic and one actual case study focusing on the inverse estimation of soil hydraulic parameters using HYDRUS-1D, are used to compare algorithms in different dimensions. The analysis reveals that AI-based samplers are immune to affine transformations of the target density, which instead double the autocorrelation time for DE-based samplers. This behavior is reiterated in the synthetic scenario, for which AI-based algorithms outperform DE-based strategies. However, this performance gain disappears when the number of soil parameters increases from 7 to 16, with both samplers exhibiting poor acceptance rates, which are not improved by increasing the number of chains from 50 to 200 or by mixing different strategies.

How to cite: Brunetti, G., Simunek, J., Wöhling, T., and Stumpp, C.: Pitfalls and Opportunities in the Use of Markov-Chain Monte Carlo Ensemble Samplers for Vadose Zone Model Calibration, EGU General Assembly 2023, Vienna, Austria, 23–28 Apr 2023, EGU23-11129, https://doi.org/10.5194/egusphere-egu23-11129, 2023.

EGU23-13104 | Posters on site | HS3.5

Combining water and pesticide data with coupled surface/subsurface hydrological modeling to reduce its uncertainty. 

Claire Lauvernet, Claudio Paniconi, Emilie Rouzies, Laura Gatel, and Antoine Caisson

In small agricultural catchments over Europe, intensive use of pesticides leads to widespread contamination of rivers and groundwater, largely due to hydraulic transfers of these reactive solutes from plots to rivers. These transfers must be better understood and described in the watershed in order to be able to propose best management practices adapted to the catchment and to reduce its contamination. The physically based model CATHY simulates interactions between surface and subsurface hydrology and reactive solute transport. However, the high sensitivity of pesticide transfers to spatially heterogeneous soil properties induces uncertainty that should be quantified and reduced. In situ data on pesticides in a catchment are usually rare and not continuous in time and space. Likewise, satellite imagery can provide spatial observations of hydrologic variables but not generally of pesticide fluxes and concentrations, and at limited scale and time frequency. The objective of this work is to combine these 3 types of information (model, in situ data, images) and their associated errors with data assimilation methods, in order to reduce pesticide and hydrological variable uncertainties. The sensitivity to spatial density and temporal frequency of the data will be evaluated, as well as the coupled data assimilation efficiency, i.e., the effect of assimilating hydrological data on pesticide-related variables. The methods will be developed using a Python package, and compared/evaluated on twin experiments using virtual data that are however generated over a real vineyard catchment, in Beaujolais, France, in order to ensure realism of the experiments, data, and associated errors.

How to cite: Lauvernet, C., Paniconi, C., Rouzies, E., Gatel, L., and Caisson, A.: Combining water and pesticide data with coupled surface/subsurface hydrological modeling to reduce its uncertainty., EGU General Assembly 2023, Vienna, Austria, 23–28 Apr 2023, EGU23-13104, https://doi.org/10.5194/egusphere-egu23-13104, 2023.

EGU23-13589 | Orals | HS3.5 | Highlight

A comparison of sensitivity analysis methods and their value for comparing denitrification models 

Jesús Carrera and Jordi Petchamé

Numerous methods exist to gain insight on a model performance. Sensitivity analysis (SA) tools provide information on how a model output depends on model parameters. It is widely argued that SA is an essential tool for assessing model uncertainty. Here, I review global SA using Variogram Analysis of Response Surfaces (VARS), variance-based methods (Sobol' indices) and polynomial chaos expansion. For the comparison, we use a set of denitrification models, which are needed to assess the fate of nitrate, a global challenge. For each of the models, we assess the uncertainty and reliability of predictions, and the use of SA tools in designing experiments to reduce model uncertainty.

How to cite: Carrera, J. and Petchamé, J.: A comparison of sensitivity analysis methods and their value for comparing denitrification models, EGU General Assembly 2023, Vienna, Austria, 23–28 Apr 2023, EGU23-13589, https://doi.org/10.5194/egusphere-egu23-13589, 2023.

EGU23-13981 | Posters on site | HS3.5

Sensitivity analysis of water balance components under climate change in Saxony 

Niels Schuetze, Corina Hauffe, Sofie Pahner, Clara Brandes, Kan Lei, and Mellentin Udo

Catchments in Saxony differ regarding their physiographic characteristics (topography, geomorphology, geology, land use, soils, etc.) and their climatic boundaries. Both factors influence the flow behavior and the water balance components of catchments. How sensitive the water balance of catchments responds to current and future changes in the climatic boundary conditions is difficult to predict for each catchment and is associated with significant uncertainties. In Saxony, the pronounced drought in groundwater and surface water from 2018 to 2020 led to considerable regional problems in water supply and quality.

Schwarze et al. (2017) already investigated trends of the observed discharge and variables derived by hydrograph separation (e.g. baseflow) in a sensitivity study. In this presentation, we show the results of an extension of this analysis with current observation data until 2020. The following research questions are investigated: (i) Are catchments in Saxony already responding to changing climatic conditions? (ii) Which regions show the most significant changes in discharge behavior relative to other water balance components? (iii) What are the factors and drivers of changes in the water balance in Saxonian Catchments?

The study is based only on observational data for precipitation, temperature, and discharge in the period of 1961 to 2020 in Saxony. Break point analysis, hydrograph separation, and sensitivity analysis of hydrological signatures are performed for different sets of climate periods to quantify changes and elasticity of the water balance components. As a result, a decreasing trend for the mean flow can be seen for almost all 88 investigated and undisturbed catchments in Saxony. This trend is more pronounced in the mountainous regions than in the lowland of Saxony. Despite the slight increase in the mean annual precipitation, the temperature rise of about one °C from 1991-2020 compared to 1961-1990 in all catchments leads to an increasing evapotranspiration, reduced discharge, and groundwater recharge.


References:

Schwarze, R., Wagner, M. and Röhm, P. (2017). Adaptation strategies to climate change - Analysis of the sensitivity of water balance variables of Saxon gauge catchments with respect to the increased temperature level from 1988 onwards compared to the reference state of 1961-1987. Ed.: Saxon State Office for Environment, Agriculture and Geology (LfULG), 2017.

How to cite: Schuetze, N., Hauffe, C., Pahner, S., Brandes, C., Lei, K., and Udo, M.: Sensitivity analysis of water balance components under climate change in Saxony, EGU General Assembly 2023, Vienna, Austria, 23–28 Apr 2023, EGU23-13981, https://doi.org/10.5194/egusphere-egu23-13981, 2023.

EGU23-15689 | ECS | Posters on site | HS3.5

Adaptive Surrogate Likelihood Function for Blended Hydrologic Models 

Rezgar Arabzadeh, Jonathan Romero-Cuellar, Robert Chlumsky, James Craig, and Bryan Tolson

This abstract introduces a recipe for an adaptive general likelihood function and its application in the Bayesian epistemology of model parameters and structure uncertainty. The proposed methodology focuses on a special class of likelihood function, hereinafter mentioned as adaptive general likelihood function (AGL), which require a minimum priori assumptions/knowledge about the model residuals. The goal of the AGL is to characterize the model residuals independently from the inference framework in order to avoid incorrectly posterior estimation as a result of jointly inferencing of model and error model parameters. Mathematically, AGL is structured with a mixture of gaussian distributions joined with a first order autoregressive model, account for error model shape and autocorrelation respectively. To assess the AGL application, it is benchmarked with a formal likelihood function formulated by Schoups and Vrugt (2010) and evaluated for 24 Camels basins where the blended model has been deterministically applied with success (Chlumsky et al. 2022). Both approaches are compared with the residual’s empirical distributions using various statistical tests. The model used here is a blended hydrologic model introduced by Mai et al., (2021) which is a class of hydrologic models constructed by averaging (blending) various process options at the process flux level. This blending means calibration of the model functions to identify traditionally calibrated model process parameters as well as the weights utilized to average multiple process options. The model is deployed in the Raven hydrologic framework (Craig et al., 2020) and simultaneously both processes weights and parameters were calibrated deterministically for both high flows and low flows using PADDS algorithm (Asadzadeh and Tolson, 2013). This multi-objective calibration yields a suite of sample of calibrated blended models which is then utilized for error model development and testing. The tests results indicated a statistically comparable performance for both methods for t-distributed residuals highly skewed and long-tailed residual errors which are apparent in many hydrologic model residuals. Finally, to disjoin the epistemic Bayesian inference framework from the error model parameters, an epsilon-support vector regression (eps-SVR) is deterministically trained as a surrogate model to map the structural/parametric variability to residual error model parameters. The eps-SVR calibration performance metrics indicated high quality of surrogate for training set indicating promising performance.

How to cite: Arabzadeh, R., Romero-Cuellar, J., Chlumsky, R., Craig, J., and Tolson, B.: Adaptive Surrogate Likelihood Function for Blended Hydrologic Models, EGU General Assembly 2023, Vienna, Austria, 23–28 Apr 2023, EGU23-15689, https://doi.org/10.5194/egusphere-egu23-15689, 2023.

The applications of statistical learning theory (SLT) in hydrology have been either in the form of Support Vector Machines and other complexity regularized machine learning algorithms that learn and predict input-output patterns such as rainfall-runoff time series or of identifying optimal complexity of low order models such as k nearest neighbour models to predict hydrological time series such as streamflow. The regularization of model complexity offers a way to identify minimal complexity of a model to accurately predict a time series of interest. However such applications often assume that the modelled residual are independent of each other. This limits its application to conceptual hydrological models where residuals are often auto-correlated. This paper applies recent results of risk bounds for time series forecasting and SLT approaches to dynamical system identification to conceptual hydrological models, offering a means to identify optimal complexity of conceptual models and complexity regularised streamflow predictions based on it.

Basins from CAMELS data set are used to demonstrate the effect of regularizing the problem of hydrological model calibration on streamflow prediction over unseen data. SAC-SMA and SIXPAR (a lower order version of SACSMA) are used as model examples. Preliminary results show that prediction uncertainty bounds are narrower if regularization does not improve the performance of a calibrated model over unseen data. This effect is stronger in drier basins than in humid ones. Also, as expected, this effect is stronger when training data size is small and holds for both SACSMA and SIXPAR. 

How to cite: Pande, S. and Moayeri, M.: Complexity-based robust hydrologic prediction: extension of statistical learning theory to conceptual hydrological models, EGU General Assembly 2023, Vienna, Austria, 23–28 Apr 2023, EGU23-16039, https://doi.org/10.5194/egusphere-egu23-16039, 2023.

Due to the lack of accurate representation of hydrological processes and parameter measurements, physically-based hydrological models consist of many parameters requiring calibration to historical observations so that reliable hydrological inference can be obtained. With the increasing data availability from various sources (e.g., satellite remote sensing, climate model reanalysis), additional information on different water balance components (e.g., soil moisture, groundwater storage, etc.) are used to constrain and validate hydrological models, resulting in better model performance and parameter identifiability. However, given the emergence of multiple datasets for various water budget components, and their differences in temporal and spatial resolutions, the uncertainties in these datasets, when used together in driving and evaluating hydrological models, could introduce potential inconsistencies in water balance estimation and lead to a non-closure problem, which could result in potentially biased parameter and water balance component estimates in hydrological modelling.

This study addresses this issue by examining the impact of inconsistent water balance component data on model performance and exploring the importance of hydrologically consistent data for robust hydrological inference. The assessment is done using a Canadian Hydrologic-Land Surface Models named MESH in the Saskatchewan River basin, Canada over the period of 2002 to 2016. Seven precipitation datasets, seven evapotranspiration products, one source of water storage data – GRACE from three different centers using spherical harmonic and mass concentration approaches – and observed discharge data from hydrometric stations are selected as the input and evaluation data. A reference water balance dataset is developed to optimally combine all available data sources for each water balance component and to obtain water balance closure though a constrained Kalman filter data assimilation technique. The MESH model is rerun with this reference dataset and results are assessed and compared to different combinations of input and evaluation data. Preliminary results reveal great variations of model performance in the water balance components when using different combinations of input and evaluation data and results of using the reference dataset is expected to have less biased water balance component estimates. This study aims to highlight the necessity of using a set of hydrologically consistent data before any model runs and model evaluation.

How to cite: Wong, J. S., Yassin, F., and Famiglietti, J. S.: Does hydrologically consistent data improve model performance? The importance of closing the water balance of input and evaluation data, EGU General Assembly 2023, Vienna, Austria, 23–28 Apr 2023, EGU23-16924, https://doi.org/10.5194/egusphere-egu23-16924, 2023.

EGU23-529 | ECS | Posters on site | HS3.8

How consistent are citizens in their observation of temporary streams? 

Mirjam Scheller, Ilja van Meerveld, Sara Blanco, and Jan Seibert

Half of the global river network dries up from time to time. However, these so-called temporary streams are not represented well in traditional gauging networks. One reason is the difficulty in measuring zero flows. Therefore, new approaches, such as low-cost sensors and citizen science, have been developed in the past few years. CrowdWater is such a citizen science project, in which citizens can submit observations of the state of temporary streams with the help of a smartphone app. The flow state of the stream is assessed visually and assigned to one of the following six classes: dry streambed, wet/damp streambed, isolated pools, standing water, trickling water, and flowing.

To determine the consistency of observations by different citizens, we asked questions regarding the flow state to more than 1200 people, who passed by temporary streams of various sizes in Switzerland and Germany. The survey consisted of 19 multiple-choice questions (with 14 being yes/no questions), three rating scale questions, two open-ended questions and five demographic questions, and was available in German and English. Most participants were interested in the topic and happy to participate. We estimate that about 80% of the people we approached participated in the survey.

Over 90% of the participants were native German speakers. When the expert assessment of the flow state was dry streambed, isolated pools or flowing water multiple surveys (4-6) could be done for up to four streams. Other states (standing water and trickling water) were assessed at only one stream. The surveys covered all six flow state classes: dry streambed: 4 times with a total of 244 participants; wet/damp streambed: 3 times with 179 participants; isolated pools: 5 times with 265 participants; standing water: 3 times with 177 participants; trickling water: 2 times with 106 participants; flowing: 6 times with 297 participants.

The answers of the participants were consistent for the driest and wettest states (dry streambed and flowing water) but differed for the in-between states. For example, half of the participants at one stream chose the wet streambed category, while the other half decided on standing water. This suggests that visual assessments of flow states for multiple classes are more complicated than could be assumed initially, but still give additional information beyond the flowing or dry categories. Above all, it provides information for streams that otherwise would be unmonitored.

How to cite: Scheller, M., van Meerveld, I., Blanco, S., and Seibert, J.: How consistent are citizens in their observation of temporary streams?, EGU General Assembly 2023, Vienna, Austria, 23–28 Apr 2023, EGU23-529, https://doi.org/10.5194/egusphere-egu23-529, 2023.

Floods are one of the most common and catastrophic natural events worldwide, making studies on the magnitude, severity and frequency of past events essential for risk management. On this wise, remote sensing techniques have been widely used in flooding diagnoses, where Sentinel-2 images are one of the main resources employed in surface water mapping. These studies have developed single band, spectral indexes and machine learning-based methods, which have typically been applied to large water bodies. However, one of the issues in identifying water surfaces remains their size. When water surfaces have sizes close to the spatial resolution of satellite images, they are difficult to detect and map. To improve remotely sensed images' spatial resolution, an algorithm for super-resolving imagery has been developed, giving good results, especially in areas covered by agricultural land with large uniform surfaces. Although this method has proved effective on Sentinel-2 images, it has not been tested for enhancing flood mapping. Thus, flood mapping is still considered an open research topic, as no suitable method has been found for all datasets and all conditions. Consequently, the present study has developed a methodology for flood delineation in small-sized water bodies. The method leverages the advantages of Sentinel-2 MSI data, image preprocessing techniques, thresholding algorithms, spectral indexes and an unsupervised classification method. Thus, this framework includes a) the generation of super-resolved Sentinel-2 images, b) the application of seven spectral indexes to highlight flood surfaces and evaluation of their effectiveness, c) the application of fifteen methods for flood extent mapping, including fourteen thresholding algorithms and one unsupervised classification method and, d) the evaluation and comparison of the performance of flood mapping methods. The technique was applied in the Carrión River, located in the Duero basin, province of Palencia, Spain. This river is classified as a narrow water body, which presents recurrent flood events due to its morphometric characteristics, fluvial dynamics, and land uses. The results obtained show optimal performances when highlighting flood zones by combining AWE spectral indices with methods such as those of Huang and Wang, Li and Tam, Otsu, and momentum-preserving thresholding algorithms and EM cluster classification.

How to cite: Lombana, L.: Flood mapping in small-size water rivers: Analysis of spectral indexes using super-resolved Sentinel-2 images, EGU General Assembly 2023, Vienna, Austria, 23–28 Apr 2023, EGU23-690, https://doi.org/10.5194/egusphere-egu23-690, 2023.

EGU23-2029 | ECS | Posters on site | HS3.8

Showcasing the Potential of Crowd-sourced Observations for Flood Model Calibration 

Antara Dasgupta, Stefania Grimaldi, Raaj Ramsankaran, Valentijn Pauwels, and Jeffrey Walker

Floods are one the costliest natural disasters, having caused global economic losses worth over USD 51 million and >6000 fatalities just in 2020. Hydrodynamic modelling and forecasting of flood inundation requires distributed observations of flood depth and extent to enable effective evaluation and to minimize uncertainties. Given the decline of in situ hydrological monitoring networks, Earth Observation (EO) has emerged as a valuable tool for model calibration and evaluation in data scarce regions, as it provides synoptic observations of flood variables. However, low temporal frequencies and the (currently) instantaneous nature of EO, still limits the ability to characterize fast moving floods. The concurrent rise of smartphones, social media, and internet access has recently led to the emerging discipline of citizen sensing in hydrology, which has the potential to complement real-time EO and in situ flood observations. Despite this, methods to effectively utilise crowd-sourced flood observations to quantitatively assess model performance are yet to be developed. In this study the potential of crowd-sourced flood observations for hydraulic model evaluation is demonstrated for the first time. The channel roughness for the hydraulic model LISFLOOD-FP was calibrated using just 32 distributed high-water marks and wrack marks collected by the community and provided by the Clarence Valley Council for the 2013 flood event. Since the timings of acquisition of these data points were unknown, it was assumed that these provide information on the peak flow. Maximum model simulated and observed water levels were thus compared at observation locations for each model realization, and errors were quantified through the root mean squared error (RMSE) and the mean percentage difference (MPD), respectively. Peak flow information was also extracted from the 11 available hydrometric gauges along the Clarence River and used to constrain the roughness parameter, to enable the quantification of value addition from the citizen sensed observations. Identical calibrated parameter values were obtained for both data types resulting in a mean RMSE value of ∼50 cm for peak flow simulation across all gauges. Outcomes from this study demonstrate the utility of uncertain crowd-sourced flood observations for hydraulic flood model calibration in ungauged catchments.

How to cite: Dasgupta, A., Grimaldi, S., Ramsankaran, R., Pauwels, V., and Walker, J.: Showcasing the Potential of Crowd-sourced Observations for Flood Model Calibration, EGU General Assembly 2023, Vienna, Austria, 23–28 Apr 2023, EGU23-2029, https://doi.org/10.5194/egusphere-egu23-2029, 2023.

Due to the influence of climate change, the range of change in precipitation and regional variation have increased over the past 10 years, and the occurrence of local drought is increasing. The existing water supply and demand analysis system in Korea is produced by each management department, so there are limitations in data collection and decision-making on water distribution. For efficient water management, integration of water information should be prioritized. Based on this, actual water use monitoring, evaluation and water shortage prediction technology can be developed.

In this study, the DB of water-cycle system was constructed focusing on domestic water and transfer function model was developed. DB construction was classified into 3 stages (pre-preparation/investigation and analysis/application and evaluation), and the first stage was defined as the concept of water inflow/delivery/outflow from the urban perspective and the current status of data by point was identified. In the second stage, research directions were established through expert consultation and undisclosed data were collected through cooperation with related organizations. The third stage was applied to Gongju-si and Nonsan-si in Korea, which are the study sites, and the supplementations were reviewed. A transfer function model was developed using the constructed DB. It is expected that it will be possible to construct a useful transfer function model when analyzing the performance index by learning the outflow of the Singwan sewage treatment equipment based on the water intake amount of the Hyeondo intake station and confirming the autocorrelation of the non-significant residual.

In the future, additional considerations (outlet location, service area, and sewage treatment area subdivision) are required in national reports on river basins and droughts, and precipitation is also considered as a major input factor for outflow.


(This work was supported by a grant from the Korea Environmental Industry & Technology Institute (KEITI), funded by the Ministry of Environment (ME) of the Republic of Korea (2022003610003))

How to cite: Lee, S. and Lee, S.: Construction of integrated DB for domestic water-cycle system and development of transfer function model, EGU General Assembly 2023, Vienna, Austria, 23–28 Apr 2023, EGU23-2201, https://doi.org/10.5194/egusphere-egu23-2201, 2023.

EGU23-2493 | ECS | Posters virtual | HS3.8

pyRCIT - A rainfall nowcasting tool based on a synthetic approach 

Ting He and Thomas Einfalt

Operating precise rainfall nowcasting with the help of observations from weather radar can give an effective warning before hydrometerological hazards occur. A common radar based rainfall nowcasting procedure includes: rain cell identification and tracking, spatial and temporal analysis of rain cell, rainfall nowcasting and nowcasting results evaluation.

In this study, an open source rainfall nowcasting tool - pyRCIT is designed and developed which is purely based on qualified weather radar data. It have four main modules: (1) weather radar data processing; (2) rainfall spatial and temporal analysis; (3) deterministic rainfall nowcasting and (4) ensemble rainfall nowcasting. In pyRCIT, rainfall is firstly obtained from weather radar data sets with a series of data quality adjustment procedures. Secondly, rain cells are identified and their spatial and temporal properties are analyzed by the RCIT algorithm. Thirdly, deterministic rainfall nowcasting is operated following the extrapolating schema using lagrangian persistence and semi-lagrangian methods separately, nowcasting results are evaluated by the object oriented verification method - SAL (Structure-Amplitude-Location). Finally, nowcasting uncertainties are analyzed by the random field theory and the quantified uncertainties are implemented as the aid of ensemble rainfall nowcasting.

Nowcasting quality of pyRCIT are evaluated by comparing it with some main rainfall nowcasting methods: TREC, SCOUT and pySTEPS. Comparative results showed that deterministic nowcasting score of pyRCIT were higher than the TREC and SCOUT methods but is nearly equal to the score of pySTEPS, for the ensemble nowcasting, score of pyRCIT is higher than all three methods for the selected cases. The pyRCIT can serve as the basis for further hydro-meteorological applications such as spatial and temporal analysis of rainfall events and flash flood forecasting.

The code of pyRCIT is available at https://github.com/greensubriane/PYRCIT.git

How to cite: He, T. and Einfalt, T.: pyRCIT - A rainfall nowcasting tool based on a synthetic approach, EGU General Assembly 2023, Vienna, Austria, 23–28 Apr 2023, EGU23-2493, https://doi.org/10.5194/egusphere-egu23-2493, 2023.

EGU23-5818 | Posters on site | HS3.8

Application of multimodal deep learning using radar and water level data for water level prediction 

Seongsim Yoon, Seyong Kim, and Sangmin Bae

In general, water level prediction models using deep learning techniques have been developed using time-series water level observation data from upstream water level stations and target water level stations even though many of physical data are necessary to predict water level. The changes of the water level are greatly affected by rainfall in the basin, therefore rainfall information is needed to more accurately predict the water level. In particular, radar data has the advantage of being able to directly acquire the amount of rainfall occurring within a watershed. This study aims to develop the multimodal deep learning model to predict the water level using 2D grid radar rainfall data and 1D time-series water level observation data. This study proposed two multimodal deep learning models which have different structures. Both multimodal deep learning models predict the water level by simultaneously using the observed water level data up to the present time and the radar rainfall data that affects the water level in the future. The first proposed model consists of a deep learning network that links 2D Average Pooling (AvgPool2D), which compresses 2D radar data to 1D data, and Long Short-Term Memory (LSTM), which predicts 1D time series water level data. The second proposed model consists of a deep learning network that predicts water levels by linking Conv2DLSTM and LSTM, which can reflect the characteristics of 2D radar data without deformation.  The two proposed multimodal deep learning models were learned and evaluated in the upper basin of Hantan River. In addition, it was compared with the results of single-modal LSTM using only water level data. There are three water level stations in the study area, and the objective was to predict the water level of the downstream station up to 180 minutes in advance. For learning and verification of the deep learning model, 10-minute water level and radar rainfall data were collected from May 2019 to October 2021. For the radar data used as input, the grid data included in the target watershed were extracted and used among composite radar data with a resolution of 1 km operating by Ministry of Environment. As a result of evaluating each learned deep learning model, two multimodal models had higher prediction accuracy than the single-modal using only water level data. In particular, second proposed model (Conv2dLSTM+LSTM) had better predictive performance than first proposed model (AvgPool2D+LSTM) at the time of the sudden rise in water level due to rainfall.

Acknowledgments

Research for this paper was carried out under the KICT Research Program (project no. 202200175-001, Development of future-leading technologies solving water crisis against to water disasters affected by climate change) funded by the Ministry of Science and ICT.

How to cite: Yoon, S., Kim, S., and Bae, S.: Application of multimodal deep learning using radar and water level data for water level prediction, EGU General Assembly 2023, Vienna, Austria, 23–28 Apr 2023, EGU23-5818, https://doi.org/10.5194/egusphere-egu23-5818, 2023.

EGU23-7700 | ECS | Orals | HS3.8

Improved flush detection and classification in combined sewer monitoring 

Markus Pichler and Dirk Muschalla

During rain events, rainwater reaches the combined sewer system and causes additional hydraulic and pollutant load. Due to the limited capacity of the sewer system and the wastewater treatment plant, overflow structures are constructed to reduce the discharge and thus create a potential hazard for the environment. For optimal management of these structures, it is necessary to know the runoff and pollutant load of the events and their distribution over time. When these distributions have a significant peak, they are often referred to as a flush, the best-known phenomenon being the first flush at the beginning of a rainfall event. This knowledge can be used for the design of retention facilities and the calibration of sewer models. The flush phenomena are mainly caused by the erosion of contaminants on the surface as well as the remobilisation of sediments in the sewer network.

Although many papers have investigated the first flush, no common pattern for the occurrence of these flushes has been identified. While the concentration of the flushes in rainwater sewers can be measured directly, the rain flushes in combined sewers are mixed with more polluted wastewater, which leads to a reduction in signal strength.

The sensor site for the used measurement data is located in a combined sewer overflow in the western part of Graz, Austria with a catchment area of 460 ha, consisting mainly of residential areas and with about 19500 inhabitants.

This work aims to separate and classify pollution flush signals from rainfall events in combined sewer systems to better understand the relationship between these signals and rainfall event characteristics.

For this reason, the continuous hydraulic and pollution data are first analysed to determine the representative dry weather contribution. By subtracting the dry weather contribution from the combined wastewater volume and the mass flux, the stormwater contribution and thus the flushes can be estimated. In addition, automatic event detection of combined sewer events was done.

Next, the wet weather events are classified by clustering the stormwater runoff-induced pollutant distribution (flush signals) and the event parameters. For the clustering of the temporal pollutant load distribution of events of different duration, the events are normalised by the mass-volume curves. To obtain the best possible clustering result, the dimension of the mass-volume curves is reduced by a principal component analysis. Different clustering methods, such as partitioning or hierarchical methods, are applied and compared.

How to cite: Pichler, M. and Muschalla, D.: Improved flush detection and classification in combined sewer monitoring, EGU General Assembly 2023, Vienna, Austria, 23–28 Apr 2023, EGU23-7700, https://doi.org/10.5194/egusphere-egu23-7700, 2023.

EGU23-8802 | Orals | HS3.8

Improving Early Warning System for Urban Flooding in Chinese Mega Cities using Advanced Active Phased Array Radar 

Dehua Zhu, Yunqing Xuan, Richard Body, Dongming Hu, and Xiaojun Bao

This two-year trial aims to bring together academics and industrial partners from UK and China to conduct a pilot study on the use of the active phased array radar to provide early urban flood warnings for Chinese mega cities, which facing challenging urban flood issues. This is the first in the world of cascade modelling using the cutting-edge active phase array radar (APRA) to provide rainfall monitoring and nowcasting information for a real-time two-dimension urban drainage model. The collaboration built up by this project and the first-hand experiment data will serve well to further catalyse the taking-up of state-of-the-art weather radars for urban flood risk management, and to tackle the innovation in tuning the radar technology to fit the complex urban environment as well as advanced modelling facilities that are designed to link the observations, providing decision making support to the city government. Recommendations for applying high spatial-temporal resolution precipitation data to real-time flood forecasting on an urban catchment are provided and suggestions for further investigation are discussed.

How to cite: Zhu, D., Xuan, Y., Body, R., Hu, D., and Bao, X.: Improving Early Warning System for Urban Flooding in Chinese Mega Cities using Advanced Active Phased Array Radar, EGU General Assembly 2023, Vienna, Austria, 23–28 Apr 2023, EGU23-8802, https://doi.org/10.5194/egusphere-egu23-8802, 2023.

EGU23-9494 | Orals | HS3.8

A Nonstationary Multivariate Framework for Modelling Compound Flooding 

Yunqing Xuan and Han Wang

 Flooding is widely regarded as one of the most dangerous natural hazards worldwide. It often arises from various sources either individually or combined such as extreme rainfall, storm surge, high sea level, large river discharge or the combination of them. However, the concurrence or close succession of these different source mechanisms can lead to compound flooding, resulting in larger damages and even catastrophic consequences than those from the events caused by the individual mechanism. Here, we present a modelling framework aimed at supporting risk analysis of compound flooding in the context of climate change, where nonstationary joint probability of multiple variables and their interactions need to be quantified.The framework uses the Block Bootstrapping Mann-Kendall test to detect the temporal changes of marginals, and the correlation test associated with the Rolling Window method to estimate whether the correlation structure varies with time; it then evaluates various combinations of marginals and copulas under stationary and nonstationary assumptions. Meanwhile, a Bayesian Markov Chain Monte Carlo method is employed to estimate the time-varying parameters of copulas.

How to cite: Xuan, Y. and Wang, H.: A Nonstationary Multivariate Framework for Modelling Compound Flooding, EGU General Assembly 2023, Vienna, Austria, 23–28 Apr 2023, EGU23-9494, https://doi.org/10.5194/egusphere-egu23-9494, 2023.

EGU23-9546 | ECS | Orals | HS3.8

DeepRain: a separable residual convolutional neural algorithm with squeeze-excitation blocks for rainfall nowcasting 

Ahmed Abdelhalim, Miguel Rico-Ramirez, and Dawei Han

Precipitation nowcasting is critical for mitigating the natural disasters caused by severe weather events. State-of-the-art operational nowcasting methods are radar extrapolation techniques that calculate the motion field from sequential radar images and advect the precipitation field into the future. However, these methods assume the motion field's invariance, and prediction is based solely on recent observations, rather than historical radar sequences. To overcome these limitations, deep learning methods such as convolutional neural networks have recently been applied in radar rainfall nowcasting. Although, the promising progress of using deep learning techniques in rainfall nowcasting, these methods face some challenges. These challenges include producing blurry predictions, inaccurate forecasting of high rainfall intensities and degradation of the prediction accuracy with rising lead times. Therefore, the aim of this study is to develop a more performant deep-learning model capable of overcoming these challenges and preventing information loss in order to produce more accurate nowcasts. DeepRain is a convolutional neural network that uses a spatial and channel Squeeze & Excitation Block after each convolutional layer, local importance-based pooling, and residual connections to improve model performance. The algorithm is trained and validated using the UK Met Office's radar rainfall mosaic, which is produced by the UK Met Office Nimrod system. Using verification metrics, the model's predictive skill is compared to another deep learning model and a range of extrapolation methods.

Keywords: deep learning; rainfall nowcasting; radar; convolutional neural networks; Squeeze-and-Excitation

How to cite: Abdelhalim, A., Rico-Ramirez, M., and Han, D.: DeepRain: a separable residual convolutional neural algorithm with squeeze-excitation blocks for rainfall nowcasting, EGU General Assembly 2023, Vienna, Austria, 23–28 Apr 2023, EGU23-9546, https://doi.org/10.5194/egusphere-egu23-9546, 2023.

EGU23-9588 | ECS | Orals | HS3.8

Comparative performance of recently introduced Deep Learning models for Rainfall-Runoff Modelling 

Yirgalem Gebremichael, Gerald Corzo Perez, and Dimitri Solomatine

Machine learning and specifically deep learning has been applied in solving numerous hydrology related problems in the past. Furthermore, extensive research has been done on the evaluation and comparison of performances of different Machine learning techniques applied in solving hydrology related problems. In this research, the possible reasons behind these performance variations are being assessed. The performance of recently introduced deep learning techniques for rainfall-runoff modelling are being evaluated by looking in to the possible modelling set-up and training procedures. Therefore, model set-up and training procedures such as: normalization techniques, input variable selection (feature selection), sampling techniques, model complexity, optimization techniques and random initialization of weights are being examined closely in order to improve the performances of different deep learning techniques for rainfall-runoff modelling. As a result, this study is trying to answer whether these factors have significant effect on the model accuracy.

The experiments are being conducted on different deep learning models such as: LSTMs, GRUs and MLPs as well as non-deep learning models such as: XGBoost, Random Forest, Linear Regression and Naïve models. Deep learning frameworks including TensorFlow and Keras are being implemented on Python. For better generalization, study areas from three different climatic zones namely: Bagmati catchment in Nepal, Yuna catchment in Dominican Republic and Magdalena catchment in Colombia are chosen to implement this experimental research. Additionally, in situ meteorological and stream flow data are being used for the rainfall-runoff modelling.

The preliminary model results show that model performances in case of Bagmati catchment are higher as compared to the other catchments. The LSTMs and MLPs are performing good with NSE values of 0.71 and 0.72 respectively. Most importantly, the linear regression model was outperforming the other models with NSE up to 0.75 in case of considering 6 days lagged rainfall input. This implies the relationship between daily rainfall and runoff data from Bagmati catchment may not be as complex. On the contrary, the 3-hourly data from Yuna catchment shows results with lower values for the performance metrics. This may be an indication of more complex relationships within the Yuna catchment.

This research provides key elements of the modelling process, especially in setting up and training deep learning models for rainfall-runoff modelling. The comparative analysis performed here, provides a basis of performance variations on different basins. This work contributes to the experiences in understanding machine learning requirements for different types of river basins.

How to cite: Gebremichael, Y., Corzo Perez, G., and Solomatine, D.: Comparative performance of recently introduced Deep Learning models for Rainfall-Runoff Modelling, EGU General Assembly 2023, Vienna, Austria, 23–28 Apr 2023, EGU23-9588, https://doi.org/10.5194/egusphere-egu23-9588, 2023.

EGU23-10491 | ECS | Posters on site | HS3.8

Addressing discoverability, trust and data quality in peer-to-peer distributed databases for citizen science 

Julien Malard-Adam, Sheeja Krishnankutty, Anandaraja Nallusamy, and Wietske Medema

Peer-to-peer distributed databases show promise for lowering the barrier to entry for citizen science projects. These databases, which do not require a centralised server to store and exchange data, instead use participants’ devices (phones or computers) to store and transfer data directly between project participants. This offers concrete advantages in terms of avoiding usually very costly and time-consuming server maintenance for the research team, as well as improving data access and sovereignty for the participating communities.

However, several technical challenges remain to the routine use of distributed databases in citizen science projects. In particular, indexing data and discovering peers who hold data of interest or from the same project; managing safety, trust and permissions; and ensuring data quality all without relying on a central server to perform these functions requires a rethinking of the standard paradigms of database and user account management.

This presentation will give a brief overview of the Constellation software for distributed scientific databases before presenting several novel approaches (concentric recursive data search, user network-centric trust, and multiple data quality verification layers) it has adopted to respond to the above-mentioned challenges. Examples of concrete applications of Constellation for data sharing in the fields of hydrology and agronomy will be included.

How to cite: Malard-Adam, J., Krishnankutty, S., Nallusamy, A., and Medema, W.: Addressing discoverability, trust and data quality in peer-to-peer distributed databases for citizen science, EGU General Assembly 2023, Vienna, Austria, 23–28 Apr 2023, EGU23-10491, https://doi.org/10.5194/egusphere-egu23-10491, 2023.

Population growth and economic development increase water demand, while human activities degrade the quality of available water resources along the adjacent rivers. The U.S. state of Alabama has been suffering from floods causing the degraded water quality by scouring pollutants into the water. In recent decades, Alabama has been experiencing persistent precipitation deficits and unusual severe droughts, resulting in limited economic and water-based recreation activities within downstream states. Since 2020, The COVID-19 pandemic aroused a series policies like quarantine and lock down, which slowed down the economic development and reduced chances of people going outside to witness the water pollution accidents.

In this study, we conducted a sentiment analysis of over 9,900 water pollution complaints (2012-2020) from residents in Alabama. Overall, it is found that complaints are dominated by negative and objective complaints no matter what extremes events or environmental accidents. Results show that sentiment alteration during climate extremes and COVID period was detected. Potential causes of the sentimental alteration in the public water pollution complaint reports were explored. Results show more complaints during summer seasons, which can be explained as higher temperature and intensive precipitation at that time. More complaints are distributed in the counties that are higher socioeconomically developed, to be more specific, counties with more population and higher GDP level. The severity of antecedent extreme events can affect the sentiment of environmental pollution complaints related to on-going extreme events due to limited human judgements. Key words extracted from the complaints point out the pollution resources and locations, which provide important clues from local government to resolved problems.

This study provides an example of how unstructured data such as public complaints can be used as a technology to improve the water pollution and public health monitoring with the help of big data and artificial intelligent technologies. While the results of this study were based water pollution complaints from residents of Alabama state, it is applicable to other environmental pollutions (like air and land) and other regions with available long-term textual data.


How to cite: Liu, A. and Kam, J.: Observed Sentimental Alteration in the Public Water Pollution Complaints during Climatic Extremes and the COVID-19 Pandemic, EGU General Assembly 2023, Vienna, Austria, 23–28 Apr 2023, EGU23-10886, https://doi.org/10.5194/egusphere-egu23-10886, 2023.

EGU23-10937 | ECS | Orals | HS3.8

Feature engineering strategies based on GIS and the SCS-CN method for improving hydrological forecasting in a complex mountain basin 

María José Merizalde, Paul Muñoz, Gerald Corzo, and Rolando Célleri

Hydrological modeling and forecasting are important tools for adequate water resources management, especially in complex systems (basins) characterized by high spatio-temporal variability of runoff driving forces, landscape heterogeneity, and insufficient hydrometeorological monitoring. Yet, during the last decades, the use of machine learning (ML) techniques has become popular for runoff forecasting, and the current research trend focuses on performing feature engineering (FE) strategies aimed both at improving forecasting efficiencies and allowing model interpretation. Here, we employed three ML techniques, the Random Forest (RF) algorithm, traditional Artificial Neural Networks (ANN), and specialized Long-Short Term Memory (LSTM) networks, assisted by FE strategies for developing short-term runoff forecasting models for a 3300-km2 complex basin representative of the tropical Andes of Ecuador. We exploited the information of two readily-available satellite products, the IMERG and GSMaP to overcome the absence of ground precipitation data, and the FE strategies proposed were based on GIS and the Soil Conservation Service Curve Number (SCS-CN) method to synthesize the use of land use and land cover, soil types, slope, among other hydrological concepts. To assess the forecasting improvement, we contrasted a set of efficiency metrics calculated both for the developed specialized models and for referential models without the application of  FE strategies. In terms of results, we were first able to develop accurate forecasting models by exploiting precipitation satellite data powered by ML techniques with different complexity levels. Second, the referential forecasting models reached efficiencies (Nash-Sutcliffe efficiency, NSE) varying from 0.9 (1-hour lead time) to 0.5 (11-hours), which were comparable for the RF, ANN, and LSTM techniques. Whereas for the specialized models, we found an improvement of 5–20 % in NSE-values for all lead times. The proposed methodology and the insights of this study provide hydrologists with new tools for developing short-term runoff forecasting systems in complex basins otherwise limited by data scarcity and model complexity issues.

How to cite: Merizalde, M. J., Muñoz, P., Corzo, G., and Célleri, R.: Feature engineering strategies based on GIS and the SCS-CN method for improving hydrological forecasting in a complex mountain basin, EGU General Assembly 2023, Vienna, Austria, 23–28 Apr 2023, EGU23-10937, https://doi.org/10.5194/egusphere-egu23-10937, 2023.

EGU23-11217 | ECS | Posters on site | HS3.8

International Natural Disasters Research and Analytics (INDRA) Reporter: A multi-platform Citizen Science Framework and Tools for Disaster Risk Reduction 

Manabendra Saharia, Dhiraj Saharia, Shreya Gupta, and Satyakam Singhal

With pervasive access to mobile phones with powerful sensors and processors, crowdsourcing has become increasingly prominent as a means of supplementing data obtained from traditional sensors. But there is a lack of a comprehensive application programming interface (API)-based framework that can collect data from multiple sources through user-friendly workflows. INDRA Reporter has been designed with a mobile-first approach geared towards real-time applications and an emphasis on user-interface/user-experience (UI/UX) to maximize collection of higher fidelity data. This paper details a comprehensive suite of tools for active and passive crowdsensing of natural hazards such as floods, storm, lightning, rain etc. Currently the framework includes mobile applications, telegram chatbots, and a publicly available dashboard. Most citizen science applications in flooding are quantitative, which makes it difficult for non-specialists to provide accurate scientific information along with providing user insight into prevailing situation within a single coherent workflow. It is imperative that workflows targeting dangerous situations emphasize on speed and visual acuity while collecting critical data.  The main objective of INDRA is to provide a simple and intuitive way of collecting qualitative and quantitative data from people. Since traditional data collection through ground-based sensors and satellites suffer from various limitations, measurements collected using INDRA will supplement these sources and form the basis of developing multi-sensor data products. We are reporting the development and release of four components of the framework – a) open INDRA API b) INDRA Reporter mobile application, c) Telegram Chat bot, and d) web dashboard. The API has been kept extensible in order to expand the data collection to other hydrologic and meteorological phenomenon.

How to cite: Saharia, M., Saharia, D., Gupta, S., and Singhal, S.: International Natural Disasters Research and Analytics (INDRA) Reporter: A multi-platform Citizen Science Framework and Tools for Disaster Risk Reduction, EGU General Assembly 2023, Vienna, Austria, 23–28 Apr 2023, EGU23-11217, https://doi.org/10.5194/egusphere-egu23-11217, 2023.

EGU23-11419 | ECS | Posters on site | HS3.8

Spatio-temporal analysis of storm surge in the Korean Peninsula 

Jung-A Yang

The Korean Peninsula (KP) located in the Northwest Pacific have different topographic features. West coast of the KP has large tidal variations. If storm surge occurred at high tide, the west coast is vulnerable to flooding. The south coast has a complex coastline with hundreds of islands. Its complex topography can amplify storm surge height (SSH) and it also makes it difficult to conduct numerical modeling for storm surge. Moreover, as the KP is located in the pathways of typhoons, it has been affected by an average of three typhoons every year. The KP has actually suffered from storm surge-induced disaster several times in the past. In order to plan efficient and effective countermeasures against storm surge disasters, it is required to identify the vulnerability of coastal regions in the KP. Therefore, this study quantitatively analyzed the frequency and cause of occurrence of storm surges that occurred along the Korean coast in the past.

First, this study collected observed tidal data at 48 tide stations which are installed along the coast of the KP and performed a hormonic analysis on the observed tidal data to build a database of SSH information that occurred along the coast of the KP from 1979 to 2021. Next, the cause of the storm surge was evaluated based on the occurrence time of the high-level SSH. If the storm surge occurred in winter season, it was treated as being caused by an extra-tropical cyclone, and if in summer season, by and tropical cyclone. Lastly, storm surge vulnerable areas were assessed based on frequency and level of the SSH. To this end, the coast of the KP was divided into five zones: the northwest coast, the southwest coast, Jeju island, the southeast coast and northeast coast. The frequency of the high-level SSH generated in those zones was calculated, and areas where storm surge occurred a lot were selected as vulnerable areas.

As a result of the study, it was found that the high-level SSH with more than 1 m in the KP are caused by tropical cyclone in summer, and the area most vulnerable to storm surge is the southeast coast.

However, the observed tidal data used in this study has a limitation in that the collection period differs depending on the zone: the observation period is longer for the southeast coast than for the southwest coast. Looking at the paths of past typhoons, many typhoons passed through the west coast, so the possibility that the southwest coast would have been judged to be more vulnerable than the southeast coast cannot be ignored if the observed tidal data for the southwest coast were more abundant. In addition, since storm surge is phenomenon that is affected not only by meteorological conditions but also by topographic conditions (e.g., complexity of coastline, water depth, etc.), spatio-temporal analysis of storm surge by topographic conditions is going to be conducted through future research.


Acknowledgement

This work was supported by the National Research Foundation of Korea grant funded by the Korea government(MSIT) (No. 2022R1C1C2009205).


How to cite: Yang, J.-A.: Spatio-temporal analysis of storm surge in the Korean Peninsula, EGU General Assembly 2023, Vienna, Austria, 23–28 Apr 2023, EGU23-11419, https://doi.org/10.5194/egusphere-egu23-11419, 2023.

EGU23-12475 | Posters on site | HS3.8

Comparing different radar-raingauge precipitation merging methods for Tuscany region 

Rossano Ciampalini, Andrea Antonini, Alessandro Mazza, Samantha Melani, Alberto Ortolani, Ascanio Rosi, Samuele Segoni, and Sandro Moretti

Radar-based rainfall estimation represents an effective tool for hydrological modelling. Nevertheless, this data type is subject to systemic and natural perturbations that need to be considered before to use it. Because of that and to improve data quality, corrections based on raingauge observations are frequently adopted. Here, we compared the efficacy of different radar-raingauge merging procedures over a regional raingauge-radar network focusing on a selected number of rainfalls events.
We adopted the methods: 1) Kriging with External Drift (KED) interpolation (Wackernagel 1998), 2) Probability-Matching-Method (PMM, Rosenfeld et al., 1994), and 3) a kriging mixed method exploiting the Conditional Merging (CM) process (Sinclair-Pegram, 2005) based on elaborations available at DPCN (Italian National Civil Protection Department). These methods have been applied on the Tuscany Regional Territory using raingauge recorded rainfalls at 15’ time-step and CAPPI (Constant altitude plan position indicator) reflectivity data at 2000/3000/5000 m at 5’ and 10’.
Relationships describing precipitation VS radar reflectivity were integrated and elaborated as part of the development of the merging procedures, while the comparison involved the analysis of variance and diversity coefficients. Kriging-based elaborations showed different spatial patterns depending on the applied procedure, with patterns closer to radar variability when using DPCN, and more reflecting the gauge data structure when adopting KED. The probabilistic method (PMM), instead, had the advantage of integrating the gauge data while preserving the spatial radar patterns, confirming interesting perspectives.

How to cite: Ciampalini, R., Antonini, A., Mazza, A., Melani, S., Ortolani, A., Rosi, A., Segoni, S., and Moretti, S.: Comparing different radar-raingauge precipitation merging methods for Tuscany region, EGU General Assembly 2023, Vienna, Austria, 23–28 Apr 2023, EGU23-12475, https://doi.org/10.5194/egusphere-egu23-12475, 2023.

EGU23-12857 | Orals | HS3.8

Surge-tide interaction along the Italian coastline 

Alessandro Antonini, Elisa Ragno, and Davide Pasquali

Storm surge events are probably one of the most studied phenomena in coastal regions since they can lead to coastal flooding, environmental damage, and sometimes loss of human life. In regions of shallow water, among other localized processes, surges occurring at high astronomical tides tend to be damped while surges occurring at rising tides are amplified affecting water level extremes. This requires accounting for tide-surge interaction when defining the coastal hazards due to extreme water levels.

Cities along the Italian coast, such as Venice, Ravenna, Bari (Adriatic sea), Genova, Livorno, Napoli, and Palermo (Tyrrhenian sea), are vulnerable to coastal flooding. Hence, a thorough understanding of the interaction between water level components, i.e., storm surge and astronomical tides, is required to define a proper framework for coastal risk assessment.

Here, we analyze water level observations in several Italian coastal locations to investigate possible correlation and interaction between astronomical tide and the storm surge. Then we study the effect that such interaction has on extreme water level statistics to support the development of flood-resilient adaptation strategies.

How to cite: Antonini, A., Ragno, E., and Pasquali, D.: Surge-tide interaction along the Italian coastline, EGU General Assembly 2023, Vienna, Austria, 23–28 Apr 2023, EGU23-12857, https://doi.org/10.5194/egusphere-egu23-12857, 2023.

EGU23-12909 | Posters on site | HS3.8

Smart Groundwater Monitoring System for Managed Aquifer Recharge Based on Enabled Real-Time Internet of Things 

Khan Zaib Jadoon, Muhammad Zeeshan Ali, Hammad Ullah Khan Yousafzai, Khalil Ur Rehman, Jawad Ali Shah, and Nadeem Ahmed Shiekh

Groundwater has provided a reliable source of high-quality water for human use. After India, USA and China, Pakistan is the fourth largest groundwater user in the world and around 60x109 m3 of groundwater is extracted annually. The situation in Pakistan has further exacerbated when government subsidized electricity for agricultural purposes – paving the way for installation of myriad tube wells across the country which resulted in excessive withdrawal of groundwater. The major challenges in sustainable groundwater management system are twofold. First, increasing withdrawals to meet growing human needs have led to significant groundwater depletion, which is usually not monitored due to high cost of monitoring system. Second, data limitations and the application of regional groundwater models for future prediction.

In this research, Internet of Things (IoT) enabled smart groundwater monitoring system has been developed and tested to monitor in-situ real-time dynamics of groundwater depletion. Each groundwater monitoring sensor is connected to an embedded module that consists of a microcontroller and a wireless transceiver based on Long Range Radio (LoRa) technology. The readings from each LoRa enabled module is aggregated at one (or more) gateways which is then connected to a central server typically through an IP connection. Sensors of the smart groundwater monitoring system were calibrated in the lab by fluctuation water levels in a 3-meter water column. A network of the low-cost groundwater sensors was installed in managed aquifer recharge wells to provide real-time assessment of groundwater level measurement remotely. The smart and resource efficient groundwater monitoring system help to reduce number of physical visits to the field and also enhance stakeholders participation to get social benefits (promote equity among groundwater users), economic benefit (optimize pumping, which reduces energy cost) and technical benefit (better estimates of groundwater abstraction) for sustainable groundwater management.

How to cite: Jadoon, K. Z., Ali, M. Z., Yousafzai, H. U. K., Rehman, K. U., Shah, J. A., and Shiekh, N. A.: Smart Groundwater Monitoring System for Managed Aquifer Recharge Based on Enabled Real-Time Internet of Things, EGU General Assembly 2023, Vienna, Austria, 23–28 Apr 2023, EGU23-12909, https://doi.org/10.5194/egusphere-egu23-12909, 2023.

EGU23-13505 | Posters on site | HS3.8

Water observations by the public- experiences from the CrowdWater project 

Ilja van Meerveld, Franziska Schwarzenbach, Rieke Goebel, Mirjam Scheller, Sara Blanco Ramirez, and Jan Seibert

Hydrology is a data limited science, especially spatially distributed observations are lacking. Citizen science observations can complement existing monitoring networks and provide useful data. Engaging the public in data collection can also increase people’s interest and awareness about water-related topics. In this PICO, we will present the CrowdWater project, in which citizen scientists share, with the help of a smartphone app, hydrological observations on stream water levels, the presence of water in temporary streams, soil moisture conditions, plastic pollution, and general information on water quality. We will highlight the type of data that are collected, our quality control procedures, and the value of the data for hydrological model calibration. We will also discuss the motivations of the citizen scientists to join the project and to continue to contribute to the project. Although the majority of our frequent contributors are adults, we try to engage the youth in the project by giving presentations in schools and at science fairs. Therefore, we will end the PICO presentation with some examples of our outreach work and lessons learned.

How to cite: van Meerveld, I., Schwarzenbach, F., Goebel, R., Scheller, M., Blanco Ramirez, S., and Seibert, J.: Water observations by the public- experiences from the CrowdWater project, EGU General Assembly 2023, Vienna, Austria, 23–28 Apr 2023, EGU23-13505, https://doi.org/10.5194/egusphere-egu23-13505, 2023.

EGU23-15389 | ECS | Posters on site | HS3.8

An innovative data driven approach improves drought impact analysis using earth observation data 

Ye Tuo, Xiaoxiang Zhu, and Markus Disse

Drought is a devastating natural hazard that can be of diverse magnitude, duration and intensity. It leads to economic and social losses and ecological imbalances. Ascribing to climate change, drought has occurred more frequently with high intensity worldwide in recent decades, such as the striking droughts in the summer of year 2022. In water resource aspect, one direct consequence of drought is the decrease of water amount in the rivers, which could further develop into water shortage for irrigation and drinking water supply, and cargo shipping disruption. Therefore, in order to make management decisions that help mitigate the drought damage, it is important to monitor river water anomalies and identify the vulnerable shrinking sections along the river network. Traditional river gauging stations only provide us limited observations of particular spots. A proper utilization of spatially distributed remote sensing data is necessary and effective. In this work, we develop a novel framework to monitor river water shrinking anomaly by including image processing and machine learning approaches, based on earth observation data. The Rhine, a major cargo-route river, is selected as the pilot case, because it had huge water decrease and caused shipping disruption during the 2022 summer’s drought in Germany. The Modified Normalized Difference Water Index (MNDWI) is calculated from the green and Shortwave-Infrared bands of Sentinel-2 satellite images.  MNDWI images of a specific non-drought period is defined as the reference datasets representing normal conditions. Afterwards, a new water shrinking index is introduced to quantify the river water anomaly during drought periods.  Specifically, a python based algorithm which includes image processing and machine learning clustering methods is developed to scan along the MNDWI images to compute the water shrinking index with adjustable river section size. With the index datasets, river sections are further grouped into categories with drought vulnerable levels. By parameterizing the section size, the algorithm is able to quantify and identify the vulnerable shrinking river sections with varying scales. It provides classified references of drought affected hotspots for the regional water management plans in case of drought mitigation. Such a scalable framework can offer a timely distributed monitoring of the drought impacts on the water resource along the river network. As a long term benefit, numerical connections can be identified between the river shrinking status and the economic losses of cargo shipping disruption due to drought.  This is of great value to facilitate the drought impact analysis and forecasts.

How to cite: Tuo, Y., Zhu, X., and Disse, M.: An innovative data driven approach improves drought impact analysis using earth observation data, EGU General Assembly 2023, Vienna, Austria, 23–28 Apr 2023, EGU23-15389, https://doi.org/10.5194/egusphere-egu23-15389, 2023.

EGU23-16292 | ECS | Posters on site | HS3.8

Hydrological decision-making systems using high-resolution weather radar observations –  a case study from Hungary 

Zsolt Zoltán Fehér, Erika Budayné-Bódi, Attila Nagy, Tamás Magyar, and Tamás János

According to past observations and long-term forecasts, the Carpathian Basin is distinguished by two precipitation trends. The frequency, length, and severity of periods of precipitation deficit and drought are increasing. Furthermore, as small-scale convective updrafts intensify, heavy thunderstorms become more intense. Both trends pose significant risks from an anthropogenic perspective. The former increases food insecurity due to intensifying droughts, which damages agricultural yields, while the latter mainly increases property damage via heavy hailstorms.

The 2022 drought year demonstrated that effective use of available water is the foundation for sustainable growth, which may be supported by well-designed infrastructure investments and smart water management technologies. A rainfall radar system with a high spatial and temporal resolution that contributes to near real-time machine decision-making is one conceivable component of such a complex system.

The Furuno WR-2100 precipitation radar, which was deployed on the outskirts of Debrecen in 2020 for benchmarking purposes, is the first component of such an intelligent decision-making system in Hungary. The radar's range comprises both urban and rural areas, allowing it to continually gather high-resolution test data for both urban hydrology and agricultural irrigation system developments.

The research presented in the article was carried out within the framework of the Széchenyi Plan Plus program with the support of the RRF 2.3.1 21 2022 00008 project.

How to cite: Fehér, Z. Z., Budayné-Bódi, E., Nagy, A., Magyar, T., and János, T.: Hydrological decision-making systems using high-resolution weather radar observations –  a case study from Hungary, EGU General Assembly 2023, Vienna, Austria, 23–28 Apr 2023, EGU23-16292, https://doi.org/10.5194/egusphere-egu23-16292, 2023.

The quality of mosaic QPE directly determines the accuracy of QPF products from nowcasting models. However, there is a common spatial discontinuity phenomenon caused by the biases of multiple radars in mosaic QPE. Consistency correction, a type of multi-radar quality control method, can be used to mitigate the spatial discontinuity of mosaic QPE, but its improving effect on QPF products should be analyzed.

For this consideration, a consistency correction method based on GPM KuPR proposed by Chu et al (2018a) was applied to the three S-band operational radars of China, and the improvement on QPE by Z-R relationship, deterministic QPF by S-SPROG (Spectral Prognosis), and ensemble QPF by STEPS (Short-Term Ensemble Prediction System) were analyzed. The results showed: 1) the raw reflectivity factors by the three operational radars over the same equidistance area were significantly different. After the consistency correction, the differences decreased to be less than 0.5 dB and the spatial discontinuity of mosaic products disappeared. 2) The precision of mosaic QPE was significantly improved after the correction, and the average RMSE of QPE decreased by 19.5%, and the TS of heavy rainfall and above rose by 44.8%. 3) The 0-1h deterministic QPF by S-SPROG, and ensemble QPF by STEPS were significantly improved after the correction. The deterministic (ensemble) TS of moderate rain and above rose by 11.9% (10.2%), and that of heavy rain and above increased by 34.2% (38.7%). 4) Furthermore, the consistency correction method contributed to precipitation velocity estimation, and decreased its RMSE by 25.0%. Clearly, the consistency correction method is significantly contributive to multi-radar mosaic QPE and precipitation nowcasting.

How to cite: Chu, Z.: Improvement of Multi-Radar Quantitative Precipitation Nowcasting with Consistency Correction Method, EGU General Assembly 2023, Vienna, Austria, 23–28 Apr 2023, EGU23-16647, https://doi.org/10.5194/egusphere-egu23-16647, 2023.

HS4 – Hydrological forecasting

EGU23-766 | ECS | PICO | HS4.1

Bridges influence large wood trapping efficiency during large floods: insights from the Francolí River flood in 2019 

Llanos Valera-Prieto, Virginia Ruiz-Villanueva, and Glòria Furdada

Recent large floods across Europe, including those in Belgium and Germany in 2021 or, more recently, in Italy in October 2022, showed that major obstructions of bridges due to the mobilized large wood (LW) significantly influenced the flood-related damages. However, in principle, none of the dangers posed by wood was inherent to the wood itself but to the obstacles and infrastructures that were not designed to allow the wood to pass. Understanding this legacy effect on wood in rivers due to the increased artificial trapping efficiency of river structures (bridges, dam reservoirs) still needs to be completed.

The Francolí River in Catalonia, NW Iberian Peninsula (853 Km2 area and 59 km length) underwent a major flash flood on October 22, 2019, that caused six fatalities. The rainfall recorded in the NW basin was 293 mm in 24 hours. Consequently, significant bio-geomorphological changes occurred; a large amount of sediment was eroded, transported and deposited, and many trees were damaged or uprooted with subsequent large wood (LW) supply and transport. In addition, infrastructures were severely damaged (e.g., three bridges collapsed).

The legacy effects on instream large wood related to the human infrastructures in river systems is an essential factor to consider when assessing the effects of floods and potential risks. Therefore, this study's main objective was to evaluate the influence of bridges on large wood accumulation during floods. 

We analyzed a reach of 30 km along the Francolí River in which there were 23 bridges. The reach was split into 52 sub-reaches based on their morphological characteristics (i.e., the width of the valley bottom, slope, and sinuosity), the presence of infrastructures, or lithologic and anthropic knickpoints, and the junction with tributaries. The 52 sub-reaches were grouped into four main typologies based on statistical segmentation and clustering.

Individual pieces of LW and accumulations were digitalized using post-flood high-resolution orthophotos (i.e., 0.10 m resolution). They were characterized using four attributes: orientation with respect to the channel (parallel, perpendicular, oblique), transported (yes or not), location (active channel or floodplain), and length. Average Nearest Neighbour, Spatial Autocorrelation (Global Moran's I test) and Density were computed and revealed the depositional pattern of LW along the study reach.

Preliminary results showed that morphological characteristics favoured LW trappings: wide valley bottoms and sinuous bends. In addition, the standing vegetation and other in-channel obstacles were crucial to trap wood. The most significant aspect, however, was the presence of bridges. A significantly more considerable amount of wood (i.e., the highest density observed, ranging between 33 and 101 pieces/ha) was trapped upstream from bridges, where wood was deposited at significantly higher elevations. Further analyses will explore the characteristics of the bridges and upstream sub-reaches.

This study will provide crucial information to understand large wood accumulation at bridges during floods and will inform flood-hazard assessments and river management.

How to cite: Valera-Prieto, L., Ruiz-Villanueva, V., and Furdada, G.: Bridges influence large wood trapping efficiency during large floods: insights from the Francolí River flood in 2019, EGU General Assembly 2023, Vienna, Austria, 23–28 Apr 2023, EGU23-766, https://doi.org/10.5194/egusphere-egu23-766, 2023.

EGU23-1241 | ECS | PICO | HS4.1

Downward counterfactual analysis of historical rainfall events in Germany 

Paul Voit and Maik Heistermann

In the last 20 years a variety of heavy precipitation events (HPEs) have caused severe floods and large damages in Germany. However, the impact of an HPE is not solely determined by the event itself, but also by the geomorphologic characteristics of the location where it occurs.

Previous studies have shown that HPEs can happen anywhere in Germany. To find out where in Germany historical HPEs could have caused a potential hazard, we extracted the 10 most extreme HPEs by using the cross-scale weather extremity index (xWEI) from the last 20 years of radar data (RADKLIM) and shifted these events to every mesoscale subbasin in Germany.

We use the geomorphological instantaneous unit hydrograph as a simple screening tool to investigate the runoff concentration at the mesoscale and the following flood wave propagation in these subbasins as response to historical HPEs. While this method might not be sufficient to model precise discharge, it can be used to spot rapid increase in direct runoff and shed light on the peak development further downstream, depending on the spatiotemporal characteristics of the HPE. 

By using historical HPEs as benchmarks, our method can help to identify areas in Germany which are prone to flood hazard and assist to adjust mitigation measures accordingly.

How to cite: Voit, P. and Heistermann, M.: Downward counterfactual analysis of historical rainfall events in Germany, EGU General Assembly 2023, Vienna, Austria, 23–28 Apr 2023, EGU23-1241, https://doi.org/10.5194/egusphere-egu23-1241, 2023.

EGU23-3147 | ECS | PICO | HS4.1

Seamless rainfall and discharge forecasting using a scale-dependent blending of ensemble rainfall nowcasts and NWP 

Ruben Imhoff, Athanasios Tsiokanos, Jerom Aerts, Lesley De Cruz, Claudia Brauer, Klaas-Jan van Heeringen, Albrecht Weerts, and Remko Uijlenhoet

Flash flood early warning requires accurate rainfall forecasts with a high spatial and temporal resolution. As the first few hours ahead are already not sufficiently well captured by the rainfall forecasts of numerical weather prediction (NWP) models, rainfall nowcasting can provide an alternative. This observation-based method, however, quickly loses skill after the first few hours of the forecast due to growth and dissipation processes that are not accounted for. In addition, providing an additional forecasting method can let users drown in the amount of available information. A promising way forward is a seamless forecasting system, which combines the aforementioned forecasting methods. By optimally combining (blending) rainfall nowcasts with NWP forecasts, we can extend the skillful lead time of short-term rainfall forecasts and provide users with more consistent, seamless forecasts.

We implemented an adaptive scale-dependent ensemble blending method in the open-source pysteps library. In this implementation, the blending of the extrapolation (ensemble) nowcast, (ensemble) NWP and noise components is performed level-by-level, which means that the blending weights vary per spatial cascade level. These scale-dependent blending weights are computed from the recent skill of the forecast components, and converge to a climatological value, which is computed from a multi-day rolling window and can be adjusted to the (operational) needs of the user. To constrain the (dis)appearance of rain in the ensemble members to regions around the rainy areas, we have developed a Lagrangian blended probability matching scheme and incremental masking strategy.

We evaluate the method using three heavy and extreme (July 2021) rainfall events in four Belgian and Dutch catchments, focusing on both the rainfall forecasts and the resulting discharge forecasts using the fully distributed wflow_sbm hydrological model. We benchmark the results of the 48-member blended forecasts against the deterministic Belgian NWP forecast, a 48-member nowcast and a simple 48-member linear blending approach. When focusing on the resulting rainfall forecasts, the introduced blending approach predominantly performs similarly or better than only nowcasting (in terms of event-averaged CRPS and CSI values) and adds value compared to NWP for the first hours of the forecast. This holds for both the radar domain and catchment scale, although the difference, particularly with the linear blending method, reduces when we focus on catchment-average cumulative rainfall sums instead of instantaneous rainfall rates. We find similar results for the resulting discharge forecasts, although the effect of the catchment size and corresponding lag times becomes influential and determines the added value of nowcasting over NWP. By properly combining observations and NWP forecasts, blending methods such as these are a crucial component of seamless hydrometeorological forecasting systems.

How to cite: Imhoff, R., Tsiokanos, A., Aerts, J., De Cruz, L., Brauer, C., van Heeringen, K.-J., Weerts, A., and Uijlenhoet, R.: Seamless rainfall and discharge forecasting using a scale-dependent blending of ensemble rainfall nowcasts and NWP, EGU General Assembly 2023, Vienna, Austria, 23–28 Apr 2023, EGU23-3147, https://doi.org/10.5194/egusphere-egu23-3147, 2023.

EGU23-5831 | PICO | HS4.1

Nowcasting localized heavy precipitation using a multi-parameter phased array weather radar (MP-PAWR) and a 3D recurrent neural network. 

Philippe Baron, Kouhei Kawashima, Dong-Kyun Kim, Hiroshi Hanado, Takeshi Maesaka, Shinsuke Satoh, Seiji Kawamura, and Tomoo Ushio

Temporal extrapolation of radar observations of precipitation is a means of nowcasting sudden localized heavy rains, i.e., restricted convective rains on a spatial scale of less than 10 km and a lifetime of a few tens of minutes. Such nowcasts are necessary to set up warning systems to anticipate damage to infrastructure and reduce the fatalities these storms cause. It is a difficult task due to the storm suddenness, their restricted area, and nonlinear behavior that are not well captured by current operational systems, even for a lead time of only 10 minutes. Often, conventional approaches use radar observations with 5 min resolution and a Lagrangian advection based extrapolation model with a poor description of the vertical dimension. In this study, we use a new Multi-Parameter Phased-Array Weather Radar (MP-PAWR) with a temporal resolution of 30 sec and a 3D recurrent neural network to improve 10-minute nowcasts of sudden localized rains. The MP-PAWR has been operational in Japan (Saitama prefecture) since 2018. The nowcast model is a supervised neural network trained with adversarial technique. It considers the 3D volume surrounding the instrument up the height of 10 km and the polarimetric information of the measurement.  Improvements with conventional nowcasting techniques will be discussed with some typical examples.

How to cite: Baron, P., Kawashima, K., Kim, D.-K., Hanado, H., Maesaka, T., Satoh, S., Kawamura, S., and Ushio, T.: Nowcasting localized heavy precipitation using a multi-parameter phased array weather radar (MP-PAWR) and a 3D recurrent neural network., EGU General Assembly 2023, Vienna, Austria, 23–28 Apr 2023, EGU23-5831, https://doi.org/10.5194/egusphere-egu23-5831, 2023.

EGU23-6096 | ECS | PICO | HS4.1

Representative Hillslope Approach for Modeling Flash Flood Generation in Ungauged Catchments 

Ashish Manoj J, Franziska Villinger, Mirko Mälicke, Ralf Loritz, and Erwin Zehe

Convective rainfall extremes usually trigger due to their highly localised and intense input of mass and momentum ‘hot moments’ in water and matter cycling. Terrestrial systems then respond with strong Hortonian overland flow and erosion up to the formation of flash floods. While heavy precipitation events are characterised by multi-decadal variability, it is noteworthy that the largest observed floods in many rivers of Europe have occurred in the last three decades. Similarly, flash floods have also intensified. The recent clustering of extremes likely reflects the ongoing acceleration of the hydrological cycle, with expected increasing frequencies of intense convective rainstorms and related flash flood and erosion events due to Clausius-Clapeyron scaling. This urgently calls for an improved understanding and models that allow the design of strategies to mitigate onsite and catchment-wide offsite damages of flash floods and erosion events.

Hortonian overland flow occurs when precipitation intensity exceeds the soil’s infiltration capacity. The latter depends on the soil water content, soil hydraulic properties and the density and connectivity of vertical preferential flow paths and are often biologically mediated, as in the case of worm borrow and root channels. Whether locally generated surface runoff reaches the stream depends on the generated spatial connectivity of overland flow paths to the river network.

Here we propose that land use management and soil surface preparation bear the key to reducing the formation of Hortonian overland flow and the connectivity of its flow path, e.g., through a locally elevated infiltration capacity and roughness, thereby reducing the overland flow velocity and favouring its re-infiltration. Moreover, we demonstrate that physically based hydrological models are key to quantifying how changes in landuse and surface preparation techniques (including buffer areas, vegetation barriers, and fascines) in combination with local flood defense reservoirs reduce the formation of flood runoff during convective extremes. Specifically, we use the model CATFLOW and the representative hillslope approach to investigate flash floods observed in four ungauged headwaters catchments in the Kraichgau, Baden-Württemberg (Germany) in 2016. While each catchment drains into a regulated flood defense reservoir, we inverted the flood hydrograph/ inflow into the flood reservoirs using water level measurements and reservoir geometry equations. LULC maps are derived from LANDSAT images using spectral profiles obtained from field surveys over the region. Since flash floods are often associated with localised short-duration, high-intensity rainfall of convective origin, the model is forced using commercial radar-based precipitation products. The CATFLOW model was set up separately for the four headwaters by transferring a completed hillslope setup (soil catena, soil hydraulic properties, plant roughness parameters) from a gauged Weiherbach experimental catchment in the same landscape while deriving the representative hillslope profiles from the digital elevation data. Our results indicate that physically based models perform well in capturing the dynamics of the reconstructed hydrographs, which speaks a) for the transferability of physically based model structures within the same hydrological landscape and b) the feasibility of representative hillslope approach and c) the usefulness of the radar product.

How to cite: Manoj J, A., Villinger, F., Mälicke, M., Loritz, R., and Zehe, E.: Representative Hillslope Approach for Modeling Flash Flood Generation in Ungauged Catchments, EGU General Assembly 2023, Vienna, Austria, 23–28 Apr 2023, EGU23-6096, https://doi.org/10.5194/egusphere-egu23-6096, 2023.

EGU23-7151 | ECS | PICO | HS4.1 | Highlight

Assessing the ability of a seamless short-range ensemble rainfall product to detect flash floods on the French Mediterranean area 

Juliette Godet, François Bouttier, Pierre Javelle, and Olivier Payrastre

Flash floods have dramatic economic, natural and social consequences, and efficient adaptation policies are required to reduce these impacts, especially in a context of global warming. This is why it remains essential to develop more efficient flash flood forecasting systems. This study was carried out in order to assess the ability of a new seamless short range ensemble rainfall forecast product, called PIAF-EPS and recently developed by Meteo France, to predict flash floods when it is used as input in an operational hydrological forecasting chain.

For this purpose, eight flash flood events that occurred in the French Mediterranean region between 2019 and 2021 were reproduced, using a similar forecasting chain as the one implemented in the French “Vigicrues-Flash” operational flash flood monitoring system. The hydrological forecasts obtained from PIAF-EPS were compared to the hydrological simulations obtained from the radar observations, and to three deterministic forecasts using varied scenarios (future constant rain, deterministic PIAF, and a numerical nowcasting system called AROME-NWC).

The verification method applied in this work uses rank diagrams and scores calculated on contingency tables, in an original way. The verification process has been conducted on each 1km² pixel of the territory.

The results illustrate the added value of the ensemble approach for flash flood forecasting, and the benefits of the use of a “seamless” product combining radar observations and numerical nowcasting.   

How to cite: Godet, J., Bouttier, F., Javelle, P., and Payrastre, O.: Assessing the ability of a seamless short-range ensemble rainfall product to detect flash floods on the French Mediterranean area, EGU General Assembly 2023, Vienna, Austria, 23–28 Apr 2023, EGU23-7151, https://doi.org/10.5194/egusphere-egu23-7151, 2023.

EGU23-7798 | ECS | PICO | HS4.1

Towards 2D flood forecasting with the HPC-enabled shallow water solver SERGHEI-SWE 

Ilhan Özgen-Xian, Mario Morales-Hernández, Michael Nones, and Daniel Caviedes-Voullième

Great advancement has been achieved in the last decade in 2D shallow water solvers for flood modelling. However, their application to physically-based flood forecasting continues to be experimental and not widespread. One of the central challenges towards operational flood forecasting with 2D solvers is their computational cost, which needs to be reconciled with the required lead times for forecasts to be of use. Nonetheless, these solvers have great potential to improve flood forecasting predictions, especially when it comes to flash floods, for which the established 1D and conceptual models may be significantly less applicable.

The shallow water solver SERGHEI-SWE leverages on robust and efficient numerical techniques and is implemented for High Performance Computing (HPC), allowing its use in supercomputers and opening new opportunities in 2D flood forecasting. In this contribution, we present proof-of-concept simulations of several flood events in different catchment and river systems. We show that, with SERGHEI-SWE, it is possible to run very high resolution flood simulations for large hydrological systems with runtimes significantly lower than the event duration. This property is essential to enable operational forecasting with useful lead times.

We run simulations on three river reaches, in the Italian river Po (125 km reach between Boretto and Pontelagoscuro) and in one of its tributaries, the river Secchia (20 km reach), and a meandering reach of the Ebro river through the city of Zaragoza. We also perform flash flood simulations on a 5 km2 district of Nice (France), and in a 50 km2 agricultural catchment in Jaén (Spain). The focus of the exercise is on the computational performance aspect and not on the model performance. The results show that high resolution simulations can be done with runtimes in the order of 100 times faster than real time, potentially allowing a very good forecast lead time. We also explore different combinations of computational resources, model resolution and ensemble size to explore the flexibility of the modelling approach under different computational systems, which may be available for flood forecasting.

How to cite: Özgen-Xian, I., Morales-Hernández, M., Nones, M., and Caviedes-Voullième, D.: Towards 2D flood forecasting with the HPC-enabled shallow water solver SERGHEI-SWE, EGU General Assembly 2023, Vienna, Austria, 23–28 Apr 2023, EGU23-7798, https://doi.org/10.5194/egusphere-egu23-7798, 2023.

Flash floods occur when heavy rain causes a fast and powerful flow of water in a drainage area. In the Eastern Mediterranean region, which contains arid and semi-arid areas, the location and timing of rainfall is the most significant factor in the formation of flash floods. Predicting when and where extreme weather events such as storms, heavy rainfall, and flooding are likely to happen is a key challenge in the effort to prevent natural disasters. Here, we present an improved version of a previous work by Ziskin and Reuveni, which investigated the use of precipitable water vapor (PWV) data from ground-based global navigation satellite system (GNSS) stations, along with surface pressure measurements to predict flash floods in an arid region of the eastern Mediterranean. The previous study involved training three machine learning models to perform a binary classification task, using multiple unique flash flood events and testing the models using a nested cross-validation technique. The results showed that the support vector machine (SVM) model had the highest mean area under the curve (AUC) and the lowest AUC variability compared to random forest (RF) and multi-layer perceptron (MLP) models.  When tested on an imbalanced dataset simulating a more realistic flash flood occurrence scenario, all models demonstrated a decrease in the false alarm rate (precision) with a high hit rate (recall) performance.

In this study, we extend the previous work by integrating nearby lightning data as a new feature in our studied dataset. The inclusion of this feature is motivated by the observation that heavy rainfall, which can lead to flood events, is often accompanied before by an increase in lightning activity. The experimental results show that the adding a 24-hour vector of nearby lightning activity improves the precision score significantly.

How to cite: Reuveni, Y., Asaly, S., and Gottlieb, L.-A.: Flash flood predictions over the Eastern Mediterranean using artificial intelligence techniques with precipitable water vapor, pressure, and lightning data., EGU General Assembly 2023, Vienna, Austria, 23–28 Apr 2023, EGU23-9979, https://doi.org/10.5194/egusphere-egu23-9979, 2023.

EGU23-11757 | ECS | PICO | HS4.1 | Highlight

Relevance of using ensemble forecasts of flash-flood impacts for an emergency service: an evaluation for the October 2018 flood event in the Aude river basin, France 

Maryse Charpentier-Noyer, Pierre Nicolle, Olivier Payrastre, Eric Gaume, François Bouttier, and Hugo Marchal

Flash floods (FF) represent an important part of the flood damages and fatalities in the world. Today, operational FF nowcasting and warning systems are often based on the use of precipitation weather radars, and therefore still offer limited anticipation. They also generally rather represent the intensity of the flood events than their severity in terms of impacts, which may limit the capacity of emergency services to take relevant decisions.

This contribution aims at evaluating the value of a new ensemble FF impacts forecasting chain for the decision making of an emergency service.  The case study corresponds to the Aude River flash floods that occurred on October 15 and 16, 2018, and which are among the most important FF observed in southeastern France in the recent years. This event is responsible for the death of 15 people (99 people injured), as well as particularly large material damages.

The tested FF impacts forecasting chain combines three new rainfall ensemble forecast products (provided by CNRM), specifically designed for short-range forecasting (0-6h), and a highly distributed rainfall-runoff model (Charpentier-Noyer et al., 2022). A simple impacts model is built and applied for each river reach based on a catalog of 8 inundation scenarios corresponding to return periods of 2 to 1000 years. The impacts are represented in terms of a number of inundated buildings.

The value of the ensemble impacts forecasts is finally evaluated based on the implementation of a multi-agent model, for the simulation of the field decisions taken by an emergency service. This new evaluation approach, based on simple but realistic hypotheses, allows to illustrate and measure the gains associated with a better anticipation of impacts, and the costs associated with false alarms, which lead to the unnecessary mobilization of rescue teams, to the detriment of really impacted locations. In case of extremely limited means for safety operations (low number of rescue teams), the decisions based on a naive zero future rainfall scenario may sometimes appear better than those using ensemble rainfall forecasts. Nevertheless, in all the simulated cases, the decisions taken from the ensemble rainfall forecasts appear more efficient than those based only on field observations.


Charpentier-Noyer, M., Peredo, D., Fleury, A., Marchal, H., Bouttier, F., Gaume, E., Nicolle, P., Payrastre, O., and Ramos, M.-H.: A methodological framework for the evaluation of short-range flash-flood hydrometeorological forecasts at the event scale, Nat. Hazards Earth Syst. Sci. Discuss. [preprint], https://doi.org/10.5194/nhess-2022-182, in review, 2022.

How to cite: Charpentier-Noyer, M., Nicolle, P., Payrastre, O., Gaume, E., Bouttier, F., and Marchal, H.: Relevance of using ensemble forecasts of flash-flood impacts for an emergency service: an evaluation for the October 2018 flood event in the Aude river basin, France, EGU General Assembly 2023, Vienna, Austria, 23–28 Apr 2023, EGU23-11757, https://doi.org/10.5194/egusphere-egu23-11757, 2023.

EGU23-13338 | ECS | PICO | HS4.1

Debris flows risk assessment for Central Asia by application of Global Ensemble Output and Post-processed Precipitation 

Gavkhar Mamadjanova, Maria Shahgedanova, and Fatima Pillosu

Accurate predictions of heavy and intense rainfall are vital for impact-based forecasting that can be essential for mitigating the significant damage and loss of life across the globe. However, producing reliable forecasts capable of capturing the rainfall values is challenging in complex mountain terrain due to the forecast uncertainty and computational cost especially in data-scarce regions. Central Asia is one of these regions, where extreme rainfall leads to flash floods, landslides and debris flows in the mountains and foothills. The risk of these events increases with global warming, and the early warning systems based on reliable forecasts are particularly important to manage the risk in the region and adapt to climate change.

In this study, we have evaluated and compared the skills of two probabilistic forecasts developed by the European Centre for Medium-Range Weather Forecasts (ECMWF): standard Ensemble Forecasts (ENS) which consists of an ensemble of 51 members and ecPoint Rainfall produced by statistical post-processing of the ENS and delivers probabilistic forecasts of rainfall totals for points within a model gridbox (18 km resolution) that can be particularly useful in the mountains. Skills of both forecasts were assessed in relation to the forecast of debris flows in Central Asia.

Both forecast products were verified against SYNOP (surface synoptic observations) data for stations over Central Asia, mainly for the debris flow season (March-October) in 2022. In this case, two popular verification methods were used: Brier Score and Receiver Operating Characteristics (ROC) diagram for the exceedance of precipitation thresholds of 1 mm, 10 mm and 25 mm.

Verification trials over the 2022 debris flow season in Central Asia show that the performance of ecPoint Rainfall depending on the forecast lead-time can be a good proxy for the range of point rainfall values to define the warning areas of debris flow risk over the study area. The ecPoint Rainfall is recommended for the operational application of heavy rainfall leading to debris flow formation which can support impact-orientated forecasting and early warning systems in Central Asia.

How to cite: Mamadjanova, G., Shahgedanova, M., and Pillosu, F.: Debris flows risk assessment for Central Asia by application of Global Ensemble Output and Post-processed Precipitation, EGU General Assembly 2023, Vienna, Austria, 23–28 Apr 2023, EGU23-13338, https://doi.org/10.5194/egusphere-egu23-13338, 2023.

EGU23-14123 | PICO | HS4.1

Wavelet-based post-processing of NWP precipitation forecasts 

Fiona Johnson and Ze Jiang

Reliable flood forecasts are dependent on accurate quantitative precipitation forecasts. Despite improvements in the resolution and schematisation of Numerical Weather Prediction (NWP) models, there are still substantial biases in their precipitation forecasts. Biases are present at a range of time scales and correctly representing the multi-temporal scale properties of precipitation including its persistence and variability is vital. In this presentation a new method for post-processing NWP model precipitation forecasts is developed. The new method is based on continuous wavelet transforms (CWT) which correct the statistical characteristics of the precipitation forecasts across a range of time scales. The precipitation amounts are corrected using a simple quantile mapping of the amplitude of each time scale of the wavelet decomposition. To account for uncertainty in precipitation timing, we also adjust the phase of the CWT randomly to create an ensemble of post-processed forecasts. Spatial correlations are preserved by maintaining the same phase adjustments at each different precipitation forecast location.  

The new method is demonstrated using hourly forecast data from the ACCESS model over the period March 2018 to September 2021  for a network of 158 gauges around Sydney, in eastern Australia. The new method improves the correlation of the forecasts and reduces the root mean square error. The spatial correlation structure of the post-processed forecasts is also improved. Correctly representing spatial patterns of precipitation is vital to ensure that catchment averaged precipitation and the resulting flood forecasts are correct.

How to cite: Johnson, F. and Jiang, Z.: Wavelet-based post-processing of NWP precipitation forecasts, EGU General Assembly 2023, Vienna, Austria, 23–28 Apr 2023, EGU23-14123, https://doi.org/10.5194/egusphere-egu23-14123, 2023.

EGU23-417 | ECS | Orals | HS4.2

Parameter transferability of a distributed hydrological model to droughts 

Giulia Bruno, Doris Duethmann, Francesco Avanzi, Lorenzo Alfieri, Andrea Libertino, and Simone Gabellani

Hydrological models often do not simulate properly streamflow (Q) during droughts, because of a poor representation of the interactions among precipitation deficits, actual evapotranspiration (ET), and terrestrial water storage anomalies (TWSA) during these periods. However, there is little research comprehensively evaluating model skills during droughts of varying intensity in a spatially distributed way. To shed further light into these drops in model skills and step toward more robust models in an anthropogenic era and a changing climate, we evaluated Q, ET, and TWSA simulations during moderate and severe droughts, and we tested if calibrating during a moderate drought could enhance model performances during a severe one. We applied the distributed hydrological model Continuum over the heavily human-affected Po river basin in northern Italy and the period 2010 – 2022. Moreover, we exploited independent ground- and remote sensing-based datasets to evaluate the temporal and spatial variability of Q, ET, and TWSA monthly simulations across the whole basin and 38 sub-catchments. Model performances for Q across the study sub-catchments were comparable during both wet years (2014 and 2020, mean KGE = 0.59±0.32) and moderate droughts (2012 and 2017, mean KGE = 0.55±0.25). Further, Continuum simulated well Q for the basin outlet even during a severe drought (KGE = 0.82 in 2022), while its performances generally decreased among the sub-catchments (mean KGE = 0.18±0.69 in 2022). In general, the model well represented ET and TWSA seasonality over the study area, and a decline in TWSA over the more recent years. Yet, during the severe 2022 drought we detected an increased uncertainty in ET anomalies, especially in human-affected croplands, that could explain the Q performance drop along with an increased anthropogenic disturbance. Including a moderate drought (2017) in the calibration period did not lead to a significant improvement in model skills during the severe event (mean KGE = 0.18±0.63 for Q during 2022), meaning that the severe 2022 drought was fairly unique for the study area both in terms of hydrological processes and human disturbance on them. By unveiling an increase in model uncertainty during a severe drought and possible causes for it, our findings are relevant to assess and possibly enhance model robustness in a changing climate and the anthropogenic era for adequate water management, disaster risk reduction, and climate change adaptation.

How to cite: Bruno, G., Duethmann, D., Avanzi, F., Alfieri, L., Libertino, A., and Gabellani, S.: Parameter transferability of a distributed hydrological model to droughts, EGU General Assembly 2023, Vienna, Austria, 23–28 Apr 2023, EGU23-417, https://doi.org/10.5194/egusphere-egu23-417, 2023.

The purpose of this study was to evaluate the applicability of medium and long-term satellite rainfall estimation (SRE) precipitation products for drought monitoring over mainland China. Four medium and long-term (19 a) SREs, i.e., the Tropical Rainfall Measuring Mission (TRMM) Multi-Satellite Precipitation Analysis (TMPA) 3B42V7, the Integrated Multi-satellite Retrievals for Global Precipitation Measurement V06 post-real time Final Run precipitation products (IMF6), Global Rainfall Map in Near-real-time Gauge-calibrated Rainfall Product (GSMaP_Gauge_NRT) for product version 6 (GNRT6) and gauge-adjusted Global Satellite Mapping of Precipitation V6 (GGA6) were considered. The accuracy of the four SREs was first evaluated against ground observation precipitation data. The Standardized Precipitation Evapotranspiration Index (SPEI) based on four SREs was then compared at multiple temporal and spatial scales. Finally, four typical drought influenced regions, i.e., the Northeast China Plain (NEC), Huang-Huai-Hai Plain (3HP), Yunnan– Guizhou Plateau (YGP) and South China (SC) were chosen as examples to analyze the ability of four SREs to capture the temporal and spatial changes of typical drought events. The results show that compared with GNRT6, the precipitation estimated by GGA6, IMF6 and 3B42V7 are in better agreement with the ground observation results. In the evaluation using SPEI, the four SREs performed well in eastern China but have large uncertainty in western China. GGA6 and IMF6 perform superior to GNRT6 and 3B42V7 in estimating SPEI and identifying typical drought events and behave almost the same. In general, GPM precipitation products have great potential to substitute TRMM precipitation products for drought monitoring. Both GGA6 and IMF6 are suitable for historical drought analysis. Due to the shorter time latency of data release and good performance in the eastern part of mainland China, GNRT6 and GGA6 might play a role for near real-time drought monitoring in the area. The results of this research will provide reference for the application of the SREs for drought monitoring in the GPM era.

How to cite: Cheng, S.: Evaluating the Drought-Monitoring Utility of GPM and TRMM Precipitation Products over Mainland China, EGU General Assembly 2023, Vienna, Austria, 23–28 Apr 2023, EGU23-571, https://doi.org/10.5194/egusphere-egu23-571, 2023.

EGU23-621 | ECS | Orals | HS4.2

Agricultural Drought Monitoring using Satellite based Surface Soil Moisture Data 

Hussain Palagiri and Manali Pal

Agricultural drought refers to a period with declining Soil Moisture (SM) content and consequent crop failure from water stress. SM plays an important role in indicating water stress and thereby identifying agricultural drought. Due to the lack of large scale, fine resolution, and accurate/quality SM many agricultural drought studies are mostly based on ground-based SM observations having limited spatiotemporal variability and cannot be applied for large scale studies. Microwave remote sensing showed capability in estimating geophysical properties like SM and paved the way for a continuous agricultural drought monitoring. European Space Agency (ESA) under Climate Change Initiative (CCI) developed an active-passive multi-satellite merged ESA CCI SM dataset. In this study, ESA CCI SM’s potential in agricultural drought monitoring is explored, by deriving Empirical Standardized Soil Moisture Index (ESSMI) to identify agricultural drought in Indian state of Telangana from 2001 to 2020. Telangana is a severely drought-prone state of India heavily impacted by significant water stress and water shortages due to frequent droughts. This increases the need for accurate agricultural drought characterization in the state. Keeping in mind the necessity of drought monitoring system for Telangana and availability of large-scale satellite soil moisture data from ESA CCI, this present study employs the ESSMI using the non-parametric distribution of ESA CCI SM data, to characterize the agricultural drought in drought prone Telangana. The efficiency of ESSMI in drought monitoring is evaluated by comparing it to the Standardised Precipitation Index (SPI) and Rainfall Anomalies (RFA) calculated from India Meteorogical Department (IMD) daily gridded rainfall data. Both the indices along with the RFA identified 2009 as dry year and 2020 as wet year. Temporal evolution of monthly drought identified by ESSMI showed monthly delayed response when compared with SPI, whereas yearly ESSMI showed consistency with SPI and RFA. Different classes of drought areas identified by ESSMI are compared with SPI which showed near normal and mild dry regions for most of the study period. ESSMI is able to effectively capture near normal to moderate drought events and shows a consistent association with the SPI and RFA both in short and long term (monthly and annual) temporal scale. The study showed the overall performance of ESSMI is reliable for agricultural drought monitoring and can be used to develop effective drought warning and risk management.

How to cite: Palagiri, H. and Pal, M.: Agricultural Drought Monitoring using Satellite based Surface Soil Moisture Data, EGU General Assembly 2023, Vienna, Austria, 23–28 Apr 2023, EGU23-621, https://doi.org/10.5194/egusphere-egu23-621, 2023.

EGU23-737 | ECS | Posters on site | HS4.2

Green Water Scarcity Index Mapping for India Using Geospatial Data Products 

Saicharan Vasala and Shwetha Hassan Rangaswamy

Green water assessment is evolving as a significant aspect of hydrological science since its existence is critical for crop production in rain-fed areas. The green water scarcity index (GWSI), which is based on evapotranspiration and effective rainfall, can assist researchers in understanding the water requirements of agriculture and the current water stress condition. To generate a GWSI map of India from 2017 to 2019 at monthly and yearly scales, this study employed Indian Meteorological Department (IMD) gridded rainfall and TerraClimate-based actual evapotranspiration data products. The results showed that India experienced low GWSI throughout the monsoon season, as was to be expected, but interestingly, there were no high GWSI values (> 0.9) during the summer months, as seen in the winter. India experienced average GWSI values of 0.87, 0.86, and 0.83 in 2017, 2018, and 2019, respectively. In comparison to other years, 2019 has a lower GWSI, and rest years have similar GWSI values in the July and December months. In contrast to how almost all months in all years have similar GWSI values, the substantial discrepancy is only seen in September 2019. Due to the high frequency of rainfall events in September 2019, the ER rate has increased, which has led to a decrease in the GWSI in India's month of September 2019. According to the findings of this study, the monsoon has less of an impact on GWSI scarcity. India experiences green water scarcity all year round, necessitating extensive irrigation for agriculture. The lack of gree water resources enabled the transition away from rainfed agriculture cultivation. This research will aid in determining the precise condition of water stress in the targeted region, as well as the zoning of water-scarce regions, so that future irrigation planning can be done appropriately.

How to cite: Vasala, S. and Hassan Rangaswamy, S.: Green Water Scarcity Index Mapping for India Using Geospatial Data Products, EGU General Assembly 2023, Vienna, Austria, 23–28 Apr 2023, EGU23-737, https://doi.org/10.5194/egusphere-egu23-737, 2023.

EGU23-1431 | Orals | HS4.2

Exhaustive Searching and LASSO for Reliable Drought Forecasting over South Korea 

Taesam Lee, Yejin Kong, Taekyun Kim, and Saejung Lee

The spring drought over South Korea has been extensive damage recent years and its forecasting can be important in water management and agricultural industries. However, the drought forecasting is not an easy task because of the difficulty to find predictors to the precipitation predictand. Also, limited hydrological records for applying to complex models such as nonlinear or deep learning models do not produce reliable forecasting results. In the current study, we proposed the drought forecasting approach by exhaustive searching for explanatory variables and a regression model for limited record lengths. At first, the target drought index was set with the accumulated spring precipitation (ASP) obtained by the median of the 93 available weather stations over South Korea. Then, exhaustive searching for predictors was performed with association between the ASP and the differences of two pair combination of the global winter MSLP, say Df4m, for the time lag of the spring seasonal drought. The 37 Df4m predictors were found with high correlation over 0.55. The detected 37 variables were categorized into three subregions. The predictors in the same region contain highly similar to each other. Subsequently, the multicollinearity problem cannot be avoidable. To solve the multicollinearity problem, the Least Absolute Shrinkage and Selection Operator (LASSO) model was applied resulting five Df4m predictors and the good agreement of the forecasting value with the observed value as R2=0.72. Therefore, we concluded that the proposed LASSO model with the exhaustive searching of the global MSLP can be a good alternative to forecast the spring drought over South Korea. The spring drought forecasting with the LASSO model and the Df4m predictors can be extensively used for water managers and water industry.  

How to cite: Lee, T., Kong, Y., Kim, T., and Lee, S.: Exhaustive Searching and LASSO for Reliable Drought Forecasting over South Korea, EGU General Assembly 2023, Vienna, Austria, 23–28 Apr 2023, EGU23-1431, https://doi.org/10.5194/egusphere-egu23-1431, 2023.

EGU23-1645 | ECS | Orals | HS4.2

Sectoral water use responses to droughts and heatwaves: analyses from local to global scales from 1990-2019 

Gabriel Antonio Cárdenas Belleza, Marc F.P. Bierkens, and Michelle T.H. van Vliet

Water security is threatened by a growing global population and the associated increase in sectoral water demand. This condition is worsened by the occurrence of droughts and heatwaves, which mainly lead to a reduction in the available water, increasing water scarcity. The resulting threats to water security are expected to become more pertinent when considering that such extreme events are expected to increase both in frequency and severity. Nonetheless, little is known about the responses in sectoral water use during extreme hydroclimatic events.


This research therefore quantifies responses in water use for different sectors (i.e. irrigation, livestock, domestic, energy and manufacturing) during droughts, heatwaves and compound events at global, regional and local scales. To achieve this, the spatial extent, times of occurrence and durations of these hydroclimatic extremes were identified worldwide for the period 1990-2019. Next, sectoral water use responses were evaluated during these extreme events and compared to normal (non-extreme) periods for sectoral water withdrawal or consumption.


Our results show that extreme events affect water use responses differently per sector and region. At a global scale, the overall use of water for domestic and irrigation sectors increased while it decreased for thermoelectric and manufacture sectors during heatwaves. Also, water use response patterns show that irrigation and domestic sectors are prioritized over livestock, thermoelectric and manufacturing on a global level. Furthermore, stronger impacts are found for heatwaves and compound events compared with impacts during droughts. Finally, our analyses show that water use drivers -such as income level, use of alternative water sources, and regulatory water policies- impact the magnitude of change in sectoral water use under these extreme events.


These results set the foundation for the development of a new global sectoral water use model which will allow more accurate quantifications of sectoral water use responses and water scarcity during present and future projected droughts and heatwaves.

How to cite: Cárdenas Belleza, G. A., Bierkens, M. F. P., and van Vliet, M. T. H.: Sectoral water use responses to droughts and heatwaves: analyses from local to global scales from 1990-2019, EGU General Assembly 2023, Vienna, Austria, 23–28 Apr 2023, EGU23-1645, https://doi.org/10.5194/egusphere-egu23-1645, 2023.

Streamflow drought is addressed as below-normal water availability in large rivers and tributaries. Streamflow drought impacts several sectors, including irrigation, river ecology, hydroelectric potential, financial, and drinking water supply. Analyzing variability in streamflow drought timing and the nonlinear interactions between drought onset and severity is necessary not only for better understanding of drought predictability but also of its temporal change, which aids in developing climate adaptation strategies. Very few studies have assessed the seasonality of streamflow droughts, although a few analyses have been performed focusing on other hydroclimatic extremes, such as extreme precipitation and floods. However, little is known about understanding the shifting behaviour of streamflow drought onset patterns at a local or regional scale. Further, a few studies have assessed the severity of low flows at a global and local scales. However, most of these studies have either considered a constant threshold approach to delineate low-flow episodes or employed sub-seasonal (monthly) temporal scales to access streamflow droughts using standardized indices of precipitation or runoff. However, none of the studies have investigated the non-linear interactions between streamflow drought onset and deficit volume and how these bivariate interactions evolve over time across large river basins. Here we investigate the timing of the streamflow drought onset and its severity (i.e., deficit volume) over 472 catchments that are spatially distributed across 21 Intergovernmental Panel on Climate Change (IPCC) Special Report on Managing the Risks of Extreme events and Disasters to Advance Climate Adaptation (SREX) reference regions in the global Tropics. We identified those catchments with little or no potential anthropogenic influences and were selected based on a detailed quality assessment of continuous streamflow records and their proximity to dam locations. We implemented a daily variable threshold approach with an 80% exceedance probability of the flow record to identify streamflow drought episodes. Moreover, based on large streamflow records, we compare the potential shifts in the seasonality of streamflow droughts in the recent (1994-2018) versus the pre-1990s (1969-1993). We show a strong persistency in the timing of streamflow drought onset in the core monsoon-dominated regions. In the northern hemisphere, the mean onset is observed primarily during August and September, whereas in the southern hemisphere, the onset timing is temporally clustered around November to March. Our proof of concept analysis suggests that North-East South-America is the most vulnerable region, in which an earlier occurrence of drought is compounded by an increasing deficit volume, indicating a drying trend throughout. Furthering this, we investigate the non-linear interactions between drought characteristics, onset time, and severity to decipher the pattern of associations across disparate climate regimes, especially in regions with pronounced seasonal cycles. The obtained insights has important implications for water resources management in tropics, where seasonal climates dominates. The findings can inform drought monitoring, planning and improve drought resilience to multiple climate stressors.

How to cite: Raut, A. and Ganguli, P.: Examining Changes in Nonlinear Interactions of Streamflow Drought Seasonality versus its Severity across Global Tropics, EGU General Assembly 2023, Vienna, Austria, 23–28 Apr 2023, EGU23-2182, https://doi.org/10.5194/egusphere-egu23-2182, 2023.

EGU23-2252 | Orals | HS4.2

Assessing the impacts of future climate change scenarios on water systems supplied by karst aquifers 

David J. Peres, Nunziarita Palazzolo, Claudio Mineo, Stefania Passaretti, Eleonora Boscariol, Anna Varriale, and Antonino Cancelliere

Water resources management is becoming increasingly challenging under current climate change. Water utilities need to assess planning adaptation strategies aimed at sustainable water resource exploitation. In this study, we estimate the potential impacts of climate change on hydrological variables and future spring discharge availability. Specifically, we exploit an empirical regressive model based on the statistical relationship between Standardized Precipitation-Evapotranspiration Index (SPEI) and minimum annual spring discharge, in combination with Regional Climate Models (RCMs) provided by the EURO-CORDEX initiative. In this regard, two Representative Concentration Pathways (RCPs) are considered, RCP4.5 (intermediate emissions scenario) and RCP8.5 (high emissions scenario), as well as two future time horizons, namely the near future 2021-2050 and the far future 2041-2070. Then, after bias correction of the so estimated minimum spring discharge values, the curves relating spring discharge and reliability in satisfying water demand are assessed. We carried out our investigation for karst aquifers located in the Italian Apennines, which are used for the water supply system of the city of Rome (Italy) and the surrounding areas, managed by ACEA Ato2, serving over 4 million users. Overall, the results indicate a general decrease in the demand that can be satisfied with high reliability, pointing out significant potential impacts of climate change on water availability on both near and far future. The proposed methodology could be a useful tool for water managers, since it provides a support for planning adaptation measures aimed at minimizing future socio-economic impacts of climate change.

How to cite: Peres, D. J., Palazzolo, N., Mineo, C., Passaretti, S., Boscariol, E., Varriale, A., and Cancelliere, A.: Assessing the impacts of future climate change scenarios on water systems supplied by karst aquifers, EGU General Assembly 2023, Vienna, Austria, 23–28 Apr 2023, EGU23-2252, https://doi.org/10.5194/egusphere-egu23-2252, 2023.

EGU23-3043 | Posters on site | HS4.2

Monthly vegetation drought forecasting using copula functions, numerical weather prediction and artificial intelligence models 

Jeongeun Won, Jiyu Seo, Chaelim Lee, and Sangdan Kim

Drought inhibits vegetation growth, triggers wildfires, reduces agricultural production and has a significant impact on the health of terrestrial ecosystems. Continuously monitoring and forecasting the effects of drought on vegetation health can provide effective information for ecosystem management. The purpose of this study is to forecast the effect of meteorological drought on vegetation, that is, the ecological drought of vegetation. Because vegetation drought is a complex phenomenon, it should be approached based on the probabilistic relationship between meteorological drought and vegetation. Accordingly, a probabilistic approach was constructed to model the bivariate joint probability distribution between meteorological drought and vegetation using the copula function. In order to predict ecological drought based on the joint probability distribution, predictive information on meteorological drought and vegetation health is required. To this end, a meteorological drought was predicted using numerical weather prediction, and a short-term vegetation prediction model considering the meteorological drought prediction results was developed. The vegetation prediction model combining Convolutional Long Short-Term Memory and Random Forest was able to improve the prediction performance of vegetation by considering spatial and temporal patterns. The vegetation drought was forecast by linking the prediction information of vegetation and meteorological drought with the joint probability distribution. The approach of this study will be able to provide useful information to respond to the drought risk in terms of ecology.


Acknowledgement

This work was supported by the National Research Foundation of Korea (NRF) grant funded by the Korea government (MSIT) (No. NRF-2022R1A2B5B01001750).

How to cite: Won, J., Seo, J., Lee, C., and Kim, S.: Monthly vegetation drought forecasting using copula functions, numerical weather prediction and artificial intelligence models, EGU General Assembly 2023, Vienna, Austria, 23–28 Apr 2023, EGU23-3043, https://doi.org/10.5194/egusphere-egu23-3043, 2023.

EGU23-3295 | ECS | Orals | HS4.2

Drivers of sustained drought over the Arabian Peninsula in recent decades 

Md Saquib Saharwardi, Hari Prasad Dasari, Karumuri Ashok, and Ibrahim Hoteit

The predominantly desert region of the Arabian Peninsula (AP), comprising seven nations, is characterized by high temperatures and meager rainfall. Temperature, and dust activity, are exacerbating over the AP. In the current study, we found that drought frequency and severity have increased in the AP over the last two decades compared to the previous five decades. This recent drought intensification is characterized by dominant decadal variability in addition to what appears to be a long-term trend. The current droughts intensification appears to be driven by increased warming over the AP than by a decrease in local precipitation. The Atlantic Multidecadal Oscillation (AMO) cycle is strongly related to decadal drought variability, and the current unprecedented multiyear drought is associated with current positive phase of AMO. We developed a statistical model for future projections that indicates that the frequency and intensity of droughts over the AP are expected to decrease significantly in the coming year.

How to cite: Saharwardi, M. S., Dasari, H. P., Ashok, K., and Hoteit, I.: Drivers of sustained drought over the Arabian Peninsula in recent decades, EGU General Assembly 2023, Vienna, Austria, 23–28 Apr 2023, EGU23-3295, https://doi.org/10.5194/egusphere-egu23-3295, 2023.

EGU23-3415 | ECS | Posters on site | HS4.2

Mapping of large-scale low water situations using satellite-based water-land boundaries 

Bastian Gessler, Silke Mechernich, Robert Weiß, and Björn Baschek

In the summers of 2018 and 2022, low water levels of German waterways massively restricted the transport performance of freight ships. Furthermore, oxygen and temperatures were critically high for the ecosystem. In such hydrological extreme situations, information on the location and shifting of the boundaries between water and terrain (water-land boundary) is relevant, e.g. for improved forecasting and monitoring of sediment displacements.

Satellite-based methods are an effective way to monitor such situations and can be used to observe large areas in a short time. Due to their independence from solar illumination and weather conditions, radar data offer considerable advantages compared to optical data. Particularly the radar satellite Sentinel-1 (ESA, Copernicus) is of great relevance, since the data are available free of charge and a continuous future supply is assured. For this reason, we use Sentinel-1 data as basic information in the project "Sat-Land-Fluss".

Here, we will present an example of S-1 water-land-boundary detection for the low water event in 2018 at the Middle Rhine. Comprehensive validation data are available, as an imagery flight was assigned by BfG on behalf of the Freiburg Waterways and Shipping Authority (WSA) at the lowest water level in November 2018. The water-land boundaries were derived from the 10-cm-resolution aerial photographs by the Federal Institute of Hydrology.

The water surfaces from S-1 data is obtained by a thresholding method of backscatter intensity. Various ancillary data were integrated and their potential for improving the result was analyzed, e.g.:

  • the location of the shipping channel (©WSA Rhein) led to a significant reduction of misclassifications, since e. g. overlay effects from ships or bridges can be removed.
  • The land cover information (©ESA World Cover 2020) allowed the correct classification of areas with low backscatter effects (e.g. agriculture) as non-water.
  • The HAND (Height Above Nearest Drainage) index from the high-resolution terrain information (DTM-5 of the Federal Agency for Cartography and Geodesy) helped to exclude areas that could be classified as not covered by water due to their topographic location.

The algorithm based only on S1-data yields about 85-92 % of correct water-classification, and together with the additional data in a)-c) we gain up to approximately 94-98 % of correct classification depending on the S-1 scene. We highlight that particularly the usage of landcover data and high resolution DTMs highly improves the reliability of the water-land boundary from S-1 data. The main remaining weaknesses are located near the water-land-boundary within approximately 50 m. Since the spatial resolution of S-1 data is rather low with about 5 x 20 m, the resulting spatial accuracy of the water-land-boundary is less than about 10 m. To improve this, the integration of a 1-m-digital terrain model of the water course (DGM-W) together with measured or predicted water level information is ongoing. This will provide water level information in areas where Sentinel-1 is not able to record information (e.g. areas of radar shadow due to vegetation, buildings, bridges or topography).

How to cite: Gessler, B., Mechernich, S., Weiß, R., and Baschek, B.: Mapping of large-scale low water situations using satellite-based water-land boundaries, EGU General Assembly 2023, Vienna, Austria, 23–28 Apr 2023, EGU23-3415, https://doi.org/10.5194/egusphere-egu23-3415, 2023.

Agro-climatological droughts have been a dominant driver of various socio-economical losses. However, the association between drought hazards & their socio-economic impacts is still less explored on a global scale. The objective of this study is to understand this linkage by globally analyzing drought hazards and their socio-economic impacts during 2001-2021.

To monitor the agro-climatological drought hazard, we have developed a new combined drought indicator (CDI) integrating satellite and reanalysis model-based four input variables (i.e., precipitation- CHIRPS data, temperature, and soil moisture – ERA5-Land data, normalized difference vegetation index – MODIS data). In CDI, the Principal Component Analysis was applied to combine all the variables. To examine the socio-economic impacts of drought hazard, we used the Geocoded Disaster (GDIS) dataset, which provided the location information of subnational-level drought events. Since GDIS shows the actual impact of drought events on socio-economic conditions, the drought vulnerability at a sub-national level can be quantified by performing a comparative analysis between CDI and GDIS.

Based on CDI, the maximum frequency of severe drought events (> 7) is observed over sub-Saharan Africa, followed by parts of south Asia. During these events, the CDI values ranged between -1.5 to -3, signifying the critical hydrometeorological conditions in the respective region. The comparative analysis shows that the CDI-based drought clusters can represent the GDIS drought events at a statistically significant level. Both CDI and GDIS methods noticed that the parts of Argentina, Brazil, the horn of Africa, western India, and north China are continuously under the grips of severe droughts. In these regions, even less severe agro-climatological (CDI) droughts have caused substantial socio-economical (GDIS) losses making these areas highly vulnerable to drought. In contrast, the outcomes of CDI also indicated extreme drought cases over parts of North America and Europe, but these events were inconsistent with GDIS, meaning that developed countries are less vulnerable to drought.

This study highlighted the importance of GDIS data for accurate drought impact assessment at the subnational level and in validating CDI. The proven subnational level association between CDI and GDIS from this study could help to identify the socio-economically vulnerable areas to drought on a finer scale and priorities the regions that demand more concern. 

How to cite: Kulkarni, S. and Sawada, Y.: Monitoring and Assessment of Global Patterns of Subnational droughts using Combined Drought Indicator and Geocoded Disaster Dataset, EGU General Assembly 2023, Vienna, Austria, 23–28 Apr 2023, EGU23-3914, https://doi.org/10.5194/egusphere-egu23-3914, 2023.

EGU23-3951 | ECS | Posters on site | HS4.2

Drought behaviour in Barcelona from its instrumental precipitation series (1786-2022) 

Josep Barriendos, María Hernández, Salvador Gil-Guirado, Mariano Barriendos, and Jorge Olcina-Cantos

The current climate change scenario increases the concern for water resource management and for the increase in the frequency of droughts in the Mediterranean region. This work proposes the analysis of the instrumental precipitation series of the city of Barcelona (1786-2022), which extends from the end of the Little Ice Age to the current climatic period. This series, due to its temporal length, constitutes a continuous scenario of pluviometric information that allows the identification and analysis of the periods in which the most severe droughts occur.

This work is organized following two main objectives. The first objective consists on the analysis of the values of this precipitation series using different statistical techniques, including drought indices. The second objective is the evaluation of the severity of the most significant drought events that appear in the instrumental precipitation series of Barcelona.

To achieve these objectives, the methodologies used in this work consist on the application of some statistical techniques on the instrumental precipitation series, such as the detection of its breaking points. At the same time, this work proposes the application of different drought indices as the SPI index and the SPEI index on the entire instrumental precipitation series of Barcelona (1786-2022). The use of these methodologies allows the comparison between the different droughts included in the instrumental series. These also allow distinguishing the most relevant droughts according to their severity. Two significant examples of the most severe droughts are the ones of the first third of 19th century (1812-1825) and the droughts of the 21st century (1998-2008). We also want to determine the relevance of the current drought (2021-2022) in contrast to the overall instrumental series of precipitation of Barcelona.

Additionally to these methodologies and results, for the most significant droughts detected in the precipitation series, it is also proposed to use monthly barometric indices to characterise the general atmospheric circulation of those periods. It would have the aim to contrast the results on the instrumental precipitation series with the synoptic conditions that produce these droughts. This comparison also would help to determine if these conditions have changed over time, especially considering recent decades in the context of current climate change.

How to cite: Barriendos, J., Hernández, M., Gil-Guirado, S., Barriendos, M., and Olcina-Cantos, J.: Drought behaviour in Barcelona from its instrumental precipitation series (1786-2022), EGU General Assembly 2023, Vienna, Austria, 23–28 Apr 2023, EGU23-3951, https://doi.org/10.5194/egusphere-egu23-3951, 2023.

EGU23-4708 | ECS | Orals | HS4.2

Is solar-induced chlorophyll fluorescence derived index much useful in agricultural drought monitoring 

Vaibhav Kumar, Hone-Jay Chu, and Mohammad Adil Aman

Drought is multifaceted, more frequent hydrometeorological phenomena occurring worldwide. The intensity and frequency of droughts are increased with rising trend of global warming. These events significantly impact society which directly linked to agricultural productivity and economy. India witnessed these extreme drought events and have faced serious economic loses. Therefore, more effective, and reliable drought monitoring is essential for its mitigation and to enhance early warning systems. In addition, there are limited studies looking at the sensitivity of solar-induced chlorophyll fluorescence (SIF) to response of meteorological parameters during drought event.   

Therefore, a maiden attempt is taken to understand how terrestrial vegetation response under severe drought event which experienced in 2009 summer monsoon period (June to September) over Indo-Gangetic plain regions in India. We studied the productivity of vegetation over IGP region using solar-induced fluorescence as a proxy. Moreover, we have derived drought indices herein Standardized Precipitation Evapotranspiration Index (SPEI), Standardized Soil Moisture Index (SSI), and SIF Health Index (SHI). These indices were utilized gridded monthly precipitation, evapotranspiration, soil-moisture, land surface temperature (LST) and solar-induced fluorescence (SIF) datasets from 2001 to 2020 over IGP region. In addition, statistical relationships and trends among these indices are evaluated through the Pearson correlation coefficient and Mann-Kendall test.

Our findings provide promising results by addressing the major drought events over Indo-Gangetic plains in India in terms of intensity and spatial coverage. There is great significance to further understand the application of SIF in agriculture drought detection. The spatio-temporal patterns and trends of standardized precipitation evapotranspiration index (SPEI), and standardized soil-moisture index (SSI), have compared against solar-induced chlorophyll fluorescence health index (SHI) anomaly for short, and mid-term (herein 01, 03 and 06 month time scales) for seasonal drought monitoring. Furthermore, the spatial extent of SPEI, SSI and SHI anomaly well agreed for the 2009 drought event across region.

Overall, SIF can be reliable tool for agricultural drought monitoring in a timely and accurate manner. The resultant water stress leads to reduction in vegetation which reflected changes in SHI anomaly. This showcasing the ability of SIF to provide insight the link between carbon and water during droughts. Furthermore, it will enhance information for stakeholders, interested into future carbon-water cycle studies.

 Keywords: SPEI, SSI, SHI, and agricultural drought.

How to cite: Kumar, V., Chu, H.-J., and Aman, M. A.: Is solar-induced chlorophyll fluorescence derived index much useful in agricultural drought monitoring, EGU General Assembly 2023, Vienna, Austria, 23–28 Apr 2023, EGU23-4708, https://doi.org/10.5194/egusphere-egu23-4708, 2023.

Extreme value statistics are well established for floods and are also receiving increasing attention in drought hydrology. They allow the user to characterize the severity of an event by a statistical probability or return period, a concept that is well understood in the scientific, policy, and public arenas. Frequency analysis is usually carried out on the basis of annual extreme event series, which  is straightforward in its application and interpretation. However, in seasonal climates with a warm and a cold season, the low-flows can be generated by different processes, which violates the basic assumptions of extreme value statistics and can lead  to inaccurate conclusions.

Here we assess the value of a mixed distribution approach for low-flows to perform frequency analysis in catchments with a mixed summer/winter regime. We first present the theoretical concept of the mixed probability estimator for low-flows. We then illustrate the characteristics of the model for archetypal low-flow regimes, from pronounced summer and winter regimes to flow mixtures with weak seasonality. We successively evaluate the gain in performance from the mixed distribution model for a range of low flow regimes, based on a comprehensive Austrian dataset. We finally scrutinize the assumption of the mixed probability estimator and review the added value of using an extended, Copula-based  framework. The results show large differences of event return periods, and suggest that the mixed estimator is relevant not only for mountain forelands, but for a much wider range of catchment typologies across Europe. These even include typical summer regimes when only single winter low-flows are mixed in. We conclude that the mixed distribution approaches outperform the conventional frequency estimator and should be used by default in seasonal climates where summer and winter low flows occur.

How to cite: Laaha, G.: The value of mixed distribution approaches for low-flow frequency analysis, EGU General Assembly 2023, Vienna, Austria, 23–28 Apr 2023, EGU23-4914, https://doi.org/10.5194/egusphere-egu23-4914, 2023.

The Standardized Precipitation Index (SPI) is applied worldwide for drought assessment. In general, in many studies, SPI was estimated from a two-parameter gamma distribution. However, in other climatic regions, there are also studies that suggest that distributions other than the Gamma distribution are more suitable. In addition, as the frequency of drought events increases, the need for daily SPI calculated with relatively short time-scales for immediate drought response is increasing. In this study, the optimal probability distribution for estimating SPI using daily precipitation in the southern part of the Korean Peninsula was explored. Gumbel, Gamma, GEV, Loglogistic, Lognormal, and Weibull are applied as candidate distributions, and optimal distributions for each season, region, and time-scale are investigated. The Chi-square test was applied to investigate the probability distribution function appropriate to the cumulative daily precipitation time series for various time-scales. In the process of calculating the SPI, when the cumulative daily precipitation has a value of 0, the cumulative probability value was calculated by reflecting the probability of having a value of 0. Then, by applying the candidate distribution, it was verified whether the estimated SPI conformed to the standard normal distribution. Finally, a more precise drought assessment could be performed by determining the optimal probability distribution for each region, season, and time-scale. It is also expected to increase the applicability of daily SPI by reducing problems that occur in a short time-scale.


Acknowledgement

This work was supported by the National Research Foundation of Korea (NRF) grant funded by the Korea government (MSIT) (No. NRF-2022R1A2B5B01001750).

How to cite: Lee, C., Seo, J., Won, J., and Kim, S.: Investigation of optimal probability distribution of Standard Precipitation Index for daily precipitation time series in Southern Korean Peninsula, EGU General Assembly 2023, Vienna, Austria, 23–28 Apr 2023, EGU23-4931, https://doi.org/10.5194/egusphere-egu23-4931, 2023.

EGU23-5680 | Orals | HS4.2

Vegetation dynamic and drought: South African savanna case study. 

María P. González-Dugo, María J. Muñoz-Gómez, Hector Nieto, María José Polo, Timothy Dube, and Ana Andreu

Semiarid rangelands are one of Africa’s most complex and variable biomes. They are a mosaic of land uses, where extensive livestock is the main economic activity, and agriculture is also crucial. They are highly controlled by the availability of water, e.g., pasture and rainfed crop production. Although the vegetation is adapted to variable climatic conditions and dry periods, the increase in drought intensity, duration, and frequency precipitate their degradation. By integrating Earth Observation data into models, we can evaluate, on the one hand, the vegetation water stress and, on the other, its primary production. This allows us to assess the interaction of both processes, improving our knowledge about the vegetation's behavior in the face of drought.


In this work, we set up an open-source cloud framework to monitor water consumption and primary production interaction over this semiarid mosaic in the long term, to analyze system tipping points. This information can help reduce the uncertainty associated with the public administration and farmers’ decision-making processes. A surface energy balance model, previously validated in the area, was applied to estimate evapotranspiration (ET) from 2000-2020 (monthly, at a 1 km spatial resolution, using MODIS data and global atmospheric reanalysis dataset). The anomalies of evapotranspiration (ET) to reference ET were used as an indicator of drought for the period. The biomass production was estimated by applying an adaptation of the Monteith LUE (light use efficiency) model based on the relationship between plant growth and incident solar radiation. The parameterization of the model corresponded to semi-natural grasslands and crops, and it was applied at a daily scale with 250 m of spatial resolution. The model’s estimation presented an acceptable agreement over the area.


Close links between grassland/crop production and drought events were found and evaluated. 2016 was the worst year regarding the state of the vegetation, followed by 2015, 2003, and 2002, all coincident with drier events (as measured by ET/ETo anomalies). The different production patterns of each patch of vegetation were visible. Although crops were mainly rainfed (probably being irrigated if necessary) and followed the precipitation rates, they were less dependent on rain than grassland. Croplands had higher production peaks during February/March than natural grasslands, although trends were similar. Production rates were much higher than usual during 2004, 2009, and 2017. These vegetation blooms came after a drought where biomass production rates were minimal. A thorough analysis of these results can provide insights to better cope with future droughts.

Acknowledgment: This work has been carried out through the project "DroughT impACt on the vegeTation of South African semIarid mosaiC landscapes: Implications on grass-crop-lands primary production" funded by the European Space Agency in the framework of the "EO AFRICA R&D Facility".

How to cite: González-Dugo, M. P., Muñoz-Gómez, M. J., Nieto, H., Polo, M. J., Dube, T., and Andreu, A.: Vegetation dynamic and drought: South African savanna case study., EGU General Assembly 2023, Vienna, Austria, 23–28 Apr 2023, EGU23-5680, https://doi.org/10.5194/egusphere-egu23-5680, 2023.

EGU23-5990 | Orals | HS4.2

Meteo-hydrological precursors of water crisis in the Turin area: a first forecasting and management chain 

Elisa Brussolo, Christian Ronchi, Alessio Salandin, Roberto Cremonini, and Secondo Barbero

The Piedmont region (north-western Italy) is located between the Alps and the Mediterranean area, two territories that are recognized as climate hotspot regions, showing amplified climate change signals and associated with environmental, social and economic impacts.
A number of water crisis that affected the Italian territory in the last twenty years exacerbated conflicts in different territories with regard to the priority use of water resource. The recent drought events (2017, 2021, and 2022) have seen areas not normally characterized by this type of phenomenon, such as the Piedmont region, go into crisis, involving all water users and human activities.
In this framework, there is a renewed urgency for improved drought monitoring, forecasting and assessment methods, that will allow for better anticipation and preparation and will lead to better management practices, in order to reduce the vulnerability of society to drought and its subsequent impacts.
As drought can be defined in a number of ways and the determination of drought magnitude and impacts can be quite complex, the top scientific priority and social challenge are the identification of meteo-hydrological precursors of water crises. This will lead from meteo-hydrological drought to socio-economic drought and drive water management and decision-making with a strong scientific basis.
In this work we  focused on the Turin area and after identifying the events that have sent in crisis the drinking water supply sources, the meteorological data and appropriate drought indexes have been analyzed. Critical thresholds and parameters have been identified and a first combined index, for developing an operational chain that can alert water utilities, stakeholders and mayors reasonably in advance, is proposed.

How to cite: Brussolo, E., Ronchi, C., Salandin, A., Cremonini, R., and Barbero, S.: Meteo-hydrological precursors of water crisis in the Turin area: a first forecasting and management chain, EGU General Assembly 2023, Vienna, Austria, 23–28 Apr 2023, EGU23-5990, https://doi.org/10.5194/egusphere-egu23-5990, 2023.

EGU23-6177 | ECS | Posters virtual | HS4.2

Influence of reservoir on propagation from meteorological to hydrological drought for Tapi river basin 

Akshay Pachore, Nirav Agrawal, Komiljon Rakhmonov, Sanskriti Mujumdar, Gulomjon Umirzakov, and Renji Remesan

Meteorological drought generally gets propagated into agricultural and hydrological drought. Hydrological drought is characterized by reduced streamflow in the river regime. Due to the interconnection between different drought types, it is important to analyze the drought propagation time. Propagation from meteorological to hydrological drought is of prime concern, as hydrological drought is having immediate consequences on industry, agriculture, and the water supply system. In the present study propagation time from meteorological to hydrological drought was studied using the spearman rank correlation coefficient for the Tapi river basin of India having semi-arid climatic conditions.  Spearman rank correlation was calculated between lagged values of the standardized precipitation index (SPI-1,2,3,4,5,6,7,8,9,10,11,12), and monthly standardized streamflow index (SSI-1). Drought propagation under the influence of the Ukai reservoir was analyzed for Sarangkheda and Ghala gauging stations. Sarangkheda station is in the upstream of the Ukai reservoir whereas, Ghala station is in the downstream. Results indicated that there is a clear influence of reservoir on propagation time from meteorological to hydrological drought. The highest correlation for the Sarangkheda station was observed for SPI-5 and SSI-1, whereas, for the Ghala station, it is for SPI-12 and SSI-1. Propagation time has significantly increased for reservoir-influenced gauging station as compared to gauging station in the natural catchment. The present study is important as information on propagation time under the influence of a reservoir can be useful to the water resource manager, stakeholders, and policymakers for doing the required preparation and taking necessary measures.

How to cite: Pachore, A., Agrawal, N., Rakhmonov, K., Mujumdar, S., Umirzakov, G., and Remesan, R.: Influence of reservoir on propagation from meteorological to hydrological drought for Tapi river basin, EGU General Assembly 2023, Vienna, Austria, 23–28 Apr 2023, EGU23-6177, https://doi.org/10.5194/egusphere-egu23-6177, 2023.

The SUDOE AQUIFER project (http://www.igme.es/aquifer/) aims at capitalizing, testing, diffusing and transferring innovative practices for groundwater monitoring and integrated management.

BRGM has developped the « MétéEAU Nappes » web platform (https://meteeaunappes.brgm.fr/fr) for several years. It enables to visualize the current and future behavior of groundwater bodies in France and to forecast groundwater availability in many monitoring wells which have been modeled using a lumped hydrological model [1].

Although more than 500 wells are monitoring groundwater level in real time in unconfined aquifers in the Adour-Garonne basin (France) (https://ades.eaufrance.fr/), none of these monitoring points have been modeled to enable 6 months groundwater levels forecast. The SUDOE AQUIFER project enables to model ten monitoring points in 2022 and 2023 to forecast groundwater levels using different climatic scenarios. These forecasts are updated on a monthly basis and can be compared to groundwater levels thresholds (piezometric drought thresholds from local authority use-restriction orders [2]).

These groundwater level forecasts are further used to predict groundwater withdrawable volume using a three-dimensional groundwater flow model in the Garonne, Tarn and Aveyron alluvial plain [3]. The main activity of this region is agriculture and the main groundwater use is crop’s irrigation. Groundwater withdrawal is especially important in the summer, and can impact the volume of groundwater reaching the rivers and sustaining their baseflow. This competition in use creates the need to accurately define potential withdrawable volumes.

Combining the lumped hydrological models with a three-dimensional groundwater flow model enables to define the potential withdrawable volume based on (1) the summer climatic scenario chosen by the decision maker, (2) the forecasted groundwater level at the end of the low-water season and (3) the status of the groundwater body (critical, balanced, conservative) to achieve at the end of the low-water season. This decision support tool is developed as a web platform and will be accessible to groundwater managers and decision makers. After choosing the groundwater level forecasted at the start of the irrigation period within 6 scenarios based on different climatic conditions, three potential withdrawable volumes will be defined depending on the status of the groundwater body considered acceptable to obtain at the end of the low-water season. This information can then be communicated to groundwater users.

These innovative practices will be extended to other regions where increase groundwater pressure forces local authority to develop methods and tools to sustainably manage groundwater bodies.

Références bibliographiques :

 [1] Mougin B., Nicolas J., Vigier Y., Bessière H., Loigerot S. (2020). « MétéEAU Nappes » : un site Internet contenant des services utiles à la gestion des étiages. La Houille Blanche, numéro 5, p. 28-36. https://doi.org/10.1051/lhb/2020045

[2] Surdyk N., Thiéry D., Nicolas J., Gutierrez A., Vigier Y., Mougin B. (2022). MétéEAU Nappes: a real-time water-resource-management tool and its application to a sandy aquifer in a high-demand irrigation context. Hydrogeology Journal. https://doi.org/10.1007/s10040-022-02509-1

[3] Le Cointe, P., Nuttinck, V., Rinaudo, JD. (2020). A Tool to Determine Annual Ground-Water Allocations in the Tarn-et-Garonne Alluvial Aquifer (France). In: Rinaudo, JD., Holley, C., Barnett, S., Montginoul, M. (eds) Sustainable Groundwater Management. Global Issues in Water Policy, vol 24. Springer, Cham. https://doi.org/10.1007/978-3-030-32766-8_13

How to cite: Beranger, S., Le Cointe, P., and Mougin, B.: Groundwater level and withdrawable volume forecasts in the Adour-Garonne basin (France) to enable sustainable groundwater management, EGU General Assembly 2023, Vienna, Austria, 23–28 Apr 2023, EGU23-6607, https://doi.org/10.5194/egusphere-egu23-6607, 2023.

EGU23-6835 | ECS | Orals | HS4.2

Multiscaling behavior of vegetation, precipitation and aridity time series in semiarid grasslands. Persistence and multifractal sources. 

Ernesto Sanz, Andrés Almeida-Ñauñay, Carlos G. Díaz-Ambrona, Antonio Saa-Requejo, Margarita Ruíz-Ramos, Alfredo Rodriguez, and Ana M. Tarquis

Grazing is an important ecosystem process affecting more than a third of the global land surface. However, it is challenging to predict responses of rangelands to changing grazing regimes due to complex interactions between grazers, vegetation and climate. Understanding the multiscaling behavior of vegetation and climate time series can be key to improving grazing and vegetation management in semiarid areas where climate change is heavily affecting vegetation-climate complex systems. 

A grassland plot in central Spain (Madrid) was selected to study this system. This plot was selected based on proximity to a meteorological station and maximum surface covered by grasses. For this plot, reflectance data were collected from MODIS (MOD09A1.006) to study the Normalized Difference Vegetation Index (NDVI). These series, from 2002 to 2020, have a 250 m spatial resolution and 8-days temporal resolution. Daily meteorological precipitation and evapotranspiration were obtained from the closest station from AEMET (Spanish Meteorological Agency). Precipitation was accumulated over 8-days and the aridity index was calculated (accumulated precipitation over accumulated potential evapotranspiration) for every 8-days to match the temporal resolution of NDVI. With these three series (NDVI, precipitation and aridity), multifractal detrended fluctuation analysis was performed, to calculate the persistence (H2) and multifractality. Furthermore, this was also done to these series after shuffling and surrogating them. 

The aridity index showed a high persistent character, while precipitation had a light persistence and NDVI showed no persistence or antipersistence, instead, it had a random character. The aridity index and NDVI displayed a decrease in H2, progressively, when surrogate and shuffle series were used. On the other hand, precipitation showed a higher H2 when the surrogate series was used compared to the original series. The shuffle precipitation series had a lesser value of H2 than the original and surrogate precipitation series. The increase in persistence on the precipitation surrogate series, have been reported in other precipitation series and it may indicate that the year that cause a decrease in persistence in the original series are separated along the original series. 

The most multifractal series was found to be NDVI followed by aridity index and finally precipitation. The multifractality always declined when the surrogate series was used in all series. Moreover, when shuffle series were used multifractality was almost eliminated in NDVI shuffle series, but some was retained for precipitation and aridity index, showing a larger source of multifractality due to the probability density function in these two series, mixing with a long-range correlation source of multifractality (mostly dominant for NDVI). 

Acknowledgements: The authors acknowledge the support of Clasificación de Pastizales Mediante Métodos Supervisados - SANTO, from Universidad Politécnica de Madrid (project number: RP220220C024).

Bibliography:

Baranowski, Piotr, et al. "Multifractal analysis of meteorological time series to assess climate impacts." Climate Research 65 (2015): 39-52.

Sanz, Ernesto, et al. "Generalized structure functions and multifractal detrended fluctuation analysis applied to vegetation index time series: An arid rangeland study." Entropy 23.5 (2021): 576.

Sanz, Ernesto, et al. "Clustering Arid Rangelands Based on NDVI Annual Patterns and Their Persistence." Remote Sensing 14.19 (2022): 4949.


How to cite: Sanz, E., Almeida-Ñauñay, A., Díaz-Ambrona, C. G., Saa-Requejo, A., Ruíz-Ramos, M., Rodriguez, A., and Tarquis, A. M.: Multiscaling behavior of vegetation, precipitation and aridity time series in semiarid grasslands. Persistence and multifractal sources., EGU General Assembly 2023, Vienna, Austria, 23–28 Apr 2023, EGU23-6835, https://doi.org/10.5194/egusphere-egu23-6835, 2023.

EGU23-6869 | ECS | Orals | HS4.2

Vegetation response to extreme drought events in northern Italy 

Alice Baronetti, Matia Menichini, and Antonello Provenzale

The increase in drought conditions is one of the main consequences of climatic change, that affects both natural and socioeconomic systems. Northern Italy is historically rich in water resources, and one of the most fertile areas in Italy. However, in the last decades drought events increased also here, affecting the hydrological behaviour of the Po River and vegetation growth.

This study aims to quantify the spatial distributions of drought events and identify their effects on vegetation greenness in northern Italy during the 2000-2020 period using MODIS images at 1 km spatial resolution. For this purpose, correlation maps between fields of bi-weekly vegetation indices (NDVI and EVI) and drought indices (SPI and SPEI) were estimated.

The NDVI and EVI indices were extracted from the atmospherically corrected MODIS images and vegetation trends were investigated by mean on the Mann-Kendall test. To analyze drought events, 150 daily precipitation ground station series were collected, aggregated at bi-weekly scale, reconstructed, homogenised and spatialised at 1km resolution by mean of the Universal Kriging with auxiliary variables. Land Surface Temperature (LST), assumed as air temperature, was collected from MODIS images. Pixels with clouds were removed, and the accuracy was determined against the high resolution gridded temperature dataset available for northern Italy. The NDVI-LST space was investigated at yearly scale exploring the link between NDVI and LST for 6000 random points in the study area. Evapotranspiration was estimated by means of the Hargreaves equation and severe and extreme drought episodes were detected by means of drought indices (SPI and SPEI) calculated at 12-, 24- and 36-months aggregation time. Trends were analysed and the main drought events were characterised, identifying the percentage of area under drought, and the magnitude, duration and frequency of droughts. Each pixel was analysed to investigate the impacts of severe and extreme drought events on vegetation properties, and the Pearson’s correlation between NDVI/EVI and SPEI/SPI at different time scales was estimated. Finally, on the basis of the correlation maps and on the CORINE Land Cover 2020, drought impacts on different vegetation communities at medium (12 months) and long (24 and 36 months) time scales were detected as the percentage of vegetation under drought stress.

The study highlights the importance of applying multiple indices to study droughts, since even though positive temperature trends were recorded in northern Italy, in the last two decades the main trigger of droughts is the lack of precipitation. Moreover the western portion of northern Italy was mostly interested by drought intensification. The investigation on drought duration revealed that the longest extreme drought events were detected in the Po Valley, where the strongest negative impacts on vegetation were detected. The results also indicated that first droughts interested herbaceous vegetation, while subsequently affecting also sparse and open forests.

How to cite: Baronetti, A., Menichini, M., and Provenzale, A.: Vegetation response to extreme drought events in northern Italy, EGU General Assembly 2023, Vienna, Austria, 23–28 Apr 2023, EGU23-6869, https://doi.org/10.5194/egusphere-egu23-6869, 2023.

EGU23-6903 | Orals | HS4.2

Winter Warm Spells and snowpack ablation in western North America 

Lucia Scaff, Sebastian Krogh, Keith Musselman, Adrian Harpold, Mario Lillo-Saavedra, Ricardo Oyarzún, Yanping Li, and Roy Rassmusen

Winter warm spells (WWS) are extreme temperature anomalies that might impact the snowpack. WWS amplify snowmelt and sublimation in mountain regions with uncertain consequences to timing and volume of water resources. Most studies focus on the spring season when snowmelt rates and streamflow response are high. However, winter snowmelt events are important in places where the snowpack and air temperatures are closer to the freezing point during winter, and thus it will become important in other regions in a warmer climate.

This study aims to understand the effect of WWS on snowpack ablation patterns in the mountainous western North America and how they might change under a warmer climate. For this, we use two convection permitting regional climate model simulations to represent historical (2001-2013) and future atmospheric and the surface conditions. The future simulation is performed with a Pseudo Global Warming approach for a high emission scenario (RCP8.5). We verify WWS using gridded maximum daily temperature observation, and winter ablation using snow pillows. Then we characterize WWS and relate them to snowpack ablation.

Although days with ablation during WWS represent a small fraction (8.3%, 0.6 days on average), 55% of total ablation occurs during WWS over regions with significant snowpack (mean peak snow water equivalent over 150 mm). Consistently, a larger ablation rate (53%) is found during WWS than non-WWS events. Total ablation during WWS increases about 157% in a warmer climate; however, the extreme ablation (99th percentile) rates show slight decrease (5%). Classifying the domain based on its humidity and temperature, we found that ablation rates during WWS in humid regions are larger in a warmer climate than those of the dry regions, which is explained by the differences in the energy balance and the snowpack cold content. WWS predominantly drive snowmelt (93.8%) rather than sublimation (6.2%), which has relevance to water resources such as flood risk, soil moisture, and streamflow response. Furthermore, the median snowmelt rate during WWS found to increase in response to warming by 179% compared to the median sublimation rate (125%). This study provides a comprehensive description of the impact of extreme temperature events and a warmer climate over our changing snowpack. We acknowledge financial support by Centro CRHIAM Project ANID/FONDAP/15130015, and the Anillo project ACT-210080.

How to cite: Scaff, L., Krogh, S., Musselman, K., Harpold, A., Lillo-Saavedra, M., Oyarzún, R., Li, Y., and Rassmusen, R.: Winter Warm Spells and snowpack ablation in western North America, EGU General Assembly 2023, Vienna, Austria, 23–28 Apr 2023, EGU23-6903, https://doi.org/10.5194/egusphere-egu23-6903, 2023.

EGU23-7180 | ECS | Orals | HS4.2

Human interventions impacts: the role of reservoir operations on drought propagation 

Tesfaye B. Senbeta, Emilia Karamuz, Krzystof Kochanek, Jaroslaw J. Napiorkowski, and Ewa Bogdanowicz

The reservoir is a hydroengineering structure to regulate discharge in rivers and store water. It can be used for flood control, water supply, irrigation, power generation, etc. It is also used for physical water management to cope with droughts at the catchment scale. The reservoir operations can have a mitigating and/or enhancing impact on droughts and their propagation from meteorological to agricultural and hydrological drought.

The aim of the study is to assess the role of reservoir operation on drought propagation using the Sulejow and Wiory reservoirs as case studies in the catchments of the Pilica and Kamienna rivers (central Poland), respectively. Two approaches, namely hydrological modelling and the observation-based approaches, were used for the study. In the hydrological modelling method, the naturalised hydrological variables in the post-dam period simulated using the Soil and Water Assessment Tool (SWAT) were compared with the observed values in the same period, while in the observation-based approach, the upstream and downstream hydrological variables such as soil moisture (remote sensing data) and observed river discharge were used. In addition, the SWAT with reservoir was considered by applying the target reservoir release method for simulating the downstream hydrological variables and comparing it with the method without reservoir. The threshold method, based on the parameter transfer method, was applied in the analysis of drought conditions to account for the non-stationarity of the hydro-climatic variables.

Preliminary results suggest that the two approaches are consistent in showing the impact of reservoir operations on the propagation and characteristics of droughts. In addition, the comparative analysis between the reservoirs shows differences based on their purpose. The results of the study can be used to understand the propagation of drought in human-altered watersheds and to appropriately manage water resources for drought mitigation.

Acknowledgements

This work was supported by the HUMDROUGHT (https://humdrought.igf.edu.pl) project carried out at the Institute of Geophysics of the Polish Academy of Sciences and funded by the National Science Centre (contract 2018/30/Q/ST10/00654).

How to cite: Senbeta, T. B., Karamuz, E., Kochanek, K., Napiorkowski, J. J., and Bogdanowicz, E.: Human interventions impacts: the role of reservoir operations on drought propagation, EGU General Assembly 2023, Vienna, Austria, 23–28 Apr 2023, EGU23-7180, https://doi.org/10.5194/egusphere-egu23-7180, 2023.

EGU23-7193 | ECS | Orals | HS4.2

Developing a national-scale hydrological model for drought monitoring in Ireland 

Sri Vengana and Fiachra O'Loughlin

Ireland’s climate is changing with the same pattern as global trends. This has the potential to have significant impacts on precipitation and water availability throughout the country. It is vital to be able to quantify the size of these impacts. One way to do this is by hydrological models tuned for the extremes of interest. This study focuses on the development of a national scale hydrological model calibrated for droughts and low flows across Ireland. A total of 332 catchments have been used to calibrate and validate the national scale model hydrological model using the Modular Assessment of Rainfall-Runoff Models toolbox (MARRMoT) over the chosen 332 catchments. These catchments range in sizes (50km2 to 10,800 km2) and all chosen catchments have a minimum of 30 years of data available so that the model calibration and validation can be performed adequately. A few different objective functions focusing on droughts were used in calibration and validation including Kling and Gupta efficiency of discharge KGE(Q) function and logarithmic transformation based KGE. Initial results show that the simulated discharges can reproduce the observed discharges across the majority of catchments and that catchment size and the amount of baseflow are the important factors that influence the accuracy of the simulations.

How to cite: Vengana, S. and O'Loughlin, F.: Developing a national-scale hydrological model for drought monitoring in Ireland, EGU General Assembly 2023, Vienna, Austria, 23–28 Apr 2023, EGU23-7193, https://doi.org/10.5194/egusphere-egu23-7193, 2023.

EGU23-7487 | Orals | HS4.2

Monitoring of drought in the Netherlands in an online portal 

Marjolein van Huijgevoort, Esther Brakkee, Gé van den Eertwegh, Erwin Vonk, Dion van Deijl, and Ruud Bartholomeus

In 2018-2020 water managers in the Netherlands were confronted with extreme drought. This event had a large impact on nature, agriculture, shipping and drinking water supply. To better anticipate dry conditions and improve water management during a drought, up-to-date and accurate information about the meteorological and hydrological situation is crucial. During the 2018 drought it became clear that current information about groundwater levels was scattered across many different organisations. In addition, each organisation had different methods to compare current groundwater levels with historical data to indicate the severity of the drought event. There was a clear need for an uniform indication of drought severity.

We developed an online information portal with up-to-date measurements for precipitation and groundwater levels. To quantify the drought severity, the Standardized Precipitation Index (SPI), Standardized Precipitation-Evapotranspiraton Index (SPEI) and Standardized Groundwater Index (SGI) are determined. The availability of long-term records (30> years) of groundwater observations is limited for most regions in the Netherlands. Therefore, the SGI is based on simulations with a time series model for all locations for the same period (27 years). Time series models are developed for 5818 wells with observations. Several criteria have been applied to evaluate the time series model, for example, a minimum value of the explained variance, resulting in 1931 wells for which SGI values are calculated. We have also compared SGI values directly derived from observations with the SGI values from simulated groundwater levels for locations with longer time periods. This comparison indicated that due to errors or missing values in observations, the SGI values from simulations are more reliable to gain a global overview of the drought situation.

By combining the information on meteorological and hydrological drought in one decision-support system (www.droogteportaal.nl), water managers and stakeholders can now get an up-to-date overview of the current situation. Due to the uniform determination of drought severity, regions within the Netherlands can be compared. This can help to implement targeted water management decisions for adaptation measures for mitigating drought impacts. Part of the information of the portal is also included in the national drought monitor of Rijkswaterstaat (Dutch Ministry of Infrastructure and Water Management). At the moment, the portal gives forecasted information for 7 days, but the data provides an excellent opportunity to include forecasts on longer timescales ((sub-)seasonal) to improve water management.

How to cite: van Huijgevoort, M., Brakkee, E., van den Eertwegh, G., Vonk, E., van Deijl, D., and Bartholomeus, R.: Monitoring of drought in the Netherlands in an online portal, EGU General Assembly 2023, Vienna, Austria, 23–28 Apr 2023, EGU23-7487, https://doi.org/10.5194/egusphere-egu23-7487, 2023.

EGU23-7644 | Orals | HS4.2

Response of vegetation indices to drought in western Spain 

Elia Quirós and Laura Fragoso-Campón

Drought is a transitory anomaly, prolonged, characterised by a period with precipitation values lower than normal in a specific area. The initial cause of any drought is a shortage of precipitation (meteorological drought) which leads to a shortage of water resources (hydrological drought) necessary to supply the existing demand. Flash drought is a critical sub-seasonal phenomenon that can be devasted for the ecosystems and, consequently, for general economy and health. There are areas where droughts are more devastating, and Spain is in a medium risk zone. In addition to water supplies, one of the first elements where the effects of droughts are first felt is on vegetation. Recent studies have addressed the relationship between NDVI and drought events. They concluded that, although vegetation activity over large parts of Spain is closely related to the interannual variability of drought, there are clear seasonal differences in the response of the NDVI to drought.

The World Meteorological Organization (WMO) categorises various drought indices into different groups such as (a) meteorology, (b) soil moisture, (c) hydrology, (d) remote sensing and (e) composite or modelled. Within the group of indices that can be defined by remote sensing, it points out some indices as possible predictors or evaluators of drought periods such us the Enhanced Vegetation Index (EVI), Normalized Difference Vegetation Index (NDVI) and Soil Adjusted Vegetation Index (SAVI). However, WMO leaves open the use of other possible VIs for drought prediction or assessment. In the current scenario, where there are multiple vegetation indices that can be used from satellite imagery, the initial objective of the study is to establish, from a set of VIs proposed or not by the WMO, which ones have the highest correlation with drought events in the study area. This correlation will be analysed according to vegetation type  (using the categorisation of the recently published ESA World cover map), in order to attempt to determine the behaviour of the vegetation index under meteorology according to each type. The study area is located in the Extremadura region of western Spain. The mean annual precipitation of the zone ranges from 446 to 1323 mm. The precipitations occur mainly from October to April while June, July and August suffer a significant drought with none or close to zero precipitation amount. The land cover types are mainly forests, agricultural and impervious cover. Regarding the temporal extent, two episodes of severe drought (2005-2006 and 2021-2022) will be studied.

Firstly, the vegetation indices available in open collections like OpenEO or Copernicus Global Land Service will be used. All available indices will be used to create time series to be compared with meteorological time series. Once the correlation is established, it will be analysed according to the type of coverage of the World cover map, in order to establish which index correlates better with drought episodes and thus try to establish the best predictor/evaluator.

How to cite: Quirós, E. and Fragoso-Campón, L.: Response of vegetation indices to drought in western Spain, EGU General Assembly 2023, Vienna, Austria, 23–28 Apr 2023, EGU23-7644, https://doi.org/10.5194/egusphere-egu23-7644, 2023.

EGU23-8074 | ECS | Orals | HS4.2

Human and natural drought impacts on groundwater fluxes of non-Amazonian South America 

Jorge Vega Briones, Steven M. de Jong, Edwin Sutanudjaja, and Niko Wanders

The consistent impact of droughts and the progressive use of groundwater for the superficial allocation of crops has extremely increased groundwater withdrawal. The rapid economic expansion is increasing water usage and is likely to exacerbate hydrological drought. While global drought intensities are increased by 10–500\% due to human water consumption, the consequences at a regional and global scale are aggravated by changing precipitation patterns, resulting in multi-year droughts and decreased groundwater recharge. 

An essential factor to better understand how human activities affect drought characteristics and development is to quantitatively distinguish natural and human components. At the same time, we see that the recovery from a severe drought is also impacted by catchment characteristics and regional climatology. In this study, we focus on the south American non-Amazon region which has frequently experienced multi-drought periods with severe impacts on surface and groundwater.

We estimate the drought impact on groundwater with the model PCR-GLOBWB2 at a 5 arcmin resolution under natural and human influence. Aggregations of the model output at a catchment level of the groundwater and subsurface partitioned run-off was performed. To determine the influence with and without lateral water flux at high resolution, the flux differences of groundwater components such as baseflow and groundwater recharge were quantified. Finally, the drought termination (DT) framework was applied to understand the recovery response of simulated surface runoff, interflow, and groundwater recharge.

The PCR-GLOBWB2 identifies regions influenced by human impact in the non-Amazon basins, supported by the drought duration, deficit, and groundwater fluxes. The differences in fluxes show an increasing groundwater withdrawal due to irrigated zones, affecting hydrological processes at a catchment and regional scale. The recovery of fluxes during these events consists of a relevant indicator for groundwater behavior due to drought and/or human consumption. We quantified the impact on groundwater resources by addressing the land-use component to understand the variability in water volumes. This study is beneficial to identify groundwater drought vulnerability in regions where observations are lacking and help to predict drought recovery periods, lateral-flux impacts, and characteristics.

How to cite: Vega Briones, J., de Jong, S. M., Sutanudjaja, E., and Wanders, N.: Human and natural drought impacts on groundwater fluxes of non-Amazonian South America, EGU General Assembly 2023, Vienna, Austria, 23–28 Apr 2023, EGU23-8074, https://doi.org/10.5194/egusphere-egu23-8074, 2023.

EGU23-8726 | ECS | Posters on site | HS4.2

Drought Risk Assessment for an Agricultural Basin in Turkey using SPEI and SPI 

Mohammadreza Khandandel, Onur Cem Yoloğlu, Daniele Secci, Valeria Todaro, Irem Daloğlu Çetinkaya, Nadim Kamel Copty, and Ali Kerem Saysel

The Konya province in the Central Anatolia Region of Turkey features a semi-arid climate with cold winters and hot, dry summers. Although the annual precipitation of the Konya Closed Basin is about 350 mm, the basin is considered one of the main agricultural regions of Turkey. Given the effects of drought on crop yields and food security, evaluation of drought risks is crucial. This study aims to describe historical as well as future drought characteristics of the Konya basin by means of two widely used meteorological drought indices: the standardized precipitation index (SPI) and the standardized precipitation-evapotranspiration index (SPEI). The indices were calculated for different timescales (6–24-month timescale) to better assess agricultural drought conditions. For the SPEI index, the potential evapotranspiration (PET) was calculated using the Hargreaves and Samani method, commonly used in arid and semi-arid weather conditions. The analysis was performed over the period 1980-2020 using precipitation and temperature data from 18 weather stations located within Konya Closed Basin. Based on drought classification by SPI and SPEI, values equal to or lower than -2 are considered extreme droughts. The results show that the number of extreme climatic drought periods at the considered stations within the Konya basin based on SPI is higher than that based on SPEI. The findings also reveal that both SPEI and SPI characterize a general increase in drought severity, areal extent, and frequency over 2000-2010 compared to those during 1980-1990, mostly because of the decreasing precipitation and to a lesser extent rising potential evapotranspiration. To assess future drought frequencies, the drought indices were calculated using precipitation and temperature data provided by 17 regional climate models from the EUROCORDEX project. The results for both RCP 4.5 and RCP 8.5 scenarios show significantly more frequent extreme and severe droughts, particularly for the second half of the 21st century. Overall, this study implies that SPEI may be more appropriate than SPI to monitor drought periods under climate change since potential evapotranspiration increases in a warmer climate.

This work was developed under the scope of the InTheMED project. InTheMED is part of the PRIMA program supported by the European Union’s Horizon 2020 research and innovation program under grant agreement No 1923.

How to cite: Khandandel, M., Yoloğlu, O. C., Secci, D., Todaro, V., Daloğlu Çetinkaya, I., Copty, N. K., and Saysel, A. K.: Drought Risk Assessment for an Agricultural Basin in Turkey using SPEI and SPI, EGU General Assembly 2023, Vienna, Austria, 23–28 Apr 2023, EGU23-8726, https://doi.org/10.5194/egusphere-egu23-8726, 2023.

EGU23-8730 | ECS | Orals | HS4.2

Global Drought Hazard Monitoring in Rainfed Areas 

Neda Abbasi, Stefan Siebert, Petra Döll, Harald Kunstmann, Christof Lorenz, and Ehsan Eyshi Rezaei

Droughts are a significant threat to the agricultural sector in general, and rainfed farming in particular. Therefore, effective and timely responses to manage droughts and their impacts are required so that farming systems can limit the negative effects of droughts on food production. We developed a crop drought index (CDI) by integrating drought hazard and exposure and applied this index at the global scale to evaluate the influence of drought on the exposed rainfed areas for different crops. In an attempt to develop an operational, multisectoral global drought hazard forecasting system, we computed and analyzed CDI for historical periods. We further used bias-corrected seasonal climate forecasts to project the drought development in a 7-month period. The CDI was calculated by using the Global Crop Water Model (GCWM) at a global extent (5 arc-minute resolution) from 1980 to 2020. We compared the drought conditions in specific years to the CDI in the 30-year reference period 1986 to 2015. The CDI was computed for 25 specific crops or crop groups based on the relative deviation of the ratio between actual evapotranspiration (ETa) and potential evapotranspiration (ETp) in a specific year from the long-term mean ratio of ETa/ETp during the crop growing season. To test the skill of the seasonal drought forecasts, CDI computed with bias-corrected ensemble forecasts was compared to simulations with standard ERA5-reanalysis data for the year 2018 when severe drought conditions were observed across Europe and other regions. The skill of the CDI to detect drought impacts was tested for historical years by comparing the time series of the harvested area weighted CDI to detrended yield anomalies for crops and countries with predominantly rainfed production. The results of the comparison with historical yield anomalies showed that the CDI is a good indicator for negative yield anomalies, in particular in regions known to be affected regularly by droughts. The model simulations employing the bias-corrected ensemble forecasts reproduced well the reference drought condition in the year 2018 in countries such as Argentina, Australia, Italy, and Spain but showed little skill to reproduce the severe drought in Western Europe. Data availability constraints also had an impact on the accuracy of historical reconstructions and forecasts. For instance, the hazard and exposure analysis rely on static input data for crop shares and crop calendars, which can impact the results (i.e., as cropping patterns are dynamic and often can change over time). The findings suggest that bias-corrected seasonal ensemble forecasts have a significant potential to enhance seasonal drought forecasts, although the skill of the forecasts varies considerably for specific regions. Further research is needed to analyze this potential across different periods and geographies systematically to increase forecasting system efficiency and minimize processing time before this system can be run operationally. In our study, we hence want to demonstrate the current status of the CDI-based forecasting system and discuss the potential, limitations, and uncertainties of such CDI forecasts for agricultural applications.


How to cite: Abbasi, N., Siebert, S., Döll, P., Kunstmann, H., Lorenz, C., and Eyshi Rezaei, E.: Global Drought Hazard Monitoring in Rainfed Areas, EGU General Assembly 2023, Vienna, Austria, 23–28 Apr 2023, EGU23-8730, https://doi.org/10.5194/egusphere-egu23-8730, 2023.

EGU23-8917 | ECS | Orals | HS4.2

Comparison of Meteorological Drought Indices in Georgia (1931-2020) 

Mariam Tsitsagi, Zaza Gulashvili, Nana Bolashvili, and Michael Leuchner

Recently, the severity of droughts has been increasing due to climate change. Due to the multifaceted nature of droughts (meteorological, hydrological, economic, ecological, etc.), it affects almost all aspects of community life directly or indirectly, both short and long term. Georgia is characterized by diverse terrain and, accordingly, climatic conditions. Most types of climates are present in Georgia except savanna and tropical forests (from humid subtropical to dry subtropical, and climate of eternal snows and glaciers). Therefore, droughts are expressed differently in this small area (67,900 km²). The complexity of different indices used in drought studies depends on the availability of the used data. The purpose of the study was to analyze the intensity of droughts in the short and long term in the territory of Georgia and their distribution for 1931-2020. In this study, we focused on the widespread Standard Precipitation Index (SPI) and Standard Precipitation Evapotranspiration Index (SPEI).  Both indices were calculated based on the data of more than 100 rain gauges located in the study area for several time-scales including 3, 6, 12 and 24 months covering the period from 1931 to 2020. As SPI uses only precipitation data, evapotranspiration is also taken into account in SPEI, which offers a more complete picture of the background of the diversity of Georgia's climate. Daily temperature (for calculation of ET) and precipitation data are used in the research. We calculated the Pearson correlation, R² and RMSE. The correlation of SPI and SPEI allowed us to determine climate type with decisive role of temperature in assessing droughts. The frequency of severe droughts has increased throughout the country, especially in recent decades. This trend is especially striking in the case of the eastern Georgian lowland. In the example of Eastern Georgia‘s precipitation data, another trend was revealed. Here the correlation of SPI and SPEI was relatively low and decreased as the period increases; for example, the correlation for 12- and 24-month periods was lower than for 3- and 6-month periods. This shows that when assessing droughts in East Georgia, it is crucial to take into account the change in temperature along with the change in precipitation. Therefore, in western Georgia, where there is a humid subtropical climate, it is possible to create an idea about the nature of droughts only by using SPI. In the lowland of Eastern Georgia, where it is unlikely to see the accurate picture with only one index, and it is better to use multivariable indices, where along with precipitation, temperature and other data will be taken into account.

How to cite: Tsitsagi, M., Gulashvili, Z., Bolashvili, N., and Leuchner, M.: Comparison of Meteorological Drought Indices in Georgia (1931-2020), EGU General Assembly 2023, Vienna, Austria, 23–28 Apr 2023, EGU23-8917, https://doi.org/10.5194/egusphere-egu23-8917, 2023.

Effective drought characterization and monitoring are urgent challenges especially in arid and semi-arid regions. The Tensift basin is in the center-west of Morocco and is exposed to recurrent droughts. The effects of climate change, which has already led to several economic, agricultural, hydrological and social losses over the past decades, exacerbate the situation. The objective of this study is to characterize the drought in the Tensift basin and to assess its impact on water resources by using the potential of satellite products. For this purpose, satellite products and reanalysis data were selected for the evaluation of observed data in the study area. These datasets were used due to the availability of long-term data, near real-time data series, relatively high spatial and temporal resolutions and open access data. In particular, precipitation and temperature retrieved by ERA5-Land (https://cds.climate.copernicus.eu) and CHIRPS (https://www.chc.ucsb.edu/data) datasets, as well as the corresponding data observed by in-situ stations, were used and statistically analyzed and evaluated by common metrics (R, R², BIAS, RMSE, and the Nash and Sutcliffe Efficiency) to compare their performance and accuracy. The obtained results showed that most meteorological stations agree with satellite and reanalysis products, with some slight errors. Based on these results, several drought indices during the period 1982-2021 have been calculated at several spatio-temporal scales to determine the impacts of drought on water supply. The results show that the Tensift Basin suffered from multiple droughts over the past 40 years. The years 2000 and 2015, 2017, 2019, 2020, 2021 were common drought periods by either the Standardized Precipitation Index (SPI) and the Standardized Precipitation and Evapotranspiration Index (SPEI); however, the Vegetation Condition Index (VCI), which was provided by NOAA-AVHRR data (https://www.star.nesdis.noaa.gov), indicate more dry years than the other indices. The drought indices provide a powerful tool to monitor drought and its impacts on water resources. These tools could potentially allow decision makers to better manage water resources as to minimize drought impacts. Furthermore, the considered drought indices could be used separately or in combination within a drought early-warning system in the study area for drought monitoring and forecasting.

Keywords: Drought, Water supply, Satellite products, Tensift basin, Remote sensing, Reanalysis data

How to cite: Naim, M. and Bonaccorso, B.: Evaluation of satellite products for drought characterization and impact assessment on water resources in the Tensift Basin (Morocco), EGU General Assembly 2023, Vienna, Austria, 23–28 Apr 2023, EGU23-8975, https://doi.org/10.5194/egusphere-egu23-8975, 2023.

EGU23-9279 | ECS | Orals | HS4.2

Current and future drought hazards in the Flemish pear sector 

Brecht Bamps, Anne Gobin, Ben Somers, and Jos Van Orshoven

Recurring episodes of drought have become a hot topic in recent years in the Flemish pear sector. Damages associated with these episodes increasingly cause economic losses and create uncertainty for fruit growers. This trend is expected to continue in the future, as episodes of drought are likely to increase in frequency, intensity and duration as a result of climate change.

This problem calls for the development of efficient risk management methods, which rely on accurate estimates of the hazard imposed by extreme weather. Therefore, our study aims to quantify the location-specific hazard and impact of past and projected drought episodes on pear orchard vigour and productivity in the region of Flanders (Belgium). The hazard under the recent past climate is characterised based on daily historical meteorological observations (1961-2022) with 5x5 km spatial resolution (Gridded Observational Dataset of the Royal Meteorological Institute of Belgium). The future hazard is determined based on daily regional climate model projections from the CORDEX ensemble (12.5x12.5 km spatial resolution). Climate projections are bias-corrected using Multivariate Quantile Mapping based on a N‐dimensional probability density function transform.

Regional AquaCrop, a spatially distributed modelling system of the field-scale crop growth model AquaCrop1, is used to calculate the soil water balance on a daily timestep, covering the region of Flanders at a spatial resolution of 12.5x12.5 km. Phenology-dependant thresholds of critical values of the soil water potential are used to analyse the frequency, intensity, duration and timing of drought-related stress episodes for rainfed pear orchards (cv. Conférence). Moreover, changes in the characteristics of potentially damaging episodes of drought under future climates are analysed.

Preliminary findings show an increase in projected frequencies of stress-inducing occurrences under Representative Concentration Pathway (RCP) 4.5 and RCP 8.5 for the period 2022-2072 compared to the reference period 1972-2022. Moreover, spatial variation in drought hazards for pear orchards across Flanders points to local environmental factors such as soil type and groundwater depth.

The spatially explicit hazard maps associated with the future climatic conditions resulting from this analysis are useful for decision-making by fruit growers, governments and insurance companies.


1Raes, D., Steduto, P., Hsiao, T. C., and Fereres, E.: AquaCrop – the FAO crop model to simulate yield response to water: II. Main algorithms and software description, Agron. J., 101, 438–447, https://doi.org/10.2134/agronj2008.0140s, 2009.

How to cite: Bamps, B., Gobin, A., Somers, B., and Van Orshoven, J.: Current and future drought hazards in the Flemish pear sector, EGU General Assembly 2023, Vienna, Austria, 23–28 Apr 2023, EGU23-9279, https://doi.org/10.5194/egusphere-egu23-9279, 2023.

EGU23-10679 | Orals | HS4.2

Quantifying the climatic drivers of drought using a standardized aridity index 

Song Feng and Miroslav Trnka

Drought is one of the costly natural disasters that affect water resources, agriculture and ecosystems. This study developed a standardized aridity index (SAI) to quantify the short- and long-term drought, and then decipher the climate drivers of the drought on local, regional and continental scales.  The ratio of total precipitation (P) to total potential evapotranspiration (PET) for a given month or multiple months was firstly calculated, and then normalized to calculate the SAI. The contribution of P, PET as well as temperature, solar radiation, wind speed and relative humidity on SAI can be decomposed by apply partial derivation of SAI and PET algorithm (i.e., Penman-Monteith model). The SAI is highly correlated to several frequently used drought indexes.  We also examined the temporal variations and spatial extent of different droughts across the global. The contributions of different climate variables on these droughts were also examined. The spatial distribution of individual droughts and their intensity revealed by SAI are comparable to those calculated using existing drought indexes and drought monitors. For example, the 12-month SAI and other drought indexes all suggested a several drought condition in the central Europe during 2015-2020, which is unprecedented in the past 2,000 years. We found that this drought was firstly initiated by precipitation deficit, but the PET became important in the late years of this drought. On average, the precipitation contributed to 70%, while the PET contributed to another 30% to this multi-year drought. The temperature warming alone contributed to about 20% of the drought intensity.

How to cite: Feng, S. and Trnka, M.: Quantifying the climatic drivers of drought using a standardized aridity index, EGU General Assembly 2023, Vienna, Austria, 23–28 Apr 2023, EGU23-10679, https://doi.org/10.5194/egusphere-egu23-10679, 2023.

EGU23-11208 | ECS | Posters on site | HS4.2

Future drought prediction using time-series of drought factors and the US drought monitor data based on deep learning over CONUS 

Bokyung Son, Jaese Lee, Jungho Im, and Sumin Park

Predicting future drought conditions is crucial for preventing massive agricultural and/or hydrological resource damage caused by drought. This study predicts future (in this case, 3-month forecast lead time) drought conditions in the contiguous United States, especially focusing on five different dry and drought severity classes indicated by the United States Drought Monitor (USDM) during 2000-2020. A deep learning model was trained using the time-series of USDM and four different types of drought-related variables (i.e., hydro-meteorological variables) such as precipitation and temperature from Phase 2 of the North American Land Data Assimilation System. UNet, one of the image-to-image translation techniques, was used as a basic deep learning architecture to consider the spatial characteristics (extents of each drought severity class) of drought across the continent. As drought classes in USDM are ordinal, the loss function of the deep learning model was set to be able to consider ordinal problems utilizing the cross-entropy loss function. The results of the proposed model were compared to the existing seasonal drought outlooks provided by the National Oceanic and Atmospheric Administration Climate Prediction Center. The performance for the validation period (2 years) showed an overall accuracy of about 65%. When compared to the seasonal outlooks, it demonstrated about a 6% improvement in terms of overall accuracy for changing drought conditions. Future research will further discuss the performance of the proposed model with other comparable reference data and the impact of each input variable to predict future drought conditions.

How to cite: Son, B., Lee, J., Im, J., and Park, S.: Future drought prediction using time-series of drought factors and the US drought monitor data based on deep learning over CONUS, EGU General Assembly 2023, Vienna, Austria, 23–28 Apr 2023, EGU23-11208, https://doi.org/10.5194/egusphere-egu23-11208, 2023.

EGU23-11265 | Orals | HS4.2

Near-real Time Daily Drought Monitoring Using an Ensemble of Gridded Precipitation Datasets 

Olivier Prat, David Coates, Scott Wilkins, Denis Willett, Ronald Leeper, Brian Nelson, Michael Shaw, Steve Ansari, and George Huffman

We present a near-real time drought monitoring framework that uses precipitation estimates from a selection of satellite (CMORPH-CDR, IMERG) and in-situ (NClimGrid) gridded precipitation products datasets. The near-real time availability of precipitation datasets allows for the computation of the standardized precipitation index (SPI) over various time scales (30-, 90-, 180-, 270-, 365-, 730-day) and daily update of drought conditions. The three drought products generated: CMORPH-SPI (Global; 1998-present; 0.25°x0.25°degree spatial resolution), NClimGrid-SPI (CONUS; 1951-present; 0.05°x0.05°), and IMERG-SPI (Global; 2000-present; 0.1°x0.1°) are being evaluated focusing on the influence of the sensors characteristics and resolutions, differing period of record, and various SPI formulations. The remotely sensed and in-situ SPIs are also compared against existing droughts monitoring resources and in particular the US Drought Monitor (USDM).

The use of cloud-scale computing resources (Microsoft Azure, Amazon Web Services) reduces considerably the computation time. Gain in computational time and process optimization allow for the implementation of a drought amelioration module that is run conjointly with the daily SPI. The drought conditions derived from the precipitation datasets enable us to estimate the amount of deficit precipitation needed to alleviate drought conditions as a function of drought severity and accumulation periods. The process flexibility also allows for the addition of other variables (i.e. temperature, ET) to develop more complex drought indices.  For instance, daily temperature information available from NClimGrid, is used to compute the Standardized Precipitation-Evapotranspiration Index (SPEI) that is evaluated against NClimGrid-SPI over CONUS.

Finally, we present the effort to transfer the SPI from research to operation (R2O). The global daily SPI derived from CMORPH-CDR is publicly available via the Global Drought Information System (GDIS) dashboard (https://gdis-noaa.hub.arcgis.com/pages/drought-monitoring). The other products developed (NClimGrid-SPI, IMERG-SPI) are expected to be added to the existing portfolio of near-real time drought monitoring capabilities.

How to cite: Prat, O., Coates, D., Wilkins, S., Willett, D., Leeper, R., Nelson, B., Shaw, M., Ansari, S., and Huffman, G.: Near-real Time Daily Drought Monitoring Using an Ensemble of Gridded Precipitation Datasets, EGU General Assembly 2023, Vienna, Austria, 23–28 Apr 2023, EGU23-11265, https://doi.org/10.5194/egusphere-egu23-11265, 2023.

The Vietnamese Mekong Delta (VMD) is the most productive region in Vietnam in terms of agriculture and aquaculture. Unsurprisingly, droughts have been a prevalent concern for stakeholders across the VMD over the past decades. However, the VMD precipitation moisture sources and their dominant factors during drought conditions were not well understood. By using the ERA5 reanalysis data as inputs, the Water Accounting Model-2layers (WAM-2layers), a moisture tracking tool that traces moisture sources using collective information of evaporation, atmospheric moisture, and circulation, was applied to identify the VMD precipitation moisture sources from 1980 to 2020. The modelling simulation indicates that the moisture sources transported from the upwind regions dominate the VMD precipitation by 60.4% to 93.3%, and the moisture source areas vary seasonally with different monsoon types. The VMD precipitation moisture sources mainly come from the northeast area (e.g. the South China Sea) in dry seasons due to the northeast monsoon, while the southwest region (e.g. the Bay of Bengal) provides the primary precipitation moisture in wet seasons. Based on the causal inference algorithm, the driving factors in the process of moisture transport were also investigated. The results show that the specific humidity and wind speed are the dominant factors for driving moisture transport and determining the amount of VMD precipitation in dry and wet seasons, respectively. During the drought events in 2015-2016 and 2019-2020, the reduced moisture transport in the 2015 and 2016 dry seasons was mainly caused by the anomaly of both specific humidity and wind speed, while the negative anomaly of moisture sources in the 2020 dry season was dominant by the specific humidity. In the 2019 wet season, the wind speed anomaly led to the reduction of tracked moisture. These findings are important to understand the VMD precipitation moisture sources and their dominant factors during recent drought events.

How to cite: Zhou, K., Shi, X., and Renaud, F.: Understanding precipitation moisture sources of the Vietnamese Mekong Delta and their dominant factors during recent drought events, EGU General Assembly 2023, Vienna, Austria, 23–28 Apr 2023, EGU23-11377, https://doi.org/10.5194/egusphere-egu23-11377, 2023.

In the past two decades, Europe has been hit by major summer heat waves and droughts, with heavy impacts on ecology, economy and civil society.

In addition to increased risk of crop failure, forest fires and danger to human health, extensive dry conditions may lead to riverine low flows and general water scarcity. Low flow conditions can restrict river navigation, hydropower production, and limit water use for power plant cooling and irrigation agriculture. Furthermore, the ecological state of the river is impaired.

To address these challenges, setting up a hydrological model based on a large ensemble climate simulation provides the required data to evaluate the water availability under future heat and drought conditions. Therefore, we create a hydrological large ensemble with 50 realizations for the periods 1990 – 2099 featuring the Water balance Simulation Model (WaSiM). The single-model initial condition large ensemble (SMILE) CRCM5-LE (CRCM5-Large Ensemble) used consists of 50 transient simulations (50 members) of a regional climate model of 150 years each (1950-2099, 7500 model years, hourly time step, 0. 11° spatial resolution) and provides the meteorological forcing data, after bias correction and statistical downscaling to the hydrologic model application scale, for 98 gauges simulated with the WaSiM-ETH water balance model in hydrological Bavaria. Due to the high number of model years, this model chain on the one hand provides a novel way to transfer and assess the non-linear relationships of the natural variability of the climate system within the hydrological system, and on the other hand results in a sufficiently large number of extreme events to conduct a robust statistical analysis.

Based on the modeling results, the dynamics of the low flow situation in Bavaria is mapped for the reference period (1981-2010), spatial patterns of drought are highlighted, and regional correlations are identified. To allow for seasonal comparisons of the negative anomalies of the runoff event, the variable-threshold approach is used. Here, the threshold is defined as the 15th percentile for the 30-day moving average of the discharge value for each day of the year, averaged over the reference period. An undershoot of this threshold for at least 20 days is considered a drought event. The use of climate simulation data allows for an analysis of how these characteristics (intensity, duration, spatial occurrence of the drought event) will change in the future due to climate change. Emphasis is placed on the potential change in the seasonal regime and the associated impacts on river system usage. By accounting for the natural variability of the climate system through the ensemble approach, the results become more robust, particularly with respect to extremes, and strengthen confidence in the change signals that are observed.

Results of these analyses are presented using a representative sample of watersheds for the entire study area, highlighting common features as well as unique characteristics. The evaluations provide important evidence for the basic definition of low-flow events and a robust estimate of how their intensity, frequency, and seasonality changes in the future as a result of climate change impacts.

How to cite: Sasse, A., Böhnisch, A., and Ludwig, R.: Low flow in Bavaria: derivation of drought characteristics and their future development in a hydrological single-model large ensemble., EGU General Assembly 2023, Vienna, Austria, 23–28 Apr 2023, EGU23-11800, https://doi.org/10.5194/egusphere-egu23-11800, 2023.

EGU23-12010 | ECS | Posters on site | HS4.2

Hydrological drought monitoring in the Ebro basin: Standardized Soil Moisture Index 

Guillem Sánchez Alcalde, Maria José Escorihuela, and Giovanni Paolini

Recent studies manifest that the frequency and severity of droughts are increasing due to climate change. Drought stands as a major climate risk; thus, its understanding and study are of utter importance. Such phenomenon results from complex interactions between the atmosphere, the continental surface and water resources management, and it can lead to large socioeconomic impacts.

Following the work of Wilhite and Glantz, droughts can be categorized based on their severity as: meteorological, agricultural, hydrological, and socioeconomic (Wilhite, D.A.; and M.H. Glantz, 1985). The first three approaches are described by the physical impact of the drought, while the latter deals with drought in terms of supply and demand (e.g., the lack of energy, food or drinking water).

Meteorological drought is associated with a precipitation deficiency period, which can also be accompanied by high temperatures or low relative humidity. If such a period persisted in time, we would start observing a deficiency in soil moisture, and a reduction in crop population and yield. Such circumstances would indicate that we are under the influence of an agricultural drought, with the potential to evolve into a hydrological drought with time. The frequency and severity of hydrological drought are defined typically on a river basin scale, with an impact on the surface and subsurface water supply (i.e., reduced streamflow or inflow to reservoirs, lakes and ponds).

Due to the effects and frequency of droughts, monitoring them is of sheer importance. Different indices have been developed for the study of droughts, based on variables such as precipitation or vegetation status. One of the most used indices is the standardized precipitation index (SPI), which shows the deviation from average precipitation. Hence, it is related to drought hazards. Each index provides different information about the drought; therefore, a combination of indices is required to identify and assess them.

Drought indices can also be obtained from L-band (21 cm, 1.4 GHz) radiometers, which provide soil moisture data, among other variables. Soil moisture plays a key role in agricultural monitoring and drought forecasting. While vegetation-based drought indices can only be applied once the drought is already causing vegetation damage, soil moisture observations can forewarn of impending drought conditions.

The main drawback of precipitation-based drought indices is that they require in-situ data, providing a discrete image of the drought. Despite precipitation indices based on theoretical models providing a continuum picture of the drought, their performance and reliability should be taken with a grain of salt. On the other side, soil moisture data not only does not depend on any model but also displays a continuum image of the drought.

In this presentation, we will study the performance of a variety of drought indicators based on precipitation and soil moisture data in the Ebro basin region and show how they manifest hydrological drought. Namely, we have developed the standardized soil moisture index (SSI). The SSI is based on the SPI method, and we have tested this index for different integration times.

How to cite: Sánchez Alcalde, G., Escorihuela, M. J., and Paolini, G.: Hydrological drought monitoring in the Ebro basin: Standardized Soil Moisture Index, EGU General Assembly 2023, Vienna, Austria, 23–28 Apr 2023, EGU23-12010, https://doi.org/10.5194/egusphere-egu23-12010, 2023.

EGU23-12437 | ECS | Orals | HS4.2

Forest Drought Impact Prediction based on Spatio-temporal Satellite Imagery and Weather Forecasts -- A Spatio-Temporal Approach using Convolutional LSTM Models 

Emine Didem Durukan, Selene Ledain, Thomas Brunschwiler, Devis Tuia, Manuel Günther, and Benjamin Stocker

Recent hot and dry summers in Europe have had a significant impact on forest functioning and structure. In 2018 and 2019, Central Europe experienced two extremely dry and hot summers. These extremes resulted in widespread canopy defoliation and tree mortality. The objective in this study is to create a predictive model for predicting the density of vegetation, as measured by the NDVI index. We predict NDVI at a horizon of a month utilising data from the previous months as input to determine where and when drought impacts are triggered. Such predictive models should take into account both spatial and temporal dependencies between environmental variables and impacts. We hereon focus on Switzerland's forests as a region of interest to leverage high-quality model input layers and applications to typical stakeholder needs. Widely used vegetation indices and mechanistic land surface models are not effectively informed by the full information contained in Earth Observation data and the observed spatial heterogeneity of land surface greenness responses at hillslope-scale resolution. Effective learning from the simultaneous evolution of climate and remotely sensed land surface properties is challenging. Modern deep learning and machine learning techniques, however, have the capacity to generate accurate predictions while also explaining the relationship between climate and its recent history, the position in the landscape, and influences on vegetation. The task is to predict the future NDVI over forest areas, given past and future weather and surface reflectance. Giving future weather predictions as an input to the model, we are going for a 'guided-prediction' approach where the aim is to exploit weather information from forecasting models in order to increase the predictive power of the model - similar to the EarthNet2021 Challenge. Models are fully data-driven, without feature engineering and trained on spatio-temporal datacubes which can be seen as stacked satellite imagery for a specific geo-location and a timestep of past Sentinel 2 surface reflectance, past (observed) and future (forecasted) climate reanalysis, time-invariant information from a digital elevation model, and land cover map. The data pre-processing step includes implementing a customized dataset for drought impact prediction task, and a customized data sampler in order to be able to sample data (scenes) both spatially and temporally. Additional data operations include  aggregation of the weather data, normalization, and data imputation both on the image-level and missing-day level. For the prediction task, we used Convolutional Long-Short Term Memory models. In the temporal domain, models are trained on the period between 2015-2018, and be validated between 05-2019 and 09-2019. For the test period summer months of 2020 and 2021 will be used. However, in the spatial domain, for the sake of testing the generalizability of the model, different regions were used for train, validate and test processes. In order to asses the models performance on the temporal domain, tests with different training and testing window sizes are used. As for evaluating the performance of the model, Mean Squared Error was used. The project will lay the basis for an early warning platform to enable periodically updated near-term drought-impact forecasts.

How to cite: Durukan, E. D., Ledain, S., Brunschwiler, T., Tuia, D., Günther, M., and Stocker, B.: Forest Drought Impact Prediction based on Spatio-temporal Satellite Imagery and Weather Forecasts -- A Spatio-Temporal Approach using Convolutional LSTM Models, EGU General Assembly 2023, Vienna, Austria, 23–28 Apr 2023, EGU23-12437, https://doi.org/10.5194/egusphere-egu23-12437, 2023.

EGU23-12672 | ECS | Orals | HS4.2

Forest drought impact prediction based on satellite imagery and weather forecasts - a spatially distributed approach using a recurrent deep neural network 

Sélène Ledain, Emine Didem Durukan, Thomas Brunschwiler, Manuel Günther, Devis Tuia, and Benjamin Stocker

The increased frequency of temperature anomalies and drought events in Switzerland has major ecological implications, with impacts over whole ecosystems. In Swiss forests, the 2018 drought, which was the most severe drought event recorded led to widespread leaf discoloration, premature leaf-shedding, and tree mortality. While work has been carried out to analyse droughts a posteriori, the prediction of potential drought impacts would make it possible to anticipate ecological responses, manage resources and mitigate damage. Current approaches to drought prediction include mechanistic models. However, such models are often limited by data accessibility and resolution to effectively describe local effects. Deep learning models trained on remote sensing and atmospheric data have been applied to drought fore- casting, but face the “black box” issue and often discard domain knowledge on drought mechanisms.

In this work, we propose a spatio-temporal deep learning method for drought forecasting in forests based on Sentinel-2 satellite imagery and weather variables, with the inclusion of topographic and environmental information. Drought is monitored by a proxy of early leaf wilting, using the normalized difference vegetation index (NDVI) that can be derived from Sentinel-2 bands. By predicting future NDVI values of pixels, we predict the potential occurrence of droughts in the short term.

Hand-crafted features based on environmental data are used as input for the model, such as high-resolution topographic features which can capture micro-climatic effects, as well as soil- vegetation-climate relationships. Environmental information is provided to the model through data on soil and forest properties. This explicit modelling with topographic and environmental features increases the model interpretability, compared to models performing feature extraction and based only on image bands.

A sequence model with long short-term memory (LSTM) cells was selected for its capacity to learn long-term dependencies as required in our application. We implement a pipeline to process spatiotemporal data, including data aggregation, normalization, missing data impu- tation and sample pixel timeseries for the prediction task. The model is trained and tested on data between 2015 and 2021, using the mean squared error to evaluate performances. A month (3 timesteps at Sentinel-2 acquisition rate) is forecasted given the past 3 months (9 timesteps) at a specific location. We opt for a “guided prediction” approach where the model has also access to weather forecasts for the future timesteps. The model is trained and tested in different regions in Switzerland to assess its generalization in space. A feature importance study was performed to identify key factors for drought forecasting and further improve the model.

This research combines drought predictors known to have an impact in ecology and hydrology with a guided deep learning model. We offer a method for dealing with heterogeneous spatiotemporal data and train an interpretable model for forecasting potential forest drought.

How to cite: Ledain, S., Durukan, E. D., Brunschwiler, T., Günther, M., Tuia, D., and Stocker, B.: Forest drought impact prediction based on satellite imagery and weather forecasts - a spatially distributed approach using a recurrent deep neural network, EGU General Assembly 2023, Vienna, Austria, 23–28 Apr 2023, EGU23-12672, https://doi.org/10.5194/egusphere-egu23-12672, 2023.

EGU23-12961 | ECS | Posters virtual | HS4.2

A pan-European analysis of drought events and impacts 

Martina Merlo, Matteo Giuliani, Yiheng Du, Ilias Pechlivanidis, and Andrea Castelletti

A drought is a slowly developing natural phenomenon that can occur in all climatic zones, and propagates through the entire hydrological cycle with long-term economic and environmental impacts. Climate change has made drought one of the greatest natural hazards in Europe, affecting large areas and populations. Different definitions of drought exist, i.e. meteorological, hydrological, and agricultural droughts, which vary according to the time horizon considered and differ in the variable used to define them. Just as there is no single definition of drought, there is no single index that accounts for all the types of droughts. As a consequence, capturing the evolution of drought dynamics and associated impacts across different temporal and spatial scales remains a critical challenge.

In this work, we analyze existing standardized drought indexes in terms of their ability in detecting drought events at the pan-European scale using data from HydroGFD2.0 reanalysis and E-HYPE hydrological model simulations over the time period 1993-2018. We firstly compare the frequency and mean duration of drought events detected by different indexes to identify the river basins mostly affected by droughts and to assess similarities and differences in the information provided by different indexes. We then compare them with the drought impacts recorded in the Geocoded Disasters (GDIS) dataset to examine agreements and discrepancies between index-detected droughts and impact data.

Preliminary results show that different indexes generally agree in pointing out that Southern England, Northern France, and Northern Italy are the regions that experienced the highest number of drought events, whereas other regions, such as Southern Spain, experienced intense droughts events, which are not consistently indicated by all indexes. In terms of drought duration, the areas affected by the longest droughts are instead the Baltic Sea region and Normandy. Clustering the 35408 European basins according to dominant hydrologic processes reveals that the variables mainly controlling the drought process vary across clusters and depends on the characteristics of each cluster. While substantial agreement exists between observed impact and detected drought, several areas without GDIS records show critical index values. Such asymmetry can be explained by incomplete reporting in GDIS but also due to some non-physical hydrometeorological factors influencing drought dynamics, such as controlled water infrastructure, that are not adequately captured by standardized indexes. These findings suggest the need of adjusting the formulation of drought indexes to the specific characteristics of different river basins in order to improve drought detection and management.

How to cite: Merlo, M., Giuliani, M., Du, Y., Pechlivanidis, I., and Castelletti, A.: A pan-European analysis of drought events and impacts, EGU General Assembly 2023, Vienna, Austria, 23–28 Apr 2023, EGU23-12961, https://doi.org/10.5194/egusphere-egu23-12961, 2023.

In Flanders, a cumulative precipitation deficit of no less than 330 mm was calculated during the growing season of 2022 (April - September) (Soil Service of Belgium). This high precipitation deficit reflects the importance and need of additional water supply to meet the water demand and the yield potential of the crop. However, this additional water must be administered as efficiently as possible to avoid water waste, while maximizing yields. For decades, the Soil Service of Belgium already offers paid irrigation advice based on simulations with a soil water balance model calibrated with manual soil samples, and weather data, while considering weather predictions separately. With the rise of affordable, autonomous sensors and IoT (Internet-of-Things) technology, it is possible to monitor the soil moisture in a field online and in real time. The use of these sensors offers opportunities such as data accessibility, model calibration, and optimization of irrigation advice.

Soil moisture model simulations and forecasts alone may be less accurate than in situ soil moisture measurements. However, soil moisture forecasts make it possible to anticipate drought or precipitation forecasts, which makes it easier to plan irrigation in advance. Sensor data alone fall short in this respect, as sensors only provide data on the previous and current soil moisture content, but do not provide information on future soil moisture development. Both approaches can be combined by calibrating the model with sensor data via inverse modelling. In this study, DREAM is used as inverse modelling approach to estimate model parameters, including soil and crop growth parameters, as well as their uncertainty. These parameter distributions result in soil moisture simulations, and, when inserting weather forecasts, predictions, along with their uncertainty. The uncertainty of the calibrated model simulations can be used to determine the probability of the soil moisture dropping below the critical water stress threshold.

When this combined approach is compared to the irrigation advice based on a model alone, the soil moisture is simulated and predicted more accurately, resulting in a more efficient water application, while the crop experiences less stress. In the dry growing season of 2022, for example, a celery trial in Flanders (Research Station for Vegetable Production) saved about 45 mm (21%) of water without sacrificing crop quality and yield. In addition to irrigation yield responses, the approach is also validated in light of parameter estimation, and soil moisture simulations, comparing simulated and measured soil moisture content.

How to cite: Hendrickx, M., Diels, J., Vanderborght, J., and Janssens, P.: Simulating and predicting soil water content by combining soil water balance calculations, weather forecasts and soil sensors with inverse modelling for optimal irrigation advice: A case study in Flanders, 2022, EGU General Assembly 2023, Vienna, Austria, 23–28 Apr 2023, EGU23-13028, https://doi.org/10.5194/egusphere-egu23-13028, 2023.

EGU23-13266 | ECS | Orals | HS4.2

Water scarcity and climate change impacts in the Eastern Italian Alps: A case study of the Adige river basin 

Susen Shrestha, Mattia Zaramella, Giacomo Bertoldi, Marco Borga, Stefano Terzi, and Pittore Massimiliano

Over the past decade, the Adige river basin in the Eastern Italian Alps has experienced water scarcity during early spring and late summer, due to a combination of decreased snowmelt, less precipitation, and increasing water demand. This condition has caused tension and disputes between upstream and downstream water users, particularly between hydropower companies in the upstream region (Trentino/South Tyrol) and agricultural users in the downstream areas (Veneto region). The potential for water scarcity impacts to intensify and expand in the future remains a major concern with climate change leading to more frequent warm and snow droughts in the region. Informing the region's administration, institutions, communities, and businesses to manage water scarcity conditions, is essential to prepare and mitigate the potential future impacts. This work aims to explore decision-making options in drought conditions in the Adige river basin, along with the potential impacts of climate change, by exploiting hydrological models for the river basins and for the major reclamation consortium in the area. The study will focus on years with severe drought, such as the 2022 drought period, using simplified decision options and examining how the decisions to meet the water needs of hydropower agencies in the upstream part of the Adige river basin could impact agricultural water use in the downstream part. The analysis will then be repeated in similar conditions, but with the added element of climate change forcing and reduced glacier volumes in the Alps. This study will identify those needs that might not be fulfilled in certain drought scenarios providing valuable insights for decision-makers and supporting the development of effective strategies to prepare and better manage future water scarcity conditions in the region.

How to cite: Shrestha, S., Zaramella, M., Bertoldi, G., Borga, M., Terzi, S., and Massimiliano, P.: Water scarcity and climate change impacts in the Eastern Italian Alps: A case study of the Adige river basin, EGU General Assembly 2023, Vienna, Austria, 23–28 Apr 2023, EGU23-13266, https://doi.org/10.5194/egusphere-egu23-13266, 2023.

EGU23-13769 | Orals | HS4.2

Understanding drought indicator-to-impact relationships to improve drought monitoring and early warning: Thailand as a case study 

Maliko Tanguy, Lucy Barker, Michael Eastman, Chaiwat Ekkawatpanit, Daniel Goodwin, Jamie Hannaford, Ian Holman, Eugene Magee, Liwa Pardthaisong, Simon Parry, Dolores Rey, and Supattra Visessri

Thailand has already been experiencing an increase in severity and duration of its droughts as a consequence of the changing climate. Developing a reliable drought monitoring and early warning system (DMEWS) is an integral part of strengthening a country’s resilience to droughts. However, for DMEWS to be useful for stakeholders, the indicators they monitor should be translatable to potential drought impacts on the ground and, ideally, inform mitigating actions. Here, we analyse these drought indicator-to-impact relationships in Thailand, using a novel combination of correlation analysis and random forest modelling. In the correlation analysis, we study the link between meteorological drought indicators and high-resolution remote sensing vegetation indices used as proxies for general crop health and forest growth. Our analysis shows that these links vary greatly depending on land use (cropland vs. forest), season (wet vs. dry) and region (north vs. south). The random forest models built to estimate regional crop productivity provided a more in-depth analysis of the crop- and region-specific value of different drought indicators. The results highlighted seasonal patterns of drought vulnerability for individual crops, usually linked to their growing season, although the effect was somewhat masked in irrigated regions (North). This new high-resolution knowledge of crop- and region-specific indicator-to-impact links can be used as the basis of targeted mitigation actions in an improved DMEWS in Thailand. In addition, the framework developed here can be applied elsewhere in the Southeast Asia region, as well as other drought-vulnerable areas internationally, in particular those that are data sparse.  

How to cite: Tanguy, M., Barker, L., Eastman, M., Ekkawatpanit, C., Goodwin, D., Hannaford, J., Holman, I., Magee, E., Pardthaisong, L., Parry, S., Rey, D., and Visessri, S.: Understanding drought indicator-to-impact relationships to improve drought monitoring and early warning: Thailand as a case study, EGU General Assembly 2023, Vienna, Austria, 23–28 Apr 2023, EGU23-13769, https://doi.org/10.5194/egusphere-egu23-13769, 2023.

EGU23-13796 | ECS | Orals | HS4.2

Innovative system for monitoring and forecasting hydrological dynamics in semi-arid Ceará, NE-Brazil 

Klaus Vormoor, Erwin Rottler, Martin Schüttig, Axel Bronstert, Ályson Estácio, Renan Rocha, Valdenor Nilo de Carvalho Junior, Clecia Guimarães, and Eduardo Martins

The state of Ceará is located in the semi-arid northeast of Brazil and is characterized by strong inter- and intra-annual variability in precipitation. Thus, droughts and an uncertain water supply threaten the people in one of the most densely populated dryland regions in the world. To store and supply water during dry periods, tens of thousands of dams of various sizes have been built, especially since the end of the 19th century. Only 155 of these reservoirs are systematically monitored and managed. For the remaining reservoirs, there is no systematic monitoring and coordinated water resource management so far. In addition to a comprehensive monitoring, it requires an adapted hydrological modeling and forecasting tool to best manage water resources in Ceará and to reduce the impact of future droughts.

In this project, an innovative system for monitoring and forecasting hydrological dynamics in Ceará was developed in collaboration with the Federal Agency of Hydrology and Meteorology (FUNCEME). This system is based on an integrated use of climate modeling, process-based hydrological modeling, remote sensing, and existing databases. Specifically, the following three complementary products have been developed:

  • Satellite-based monitoring of stored water volume in reservoirs: Weekly monitoring of water masks of > 30,000 reservoirs is performed by evaluating and classifying Sentinel-1 scenes. The stored water volume can then be inferred from the area-volume relationship derived using high-resolution TanDEM-X CoSSC DEMs for these reservoirs during explicit drought years (i.e. when reservoirs were empty).
  • Modeling and seasonal forecasting of hydrological dynamics using WASA-SED: The process-based hydrological model WASA-SED, developed for semi-arid areas, was adapted and calibrated for the state area of Ceará. Information from satellite-based reservoir monitoring is dynamically assimilated in the simulations. Based on an ensemble of ECHAM4.6 climate simulations (updated monthly), the adapted hydrological model is used to generate seasonal forecasts with six months lead time on streamflow and reservoir filling conditions.
  • Web-based visualization of monitoring and forecast results: The results of satellite-based monitoring and dynamic hydrological modeling and forecasting are centrally managed in a database and can be retrieved from there by a web application. The corresponding information is visualized online as maps and graphics and made available to different user groups and decision makers.

How to cite: Vormoor, K., Rottler, E., Schüttig, M., Bronstert, A., Estácio, Á., Rocha, R., de Carvalho Junior, V. N., Guimarães, C., and Martins, E.: Innovative system for monitoring and forecasting hydrological dynamics in semi-arid Ceará, NE-Brazil, EGU General Assembly 2023, Vienna, Austria, 23–28 Apr 2023, EGU23-13796, https://doi.org/10.5194/egusphere-egu23-13796, 2023.

EGU23-14106 | ECS | Orals | HS4.2

Reinvestigating Groundwater Drought Using In Situ and GRACE Data 

Jinyuan Wang, Kaniska Mallick, Natascha Kuhlmann, Patrick Matgen, Stéphane Bordas, and Laurent Pfister

Groundwater plays a unique role in the terrestrial water cycle. It is one of the prime sources of water during periods of severe drought. Depletion of groundwater reaching certain thresholds substantially lead to the degradation of water quality. Among all the hydrological variables, it has a characteristics behavior due to its lagged response to precipitation, evapotranspiration, soil water content variations, and surface water variation due to anthropogenic activities. Groundwater drought has been studied in various regions in the world, which revealed significant correlation among hydrological factors, including precipitation, soil water content, and various terrestrial water storage. Terrestrial water storage variables used for monitoring groundwater drought are total water storage change (TWSC) and groundwater storage change (GWSC). While the TWSC can be estimated from the Gravity Recovery and Climate Experiment (GRACE), GWSC can be estimated from in situ groundwater level within the network of well records using relevant hydrogeological information. Previous studies showed the ability and reliability of GRACE data in groundwater monitoring in the regions under extreme drought. Hydrological model outputs, e.g., the Global Land Data Assimilation System (GLDAS), have been used to derive groundwater drought indicators that reached certain reliability. The present study conducts a systematic investigation on the ability of the GRACE data to reflect the groundwater drought conditions, by comparing in situ groundwater data, TWSC estimated from GRACE (TWSCGRACE), GWSC estimated from the conjuncture of GRACE and GLDAS (GWSCGLDAS), Standardized Precipitation Index (SPI), and satellite land surface temperature. Further, by estimating the vadose zone water storage change (VZWC) using TWSC and in situ groundwater data (VZWCin situ), as well as using TWSC and GLDAS (VZWCGLDAS), we investigate the ability of GRACE and in situ data to monitor the vadose zone water content. Our results show that TWSCGRACE correlates better with in situ groundwater data as compared to GWSCGLDAS in all three study areas located in India, Australia, and Belgium, which are some of the hotspots suffering from intensive flash drought in the recent decade. TWSCGRACE shows stronger correlation and better consistency with SPI and land surface temperature as compared to in situ groundwater data. VZWCin situ correlates well with VZWCGLDAS but is limited to data availability from the well network. Results from GWSCGLDAS and VZWCGLDAS show that hydrological model outputs can serve as replacement or supplement to estimate GWSC and VZWC when in situ groundwater data is significantly missing.

How to cite: Wang, J., Mallick, K., Kuhlmann, N., Matgen, P., Bordas, S., and Pfister, L.: Reinvestigating Groundwater Drought Using In Situ and GRACE Data, EGU General Assembly 2023, Vienna, Austria, 23–28 Apr 2023, EGU23-14106, https://doi.org/10.5194/egusphere-egu23-14106, 2023.

EGU23-14395 | ECS | Posters on site | HS4.2

Deciphering the declining runoff in the Thaya river basin 

Petr Pavlik, Milan Fischer, Adam Vizina, Juraj Parajka, Martha Anderson, Petr Štěpánek, Martin Hanel, Petr Janál, Song Feng, Evžen Zeman, and Miroslav Trnka

This study aims at understanding the changes in the water balance in the Thaya river basin over the past 40 years. The Thaya River is one of the tributaries to the Danube basin with a catchment area of more than 13 000 km2. A number of hydroclimatic variables related to runoff were examined by a trend analysis based on Theil-Sen regression and Mann-Kendall tests for the two periods 1981–2020 and 2001–2020. The latter period was selected because it allows analysis of several relevant variables derived from the Moderate Resolution Imaging Spectroradiometer (MODIS). These variables ecompass snow cover, leaf area index and land surface temperature based actual evapotranspiration.

With our analyses we confirm previously found increasing trends in air temperature, ETo, and no trends in precipitation. We also found a consistent increase of ET during spring months and indication of summer decrease (not statistically significant). This change was associated with a significant increase of spring vegetation development followed by summer stagnation. We identified a significant trend decline in runoff, mainly in the upland sourcing areas. The correlation analysis reveals a different behavior along the elevation gradient, with evapotranspiration in the uplands being limited by energy and in the lowlands by water, especially in spring. During summer, however, the entire basin is often water-limited, with a more pronounced limitation in the lowlands. According to attribution analysis for the past 20 years, the significantly decreasing runoff is driven primarily by non-significantly decreasing precipitation, significantly increasing air temperature and vapor pressure deficit. Global radiation and wind speed affect the runoff only to a very limited extent. We conclude that complex adaptation measures reflecting the site specificity and elevation gradient are needed to sustain the water dependent sectors operating in the region facing increasing aridity. 


How to cite: Pavlik, P., Fischer, M., Vizina, A., Parajka, J., Anderson, M., Štěpánek, P., Hanel, M., Janál, P., Feng, S., Zeman, E., and Trnka, M.: Deciphering the declining runoff in the Thaya river basin, EGU General Assembly 2023, Vienna, Austria, 23–28 Apr 2023, EGU23-14395, https://doi.org/10.5194/egusphere-egu23-14395, 2023.

EGU23-14822 | Orals | HS4.2

Spatio-temporal assessment of groundwater drought risk in the Souss-Massa aquifer: Impacts of climate variability and anthropogenic activity 

Soumia Gouahi, Mohammed Hssaisoune, Mohammed Nehmadou, Brahim Bouaakkaz, Hicham Boudhair, and Lhoussaine Bouchaou

Although the several studies carried out in the Souss Massa region, in terms of water resources, the assessment of the drought is still understudied, particularly groundwater drought which remains a gap in the previous studies. In this work, meteorological drought is investigated by using the standardized precipitation index (SPI) to shed light on its impact on groundwater drought occurrence. Thereafter, a combination of reliability analysis and standardized water level index (SWI) is used for groundwater risk modeling. Reliability analysis accounts for the safety and the failure of a system regarding loads, which take into account the external effects (withdrawals and recharge), and resistance which accounts for the system's capacity, thereafter values of Groundwater Drought Risk (GDR) and Environmental Hazard Index (EHI) are generated and then spatially distributed to assess groundwater risk for mild, moderate, severe, and extreme droughts for the whole region of Souss-Massa. Results showed a wavering between short dry and wet periods based on SPI, and demonstrated a weak correlation between the SPI and the SWI, hence the upward trend in the SWI is explained by the anthropogenic overexploitation of the aquifer. Furthermore, groundwater drought risk (GDR) values are low in the upper Souss and increase in the middle part and in the Massa basin, where significant effects are potentially expected. Based on the EHI results, it is confirmed that the Massa basin and the middle Souss are susceptible to groundwater drought and its environmental impact and need immediate intervention to properly manage the groundwater resources. This model could be helpful for the policymakers for better planning of water supply by providing useful information about the expected frequency and severity of water shortage in the studied area.

Keywords:
Groundwater drought, Reliability analysis, meteorological drought, anthropogenic activities, Souss Massa basin.


How to cite: Gouahi, S., Hssaisoune, M., Nehmadou, M., Bouaakkaz, B., Boudhair, H., and Bouchaou, L.: Spatio-temporal assessment of groundwater drought risk in the Souss-Massa aquifer: Impacts of climate variability and anthropogenic activity, EGU General Assembly 2023, Vienna, Austria, 23–28 Apr 2023, EGU23-14822, https://doi.org/10.5194/egusphere-egu23-14822, 2023.

EGU23-14961 | Orals | HS4.2

Multi-temporal drought rarity curves - a yearly classification of meteorological drought severity in France 

Juliette Blanchet, Baptiste Ainési, and Jean-Dominique Creutin

Droughts are recurrent phenomena, impacting eco- and socio-systems at varied temporal and spatial scales. Their impact depends on both the severity of the antecedent meteorological conditions and the recovery dynamics of the impacted systems. The drought severity analysis proposed in this study accounts for the ”memory effect” of rainfall accumulation by considering across time the rarity of antecedent precipitation at multi-temporal scales. It applies to rainfall accumulation over a single area. In this presentation, we define the yearly curve of multi-temporal drought rarity by the non exceedance probability of the smallest rainfall accumulations observed that year over a range of accumulation durations. Each rarity curve is thus defined by as many values as the number of durations considered. We apply this concept to droughts in France from 1950 to 2022, with accumulation durations varying from 4 weeks to 260 weeks. We show that the rarity curves are easy tools to summarize how droughts build and persists across time and temporal scales. We use an automatic classification of the curves to discriminate years associated to short- to long-term droughts (basically from half a year to five years). Although the concept is here used for rainfall over a single area, France, it could be applied as well to a set of areas and/or to other drought variables such as discharge or soil moisture. 

How to cite: Blanchet, J., Ainési, B., and Creutin, J.-D.: Multi-temporal drought rarity curves - a yearly classification of meteorological drought severity in France, EGU General Assembly 2023, Vienna, Austria, 23–28 Apr 2023, EGU23-14961, https://doi.org/10.5194/egusphere-egu23-14961, 2023.

EGU23-15473 | ECS | Posters on site | HS4.2

The implementation of the GEOframe system in the Po River District for the hydrological modelling and water budget quantification 

Gaia Roati, Giuseppe Formetta, Marco Brian, Silvano Pecora, Silvia Franceschi, Riccardo Rigon, and Herve Stevenin

As observed in the last years, flood and drought events are getting more likely to happen due to climate change and can cause significant environmental, social and economic damages.

For this reason, already in 2021, the Po River District Authority (AdbPo) undertook the implementation of the GEOframe modelling system on the whole territory of the district in accordance with the GCU-M (Gruppo di Coordinamento Unificato-Magre) to update the existing numerical modelling for water resource management and with the objective of producing a better quantification and forecast of the spatial and temporal water availability across the entire river basin and, finally, to improve the planning activity of the

Authority.

The GEOframe system was developed by a scientific international community, led by the University of Trento, and is a semi-distributed conceptual model, with high modularity and flexibility, completely open-source.

The implementation of GEOframe in the Po River District has begun in the Valle d’Aosta Region, the most upstream part of the district.

After an initial part of meteorological data collection, validation, spatial interpolation, and geomorphological analysis, a first running of the model to assess all the components of the hydrological balance (evapotranspiration, snow accumulation, water storage and discharge) was carried out.

Consequently, the calibration phase started, consisting of the research of the values of the characteristic parameters of the model which fit the discharge evolution recorded in the hydrometers of the region in the best possible way, comparing the modelled discharge trend with the measured one.

The calibration, based on KGE method, has been executed in 10 hydrometers in Valle d’Aosta across a 4 years period. The results were encouraging, with an objective function of 0.76 at the closure point of the region.

The same process is now in progress in Piemonte, one of the biggest regions of Italy, which contains more than 100 hydrometers. The resulting objective functions are in general rather high and will be presented in this work.

At the same time, thanks to the geomorphological analysis, most part of Po River District (up to Pontelagoscuro (FE)), which totally occupies more than 42,000 km2, has been divided into subbasins, the hydrological reference units where the simulation process takes place, and this dataset will be open-source and shared with the scientific community.

On the other hand, the interpolation and spatialization of the meteorological data will be carried out according to the 1 km2 European Environmental Agency reference grid.

In conclusion, in this initial stage of implementation of the model and calibration of its parameters, it was possible to assess the capacity of GEOframe to simulate not only the water discharge but also the other components of the water cycle, namely the evapotranspiration, the water storage and the snow accumulation. Furtheremore, implementing GEOframe in a mountainous area underlines the importance and the influence that snow and glaciers, especially in a higher temperature scenario due to climate change, can have on water availability and, therefore, a better modelling component of these elements will be implemented in the future developments of GEOframe.

How to cite: Roati, G., Formetta, G., Brian, M., Pecora, S., Franceschi, S., Rigon, R., and Stevenin, H.: The implementation of the GEOframe system in the Po River District for the hydrological modelling and water budget quantification, EGU General Assembly 2023, Vienna, Austria, 23–28 Apr 2023, EGU23-15473, https://doi.org/10.5194/egusphere-egu23-15473, 2023.

EGU23-16413 | ECS | Posters on site | HS4.2

Comparing the performance of process-based models for drought simulation in Scotland 

Shaini Naha, Kit Macleod, Zisis Gagkas, and Miriam Glendell

Scotland is increasingly vulnerable to periods of dry weather, impacting water users and the natural environment. In 2022, large parts of Scotland have experienced water scarcity, resulting in Scotland Environmental Protection Act (SEPA) suspending water abstractions for abstraction licence holders in some Scottish catchments. To understand and manage these water scarcity events in Scotland, we need to monitor and model the drought processes. This research is a part of a Scottish Government funded project ‘Understanding the vulnerabilities of Scotland’s water resources to drought’ which has been co-constructed with a range of national level stakeholders and aims to understand what the specific impacts of droughts are and what are the vulnerabilities that may apply to Scotland under future change. This includes the understanding of the spatial variability and characteristics of future hydrological drought events and short-term forecasting of drought duration to inform adaptive catchment management, while considering water resources requirements of different user sectors. As a first step towards constructing a national short-term drought forecasting framework, we have reviewed the state-of-the art hydrological modelling approaches currently applied in the UK. Our review suggests a lumped conceptual model, GR6J and a distributed hydrological response unit-based model, HYPE, are the most appropriate hydrological models for both simulating and short-term forecasting of droughts, based on the following criteria: openly available model code, proven ability at simulating and forecasting low flows, and widely used and supported model. In next steps, we will design a common modelling framework for drought simulation and forecasting in Scotland. Using both HYPE and GR6J, we will set up and test both models in a medium size long-term monitoring test catchment in Tarland in northeast Scotland (~70km2) where we have good process understanding and recent hydro climatological datasets. Comparison of the model performances of HYPE and GR6J will guide us to take a decision on which model to move forward with for upscaling in Scotland. Machine learning approaches for low-flow forecasting using long-short-memory networks will also be explored in developing a multi-model drought forecasting ensemble.  

Keywords: Drought, water scarcity, modelling, HYPE, GR6J, forecasting 

How to cite: Naha, S., Macleod, K., Gagkas, Z., and Glendell, M.: Comparing the performance of process-based models for drought simulation in Scotland, EGU General Assembly 2023, Vienna, Austria, 23–28 Apr 2023, EGU23-16413, https://doi.org/10.5194/egusphere-egu23-16413, 2023.

EGU23-16778 | Orals | HS4.2

Understanding the hydrological drought processes in the Paraná River Basin. 

Luz Adriana Cuartas, Thais Fujita, Juliana Andrade Campos, Ana Paula Cunha, Cintia Berttachi Uvo, Elisangela Broedel, and José Antonio Marengo

Brazil has endured the worst droughts in recorded history over the last decade, resulting in severe socioeconomic and environmental impacts. The country relies heavily on water resources, with 77.7% of water consumed for agriculture (irrigation and livestock), 9.7% for industry, and 11.4% for human supply. Hydropower plants generate about 64% of all electricity consumed. One of the most impacted basins was the Paraná River basin It concentrates a third of the Brazilian population in urban centres such as São Paulo, the largest city in Latin America, thus it is the river basin with the greatest demand in the country. This basin is also the most important in hydropower generation, by the highest install capacity for hydropower; 57 reservoirs in the main steam and its tributaries (Grande, Paranaíba, Tietê, Paranapanema and Iguaçu Rivers), with Itaipu having the largest installed capacity (14,000 MW). This study aimed to advance the state of knowledge regarding hydrological drought patterns in the Paraná River Basin for improved monitoring and forecasting.

Droughts, like all hydrometeorological processes, are multivariate processes, that is, they are the result of the interaction of multiple hydrometeorological, climatic, and anthropogenic variables, among others. Therefore, several studies have shown the need to consider a multivariate approach to analysis and modelling drought events, which allows a better evaluation of the characteristics and conditions of its.

In this study we applied: i) well know univariate drought index: SPI, SPEI and SSFI; ii) a multivariate index, obtained through the Copulas Theory and; iii) potential soil moisture conditions obtained through the Normalized Terrain Model HAND, to understand and characterized hydrological droughts in the Paraná River Basin and Subbasins. We used rainfall data from CHIRPS, streamflow data obtained from the Brazilian National Electrical System Operator (ONS) and the National Water and Sanitation Agency (ANA), the SPEI global drought monitor dataset and HAND MERIT dataset (90 m spatial resolution).

The results show that the hydrological droughts in the last decade of 1981–2021, were the most severe and intense. Among the indices, SPEI, SSFI and the multivariate index, presented the strongest evidence, at time scales of 12, 24, 36 and 48 months. The multivariate index together with HAND information allow us to understand better the process of developing, duration, and recovery of drought events.

How to cite: Cuartas, L. A., Fujita, T., Andrade Campos, J., Cunha, A. P., Berttachi Uvo, C., Broedel, E., and Marengo, J. A.: Understanding the hydrological drought processes in the Paraná River Basin., EGU General Assembly 2023, Vienna, Austria, 23–28 Apr 2023, EGU23-16778, https://doi.org/10.5194/egusphere-egu23-16778, 2023.

EGU23-16949 | Orals | HS4.2

Effective hydrological drought monitoring depending on the catchment's hydrological regime 

Oscar Manuel Baez Villanueva and Mauricio Zambrano-Bigiarini

There is an expected increase in the occurrence and severity of hydrometeorological extremes in many regions worldwide. Current research indicates that despite a positive trend in reducing drought impacts, most regions still need to adapt their monitoring practices to cope with projected drought events effectively. On the other hand, we still need a clear understanding of how a changing climate can modify the hydrological regime of catchments in the future. Therefore, it is essential to understand which drought indicators are relevant to monitoring catchments with different hydrological regimes.

Therefore, this study aims to elucidate which drought indices are required to effectively monitor hydrological drought depending on the catchment’s hydrological regime, using  100 near-natural Chilean catchments with contrasting climatic conditions and hydrological regimes as a case study. For this purpose, different drought indices were computed at different temporal scales: SPI and SPEI at 3, 6, 9, 12, and 24 months; the Empirical Standardised Soil Moisture Index (ESSMI) at 3, 6, and 12 months; and a standardised snow water equivalent index (SSWEI) at 3 and 6 months. State-of-the-art gridded datasets used for computing the drought indices were: CR2MET v2.5 (a Chilean dataset based on ERA5) for precipitation and potential evapotranspiration; ERA5, ERA5-Land, and SMAP (L3 and L4) for soil moisture; and ERA5 and ERA5-Land for snow water equivalent. These indices were evaluated against the Standardised Streamflow Index (SSI) to select indices that are able to effectively monitor hydrological droughts, considering different hydrological regimes. A cross-correlation analysis and an event coincidence were used to assess which index had the highest correlation with SSI. Results showed that the indices and temporal scales used to effectively monitor hydrological droughts changed according to the catchment's hydrological regime. The results of the present work are pivotal for water managers as they provide insights on how the hydrological regime of the catchments should be considered in drought monitoring.

How to cite: Baez Villanueva, O. M. and Zambrano-Bigiarini, M.: Effective hydrological drought monitoring depending on the catchment's hydrological regime, EGU General Assembly 2023, Vienna, Austria, 23–28 Apr 2023, EGU23-16949, https://doi.org/10.5194/egusphere-egu23-16949, 2023.

EGU23-17222 | Posters on site | HS4.2

Risks of Future Droughts and their Impacts on Scottish Private Water Supplies 

Sayali Pawar, Sarah Halliday, Paola Ovando, and Miriam Glendell

In recent years, Scotland has been experiencing lower-than-average rainfall in the spring and summer seasons leading to water scarcity in many parts of the country, especially during the summer months. Climate change is likely to exacerbate these dry conditions even more in the future, presenting significant risks to water resources management. Businesses and households, especially those relying on Private Water Supplies (PWS) in rural areas, such as boreholes and springs, have already observed noticeable changes in the quantity and quality of water during the dry periods. Around 3.5% of the Scottish population relies on PWS which includes households, industries, agriculture, and the tourism industry. This study aims to project future drier periods from 2041-2080 across Scotland on a 1-km grid, using the Standardised Precipitation and Evapotranspiration Index and the observed meteorological data from 1981-2020 as the baseline. Results suggest low to extreme drought conditions in all 1-km cells , with increases in dry conditions likely to be highest in the eastern parts of Scotland, showing a distinct spatial variability in drought characteristics across Scotland. In future work, past and future drought occurrences will be linked with the water quality characteristics of PWS to understand the likely impact of future droughts on Scotland’s water security. The water quality dataset has been made available from the Drinking Water Quality Regulator for Scotland for the period 2006-2020 for nearly 6000 PWS locations. These PWS have been monitored twice a year on an average for their water quality. They span across 25 administrative areas in Scotland and represent roughly 27% of the total PWS in Scotland.  Water quality variables such as faecal coliforms, E.coli, iron, turbidity, lead, pH, colour, nitrate and phosphate will be included in the analysis to facilitate planning for effective, resilient water resources management and ensure access to clean water to maintain health and livelihoods. 

How to cite: Pawar, S., Halliday, S., Ovando, P., and Glendell, M.: Risks of Future Droughts and their Impacts on Scottish Private Water Supplies, EGU General Assembly 2023, Vienna, Austria, 23–28 Apr 2023, EGU23-17222, https://doi.org/10.5194/egusphere-egu23-17222, 2023.

EGU23-17360 | ECS | Orals | HS4.2

Drought characterization across Peru and Ecuador and its relationship with ocean-atmospheric indices 

Fiorella Vega-Jácome, Axel Bronstert, Carlos Antonio Fernandez-Palomino, and Waldo Lavado-Casimiro

Peru and Ecuador have suffered high economic losses because of extreme events (Floods and Droughts). The analysis of the meteorological droughts and their drivers is of paramount importance for water resources management and risk assessment in these countries. This study aims to characterize the spatiotemporal variability of droughts across Peru and Ecuador over the last four decades (1981-2020) and evaluate the relationship with the ocean-atmospheric circulation patterns. The Rain for Peru and Ecuador (RAIN4PE) gridded precipitation dataset was used to estimate the Standardized Precipitation Index (SPI) at time scales of 3 and 12 months to assess short and long-term droughts, respectively. Droughts were characterized by the number of events, duration, intensity, and severity, and the relationship was evaluated by computing the Pearson correlation to identify the leading oceanic-atmospheric indices: E (Eastern Pacific SST anomalies), C (Central Pacific SST anomalies), PDO (Pacific Decadal Oscillation), SOI (Southern Oscillation Index), MEI2 (Multivariate Enso Index), TPI (Tripole Index for the Interdecadal Pacific Oscillation), TNA (Tropical North Atlantic index), and TSA (Tropical Southern Atlantic Index).

The results show high spatiotemporal variability of drought characteristics with the high frequency of extreme droughts over the southern Peruvian Andes in Peru and the eastward of the Andes in Ecuador. The ranking of the extremeness of drought events based on the areal extent, duration, and intensity identified that three of the four more extreme events match ENSO conditions in Peru (1992/02, 1988/08, 1990/01) and Ecuador (1985/04, 1990/01, 1995/04). Finally, strong relationships between ocean-atmospheric indices and droughts in Peru and Ecuador were identified. Droughts in Peru evidence significant correlations with E, C, and TNA indices. Similarly, droughts in Ecuador show high correlations with E, C, PDO, TPI, and SOI indices. These results provide more insights into the characteristics of droughts and the possible drivers, information that is useful for water resource management decisions and can help as the basis for developing drought forecasts.

How to cite: Vega-Jácome, F., Bronstert, A., Fernandez-Palomino, C. A., and Lavado-Casimiro, W.: Drought characterization across Peru and Ecuador and its relationship with ocean-atmospheric indices, EGU General Assembly 2023, Vienna, Austria, 23–28 Apr 2023, EGU23-17360, https://doi.org/10.5194/egusphere-egu23-17360, 2023.

EGU23-17410 | ECS | Orals | HS4.2

Environmental Vulnerability Assessment of Anthropogenic Droughts in Regulated Basins 

Ali Mehran and Amir AghaKouchak

Man-made local water supply infrastructure (in particular reservoirs) affects future water availability because it is built specifically to cope with climatic extremes. A system with multiple reservoirs, and therefore more local resilience, will be less vulnerable to climatic change and variability compared to a system with limited local capacity to cope with extremes. Therefore, different regions will see different water availability changes depending on their local infrastructure and capacity to cope with variability or adapt to change. The key questions that are studied in this proposal is the extent and intensity of environmental impact of the water stress. To address the question, this study proposes a multidisciplinary framework that integrates top-down (local inflows) and bottom-up (historical water use categories) factors to quantify the human induced water stress in each reservoir and the overall impact on the system’s resilience (water availability). The human induced water stress in regulated basins (with multiple reservoirs) is tracked by assessing the historical water use categories, which are later used to develop hypothetical water demand scenarios for near-future water stress assessment. Recent studies have shown that by changing water use policies, the system builds up resilience to cope with water stress. Our study explores reservoirs with multiple basins and tracks the policy changes impact on the system regarding the reservoirs orientation in the basin. Furthermore, this study tracks the environmental impact of the socioeconomic drought condition in regulated basins and highlights the changes due to water use policies.

How to cite: Mehran, A. and AghaKouchak, A.: Environmental Vulnerability Assessment of Anthropogenic Droughts in Regulated Basins, EGU General Assembly 2023, Vienna, Austria, 23–28 Apr 2023, EGU23-17410, https://doi.org/10.5194/egusphere-egu23-17410, 2023.

EGU23-282 | ECS | Orals | HS4.3

Developing a user-focused flood forecast product for a continental-scale system 

Gwyneth Matthews, Hannah Cloke, Sarah Dance, Cinzia Mazzetti, and Christel Prudhomme

Floods are the most common and disastrous natural hazards, but early warning systems can help mitigate the damage by increasing preparedness. However, the products from these early warning systems must be skilful and actionable to be useful in the event of a flood. The European Flood Awareness System (EFAS), part of the European Commission's Copernicus Emergency Management Service, provides complementary flood forecasts to EFAS partners across the whole of Europe. One forecast product provided by EFAS is the ‘post-processed forecast product’ which is generated for the location of approximately 1600 river gauge stations where sufficient historic and near-real time river discharge observations are available. The aim of this product is to provide an error-adjusted forecast up to a maximum lead-time of 15 days. However, the post-processing methodology and the product design of the post-processed forecast product has not evolved over the past few years and therefore may not satisfy user’s changing requirements nor benefit from recent scientific advances. Following a skill assessment of the EFAS post-processed forecasts and a consultation with the EFAS partners a roadmap for future developments of the EFAS post-processed forecast product was designed. Here, we present this roadmap, and the results of the first stages, which include increasing the temporal resolution to 6-hourly timesteps, improvements to the post-processing methodology to better account for the different hydroclimatic regimes across Europe, and changing the post-processed forecast product to make it more locally relevant and useful to the EFAS Partners.

How to cite: Matthews, G., Cloke, H., Dance, S., Mazzetti, C., and Prudhomme, C.: Developing a user-focused flood forecast product for a continental-scale system, EGU General Assembly 2023, Vienna, Austria, 23–28 Apr 2023, EGU23-282, https://doi.org/10.5194/egusphere-egu23-282, 2023.

EGU23-613 | ECS | Posters on site | HS4.3

Bayesian neural network-based satellite fog detection 

Prasad Deshpande, Shivam Tripathi, and Arnab Bhattacharya

Fog, an essential component of the hydrological cycle, is frequently experienced in North India during winter. The reduced visibility due to fog causes many accidents and delays in trains and flights, leading to loss of health and economy. Hence real-time detection and forecast of fog are crucial for mitigating these losses. The study proposes an algorithm to detect fog using satellite observations. The algorithm consists of Bayesian Neural Networks containing weights as probability distributions, unlike ordinary neural networks that treat weights as deterministic parameters. This algorithm provides prediction uncertainty. Both epistemic (data-dependent) and aleatoric (model-dependent) uncertainties are modelled. The final output is the percentage chances of fog which can be suitably thresholded into fog/no-fog. In this study, in situ airport weather records (METAR) are used as reference observations, whereas satellite observations are obtained from the 6 bands of the INSAT-3D geostationary satellite (with a spatial resolution of 4 km). Sub-hourly data of wintertime observations from 2016 to 2020 for seven cities spread across North India are used to train and validate the proposed methodology. The model performs better than the INSAT-3D fog product developed by ISRO. The critical success index of INSAT-3D fog product and the proposed method are 0.17 and 0.44, respectively, whereas Cohen’s Kappa values are 0.22 and 0.50, respectively. The uncertainty analysis shows that aleatoric uncertainty is generally higher than epistemic uncertainty. Moreover, for observations having higher aleatoric uncertainty, the epistemic uncertainty is also high, showing a positive correlation. The real-time predictions are disseminated on the website (www.fog.iitk.ac.in) for the public and scientists. This work is a part of the Fog Prediction using Data Science project.

How to cite: Deshpande, P., Tripathi, S., and Bhattacharya, A.: Bayesian neural network-based satellite fog detection, EGU General Assembly 2023, Vienna, Austria, 23–28 Apr 2023, EGU23-613, https://doi.org/10.5194/egusphere-egu23-613, 2023.

EGU23-1536 | ECS | Orals | HS4.3

Statistical generation of fine-resolution precipitation data in Ganga and Godavari River basins of India using limited training datasets 

Nibedita Samal, Akshay Singhal, Ankit Singh, and Sanjeev Kumar Jha

The Ganga and Godavari are major rivers of India and are known for satisfying the agricultural needs of most part of the country. In the past few decades, these basins have seen increased geohazard scenarios such as floods, flash floods, landslides, etc. The availability of fine-scale precipitation data is a necessity for accurate monitoring and routine issuance of flood warnings. Downscaling of precipitation is a challenging task due to the complex topography of the basin, seasonality of the Indian rainfall, and large-scale influence of meteorological variables. In this study, we set up a Multiple-Point Statistics (MPS) based statistical downscaling approach using available precipitation data of the previous years to generate precipitation data for future at a finer resolution. The MPS approach uses the Training Image (TI) as input, hence we investigate into the adequate length of the past data record required for setting up the statistical model. We also investigate whether the length of data used as a TI in one River basin has any similarity in the other River basin. Further, what is the minimum year of data required to set up the statistical model. This is done by diving the datasets into five sets of TIs with each succeeding set larger than the previous one. This study uses datasets from High Asia Refined Analysis (HAR) (30×30 km) and the Integrated Multi-satellitE Retrievals for GPM (IMERG) (10×10 km) as the reanalysis and observation data respectively for a time period of 2001 to 2014. The idea is to explore if MPS is able to reproduce proper spatial features even with smaller TI data. The work is significant as it will benefit the hydrologists and water resource managers. The work is in progress and the results of the study will be presented at the conference.

How to cite: Samal, N., Singhal, A., Singh, A., and Jha, S. K.: Statistical generation of fine-resolution precipitation data in Ganga and Godavari River basins of India using limited training datasets, EGU General Assembly 2023, Vienna, Austria, 23–28 Apr 2023, EGU23-1536, https://doi.org/10.5194/egusphere-egu23-1536, 2023.

EGU23-2950 | Orals | HS4.3

Evaluation of continental-scale ensemble hydrological forecasts from Environment and Climate Change Canada: a comparison with forecasts from the Global Flood Awareness System (GloFAS) 

Vincent Fortin, Silvia Innocenti, Étienne Gaborit, Dorothy Durnford, Setigui Keita, Jacob Bruxer, Marie-Amélie Boucher, Shaun Harrigan, Ervin Zsoter, Milena Dimitrijevic, Caroline Sévigny, Nicole O'Brien, and Natalie Gervasi

Environment and Climate Change Canada (ECCC) is in the process of deploying a continental-scale hydrological prediction system known as the National Surface and River Prediction System (NSRPS). Operating at a resolution of 30 arc seconds, NSRPS currently generates Ensemble Streamflow Predictions (ESPs) for over four million grid points. Issued once per day, the ensemble is composed of twenty members and provides 16-day forecasts. NSRPS differs from other hydrological forecasting systems in operational use in Canada by being continental in scope and by relying on an Earth System Modelling (ESM) approach for prediction. In order to assess the value of forecasts issued by NSRPS, a comparison is performed with a similar ESP system available over all of Canada: the Global Flood Awareness System (GloFAS) from the European Centre for Medium-Range Weather Forecasts (ECMWF). The evaluation focusses on the Great Lakes and St. Lawrence watershed as well as the Nelson and Churchill watersheds, each over one million km² in size. 393 streamflow stations are identified where NSRPS and GloFAS agree on the watershed delineation. The comparison is limited to the Spring, Summer and Fall of 2022 due to NSRPS forecast data availability. For most stations, NSRPS performs better than GloFAS in terms of Continuous Ranked Probability Score (CRPS), but the median of the potential CRPS across the 393 stations is very similar for days 3-16. Both systems suffer from a lack of spread, particularly for short lead times, but the problem is slightly more acute for GloFAS. Bayesian Model Averaging (BMA) is explored in order to obtain calibrated probabilistic forecasts that perform better than both NSRPS and GloFAS. 

How to cite: Fortin, V., Innocenti, S., Gaborit, É., Durnford, D., Keita, S., Bruxer, J., Boucher, M.-A., Harrigan, S., Zsoter, E., Dimitrijevic, M., Sévigny, C., O'Brien, N., and Gervasi, N.: Evaluation of continental-scale ensemble hydrological forecasts from Environment and Climate Change Canada: a comparison with forecasts from the Global Flood Awareness System (GloFAS), EGU General Assembly 2023, Vienna, Austria, 23–28 Apr 2023, EGU23-2950, https://doi.org/10.5194/egusphere-egu23-2950, 2023.

EGU23-2956 | Posters on site | HS4.3 | Highlight

Evaluation of Seasonal Streamflow Forecasts over South American Large Rivers 

Ingrid Petry, Fernando Fan, Vinicius Siqueira, Walter Collischonn, Rodrigo Paiva, Erik Quedi, Cléber Gama, Reinaldo Silveira, Camila Freitas, and Cássia Aver

Society’s increasing demand for water and the need for its long-term management have motivated efforts toward improving seasonal streamflow forecasts. Currently, seasonal climate forecasts are routinely issued in meteorological centers around the world, generating information for decision-making and seasonal streamflow forecasting (SSF) studies that are becoming more frequent. Seasonal streamflow forecast skill derives from land surface initial conditions and atmospheric boundary conditions that mostly depend on large-scale climate phenomena (such as ENSO). Thus, seasonal rainfall predictions produced by dynamic climate models that represent ocean-atmosphere interactions may have a positive impact on streamflow forecasts. In South America, seasonal streamflow forecasts are essential for the hydropower sector, which is responsible for ~65% of the electric energy produced in countries such as Brazil. In this work, we assessed seasonal streamflow forecasts over South America based on a continental-scale application of a hydrologic-hydrodynamic model and precipitation forecasts from the ECMWF's fifth generation seasonal forecast system (SEAS5). Seasonal streamflow forecasts (SEAS5-SF) were evaluated against a reference model run and forecast skill was estimated relative to the Ensemble Streamflow Prediction (ESP) method. The bias correction of SEAS5 predicted precipitation improved the performance of the seasonal streamflow forecasts, frequently turning negative skill results into near null to positive skill. Results indicate that the ESP remains a hard-to-beat method for seasonal streamflow forecasting in South America. SEAS5-SF skill was found to be dependent on initialization month, season, basin and forecast lead time, with greater skill on the initialization month lead time. Rivers where the forecast skill is higher were Amazon, Araguaia, Tocantins and Paraná.


Acknowledgments: This work presents part of the results obtained during the project granted by the Brazilian Agency of Electrical Energy (ANEEL) under its Research and Development program Project PD 6491-0503/2018 – “Previsão Hidroclimática com Abrangência no Sistema Interligado Nacional de Energia Elétrica” developed by the Paraná State electric company (COPEL GeT), the Meteorological System of Paraná (SIMEPAR) and the RHAMA Consulting company. The Hydraulic Research Institute (IPH) from the Federal University of Rio Grande do Sul (UFRGS) contribute to part of the project through an agreement with the RHAMA company (IAP-001313).

How to cite: Petry, I., Fan, F., Siqueira, V., Collischonn, W., Paiva, R., Quedi, E., Gama, C., Silveira, R., Freitas, C., and Aver, C.: Evaluation of Seasonal Streamflow Forecasts over South American Large Rivers, EGU General Assembly 2023, Vienna, Austria, 23–28 Apr 2023, EGU23-2956, https://doi.org/10.5194/egusphere-egu23-2956, 2023.

EGU23-4349 | Orals | HS4.3

Confidence intervals for the reliability diagram 

Jan Verkade

The reliability diagram is often used to assess the reliability of a set of probabilistic forecasts. It plots the observed relative frequency of an event against its predicted probability. Reliability is evaluated by assessing the distance of the plotting positions from the diagonal which designates 'perfect reliability'. The reliability diagram is easy to construct and to understand. However, there is a caveat: it is not immediately clear which distance from the diagonal would still be considered 'reliable'. Due to finite sample size, even a perfectly reliable forecasting system could result in a reliability diagram where not all points are on the diagonal. Various authors have proposed visual guidance that allows a forecaster to assess whether the observed relative frequencies fall within the variations that can be expected even when a forecasting system is perfectly reliable. These include 'consistency bars', a modified version of the reliability diagram which is plotted on probability paper and  a 'standardized reliability diagram' based on the Normal transform of the Poisson binomial distribution. The present contribution provides another method to visualize the expected deviation from the diagonal: confidence intervals based on the Poisson binomial distribution. The application is demonstrated in various case studies.

How to cite: Verkade, J.: Confidence intervals for the reliability diagram, EGU General Assembly 2023, Vienna, Austria, 23–28 Apr 2023, EGU23-4349, https://doi.org/10.5194/egusphere-egu23-4349, 2023.

EGU23-4846 | ECS | Posters on site | HS4.3

Are ensemble NWP forecasts now so good that calibration is unnecessary? 

James Bennett, David Robertson, Durga Lal Shrestha, Kim Robinson, and Andrew Schepen

For streamflow forecasting, calibration of ensemble numerical weather prediction (NWP) models has long been considered a necessary evil. Necessary, because NWP forecasts are usually too biased to force calibrated hydrological models, they often produce unreliable ensembles and may produce forecasts that are less accurate than simple climatology at longer lead times. Evil, because calibration adds complexity to any forecasting system and the calibration process destroys spatial, temporal and inter-variable correlations in the ensemble, which then must be reconstructed in various and usually unsatisfying ways. As ensemble NWPs improve, the degree to which calibration is ‘necessary’ declines.

Here we investigate recent versions of two ensemble NWP models – the European Centre for Medium-range Weather Forecasts ensemble NWP (ECMWF-ens) and the Bureau of Meteorology’s Australian Community Climate and Earth-System Simulator Global Ensemble (ACCESS-GE) NWP. The models are tested over Tasmania, where CSIRO is working with Hydro Tasmania, Australia’s largest generator of hydropower, to establish new ensemble streamflow forecasting systems. Tasmania is mountainous and temperate and features strong rainfall gradients. We apply an existing calibration method – the Catchment-scale Hydrological Precipitation Processor (CHyPP) – which uses a Bayesian Joint Probability model to calibrate ensemble precipitation forecasts.

We show that CHyPP improves reliability in both the ECMWF-ens and ACCESS-GE ensembles, but these improvements come at the cost of a slight reduction in skill at short lead times. Uncalibrated ACCESS-GE forecasts generally produce more biased and less reliable forecasts than ECMWF-ens, and we conclude that calibration is necessary for the ACCESS-GE model, both to reduce biases and improve reliability. However, the improvements in bias from calibrating the ECMWF-ens are negligible in some catchments, with the main benefit being improved reliability at longer lead times. This brings into question the need for calibration of the ECMWF-ens model with CHyPP. We note that these findings may not hold outside the Tasmanian catchments tested, where high resolution ensemble NWP forecasts generally perform well. We discuss the implications of these findings with respect to streamflow forecasts.

How to cite: Bennett, J., Robertson, D., Shrestha, D. L., Robinson, K., and Schepen, A.: Are ensemble NWP forecasts now so good that calibration is unnecessary?, EGU General Assembly 2023, Vienna, Austria, 23–28 Apr 2023, EGU23-4846, https://doi.org/10.5194/egusphere-egu23-4846, 2023.

EGU23-5511 | Orals | HS4.3 | Highlight

A skill assessment of the European Flood Awareness System notifications 

Jesús Casado Rodríguez, Corentin Carton De Wiart, Stefania Grimaldi, and Peter Salamon

The European Flood Awareness System (EFAS) of the Copernicus Emergency Management Service is an operational forecasting system whose aim is to raise awareness about floods in European transnational rivers. It produces probabilistic, medium-range discharge forecasts twice a day by running the open-source hydrological model LISFLOOD with four different meteorological forcings, two deterministic forecasts from the DWD (German Weather Service) and the ECMWF (European Centre for Medium Range Weather Forecasts), respectively, and two probabilistic forecasts from ECMWF and the Cosmo Consortium (COSMO-LEPS). Based on these forecasts, flood notifications are issued to the EFAS partners if a set of criteria is met: contributing area larger than 2000 km², lead time from 48 to 240 h, at least one deterministic model exceeds the discharge threshold (5-year return period), and at least one probabilistic model predicts 30% exceedance probability of that discharge threshold for three or more consecutive forecasts.

The operational EFAS is being regularly updated, so the configuration of EFAS has changed since the time these notification criteria were defined. For instance, the temporal resolution has increased from daily to 6-hourly, and the spatial resolution is planned to improve from 5km to approximately 1.5 km (1 arcminute).

This study aims at assessing the skill of the notification criteria above presented with the current system setup, and to derive a new set of criteria that optimizes the notification skill. We will focus on three research questions: (i) how can we combine the different models (deterministic and probabilistic) into a grand ensemble and what probability threshold optimizes skill? (ii) Is the persistence criterion (i.e. 3 consecutive forecasts need to provide persistent predictions of high flood risk) adding to the skill both at shorter and larger lead times? (iii) Can we reduce the contributing area threshold without compromising skill?

The study will make use of reanalysis, driven by meteorological observations, and forecast data at over 2300 stations across Europe for a time span from October 2020, which was the release time of the last major change in the EFAS setup, until present. By comparing the reanalysis data with the simulated discharge threshold, a total of 1327 “observed” flood events have been identified in the 2 years from October 2020 to October 2022. The “notified” events will be computed by comparing the forecast data against the notification criteria; we will compute skill metrics (f1, Hanssen-Kuipers) at each daily lead time for different combinations of meteorological forcing and notification criteria in order to find the procedure that maximizes the skill of EFAS notifications and to assess the above research questions.

The outcome of this study will be applied to the EFAS operational system, directly impacting the preparedness of the relevant authorities in future flood events.

How to cite: Casado Rodríguez, J., Carton De Wiart, C., Grimaldi, S., and Salamon, P.: A skill assessment of the European Flood Awareness System notifications, EGU General Assembly 2023, Vienna, Austria, 23–28 Apr 2023, EGU23-5511, https://doi.org/10.5194/egusphere-egu23-5511, 2023.

EGU23-5632 | ECS | Orals | HS4.3

Surface Water Flood forecasting using reasonable worst case scenarios from ensemble rainfall forecasts 

Ben Maybee, Cathryn Birch, Steven Boeing, Thomas Willis, Linda Speight, Aurore Porson, Kay Shelton, Charlie Pilling, and Mark Trigg

Surface water flooding (SWF) presents a significant risk to livelihoods, which is projected to increase under climate change. However, forecasting the intense convective rainfall that causes most SWF on the temporal and spatial scales required for effective flood forecasting remains extremely challenging. National scale flood forecasts are currently issued for England and Wales by the Flood Forecasting Centre (FFC). The forecasts are well regarded amongst flood responders, although they feel they would benefit from more location-specific information.

We have developed an enhanced, regional-scale surface water flood forecast system driven by post-processed ensemble rainfall forecasts. We apply a neighbourhood post-processing method to generate percentile-based reasonable worst case rainfall scenarios from the UK operational Met Office Global and Regional Ensemble Prediction System (MOGREPS-UK), a 2.2km horizontal resolution, convection-permitting operational ensemble system that provides forecasts at up to 5 days lead time. Enhanced surface water flood forecasts are then generated by conducting look-ups of meteorological inputs against catchment-level hydrological reference data from the national Environment Agency Risk of SWF mapping database. In this manner the likely severity of flooding associated with forecast rainfall events is assessed by reference to the driving hyetographs for local-scale hydrological modelling, which is available nationally.

Evaluation of the forecasts is informed by both quantitative assessment and qualitative user feedback. We tested the new forecast system over Northern England over summer 2022 and held a co-development workshop with professional and volunteer flood responders, in which we presented participants with existing and new forecasts for recent case-study flood events. We found that responders would routinely use the enhanced forecasts if they were offered as a complement to existing operational provision, with the enhanced information having the strongest impact on decision making for severe, high impact flood events. Responders valued having access to more localised forecast information, which was viewed as useful for decision making, despite the necessity of accepting a higher degree of forecast uncertainty.

We evaluated the SWF forecasts over a historical 10-year period for days with observed SWF events across Northern England and, to assess false alarms, we verified them against SWF forecasts produced using radar observations for several summers’ continuous daily forecasts. The method is effective at forecasting impacts from higher impact flood events, although still generally over-estimates the extent of affected areas. The results of quantitative skill assessment will form a key basis for determining future operational deployment across England and Wales, which we will discuss the feasibility of and requisite next steps.

How to cite: Maybee, B., Birch, C., Boeing, S., Willis, T., Speight, L., Porson, A., Shelton, K., Pilling, C., and Trigg, M.: Surface Water Flood forecasting using reasonable worst case scenarios from ensemble rainfall forecasts, EGU General Assembly 2023, Vienna, Austria, 23–28 Apr 2023, EGU23-5632, https://doi.org/10.5194/egusphere-egu23-5632, 2023.

EGU23-5735 | ECS | Orals | HS4.3

A polyglot tool for the evaluation of deterministic and probabilistic streamflow predictions 

Thibault Hallouin, François Bourgin, Charles Perrin, Maria-Helena Ramos, and Vazken Andréassian

Whether they refer to it as validation, verification, or evaluation, hydrological practitioners regularly need to compute performance metrics to measure the differences between observed and simulated/predicted streamflow time series. While the metrics used are often the same (MAE, NSE, KGE, Brier, CRPS, etc.), the tools used to compute them are seldom the same. In some cases, specific tools are not used and the computation of the metrics are directly hand written in the scripts used to analyse model outputs. In addition, the computation of performance metrics is often accompanied with a variety of pre- and post-processing steps that are rarely documented (e.g. handling of missing data, data transformation, selection of events, uncertainty estimation). This can be error prone and hinder the reproducibility of published results. The sharing of tools computing these performance metrics is likely limited by the variety of programming environments in the hydrological community, and by well-established practices in operational environments that are difficult to modify. In order to enable the sharing between researchers and practitioners and move towards more reproducible hydrological science, we argue that an evaluation tool for streamflow predictions must be polyglot (i.e. that it must be usable in several programming languages) and that it must not only compute the performance metrics themselves, but also the pre- and post-processing steps required to compute them. To this end, we present a new open source, polyglot, and compiled tool for the evaluation of deterministic and probabilistic streamflow predictions. The tool, named “evalhyd”, can be used in Python, in R, and as a command line tool. We will present the concept behind its development and illustrate how it works in practice through examples from operational streamflow predictions in France. We will also discuss further steps and remaining challenges in the evaluation of hydrological model predictions.

How to cite: Hallouin, T., Bourgin, F., Perrin, C., Ramos, M.-H., and Andréassian, V.: A polyglot tool for the evaluation of deterministic and probabilistic streamflow predictions, EGU General Assembly 2023, Vienna, Austria, 23–28 Apr 2023, EGU23-5735, https://doi.org/10.5194/egusphere-egu23-5735, 2023.

EGU23-6796 | ECS | Orals | HS4.3

Enhancing the seasonal forecasts from large-scale hydro-climate services to better meet the local conditions 

Yiheng Du, Ilaria Clemenzi, and Ilias Pechlivanidis

A key challenge in continental and global hydro-climate services deals with the incomplete (or even lack of) incorporation of local knowledge and data from the users. Here, we demonstrate the regional skill of seasonal forecasts from large-scale hydro-climate services, while we present a framework that accounts for local data and with the use of machine-learning enhances the seasonal forecasts by better capturing the local information. Five European case studies subject to different hydro-climate conditions and user needs are selected. We test our framework using the E-HYPE hydrological model forced by bias-adjusted ECMWF SEAS5 seasonal meteorological forecasts. We firstly assess the skill of seasonal hydrological forecasts using pseudo-reality and “real” local observations as reference. The skill assessment is driven by the local needs and hence it is conducted for different target hydro-climatic variables and conditions (i.e. floods and droughts). This first evaluation sets the benchmark for quantifying the added value from a machine-learning enhanced hydro-climate service. We next introduce a post-processing workflow to take advantage of the available local observations and potentially improve the forecasting skill. Here, quantile mapping and machine-learning post-processors are tested in the case study areas to further tune the output from the European hydro-climate service towards the local observations. Results from these hybrid seasonal forecasts show potentials to meet the local conditions and consequently address the user expectations from the service. The current work is highlighting the way forward for machine-learning enhanced services that allow tailoring large-scale hydro-climate services using local knowledge and data.

How to cite: Du, Y., Clemenzi, I., and Pechlivanidis, I.: Enhancing the seasonal forecasts from large-scale hydro-climate services to better meet the local conditions, EGU General Assembly 2023, Vienna, Austria, 23–28 Apr 2023, EGU23-6796, https://doi.org/10.5194/egusphere-egu23-6796, 2023.

EGU23-7722 | Posters on site | HS4.3

Assessing seasonal meteorological and hydrological forecasts across South Korea 

Yongshin Lee, Andres Peñuela-Fernandez, Francesca Pianosi, and Miguel Rico-Ramirez

Due to the intensified impact of climate change, the intensity and severity of catastrophic droughts is increasing all over the world. South Korea had also suffered from extreme droughts, including a recent a drought that prolonged from 2013 to 2015 and caused nation-wide crop failures. As one of the measures to anticipate droughts and mitigate damages, past studies have evaluated the use of seasonal forecasts in other regions. However, few studies have focussed the assessment at catchment-scale, which is more suitable for practical water management, and no studies were found on the assessment of seasonal forecasts over South Korea.

Firstly, we assessed the skill of Seasonal Precipitation Forecasts (SPFs) over the 20 catchments in South Korea where the largest reservoirs are located, over the period 2011 to 2020. Ensemble SPFs from 4 weather forecasting centres (ECMWF, UK Met Office, Météo France and DWD) were evaluated, and the skill quantified using the Continuous Ranked Probability Skill Score (CRPSS). We analysed how the skill of the seasonal meteorological forecasts varies across the seasons and years, before and after bias correction, and if the skill can be linked to catchments characteristics. In doing so, we developed a methodology and a Python package to implement it, which is freely available for future applications to other regions (https://github.com/uobwatergroup/seaform.git). The results showed that amongst the four forecasting centres, SPFs by ECMWF were the most skilful in South Korea. In particular, they generally outperformed climatology for up to 2 months of lead time and during the Wet season of drier years for all the lead times. We also found that linear bias correction is useful to correct systematic seasonal biases and there is no significant correlation between the catchment characteristics and forecast skill. Additionally, we investigated the possibility of anticipating dry years from ENSO indices and the forecasts themselves, but we found no significant link.

Secondly, we looked at how skill in seasonal meteorological forecasts propagates into the skill of hydrological forecasts (SHFs). We used the lumped hydrological Tank model to generate ensembles of reservoir inflow from ECMWF’s seasonal forecasts data (precipitation, Evapotranspiration and temperature). Again, we quantified the skill (CRPSS) of SHFs at different lead times, seasons and in wet and dry year. The results showed that the skill of SHFs is highly dependent on the skill of SPFs, and it mimics the seasonal and annual (dry and wet years) features of precipitation forecasts. We also tested 4 different types of processing methods (raw, pre-processing, post-processing, pre/post-processing) found that pre-processing method which corrects bias of weather forcings is the most useful to improve forecast skill.

How to cite: Lee, Y., Peñuela-Fernandez, A., Pianosi, F., and Rico-Ramirez, M.: Assessing seasonal meteorological and hydrological forecasts across South Korea, EGU General Assembly 2023, Vienna, Austria, 23–28 Apr 2023, EGU23-7722, https://doi.org/10.5194/egusphere-egu23-7722, 2023.

EGU23-7873 | ECS | Orals | HS4.3

Sensitivity Analysis of Flood Risk Estimation under Nonstationary Conditions: A Case Study of the Weihe River, China 

Bin Xiong, Shuchen Zheng, Lihua Xiong, and Chong-Yu Xu

Flood risk has been increasing in many basins of the world, due to the global water cycle change driving by the global climate warming. To deal with the nonstationary properties of hydrological extremes, some new concepts, methods and models on flood frequency analysis and risk assessment are developed and applied. However, the robustness of nonstationary frequency analysis models, e.g. those based on the Generalized Additive Models for Location, Scale and Shape, is yet a big concern because the uncertainty of the parameters introduced by the methods and its impact on design flood values are difficult to quantify. This study aims to develop sensitivity degree indexes to assess the robustness of the nonstationary estimation of flood risk rates and their attributions, based on classical and Bayesian statistics, respectively. The results of the case study showed that the proposed method was efficient in identifying significant driving factors of nonstationary flood frequency; the results of the sensitivity index based on the Bayesian statistics showed that the uncertain degree of the nonstationary flood risk estimation increases with uncertain degree of the nonstationary model parameters as expected, but the sensitivity degree is decreased. It is indicated that the degree of influence of model parameters uncertainty on the risk estimation results is model dependent. This study will benefit the application of nonstationary frequency analysis methods in the flood risk assessment and flood design inference fields.

Keywords: Flood frequency analysis; Flood risk; Non-stationarity; Attribution

*This work was supported by the Research Council of Norway (FRINATEK Project 274310).

How to cite: Xiong, B., Zheng, S., Xiong, L., and Xu, C.-Y.: Sensitivity Analysis of Flood Risk Estimation under Nonstationary Conditions: A Case Study of the Weihe River, China, EGU General Assembly 2023, Vienna, Austria, 23–28 Apr 2023, EGU23-7873, https://doi.org/10.5194/egusphere-egu23-7873, 2023.

EGU23-8578 | Orals | HS4.3 | Highlight

A new process-oriented ensemble hydrological prediction system for flood prediction and water management in the US Pacific Northwest 

Andy Wood, Josh Sturtevant, Naoki Mizukami, and Guoqiang Tang

Water-related applications and decisionmaking for flood forecasting and seasonal water management commonly rely on hydrologic modeling and forecasting that must provide accurate information over large domains as well as at local watershed scales.  We present progress on an experimentally operational hydrologic forecasting system being developed in a project between NCAR and the US Army Corps of Engineers to increase situational awareness in the US Columbia River basin of the Pacific Northwest, where myriad management concerns include flood risk mitigation, hydropower generation, navigation, water supply, recreation, fisheries and environmental management. The components of the system arise from process-oriented hydrologic modeling, analysis and prediction research that has been developed over the last decade in a collaboration between NCAR, federal US water agencies, and several academic institutions. In particular, a calibrated, watershed-based SUMMA hydrologic model and MizuRoute channel routing model are run in both retrospective and real time modes to provide 3-hourly timestep ensemble flood forecasts for short to medium range lead times, as well as ensemble seasonal streamflow and water supply forecasts up to a 1-year lead time. A 36-member meteorological forcing analysis is used to initialize the model states, while ensemble meteorological forecasts from GEFS, sub-seasonal-to-seasonal (S2S) climate forecasts and ESP are used to drive future flow predictions. We present the current status of the system, which runs in real time at NCAR, and discuss different elements of the forecast approach, including model calibration, ensemble initialization, data assimilation, downscaling of NWP, S2S climate forecast use, post-processing, and hindcasting. We also discuss project links to a related streamflow forecasting testbed initiative through the new NOAA Cooperative Institute for Research to Operations in Hydrology (CIROH)

How to cite: Wood, A., Sturtevant, J., Mizukami, N., and Tang, G.: A new process-oriented ensemble hydrological prediction system for flood prediction and water management in the US Pacific Northwest, EGU General Assembly 2023, Vienna, Austria, 23–28 Apr 2023, EGU23-8578, https://doi.org/10.5194/egusphere-egu23-8578, 2023.

EGU23-9579 | Posters on site | HS4.3

Five years of real time hydro-meteorological forecasts and monitoring for local civil protection: the SOL and MOCAP warning systems 

Alessandro Ceppi, Enrico Gambini, Giovanni Ravazzani, Gabriele Lombardi, Stefania Meucci, and Marco Mancini

Among the natural disasters floods are identified with the greatest impact on highly urbanized areas in economic terms and loss of human lives. Flooding phenomena are more often observed due not only to significant weather events, but also to less intense, but more frequent episodes that undermine the urban drainage system and its interconnections with the river network.

In this context, an alert system has been developed to predict possible river floods for the Seveso, Olona and Lambro rivers (SOL) 24 - 36 hours in advance with a technology based on the sequential functioning of hydrological meteorological, hydraulic engineering calculation models, and visualization on web-GIS.

The proposed flood warning system is, in fact, composed of a physically based and spatially distributed hydrological model for the rainfall-runoff transformation, fed by both observed and forecasted atmospheric forcings of various deterministic and probabilistic meteorological models such as the GFS, Bolam, Moloch, Cosmo I2 and I5, Cosmo-Leps, and WRF.

The data measured on the ground are daily provided by a citizen scientist observation network of the Meteonetwork association and by the official Arpa Lombardia network.

In recent years, this decision support system has also been integrated with a real-time hydrological monitoring and alert network (MoCAP, an Italian acronym which stands for municipal monitoring for flood alerts), developed for the civil protection of the Bovisio-Masciago town, which is located along the Seveso River.

This study describes the benchmark analysis of the coupled forecasting and monitoring systems for local civil protection purposes and its relative performance in the last five years (2018-2022) of functioning.

How to cite: Ceppi, A., Gambini, E., Ravazzani, G., Lombardi, G., Meucci, S., and Mancini, M.: Five years of real time hydro-meteorological forecasts and monitoring for local civil protection: the SOL and MOCAP warning systems, EGU General Assembly 2023, Vienna, Austria, 23–28 Apr 2023, EGU23-9579, https://doi.org/10.5194/egusphere-egu23-9579, 2023.

EGU23-9645 | Posters on site | HS4.3 | Highlight

Towards improved hydro-meteorological ensemble forecasting for flood warning in small catchments in Saxony, Germany 

Jens Grundmann, Michael Wagner, and Andy Philipp

Flood forecasting and warning for small catchments are challenging due to the short response time of the catchments on heavy rainfall events. Thus, disaster managers are interested in extended lead times to initiate flood defence measures, which can be obtained by employing forecasts of numerical weather models as driving data for hydrological models. To portray the inherent uncertainty of weather model output, ensemble hydro-meteorological forecasts can be used.

By this contribution, we introduce the next steps to improve our operational web-based demonstration platform for ensemble hydrological forecasting in small catchments of Saxony, Germany (http://howa-innovativ.hydro.tu-dresden.de/WebDemoLive/). In its current configuration, it uses the Icon-D2-EPS numerical weather prediction product of the German Weather Service (DWD) and provides a hydrologic forecast ensemble of 20 members each three hours, for lead times up to 27 hours. The system is established for three pilot regions with different hydrological settings in Saxony, Germany. Within the second funding period of the HoWa-project improvements are planned for three main parts of the hydro-meteorological ensemble prediction platform considering a) the for observed and forecasted precipitation input, b) the hydrological forecast modelling, and c) the post-processing, visualisation and communication of results including their uncertainty.

In terms of precipitation input we are going to incorporate radar based nowcasting for short term forecasts of the next two hours. Furthermore, we will enlarge the maximum forecast period to 48 hours by exploring the full range of the Icon-D2-EPS NWP forecasts. In addition, forecasts will be updated more frequent. Regarding the hydrological forecasting features will be implemented for flood reservoir operation, and the numbers of catchments/regions will be increased. Finally, a new web-based visualisation dash board will be developed to allow for user oriented analysis and configuration. First steps towards these improvements will be presented.

How to cite: Grundmann, J., Wagner, M., and Philipp, A.: Towards improved hydro-meteorological ensemble forecasting for flood warning in small catchments in Saxony, Germany, EGU General Assembly 2023, Vienna, Austria, 23–28 Apr 2023, EGU23-9645, https://doi.org/10.5194/egusphere-egu23-9645, 2023.

EGU23-10284 | ECS | Orals | HS4.3

A reproducible data-driven workflow for probabilistic seasonal streamflow forecasting over North America 

Louise Arnal, Martyn P. Clark, Vincent Fortin, Alain Pietroniro, Vincent Vionnet, Paul H. Whitfield, and Andy W. Wood

Seasonal streamflow forecasts are critical for many different sectors - e.g., water supply management, hydropower generation, and irrigation scheduling. Initial hydrological conditions (e.g., snow storage and soil moisture) are an important source of hydrological predictability on seasonal timescales. Snowmelt is the main source of runoff generation in high-latitude and/or high-altitude headwaters basins across North America, and the basins downstream. As a result, data-driven forecasting from snow observations is a well-established approach for operational seasonal streamflow forecasting in the USA and Canada.

The aim of this work is to benchmark the skill of probabilistic seasonal streamflow forecasts across North America. To this end, we developed a reproducible data-driven workflow and implemented it for basins with a nival regime across North America. The workflow uses snow water equivalent measurements from the Canadian historical Snow Water Equivalent dataset (CanSWE), the Natural Resources Conservation Service (NRCS) manual snow surveys, and the SNOTEL automatic snow pillow in the USA. These datasets are gap filled using quantile mapping based on neighboring snow and precipitation stations. Principal Component Analysis is then used to define a small set of orthogonal predictor variables. These principal components are used as predictors in a regression model to generate ensemble hindcasts of streamflow volumes for basins across North America. 

Preliminary results for 93 nival basins and 17 glacial basins across Canada suggest that this forecasting method has the ability to provide skilful hindcasts (i.e., better than streamflow climatology) during the snowmelt season with up to 2-3 months lead. The results of this study provide a reference against which alternative forecasting methods (e.g., process-based forecasting models or machine learning approaches) can be assessed in the future.

This work is a contribution of the recently launched Cooperative Institute for Research to Operations in Hydrology (CIROH) initiative that aims to develop next-generation water prediction capabilities. The CIROH program and the Global Water Futures (GWF) program are advancing capabilities for probabilistic streamflow forecasting over North America.

How to cite: Arnal, L., Clark, M. P., Fortin, V., Pietroniro, A., Vionnet, V., Whitfield, P. H., and Wood, A. W.: A reproducible data-driven workflow for probabilistic seasonal streamflow forecasting over North America, EGU General Assembly 2023, Vienna, Austria, 23–28 Apr 2023, EGU23-10284, https://doi.org/10.5194/egusphere-egu23-10284, 2023.

EGU23-10361 | ECS | Orals | HS4.3

Application of weather post-processing methods for operational ensemble hydrological forecasting on multiple catchments in Canada 

Freya Saima Aguilar Andrade, Richard Arsenault, and Annie Poulin

Hydrological forecasts often contain biases or uncertainty that make them less useful to water resources system managers. They can, however, be further improved using post-processing methods. Post-processing has the capability to reduce overall bias and improve the uncertainty quantification (spread), in order to enhance the usefulness of the forecasts in decision-making. In this study, a Quantile Mapping (QM) post-processing method was implemented on meteorological forecasts assessed in three different configurations: A monthly, a seasonal, and an annual quantile mapping schemes. The evaluation was carried out over 22 watersheds with different basin areas in the south of Canada. Post-processing methods were trained on ECMWF operational forecasts from 2015-2019 inclusively, then applied on forecasts from 2020 and fed to 8 assimilated hydrological models on each catchment. The hydrological forecasts for the year 2020 were generated at a lead time of 8 days and a timestep of 6 hours. The methodology and results were evaluated using the Continuous Ranked Probability Score (CRPS) metric. Results show that all three QM combinations improve the performance of the forecasts at the most distant lead times, showing significant improvements from day 4. The annual QM implementation was shown to perform the best, followed by seasonal or monthly, depending on the watershed.

How to cite: Aguilar Andrade, F. S., Arsenault, R., and Poulin, A.: Application of weather post-processing methods for operational ensemble hydrological forecasting on multiple catchments in Canada, EGU General Assembly 2023, Vienna, Austria, 23–28 Apr 2023, EGU23-10361, https://doi.org/10.5194/egusphere-egu23-10361, 2023.

EGU23-11632 | Posters on site | HS4.3

Preprocessing intense precipitation forecasts to improve flood predictability for small and quick responding catchments 

Trine Jahr Hegdahl, Thordis Thorarinsdottir, and Kolbjørn Engeland

Small catchments have a quick flood response subject to intense precipitation. Previous studies show a lack of predictability for rain induced floods in these catchments. The aims of this study are to (i) apply processing techniques that focus on improving high to extreme precipitation forecasts, and (ii) evaluate how and if the spatial distribution of precipitation within a catchment affects the flood forecast, and the ultimate effect on flood predictability. Even though preprocessing precipitation has shown to improve flood prognosis, high (intense) precipitation values are still difficult to forecast correctly. In this study, we use precipitation forecasts from the regional weather forecasting model AROME-MetCoOp (MEPS, a 30-member lagged ensemble with a grid resolution of 2.5 km) and the global European Center of Medium-Range Weather Forecasts Integrated Forecasting System (ECMWF HRes and ENS, grid resolution of ~8km and for the ensemble ~16 km). MEPS serves as the reference forecast and is used in the operational flood forecasting system in Norway. For the ECMWF HRes and ENS we will apply techniques focusing on the high precipitation values. We will use Bayesian Model Averaging and apply a sampling approach that ensures that the tail of the posterior distribution is represented. We will also use a quantile regression method that employs an extreme value distribution in the tail. To assess the streamflow forecasts from all ensemble forecasts, a gridded HBV model run at a 3 hourly temporal resolution is used. 

The performance of flood forecasts for the different preprocessing approaches for the precipitation ensemble forecasts will be evaluated. For intense precipitation events the spatial distribution of precipitation within a catchment will be evaluated with an emphasis on the ultimate effect on estimating flood peaks for small and quick responding catchments. 

How to cite: Hegdahl, T. J., Thorarinsdottir, T., and Engeland, K.: Preprocessing intense precipitation forecasts to improve flood predictability for small and quick responding catchments, EGU General Assembly 2023, Vienna, Austria, 23–28 Apr 2023, EGU23-11632, https://doi.org/10.5194/egusphere-egu23-11632, 2023.

EGU23-11744 | Posters on site | HS4.3

Development of forecasting rainfall accuracy correction method based on observation scenario 

Jungsoo Yoon, Seokhwan Hwang, and Narae Kang

Numerical weather prediction (NWP) provided by the Korea Meteorological Administration (KMA) has rainfall predictions such as typhoons, so it simulates the time point relatively well, but the rainfall intensity of heavy rain, such as the peak of precipitation, is inaccurate to use for flood forecasting. Various methods have been tried for peak smoothing or under-estimation limits due to limitations due to the temporal and spatial scale of the prediction field, but a solution that can be used in practice has not been found. In order to solve this problem, this study developed a technique for correcting the temporal distribution of meteorological forecast data using the representative temporal distribution extracted based on a large amount of past observation data. In order to solve the peak smoothing problem of numerical forecasting, after merging radar quantative precipitation forecasting (QPF) and NWP, the abnormal distribution of precipitation around the peak was corrected using the standard time distribution based on observation data. As a result of correction for typhoon Hinnamno attack in 2022, the accuracy was improved from 68% of the actual rainfall before correction to 85% due to improvement in the peak.


Acknowledgement : This research was supported by a grant(2022-MOIS61-002) of ‘Development Risk Prediction Technology of Storm and Flood for Climate Change based on Artificial Intelligence’ funded by Ministry of Interior and Safety(MOIS, Korea).


How to cite: Yoon, J., Hwang, S., and Kang, N.: Development of forecasting rainfall accuracy correction method based on observation scenario, EGU General Assembly 2023, Vienna, Austria, 23–28 Apr 2023, EGU23-11744, https://doi.org/10.5194/egusphere-egu23-11744, 2023.

EGU23-14249 | ECS | Posters on site | HS4.3

Verification of ECMWF SEAS5 precipitation seasonal forecasting using ERA5 and observations for Brazilian Hidro Power Plants 

Nathalli Rogiski da Silva, Reinaldo Bomfim da Silveira, Camila Freitas, Cassia Silmara Aver Paranhos, André Luiz de Campos, and Leandro Ávila Rangel

The Electric Energy Company of Parana (COPEL GeT), the Meteorological System of Parana (SIMEPAR) and RHAMA Consulting company are undertaking the research project PD-6491-0503/2018 for the development of a hydrometeorological seasonal forecasting for Brazilian reservoirs. The project, sponsored by the Brazilian Electricity Regulatory Agency (ANEEL) under its research and development programme, aims the forecasting of streamflow, at temporal scales ranging from 1 to 270 days, at hydro power enterprises, which are integrated by the National Power System Operator (ONS) through its Interconnected System (SIN). In the present work, we verify the precipitation seasonal product from SEAS5 from ECMWF against three references, namely model climatology, ERA5 reanalysis and in-situ observations. In order to achieve the results, we extract the values from the model, respectively to the closest location of observations within Brazilian rain gauge network, corresponding to hydro power plants, and compare them to the observed values and ERA5 results, for the period from 2000 to 2020. The accuracy measurement was performed by settling a contingency matrix to estimate the probability of detection (POD), probability of false detection (POFD), the ROC curve, the area under the ROC (AUC) and other related metrics. The statistics are gathered by monthly and by season and by considering three quantile thresholds of rainfall distribution for forecasting, computed for 153 reservoirs of the SIN. The results describe a good performance of SEAS5 for either monthly or seasonal forecast if compared to climatology or ERA5, but less accuracy if compared to the rain gauges, mainly for low quantiles. Despite this, by considering the large extension of the country and its climate diversity, we noticed the SEAS5 is quite promising for using on hydrological forecasting at seasonal scale.

How to cite: Rogiski da Silva, N., Bomfim da Silveira, R., Freitas, C., Silmara Aver Paranhos, C., Luiz de Campos, A., and Ávila Rangel, L.: Verification of ECMWF SEAS5 precipitation seasonal forecasting using ERA5 and observations for Brazilian Hidro Power Plants, EGU General Assembly 2023, Vienna, Austria, 23–28 Apr 2023, EGU23-14249, https://doi.org/10.5194/egusphere-egu23-14249, 2023.

EGU23-14944 | ECS | Orals | HS4.3

Estimation of different uncertainties in simulated streamflow from hydrological models 

Mehnaza Akhter, Munir Ahmad Nayak, and Manzoor Ahmad Ahanger

Streamflow simulated from hydrological models is associated with uncertainty from a variety of sources. The chief sources of uncertainty are: i) errors in the measurement of the observed inputs to the hydrologic models, say precipitation, discharge, and temperature observations, ii) calibration uncertainty associated with algorithms used to estimate the parameters of the model iii) structural uncertainty, associated with incomplete or approximate representation of the catchment with hydrologic models. Operational forecasts generally ignore these uncertainties for important management decisions in water resources, for example, in issuing flood warnings. However, several works have shown that these uncertainties can substantially impact large streamflow forecasts made through hydrologic models. In this work, we explore different error models for estimating the relative contribution of individual error sources to overall uncertainty in the streamflow simulations. Four hydrologic models are used to estimate error distributions at various flow quantiles due to individual sources. The strategy can be adopted to improve the sources contributing to these uncertainties for future predictions from these systems. The approach may be used to reduce the major sources of uncertainty, which will help in reducing the computational efforts in estimating the uncertainties in streamflow simulations.

How to cite: Akhter, M., Nayak, M. A., and Ahanger, M. A.: Estimation of different uncertainties in simulated streamflow from hydrological models, EGU General Assembly 2023, Vienna, Austria, 23–28 Apr 2023, EGU23-14944, https://doi.org/10.5194/egusphere-egu23-14944, 2023.

EGU23-15775 | Posters on site | HS4.3

A seamless hydrologic forecasting system for Germany 

Husain Najafi, Rakovec Oldrich, Pallav Kumar Shrestha, Stephan Thober, and Luis Samaniego

An experimental hydrological forecasting system has been developed for Germany (https://www.ufz.de/HS2SForcasts4Germany) at high resolution (1 km). Since early 2021, the hydrological forecasting system provides operational ensemble forecasts for soil moisture droughts at sub-seasonal time scale (HS2S). In the next year, it will be upgraded to streamflow and inundation areas. The mesoscale Hydrologic Model (mHM- www.ufz.de/mhm) with the Multiscale Parameter Regionalization scheme [1,2,3] is used to simulate hydrological forecasts across German catchments. This model is forced with the extended large atmospheric ensemble forecasts from the European Centre for Medium-Range Weather Forecast (ECMWF). The soil moisture index is updated twice per week with associated uncertainties of the initial atmospheric conditions. The initial conditions are obtained with the DWD precipitation and temperature data, similar to the German Drought Monitor (www.ufz.de/droughtmonitor). The hydrological forecasting system was also evaluated for 2021 summer flood in west Germany [4]. The system has shown promising results in flood forecasting as well. This system is based on the EDgE system [5] and can easily be developed across other regions around the world.

Refrences

[1] Samaniego L., Kumar R., & Attinger, S. (2010). Multiscale parameter regionalization of a grid-based hydrologic model at the mesoscale. Water Resour. Res., 46,W05523, doi:10.1029/2008WR007327. WRR Editors' Choice Award 2010

[2] Samaniego L., et al. (2021). mesoscale Hydrologic Model. Zenodo. doi:10.5281/zenodo.1069202, https://doi.org/10.5281/zenodo.1069202

[3] Kumar, R., Samaniego, L., & Attinger, S. (2013). Implications of distributed hydrologic model parameterization on water fluxes at multiple scales and locations. Water Resour. Res., 49(1), 360-379. https://doi.org/10.1029/2012WR012195.

[4] Najafi, H., Rakovec, O., Kumar Shrestha, P., Thober, S., & Samaniego, L. (2022). Post-Assessment of ECMWF-mHM ensemble flood forecasting for 2021 summer flood in west Germany. 2022 AGU Fall meeting. Chicago, IL & online everywhere.

[5] Samaniego et al. (2019). Hydrological Forecasts and Projections for Improved Decision-Making in the Water Sector in Europe. BAMS, 100(12), 2451–2472. https://doi.org/10.1175/BAMS-D-17-0274.1

How to cite: Najafi, H., Oldrich, R., Shrestha, P. K., Thober, S., and Samaniego, L.: A seamless hydrologic forecasting system for Germany, EGU General Assembly 2023, Vienna, Austria, 23–28 Apr 2023, EGU23-15775, https://doi.org/10.5194/egusphere-egu23-15775, 2023.

EGU23-16025 | ECS | Posters on site | HS4.3

Medium range ensemble streamflow forecasts for hydropower dams of the Brazilian National Interconnected System 

Cléber Gama, Vinicius Siqueira, Arthur Kolling Neto, Rodrigo Paiva, Fernando Fan, Walter Collischonn, Erik Quedi, Ingrid Petry, Reinaldo Silveira, Camila Freitas, and Cassia Paranhos

Short-to-medium range streamflow forecasting is essential for planning and operating hydropower plants (HPPs). The Brazilian National Interconnected System (SIN) is composed of more than 150 HPPs that are located over a wide range of climate and hydrological conditions. Forecasts of natural inflow into the SIN reservoirs are important to establish optimal operating rules to reduce costs with other energy sources, therefore influencing the prices in the energy market. The objective of this work is twofold: (i) evaluate the skill of ensemble streamflow forecasts for the SIN hydropower plants based on continental-scale hydrological modeling (MGB-SA) and medium-range ECWMF rainfall forecasts (MGB-ECMWF), and (ii) compare the MGB-ECMWF forecasts to those produced operationally by the Electric System National Operator (ONS). The MGB-ECMWF predictions were additionally bias-corrected and updated using quantile mapping and auto-regressive model approaches, and were assessed in the period from 2015 to 2020 in terms of weekly averages. The forecast skill was estimated relative to both streamflow climatology and persistency using the CRPS metric, while the comparison between MGB-ECMWF and operational forecasts was performed using deterministic metrics typically adopted by ONS. The skill of MGB-ECMWF forecasts was substantially improved (especially in the first week) by the use of output correction methods, which were demonstrated to be essential for quantitative streamflow forecasting using a continental-scale hydrological model. The relative performance between ONS and MGB-ECMWF forecasts was quite variable (exhibiting positive and negative values) over the geographical extent of the SIN, although in several locations the MGB-ECMWF forecasts have performed equal to or even better than those issued by ONS. Finally, the results presented here provide insights for investigations and applications of streamflow forecasts using continental-scale modeling and simple output correction techniques, which can bring benefits, for example, in the optimization of the reservoir operation and electricity generation.

Acknowledgments: This work presents part of the results obtained during the project granted by the Brazilian Agency of Electrical Energy (ANEEL) under its Research and Development program Project PD 6491-0503/2018 – “Previsão Hidroclimática com Abrangência no Sistema Interligado Nacional de Energia Elétrica” developed by the Paraná State electric company (COPEL GeT), the Meteorological System of Paraná (SIMEPAR) and the RHAMA Consulting company. The Hydraulic Research Institute (IPH) from the Federal University of Rio Grande do Sul (UFRGS) contribute to part of the project through an agreement with the RHAMA company (IAP-001313).

How to cite: Gama, C., Siqueira, V., Kolling Neto, A., Paiva, R., Fan, F., Collischonn, W., Quedi, E., Petry, I., Silveira, R., Freitas, C., and Paranhos, C.: Medium range ensemble streamflow forecasts for hydropower dams of the Brazilian National Interconnected System, EGU General Assembly 2023, Vienna, Austria, 23–28 Apr 2023, EGU23-16025, https://doi.org/10.5194/egusphere-egu23-16025, 2023.

EGU23-16465 | ECS | Orals | HS4.3 | Highlight

Stochastic flow forecast tool in Mediterranean watersheds for hydropower plants management at operational time scales 

Raquel Gómez-Beas, María José Polo, María Fátima Moreno, Manuel del Jesus, and Cristina Aguilar


The operation of hydropower systems is carried out based on operation rules and environmental flows requirements. The effects of the highly temporal variability of hydrological regime in Mediterranean areas are more pronounced in Run-of-River hydropower systems, located in mountainous areas as they must often cease operation due to flow rates either below the turbine minimum discharge and the environmental flow requirements, or over the turbine maximum discharge. Conversely, regulated basins with storage systems are more resilient to changes in the short-medium term. In any case, having a forecast operational tool with delimited uncertainty and sufficient reliability would mean an improvement in the hydropower production planning, as well as a decrease in opportunity costs.

A stochastic flow forecast tool is applied in two selected Mediterranean hydropower systems (Southern Spain). In particular, the mini hydropower plants in Poqueira river, as representative of Run-of-River systems; and Los Hurones plant, with a reservoir, are presented. The forcing agents of the increase in humidity were first identified, being the snow and rainfall regimes in Poqueira, and the atmospheric pressure and NAO index in Los Hurones respectively. Secondly, the statistical modelling of dependent variables was carried out with parametric and non-parametric approaches to, finally, generate the probability distribution functions of occurrence of the flow regime. This structure of Bayesian dynamics forecast of water inputs to the plants on a week-month and month-season scale allows the forecast based on observable and verifiable antecedent conditions in quasi-real time.

The operationality of the hydropower plants refers to the probability of producing energy, so that its complementary value, probability of failure, is defined as the number of days in which the plant is not operating. Failure frequency and the associated operationality were calculated from the 250 stochastic replications of the 20-year period of the forcing agent in the selected case study. Including the 250 replications of the inputs allows considering the effect of different combinations of wet and dry years on the variables analysed, and provides the uncertainty associated with both, a certain value of operationality, and a fixed value of the hydrological variable at the desired time scale.

Results reveal that the higher operationality in Poqueira is given between April and May when the snowmelt produces greater flows, with a 25% probability of having less than 4 days of failure, lower than in the winter months (December to February), with a 25% probability of having 8-18 days of failure. In Los Hurones, with a 25% probability, the lowest failure will be 8-12 days between April and June, being significantly higher the rest of the year. Operational graphs obtained from the uncertainty analysis allow estimating how to plan the operation of hydroelectric plants to maximize its production based on the data observed in previous weeks and months.


Acknowledgments: This work has been funded by project TED2021-130937A-I00, ENFLOW-MED "Incorporating climate variability and water quality aspects in the implementation of environmental flows in Mediterranean catchments" with the economic collaboration of MCIN/AEI/10.13039/501100011033 and European Union "NextGenerationEU"/Plan de Recuperación, Transformación y Resiliencia.

How to cite: Gómez-Beas, R., Polo, M. J., Moreno, M. F., del Jesus, M., and Aguilar, C.: Stochastic flow forecast tool in Mediterranean watersheds for hydropower plants management at operational time scales, EGU General Assembly 2023, Vienna, Austria, 23–28 Apr 2023, EGU23-16465, https://doi.org/10.5194/egusphere-egu23-16465, 2023.

The exploitation of rivers and hydropower reservoirs involves daily monitoring of  the water resources, the meteorological conditions, the status of  the river banks, the flood areas, etc. As maximum river discharge often results in flooding, it is of importance to provide with timely and reliable forecasts of discharge and water levels. Predicting river discharge and water levels has been a subject of hydrological modelling and a topic of serious research. However, only in recent years scholars and practitioners have turned to consider earth observation data for their studies, mainly to compare evidence of flood mapping. We present an approach of using earth observation data to feed AI architectures – EO4AI – and produce forecasts for discharge and water level with significant degrees of accuracy.  Our starting point is that river discharge and water levels depend on a variety of meteorological and environmental factors like precipitations, snow cover, soil moisture, vegetation index and satellite data offer rich variety of datasets, supplying this information. We adopt a pipeline of deep learning architectures consisting of GAN, CNN, LSTM and EA to actually generate forecasts for river discharge and water level by using historic satellite data of the meteorological features listed above, and in-situ measurements for water level and discharge. The satellite data are provided by ADAM  via the NoR service of ESA. ADAM provides data access to satellite datasets from different satellites with semantic relevance for the construction of sediment transport and deposition forecast model as discussed above.  We explain the purpose of the pipeline components. Our forecast models are calibrated for 3, 5, 7, 30 days ahead, and our experiments provide predictions for one year ahead with each of the calibrated models. We discuss experiment results carried out with data from the Danube and Arda rivers, including three dams from cascade Arda and compare them with predictions derived with other methods. We demonstrate the viability of the approach and the reliability of the forecasting results. We further show how the forecasts can be used in hydrodynamic modelling context, for early warning applications and for routine water resources management and monitoring tasks.

How to cite: Damova, M. and Stankov, S.: Forecasting Discharge and Water Levels of Rivers and Dams using Earth Observation and AI, EGU General Assembly 2023, Vienna, Austria, 23–28 Apr 2023, EGU23-17141, https://doi.org/10.5194/egusphere-egu23-17141, 2023.

EGU23-17334 | ECS | Posters on site | HS4.3

Simulation of long-term rainfall runoff using a Long Short-Term Memory (LSTM) networks: Case of Osipcheon watershed in Korea 

Sung Wook An, Jung Ryel Choi, and Byung Sik Kim

Water resource management requires long-term historical discharge data, and physical hydrology models were widely used. Recently, in the field of water resources, various studies using artificial neural networks have been conducted. In this paper, long-term discharge was estimated using meteorological data and LSTM (Long Short-Term Memory). Study area is selected as Osipcheon watershed in Korea. Observed meteorological data and discharge data were collected for 10 years to training period (2011-2018) and testing period (2019–2020). The potential evaporation data was calculated by Hargreaves formula equation. And NSE (Nash– Sutcliffe Efficiency), RMSE (Root Mean Square Error), and MSE (Mean Square Error) were used to compare LSTM results and observed discharge during the training, test and total period. As a result, NSE, RMSE, and MSE were satisfactory during the total period which showed a high possibility of using the LSTM deep learning technique in the water resource area.

Acknowledgment: This research was supported by a grant(2022-MOIS61-001) of Development Risk Prediction Technology of Storm and Flood For Climate Change based on Artificial Intelligence funded by Ministry of Interior and Safety(MOIS, Korea).

How to cite: An, S. W., Choi, J. R., and Kim, B. S.: Simulation of long-term rainfall runoff using a Long Short-Term Memory (LSTM) networks: Case of Osipcheon watershed in Korea, EGU General Assembly 2023, Vienna, Austria, 23–28 Apr 2023, EGU23-17334, https://doi.org/10.5194/egusphere-egu23-17334, 2023.

EGU23-17521 | ECS | Posters on site | HS4.3

Water level forecasting of Reservoir downstream by machine learning 

I-Hsiu Chuang, Gwo-Fong Lin, Ming-Jui Chang, and Yuan-Fu Zeng

Taiwan is located in the subtropical monsoon region, both typhoons and vigorous convection caused by strong southwesterly flow develop seasonal compound disasters.
In addition, the response time for early warning systems of the reservoirs and downstream riverbanks has been shortened due to higher frequency and greater intensity of short-duration rainfall events in recent years. Past studies pointed out that the current water level forecast does not consider the outflow discharge of the reservoir. Therefore, this study proposes a downstream water level forecasting model that considers the outflow discharge of the reservoir, and the model is provided to relevant hazard mitigation centers.
This research has selected the water level of the Taipei bridge as target status and collected data of typhoon and storm events from 2014-2021. These data included the precipitation in the watershed of upstream of Taipei bridge, outflow discharge of Shimen reservoir, outflow discharge of Feitsui reservoir, and tidal of Tamsui river estuary as the alternative factors. Subsequently, building several models based on multiple machine learning, such as RNN, SVM, and LSTM to interface with the constant-quantity rainfall forecast of the Central Weather Bureau, then produce the forecast in the future 12 hours with Multi-Step Forecasting (MSF) about the water level of Taipei bridge.
The result shows that SVM, RNN, LSTM forecast in the future 1 hour precisely, which statistical values of CC are more than 0.97, and root mean square errors of water level are around 0.2 m. As the forecast time is longer, the statistical values of CC decrease around 0.93 and root mean square errors of water level increase around 0.3 m.
However, LSTM is able to learn dependencies between the time series and get more precise outcomes than the SVM and RNN, which is not outstanding initially then performs the best at the last. The proposed water level forecast is proved to improve the accuracy of the forecast in the future 12 hours about the water level of Taipei bridge. Moreover, by coordinating the Quantitative Precipitation Forecast (QPF) and warning water level, the model provides early warning of the future twelve-hour water level, which is not only beneficial to evacuation and operating traversing dock-gate and evacuation gates efficiently, but also conducive to reducing the risk of losses in life and property.
Keywords: Water level, Quantitative Precipitation Forecast, Machine learning, Multi-Step Forecasting

How to cite: Chuang, I.-H., Lin, G.-F., Chang, M.-J., and Zeng, Y.-F.: Water level forecasting of Reservoir downstream by machine learning, EGU General Assembly 2023, Vienna, Austria, 23–28 Apr 2023, EGU23-17521, https://doi.org/10.5194/egusphere-egu23-17521, 2023.

EGU23-4653 | PICO | HS4.4

A national flood awareness system for ungauged catchments in complex topography for Aoetearoa New Zealand. 

Celine Cattoen, Jono Conway, Nava Fedaeff, Paula Blackett, Ude Shankar, Tilmann Steinmetz, Trevor Carey-Smith, Stuart Moore, and Richard Measures

Floods cause over $40 Billion of damage worldwide every year. In Aotearoa New Zealand, it is the most frequent natural disaster, with an average annual cost of NZ$100 million for residential properties. Effectively forecasting and communicating flood hazards at national or continental scales is critical to reducing the impacts of flooding. However, developing national-scale river flow forecasting systems remains a challenge due to the predominance of ungauged catchments in often complex and steep terrain. We will present the model development, communication, and evaluation of New Zealand’s first national flood awareness system prototype, the Aotearoa Flood Awareness System, AFAS (Cattoën et al., 2022). To produce river forecasts, a high-resolution convective-scale atmospheric model drives an uncalibrated and semi-distributed hydrological model. The system includes statistical perturbations in rainfall, soil moisture and baseflow to generate a 50-member ensemble. We implemented a relative flow and flood exceedance threshold framework to evaluate hourly forecasts across six categories from below normal to extremely high. We assessed forecast performance categorically against observations, for a 2.5-year reforecast period, at 272 flow sites nationwide, up to 48 hours ahead. AFAS produces skilful streamflow forecasts in catchments with complex topography, even with operational delays ingesting observations. We explored a novel approach to river forecast communication using daily videos and will present feedback gathered from stakeholder workshops and semi-structured interviews. Finally, we will share our experience providing real-time AFAS forecast information during flood responses on the West Coast in 2021 and 2022. AFAS appears to be the first river forecasting system to produce public-friendly videos to communicate streamflow forecasts in their topographical context. Further development of AFAS would benefit from a federated approach across national and regional agencies, including sharing real time weather observations, forecasting tools and expertise.

Cattoën, C., Conway, J., Fedaeff, N., Lagrava, D., Blackett, P., Montgomery, K., Shankar, U., Carey-Smith, T., Moore, S., Mari, A., Steinmetz, T., & Dean, S. (2022). A national flood awareness system for ungauged catchments in complex topography: The case of development, communication and evaluation in New Zealand. Journal of Flood Risk Management, e12864. https://doi.org/10.1111/jfr3.12864

How to cite: Cattoen, C., Conway, J., Fedaeff, N., Blackett, P., Shankar, U., Steinmetz, T., Carey-Smith, T., Moore, S., and Measures, R.: A national flood awareness system for ungauged catchments in complex topography for Aoetearoa New Zealand., EGU General Assembly 2023, Vienna, Austria, 23–28 Apr 2023, EGU23-4653, https://doi.org/10.5194/egusphere-egu23-4653, 2023.

EGU23-5326 * | ECS | PICO | HS4.4 | Highlight

Towards flood warnings everywhere - data-driven rainfall-runoff modeling at global scale 

Frederik Kratzert, Martin Gauch, Daniel Klotz, Asher Metzger, Grey Nearing, Guy Shalev, Shlomo Shenzis, Tadele Tekalign, Dana Weitzner, and Oren Gilon

The goal of Google’s Flood Forecasting Initiative is to provide timely and actionable flood warnings to everyone, globally. Until recently, Google provided operational flood warnings only for specific partner countries, namely India, Bangladesh, Sri Lanka, Colombia, and Brazil. In 2021 our flood alerting system sent out around 115 million flood notifications, reaching over 23 million people in the affected local areas. In all of the regions mentioned above, our operational model relies on partnerships with local governments to provide real-time measurements of observed discharge or water level (Nevo et al. 2021). However, relying on real-time measurement data makes it harder to scale to new regions as a) this data does not exist everywhere, and b) even if it exists, it requires significant per-country time and resource investment.

Building on research results from the last few years (e.g., Kratzert et al. 2019a, Kratzert et al. 2019b, Klotz et al. 2021), we built a global rainfall-runoff model that does not rely on real-time measurements in the operational context but only uses globally available forcing data and globally available catchment attributes. It can therefore be deployed everywhere, including in ungauged basins. Following Kratzert et al. (2019a), our rainfall-runoff model is based on the Long Short-Term Memory network (LSTM) and is trained on thousands of hydrologically diverse basins from all around the world. To forecast river discharge for any given river on Earth, the model uses time series data from various meteorological forcing products (IMERG, CPC, ERA5-Land, ECMWF’s IFS), as well as static catchment characteristics.

This new model allows us to scale to new regions more quickly. As of January 2023, we now provide operational flood warnings to hundreds of sites across 48 countries worldwide, with hundreds of more sites being rolled out in the coming months. Besides our previous channels of communicating flood warnings (e.g. Google Search, Google Maps, Google Alerts, and direct communications with NGOs and governments), we also released FloodHub (g.co/floodhub), a new interactive portal that allows for easy access to all operational forecasts.

Here, we present more information about the modeling methodology shifts, the challenges we faced and finally showcase the latest advancements made.


References:

Klotz, D., et al. (2022). Uncertainty estimation with deep learning for rainfall–runoff modeling. Hydrology and Earth System Sciences, 26(6), 1673-1693.

Kratzert, F., et al. (2019a). Towards learning universal, regional, and local hydrological behaviors via machine learning applied to large-sample datasets. Hydrology and Earth System Sciences, 23(12), 5089-5110.

Kratzert, F., et al. (2019b). Toward improved predictions in ungauged basins: Exploiting the power of machine learning. Water Resources Research, 55(12), 11344-11354.

Nevo, S., et al., (2021). Flood forecasting with machine learning models in an operational framework. Hydrology and Earth System Sciences Discussions, pp.1-31.

How to cite: Kratzert, F., Gauch, M., Klotz, D., Metzger, A., Nearing, G., Shalev, G., Shenzis, S., Tekalign, T., Weitzner, D., and Gilon, O.: Towards flood warnings everywhere - data-driven rainfall-runoff modeling at global scale, EGU General Assembly 2023, Vienna, Austria, 23–28 Apr 2023, EGU23-5326, https://doi.org/10.5194/egusphere-egu23-5326, 2023.

EGU23-5399 | PICO | HS4.4 | Highlight

How the diversity of locally driven operational hydrological prediction systems can support globally configured on-demand high-resolution services 

Maria-Helena Ramos and Ursula McKnight and the DE_330-MF Hydrology Team

In the past years, the research and operation communities on climate, weather and hydrology have put efforts into developing on-demand services for the monitoring, forecasting or emergency response and recovery phases of extreme hydrometeorological events. This is the case for the ‘Copernicus EMS On Demand Mapping’ for natural disasters, including flood inundation, as well as the ‘Destination Earth’s on-demand extremes digital twin’ flagship initiative of the European Commission. These efforts often require new, configurable on-demand prediction capabilities to run Earth system models at very high resolution on global scales. From the hydrological sciences and services perspective, it raises questions about how the diversity of operational hydrological prediction systems that support local modelling and decision-making can integrate this new paradigm, without losing efficiency and predictive accuracy in the process.

In this study, we investigate existing (or soon-to-be) operational flood impact modelling simulation capabilities in nine countries: Bulgaria, Czech Republic, Denmark, Finland, France, Iceland, Ireland, Slovakia and Sweden. We developed technical model workflows for each country to illustrate the diversity of approaches encountered in national flood forecasting systems. Each workflow is a visual diagram that identifies nodes represented by start/end points, and tasks and processes that affect the outcomes (i.e., the flood forecasts). Workflow developers were guided to reflect on aspects such as offline setups (domain discretization, model calibration), input data (acquisition, type, source), data pre-processing steps, models and associated routines (data assimilation, post-processing), and outputs (web-based interfaces, visualization). Guidance for inter-comparable workflows were discussed, which allowed us to reflect on a generic workflow to depict the way data and models interact in the context of flood forecasting and warning. 

Altogether, the hydrological/flood forecasting technical workflows highlight the needs of each configured system to locally pre-process meteorological data before using them as input to the hydrological models. This may include different actions: file reading, data formatting, data interpolation, computation of sub-catchment areal precipitation, etc. As the workflows rely on continuous hydrological modelling (as opposed to event-based models), the role of model initialization to capture the catchment initial conditions at the time a forecast is issued (e.g., the amount of water stored or flowing in the catchment before a flood event) is also highlighted. These are important aspects to be considered when interfacing national flood forecasting systems with continental or global on-demand services. The workflows offer a comprehensive and diverse view of the many components that can facilitate or hinder reproducibility, transferability, and (event- or user-driven) triggering of on-demand services, contributing to inform the setup of new approaches that aim at more interactive and configurable access to data for flood risk assessment at different scales.

This work is funded by the EU under agreement DE_330_MF between ECMWF and Météo-France. The on-demand capability proposed by the Météo-France led international partnership is a key component of the weather-induced extremes digital twin, which ECMWF will deliver in the first phase of Destination Earth, launched by the EC.

How to cite: Ramos, M.-H. and McKnight, U. and the DE_330-MF Hydrology Team: How the diversity of locally driven operational hydrological prediction systems can support globally configured on-demand high-resolution services, EGU General Assembly 2023, Vienna, Austria, 23–28 Apr 2023, EGU23-5399, https://doi.org/10.5194/egusphere-egu23-5399, 2023.

EGU23-7049 | PICO | HS4.4

Different aspects of hydrological forecast assessment in Slovakia 

Hana Hlaváčiková, Kateřina Hrušková, Eva Kopáčiková, Michaela Mikuličková, Marcel Zvolenský, Zinaw Shenga, and Danica Lešková

A well-configured, verified hydrological operational forecasting system is an invaluable tool for hydrological forecasting and warning services. Target users of such a service can be water managers, power generation planning, navigation, civil protection, and the public, whose priority is to obtain the best possible forecast for their area of interest. This was one of the reasons why SHMU proceeded to a more complex assessment of hydrological forecasts.

The main objective of the assessment was to analyse the uncertainties that significantly affect the quality of the forecast itself. The evaluation was conducted for 47 selected water-gauging profiles. It showed that in Slovak physical-geographical conditions, the precipitation data (measured and predicted) and the configuration of the hydrological model are the most significant sources of uncertainties. Forcing data for hydrological forecasts come from the deterministic ALADIN/SHMU model with 4.5 km resolution, generated 4 times per day with hourly time-step and lead time 69 hours. The HBV model efficiency was tested on a total of 138 forecast profiles during the period 08/2016 – 12/2020. The input data used was precipitation from a combined radar product (qPrec) with 1 km resolution, which also enters the models in operation. Model performance was expressed by NSE and KGE statistics as well as visual inspection of the hydrographs. It showed very good model simulation results for most of the catchments. A weak point was the simulation and forecast of peak flows, which the model underestimated in many cases. It was therefore necessary to proceed to a more detailed analysis of the precipitation input, both measured and predicted, in relation to the predicted flows. Monthly precipitation totals and for selected catchments also daily ones were analysed and feedback was sent to the precipitation data providers for hydrological models. Monthly precipitation totals were compared with totals obtained from spatial interpolation of 568 rain gauge stations in a GIS environment. From these comparisons, systematic errors are visible as well as their temporal evolution for the specific catchments. Such analyses are not a routine part of hydrological forecasting systems.

The work also includes a quantification of the uncertainty of the meteorological forecast and hydrological model separately expressed for different forecast lead times for a specific forecast profile. In the future, we would like to apply the methodology used for other profiles in order to detect possible systematic errors affecting the quality of the hydrological forecast.

This work was supported by the Slovak Research and Development Agency under the Contract no. APVV-19-0340.

How to cite: Hlaváčiková, H., Hrušková, K., Kopáčiková, E., Mikuličková, M., Zvolenský, M., Shenga, Z., and Lešková, D.: Different aspects of hydrological forecast assessment in Slovakia, EGU General Assembly 2023, Vienna, Austria, 23–28 Apr 2023, EGU23-7049, https://doi.org/10.5194/egusphere-egu23-7049, 2023.

The World Meteorological Organization’s (WMO) Global Data-processing and Forecasting System (GDPFS) is an international network of global, regional, and national centres that make meteorological analysis and forecast products operationally available. GDPFS has strengthened the capabilities of countries to meet the needs of users by sharing Numerical Weather Prediction (NWP) products and services related to operational meteorology, climate, and application fields in all timescales.

Advances in supercomputing and science over the last decade have furthered environmental predictions and probabilistic forecasts. Larger ensembles of NWP with increased horizontal and vertical resolutions are generated across all time scales. These developments clearly indicate the potential to evolve GDPFS to the WMO Integrated Processing and Prediction System (WIPPS) from its current form to a seamless platform, covering predictions for all time scales from minutes to centuries and encapsulating everything known about the Earth system which involves the atmosphere, ocean, hydrosphere, and cryosphere, along with all the interconnections and feedbacks among them.

As part of the Earth system approach, a few activities relevant to marine meteorology and oceanography have been already developed.  Further expanding the area of WIPPS, following hydrological activities are being established:

  • Sub-seasonal to seasonal (S2S) hydrological predictions
  • Snow cover predictions
  • Flash flood forecasting

The authors will present the draft idea of the concept and the expected benefits of bridging the gap between operational meteorological and hydrology as part of an integrated processing and prediction system and show the ways on how experts can contribute to the evolution of WIPPS under the framework of WMO. Hydrological and meteorological communities can benefit significantly from the improved coupling between the NWP and hydrological models as for example the predicted precipitation reflecting realistic soil moisture contributes to predicting more accurate soil moisture and discharge. This is especially the case for short time scales (flash floods), S2S times scales as well as for snow cover considering nonstationary boundary conditions through a changing climate. Through its thematic focus on weather, water and climate and the strengths of centres of WMO Members to run operational prediction system, WIPPS offers the possibility to bridge the gap of operational services/systems between meteorology, hydrology and climatology and provides the opportunity for researchers to collaborate with operational practitioners and National Meteorological and Hydrology Services (NMHS). Questions like, what are the needs of scientists and practitioners, what are the bottlenecks, what are the best ways of collaboration and how can WMO develop the framework for a transdisciplinary effort to improve operational Earth system prediction systems for meteorology, climatology, and hydrology, can be discussed during the session to accelerate future cooperation.


How to cite: Schwab, M. P., Ba, R., Kim, H., Lim, E., and Honda, Y.: Bridging the gap between operational meteorology and hydrology: Including hydrological forecasts into the WMO Integrated Processing and Prediction System (WIPPS/GDPFS), EGU General Assembly 2023, Vienna, Austria, 23–28 Apr 2023, EGU23-7818, https://doi.org/10.5194/egusphere-egu23-7818, 2023.

EGU23-8144 | ECS | PICO | HS4.4

SONICS: A new Peruvian hydrological dataset of simulated daily streamflow for flood monitoring and forecasting 

Harold Llauca, Karen Leon, Waldo Lavado, and Oscar Felipe

Increasing hydrological risks and water use puts pressure on water resources and highlights the importance of a systematic hydrological analysis and modeling at national scale in gauged and ungauged catchments. This paper aims to develop a national hydrological model using physiographic and climatic characteristics to compute dissimilarity indices to pair donor and receptor sub-basins for the entire Peru. Therefore, we use the gridded hydrometeorological PISCO dataset (0.1º x 0.1º) to drive a conceptual rainfall-runoff (ARNO/VIC) model, which serves as an input for a river-routing (RAPID) model in thousands of river reaches. We identify 122 similarity-based hydrological zones across the country to run the hybrid model (ARNO/VIC+RAPID) with previously calibrated parameters. National daily streamflow simulations show good performance (KGE ≥ 0.75, NSEsqrt ≥ 0.65, MARE ≤ 2, and -25% ≤ PBIAS ≤ 25%) for catchments located at the Pacific coast and the Andes-Amazon transition. Finally, a new hydrological dataset of daily flow series for entire Peru is presented, including a temporal coverage from 1 January 1981 to 31 March 2020. This new product represents an important contribution for water resource modeling including future risk scenario simulations in often poorly gauged catchments in Peru.

Keywords: Peru; PISCO; hydrological regionalization; large-scale modeling; national streamflow simulation.


How to cite: Llauca, H., Leon, K., Lavado, W., and Felipe, O.: SONICS: A new Peruvian hydrological dataset of simulated daily streamflow for flood monitoring and forecasting, EGU General Assembly 2023, Vienna, Austria, 23–28 Apr 2023, EGU23-8144, https://doi.org/10.5194/egusphere-egu23-8144, 2023.

Flash floods often lead to significant damages and human suffering. To mitigate this, hydrological forecasting models provide extended warning time and allow for better preparedness in the affected areas.

Among other data, hydrological modeling highly depends on reliable precipitation input. Typically, for the use case of precipitation based hydrological flood forecasting three data product types appear useful: (i) observed data for the near past until now, (ii) nowcast data for the next few hours, and (iii) forecast data for precipitation amounts in the near future. The German Weather Service (DWD) provides a multitude of different products for all three types covering Germany.

Producing a coherent time series containing data of these three types can be challenging because of different file formats, different temporal and spatial resolutions, and even varying spatial representations (e.g. regular grid versus icosahedron). To facilitate hydrological forecast modeling, we present our open source Python package weatherDataHarmonizer. It overcomes the temporal and spatial differences between the data types and provides a harmonized time series of spatially distributed precipitation.

First, the package contains modules for low-level access of the DWD original binary data for quantitative radar composites. This comprises measured radar data, e.g. RADOLAN RW, and nowcasting products like RADVOR RQ and RADOLAN RV. The modules are generic enough to support other products in this binary format. Beyond RADOLAN binaries, the package provides low-level access to data used at DWD for the regional weather forecast modeling, e.g. Icon-D2 and the ensemble forecast model Icon-D2-EPS in grib2 format. Both low-level access modules offer specific data and metadata classes and include functions to give the correct spatial coordinates.

Second, we added high-level support for the following DWD products: RADOLAN RW, RADVOR RQ, RADOLAN RV, Icon-D2, and Icon-D2-EPS. All these classes comprise methods for reading files, regridding via IDW method, cropping, and exporting to netcdf with data and metadata.

Third, the package involves a weather data class that collects all supported data, harmonizes the temporal resolution, and invokes regridding for the same spatial distribution. It results in a coherent time series of precipitation data from the near past to the maximum forecast time. Users can directly use the harmonized data within Python or rely on the export to netcdf functionality.

For quality assurance and reproducibility purposes, the weatherDataHarmonizer is highly modular and extendable for other products. It further includes unittests and standardized docstrings, which describe packages, classes, methods, and functions.

The weatherDataHarmonizer is developed and used within the project HoWa-PRO to generate ensemble precipation timeseries for flood early warning in small catchments.

How to cite: Wagner, M. and Grundmann, J.: Precipitation Data Harmonizer: Harmonizing radar, nowcast, and forecast precipitation data for hydrological applications, EGU General Assembly 2023, Vienna, Austria, 23–28 Apr 2023, EGU23-8978, https://doi.org/10.5194/egusphere-egu23-8978, 2023.

EGU23-14368 | PICO | HS4.4

Linking early warnings to early actions through system approach: learnings from pilots in Western Balkans and Türkiye 

Marta Giambelli, Sabrina Meninno, Miranda Deda, Chiara Paniccia, Romanella Vio, Stefania Renzulli, Marina Morando, Enrico Ponte, and Marco Massabò

Ensuring that early warning information is effectively translated into anticipatory/ early actions is a pressing challenge that requires partnership and coordination of multiple actors at different territorial levels. This issue has been investigated in the framework of the IPA Floods and Fires program (https://www.ipaff.eu/) for the Western Balkans and Türkiye in 7 pilot studies. An operational approach has been developed to guide key institutions in planning anticipatory actions in the event of a flood based on early warnings, considering EWS in its full length of value cycle.

The approach is grounded on the concept that an Early Warning System (EWS) should be an “integrated system” comprising hazard monitoring, forecasting and prediction, disaster risk assessment, communication and preparedness activities, systems and processes” (WMO, 2016, UNDRR, 2009). A system approach enables to intersect and interlink all the elements and actors of EWS at different territorial levels, including local administrations, which are typically the first responder in case of a flood due to their proximity to at-risk communities.

The approach consisted in few key steps part of gradual capacity development process. The first important step was the context analysis at Country level carried out through questionnaires, scoping tools on EWS, and interactive workshops, which informed a comprehensive stakeholder mapping, guided the constitution of multi-territorial and multi-sectorial working groups (from National Hydrometeorological Services, to River basin and water agencies and civil protection authorities at all the levels). The second step was the design and implementation of a Command Post Exercise (CPX) project to test coordination and communication among all the EWS actors, as well as the activation of the emergency plans and procedures in response to warnings from the national to the local level. This step was instrumental to strengthen inter-agency familiarity and functional capacities of the system, to identify barriers for effective operations, and raise awareness on strategies for EW-EA linkage. The third and final step of the proposed approach consisted in a lessons learned analysis, recognizing gaps and capacities to be strengthened

The implementation of this approach in 7 pilot cases in Western Balkans and Türkiye has highlighted several benefits and challenges, including the effort to achieve a broader and regional perspective by transcending country-specific results. Specifically, the lesson learnt analysis outlined the base of a set of criteria, built on the regional experience, for a general and co-designed path to move towards the integration of early warnings into emergency response planning and civil protection actions. Key learnings and discussions among the involved parties in the approach supported the identification of preliminary recommendations and effective practices. The implementation of pilot cases highlighted that engaging local administrations and establishing cross-institutional partnerships are essential for effective preparedness and the overall strength of the system, confirming that an EWS can be completely hampered by its weakest component.

How to cite: Giambelli, M., Meninno, S., Deda, M., Paniccia, C., Vio, R., Renzulli, S., Morando, M., Ponte, E., and Massabò, M.: Linking early warnings to early actions through system approach: learnings from pilots in Western Balkans and Türkiye, EGU General Assembly 2023, Vienna, Austria, 23–28 Apr 2023, EGU23-14368, https://doi.org/10.5194/egusphere-egu23-14368, 2023.

EGU23-15949 | ECS | PICO | HS4.4

On-demand flood predictions and warnings with high-resolution weather and hydrological models: the case of Vejle, Denmark 

Charlotte Plum, Grith Martinsen, Emma Dybro Thomassen, Jonas Wied Pedersen, and Michael Brian Butts

Floods are often caused by small-scale weather and hydrological phenomena that require very high-resolution models to adequate resolve and simulate. Unfortunately, high-resolution models are expensive to run continuously in real-time, which makes the case for only running these specialized systems “on-demand” when it is deemed necessary. The aim of this study is to investigate a high-resolution digital twin designed for on-demand use and test it on the case of Vejle, Denmark. The city of Vejle is of special interest because it is prone to frequent floods from long-term winter precipitation, convective cloudburst events in summer as well as storm surges from the sea. On top of this, several fast and slow responding rivers meet inside the city

Here, we present results from a hydrological forecasting setup based around the conceptual HYPE model, which is developed by the Swedish Meteorological and Hydrological Institute. The model is developed with high-resolution soil and land use data, forced with high-resolution meteorological observations, and its predictions are evaluated at several gauges along the Vejle and Grejs rivers. The final aim of the research is to assess the benefits of utilizing subkilometer-scale HARMONIE weather predictions, which especially is expected to improve the resolution of local rainfall fields. The full forecasting chain will be put into operation in the coming year.

How to cite: Plum, C., Martinsen, G., Dybro Thomassen, E., Wied Pedersen, J., and Brian Butts, M.: On-demand flood predictions and warnings with high-resolution weather and hydrological models: the case of Vejle, Denmark, EGU General Assembly 2023, Vienna, Austria, 23–28 Apr 2023, EGU23-15949, https://doi.org/10.5194/egusphere-egu23-15949, 2023.

EGU23-16118 | ECS | PICO | HS4.4

Rainfall-Runoff Database for Facilitating Improved Adaptation Strategies to Climate Extremes 

Soumyaranjan Sahoo, Stefania Camici, Claudia Pandolfo, Alessio Burnelli, Luca Ciabatta, and Luca Brocca

Global freshwater availability is extensively governed by streamflow availability. However, in the recent past, the streamflow in many world rivers is showing a greater variability as a response to extremes, such as floods, which in turn is challenging to water managers due to lack of sufficient information. Reliable flood forecasting system, exploiting also satellite information, can help decision-makers to take actions for addressing both disaster risk and water resources management.

In this study, a framework for a comprehensive rainfall-runoff database was developed to study the catchment response to a variety of rainfall events. The core of the framework is the hydrological model, MISDc (Modello Idrologico Semi-Distribuito in continuo), forced with satellite Global Precipitation Measurement (GPM) precipitation data and soil moisture Advanced SCATterometer (ASCAT) backscatter observations. The resulting rainfall-runoff database stores pre-simulated events classified on the basis of the rainfall amount, initial wetness conditions, and initial discharge. The system was developed and tested at several gauged river sections along the upper Tiber river (central Italy) and the Po river (North Italy), and it demonstrated to be an effective tool to assess possible streamflow scenarios assuming different soil moisture conditions and rainfall volumes for the following days. This activity is part of the European Space Agency Digital Thin Earth Hydrology project aimed to develop what-if scenarios for flood risk assessment.

How to cite: Sahoo, S., Camici, S., Pandolfo, C., Burnelli, A., Ciabatta, L., and Brocca, L.: Rainfall-Runoff Database for Facilitating Improved Adaptation Strategies to Climate Extremes, EGU General Assembly 2023, Vienna, Austria, 23–28 Apr 2023, EGU23-16118, https://doi.org/10.5194/egusphere-egu23-16118, 2023.

EGU23-17149 | PICO | HS4.4

Early Warning Embedded in Intelligent Web-based Workflow for River Monitoring through Earth Observation and AI 

Mariana Damova, Emil Stoyanov, Stanko Stankov, and Hermand Pessek

The exploitation of rivers and hydropower reservoirs involves daily monitoring of the water resources, the meteorological conditions, the status of the coast, the flood areas, etc. Providing with timely and easy to consume information, analytics and early warnings for current and upcoming statuses or events helps water resources managers and high level officials to adequately observe and plan operations for sustainable development of river areas. We present an intelligent web-based workflow that combines different methods of AI, e.g. linked data, deep learning and resoning, to provide an integrated information system that ensures interoperability between spatial information of GIS systems, remote sensing information, symbolic and numerical data like meteorological data and proprietary measurements and creates an actionable knowledge value chain for the needs of rivers and hydropower reservoirs exploitation with embedded early warning capability. We show how hydrodynamic modelling using Telemac with forecasted water economic data, produced from earth observation and in-situ measurements applied to a series of neural network architectures, derive predictive river models, that are integrated into the work-flow and made available for querying, reviewing, projecting the changes in the navigational conditions of navigable rivers, geo-spatial visualization on GIS. The intelligent work-flow further provides with functional features like forecasts generation for river discharge, turbidity, water level, alerting and querying of a variety of correlations and synchronized visualizations in tables, graphs and GIS maps. It helps improve the
operational efficiency by providing ability to interact with and view all water resources management information at ones, ensures accuracy and decision making ability by correlating historic and forecast data with satellite imagery and data, gives automated forecasting of water economic data using satellite meteorological data, reduce risk through automated alerts. We demonstrate on the example of Danube the advantages of the presented intelligent web-based work-flow for the monitoring of rivers and their environment for sustainable development and planning.

Acknowledgement
This work has been carried out within ESA Contract No 4000133836/21/NL/SC


How to cite: Damova, M., Stoyanov, E., Stankov, S., and Pessek, H.: Early Warning Embedded in Intelligent Web-based Workflow for River Monitoring through Earth Observation and AI, EGU General Assembly 2023, Vienna, Austria, 23–28 Apr 2023, EGU23-17149, https://doi.org/10.5194/egusphere-egu23-17149, 2023.

EGU23-17458 | PICO | HS4.4

Surface water flood forecast-based loss estimation for resilient finance 

Dimosthenis Tsaknias, Andrew Pledger, Avinoam Baruch, and Dapeng Yu

Hazard warning systems are being increasingly employed globally, though these fail to account for surface water flooding or flooding from ordinary water courses. Thus, Previsico currently delivers to asset owners a warning and forecast service for surface water flooding at 25m resolution using its proprietary live hydrodynamic modelling software. Flood forecasts are generated every three hours and are produced using the latest rainfall nowcasts (6-hour outlook) and forecasts (48-hour outlook). The service issues property-level alerts so assets can be moved to safety, and organisations can improve their flood response capabilities. However, whilst warnings are important for mitigating physical impacts and losses, they – in isolation – are insufficient for coordinating the responses of insurers, re-insurers, and the wider finance sector. Of particular note, the accuracy of catastrophe claim reserves that depends on correct and timely loss estimates can directly affect the solvency and stability of a company. Loss estimation tools combining flood nowcasting and forecasting for perils that are rarely accounted for (e.g. surface water and ordinary water course flooding) are urgently needed to help insurers and reinsurers make reserving decisions with confidence.

We have therefore developed a loss estimation algorithm parameterised using Previsico’s world-leading forecast and nowcast derived flood extent and depth data and asset exposure and vulnerability data to produce near-present views of financial risk. Loss estimates will in turn be delivered to customers via Previsico’s flood dashboard and email alerts and alongside asset alerts and flood tiles, will support improved flood response capabilities for both the financial sector and associated stakeholders, including property owners and managers.     

How to cite: Tsaknias, D., Pledger, A., Baruch, A., and Yu, D.: Surface water flood forecast-based loss estimation for resilient finance, EGU General Assembly 2023, Vienna, Austria, 23–28 Apr 2023, EGU23-17458, https://doi.org/10.5194/egusphere-egu23-17458, 2023.

EGU23-17560 | PICO | HS4.4

Exploration of flood lead-times through river level monitoring: A case study from the Vilcanota river in Cusco, Peru 

Miguel Arestegui, Waldo Lavado, Abel Cisneros, Giorgio Madueño, Cinthia Almeida, Carlos Millán, Juan Bazo, and Jahir Anicama

Floods impact recurrently vulnerable populations in the Andean region. Anticipatory action approaches and mechanisms propose ways to reduce these impacts by acting ahead based on forecasting and monitoring systems. However, how much ahead in time can we take action with enough confidence? This is not a trivial question given the challenges of historical hydrometeorological records in the whole andean region. In this context, technological tools and approaches based on free and open source electronics have allowed new possibilities for hydrological monitoring instrumentation. By increasing the coverage in the Vilcanota river in Cusco, Peru, we can make empirical explorations and analytical estimates of riverine flood lead-times as well as historical flood maps. As a result, developments of early action mechanisms and early warning systems can be appropriate to what is feasible in such a context and similar ones.

How to cite: Arestegui, M., Lavado, W., Cisneros, A., Madueño, G., Almeida, C., Millán, C., Bazo, J., and Anicama, J.: Exploration of flood lead-times through river level monitoring: A case study from the Vilcanota river in Cusco, Peru, EGU General Assembly 2023, Vienna, Austria, 23–28 Apr 2023, EGU23-17560, https://doi.org/10.5194/egusphere-egu23-17560, 2023.

EGU23-803 | ECS | PICO | HS4.5

Impact-based seasonal rainfall forecasting to trigger early action for droughts 

Tim Busker, Hans de Moel, Bart van den Hurk, and Jeroen C.J.H. Aerts

The Horn of Africa faces an ongoing multi-year drought due to five consecutive failed rainy seasons, a novel climatic event with unpreceded impacts. Over 50 million individuals in the region are expected to be highly food insecure by the end of 2022 and early 2023. The severity of these drought impacts call for the urgent upscaling and optimisation of early warning systems that trigger early actions. However, drought research focuses mainly on meteorological and hydrological forecasting, while early action is seldom addressed specifically. This leads to a gap between early warning and early action, which heavily reduces the effectiveness of these systems.

To address this gap, this study investigates the effectiveness of early action for droughts by using seasonal ensemble forecasts from the European Centre for Medium-Range Weather Forecasts (ECMWF) SEAS5 system, predicting rainfall for the March-April-May (MAM) and October-November-December (OND) rainy seasons. We show that these seasonal rainfall forecasts reflect major on-the-ground impacts, which we identify from 9 years of monthly drought surveillance data from 21 counties in Kenya. Subsequently, we show that the SEAS5 drought forecasts with short lead times have substantial potential economic value (PEV) when used to trigger action before the OND season across the region (PEV max = 0.43). Increasing lead time to one or two months ahead of the season decreases PEV, but the benefits of early action still persist (PEV max = 0.2). Highest value for early action is found for the OND season in Kenya and Somalia, with excellent PEV max  of around 0.8 in Somalia. This indicates exceptional potential for early action to reduce impacts in this drought-prone country. The potential for early action is relatively low for the MAM season across the region, due to the season’s lower predictability. To illustrate the practical value of this research, we showcase how our methodology can be used by a pastoralist in the Kenyan drylands to effectively trigger livestock destocking ahead of a drought using SEAS5 forecasts.

These results are making headway to the development of concrete early action triggers for drought-prone regions, which are urgently needed to translate early warning to early action for droughts. It also emphasizes the need to expand historical datasets of drought impacts and early actions to support future research and policy development. Therefore, this work supports early decision-making and the development of early action protocols across the different countries in the Horn of Africa.

How to cite: Busker, T., de Moel, H., van den Hurk, B., and C.J.H. Aerts, J.: Impact-based seasonal rainfall forecasting to trigger early action for droughts, EGU General Assembly 2023, Vienna, Austria, 23–28 Apr 2023, EGU23-803, https://doi.org/10.5194/egusphere-egu23-803, 2023.

EGU23-1569 | ECS | PICO | HS4.5

Improved flood-related decision-making in case of urban flash floods in a metropolitan city of India 

Akshay Singhal, Nibedita Samal, Sanjeev Jha, Louise Crochemore, and Isabelle Ruin

Occurrences of short-duration extreme rainfall have significantly increased over India, leading to frequent flash floods. Growing incidences of urban floods pose a challenge to rainfall forecasting agencies and disaster mitigation authorities. Advancement in the numerical weather prediction (NWP) models has resulted in improved skills of rainfall forecast for longer lead times. However, in recent years, there is a growing emphasis on developing an impact-based approach to communicate the probable impacts of the forecast and reduce the socio-economic losses. In this study, we aim to generate Impact-Based Forecasts (IBFs) in response to the growing incidences of urban flash floods in metropolitan cities of India such as Mumbai. IBFs will provide warnings about the potential impacts as well as communicate protective responses based on the category of impact, i.e., high, moderate, and low. To this end, an inventory of several urban floods over the city of Mumbai during the past decades is prepared, and the relationship between past extreme hazards and related impacts is investigated. Various available Quantitative Precipitation Forecasts (QPFs) from the European Centre for Medium-range Weather Forecasts (ECMWF), Japan Meteorological Agency (JMA), UK Met Office (UKMO), and National Centre for Medium-Range Weather Forecasting (NCMRWF) will be used in the study. Moreover, several observation datasets, such as from the Indian Meteorological Department (IMD), and from Integrated Multi-satellitE Retrievals for GPM (IMERG), will be used to validate the forecast information. The raw precipitation forecasts will be post-processed using a Bayesian joint probability (BJP) model-based rainfall post-processing approach to improve reliability and accuracy. With this study, decision-makers are expected to gain crucial insights regarding the probable impacts arising due to multiple realistic flash floods in Mumbai scenarios. The analysis is underway, and the results will be presented at the conference.

How to cite: Singhal, A., Samal, N., Jha, S., Crochemore, L., and Ruin, I.: Improved flood-related decision-making in case of urban flash floods in a metropolitan city of India, EGU General Assembly 2023, Vienna, Austria, 23–28 Apr 2023, EGU23-1569, https://doi.org/10.5194/egusphere-egu23-1569, 2023.

EGU23-1894 | ECS | PICO | HS4.5

Using hydrodynamic flood modelling to support impact-based forecasting: a case study for Super-Typhoon Haiyan in the Philippines 

Asha Barendregt, Irene Benito Lazaro, Sanne Muis, Marc van den Homberg, and Aklilu Teklesadik

The Philippines is one of the countries most at risk to natural disasters. Amongst these disasters, typhoons and its associated landslides, storm surges and floods have caused the largest impact. Due to increased typhoon intensity, the country’s high population density in coastal areas and rising mean sea levels, the coastal flood risk in the Philippines is only expected to increase. The 510 initiative of the Netherlands Red Cross uses an Impact Based Forecasting (IBF) model based on machine learning to anticipate the impact of an incoming typhoon to set early action into motion. The IBF model underperformed in regions that are susceptible to storm surges. Most notably, it showed a poor performance for Super-Typhoon Haiyan (2013), which caused storm surges to reach up to over five meters high. The goal of this research is to evaluate how the IBF model can be improved by applying a fast hydrodynamic modelling approach that can forecast storm surges and coastal flooding associated with typhoons. First, the accuracy of the Global Tide and Surge Model (GTSM) in simulating Haiyan’s coastal water levels was examined. GTSM was forced with two different meteorological datasets: a gridded climate reanalysis dataset, ERA5, and observed track data combined with Holland’s parametric windfield model. Second, GTSM’s water levels were used as input for a hydrodynamic inundation model to simulate the flood depth and extent in San Pedro Bay, which was subjected to a widespread coastal flood during Haiyan. This was explored both with and without the inclusion of wave setup. Our results show that Haiyan’s flood cannot adequately be indicated using the ERA5 reanalysis dataset as meteorological forcing, as it underestimated Haiyan’s extreme wind speeds with ~60 m/s. By applying the Holland parametric wind field model, more accurate flood predictions and storm surge simulations can be made. Additionally, GTSM’s temporal resolution influences the models performance substantially. By increasing the 1 hour resolution to a 30 minute resolution the prediction of the overall flood extent improved by 16%. In future research we recommend examining the applicability of the Global Tide and Surge Model when using a higher spatial resolution to help better represent local processes. Additionally, exploring the accuracy for other typhoons that struck the Philippines and the applicability in operational setting using forecasted track data can contribute to further improving forecast-based early action systems in anticipating coastal flood occurrences.


How to cite: Barendregt, A., Benito Lazaro, I., Muis, S., van den Homberg, M., and Teklesadik, A.: Using hydrodynamic flood modelling to support impact-based forecasting: a case study for Super-Typhoon Haiyan in the Philippines, EGU General Assembly 2023, Vienna, Austria, 23–28 Apr 2023, EGU23-1894, https://doi.org/10.5194/egusphere-egu23-1894, 2023.

EGU23-3876 | PICO | HS4.5

Rapid global hazard forecasting to support early action in data poor regions 

fredrik huthoff, kris van den berg, and carolien wegman

In March 2022, the United Nations set as a five year target that every place on Earth should be served by Early Warning Systems (EWS) for natural hazards. Such an EWS provides emergency alerts when a natural disaster is imminent and can support local or international (aid) organizations to take effective action early on. Places most vulnerable to natural disasters are often those where little local data and capacity is available to locally develop and operate such a system. As local EWS are not yet available everywhere, robust and reliable global approaches and collaboration initiatives are needed as initial and possible fallback solution.

We propose an innovative flood hazard mapping method based on globally available data that can spatially indicate oncoming floods and thereby inform on preparatory actions to take, such as required emergency stocks, needed shelter capacity, clearing of evacuation routes, and strategic protection of vulnerable people and assets. It instantaneously calculates forecasted flood extents based on global precipitation forecasts and the terrain’s natural drainage network. Its functioning is demonstrated for a selection of historical flood events and shows to good agreement with satellite-observed inundated areas, even where flood extents have gone beyond catchment boundaries. The method can easily be scaled-up to other areas around the world and can be expanded to issue automated warnings and provide impact estimates.


How to cite: huthoff, F., van den berg, K., and wegman, C.: Rapid global hazard forecasting to support early action in data poor regions, EGU General Assembly 2023, Vienna, Austria, 23–28 Apr 2023, EGU23-3876, https://doi.org/10.5194/egusphere-egu23-3876, 2023.

EGU23-7070 | ECS | PICO | HS4.5

A Bayesian decision framework to support flood anticipatory actions in the urban data scarce city of Alexandria, Egypt 

Adele Young, Biswa Bhattacharya, and Chris Zevenbergen

Ensemble prediction systems (EPS) have been proposed to quantify uncertainty in forecasts, but to what extent they are useful for supporting flood anticipatory actions in an urban data-scarce city has not been fully explored. This research uses a Bayesian decision theory framework to support sequential decisions for reducing flood impacts. The predictive information is derived from probability distributions of flood depth simulated from a coupled ensemble Weather Research and Forecasting (WRF) and hydrodynamic MIKE urban inundation model. A damage function is used to value user actions and expected damages. Posterior probabilities are computed using prior probabilities and expected damages to select an action which minimises the expected losses.

The analysis is done for the Egyptian coastal city of Alexandria, which experiences extreme rainfall and pluvial flooding from winter storms resulting in disruptions, damages and loss of lives. The decision framework supports anticipatory actions which can be taken 12-72 hours before an event. These include cleaning drains, dispatching pump trucks to critical flood locations before events, and proactive pumping to increase storage.

Results suggest the use of a probabilistic decision framework can help support mitigating actions and reduce the occurrence of false and missed alarms. However, it depends on the combination of event intensity and probability (e.g. high intensity, low probability) the specific action and the loss function used. This approach helps decision-makers understand the value of probabilistic forecasts and models to trigger actions for improved decision support.

How to cite: Young, A., Bhattacharya, B., and Zevenbergen, C.: A Bayesian decision framework to support flood anticipatory actions in the urban data scarce city of Alexandria, Egypt, EGU General Assembly 2023, Vienna, Austria, 23–28 Apr 2023, EGU23-7070, https://doi.org/10.5194/egusphere-egu23-7070, 2023.

EGU23-8724 | ECS | PICO | HS4.5

Flood Early Warning and Hazard Mapping for Railway and Dam Management 

Heather J. Murdock, Antje Otto, Anna Heidenreich, and Annegret H. Thieken

Floods in Europe regularly cause damage and disruption to communities and infrastructure. The extreme flood of July 2021 which affected Germany, Belgium, Luxemburg and the Netherlands provides an example of a flood event with a rapid onset time with corresponding short warning times and high uncertainty. This was a flood event with high velocities and volumes of debris. In addition to casualties there was extensive damage and disruption to infrastructure including roads, rail, water supply, and power transmission. Some negative impacts can be mitigated through the use of flood early warning systems (FEWS) and spatial planning using hazard maps. For such risk reducing measures, it is important to understand what challenges remain towards implementation. For example, challenges may differ between actors with different mandates and capacities.   

Infrastructure operators have an important role in flood risk management as the functioning of critical infrastructure (CI) is of high importance for society. CI in this context includes infrastructure, such as dams and railroad which we focus on, whose failure or impairment results in lasting disruptions to the overall system. Is it therefore possible that the prevention of damage and disruption to CI can reduce risk for society as a whole? Flood early warning information can support early action including moving mobile assets to higher ground, preventative closures, or protecting critical parts of a network with mobile flood barriers. Little empirical data exists, however, to address this question. It is therefore unclear to what extent flood risk management measures have become integrated into CI management by infrastructure operators.   

In this study we conduct expert interviews with CI operators in Germany and Belgium to investigate: (1) what FEWS information CI operators use, (2) how has it been applied during past flood events, particularly in 2021, (3) what information is shared with other stakeholders in an emergency context, (4) what flood hazard maps do operators currently use, and (5) how are flood hazard maps integrated into infrastructure planning. Our focus on dam and railway operators is due to the important role they play in water management and regional transportation, respectively. The interviews are transcribed and coded using MaxQDA to address the five points mentioned above. The empirical basis of this research can help to shed light on the effectiveness of available information to reduce risk in an emergency management context as well as for infrastructure planning. 

How to cite: Murdock, H. J., Otto, A., Heidenreich, A., and Thieken, A. H.: Flood Early Warning and Hazard Mapping for Railway and Dam Management, EGU General Assembly 2023, Vienna, Austria, 23–28 Apr 2023, EGU23-8724, https://doi.org/10.5194/egusphere-egu23-8724, 2023.

EGU23-9345 | ECS | PICO | HS4.5

Lessons from Red Cross Red Crescent Anticipatory Action 

Arielle Tozier, Eduardo Castro Jr., Hafizur Rahaman, Dorothy Heinrich, Yolanda Clatworthy, and Luis Mundorega

The Red Cross Red Cresent is among the organizations with the longest and most extensive experience with forecast-based action. We present the findings of recently-published research based on interviews with 139 stakeholders involved in Red Cross Red Crescent (RCRC) AA programs in 18 countries. We find that the organizaitonal benefits of forecast-based ation include capacity building, more proactive operations, and expedited humanitarian response. Forecast-based action can also help to overcome common challenges in climate services by providing a framework and decision-making and resources for early action. Despite these benefits, AA practitioners struggle with challenges common to climate services, development, and humanitarian aid, including local project ownership, capacity and infrastructure, integration with existing systems, data availability, forecast uncertainty, and monitoring and evaluation. We conclude that forecast-based action systems can only be sustainble if they address these perennial challenges and focus on building capacity and ownership. Furthermore, donors can play a major role in facilitating these shifts by providing funding designed to support long-term multi-stakeholder processes.

How to cite: Tozier, A., Castro Jr., E., Rahaman, H., Heinrich, D., Clatworthy, Y., and Mundorega, L.: Lessons from Red Cross Red Crescent Anticipatory Action, EGU General Assembly 2023, Vienna, Austria, 23–28 Apr 2023, EGU23-9345, https://doi.org/10.5194/egusphere-egu23-9345, 2023.

EGU23-9862 | ECS | PICO | HS4.5

Assessing ensemble flood forecasts with action-relevant scores to support flood preparedness actions: An application to the Global Flood Awareness System in Uganda. 

Douglas Mulangwa, Andrea Ficchi, Philip Nyenje, Jotham Sempewo, Linda Speight, Hannah Cloke, Shaun Harrigan, Benon Zaake, and Liz Stephens

This study investigates the importance of assessing ensemble flood forecasts with action-relevant scores to support flood preparedness actions by analyzing the discrepancies between traditional general scores that focus on the overall accuracy with other more specific flood event-based scores. Popular general scores such as the Kling-Gupta Efficiency (KGE) or the Continuous Ranked Probability Score (CRPS) are widely used in hydrological modeling and forecasting, but they aggregate different aspects of model quality into a single overall score. On the other hand, flood event-based scores, such as Flood Timing Error (FTE), False Alarm Ratios (FAR) and Probability of Detection (POD), provide more specific verification measures of forecast quality that should be more informative to decision-makers. Both classes of overall accuracy and event-based scores include either deterministic or probabilistic scores, focusing on either the ensemble mean (or quantiles) or on probabilities. 

Results are presented for ten catchments in Uganda with different morphological and hydrological characteristics. An evaluation of extended-range re-forecasts from the Copernicus-Emergency Management Service Global Flood Awareness System (GloFAS) has been carried out against observed streamflow data, contrasting overall performance scores, including the KGE and the CRPS, and event-based scores, including the FTE, FAR and POD for forecasts at different lead times (< 45 days). The relative performance of two different versions of GloFAS (2.1 and 3.1) is assessed by this multi-criteria verification setting. Results show that the relative ranking of forecast performance across model versions and catchments may vary based on the scores considered, suggesting that a multi-criteria and event-based evaluation is needed to inform flood preparedness actions.

How to cite: Mulangwa, D., Ficchi, A., Nyenje, P., Sempewo, J., Speight, L., Cloke, H., Harrigan, S., Zaake, B., and Stephens, L.: Assessing ensemble flood forecasts with action-relevant scores to support flood preparedness actions: An application to the Global Flood Awareness System in Uganda., EGU General Assembly 2023, Vienna, Austria, 23–28 Apr 2023, EGU23-9862, https://doi.org/10.5194/egusphere-egu23-9862, 2023.

EGU23-10940 | ECS | PICO | HS4.5

Automatic generation of impact-based drought forecast, implications for early warning and action in East Africa 

Nishadh Kalladath Abdul Rasheed, Viola Otieno, Herbert Misiani, Jully Ouma, Erick Otenyo, Jason Kinuya, and Ahmed Amdihun

The regions of east Africa are facing unprecedented drought impacts at present and it is expected to intensify with climate change. Impact based forecast can give critical information for disaster preparedness, adaptation, and anticipatory action thereby increasing communities’ resilience. Probabilistic forecasts with uncertainty metrics have in the past provided early warning information for early actions. However, the complexity of drought as a disaster, encompassing and effecting wide range of socio-economic activities with interlinked compounding and cascading effect often makes drought impact forecasting bound to be less effective and robust (Boult et al. 2022). Moreover, drought impacts which are subjected to the influence of other high-impact weather related events, increases the difficulty to ascertain the extent of the impact. Therefore, drought impact forecasting should be viewed as a dynamic process that involves multi-stakeholders to realize its full potential of triggering early action (de Brito 2021). In such a scenario, the availability of an open, and widely accessible information portal can be effective in ensuring early waning information is disseminated widely across all stakeholders to trigger timely action.   

This study demonstrates an automatic impact-based drought forecast system to be integrated with existing East Africa Drought Watch (EADW) web portal. For the last two-to-three years, EADW has proven to be single window portal for major hazard related information dissemination for disaster early warning and action. The proposed automatic impact-based drought forecast system is based on TMAST ALERT probabilistic soil moisture and Water Requirement Satisfaction Index (WRSI) forecast using their data Application Programming Interface (API). TAMSAT ALERT is region specific validated, calibrated data source and its effectiveness assessed in impact-based forecast for the region (Boult et al. 2020, Busker et. al 2022). CLIMADA, an open-source software for climate risk assessment was used for integrating the soil moisture hazard data with exposure, and vulnerability to forecast socio-economic impact of drought. The current version of the system, directed for agriculture drought IBF, uses Spatially-Disaggregated Crop Production Statistics Data in Africa and WRSI maize crop unimodal relationship as impact function. The probabilistic forecast of WRSI is used to generate the Impact Based Forecasting (IBF), impact versus probability matrix for region specific map generation.  Finally, implications for early warning and early action on agricultural practices in the Eastern Africa region are discussed.  

1. Boult, Victoria L., et al. "Towards drought impact-based forecasting in a multi-hazard context." Climate Risk Management 35 (2022): 100402. 

2. de Brito, Mariana Madruga. "Compound and cascading drought impacts do not happen by chance: A proposal to quantify their relationships." Science of the Total Environment 778 (2021): 146236.​ 

3. Boult, Victoria L., et al. "Evaluation and validation of TAMSAT‐ALERT soil moisture and WRSI for use in drought anticipatory action." Meteorological Applications 27.5 (2020): e1959. 

4. Busker, T., de Moel, H., van den Hurk, B., Asfaw, D., Boult, V., and Aerts, J.: Impact-based drought forecasting for agro-pastoralists in the Horn of Africa drylands, IAHS-AISH Scientific Assembly 2022, Montpellier, France, 29 May–3 Jun 2022, IAHS2022-255, https://doi.org/10.5194/iahs2022-255, 2022. 

How to cite: Kalladath Abdul Rasheed, N., Otieno, V., Misiani, H., Ouma, J., Otenyo, E., Kinuya, J., and Amdihun, A.: Automatic generation of impact-based drought forecast, implications for early warning and action in East Africa, EGU General Assembly 2023, Vienna, Austria, 23–28 Apr 2023, EGU23-10940, https://doi.org/10.5194/egusphere-egu23-10940, 2023.

EGU23-11434 | ECS | PICO | HS4.5

Evaluating the explainability and performance of an elementary versus a statistical impact-based forecasting model 

Sahara Sedhain, Marc van den Homberg, Aklilu Teklesadik, Maarten van Aalst, and Norman Kerle

The disaster risk community has notably shifted from a response-driven approach to making informed anticipatory action choices through impact-based forecasting (IBF). Algorithms are being developed and improved to increase impact prediction abilities, and to allow automatic triggers to reduce the reliance on human judgement. However, as complexities in modelling algorithms increase, it becomes more difficult for decision makers to interpret and explain the results. This reduces the accountability and transparency, and can lead to lower adoption of the models. Therefore, humanitarian decision-makers can benefit from a mechanism to evaluate different IBF approaches, which has not yet been developed. Through a case study of anticipatory action for tropical cyclones in the Philippines, we evaluated two very different approaches to IBF: (1) a statistical trigger model that uses a machine learning algorithm with several predictor variables, and (2) an elementary trigger model that combines damage curves and weighted overlay of vulnerability indicators, to predict the impact and prioritize areas for intervention. The models were evaluated based on their performance for damage prediction and their sensitivity to different risk indicators for Typhoon Kammuri (2019) in the Philippines. The study also proposed a way of characterising the explainability specific to an IBF model, and that gives clarity on which elements, and why, influence the results, done via a model card. To facilitate this process a prototype interactive decision portal was built, which shows decision makers the sensitivity of the results to variations in input parameters. The results show that in relative terms the elementary model performed better and would have allowed to maximise impact reduction through early action, suggesting that, for this particular case, complex was not necessarily a better choice. However, the uncertainty in both models due to limitations in the initial hazard forecast indicates that multiple models need to be evaluated for practical cases that cover different characteristics of the hazard and socio-vulnerable situations. For this, the evaluation framework we developed can be expanded across operational IBF projects.

How to cite: Sedhain, S., van den Homberg, M., Teklesadik, A., van Aalst, M., and Kerle, N.: Evaluating the explainability and performance of an elementary versus a statistical impact-based forecasting model, EGU General Assembly 2023, Vienna, Austria, 23–28 Apr 2023, EGU23-11434, https://doi.org/10.5194/egusphere-egu23-11434, 2023.

EGU23-14435 | PICO | HS4.5

Towards a global machine learning based impact model for tropical cyclones 

Mersedeh Kooshki, Marc van den Homberg, Kyriaki Kalimeri, Andreas Kaltenbrunner, Yelena Mejova, Leonardo Milano, Pauline Ndirangu, Daniela Paolotti, Aklilu Teklesadik, and Monica Turner

Due to its geographical location, the Philippines is prone to tropical cyclones (TC) which produce strong winds, accompanied by heavy rains and flooding of large areas, resulting in heavy casualties to human life and destruction to livelihoods and properties. To reduce the humanitarian impact of TC, the Philippine Red Cross with the German Red Cross and 510, an initiative of The Netherlands Red Cross, designed and implemented a machine learning impact-based forecasting model based on XGBoost, which is used operationally to release funding and to trigger early action. The model predicts the percentage of houses that will be completely damaged due to a TC using predictive features for the hazard (wind speed, rainfall, storm surge and landslides), exposure (such as ruggedness and population density) and vulnerability (such as housing material and poverty) . However, this model is not easily transferable to other countries, due to its use of country specific data from the Philippines.

Here, we develop upon this line of research around the XGBoost model, in three ways. First, we evaluate multiple ML algorithms for classification and regression of impact data of tropical storms. Secondly, we perform a sensitivity analysis on the predictive features, replacing where possible those features for which only Philippines-specific data sources can be used with features for which data from global open data sources are available. Thirdly, the XGBoost model provides predictions at the aggregated geographical level of a municipality. Our research centres on transforming it to a grid based model with a resolution of 0.1 x 0.1 latitude-longitude degrees. For all experiments, due to the scarcity and skewness of the training data (algorithms are trained on only 40 historical typhoon events), specific attention is paid to data stratification, sampling and validation techniques. 

We find that XGBoost slightly outperforms random forest and that regression is more suitable to detect outliers than classification. Furthermore, we show that we can limit the predictive features from the original model to a subset of 20 features. The transformation to a grid-based model was possible by de-aggregating the impact data using OpenStreetMap housing data obtained from Humanitarian Data Exchange. Preliminary results show that the ML model performance worsens when going from municipality to grid-based level. This is likely caused by a larger error variance between the individual grid cells of a municipality which get averaged when aggregated. To conclude, relying on globally available data sources and working at grid level holds potential to render a machine learning based impact model generalisable and transferable to locations outside of the Philippines impacted by TCs. Future research will focus on validation with data for other countries. Ultimately, a transferable model will facilitate the scaling up of anticipatory action for tropical cyclones. 

How to cite: Kooshki, M., van den Homberg, M., Kalimeri, K., Kaltenbrunner, A., Mejova, Y., Milano, L., Ndirangu, P., Paolotti, D., Teklesadik, A., and Turner, M.: Towards a global machine learning based impact model for tropical cyclones, EGU General Assembly 2023, Vienna, Austria, 23–28 Apr 2023, EGU23-14435, https://doi.org/10.5194/egusphere-egu23-14435, 2023.

EGU23-15188 | ECS | PICO | HS4.5

Machine-learning enhanced forecast of tropical cyclone rainfall for anticipatory humanitarian action 

Andrea Ficchì, Guido Ascenso, Matteo Giuliani, Enrico Scoccimarro, Linus Magnusson, Rebecca Emerton, Elisabeth Stephens, and Andrea Castelletti

Tropical Cyclones (TCs) have the potential to cause extreme rainfall and storm surge, which in turn can lead to riverine and coastal flooding with huge damage to property and loss of lives.

The use of precipitation forecasts in the context of decision-making and anticipatory action is currently hampered by the limited skill of numerical weather prediction models in forecasting the characteristics of such extreme rainfall events (especially their severity and location) with a sufficiently long lead time.

In this study, we present a post-processing scheme for precipitation forecasts based on a popular deep-learning algorithm (U-Net). We design our Machine Learning (ML) model to reduce the local biases of precipitation forecasts from TCs and adjust the spatial distribution of extreme rainfall. For this, we use a composite loss function to train the model, based on the combination of the Mean Absolute Error (MAE) and the Fractions Skill Score (FSS). We first demonstrate the potential of our ML-based approach working on ERA5 reanalysis data and subsequently apply it to the ensemble mean of ECMWF sub-seasonal forecasts with a lead time up to 10-days. As for the ensemble spread, we investigate possible post-processing adjustments based on the improvement of the spread-error relationship and of action-relevant scores of interest for humanitarian agencies, namely False Alarm Ratios (FAR) and Hit Rates (HR). We train and validate the model on a historical dataset of global TC precipitation events, using ECMWF re-forecasts over 20 years and a multi-source observational dataset (MSWEP) as reference. The results are evaluated with a multi-criteria approach including MAE, FSS, FAR, and HR, to assess the capacity of improving the predicted severity and spatial patterns of TC precipitation, as well as their potential for triggering anticipatory actions. Finally, we discuss how the outputs of our model can be used and further improved to support humanitarian actions aimed at saving lives in vulnerable communities in Mozambique.

How to cite: Ficchì, A., Ascenso, G., Giuliani, M., Scoccimarro, E., Magnusson, L., Emerton, R., Stephens, E., and Castelletti, A.: Machine-learning enhanced forecast of tropical cyclone rainfall for anticipatory humanitarian action, EGU General Assembly 2023, Vienna, Austria, 23–28 Apr 2023, EGU23-15188, https://doi.org/10.5194/egusphere-egu23-15188, 2023.

EGU23-15732 | PICO | HS4.5

How a flood forecasting system saved lives and property in West Africa 

Jafet C.M. Andersson, Aishatu T. Ibrahim, Ahmed Lamine Soumahoro, Vakaba Fofana, Abdou Ali, and Berit Arheimer

Floods pose an increasing challenge for societies in West Africa; causing loss of lives, damaged infrastructure, and food insecurity. Improving flood management is hence paramount for the region, which several initiatives aim to contribute to. Hydrological forecasting systems can help, but only if they lead to appropriate action.

This presentation focusses on how a flood forecasting system has been used to save lives and property in West Africa within the FANFAR project (www.fanfar.eu). The system was co-designed and co-developed together with hydrological services, emergency management agencies, river basin organisations, and regional expert centres in 17 countries. The pilot system was launched early in the project, producing new forecasts every day. This enabled operational staff at national and regional agencies to utilize the system during the current rainy season, for every season since 2019.

During 2020, Nigeria experienced severe flooding. The Nigeria Hydrological Services Agency (NIHSA) hence decided to utilize FANFAR to warn the population of forthcoming flood risks, which resulted in 2 500 lives saved on one occasion, and minimisation of property damage on another. In the presentation we describe these events, and how NIHSA acted together with other institutions to entice action.

FANFAR was also used in Ivory Coast during the 2022 rainy season. Operational staff at SODEXAM – the meteorological services of Ivory Coast – utilized the system to inform two flood-prone communities of forthcoming flood risks. This resulted in on-the-fly construction of a drainage ditch, which reduced impacts on the nearby community. In the presentation we describe the event and also the approach SODEXAM took to build trust and communicate with the communities.

We also briefly describe the FANFAR system that employs a daily forecasting chain including meteorological reanalysis and forecasting based on HydroGFD, data assimilation of gauge observations, hydrological initialisation and forecasting with the HYPE model, flood severity assessment, and distribution through e.g. web visualisation. 

How to cite: Andersson, J. C. M., Ibrahim, A. T., Soumahoro, A. L., Fofana, V., Ali, A., and Arheimer, B.: How a flood forecasting system saved lives and property in West Africa, EGU General Assembly 2023, Vienna, Austria, 23–28 Apr 2023, EGU23-15732, https://doi.org/10.5194/egusphere-egu23-15732, 2023.

EGU23-16024 | ECS | PICO | HS4.5

From flood forecast to direct damage prediction: Supporting early action with an Impact-based Forecasting system 

Margherita Sarcinella, Brianna R. Pagán, Lisa Landuyt, Jeremy S. Pal, Arthur H. Essenfelder, and Jaroslav Mysiak

The global economic loss caused by weather-related extreme events amounts to over $260 billion in 2022. Storms and floods are among the deadliest disasters and are responsible for the highest toll. Despite committed research efforts in strengthening flood forecasting and making those predictions readily and openly available, much remains to be done to facilitate intervention when locally acting upon those forecasts. This research aims at building an automated tool to forecast flood direct damages with a high spatial resolution and timeliness. Thus, allowing prompt, informed and targeted early action on site before the disaster hits. Moreover, it can serve as a device to unravel criticalities within preparedness plans and guide the adoption of adaptation measures in the long term. The proposed research develops a tool to rapidly link GLOFAS discharge forecasts with the relative inundation map and direct damages caused. The method includes three modules: i) a factual component collecting satellite-derived flood maps of historical events; ii) a probabilistic component based on hydrological modelling and iii) the impact assessment. The past event database comprises 10-meter resolution inundation maps derived from Sentinel-1 SAR imagery with a single-scene automated classification method. The outcome of hydrological modelling is then integrated with the remote sensing database to improve its accuracy and spatial resolution. Lastly, the impact assessment module estimates affected people and the economic damage to buildings. The presented methodology is applied to two case studies: the flooding caused by Tropical Cyclone Idai that made landfall in March 2019 in Mozambique and the country-wide flood event that occurred in Pakistan in the summer of 2022.

How to cite: Sarcinella, M., Pagán, B. R., Landuyt, L., Pal, J. S., Essenfelder, A. H., and Mysiak, J.: From flood forecast to direct damage prediction: Supporting early action with an Impact-based Forecasting system, EGU General Assembly 2023, Vienna, Austria, 23–28 Apr 2023, EGU23-16024, https://doi.org/10.5194/egusphere-egu23-16024, 2023.

EGU23-16824 | ECS | PICO | HS4.5

Flood Preparedness Application Using Pre-determined Global Flood Inundation Maps 

Brett Snider, Robin Bourke, and Mathew Godsoe

In Canada, floods are the most common and most costly natural disaster. Floods threaten lives, properties, and the environment and these risks are only expected to increase alongside expected population increase and impacts from climate change. Flood early warning systems (FEWs) can help mitigate the impact of floods by helping inform the public when and where a flood may occur, identifying infrastructure that may be impacted, and disseminating evacuation routes that avoid flooded roads. FEWs have been shown to save lives and mitigate flood impacts. However, many existing FEWs are limited in terms of their forecast horizon and geographical coverage, and also require precise hydraulic models and substantial computing.

This paper develops a flood preparedness application for all of Canada to help prepare Canadians for future and imminent floods. This Canadian flood preparedness application addresses limitations associated with many of the developed FEWS in Canada by matching predicted river flows to predetermined return periods for developed global (or country-wide) flood inundation maps. By matching predicted river flow to return periods of predetermined inundation maps, complex computation is avoided reducing response time, and improving geographical coverage (by using a Canada-wide model). Lastly, using the static map approach, the public and emergency personal can help prepare for floods well in advance, identifying their own flood risk and as well as evacuation and muster locations strategies by identifying roads that would likely be flooded under various flood return periods. Overall the Canada-wide flood preparedness application will help protect and better prepare Canadians as flood risks continue to rise by increasing forecast horizon and geographical coverage and minimizing computation. The new approach of using global (or country-wide) static flood inundation maps to inform FEWS may be applicable in other countries where detailed hydraulic models are unavailable or too time consuming to calculate on a continuous or as needed basis.

How to cite: Snider, B., Bourke, R., and Godsoe, M.: Flood Preparedness Application Using Pre-determined Global Flood Inundation Maps, EGU General Assembly 2023, Vienna, Austria, 23–28 Apr 2023, EGU23-16824, https://doi.org/10.5194/egusphere-egu23-16824, 2023.

Streamflow prediction by using time series models is one of the practical methods that can play an important role in water resource management.  But choosing the correct model based on the linear or non-linear streamflow behavior is so crucial. Additionally, streamflow non-linearity can be affected by physiographic characteristics of watershed.  In this study, streamflow non-linearity of daily, monthly and yearly time series and its relationship with the hydrometric station area have been examined. To fulfill this purpose, ten hydrometric stations with various catchment area were selected in Hesse state in Germany. The Brock-Dechert-Scheinkman (BDS) test for testing non-linearity patterns in time series, was used to test non-linearity. The results showed that daily streamflow time series exhibit strong non-linearity. In addition, as the timescale increases, the intensity of nonlinearity decreases. Monthly and yearly streamflow time series showed less evidence of non-linearity. Furthermore, regarding the investigation of the relationship between streamflow non-linearity and watershed area, pearson and spearman tests were used. The results revealed that in none of the time scales, daily, monthly, and yearly there is no significant correlation between these two parameters. It should be noted that the novelty of this article is examining the relationship between intensity of the non-linearity and watershed area as a factor in choosing the best fitted model for time series.

How to cite: Khazaeiathar, M. and Schmalz, B.: Investigation of Non-linearity of Daily, Monthly, and Yearly Streamflow and the Correlation Between Non-linearity and Catchment Area, EGU General Assembly 2023, Vienna, Austria, 23–28 Apr 2023, EGU23-371, https://doi.org/10.5194/egusphere-egu23-371, 2023.

EGU23-580 | ECS | Orals | HS4.6

Impact of including CMIP6 ‘hot’ models in hydrological impact studies. 

Mehrad Rahimpour Asenjan, Francois Brissette, Jean-luc Martel, and Richard Arsenault

Climate change is already impacting different aspects of our lives, creating new risks and exacerbating existing ones. Developing effective adaptation and mitigation strategies requires a robust understanding of the magnitude and uncertainty of climate change impacts. A top-down approach is generally used to study climate change impacts on hydrology, forcing the hydrological models with the projections of multiple climate models and studying the impacts. To this end, typically, the impact researchers have given equal weight to climate models considering them independent and equally plausible, giving rise to the notion of “model democracy”. However, model democracy has been criticized fundamentally, and in model ensembles in which the justifiability of some models is challenged, such as CMIP6, model democracy is not a viable option anymore. Some of the CMIP6 models project a warmer future than those predicted by CMIP5 previously.  The climate sensitivity, a measure of the temperature rise in case of increased atmospheric carbon dioxide concentration, of these “hot models” is higher than the range that is expected to be plausible based on observations and our knowledge of planetary physics. The use of hot models in Climate change impact studies biases and overestimates the severity of the impacts. In this study, the impact of the inclusion (or exclusion) of hot models in a multi-model ensemble on the findings of large-sample hydrological climate change impact studies is evaluated. For 3107 North American catchments, we quantify this impact in terms of the magnitude and uncertainty of multiple streamflow metrics, such as mean annual streamflow and the hydrological extremes. The results exhibit a distinct spatial pattern in which the hot models' removal results in reduced streamflow metrics variability in northern regions (Canada and Alaska), southeast US, and along the US pacific coast. The reduced variability means that the hot models contribute to the extremes of the distributions in these regions. The variability reduction is highly dependent on the location of the catchments. Our findings emphasize the importance of the appropriate selection of climate models and display some of the dangers of including ill-advised models in climate change impact studies.

Keywords: Climate change, GCMs, CMIP6, Impact study,  Hydrology, hot models, climate model selection, Uncertainty 

How to cite: Rahimpour Asenjan, M., Brissette, F., Martel, J., and Arsenault, R.: Impact of including CMIP6 ‘hot’ models in hydrological impact studies., EGU General Assembly 2023, Vienna, Austria, 23–28 Apr 2023, EGU23-580, https://doi.org/10.5194/egusphere-egu23-580, 2023.

EGU23-1012 | ECS | Posters on site | HS4.6

A transparency fusion-based methodology for meteorological drought prediction 

Huihui Zhang, Tobias Sauter, and Hugo Loaiciga

Accurate prediction of drought is essential for assessing agricultural production, water resources management, and early risk warning. Various machine learning models have been developed to enhance the accuracy of drought prediction. However, most drought models do not account for data uncertainty. Novel approaches such as the stacking model consider the predictor uncertainty and include multi-source satellite-based products. Here, we develop and test a fusion-based ensemble stacking model that integrates extreme gradient boosting (XGBoost), random forecast (RF), and light gradient boosting machine (LightGBM) for drought modeling and prediction. Multi-source data, including meteorological, vegetation, anthropogenic, landcover, climate teleconnection patterns, and topological characteristics are incorporated in the proposed stacking model. The modeling framework forecast the one-month lead standardized precipitation evapotranspiration index (SPEI) on 12 month scale. In particular, data uncertainty is taken into account allowing for a rigorous model performance evaluation. The proposed method is applied and tested in the German federal states of Brandenburg, and Berlin. The results show that the ST model outperforms XGBboost, RF, and LightGBM, achieving an average coefficient of determination (R2) value of 0.845 in each month of the year 2018. The spatial-temporal Moran’s I method indicates that the ST model captures non-stationarity in modeling the relationship between predictors and the meteorological drought index and outperforms the other three models. Counterfactual sensitivity analysis indicated that extreme precipitation, soil moisture, runoff, and precedent SPEI explain more than 80 % of the total variance of the prediction. Based on the accuracy and flexibility of the method, it seems to be a promising approach for predicting other environmental phenomena.

How to cite: Zhang, H., Sauter, T., and Loaiciga, H.: A transparency fusion-based methodology for meteorological drought prediction, EGU General Assembly 2023, Vienna, Austria, 23–28 Apr 2023, EGU23-1012, https://doi.org/10.5194/egusphere-egu23-1012, 2023.

EGU23-4540 | ECS | Posters on site | HS4.6

Continental-scale evaluation of subseasonal–to–seasonal (S2S) streamflow forecasts over South America 

Erik Quedi, Fernando Fan, Vinicius Siqueira, Walter Collischonn, Ingrid Petry, Cleber Gama, Rodrigo Paiva, Reinaldo Silveira, Cassia Paranhos, and Camila Freitas

Hydrological forecasts ranging from two weeks to months in advance are critical for decision making in water resources management and economic sectors. In the subseasonal timescale, there is an opportunity to anticipate events of hydrological interest, such as periods of floods and droughts. The development of subseasonal forecasts with good quality for decision support systems is still a great challenge for the technical and scientific community, as it fits into a predictability gap between medium-range weather (3 to 15 days) and seasonal climate prediction (2 to 7 months). In South America, the climate and weather variability can represent risk to activities such as agriculture and hydropower energy production. For instance, Brazil, the larger country in terms of area and economy in the continent, has an electrical power generation matrix with 63% of hydropower and rely on weather forecasts spanning multiple timescales for its integrated system operation. This work evaluated the potential skill of subseasonal streamflow forecasts over South America based on ECMWF ensemble forecasts with lead times up to 46 days obtained from the Subseasonal-to-Seasonal (S2S) project database. A continental-scale hydrologic-hydrodynamic model was used to carry out the simulation runs for obtaining subseasonal ensemble streamflow forecasts. Forecast bias was evaluated against a reference model run (i.e., pseudo-observations) for both raw and bias corrected precipitation, and the forecast skill was evaluated against the Ensemble Streamflow Prediction (ESP) method. Forecasts and pseudo-observations were aggregated into weekly averages, ranging 6 weeks for verification, and were divided into subsets for each season of the year (DJF, MAM, JJA, SON) to access seasonal patterns over South American regions. The results highlight that the forecast skill is dependent on initialization month, season, basin, and forecast lead time, with greater skill on shorter lead times. Bias correction was able to reduce the mean forecast error over most regions of the continent. In addition, the bias correction improved skill and maintained positive skill after the third week of forecast, especially in northeastern regions and on wet seasons (DJF, MAM), meanwhile in central regions the improvements were not clear. However, the ESP method outperformed the ECMWF-based ensemble in many regions. Finally, the results presented here provide insights for investigations and applications of S2S forecasts in the operational scope on a continental scale, which can bring benefits, for example, in the optimization of the operation of electricity generation reservoirs.

Acknowledgments: This work presents part of the results obtained during the project granted by the Brazilian Agency of Electrical Energy (ANEEL) under its Research and Development program Project PD 6491-0503/2018 – “Previsão Hidroclimática com Abrangência no Sistema Interligado Nacional de Energia Elétrica” developed by the Paraná State electric company (COPEL GeT), the Meteorological System of Paraná (SIMEPAR) and the RHAMA Consulting company. The Hydraulic Research Institute (IPH) from the Federal University of Rio Grande do Sul (UFRGS) contribute to part of the project through an agreement with the RHAMA company (IAP-001313).

How to cite: Quedi, E., Fan, F., Siqueira, V., Collischonn, W., Petry, I., Gama, C., Paiva, R., Silveira, R., Paranhos, C., and Freitas, C.: Continental-scale evaluation of subseasonal–to–seasonal (S2S) streamflow forecasts over South America, EGU General Assembly 2023, Vienna, Austria, 23–28 Apr 2023, EGU23-4540, https://doi.org/10.5194/egusphere-egu23-4540, 2023.

EGU23-5028 | ECS | Orals | HS4.6

Towards machine learning-based streamflow drought forecasts across the Colorado River Basin 

Phillip Goodling, Roy Sando, Ryan McShane, Scott Hamshaw, David Watkins, Ellie White, Caelan Simeone, and John Hammond

Drought is among the most damaging environmental phenomena, affecting agricultural productivity, wildfire risks,  hydropower production, water quantity and quality, public health, ecosystem integrity, and recreation. Streamflow drought, where the streamflow declines below a threshold defining anomalously low flows, is one measure of hydrologic drought that can be interpreted as an integrative measure of the availability of water for specific uses. Early warning of streamflow drought onset, severity, spatial extent, and duration is needed to support improved water resource management. Streamflow drought forecasting is particularly important in the western United States where a changing climate threatens already-scarce water resources.

The U.S. Geological Survey is  applying a variety of machine learning and artificial intelligence modeling methods to predict streamflow drought in a 40-year retrospective analysis at 425 USGS stream gage locations within and surrounding the Colorado River basin. In this presentation, we briefly provide an overview of these approaches, then primarily focus on results from random forest binary classification models for streamflow drought onset and duration. For this study, streamflow drought is defined using seasonally variable streamflow exceedance thresholds developed from the Weibull distribution of observed flows or zero-flow durations from 1981-2020. We trained a large set of random forest models (n =72) , each of which predicts daily streamflow drought onset and duration probabilities at a particular forecast horizon and severity level. The models are trained using past observations of daily streamflow drought and a predictor dataset of daily hydrometeorological variables and static basin characteristics We combine the results of these models to provide holistic forecasts. In addition to streamflow drought prediction performance, we evaluate the opportunities for transitioning this modeling framework to operational forecasting and consider future directions for providing actionable forecasts to regional and national stakeholders.

How to cite: Goodling, P., Sando, R., McShane, R., Hamshaw, S., Watkins, D., White, E., Simeone, C., and Hammond, J.: Towards machine learning-based streamflow drought forecasts across the Colorado River Basin, EGU General Assembly 2023, Vienna, Austria, 23–28 Apr 2023, EGU23-5028, https://doi.org/10.5194/egusphere-egu23-5028, 2023.

EGU23-5859 | Posters on site | HS4.6

S2S rainfall forecast calibration in real-time for a dense network of hydropower catchments 

Andrew Schepen, James Bennett, Prafulla Pokhrel, and Kim Robinson
The continuing improvement of seasonal rainfall outlooks means they are now skillful enough to predict inflows to hydropower schemes and help to anticipate operational decisions. Hydro Tasmania, Australia’s largest generator of hydropower, is working with CSIRO to develop a long-range inflows prediction system for its 6 hydroelectric schemes. The schemes complement each other and are operated as a single system. The inflows predictions will be generated with conceptual hydrological models calibrated to a dense network of 563 sub-catchments. In this study, we develop a real-time S2S rainfall forecast capability for this network with forecasts updated as frequently as daily. We seek to establish a forecast post-processing model that generates high-resolution, spatially correlated ensemble rainfall forecasts from coarse-resolution climate model forecasts. We compare lagged ensemble forecasts from the Bureau of Meteorology’s new ACCESS-S2 seasonal forecasting model with burst ensemble forecasts from ECMWF’s SEAS5 model, eliciting the value of simple versus complex post-processing methods for coarse-scale calibration of the ensemble climate forecast. A random selection from k nearest-neighbours provides a template for disaggregation of each ensemble member to the required spatial and temporal resolution. To understand the skill available to the real-time forecasting system, we evaluate the historical performance of the system from 1981-2018. Skilful forecasts can be obtained for the next month after which the ensemble time series ought to revert to an unbiased climatology forecast. The calibration method can be highly computationally efficient, allowing parameters to be re-estimated in the process of generating each new forecast, thereby updating parameters with the most up-to-date forecast and observation data available. Combined with an efficient hydrological model, reliable rainfall forecasts can add value to antecedent hydrological conditions to provide more skilful forecasts of inflows for the season ahead.  

How to cite: Schepen, A., Bennett, J., Pokhrel, P., and Robinson, K.: S2S rainfall forecast calibration in real-time for a dense network of hydropower catchments, EGU General Assembly 2023, Vienna, Austria, 23–28 Apr 2023, EGU23-5859, https://doi.org/10.5194/egusphere-egu23-5859, 2023.

EGU23-6481 | ECS | Posters virtual | HS4.6

Evaluation of Predictive Skill of Flash Droughts over China based on S2S Forecast Models 

Ruxuan Ma and Xing Yuan

Flash droughts have been occurring frequently worldwide, which has a serious impact on food and water security. Flash droughts have raised a wide concern, but whether they can be predicted at sub-seasonal time scale remains unclear. We investigate the forecast skill of flash droughts over China with lead times up to three weeks by using model hindcasts from the sub-seasonal-to-seasonal prediction (S2S) project. The flash droughts are identified by using weekly soil moisture percentiles from two S2S forecast models (ECMWF and NCEP). The comparison with reanalysis shows that ECMWF and NCEP forecast models underestimate flash drought occurrence. The ensemble of the two models increases equitable threat score from ECMWF and NCEP models for lead 1 week. In terms of probabilistic forecast, ECMWF also has higher brier skill score than NCEP especially over Eastern China, which is consistent with higher temperature and precipitation forecast skill and flash drought predictability of ECMWF model. The multi-model ensemble shows a higher skill than ECMWF model. This study suggests the importance of multi-model ensemble flash drought forecasting.

How to cite: Ma, R. and Yuan, X.: Evaluation of Predictive Skill of Flash Droughts over China based on S2S Forecast Models, EGU General Assembly 2023, Vienna, Austria, 23–28 Apr 2023, EGU23-6481, https://doi.org/10.5194/egusphere-egu23-6481, 2023.

EGU23-7396 | ECS | Posters virtual | HS4.6

Decadal variation of predictive skill of seasonal climate over the Yangtze River and its possible causes 

Chunyu Shao, Xing Yuan, and Feng Ma

Seasonal climate predictions with global climate models which are developed based on the ocean-atmosphere interactions, contribute to the water resources management and hazard mitigation. Nowadays, multi-model ensemble seasonal climate prediction system, such as North American Multi-Model Ensemble (NMME), has become an effective way to provide useful forecast information a few months ahead especially over regions with strong ocean-atmosphere coupling. Previous studies have evaluated the skill of NMME hindcasts worldwide, however, it’s still unclear that whether the NMME real-time forecasts perform as well as the hindcasts and how the changes in ocean-atmospheric teleconnections affect the prediction skill. Here we show that although selecting an appropriate time frame for the calculation of climatology can reduce errors of real-time prediction, the real-time prediction skills are lower than hindcast skills in the Yangtze River basin, with anomaly correlation decreased by 14%-51% (38%-75%) and error increased by 30%-31% (51%-55%) for seasonal precipitation (temperature) predictions up to the sixth lead-seasons, and the skill decrease larger at longer leads. The failure in representing the decadal variations of ocean-atmospheric teleconnection (especially the association with Indian Ocean surface temperature) during the real-time forecast period can partly explain the decline in the prediction skills. Our findings suggest that improved simulations of the changes in the ocean-atmospheric teleconnections are necessary for skillful seasonal climate predictions in the real-time.

How to cite: Shao, C., Yuan, X., and Ma, F.: Decadal variation of predictive skill of seasonal climate over the Yangtze River and its possible causes, EGU General Assembly 2023, Vienna, Austria, 23–28 Apr 2023, EGU23-7396, https://doi.org/10.5194/egusphere-egu23-7396, 2023.

EGU23-9689 | Posters on site | HS4.6

Hydrometeorological System for Seasonal Streamflow Forecasting at Brazilian Hydro Power Enterprises 

Reinaldo Bomfim da Silveira, Camila Freitas, Cassia Silmara Aver Paranhos, Luciane Cristina Pinheiro, Roberto Santos, André Luiz de Campos, Leandro Ávila Rangel, Nathalli Rogiski da Silva, Fernando Mainardi Fan, Cléber Henrique de Araújo Gama, Erik Quedi, and Ingrid Petry

The Electric Energy Company of Parana (COPEL GeT), the Meteorological System of Parana (SIMEPAR) and RHAMA Consulting company are undertaking the research project PD-6491-0503/2018 for the development of a hydrometeorological seasonal forecasting for Brazilian reservoirs. The project, sponsored by the Brazilian Electricity Regulatory Agency (ANEEL) under its research and development programme, aims the forecasting of streamflow, at temporal scales ranging from 1 to 270 days, at hydro power enterprises, which are integrated by the National Power System Operator (ONS) through its Interconnected System (SIN). We present in this work the framework built up as interface to the results of this project, which integrate shapefiles of main river basins in Brazil, hydro meteorological information, forecasts of precipitation from seasonal models (e.g., ECMWF’s SEAS5) and derived streamflow from hydrological model used in the project (MGB-SA mainly) for the entire electric energy network of the country. The platform encompasses layers of maps and graphics synchronized by date, respectively to locations of hydro power plants in Brazil, which allows users to perform multiple analysis for either energy planning or routine hydraulic operations. We shall demonstrate examples of applications, such analysis of a flood event happened during the 2014/2015 El Niño episode, which caused heavy precipitation, increased river level and flow into reservoirs in the Iguaçu River basin, disruption of services and economic losses in the South of Brazil. Given the limitations of seasonal precipitation forecasting, the model was successful in predicting the heavy accumulated rainfall in the analyzed period. In parallel, the hydrological model was able to simulate flow peaks well in advance. In addition, the platform allows an overview of the SIN subsystems and respective stored energy, which allows intercomparison and pragmatic analysis of the country's electric energy capacity.

How to cite: Bomfim da Silveira, R., Freitas, C., Silmara Aver Paranhos, C., Cristina Pinheiro, L., Santos, R., de Campos, A. L., Ávila Rangel, L., Rogiski da Silva, N., Mainardi Fan, F., de Araújo Gama, C. H., Quedi, E., and Petry, I.: Hydrometeorological System for Seasonal Streamflow Forecasting at Brazilian Hydro Power Enterprises, EGU General Assembly 2023, Vienna, Austria, 23–28 Apr 2023, EGU23-9689, https://doi.org/10.5194/egusphere-egu23-9689, 2023.

EGU23-9937 | Orals | HS4.6

Towards robust seasonal streamflow forecasts in mountainous catchments: impact of calibration metric selection in hydrological modeling 

Pablo A. Mendoza, Diego Araya, Eduardo Muñoz-Castro, and James McPhee

The ensemble streamflow prediction (ESP) method has been widely used to produce seasonal streamflow forecasts, especially in snow-influenced basins. Because the approach relies on the assumption of perfect initial conditions that are obtained from hydrological models, choices related to their implementation may have considerable impacts on forecast attributes. Here, we investigate the extent to which the choice of calibration objective function (OF) affects the quality of seasonal (Spring-Summer) streamflow forecasts in mountainous regions, and also explore possible connections between forecast skill and hydrological consistency - measured in terms of biases in hydrological signatures - obtained from the model parameter sets. To this end, we calibrate three conceptual rainfall-runoff models (GR4J, TUW, and Sacramento) using 12 different calibration metrics, including seasonal objective functions that emphasize errors during the snowmelt period, and produce hindcasts for five initialization times over a 33-year period (April/1987 - March-2020) in 22 mountain catchments that span diverse hydroclimatic conditions along the semiarid Andes Cordillera. The results show that seasonal objective functions generate satisfactory performance in terms of probabilistic skill, reliability, and correlation compared to classic OFs like the Nash-Sutcliffe Efficiency (NSE). Nevertheless, commonly used OFs provide more realistic simulations in terms of simulated hydrological signatures. Among the options tested, an OF that combines the Kling-Gupta Efficiency (KGE) and NSE(log(Q)) provides the best compromise between hydrologically consistent model simulations and good forecast performance. Overall, we do not find direct relationships between hydrologically consistent model parameter sets and the quality of seasonal ESP forecasts. Finally, the results show that ESP is most skillful in catchments with high baseflow index and high interannual runoff variability. 

How to cite: Mendoza, P. A., Araya, D., Muñoz-Castro, E., and McPhee, J.: Towards robust seasonal streamflow forecasts in mountainous catchments: impact of calibration metric selection in hydrological modeling, EGU General Assembly 2023, Vienna, Austria, 23–28 Apr 2023, EGU23-9937, https://doi.org/10.5194/egusphere-egu23-9937, 2023.

EGU23-10122 | Orals | HS4.6

Extracting value from seasonal forecasts for droughts: an approach based on persistence rules. 

Rafaela Cristina de Oliveira, Ingrid Petry, and Fernando Mainardi Fan

Long-term planning is part of good water resource management. This management takes place according to the needs of society, such as optimizing energy production, providing water for agriculture, supplying industry and guaranteeing urban water supply. The quantification of water resources and their long-term forecast are tools that help with this planning. In this work, we evaluated the ability of seasonal streamflow forecasts to detect droughts periods based on forecast evaluation rules of a Hydrologic Ensemble Prediction System (H-EPS), and compare them with the benchmark Ensemble Streamflow Prediction (ESP). Seasonal forecasts of seven months horizon were generated using the MGB-AS model forced with ECMWF seasonal precipitation forecasts (SEAS5), for basins larger than 1000 square kilometers. The focus of the study were the 153 hydroelectric plants of the Brazilian National Interconnected System (SIN), which affluent flows were studied for the period of 2007 to 2016.  For each plant, drought forecasts were analyzed using the Area Under the Receiver Operating Characteristics curve (AUROC). The drought threshold was defined as the 90th percentile of the flow, using data from 1979 to 2006. Exceedance diagrams were made, where each forecast horizon was represented with the percentage of members that indicated the occurrence of a dry month. Then, contingency tables were set up, considering the drought detection criterion as at least one member indicating drought in the seven horizons and six months with at least 20% of the members indicating drought. The rule was elaborated based on data from the Itaipu power plant (Paraná River) and applied to all plants. Through the results, it was observed that the H-EPS forecasts were more accurate in detecting droughts than the benchmark. In the regional analysis of the results, the rule chosen for Itaipu was also suited for the plants in the southeast region. This may have occurred because these hydroelectric plants rivers present similar hydrological behavior, related to the type of soil, evapotranspiration rates, precipitation, climate and similar relief. Our next steps involve the creation, testing and analysis of more locally and temporally optimized rules, including some that consider only the first months predicted in the analysis.

How to cite: Cristina de Oliveira, R., Petry, I., and Mainardi Fan, F.: Extracting value from seasonal forecasts for droughts: an approach based on persistence rules., EGU General Assembly 2023, Vienna, Austria, 23–28 Apr 2023, EGU23-10122, https://doi.org/10.5194/egusphere-egu23-10122, 2023.

Model output statistics (MOS) are generally tailored for single variables, despite their application to multivariate time series being constantly required in many problems. For instance, distributed, physical-based hydrological models often require as input meteorological variables (e.g. precipitation, land temperature, evapotranspiration, etc) that are strongly correlated. Preserving the spatio-temporal variability of single variables as well as the inter-variables dependence structure is thus of fundamental importance in climate model outputs to enhance, for instance, reliable hydrological predictions. In this context, we extend the multivariate bias correction algorithm (MBCn) proposed by Cannon (2018) through pre-filtering the input data and improving the orthogonal rotation matrix. We finally evaluate different bias correction algorithms. Our proposed approach is grounded on the multivariate techniques of principal component analysis (PCA) and sparse principal component analysis (SPCA). It seeks to promote bias correction while preserving spatial and inter-variable dependencies. We apply and test our algorithm using S2S predictions provided by the C3S multi-system seasonal forecast service, which includes climate models such as ECMWF, NCEP and canCM4i. The ERA 5 reanalysis data are used as reference meteorological data. We particularly explore the application of the proposed methodology to daily S2S forecasts of precipitation, temperature, wind field and surface solar radiation, which are notably valuable as input to hydrological models and to estimate evapotranspiration, droughts indices and renewable energy yields.


Acknowledgment

This work was supported by the National Research Foundation of Korea(NRF) grant funded by the Korea government(MSIT) (No. 2019R1A2C2087944).

How to cite: Lima, C. and Kwon, H.-H.: A multivariate bias correction algorithm for climate model predictions and projections, EGU General Assembly 2023, Vienna, Austria, 23–28 Apr 2023, EGU23-10505, https://doi.org/10.5194/egusphere-egu23-10505, 2023.

EGU23-10624 | Orals | HS4.6

Seamless subseasonal probabilistic streamflow forecasting: MuTHRE lets you have your cake and eat it too 

Mark Thyer, David McInerney, Dmitri Kavetski, Richard Laugesen, Fitsum Woldemeskel, Narendra Tuteja, and George Kuczera

Subseasonal streamflow forecasts inform a multitude of water management decisions, from early flood warning to reservoir operation. ‘Seamless’ probabilistic forecasts, i.e., forecasts that are reliable and sharp over a range of lead times (1-30 days) and aggregation time scales (e.g. daily to monthly) are of clear practical interest. However, existing forecast products are often ‘non-seamless’, i.e., developed and applied for a single time scale and lead time (e.g. 1 month ahead). If seamless forecasts are to be a viable replacement for existing ‘non-seamless’ forecasts, it is important that they offer (at least) similar predictive performance at the time scale of the non-seamless forecast.

This study compares forecasts from two probabilistic streamflow post-processing (QPP) models: the recently developed seamless daily Multi-Temporal Hydrological Residual Error (MuTHRE) model and the more traditional (non-seamless) monthly QPP model used in the Australian Bureau of Meteorology’s Dynamic Forecasting System. Streamflow forecasts from both post-processing models are generated for 11 Australian catchments, using the GR4J hydrological model and pre-processed rainfall forecasts from the ACCESS-S numerical weather prediction model. Evaluating monthly forecasts with key performance metrics (reliability, sharpness, bias and CRPS skill score), we find that the seamless MuTHRE model achieves essentially the same performance as the non-seamless monthly QPP model for the vast majority of metrics and temporal stratifications (months and years). As such, MuTHRE provides the capability of ‘seamless’ daily streamflow forecasts with no loss of performance at the monthly scale – the modeller can proverbially ‘have their cake and eat it too’. This finding demonstrates that seamless forecasting technologies, such as the MuTHRE post-processing model, are not only viable, but a preferred choice for future research development and practical adoption in streamflow forecasting.

How to cite: Thyer, M., McInerney, D., Kavetski, D., Laugesen, R., Woldemeskel, F., Tuteja, N., and Kuczera, G.: Seamless subseasonal probabilistic streamflow forecasting: MuTHRE lets you have your cake and eat it too, EGU General Assembly 2023, Vienna, Austria, 23–28 Apr 2023, EGU23-10624, https://doi.org/10.5194/egusphere-egu23-10624, 2023.

EGU23-11515 | Orals | HS4.6 | Highlight

An introductory review of the integration of local and scientific knowledges in climate services 

Micha Werner, Sumiran Rastogi, Marc van den Homberg, Ilias Pechlivanidis, and Lluís Pesquer

Climate services have a well-recognised potential for empowering decision makers in taking climate smart decisions; across sectors, public agencies, policy makers, and including citizens. This potential is, however, often not fully realised as the uptake of climate services may be hampered by a range of barriers, including the lack of understanding of the needs of users, and the poor recognition of the knowledge users themselves have. Research shows, however, that the users climate services intend to serve often have a well-developed knowledge of the climate systems around them based on their observation and experience. In a recently initiated H2020 research project, Innovating Climate Services through Integration of local and Scientific Knowledge (I-CISK, https://icisk.eu) we recognise that integrating multiple knowledges through co-creation of climate services with users, can contribute to closing the usability gap, despite the challenges to these knowledges as a result of demographic, climatic and environmental change.

Here we present an introductory review of the current state of the art in the integration of local knowledge in climate services. This review does not aim to comprehensively address the very broad and multiple dimensions of local knowledge, but rather gives a perspective of current approaches in science and practice to the integration of local and scientific knowledge. We first explore what we consider as local knowledge within the scope of this review, which will also be used as a reference to inform our further research on local knowledge within the context of its integration in climate services in the I-CISK project. We then review how local knowledge is used in climate services, and introduce a basic typology of how local knowledge and scientific knowledge are considered and/or integrated within climate services. Finally, we provide a reflection on the challenges and directions of local and scientific knowledge integration in climate services, and give a brief outlook on how these challenges will be addressed in the I-CISK project.

How to cite: Werner, M., Rastogi, S., van den Homberg, M., Pechlivanidis, I., and Pesquer, L.: An introductory review of the integration of local and scientific knowledges in climate services, EGU General Assembly 2023, Vienna, Austria, 23–28 Apr 2023, EGU23-11515, https://doi.org/10.5194/egusphere-egu23-11515, 2023.

EGU23-12694 | ECS | Posters on site | HS4.6

Comparing drought simulation performance from large-scale and locally set up hydrological models for large mountainous rivers in Switzerland 

Annie Y.-Y. Chang, Konrad Bogner, Maria-Helena Ramos, Shaun Harrigan, Daniela I.V. Domeisen, and Massimiliano Zappa

Historically, Switzerland and the nearby alpine countries have not been associated with major droughts. However, in recent years, the European Alpine space has experienced several unprecedented low-flow conditions and drought events. As many economic sectors in the region depend heavily on sufficient water availability, such as hydropower production, navigation and transportation, agriculture, and tourism, it is important for decision-makers to have early warnings of drought tailored to their needs and geographical conditions.

The European Flood Awareness System (EFAS) has been in operation since 2012 providing flood risk overviews for Europe up to 15 days in advance. More recently, it has also run long-range hydrological outlooks for sub-seasonal to seasonal horizons. While EFAS early flood warnings have been extensively evaluated in the past years, less attention has been paid to evaluating the system’s ability to detect upcoming drought conditions. In this study, we turn our focus to this other extreme of the spectrum and on EFAS’ predictability of drought events in large Alpine catchments. Our goal is to investigate how hydrological patterns of skill at a large spatial scale can be combined with local model outputs to more accurately inform decision makers on droughts and their spatio-temporal evolution.

For this, we evaluate the performance of EFAS comparatively to that of a local model in terms of the ability to simulate drought conditions. The Precipitation-Runoff-Evapotranspiration HRU (PREVAH) local model was set up for 59 stations in Switzerland. The PREVAH model is a distributed conceptual hydrological model that accounts for processes such as evapotranspiration, interception, snow- and ice-melt, soil moisture storage, groundwater storage, and runoff generation. We analyse 25 overlapping stations between the local model and the EFAS reporting stations (river network points where EFAS outputs are available to users), and compare the drought simulation performances of the two models. We focus on evaluating the duration, deficit, and magnitude of the drought events, as well as metrics including Nash–Sutcliffe model efficiency coefficient (NSE) and Kling-Gupta efficiency (KGE).

The outcome of this study will lay a foundation for how a large-scale hydrological model like EFAS can complement a local model like PREVAH to improve the predictability of sub-seasonal drought forecasting and provide more reliable early warnings for better water resources management.

How to cite: Chang, A. Y.-Y., Bogner, K., Ramos, M.-H., Harrigan, S., Domeisen, D. I. V., and Zappa, M.: Comparing drought simulation performance from large-scale and locally set up hydrological models for large mountainous rivers in Switzerland, EGU General Assembly 2023, Vienna, Austria, 23–28 Apr 2023, EGU23-12694, https://doi.org/10.5194/egusphere-egu23-12694, 2023.

EGU23-13170 | Posters on site | HS4.6

A pan-European service for hydrological seasonal forecasts at C3S 

Wei Yang, Peter Berg, Ronald Hutjes, Ursula McKnight, Lisanne Nauta, and Spyros Paparrizos

As contractor and sub-contractor for C3S, SMHI and WU-DES have set up a multi-model operational service for hydrological seasonal forecasts. The service currently produces forecasts of monthly mean river discharge for a pan-European domain using several hydrological models, namely E-HYPEcatch, on irregular catchment delineations, and E-HYPEgrid and VIC-WUR on regular 5km gridded drainage network of EFAS. Also, the EFAS-Lisflood forecasts from the separate ECMWF production line are included in the final data set. All forecasts use the SEAS5 meteorological forecasts with 51 ensemble members. The data from all models are available from the CDS data portal for a re-forecast (https://doi.org/10.24381/cds.13c18212) and a forecast period (https://doi.org/10.24381/cds.52f45864). Further, the most probable forecast is displayed in an online application (https://cds.climate.copernicus.eu/cdsapp#!/software/app-hydrology-seasonal-forecast-explorer?tab=app).

Ongoing work is aimed at introducing a second meteorological forecasting system, and adding more output variables at a higher daily temporal resolution. The quality of the forecasts is at this point mainly addressed by working on the input data and statistical downscaling and bias adjustment. The new system is expected to be operational in mid-2024.

How to cite: Yang, W., Berg, P., Hutjes, R., McKnight, U., Nauta, L., and Paparrizos, S.: A pan-European service for hydrological seasonal forecasts at C3S, EGU General Assembly 2023, Vienna, Austria, 23–28 Apr 2023, EGU23-13170, https://doi.org/10.5194/egusphere-egu23-13170, 2023.

EGU23-14589 | ECS | Orals | HS4.6

Seasonal forecasts for Germany: Enhancing the predictive capability of global SEAS5 ensemble forecasts using bias correction 

Jan Niklas Weber, Christof Lorenz, Tanja Portele, and Harald Kunstmann

For an optimized use of water resources for irrigation or power generation, knowledge of their expected availability in the coming months is essential. This particular sub-seasonal to seasonal time horizon is covered by seasonal forecasting systems like SEAS5 from the European Centre for Medium-Range Weather Forecasts (ECMWF), which could provide crucial information for an improved and more timely water management. In this study, we evaluate the skill of precipitation and temperature forecasts from SEAS5 for Germany. The performance of forecasts without any post-processing or bias-correction remains below the climatology from the second lead month. To increase the performance, we apply a post-processing approach for Bias Correction and Spatial Disaggregation (BCSD) to a) increase the spatial resolution and b) reduce biases compared to our chosen reference ERA5-Land. By means of several quality parameters such as the Continuous Ranked Probability Skill Score (CRPSS) and the Brier Skill Score (BSS), it is shown that the corrected SEAS5 seasonal forecasts at monthly resolution deliver a significantly increased performance compared to purely climatological forecasts and raw SEAS5 forecasts, especially in the first forecast month. Special focus is put on climatic extremes, since especially here the seasonal forecasts have the potential to provide highly valuable information that are, by definition, absent, e.g., in climatological forecasts. This is clearly evident for compound events, which show increased predictability up to five months in advance. Months with normal conditions perform rather poorly, whereas abnormally warm or dry months are well forecasted up to and including the sixth lead month. Temperature variables perform particularly well, while precipitation forecasts show lower skill. Forecasts of the Standardized Precipitation Evapotranspiration Index (SPEI, a widely used indicator for droughts and, hence, limited water availability) show higher skill than pure precipitation forecasts. We further assess the performance of post-processed SEAS5 forecasts in terms of the Potential Economic Value (PEV), which allows for the quantification of economic savings due to forecast-based actions. Depending on a well-chosen cost-loss-ratio of particular actions, seasonal forecasts from SEAS5 show a promising skill for timely decision making in the water management and related sectors. In our presentation, we hence demonstrate the skill of post-processed seasonal forecasts from SEAS5 over Germany and provide a benchmark for other forecasting products and post-processing routines.

How to cite: Weber, J. N., Lorenz, C., Portele, T., and Kunstmann, H.: Seasonal forecasts for Germany: Enhancing the predictive capability of global SEAS5 ensemble forecasts using bias correction, EGU General Assembly 2023, Vienna, Austria, 23–28 Apr 2023, EGU23-14589, https://doi.org/10.5194/egusphere-egu23-14589, 2023.

EGU23-14943 | ECS | Orals | HS4.6

Global Budyko water balance assessment application as a diagnostic tool to improve seasonal forecasts 

Ehsan Modiri, Luis Samaniego, Robert Schweppe, Pallav Kumar Shrestha, Oldrich Rakovec, Matthias Kelbling, Alberto Martínez-de La Torre, Edwin Sutanudjaja, Eleanor Blyth, Niko Wanders, and Stephan Thober

A primary objective of hydrological modelling (HM) is to monitor the water balance in catchments and provide forecasts of key variables and fluxes (i.e., soil moisture and streamflow) at the seasonal scale. Within the Copernicus Climate Change Service, a global seasonal forecasting framework using four state-of-the-art HMs (i.e., HTESSEL, Jules, mHM and PCR-GLOBWB) is developed. The system is required to provide skillful forecasts to provide an added-value to society. In this study, we evaluate the skill of streamflow forecasts using established skill metrics such as Continuous Rank Probability Score and Brier Score.

As a first step, we evaluated the performance of the reference run of the four models that is based on ERA5-Land forcing. We employed more than 3100 river flow measurements obtained from the Global Runoff Data Centre (GRDC). These data allow us to classify basins according to aridity and evaporation indices and to evaluate their performance according to geographical regions. In a Budyko analysis, all models adhere to the expected theoretical functions that respect both the conservation of energy and water. However, applying the Budyko analysis to the observational records and reanalysis data only, some basins do not adhere to the energy limit by, for example, having more actual evaporation than potential evaporation. These findings suggest that water may have been transported across basins or that groundwater wells may have been overdrafted. For the development of the global forecasting system, an evaluation of model performance at these basins should be taken with care, and hydrologic models should not be calibrated here. By comparing the regional differentiated Budyko analysis and evaluating the skill metrics of the four HMs, we aim to discriminate among structural and forcing errors. Eventually, this analysis would allow improving the skills of the global seasonal forecasts system.

How to cite: Modiri, E., Samaniego, L., Schweppe, R., Shrestha, P. K., Rakovec, O., Kelbling, M., Martínez-de La Torre, A., Sutanudjaja, E., Blyth, E., Wanders, N., and Thober, S.: Global Budyko water balance assessment application as a diagnostic tool to improve seasonal forecasts, EGU General Assembly 2023, Vienna, Austria, 23–28 Apr 2023, EGU23-14943, https://doi.org/10.5194/egusphere-egu23-14943, 2023.

EGU23-15287 | Posters on site | HS4.6

Towards automated seasonal river discharge ensemble forecasts on a federated compute and data infrastructure 

Frederiek Sperna Weiland, Joost Buitink, Jaap Langemeijer, Raymond Oonk, and Bjorn Backeberg

The wealth of available global datasets at high spatial and temporal resolutions opens many opportunities for hydrological modelling and forecasting. It is now possible to provide high-resolution hydrological simulations for a river basin anywhere in the world, even in basins without in situ observations. Combined with the strength of global parameter estimations of the wflow_sbm concept (Imhoff et al, 2021), this allows us to build and run hydrological models without calibration. These models can ultimately be used to provide discharge forecasts for the seasonal time scale. Here we present a workflow that tests the interoperability, scalability, and performance of combining cloud and high-throughput compute and data resources. The workflow combines open source technologies, including containerization, to provide automated monthly river discharge forecasts for practically every basin on the globe on cloud, HTC and in the future HPC platforms. We leverage the global ERA5 and SEAS5 products from the Copernicus Climate Data store as input for the wflow hydrological model. The workflow automatically downloads the required input data for the model domain, resamples the data to the required model grids, and runs the simulations. The workflow is automatically triggered every month when new SEA5 forecasts become available. Prior to running the forecasts, the ERA5 files are used to update the hindcast model states in preparation for the forecast. Next, 50 wflow ensemble members, forced using the SEAS5 forecasts, are run in parallel to provide estimates on the probability of discharge events. The workflow is currently set up and running for the Rhine basin on SURF’s high-throughput computing platform, but can easily be deployed on different infrastructures and for different river basins. 

How to cite: Sperna Weiland, F., Buitink, J., Langemeijer, J., Oonk, R., and Backeberg, B.: Towards automated seasonal river discharge ensemble forecasts on a federated compute and data infrastructure, EGU General Assembly 2023, Vienna, Austria, 23–28 Apr 2023, EGU23-15287, https://doi.org/10.5194/egusphere-egu23-15287, 2023.

EGU23-16515 | ECS | Posters on site | HS4.6

ANALYSIS OF SUB SEASONAL STREAMFLOW FORECASTS FOR HPPs RESERVOIRS AT SOUTH AMERICA BASED ON ECMWF AND GEFS MODELS DATA 

Cassia Aver, Camila Freitas, Erik Quedi, Fernando Fan, Vinicius Siqueira, Walter Collischonn, Cleber Araujo, Ingrid Petry, and Reinaldo Silveira

The flow forecast is used in several sectors of society, bringing benefits in relation to the mitigation of possible impacts in flood events and it is information of great value for the economic sectors associated with agriculture and energy generation. In South America, climate and meteorological variability directly impact these economic sectors. In Brazil, for example, the production of electricity is predominantly hydroelectric generation, which currently represents about 63% of the installed power in the country, in addition to the complementarity between different hydrographic basins and the other sources that make up the Brazilian energy matrix.

The Brazilian electricity sector relies on flow forecasts for different time scales, which are used to optimize the available water resources and for the energy commercialization. The National Electric System Operator (ONS) is responsible for coordinating the operation of 153 Hydroelectric Power Plants (HPPs) and uses different hydrological models for flow forecasting. For the 14-day horizon (short term) it’s used the deterministic rain-flow model called SMAP. For the horizon of 15 to 45 days (sub seasonal) it’s used the PREVIVAZ, a univariate stochastic model.

This work presents the evaluation of the performance of the SMAP model for forecasting in a sub seasonal horizon for 6 reservoirs in the Iguaçu River basin, associated with HPPs with a total installed capacity of 7,024 MW, located in the southern region of Brazil. Streamflow forecasts were evaluated using the European Center for Medium-Range Weather Forecasts (ECMWF) sub seasonal forecast, with lead time up to 46 days, from the Subseasonal-to-Seasonal (S2S) project database, and using the Global Ensemble Forecast System (GEFS) sub seasonal forecast, with lead time up to 35 days, from the National Centers for Environmental Prediction (NCEP) of the National Oceanic and Atmospheric Administration (NOAA).

The results showed that the flow forecasts for the sub seasonal horizon present good performance for the initial forecast horizon, with degradation in the quality of the results after this horizon. There was also evidence of gain associated with forecasts for the ensemble over the entire horizon. The use of the SMAP model combined with precipitation forecasts in the sub seasonal horizon proved to be superior to the PREVIVAZ model, currently in use at the National Electric System Operator (ONS), with a significant improvement being observed, evidencing the usefulness of flow forecasts based on numerical models of precipitation prediction for the sub seasonal horizon.

Acknowledgments: This work presents part of the results obtained during the project granted by the Brazilian National Electricity Regulatory Agency (ANEEL) under its Research and Development Project PD 6491-0503/2018 – “Previsão Hidroclimática com Abrangência no Sistema Interligado Nacional de Energia Elétrica” developed by the Paraná State electric company (COPEL GeT), the Meteorological System of Paraná (SIMEPAR) and the RHAMA Consulting company. The Hydraulic Research Institute (IPH) from the Federal University of Rio Grande do Sul (UFRGS) contribute to part of the project through an agreement with the RHAMA company (IAP-001313).

How to cite: Aver, C., Freitas, C., Quedi, E., Fan, F., Siqueira, V., Collischonn, W., Araujo, C., Petry, I., and Silveira, R.: ANALYSIS OF SUB SEASONAL STREAMFLOW FORECASTS FOR HPPs RESERVOIRS AT SOUTH AMERICA BASED ON ECMWF AND GEFS MODELS DATA, EGU General Assembly 2023, Vienna, Austria, 23–28 Apr 2023, EGU23-16515, https://doi.org/10.5194/egusphere-egu23-16515, 2023.

EGU23-16559 | Posters on site | HS4.6

Short- to seasonal-range streamflow forecasting in reservoirs of the Brazilian National Interconnect Electric Power System 

Camila Freitas, Reinaldo Silveira, Ingrid Petry, Cassia Paranhos, Fernando Fan, Walter Collishonn, and Carlos Tucci

The Electric Energy Company of Parana (COPEL GeT), the Meteorological System of Parana (SIMEPAR) and RHAMA Consulting company are undertaking the research project PD-6491-0503/2018 for the development of a hydrometeorological seasonal forecasting for Brazilian reservoirs. The project, sponsored by the National Agency for Electric Energy (ANEEL) under its research and development programme, aims the forecasting of streamflow, at temporal scales ranging from 1 to 270 days which are integrated by the National Power System Operator (ONS) through its Interconnected System (SIN). The SIN is composed of more than 150 hydropower plants and reservoirs located over a wide range of climate and hydrological conditions. It is responsible for more than 50% of the total electricity produced in the country. In this work we describe the overall characteristics of this project, comprising its structure, main research results and its usefulness for assisting decision makers in the field of energy, as will be demonstrated through some application sceneries. We used the precipitation short-medium-range, sub-seasonal, and seasonal ECMWF forecasts as input to a continental-scale, hydrologic hydrodynamic model (MGB-SA) to produce streamflow forecasts for the SIN hydropower reservoirs. On the short-medium-range horizon we used persistency and the control member as benchmarks, while in the sub-seasonal and seasonal we used the ESP. On the short-medium-range and sub-seasonal, the ensemble average performance was superior to the control deterministic predictions for ECMWF (MGB-SA), both for the prediction quality metrics and for the event discrimination metrics. On the seasonal forecast, the ECMWF results were consistently superior to the benchmark on the first lead time month, decreasing performance with the horizon. The results of the project are expected to benefit energy generation planning, routine and emergency hydraulic operation (e.g., flood and droughts), as well as energy commercialization procedures in the country.

How to cite: Freitas, C., Silveira, R., Petry, I., Paranhos, C., Fan, F., Collishonn, W., and Tucci, C.: Short- to seasonal-range streamflow forecasting in reservoirs of the Brazilian National Interconnect Electric Power System, EGU General Assembly 2023, Vienna, Austria, 23–28 Apr 2023, EGU23-16559, https://doi.org/10.5194/egusphere-egu23-16559, 2023.

EGU23-17399 | ECS | Posters on site | HS4.6

Assessment of Future Climate Change Impacts on Water Resources of the Upper Kabul River Basin, Afghanistan Using SWAT 

Tooryalay Ayoubi, Christian Reinhardt-Imjela, and Achim Schulte

In this study, climate change impacts on future stream-flow dynamics and water availability are analyzed in the mid-century (2030-2049) and the end-century (2080-2099) using the output of regional climate models (RCMs) under two representation concentration pathways (RCPs 4.5 and 8.5) in the Upper Kabul River Basin (UKRB). A hydrological model was developed using the Soil and Water Assessment Tool (SWAT) from 2009-2019, calibrated from 2010-2016 and validated from 2017-2018. Results indicated, SWAT was capable of simulating the monthly stream-flow dynamics with "satisfactory" to "very good" accuracy. Temperature and precipitation data of four RCMs were bias-corrected using delta change method and were used in SWAT after validation. The future temperature increased in all seasons, the peak occurs earlier in June instead of July in both periods. Future precipitation decreases in spring, while increases in summer, autumn and winter. The precipitation changes are greatest in winter, with a shift of the annual peak from March to February. Changing precipitation in winter combined with increasing in temperature caused an earlier onset of snowmelt with a shift of the discharge peak from June to April/May. The basin’s future water balance is characterized by increasing surface runoff, evapotranspiration (ET), potential evapotranspiration (PET) and total water yield in 2040s and 2090s for both RCPs 4.5 and 8.5. In contrast snowfall and snowmelt are expected to decrease. The future runoff is projected to increase in spring, and decrease in summer (May- August). Thus, a decrease in dry season runoff and increase in wet season runoff is expected.

How to cite: Ayoubi, T., Reinhardt-Imjela, C., and Schulte, A.: Assessment of Future Climate Change Impacts on Water Resources of the Upper Kabul River Basin, Afghanistan Using SWAT, EGU General Assembly 2023, Vienna, Austria, 23–28 Apr 2023, EGU23-17399, https://doi.org/10.5194/egusphere-egu23-17399, 2023.

EGU23-84 | Posters virtual | HS4.7

Forensic Analysis of Urban Flood using Ensemble Hydrologic Modeling 

Xóchitl Peñaloza-Rueda, Juan Carlos Centeno-Álvarez, and Laurent G. Courty

In the night of 6 to 7 of September 2022, the Tula River in the municipality of Tula de Allende, Mexico, reached its highest level in living memory, flooding the city. More than 31000 peoples were affected and 17 patients at the local hospital died. The Tula river catchment upstream of the city is complex, with four dams, three natural tributaries, and being the outlet of the drainage system of the urban area of Mexico City. Most of those reaches have patchy, inexistent or unreliable hydrometric records, complicating the task of understanding the causes of the flooding.

To circumvent those issues related to hydrometric records, in this study we employ an ensemble hydrologic modeling to reproduce the event and shed light on the relative contribution of each tributary to the flood in Tula de Allende. The considered ensemble will comprise ensembles of the catchment parameters and hydrographs coming from the Valley of Mexico. The aim is to obtain an ensemble of hydrographs, from which those that are closest to observed data will be selected, followed by an uncertainty analysis. This methodology is expected to provide reliable hydrological results to be used as an input of a hydrodynamic model to further the analysis of the event.

How to cite: Peñaloza-Rueda, X., Centeno-Álvarez, J. C., and Courty, L. G.: Forensic Analysis of Urban Flood using Ensemble Hydrologic Modeling, EGU General Assembly 2023, Vienna, Austria, 23–28 Apr 2023, EGU23-84, https://doi.org/10.5194/egusphere-egu23-84, 2023.

EGU23-143 | ECS | Orals | HS4.7 | Highlight

Does the spatial variability of the rainfall events affect the efficacy of the hydrological models? 

Dasari Indhu and Vamsi Krishna Vema

The major socioeconomic issue affecting the nation's economy is flooding. The use of hydrologic models to predict floods has been the subject of numerous well-founded research, but little is still known about how spatial variability of rainfall affects the flood modeling. The purpose of this study is to comprehend, using the spatial variability index, how rainfall spatial variability affects flood characteristics and its importance in the selection of the hydrological models. The spatial variability index classifies the rainfall events into spatially homogenous (Class A) or spatially varying (Class B) by analyzing the spatial variability of rainfall and catchment properties. Further in this study, both lumped and distributed models have been set-up to understand whether the segregation of events prior to the flood modeling improves the model efficiency or not. Both the models were calibrated separately for the Class A and Class B events. The results shown that Class A events performed better in the lumped model with percentage error in peak flow (PEPF) of 18.45% and 20.32% in calibration and validation respectively. Whereas, the Class B events performance was better in the distributed model with PEPF of 11.5% and 15.85% in calibration and validation. These results were compared against the model calibrated using the traditional method, i.e. without segregating the events. The results show that performance of the lumped model is deteriorated. Similarly, distributed model performance was better when the class B events are separated instead of the combined events. Therefore, segregation of the rainfall events prior to the flood modeling helps in improving the model selection and its performance, which also reduces the assumptions in the model selection.

How to cite: Indhu, D. and Vema, V. K.: Does the spatial variability of the rainfall events affect the efficacy of the hydrological models?, EGU General Assembly 2023, Vienna, Austria, 23–28 Apr 2023, EGU23-143, https://doi.org/10.5194/egusphere-egu23-143, 2023.

EGU23-627 | ECS | Posters on site | HS4.7 | Highlight

Development of Rainfall Runoff model using MIKE NAM for the flood prone basin of India 

Ayushi Panchal and Sanjaykumar Yadav

Rainfall-runoff modelling is significantly carried out in order to evaluate the response of different combinations of hydrometeorological and physical characteristics of the basin. The hydrological models are developed for simulating the rainfall-runoff process. The hydrologic models are the conceptual, physical, experimental as well as artificial intelligence models. MIKE NAM model gives the conceptual rainfall-runoff model with the inputs such as rainfall, evaporation as well as the observed discharge. Various basin parameters such as interflow contribution, part of precipitation which contributes the runoff, overland flow, lower bound and upper bound limits of inflow and outflow hydrographs, interflow, baseflow, constant for time to route the base flow along with the thresholds for recharge and overland flow are being considered in MIKE NAM model. The provision to consider the parameters such as field capacity as well as wilting point is given in the NAM model. In the present study rainfall-runoff simulation has been carried out to evaluate the performance of MIKE NAM conceptual model. A sub-basin of Indian peninsular river Tapi has been chosen for carrying out the simulation. The daily data of rainfall, evaporation and river discharge for the period of 10 years has been given to the model in order to simulate the runoff. The model has been calibrated and validated by the observed data. The reliability of the developed model has been evaluated based on the statistical performance measures such as coefficient of correlation, root mean square error, Mean Absolute Error along with Nash Sutcliff Efficiency (NSE). Based on the performance of statistical parameters it can be concluded that MIKE 11 NAM model can be used effectively to simulate the runoff. The good agreement has been shown between simulated and observed river discharge and is proven to be enough accurate to predict the discharge. The threshold value of rainfall which results in to basin flooding has been computed from the present analysis for key rain gauges of the basin. The developed model can be used for forecasting future basin floods.

How to cite: Panchal, A. and Yadav, S.: Development of Rainfall Runoff model using MIKE NAM for the flood prone basin of India, EGU General Assembly 2023, Vienna, Austria, 23–28 Apr 2023, EGU23-627, https://doi.org/10.5194/egusphere-egu23-627, 2023.

EGU23-2261 | ECS | Orals | HS4.7

Determining near surface roughness based on artificial precipitation experiments on natural hillslopes for the application in hydrodynamic flash flood modelling 

David Feldmann, Patrick Laux, Andreas Heckl, Manfred Schindler, and Harald Kunstmann

Flash floods resulting from torrential precipitation events cause devastating destruction and loss of human lives, as numerous events in Central Europe have demonstrated in recent years. To assess the damage potential of such events, using hydrodynamic 2D-models is the most accurate method to simulate all hydraulic and hydrological processes at the earth's surface.

Beside infiltration, roughness is the key parameter for hydraulic surface runoff simulations. Particularly roughness for near surface runoff is affected by high uncertainties, as numerous available values are only valid for higher water depths. The choice of the roughness coefficient influences the flow velocity and therefore the accumulation of surface runoff. This potentially leads to an inaccurate planning of flood protection measures.

Based on artificial rainfall experiments on natural hillslopes, available in literature, we estimate the roughness coefficient (Manning’s n). The experiments have been conducted on a wide range of different sites, whose properties differ in vegetation type (pasture, crops, bare soil), vegetation density (0-100%) and slope (10-30%). A framework evaluating rainfall intensity and surface runoff with the aim to separate the impact of infiltration rate and roughness on the shape of the hydrograph is developed. This avoids complex measurements of flow velocity and water depth during the field experiments.

To verify the validity of the framework, three water depth-dependent formulations of roughness and a constant Manning coefficient are used to simulate the measured hydrograph with an idealized hydraulic 2D-model. This finally results in a robust parameterisation of near surface roughness for a water depth below 1 cm. A strong dependence of the roughness coefficient on the degree of vegetation cover and a correlation between rain intensity and roughness was found. In addition, the temporal change of the infiltration rate during the rainfall experiment could precisely be calculated through the determination of roughness. Therefore, the developed framework also allows a better calibration of infiltration models based on artificial rainfall experiments. In conclusion, this study reduces uncertainties in 2D-hydraulic flash flood modeling by providing empirical near surface roughness coefficients.

How to cite: Feldmann, D., Laux, P., Heckl, A., Schindler, M., and Kunstmann, H.: Determining near surface roughness based on artificial precipitation experiments on natural hillslopes for the application in hydrodynamic flash flood modelling, EGU General Assembly 2023, Vienna, Austria, 23–28 Apr 2023, EGU23-2261, https://doi.org/10.5194/egusphere-egu23-2261, 2023.

EGU23-2599 | Orals | HS4.7

Introducing a dynamic spatiotemporal rainfall generator for flood risk analysis 

Shahin Khosh Bin Ghomash, Daniel Bachmann, Daniel Caviedes-Voullième, and Christoph Hinz

Precipitation scenario analysis is a crucial step in flood risk assessment, in which storm events with different probabilities are defined and used as input for the hydrological/hydrodynamic calculations. Rainfall generators may serve as a basis for the precipitation analysis. With the increase in the use of high resolution spatially-explicit hydrological/hydrodynamic models in flood risk calculations, demand for synthetic gridded precipitation input is increasing. In this work, we present a dynamic spatiotemporal rainfall generator. The model is capable of generating catchment-scale rainfields containing moving storms, which enable physically-plausible and spatiotemporally coherent precipitation events. This is achieved by the tools event-based approach, where dynamic storms are identified as clusters of related data that occur at different locations in space and time, and are then used as basis for event regeneration. The implemented methodology, mainly inspired by Dierden et al. (2019), provides an improvement in the spatial coherence of precipitation extremes, which can in turn be beneficial in flood risk calculations.

The model has been validated under different databases such as the radar-based RADALON dataset or spatially-interpolated historical raingauge timeseries of different catchments in Germany, which is also presented in this work. The validation indicates the models ability to adequately preserve observed storm statistics in the generated timeseries. The generator is developed as an extension to the state-of-the-science flood risk modelling tool ProMaIDes (Promaides 2023). The model also puts great focus on user accessibility with offering features such as an easy installation process, support for most operating systems, a user interface and an online user manual.


Diederen, D., Liu, Y., 2020. Dynamic spatio-temporal generation of large-scale synthetic gridded precipitation: with improved spatial coherence of extremes. Stoch Environ Res Risk Assess 34, 1369–1383. https://doi.org/10.1007/s00477-019-01724-9

ProMaIDes (2023): Protection Measures against Inundation Decision support. https://promaides.h2.de

How to cite: Khosh Bin Ghomash, S., Bachmann, D., Caviedes-Voullième, D., and Hinz, C.: Introducing a dynamic spatiotemporal rainfall generator for flood risk analysis, EGU General Assembly 2023, Vienna, Austria, 23–28 Apr 2023, EGU23-2599, https://doi.org/10.5194/egusphere-egu23-2599, 2023.

EGU23-4322 | ECS | Posters virtual | HS4.7

Testing compound floods by a new oceanic-coastal model in Cuba: preliminary results. 

Daniela Córdova de Horta, Luis.F Córdova López, Antonio Jodar-Abellan, Andres Fullana, and Daniel Prats

Testing compound floods by a new oceanic-coastal model in Cuba: preliminary

results.

Daniela Cordova de Horta 1,2 , Luis. F Cordova Lopez 1 , Antonio Jodar-Abellan 2,3 , Andres

Fullana 2,4 , Daniel Prats 2,4

1 Technological University of La Habana, Cuba.
2 University Institute of Water and Environmental Sciences, University of Alicante, Alicante, Spain.
3 Spanish Research Council, Centro de Edafología y Biología Aplicada del Segura (CEBAS-CSIC), Soil
and Water Conservation Group, Murcia, Spain.
4 Department of Chemical Engineering, University of Alicante, 03690 Alicante, Spain.
Abstract:
Due to the climate change recognized in recent years, the danger on the coasts,
at a global scale, has increased critically. This issue is associated with the increase in the
global average temperature, which has the effect of raising the average sea level and the
increase in intensity and frequency of Extreme Meteorological Events (EME).
Currently, more than 50% of the world's population lives in coastal regions and a
significant part in coastal areas vulnerable to flooding as a result of the rise in the mean
sea level, rainfall and river flooding. The simultaneous occurrence or brief succession of
these hazards can cause flooding that generates impacts greater than those caused by
these events individually. In this study, a new technique of composite flood analysis is
proposed in numerous urban-coastal areas and basins of Cuba by coupling
hydrodynamic simulation tools. In particular, we present the results of the establishment
phase of the oceanic-coastal model called “Delft 3d Flow and Delft 3d Wave”, where
hurricanes Katrina, Isaac, Zeta and Ike were chosen. Likewise, the Era5 database was
used to generate the wind and pressure fields associated with hurricanes. In addition, the
results of a set of tests are presented to define the way of nesting and the best resolution
ratios of the computation meshes of the different domains. Finally, statistics parameters
were applied to support the selection of the best alternatives by comparing our model
results with the observations obtained by the National Oceanic and Atmospheric
Administration (NOAA) databases. From the author’s knowledge, the proposed
methodology can provide to planning policy makers very useful information in the face
of flood effects especially in a study area (Cuba) where flow registers from stream
gauge stations are considerably scarce.

How to cite: Córdova de Horta, D., Córdova López, L. F., Jodar-Abellan, A., Fullana, A., and Prats, D.: Testing compound floods by a new oceanic-coastal model in Cuba: preliminary results., EGU General Assembly 2023, Vienna, Austria, 23–28 Apr 2023, EGU23-4322, https://doi.org/10.5194/egusphere-egu23-4322, 2023.

EGU23-4426 | ECS | Posters on site | HS4.7

Process-Based Hydrologic and Hydraulic Modelling for Floods in Brahmaputra 

Walter Samuel, Venugopal Vuruputur, and Ramananda Chakrabarti

Floods are known to cause extensive damage to property and life, which makes it necessary to determine the plausible magnitude and frequency of these hydrologic extremes. In this study, we use a combined hydrologic and hydraulic modelling approach to study the flood characteristics of Brahmaputra - a large transboundary river (580,000 km2) associated with complex topography, geomorphology, and a dense network of tributaries. A semi-distributed process-based model HEC-HMS, (forced with different precipitation datasets, -(APHRODITE, GLDAS, IMD and TRMM) is used to simulate an ensemble of its historical streamflow at a daily timescale. These calibrated and validated flows are used in conjunction with a network of level gauge stations (within Arunachal Pradesh & Assam in India) to quantify and improve flood mapping with the help of a two-dimensional hydraulic model HEC-RAS. The historical flood extents (2015 to 2022) obtained using the hydrologic & hydraulic modelling approach is further validated with the help of satellite earth observation data products. Such a multi-pronged, ensemble-based modelling strategy has the potential to create a more informed flood risk management system, in terms of providing better likelihood and uncertainty estimates, in the lower reaches of Brahmaputra often prone to prolonged inundation.

How to cite: Samuel, W., Vuruputur, V., and Chakrabarti, R.: Process-Based Hydrologic and Hydraulic Modelling for Floods in Brahmaputra, EGU General Assembly 2023, Vienna, Austria, 23–28 Apr 2023, EGU23-4426, https://doi.org/10.5194/egusphere-egu23-4426, 2023.


Gergely Ámon1, and Katalin Bene2


1,2National Laboratory for Water Science and Water Security, Széchenyi István University, Department of Transport Infrastructure and Water Resources Engineering, Egyetem square 1., H-9026 Győr, Hungary


Flash floods and low-flow events often severely impact small, steep watersheds. Water resources engineers need to understand and prepare for these events. On small, steep-sloped watersheds, meteorological and watershed characteristics influence the behaviour of the overland flow. In this research, we applied different precipitation events in time and intensity

 on the watershed to determine the impact on outflow characteristics.

The Hidegvíz-valley watershed on the north-western side of Hungary, a well-measured and instrumented experimental watershed, was selected for surface flow modelling. A 2D hydrodynamical model was developed and calibrated on a measured rainfall-runoff time series. Two measured rainfall events and triangular design rainfalls with different return periods were applied to the calibrated model to determine the impact on surface runoff attributes. Peak outflow, runoff ratio and runoff volume were selected to describe outflow characteristics. The results show that the peak flow at one rainfall event is much greater than at the other rainfall events. The volume of a rainfall event increases for longer-duration events. After certain rainfall events, the runoff ratio and runoff volume did not change much.

The research will help to better understand runoff processes due to different rainfall events and durations and help to improve the design approach for flood and drought protection.

Keywords: numerical modelling, hydrodynamics, overland flow, watershed model


The research is carried out within the framework of the Széchenyi Plan Plus program with the support of the RRF 2.3.1 21 2022. 00008 project. 

How to cite: Ámon, G. and Bene, K.: Impact of different rainfall events on overland flow using a 2D hydrodynamical model on a steep-sloped watershed, EGU General Assembly 2023, Vienna, Austria, 23–28 Apr 2023, EGU23-9179, https://doi.org/10.5194/egusphere-egu23-9179, 2023.

EGU23-10551 | ECS | Posters virtual | HS4.7

A Computationally Efficient Flood Evacuation Planning Tool to Assess the Impacts of Flooding on Transportation Networks. 

Rishav Karanjit, Vidya Samadi, Pamela Murray-Tuite, Amanda Hughes, and Keri Stephens

Floods are a serious natural hazard that may disrupt essential infrastructure, towns, and communities worldwide. As a result, hundreds of lives are lost every year, and floods cause massive economic damage to critical infrastructure (CI). Preparing in advance for possible evacuations can drastically reduce the likelihood of potential deaths and damage to the environment and CIs. However, the absence of a reliable cyber system to define evacuation routes creates considerable delays in the process of evacuation, which in turn slows down disaster preparation and response efforts. Recent advancements in data-driven and machine-learning approaches have given faster and more inventive ways to forecast flooding events, which serve as the primary causes and processes for a large number of issues associated with flood prediction. The purpose of this research is to devise a one-of-a-kind, computationally efficient surrogate model for defining evacuation routes in Low Country, South Carolina, USA. The tool incorporates the distinctive characteristics of machine learning (ML) modeling, transportation geospatial data, and hydraulics and drainage qualities to assess evacuation routes. The system was expertly designed to estimate flood stage levels using ML across USGS gaging stations, combine the findings with the results of Manning's equation, and traffic data, and then integrate all this information into a remote web application. The architecture of the tool is made up of several interchangeable components, such as modules for ML modeling, performance assessment, inundation mapping, and online visualization. The efficacy of  the Flood Evacuation Planning Tool, with a simple conceptual inundation model and a dynamic user interface, is shown by thorough testing and processing measurements. Enhancements to the system that are now being implemented and those that will be implemented in the near future include expanding coverage to areas that are more prone to flooding and boosting the capabilities and accuracy of the tool will be discussed.

How to cite: Karanjit, R., Samadi, V., Murray-Tuite, P., Hughes, A., and Stephens, K.: A Computationally Efficient Flood Evacuation Planning Tool to Assess the Impacts of Flooding on Transportation Networks., EGU General Assembly 2023, Vienna, Austria, 23–28 Apr 2023, EGU23-10551, https://doi.org/10.5194/egusphere-egu23-10551, 2023.

EGU23-13267 | ECS | Orals | HS4.7

Applying single- and multi-site weather generators for the estimation of extreme floods in the Austrian Alps 

Caroline Ehrendorfer and Mathew Herrnegger

The length and quality of observed discharge data is frequently insufficient to derive robust extreme discharge values, which are crucial for water management planning for the present and future climates. Using long timeseries of synthetic weather data generated by stochastic weather generators (SWGs) as input to rainfall-runoff models to derive extreme discharge peaks could be of value for basins with missing or short observation timeseries. While multi-site generators preserve spatial correlation between stations, their complexity also limits them in other ways, such as implementing only simple parametric distributions that don’t adequately represent tails of distributions and extreme events. Single-site generators offer more complex parametric distributions, but don’t preserve correlation between stations, making them unsuitable for distributed hydrological modeling. In the context of hydrological modeling with emphasis on extremes, the question arises if the lumped output of a multi-site generator outperforms a single-site generator in combination with a lumped hydrological model, or if the advantages of a heavy-tailed distribution can outweigh the averaging across a heterogenous catchment. This work examines the transfer of synthetic weather data into runoff extremes in the alpine watershed of the Austrian Ybbs River by driving the rainfall runoff model COSERO with meteorological timeseries from the single- and multi-site SWGs WeaGETS and MulGETS. A GEV distribution was fit to each timeseries of annual runoff maxima to derive events with return periods of 30, 100 and 300 years. The single-site generators and their superior parametric distribution functions did not outweigh the averaging effect, and hydrological simulations were greatly biased, significantly underestimating flood peaks. However, also the results of the flood frequency analysis using multi-site synthetic data underestimated the results using observed data for all return periods by at least 30 %. The findings show that the application of single- and multi-site SWGs to estimate runoff extremes may not be applicable and must be critically reviewed.

How to cite: Ehrendorfer, C. and Herrnegger, M.: Applying single- and multi-site weather generators for the estimation of extreme floods in the Austrian Alps, EGU General Assembly 2023, Vienna, Austria, 23–28 Apr 2023, EGU23-13267, https://doi.org/10.5194/egusphere-egu23-13267, 2023.

EGU23-13817 | Posters on site | HS4.7 | Highlight

Development of a coastal inundation compound modelling framework 

Italo dos Reis Lopes, Lorenzo Mentaschi, Nadia Pinardi, Michalis Vousdoukas, Luisa Perini, and Arcangelo Piscitelli

Environmental hazards represent a major socio-economic challenge where floods events are the most impactful in terms of global population affected (UNDRR, 2020). Coastal areas are exposed to multiple met-ocean extreme events which can occur separately or combined. Storm surges associated with wind waves, heavy rainfall and tides can lead to catastrophic inundation events associated with breakdown of structures, food and water insecurities and loss of lives. Additionally, climate changes are associated with two coastal risk factors: a) an increase of extreme events (Schiermeier, 2011; Vitousek et al., 2017) and b) an increase of sea level rise (IPCC, 2018).

Different approaches exist to flood modelling (Vousdoukas et al.,2016; Dottori, Martina and Figueiredo, 2018), varying by complexity and accuracy. Simple hydrological models, which operate by integrating the 2D shallow water equation in a flood-plain, offer a good trade-off between computational demand and good skills in simulating real coastal flood events (Smith, Bates and Hayes, 2012). Since accurate inundation modelling is of great importance for risk prevention and management of coastal areas, a system that can be reallocated and calibrated for different regions is a forefront of the research topic.

As a first case study, the flood event of February 2015 in Emilia-Romagna Region (Italy) was selected. The event was characterized by a combination of heavy rain, waves and tides which leads to one of the highest water levels ever recorded in the area (Perini et al., 2015). The model was run with different Digital Elevation Models and forced with water levels provided by Istituto Superiore per la Protezione e la Ricerca Ambientale (ISPRA) station. The results were compared with observational data of inundation maps.  A broad agreement was found between inundation maps produced by the model and observational data, though with significant local discrepancies. The main differences between model and observations can be ascribed mainly to DEM’s local uncertainty. Work is in progress to include the different types of forcings and to elaborate machine-learning based protocols of calibration to locally improve the model skill, by a) optimizing the mean elevation of the DEM using the modelled and observed flooded areas and b) best-fitting Manning coefficients over the DEM using land use data.

How to cite: dos Reis Lopes, I., Mentaschi, L., Pinardi, N., Vousdoukas, M., Perini, L., and Piscitelli, A.: Development of a coastal inundation compound modelling framework, EGU General Assembly 2023, Vienna, Austria, 23–28 Apr 2023, EGU23-13817, https://doi.org/10.5194/egusphere-egu23-13817, 2023.

EGU23-14250 | ECS | Orals | HS4.7 | Highlight

A process-based flood frequency analysis using a weather generator and distributed hydrological modelling in a Spanish Mediterranean catchment: the Segura River basin 

Carles Beneyto, Sergio Salazar-Galan, José Ángel Aranda, Rafael García-Bartual, Eduardo Albentosa-Hernández, and Félix Francés

In the context of a Flood Risk Management Plan (FRMP), flood frequency analysis is of paramount importance to obtain high return period flood quantiles. However, these estimations still present high uncertainty as a result of the short temporal length of the maximum available flow records; the data recording errors (principally on large floods); the high variance and asymmetry of the maximum flows; the hypothesis considered to evaluate the initial soil moisture conditions and the spatio-temporal variability of storms; the extended use of the iso-frequency hypothesis, among others. One of the prominent approaches to deal with these issues is the use of process-based flood frequency analysis. This way the main hydrological processes are considered at the same time that better information on extreme rainfall and historical floods can be incorporated. In this article, a weather generator (GWEX) and a distributed hydrological model (TETIS) are integrated in a cascade modelling approach, expanding the information to support the frequency analysis in a case study: the Segura River basin (Murcia, Spain) with 14,000 km2. Specifically, the methodology consists of the following steps: a) a regional study of annual maximum daily rainfall; b) Calibration of the WG on a daily scale and generation of a long daily precipitation series (5,000 years); c) Extreme storm selection (698) and temporal disaggregation into sub-daily scale (hourly); d) calibration and validation of hydrological model and simulation of selected synthetic storms with the hourly temporal resolution and a spatial resolution of 200 m; e) flood frequency estimation considering synthetic annual maximum instantaneous floods.

Finally, the methodology was validated with six historical catastrophic flood events since 1825. According to the results, the last major flood in September 2019 in the “Rambla de Abanilla” (one of the main tributaries to the flood prone area via flash flood processes) would correspond with an event with a low probability of flooding (around a 400-year return period). But the rainfall event generating it has an assigned return period ranging from 10 to 1000 years, depending on the geographical point or rain gauge considered in the Abanilla sub-catchment. This result shows that the classical approach of iso-frequency is not feasible to use in this kind of catchments. Using this methodology, it was possible to estimate the effect of the introduction of flood risk mitigation measures via scenario modelling. In this same tributary, the proposed reforestation in the FRMP will reduce the high frequency quantiles in a 10% and the structural measures a 65% the 100-year quantile. Finally, based on the results obtained, it is possible to move towards an analysis of the efficiency of the measures and to support scientifically sound decision making.

How to cite: Beneyto, C., Salazar-Galan, S., Aranda, J. Á., García-Bartual, R., Albentosa-Hernández, E., and Francés, F.: A process-based flood frequency analysis using a weather generator and distributed hydrological modelling in a Spanish Mediterranean catchment: the Segura River basin, EGU General Assembly 2023, Vienna, Austria, 23–28 Apr 2023, EGU23-14250, https://doi.org/10.5194/egusphere-egu23-14250, 2023.

The engineering design of hydraulic infrastructures in either urban or rural environments requires flow hydrograph scenarios to be tested in numerical models. Whilst peak flow discharge is calculated according to a return period analysis of historical data,  the definition of the corresponding hydrograph duration and shape is not unique. The first one is typically considered either equal to the concentration time of the catchment or dependent on rainfall event intensity and duration. The shape of the hydrograph is then defined as a rectangle (e.g., constant flow discharge) or other simple shapes (e.g., triangle) according to empirical rules. In this work, we propose the definition of an average hydrograph shape based on the stochastic analysis of the Compound Poisson Process, which is usually considered as a proxy model for hydrological data in several applications. Once the peak flow discharge value is derived by means of the Peak Over Threshold analysis and a baseflow value is set, we calculate the duration of both the raising and the falling limbs of the hydrograph based on the concept of mean first passage time across thresholds for non-Markovian processes. As this technique considers the ensemble of the infinite possible stochastic trajectories reaching the threshold, it then returns a more comprehensive description of the possible mean shape of the hydrograph. Such a shape can also be approximated by using relationships already available in the literature (e.g., the Yevdjevich function). In definitive, the proposed approach provides more reliable results when the hydraulic processes being modelled (e.g., flow erosion) require that not only the peak but also the shape and the hydrograph duration are important for verification and design purposes.

How to cite: Calvani, G. and Perona, P.: Stochastic description of mean flow hydrograph shape for flood modeling and river engineering design purposes, EGU General Assembly 2023, Vienna, Austria, 23–28 Apr 2023, EGU23-14306, https://doi.org/10.5194/egusphere-egu23-14306, 2023.

EGU23-14957 | Orals | HS4.7

The impacts of climate change on the flood risk for Cork city: A case study 

Bidroha Basu and Michael O Sullivan Greene

Cork city is considered to be in a vulnerable region to flooding and is expected to face significant economic and social damage due to the effects of climate change in the upcoming future. An increasing trend in the precipitation and temperature coupled with a rise in severity and frequency of storm events leads to a higher frequency of expected flooding for Cork city in the upcoming decades. More floods and severe heatwaves during the summer months will hugely impact Cork’s large agricultural sector and property in the urban, suburban and rural areas surrounding the city. In 2009, Cork city experienced a severe flood event that devastated property resulting in €90 million worth of damages only to the city centre.

This study focuses on the identification of the most vulnerable regions in Cork city based on the historically observed flood-related data. Furthermore, the changes in flood vulnerability and risk for the city in the future corresponding to different climate change scenarios have been explored. Three regional climate models (RCMs) and two Representative Concentration Pathways (RCPs) has been considered to obtain future projected meteorological variables, which were used to simulate future projected streamflow using Soil Water Assessment Tool (SWAT) model for each RCM and RCP. The daily simulated streamflow in the future was used to first extract the annual maximum flow, and then to obtain flood quantiles corresponding to different return periods using generalized extreme value distribution. The flood quantiles were then fed into the HEC-RAS model to generate flood inundation maps for Cork city. Comparison of flood inundation maps for a chosen return period for the historical and future period corresponding to different climate change scenarios revealed that the flood depth and flood extend is expected to increase in the future for the majority of the climate change scenarios.

A detailed risk assessment based on those developed flood inundation maps were then performed will then be performed for Cork to identify the most vulnerable areas. Subsequently, the social and economic impact of flooding has been quantified in this study. It has been noted that due to climate change, the expected damage from future flood events will ellipse the damage seen in the 2009 flood at Cork city.

How to cite: Basu, B. and O Sullivan Greene, M.: The impacts of climate change on the flood risk for Cork city: A case study, EGU General Assembly 2023, Vienna, Austria, 23–28 Apr 2023, EGU23-14957, https://doi.org/10.5194/egusphere-egu23-14957, 2023.

EGU23-15296 | ECS | Orals | HS4.7

Evaluation of the performance of the 1-arc min hydrological model LISFLOOD in German catchments 

Edgar Fabian Espitia Sarmiento, Fatemeh Heidari, Qing Lin, and Elena Xoplaki

Floods represent one of the most frequent natural hazards in the world and have a high impact on society. In central Europe and countries like Germany, flooding severity has increased in the last 10 years with devastating effects in well-being and high economic loses. Currently, the European Flood Awareness System (EFAS) is preparing a major release of the system at a spatial scale of 1 arc min. EFAS uses a specific number of hydrological stations for calibration, nevertheless, the availability of information at a higher resolution allows for a further update of the current system, over specific areas and catchments. The objective of this study is to evaluate the performance of the fully distributed rainfall-runoff model by calibrating and testing LISFLOOD for flood forecasting in Germany at 1 arc min with daily resolution. For this study we selected all major rivers and catchments that flow through Germany, choosing a period of analysis from 1990 to 2020. The meteorological forcing entails precipitation, temperature, solar radiation, and vapor pressure, from the high-resolution multi-variable gridded meteorological data set for Europe, EMO-1arcmin (Thiemig et al., 2022; http://data.europa.eu/89h/0bd84be4-cec8-4180-97a6-8b3adaac4d26). The discharge data were collected from the transnational flood portal for all states in Germany and the neighboring countries. The maps, the static maps that characterize the land use, land cover and human activity on the surface, soil and groundwater characteristics of the study area are kindly provided by EFAS. The calibration was conducted using the non-dominated sorting genetic algorithm-II (NSGA-II) in a top-down approach where the Kling–Gupta efficiency criteria (KGE) acted as the objective function for evaluating the model performance. The results show that the calibrated LISFLOOD model could be use in flood scenarios with reduced performance along the coastal areas.

Reference

Thiemig, Vera; Ramos Gomes, Gonçalo Nuno; Skøien, Jon Olav; Ziese, Markus; Rauthe-Schöch, Armin; Rustemeier, Elke; Rehfeldt, Kira; Walawender, Jakub; Kolbe, Christine; Pichon, Damien; Schweim, Christoph; Salamon, Peter (2022). EMO-1arcmin: A high-resolution multi-variable gridded meteorological data set for Europe (1990-2021). [Data set]. European Commission, Joint Research Centre (JRC). https://doi.org/10.2905/0BD84BE4-CEC8-4180-97A6-8B3ADAAC4D26

How to cite: Espitia Sarmiento, E. F., Heidari, F., Lin, Q., and Xoplaki, E.: Evaluation of the performance of the 1-arc min hydrological model LISFLOOD in German catchments, EGU General Assembly 2023, Vienna, Austria, 23–28 Apr 2023, EGU23-15296, https://doi.org/10.5194/egusphere-egu23-15296, 2023.

EGU23-15596 | Orals | HS4.7 | Highlight

Semi-probabilistic flood risk analysis including climate change uncertainties 

Fernando Pereira, Jiri Nossent, Gert Leyssen, Els Van Uytven, Joris Blanckaert, Roeland Adams, and Tim Franken

Flood risk analysis is of the utmost importance for policy makers and water managers as an input for the design and management of water bodies. In order to assess the frequency and severity of potential extreme floods, both data analysis and modelling, or even a combined approach can be employed. However, the spatial and temporal context of flood events is often complex, in particular when the extreme water levels can be caused by a combination of extreme upstream discharges, extreme downstream water levels and/or extreme wind events, and given the additional impact of climate change. This complexity hampers a straightforward analysis and extrapolation of rare flood events. We therefore present a semi-probabilistic flood risk analysis, that combines an ensemble approach, using different hydrological models and various climate scenarios, with a methodology that describes the extreme domain of the different flood drivers by a nested Copula. The latter Copula is based on the individual univariate extreme value distributions of each of the drivers. Synthetic design conditions for different return periods can be generated by a stratification of the obtained probability domain for extreme events. An application for the catchment of the River Scheldt in Belgium will be used to illustrate the presented approach for flood risk analysis, including an ensemble of 3 hydrological models, multiple climate scenarios for different time horizons and different projections of sea level rise.

How to cite: Pereira, F., Nossent, J., Leyssen, G., Van Uytven, E., Blanckaert, J., Adams, R., and Franken, T.: Semi-probabilistic flood risk analysis including climate change uncertainties, EGU General Assembly 2023, Vienna, Austria, 23–28 Apr 2023, EGU23-15596, https://doi.org/10.5194/egusphere-egu23-15596, 2023.

EGU23-15619 | ECS | Orals | HS4.7

Hydrological modelling of July 2021 floods in Vesdre and Amblève catchments 

Christophe Dessers, Pierre Archambeau, Benjamin Dewals, Sébastien Erpicum, and Michel Pirotton

Extreme events as the ones which occurred in July 2021 mostly in Belgium, Germany and the south of the Netherlands are causing important human and material losses. This event broke many records in a meteorological point of view as well as in the behaviour of the rivers, hence it urges several procedures of water and flood management to be revisited or better understood. However, hydrological modelling of such phenomena is challenging as it should cope with historical rain and discharge flow intensities never recorded before in the region but also deal with human construction and behaviour such as dams. Furthermore, most of the measurement devices in the Vesdre river were swept away or damaged during this flood engendering a paucity of reliable data for this catchment.

This presentation will focus on the hydrological simulation and a model comparison in the Vesdre and Amblève catchments in Belgium during the episode of July 2021. Both neighbour catchments were among the most damaged and displays anthropogenic characteristics. The former lacks accurate data along the watercourse but chronicles of the water depths and the manoeuvres of the sluice gates in the dams are exploitable to reconstruct the inputs and outputs. While the latter contains a rich database of flow measurements during that period and spatially well distributed to capture all main tributaries in the Amblève.

The Amblève river was favoured to perform a calibration of the models and analysis of the evolution of the flow properties along its stream. With this aim in mind, the modular structure of the hydrology package in the WOLF software, developed by the HECE team at the University of Liège, was employed to carry out distributed event hydrology simulations. Semi-distributed optimisations were performed, considering the functioning of the dams. The impact of an increasing complexity of the models and a comparison with celebrated models such as GR4H and VHM was investigated, as well as the effect of the source of rain data and their quality on the results.

This study emphasised that, for all models, most of the flow in the surface drained by the dams in the Vesdre was mainly caused by runoff/overland flows. This effect was observed in some subbasins in the Amblève displaying the same types of land uses, but also in more urban areas. Nonetheless, head catchments in the Ambève were mostly composed of groundwater flow. Moreover, it shows the importance of accurately distributed rain and confirms the local character of the phenomenon and its effect on the hydrological properties evolution

How to cite: Dessers, C., Archambeau, P., Dewals, B., Erpicum, S., and Pirotton, M.: Hydrological modelling of July 2021 floods in Vesdre and Amblève catchments, EGU General Assembly 2023, Vienna, Austria, 23–28 Apr 2023, EGU23-15619, https://doi.org/10.5194/egusphere-egu23-15619, 2023.

The prediction, warning, and impact of heavy precipitation events are highly dependent on the available data basis and regional factors. Especially in small catchments, explicit warning is often hampered by the lack of runoff data. The effects of urban flash floods triggered by heavy rain events can also be difficult to predict in catchments of small streams. This greatly increases the risk of unexpected damage in these areas. Prediction systems for small catchments (up to about 200 km²), so far mostly rely only on precipitation forecasting and simple soil water balancing. With this research, a methodology improved by artificial intelligence for the prediction of flood events in small catchments is presented.

The CatRaRe catalog with heavy rainfall events of the last 20 years from the German Weather Service is used as a basis for the investigations of heavy rainfall events in small catchments. However, stationary area parameters and runoff data of streams within the catchment are further missing for a precise area-based prediction. The latter were modeled by a recurrent neural network (RNN) in the form of runoff ratio values. Thus, with additional consideration of the CatRaRe catalog, a step prediction system of selected, small catchments in North Rhine-Westphalia (NRW) is created.

Based on the Digital Elevation Model of NRW (DEM 50), catchment areas are determined and assigned to the events of the CatRaRe catalog. For each selected catchment, the maximum discharge values of a gauging station, within a catchment and given time window after the precipitation event, are investigated. As an additional factor, the ratio between the maximum discharge as well as the mean discharge after a corresponding precipitation event is determined. In catchments without a gauging station and therefore without a runoff time series, an RNN is used to fill data gaps. Recurrent networks using the LSTM (long term short memory) method have already been successfully used to simulate time series, since LSTM networks can model temporal and spatial variability well1,2.

Further input variables for the RNN are the primary soil type and the size and topography of the respective catchment. Additional information about the pre-rainfall index and the magnitude of individual events is also incorporated as differently (area-dependent) weighted measures. Thus, in the case of a precipitation event, it can be calculated whether critical runoff values or runoff ratio values were observed during similarly intense events in the past. This information is regionalized by means of the RNN and can be transferred to non-gauged catchments.

As the data basis grows, events that have already occurred - in particular the July 2021 event - will be evaluated accordingly in further analyses and the sensitivity of the respective influencing variables for the forecast will be adjusted.


1Kratzert, F., Klotz, D., Brenner, C., Schulz, K., and Herrnegger, M.: Rainfall–runoff modelling using Long Short-Term Memory (LSTM) networks, Hydrol. Earth Syst. Sci., 22, 6005–6022, https://doi.org/10.5194/hess-22-6005-2018, 2018

2Hu, C.; Wu, Q.; Li, H.; Jian, S.; Li, N.; Lou, Z. Deep Learning with a Long Short-Term Memory Networks Approach for Rainfall-Runoff Simulation. Water 2018, 10, 1543, https://doi.org/10.3390/w10111543

How to cite: Hotzel, A. and Mudersbach, C.: Improved event-based flood warning system for small catchments using artificial intelligence and the CatRaRe catalog, EGU General Assembly 2023, Vienna, Austria, 23–28 Apr 2023, EGU23-1231, https://doi.org/10.5194/egusphere-egu23-1231, 2023.

EGU23-3611 | ECS | Orals | HS4.8

Fastflood.org, an open-source super-fast flood model in the browser 

Bastian van den Bout, Victor Jetten, Cees van Westen, and Luigi Lombardo

Flood modelling, particularly for urban contexts, often suffers from the long computation time and detailed data requirements. Real-time forecasting requires fast, data-efficient tools. A recent break-through in rapid flood simulation has allowed us to develop www.fastflood.org, an open-source platform for near-instant fully spatial flood prediction. It uses the fast sweeping method for elevation model correction, flow accumulation, and estimation of steady-state discharge. Afterwards, a compensated partial steady state is estimated through catchment characteristics and a flood depth field is iteratively back-calculated. We will show that our method, in various real-world tests, achieves over 97% accuracy compared to traditional models in flood extent modelling, while obtaining a speed increase of over 1500 times. Together with recently published global datasets on elevation and land cover, the web-based tool allows for rapid setup and simulation of flood scenarios. Due to the speed of the method, editing of risk-reducing measures (reservoirs, barriers, channel alterations) can be carried out with direct feedback on the consequences for small to medium sized areas. Testing on flash and fluvial flood events show very good promise for early warning methods by linking the flood simulation technique with weather forecasts in real-time. Finally, by employing recent IT technologies such as web-assembly, the model can run completely on the user’s machine, allowing for a sustainable, free model.


How to cite: van den Bout, B., Jetten, V., van Westen, C., and Lombardo, L.: Fastflood.org, an open-source super-fast flood model in the browser, EGU General Assembly 2023, Vienna, Austria, 23–28 Apr 2023, EGU23-3611, https://doi.org/10.5194/egusphere-egu23-3611, 2023.

EGU23-4143 | ECS | Posters virtual | HS4.8

Application of Innovative Digital Technologies in Urban Flood Risk Management 

Vahid Bakhtiari, Farzad Piadeh, and Kourosh Behzadian

Climate change can lead to several devastating hazards, including extreme rainfall and alteration of precipitation patterns that both contribute to more urban floods and various repercussions on urban life and infrastructure [1]. The establishment of risk management strategies along with engaging involved parties, i.e., authorities and publics, has become an integral part of mitigating strategies for growing urban flood risk [2]. These control measures have undergone several principal transformations in recent years particularly due to development of the real-time early warning of flood forecasting systems associated with digital innovative technologies such as virtual reality (VR), augmented reality (AR), and digital twin (DT). These technologies have been widely used for not only virtually real-time representation of formation and development of urban flooding but also raising stakeholder knowledge and awareness regarding the consequences of flood risk [3,4].

In this research work, the application of digital innovative technologies in the digital visualisation of urban floods and increasing stakeholder awareness has been investigated. To begin with, VR has been widely used to model pluvial floods by creating a simulated artificial 3D environment that allows users to explore and interact with virtual surroundings. AR has been implemented through the development of mobile apps that enables the user to investigate the possibility of a flood. DT commencing an efficient flood risk communication tool to provide the user with information about the current condition, potential risks, and flood-prone areas that are integrated into the complex real-time digital system made up of numerous sensors, logic devices, and predictive functions in urban areas.

The results of investigation show while conventional technologies have often concentrated on authorities, the above innovative technologies have shifted their focus to local authorities and public. VR has been comprehensively employed to engage them in risk control management through allowing the users to interact with the system under risks. AR is mainly utilised to serve the public through installed software on their phones and investigating flood-prone areas. The focus of DT has been on involving authorities and operators to understand the real-time information about flood hydraulics and function of urban system and components. Despite the extensive capabilities, DT has yet to be properly taken into account and, if properly presented, can be effective in raising public awareness especially because of its significant abilities in the virtual representation of interactions within the system.

References

[1] Piadeh, F., Behzadian, K., Alani, A. (2022). A critical review of real-time modelling of flood forecasting in urban drainage systems. Journal of Hydrology, 607, 127476.

[2] Piadeh, F., Ahmadi, M., Behzadian, K. (2022). A novel framework for planning policy and responsible stakeholders in industrial wastewater reuse projects: a case study in Iran. Water Policy, 24(9), pp. 1541-1558.

[3] Haynes, P., Hehl-Lange, S., Lange, E. (2018). Mobile augmented reality for flood visualisation. Environmental Modelling and Software, 109, pp. 380-389.

[4] Pedersen, A., Borup, M., Brink-Kjær, A., Christiansen, L., Mikkelsen, P. (2021). Living and prototyping digital twins for urban water systems: towards multi-purpose value creation using models and sensors. Water, 13(5), 592.

How to cite: Bakhtiari, V., Piadeh, F., and Behzadian, K.: Application of Innovative Digital Technologies in Urban Flood Risk Management, EGU General Assembly 2023, Vienna, Austria, 23–28 Apr 2023, EGU23-4143, https://doi.org/10.5194/egusphere-egu23-4143, 2023.

EGU23-4183 | ECS | Posters virtual | HS4.8

Time-series Boosting in Ensemble Modelling of Real-Time Flood Forecasting Application 

Farshad Piadeh, Farzad Piadeh, and Kourosh Behzadian

While concept of boosting ensemble data mining techniques has been recently attracted a lot of attention for flood forecasting, mainly on non-urbanised river basins or reservoirs [1,2], time-series boosting, i.e., contribution of last timestep prediction to the next forecasting model is a new era, especially for real-time operation of flood forecasting models in the shape of early warning systems.

This study aims to provide time-series boosting for ensemble flood forecasting model through adding forecasted water level of one timestep before as an input of training base models to previous proposed rainfall feature, especially rainfall duration, intensity, evidence of past rainfall and season occurrence [3]. Several weak learner data mining techniques are developed for various forecast lead times and recorded in data cube structure that can be used for developing time-series boosted ensemble model. This novel model was tested for real case study of Hanwell urban drainage systems located in the west London, UK for a period of 20 years data with 15min intervals. Confusion matrix is employed for performance assessment and the model is compared by conventional benchmark gradient boosted models.

Results shows the added feature can significantly increase the accuracy of overflow detection of all developed base models, especially for longer timesteps. More specifically, adding the new feature to the model can increase the accuracy rate from 84% for the best developed base model to 93% in 3hrs-ahead predictions. More importantly, the model can decrease underestimation miss rate from 45% to only 21% for the same forecast lead time. Furthermore, new time-series boosted ensemble model can noticeably increase overflow detection rate, where hit rate increase from 78% to 88% in 3hrs-ahead predictions. Overall, the concept of time-series boosted ensemble modelling can overcome the problem of missing and false alarm of real-time operation by adding the previous situation of catchment to the forecasting procedure.

References

[1] Jarajapu, D., Rathinasamy, M., Agarwal, A., Bronstert, A. (2022). Design flood estimation using extreme Gradient Boosting-based on Bayesian optimization, Journal of Hydrology, 613(A), 128341.

[2] Piadeh, F., Behzadian, K., Alani, A. (2022). A critical review of real-time modelling of flood forecasting in urban drainage systems. Journal of Hydrology, 607, 127476.

[3] Piadeh, F., Behzadian, K., Alani, A.M. (2022). Multi-Step Flood Forecasting in Urban Drainage Systems Using Time-series Data Mining Techniques. Water Efficiency Conference, West Indies, Trinidad and Tobago. repository.uwl.ac.uk/id/eprint/9690 [Accessed 31/12/2022].

How to cite: Piadeh, F., Piadeh, F., and Behzadian, K.: Time-series Boosting in Ensemble Modelling of Real-Time Flood Forecasting Application, EGU General Assembly 2023, Vienna, Austria, 23–28 Apr 2023, EGU23-4183, https://doi.org/10.5194/egusphere-egu23-4183, 2023.

EGU23-4251 | ECS | Orals | HS4.8

PSO-SVR Rainfall Forecast-Assisted Real-time Optimal Operation of Urban Drainage Systems 

Fatemeh rezaie Adaryani, S. Jamshid Mousavi, and Fatemeh Jafari

One of the most effective parameters in hydrologic modeling and water resource management issues such as flood warning and real time control of urban drainage systems is short term rainfall forecasting accuracy [1]. In recent decades, developing real-time urban flood forecasting models has been investigated through various studies and different machine and deep learning models have been applied as a prediction model [2]. For instance, in [3], the role of short-term rainfall forecasts in predictive real-time optimal operation (PRTOP), for five adaptive PRTOP models, have been compared.

In this study, based on the result of the [1], one of the superior rainfall forecasting models, the machine learning-based particle swarm optimization (PSO)-support vector regression (SVR) rainfall forecasting approach, is used to develop a 15-minute ahead forecast model of rainfall depth. The PSO-SVR model is linked then to the harmony search (HS)-storm water management model (SWMM) as an optimization-simulation model in a predictive real-time operation model to minimize the flood volume, objective function = min (flood volume), at the control point of a portion of an urban drainage system in Tehran, Iran. Subsequently, the effect of integrating forecasting model with the simulation-optimization model (HS-SWMM) has been examined.

The application of the proposed real-time operation approach through optimizing the operation of the system for eight selected rainfall events, each of them has been selected from different classes, reveals its outperformance over a reactive real-time operation model (RTOP) by decreasing the flood volume at the control point up to 7.5%. 

Keywords: Urban Drainage Systems, Short-term Rainfall Forecasting, Real-time Operation, Machine Learning.


[1] Adaryani, F. R., Mousavi, S. J., & Jafari, F. (2022). Short-term rainfall forecasting using machine learning-based approaches of PSO-SVR, LSTM and CNN. Journal of Hydrology614, 128463.

[2] Piadeh, F., Behzadian, K., & Alani, A. (2022). A critical review of real-time modelling of flood forecasting in urban drainage systems. Journal of Hydrology, 127476.

[3] Jafari, F., Mousavi, S. J., & Kim, J. H. (2020). Investigation of rainfall forecast system characteristics in real-time optimal operation of urban drainage systems. Water Resources Management34(5), 1773-1787.

How to cite: rezaie Adaryani, F., Mousavi, S. J., and Jafari, F.: PSO-SVR Rainfall Forecast-Assisted Real-time Optimal Operation of Urban Drainage Systems, EGU General Assembly 2023, Vienna, Austria, 23–28 Apr 2023, EGU23-4251, https://doi.org/10.5194/egusphere-egu23-4251, 2023.

EGU23-4311 | ECS | Posters virtual | HS4.8

Real-Time Urban Flood Forecasting: Application of Hybrid Modelling Using Both Physically based and Data-Driven models 

Ahmad Ferdowsi, Farzad Piadeh, and Kourosh Behzadian

Today, urban flood forecasting is modelled well by hydrologists through physically based models in which different weather data, characteristics of catchments and streams/conduits are used as inputs to provide water level in UDS or water depth of surface runoff [1]. However, continuous access to these data can be challenging and demanding for model calibration or real-time applications that result in lack of providing accurate forecasting [2]. Alternatively, data-driven models can be used in hydrology and data sciences to provide high-speed, less data demanding, and more accuracy for especially short-term water level/depth of urban flooding [3]. However, these models can be inaccurate when new situations, especially new climate change based extreme events, occurred because these models are unable to understand and be adapted with different physical and hydrological situation of catchments [4]. Therefore, while both approaches are well-explored in simulating rainfall-runoff relationship over the urban catchments of interest, coupling these models sound promising and worth investigating in real-time applications of flood warning systems.

The present study critically investigates the applications of real-time hybrid models in which physically based and data-driven models are coupled together as integrated platform to take advantages of each type of modelling. The results show three different approaches have been highlighted in this area: (1) using physically-based models to provided up-to-date input data for machine-learning based modelling, (2) applying data-mining techniques to extract the rainfall-runoff features that are used for physically-based models, particularly different types of storm water management model, (3) error bias adjustment or interpolation of forecasts by using both physically-based and data-drive modelling.

Results also indicate that the first approach have been usually expressed when input database faces missing data problem, high value uncertainty or highly impacted by climate-related extreme events. This approach was also used for small-scale but dense city area without flexibility in surface lands or underground modifications. On the other hand, the second approach have been presented where big database are available and data screening are required. Furthermore, this modelling approach is more appropriate for high variability and high coverage catchment areas. Finally, the last modelling approach outperforms other approaches in covering both quality and quantity of data resources. However, integration of interpolation and bias adjustment of individual models still have remains as open case than should be more tested in the future.

References

[1] Zounemat-Kermani, M., Matta, E., Cominola, A., Xia, X., Zhang, Q., Liang, Q., Hinkelmann, R. (2020). Neurocomputing in surface water hydrology and hydraulics: A review of two decades retrospective, current status and future prospects. Journal of Hydrology, 588, 125085.

[2] Piadeh, F., Behzadian, K., Alani, A. (2022). A critical review of real-time modelling of flood forecasting in urban drainage systems. Journal of Hydrology, 607, 127476.

[3] Rezaie Adaryani, F., Mousavi, S. Jafari, F. (2022). Short-term rainfall forecasting using machine learning-based approaches of PSO-SVR, LSTM and CNN. Journal of Hydrology, 614(A), 128463.

[4] García, L., Barreiro-Gomez, J., Escobar, E., Téllez, D., Quijano, N., Ocampo-Martinez, C. (2015). Modeling and real-time control of urban drainage systems: A review. Advances in Water Resources, 85, pp. 120-132.

How to cite: Ferdowsi, A., Piadeh, F., and Behzadian, K.: Real-Time Urban Flood Forecasting: Application of Hybrid Modelling Using Both Physically based and Data-Driven models, EGU General Assembly 2023, Vienna, Austria, 23–28 Apr 2023, EGU23-4311, https://doi.org/10.5194/egusphere-egu23-4311, 2023.

EGU23-4524 | ECS | Orals | HS4.8

Event-based Flood Data Imputation for Infilling Missing Data in Real-time Flood Warning Systems 

Farzad Piadeh, Kourosh Behzadian, and Joseph P. Rizzuto

Real-time flood warning systems as part of digital and innovative non-structural solutions have been widely used to prepare decision makers, operators, and affected population to alleviate socio-economic flooding consequences [1]. Many models have been introduced recently to provide more accurate flood forecasts with longer lead times. However, they rely highly on availability of input data which may contain missing values in measurement for one or more timesteps mainly due to wide range of reasons such as random/systematic errors and blunders. Hence, real-time early warning systems cannot be operated properly unless these missing data are properly infilled [2]. Despite data imputation techniques have been mainly employed in pre-processing step of historical data i.e., models training and validation, they have not been properly elaborated in real-time operation practically [3].

This paper aims to propose a new event-based data imputation method for infilling rainfall and water level missing data appearing in real-time operation of flood early warning systems. Event identification is first used to divide the real-time data into the wet or dry weather conditions which then are used for selecting the best strategy of infilling missing data. Imputation decision framework takes advantage of various imputation techniques including t-copula, move-median, and kriging based on external available benchmarks and temporal location of missing data. Proposed methodology is tested in real-world case study of urban drainage system in London, UK. Conventional techniques such as linear regression, kriging, nearest neighbourhood, t-copula, inverse distance, and similar calendar are first compared together and best techniques are then tested with proposed methodology in three real-time scenarios as (1) missing rainfall intensity, (2) missing water level, (3) missing both rainfall and water level. Recurrent neural network model used for flood forecasting and results are demonstrated for the next 3hr-ahead predictions.

Results show the proposed method can reduce root mean square error (RMSE) from 55% to 13%, 43% to 12%, and 97% to 17% for the above scenarios, respectively. Furthermore, using external benchmark data resources, i.e. other near rainfall/water level stations, shows very efficient when missing data appears at early steps of rainfall events where selected conventional techniques suffer from predicting rainfall pattern. Finally, when both water level and rainfall intensity were missing, the proposed imputation method can reduce RMSE from 197mm to 117mm (RMSE was originally 100 for no missing data) for 3hr-ahead predictions. Generally, this study shows the proposed imputation method can better infill the missing data, especially those in the flood event by using correlated data in other weather/gauging stations and flexibility in applying different methods.

References

[1] Piadeh, F., Behzadian, K., Alani, A.M. (2022). Multi-Step Flood Forecasting in Urban Drainage Systems Using Time-series Data Mining Techniques. Water Efficiency Conference, West Indies, Trinidad and Tobago, repository.uwl.ac.uk/id/eprint/9690 [Accessed 31/12/2022].

[2] Piadeh, F., Behzadian, K., Alani, A. (2022). A critical review of real-time modelling of flood forecasting in urban drainage systems. Journal of Hydrology, 607, 127476.

[3] Ben Aissia, M., Chebana, F., Ouarda, T. (2017). Multivariate missing data in hydrology–Review and applications. Advances in Water Resources, 110, pp.299-309.

How to cite: Piadeh, F., Behzadian, K., and Rizzuto, J. P.: Event-based Flood Data Imputation for Infilling Missing Data in Real-time Flood Warning Systems, EGU General Assembly 2023, Vienna, Austria, 23–28 Apr 2023, EGU23-4524, https://doi.org/10.5194/egusphere-egu23-4524, 2023.

EGU23-7434 | Orals | HS4.8

The operational flash-flood forecasting system for the Kingdom of Saudi Arabia: A case study of the 24th November 2022  flash flood in Jeddah 

Giulia Sofia, Qing Yang, Xinyi Shen, Mahjabeen Fatema Mitu, Platon Patlakas, Ioannis Chaniotis, Andreas Kallos, Mohammed Ahmed Alomari, Saad S. Alzahrani, Zaphiris Christidis, and Emmanouil Anagnostou

Predicting flash floods in the arid region of the Arabia Peninsula poses unique challenges to researchers and practitioners due to the generally limited data records and field observations. The rapid onset of these events hinders mitigation measures and limits timely decisions, resulting in fatalities and property losses. To improve our predictive capability, we deployed a flash flood forecasting system that integrates numerical weather forecasts from the Weather Research and Forecasting (WRF) model with a distributed hydrological model, the Coupled Routing and Excess STorage (CREST), and a 2D hydrodynamic model (HEC-RAS). The atmospheric component runs at cloud-resolving scales (1.6 km) to incorporate local features and strong convection. The hydrological and hydrodynamic models run at variable spatiotemporal resolution: the rainfall-runoff generation runs at 500 meter-by-hourly, routing at 30 meter-by-hourly, while the floodplain dynamics are computed at 30 meter-by-hourly. The significant differences in computational demands dictate the domain differences: CREST runs over large natural basins while HEC-RAS runs over small urban sub-basins associated with dense infrastructures and exposure.

The effectiveness of the operational national scale flash flood forecasting system is evaluated in this study for the extreme precipitation event that hit Jeddah on 24 November 2022. The event was the heaviest ever recorded in the area, causing widespread flash floods across Jeddah's urban and rural areas.

The atmospheric component forecast is compared to the NASA satellite precipitation product (IMERG Late) and radar-rainfall estimates that were bias-adjusted based on in situ gauge observations. Since no hydrological observations were available to the authors for this event, discharge obtained from the gauge-adjusted radar-rainfall data, which represents the benchmark precipitation, was used as a reference to assess the skill of the WRF-based flood forecasts. Finally, the effectiveness of the warning system was compared to reported localized flood incidents at the street or neighborhood level by the public ('crowd source').

The results of this study reveal an excellent temporal and spatial agreement between the forecasted precipitation from WRF and the bias-adjusted radar-rainfall estimates. The same conclusions cannot be drawn for the IMERG Late data. The satellite product seems to overestimate precipitation in most cases, which is consistent with the findings of several prior satellite validation studies. Comparing the flood quantiles for the Nov. 24th flood event indicates that the WRF-driven flood peak discharge properties agree with the radar-based ones. The differences between the flood characteristics (hydrographs peak, timing, and flood volume) when using WRF-forecasted versus radar-based benchmark precipitation were also minimal. The simulated flood inundation could capture the broad patterns of inundated areas at the city level: a high degree of agreement was reached, and more than 95% of the reported incidents across the city districts fell within the forecasted high or extreme warnings provided by the operational system on Nov. 23rd, at 12.30; therefore, more than 12 hours ahead. The importance of the study comes from the fact that it provides an effective solution and a state-of-the-art methodology to forecast such types of extreme rainfall events, which can cause major flash floods in the urban areas of Saudi Arabia.

How to cite: Sofia, G., Yang, Q., Shen, X., Mitu, M. F., Patlakas, P., Chaniotis, I., Kallos, A., Alomari, M. A., Alzahrani, S. S., Christidis, Z., and Anagnostou, E.: The operational flash-flood forecasting system for the Kingdom of Saudi Arabia: A case study of the 24th November 2022  flash flood in Jeddah, EGU General Assembly 2023, Vienna, Austria, 23–28 Apr 2023, EGU23-7434, https://doi.org/10.5194/egusphere-egu23-7434, 2023.

EGU23-7962 | ECS | Posters on site | HS4.8

An empirical rainfall threshold approach for the regional civil protection flood warning system: the case study of the Milan urban area 

Enrico Gambini, Alessandro Ceppi, Giovanni Ravazzani, Marco Mancini, Ismaele Valsecchi, Alessandro Cucchi, Alberto Negretti, and Immacolata Tolone

In recent years the interest towards flood forecasting in urban areas has increased significantly: urban areas and the people living in there are generally very exposed to floods; also, this problem may worsen in the future due to climate and land-use change.

Empirical rainfall thresholds could represent a useful tool especially for those river basins where applying hydrological models is difficult. Such an approach can potentially be used for every river cross section whenever enough rainfall-discharge data are collected.

In this study, we developed some empirical rainfall threshold with the aim of validating and enhancing the Regional Civil Protection warning system operating in the Lombardy Region.

Rainfall data were collected from a total of 92 stations taken from the official regional Environmental Protection Agency of the Lombardy Region (ARPA-Lombardia) and from the network of a citizens science association “Meteonetwork”. Data on hydrometric levels and discharge were obtained entirely through the regional Environmental Protection Agency of the Lombardy Region.

The study focused on the small and well urbanized river basins which drain their water towards the city of Milan (mainly Seveso, Olona and Lambro River basins). Simple rainfall-runoff methods and decision theory, as indicated on the local civil protection directory, were used to validate the results obtained.

Preliminary results given by this methodology have shown that it could be a helpful tool for local civil protection authorities to take preventive actions for the population, as well as to validate the existing warning systems based on rainfall thresholds.

How to cite: Gambini, E., Ceppi, A., Ravazzani, G., Mancini, M., Valsecchi, I., Cucchi, A., Negretti, A., and Tolone, I.: An empirical rainfall threshold approach for the regional civil protection flood warning system: the case study of the Milan urban area, EGU General Assembly 2023, Vienna, Austria, 23–28 Apr 2023, EGU23-7962, https://doi.org/10.5194/egusphere-egu23-7962, 2023.

EGU23-8574 | ECS | Orals | HS4.8

Real-time flood overflow forecasting in Urban Drainage Systems by using time-series multi-stacking of data mining techniques 

Farzad Piadeh, Kourosh Behzadian, Albert S. Chen, Luiza C. Campos, and Joseph P. Rizzuto

 Overflow forecasting in early warning systems is acknowledged as an essential task for devastating urban flood risk management. Although many machine learning models have been developed recently to forecast water levels in urban drainage systems (UDS), they usually require big and accurate data resources [1]. Alternatively, ensemble data mining models are becoming more popular, in which time-series numerical data are turned into the categorised features that classify wet weather conditions as two classes of overflow and non-overflow conditions [2]. However, the concept of time-series ensemble modelling i.e., blending different data mining techniques for predictions with different timesteps is still new [3]. Furthermore, the application of more advanced models, particularly multi-blending in these types of ensemble modelling requires more investigation. This study aims to introduce a novel multi-stacking model that integrates different decision tree frameworks by developing various base weak learner data mining techniques and associated base model performance indicators in the process of time-series blending of pre-trained stacked ensemble models. The performance of this new approach is compared by several previously developed ensemble models [2] through confusion matrix performance criteria, including hit rate, overestimation, and underestimation. This method is demonstrated by its application to a real case study of UDS located in the northwest of London for performance assessment up to 5hr ahead (i.e., 20 timesteps with 15-min intervals). In total, 140 base-models and 20 stacked models were developed that are stored in the data warehouse to use as real-time early-warning flood overflow forecasting for this case study. These developed models were used through introduced decision three framework that specified stacking blending methodology. Results show that while base models and stacked models suffer from high miss rate, especially for forecasting more than 3hrs ahead (more than 50%), the proposed multi-stacking model could perfectly maintain the miss rate (i.e., sum of over- and under-estimations) of up to 4hr-ahead predictions less than 10%, but this rate dropped to nearly 30% for 5hr-ahead predictions. However, the rate of overflow forecasting remained acceptably near 80% whereas it is recorded to less than 58% for other benchmark models. Using different decision frameworks for determining importance of each stacked model in blending mode of multi-stacking method shows could reduce errors in forecasting rate and take advantage of each model in real-time early warning urban flood forecasting.

References

 [1] Piadeh, F., Behzadian, K., Alani, A. (2022). A critical review of real-time modelling of flood forecasting in urban drainage systems. Journal of Hydrology, 607, 127476.

[2] Granata, F., Di Nunno, F., de Marinis, G. (2022). Stacked machine learning algorithms and bidirectional long short-term memory networks for multi-step ahead streamflow forecasting: A comparative study, Journal of Hydrology, 613(A), 128431.

[3] Piadeh, F., Behzadian, K., Alani, A.M. (2022). Multi-Step Flood Forecasting in Urban Drainage Systems Using Time-series Data Mining Techniques. Water Efficiency Conference, West Indies, Trinidad and Tobago. repository.uwl.ac.uk/id/eprint/9690 [Accessed 31/12/2022].

How to cite: Piadeh, F., Behzadian, K., Chen, A. S., Campos, L. C., and Rizzuto, J. P.: Real-time flood overflow forecasting in Urban Drainage Systems by using time-series multi-stacking of data mining techniques, EGU General Assembly 2023, Vienna, Austria, 23–28 Apr 2023, EGU23-8574, https://doi.org/10.5194/egusphere-egu23-8574, 2023.

EGU23-9445 | ECS | Posters virtual | HS4.8

Application of Decision-Making Techniques for Prioritizing Water Treatment Technology in Flood Events: A  Preventive Crisis Management in the Czech Republic 

Mehran Akrami, Kourosh Behzadian, Mohammad Gheibi, Masoud Khaleghiabbasabadi, and Stanisław Wacławek

Flood is one of the phenomena that threaten people's life and property, which occurs every year in developed and developing countries [1]. Meanwhile, rapid response to water quality problems during this natural disaster is one of the most critical factors of an Early-Warning System (EWS). Due to the change in the river network and the washing of urban and rural environments, the quality of water in flood is significantly reduced, and the residents face the problem of water supply during this period [2]. This paper presents a fast response framework for selecting the best water treatment techniques in unusual pollution loads of urban floods based on water qualitative analysis and methods of Game Theory (GT) as decision-making techniques. The main goal of this study is to provide a framework for improving drinking water supply services during flood risk management in the Czech Republic. To achieve the fast water treatment technologies, Ordered Weighted Averaging (OWA), mulTi-noRmalization mUlti-distance aSsessmenT (TRUST) and VIekriterijumsko KOmpromisno Rangiranje (VIKOR) computations as Multi Criteria Decision Making (MCDM) were applied. In fact, based on this structure, an operational model for the Czech Republic as per the Preventive Crisis Management (PCM) approach has been expressed as the primary outcome of this investigation. The results demonstrated that mobile membrane technologies could have higher efficiency than other methods. However, from the economic aspect, many options can be utilized in different scenarios according to the managerial opinions.

Keywords: Early-Warning System; Flood; Water Quality; Preventive Crisis Management; Czech Republic

Reference

[1] Zabihi, O., Siamaki, M., Gheibi, M., Akrami, M. and Hajiaghaei-Keshteli, M., 2023. A smart sustainable system for flood damage management with the application of artificial intelligence and multi-criteria decision-making computations. International Journal of Disaster Risk Reduction, 84, p.103470.

[2] Akbarian, H., Gheibi, M., Hajiaghaei-Keshteli, M. and Rahmani, M., 2022. A hybrid novel framework for flood disaster risk control in developing countries based on smart prediction systems and prioritized scenarios. Journal of environmental management, 312, p.114939.

How to cite: Akrami, M., Behzadian, K., Gheibi, M., Khaleghiabbasabadi, M., and Wacławek, S.: Application of Decision-Making Techniques for Prioritizing Water Treatment Technology in Flood Events: A  Preventive Crisis Management in the Czech Republic, EGU General Assembly 2023, Vienna, Austria, 23–28 Apr 2023, EGU23-9445, https://doi.org/10.5194/egusphere-egu23-9445, 2023.

EGU23-9622 | ECS | Posters on site | HS4.8

Risk-based Decision Support System for Early Warning of Chemical Emissions in Flood Event: A Case Study of Crystallization Factories in Liberec City, Czech Republic 

Mohamad Gheibi, Masoud Khaleghiabbasabadi, Barbara Socha, Stanisław Wacławek, and Miroslav Černík

Based on the reports presented in various studies, it appears that in the Czech Republic, in 2002, as a result of a fluvial flood, chlorine and other chemicals in a factory were washed away and led to various epidemiological effects [1]. This paper presents a Decision Support System (DSS) based on Random Forest (RF) artificial intelligence technique and Failure Modes and Effects Analysis (FMEA) [2] to minimize the chemical risks in industrial factories and control possible pollution from crystallization plants. The methodology is demonstrated by its application on real crystallization plant in Liberec, Czech Republic. The investigations demonstrated that the RF algorithm has the ability to predict the severity of the occurrence and the Risk Probability Number (RPN) of spreading pollution with more than 90% regression coefficient. On the other hand, combining the machine learning method with the risk analysis has the possibility of heavy metal emission risk detection as well as the presentation of available solutions using the classic Delphi technique [3,4]. The evaluations of this research proved that the proposed methdology can significantly increase the biological security of citizens in crisis conditions.

Keywords: Flood; Decision Support System; Machine Learning; Risk Analysis; Czech Republic.


Reference

[1] Gautam, K.P. and Van Der Hoek, E.E., 2003. Literature study on environmental impact of floods. DC1-233-13.

[2] Gheibi, M., Karrabi, M. and Eftekhari, M., 2019. Designing a smart risk analysis method for gas chlorination units of water treatment plants with combination of Failure Mode Effects Analysis, Shannon Entropy, and Petri Net Modeling. Ecotoxicology and Environmental Safety, 171, pp.600-608.

[3] Zabihi, O., Siamaki, M., Gheibi, M., Akrami, M. and Hajiaghaei-Keshteli, M., 2023. A smart sustainable system for flood damage management with the application of artificial intelligence and multi-criteria decision-making computations. International Journal of Disaster Risk Reduction, 84, p.103470.

[4] Akbarian, H., Gheibi, M., Hajiaghaei-Keshteli, M. and Rahmani, M., 2022. A hybrid novel framework for flood disaster risk control in developing countries based on smart prediction systems and prioritized scenarios. Journal of environmental management, 312, p.114939.

How to cite: Gheibi, M., Khaleghiabbasabadi, M., Socha, B., Wacławek, S., and Černík, M.: Risk-based Decision Support System for Early Warning of Chemical Emissions in Flood Event: A Case Study of Crystallization Factories in Liberec City, Czech Republic, EGU General Assembly 2023, Vienna, Austria, 23–28 Apr 2023, EGU23-9622, https://doi.org/10.5194/egusphere-egu23-9622, 2023.

EGU23-9672 | ECS | Posters on site | HS4.8

Using Ensemble Data Mining Modelling for Nonbinary Overflow Detection in Urban Flooding 

Kourosh Behzadian, Farzad Piadeh, Albert S. Chen, Luiza Campos, and Zoran Kapelan

Application of data-driven modelling especially using data mining techniques in flood warning systems has received significant attention recently due mainly to its well-explored sustainable solution for alleviating disruptive socio-economic effects of flood occurrence [1]. Various machine learning models with hybrid data mining techniques have been applied for water level prediction or overflow detection. However, the concept of time-series ensemble modelling has yet to be perceived well, particularly application of nonbinary classification for overflow detection and associated flood risk management [2].

This study presents a new real-time nonbinary overflow detection in urban flooding through extraction of rainfall key features by developing weak learner base models and proposing time-series multi-classification ensemble model. This framework is demonstrated by its application on real case study of urban drainage systems (UDS) located in London, UK. Extracted rainfall features which are selected by partial least squares analysis include (1) rainfall duration, (2) rainfall intensity, (3) evidence of previous rainfall occurrence, and (4) rainfall date of the year. These features are then used to develop seven base models including (1) discriminant analysis, (2) decision tree, (3) Gaussian process regression, (4) K-nearest neighbourhood, (5) Naïve bayes, (6) neural network pattern recognition, and (7) support vector machine to detect one of the three condition of (1) overflow, (2) water level rise is expected but drained successfully without any overflow occurrence, (3) no water level rise is expected. A novel ensemble model (ENS) which blends the performance of developed base models into the decision tree structure was then developed for overflow detection of next twelve 15-min timesteps (i.e., 3 hrs). The result performance of this model is compared by two well-practiced models i.e., stacked random forest (ERF), and nagging K-nearest neighbourhood (EKN) [3]. Confusion matrix is selected as a method of performance assessment in which total positive ratio, accuracy, and total negative ratio are picked up as key performance indicators.

Results show two new proposed rainfall features named “evidence of previous rainfall occurrence” and “rainfall date of the year” could significantly enhance the base model’s accuracy. Furthermore, ENS model could reduce overestimation and underestimation miss rates by nearly 10% in total for 3 hrs-ahead overflow detection, whereas these figures are 37% and 39% for total miss rate of ERF and EKN respectively in the same detection duration. Furthermore, the rate of correct high-hazard overflow detections is 88% in comparison to 64% in ERF and 24% in EKN, which highlights superior ability of the proposed model in early warning alarms of high-hazard situations.

References

[1] Rezaie Adaryani, F., Mousavi, S. Jafari, F. (2022). Short-term rainfall forecasting using machine learning-based approaches of PSO-SVR, LSTM and CNN. Journal of Hydrology, 614(A), 128463.

[2] Piadeh, F., Behzadian, K., Alani, A. (2022). A critical review of real-time modelling of flood forecasting in urban drainage systems. Journal of Hydrology, 607, 127476.

[3] Piadeh, F., Behzadian, K., Alani, A.M. (2022). Multi-Step Flood Forecasting in Urban Drainage Systems Using Time-series Data Mining Techniques. Water Efficiency Conference, West Indies, Trinidad and Tobago. repository.uwl.ac.uk/id/eprint/9690 [Accessed 31/12/2022].

How to cite: Behzadian, K., Piadeh, F., Chen, A. S., Campos, L., and Kapelan, Z.: Using Ensemble Data Mining Modelling for Nonbinary Overflow Detection in Urban Flooding, EGU General Assembly 2023, Vienna, Austria, 23–28 Apr 2023, EGU23-9672, https://doi.org/10.5194/egusphere-egu23-9672, 2023.

EGU23-10211 | ECS | Orals | HS4.8

Role of Satellite Precipitation Products in Real-Time Predictions of Urban Rainfall-Runoff by Using Machine Learning Modelling 

Cristiane Girotto, Farzad Piadeh, Kourosh Behzadian, Massoud Zolgharni, Luiza Campos, and Albert Chen

The accurate prediction of runoff features such as water level and flow is valuable for planning and operation of urban drainage systems (UDS), especially for appropriately acting as flood control mechanisms during extreme rainfall events which are constantly impacted by climate change variables [1]. In addition, cost-effective design, and operation of flood control measures such as smart UDS require highly accurate rainfall predictions across the catchment area, i.e., intensity and duration [2]. Furthermore, sufficient lead time is needed to activate the control mechanisms on the UDS without affecting the accuracy of the predictions. It seems that the emerging use of satellite precipitation products (SPPs) is promising for obtaining predictions with longer lead times [3]. Hence, more exploration of potential runoff predictions by using SPPs is worth investigating to achieve a more accurate and longer lead time.

This study employs a type of SPPs i.e., global precipitation measurement-integrated multi-satellite retrieval product (GPM-IMERG) to predict rainfall-runoff duration, peak and volume, as well as changes in flow over the course of the event at 30-minute intervals. In order to train and validate the machine learning model, the data from GPM-IMERG V06 was merged with ground data from the catchment precipitation gauge and flow sensor. The methodology is demonstrated by its application to the rainfall-runoff modelling of a real-world small urban sub-catchment area and its performance is evaluated by comparing it with the runoff predictions from physically based simulation models [4].

Results show that while using SPPs solely can provide accurate predictions, significant improvement can be obtained when this data is integrated with ground monitoring data. The model output can be utilised for better design, planning and management of UDS technologies as flood control tools and consequently real-time operation of UDS in urban flooding.

[1] Ferrans, P., Torres, M., Temprano, J., Sánchez, J., (2022). Sustainable Urban Drainage System (SUDS) modelling supporting decision-making: A systematic quantitative review. Science of The Total Environment. 806(2), 150447.

[2] Guptha, G., Swain, S., Al-Ansari, N., Taloor, A., Dayal, D. (2022). Assessing the role of SuDS in resilience enhancement of urban drainage system: A case study of Gurugram City, India. Urban Climate, 41, 101075.

[3] Piadeh, F., Behzadian, K., Alani, A. (2022). A critical review of real-time modelling of flood forecasting in urban drainage systems. Journal of Hydrology, 607, 127476.

[4] Broekhuizen, I., Leonhardt, G., Marsalek, J., & Viklander, M. (2020). Event selection and two-stage approach for calibrating models of green urban drainage systems. Hydrology and Earth System Sciences, 24(2), 869–885.

How to cite: Girotto, C., Piadeh, F., Behzadian, K., Zolgharni, M., Campos, L., and Chen, A.: Role of Satellite Precipitation Products in Real-Time Predictions of Urban Rainfall-Runoff by Using Machine Learning Modelling, EGU General Assembly 2023, Vienna, Austria, 23–28 Apr 2023, EGU23-10211, https://doi.org/10.5194/egusphere-egu23-10211, 2023.

EGU23-15800 | Orals | HS4.8

Urban Flood Forecast using an Open Source Coupled 1D1D SWMM Model for Real-Time Applications 

Nanna Høegh Ravn, Henry Baumann, and Alexander Schaum

Due to climate change, heavy rainfall events are occurring more frequently and at a higher rate. At the same time, the sewer system is often not designed to handle such a large amount of precipitation, which often leads to flooding of certain critical areas. However, modern sensor technology for monitoring the filling and flow rates in the sewer system, as well as for monitoring and forecasting rainfall probabilities, including quantity information, form a good basis for developing modern multifunctional early warning systems, which can serve as an aid for decisions on action. Urban water drainage systems represent complex networks with nonlinear dynamics and different types of interactions. This yields an involved modelling problem for which different off-line simulation approaches are available. Nevertheless, these approaches cannot be used for real-time simulations, i.e., running in parallel to weather now- and forecasts and enabling the monitoring and automatic control of urban water drainage systems. Alternative approaches, used commonly for automation purposes, involve parameterized linear delay systems, which can be used in real-time but lack the necessary level of detail, which is required for adequate flood risk prognostics. Given this setup, an approach for the effective modelling of detailed water drainage systems for real-time applications implemented with the open-source Storm Water Management Model (SWMM) software is addressed and exemplified for a part of the water drainage system of the city of Flensburg in northern Germany. Additionally, a freely available early-warning system prototype is introduced and used to combine weather forecast information on a 2-h prediction horizon with the developed model and available measurements. This prototype is subsequently used for data assimilation using the ensemble Kalman filter (EnKF) for the considered area in Flensburg. The project presented here is part of the NEPTUN project. NEPTUN is financed by Interreg Deutschland-Danmark with means from the European Regional Development Fund. 

How to cite: Høegh Ravn, N., Baumann, H., and Schaum, A.: Urban Flood Forecast using an Open Source Coupled 1D1D SWMM Model for Real-Time Applications, EGU General Assembly 2023, Vienna, Austria, 23–28 Apr 2023, EGU23-15800, https://doi.org/10.5194/egusphere-egu23-15800, 2023.

EGU23-17237 | ECS | Orals | HS4.8

A smart dashboard for forecasting disaster casualties: An investigation from sustainable development dimensions 

Seyed Reza Naghedi, Xiao Huang, and Mohamad Gheibi

Natural disasters are known to cause widespread and severe damages all over the world annually. Flood events are responsible for economic and human life losses[1]. One of the most important indicators of the damage level in a flood crisis is the number of casualties. This index is evaluated annually in all countries based on natural disasters. Studies indicate that the death rate caused by floods correlates with countries' development over time [2]. In the present study, quantitative values of three sustainability indicators were extracted in the Czech Republic, Iran, and the United States between 1990 and 2020. These indicators are the Human Development Index (DPI), Gross Domestic Product(GDP), and Climate-Change Impacts (CCI), representing the Social, Economic, and Environmental aspects of sustainable development, respectively.  Then, the mathematical relationships between the development indicators and the number of human losses caused by disasters were evaluated using statistical distributions based on time series. In the final step, using Artificial Intelligence (AI) methods, including Artificial Neural Network (ANN), Adaptive Neuro-Fuzzy Inference System (ANFIS), and Random Tree (RT), a prediction of the number of potential fatalities per natural disaster was obtained. The outcomes showed that each country's deaths caused by natural disasters could depend on different parameters and impact coefficients. In addition, the ANFIS algorithm, with more than 98% accuracy, has the most efficiency in determining the severity of the event. With the help of this AI system, it is possible to evaluate society's behavior and its resilience against floods from a holistic viewpoint[3].

How to cite: Naghedi, S. R., Huang, X., and Gheibi, M.: A smart dashboard for forecasting disaster casualties: An investigation from sustainable development dimensions, EGU General Assembly 2023, Vienna, Austria, 23–28 Apr 2023, EGU23-17237, https://doi.org/10.5194/egusphere-egu23-17237, 2023.

The release of dangerous chemicals in flood crises is a common and recurring phenomenon. Because due to the breakdown of the infrastructure in the year, the possibility of release of dangerous pollutants is expected more than before [1]. The present research has chosen a chemical factory with Glycerin tanks as a case study in the city of Liberec (Czech Republic). As acute exposure to these compounds leads to effects such as headaches, dizziness, bloating, nausea, vomiting, thirst, and diarrhea [2], the control of this pollution can significantly reduce the health risk impacts especially during floods. In the first step of this study, all the physics coordinates of the reservoirs were examined and evaluated in different conditions. In the next step, according to the experimental calculations, the volume of Glycerin release from the reservoirs and in the flood flow was evaluated. Risk analysis was done using the HAZard & OPerability study (HAZOP) technique. Risk Number in the HAZOP method is computed based on two factors containing Risk Possibility (RP) and Risk Intensity (RI) [3]. Both the values are determined according to prediction of Adaptive Neuro Fuzzy Inference System (ANFIS) [4] based on previous studies in different countries. The results demonstrated that the integrated HAZOP-ANFIS model has different performance in various flood flow conditions.

RP value is predicted abased on three parameters include; rainfall value, mass of contaminant, and flood flow. Likewise, the RI is estimated in ANFIS method according to self-assimilative factor and continuity of floods [4]. The computations demonstrated that ANFIS technique has more than 0.9 correlation coefficient for prediction of both flood risk factors (RP and RI). Likewise, the sensitivity analysis of the prediction system is examined as per all the declared physical features which effects on RP and RI. Also, it should be mentioned that in the Glycerin content is in the range of 45%- 65% in the case study. Numerical analysis illustrated the performance of designed framework has more efficiency in the higher concentrations of the contamination. The suggested structure can be used as an early qualitative framework for acute effects of hazardous material emissions.

Keywords: HAZOP risk assessment; ANFIS; Flood; Glycerin emissions; Chemical plant

References:

[1] Yard, E.E., Murphy, M.W., Schneeberger, C., Narayanan, J., Hoo, E., Freiman, A., Lewis, L.S. and Hill, V.R., 2014. Microbial and chemical contamination during and after flooding in the Ohio River—Kentucky, 2011. Journal of Environmental Science and Health, Part A, 49(11), pp.1236-1243.

[2] Dunjó, J., Fthenakis, V., Vílchez, J.A. and Arnaldos, J., 2010. Hazard and operability (HAZOP) analysis. A literature review. Journal of hazardous materials, 173(1-3), pp.19-32.

[3] Zabihi, O., Siamaki, M., Gheibi, M., Akrami, M. and Hajiaghaei-Keshteli, M., 2023. A smart sustainable system for flood damage management with the application of artificial intelligence and multi-criteria decision-making computations. International Journal of Disaster Risk Reduction, 84, p.103470.

[4] Akbarian, H., Gheibi, M., Hajiaghaei-Keshteli, M. and Rahmani, M., 2022. A hybrid novel framework for flood disaster risk control in developing countries based on smart prediction systems and prioritized scenarios. Journal of environmental management, 312, p.114939.

How to cite: Moezzi, R., Taghavian, H., Gheibi, M., Koci, J., and Cyrus, J.: Integrated HAZard & OPerability study (HAZOP) and Adaptive Neuro Fuzzy Inference System (ANFIS) as an early alarm framework for Glycerin emission control of a chemical plant during floods: A case study of Liberec city, Czech republic, EGU General Assembly 2023, Vienna, Austria, 23–28 Apr 2023, EGU23-17416, https://doi.org/10.5194/egusphere-egu23-17416, 2023.

HS5 – Water policy, management and control

EGU23-2933 | ECS | Posters on site | HS5.1

Developing an Integrated Water Management Tool for Winnipeg River’s Hydropower System 

Hamid Gozini, Masoud Asadzadeh, Jacob Snell, Kristina Koenig, and Kevin Gawne

Hydropower is a renewable, economic, and low-emission source of energy and has the flexibility to accommodate different electricity demands. The Province of Manitoba’s current electricity supply is about 97% generated by hydropower, making it potentially vulnerable to climate change. The increase in the annual mean temperature in the Canadian Prairies is twice the rise in the global mean temperature, influencing precipitation patterns which ultimately highlights the importance of understanding the impacts of climate change in Manitoba. A MODSIM-DSS model has been developed for the operation of water control structures and hydropower facilities along the Winnipeg River, including the Rainy and English Rivers, which contains 11% of the hydropower capacity in Manitoba. This simulation model is equipped with parametric rule curves representing the operation of control points in the system. These rule curves are calibrated and evaluated against historically measured and observed data. To better understand potential adaptation responses, the simulation model will be used to project the response of this hydropower system to future climate conditions.

How to cite: Gozini, H., Asadzadeh, M., Snell, J., Koenig, K., and Gawne, K.: Developing an Integrated Water Management Tool for Winnipeg River’s Hydropower System, EGU General Assembly 2023, Vienna, Austria, 23–28 Apr 2023, EGU23-2933, https://doi.org/10.5194/egusphere-egu23-2933, 2023.

The Mekong River is the largest transboundary river in Southeast Asia and the main source of water supply for agricultural irrigation in the Lower Mekong River Basin (LMRB), supporting socioeconomic development and the livelihoods of millions of people. Irrigation accounts for more than 70% of water use in the LMRB, and issues of water use and allocation in the basin attract much attention, especially in dry years. However, there is a lack of systematic and up-to-date estimation of irrigation water requirements (IWR) in the LMRB, for historical and climate change conditions, which are essential for water resources planning and management in the basin. We use gridded meteorological and crop land use data to estimate monthly IWR at 5-arc minute resolution in the five LMRB countries, namely Myanmar, Laos, Thailand, Cambodia and Vietnam, using meteorological observations of 1991-2020 and climate projections for 2031-2060 and 2061-2090 by five global climate models under two climate scenarios, SSP126 and SSP585. Crop water productivity and water footprint are also estimated along with IWR. Under historical climate, the total IWR in the LMRB is estimated to be 20.44 billion m3, with Vietnam having the largest share of 9.18 billion m3, followed by Thailand with 7.54 billion m3. IWR concentrates in the dry season of November-April, accounting for 78.4% of annual IWR. Rice is the main water-consuming crop, accounting for 86.7% of total IWR. Relative to historical climate condition, SSP126 generally leads to slightly decreased IWR, whereas SSP585 leads to a large increase in IWR. Crop water productivity of rice is unevenly distributed in the basin, being higher in Vietnam and Laos and lower in Cambodia and Thailand. Green water footprint of rice is about 3.7 times higher than that of blue water footprint, indicating most of rice water consumption is from precipitation. Under SSP126, there is little change in water footprint, however under SSP585 blue water footprint increases significantly, in 2061-2090. This study provides update-to-date and high-resolution IWR estimates which can support water use and allocation dialogue, policy-making and management in the basin.

How to cite: Luo, Y. and Zhu, T.: Estimating Spatially Distributed Irrigation Water Requirements for the Lower Mekong River Basin: Present Condition and Climate Change Impacts, EGU General Assembly 2023, Vienna, Austria, 23–28 Apr 2023, EGU23-3002, https://doi.org/10.5194/egusphere-egu23-3002, 2023.

EGU23-3855 | ECS | Orals | HS5.1

Adaptive operation of reservoirs in the Lower reaches of Jinsha River at the dry season under climate change 

Wenhao Jia, Guobin Fu, Mufeng Chen, and Sen Wang

             Reservoir operation is important to realize the coordination of social, economic and environmental systems. However, climate events have changed the water cycle process and the spatial-temporal distribution of the water resource system, which has brought new challenges to regional water resources management and reservoir operation. This study aims at analyzing the impacts of climate change on the multi-objective reservoir operation at the dry season, and the adaptive reservoir operation scheme for future climate change scenarios. The Jinsha River, at the upper reaches of the Yangtze River, was chosen as the research area because a large number of reservoirs have been built in the basin. Firstly, the Pettitt, MK and Moving t-test methods were used to identify the abrupt points of the hydro-meteorological data series from 1957 to 2018, and then the SWAT model was used to quantify the impacts of climate change on the runoff in the Jinsha River. Secondary, the multi-objective optimal operation model of cascade reservoirs was constructed, and then an improved PA-DDS method is developed to find the Pareto front between ecological protection and power generation. Thirdly, the impacts of climate change on reservoir operation were analyzed by comparing the scheduling results between the pre-change period (1957-1996) and the post-change period (1997-2018). Finally, using the Delta downscaling method, the GCM models chosen by suitability assessment were inputted into the SWAT model to simulate the future runoff for the reservoir operation model under different scenarios. The results showed that (1) the temperature and precipitation in the Jinsha River faced an abrupt change in 1997, while the runoff changed in 1997 and 2004. (2) the SWAT model can well simulate the daily runoff of Jinsha River (Re<15%, NSE>0.79, R2>0.8), while climate change accounts for 52.4% and 52.1% of runoff change during 1997-2004 and 2005-2018, respectively. (3) climate change can increase the ecological deviation degree and the power generation of reservoirs. In addition, compared with the traditional optimal scheduling scheme, the potential climate change brings higher requirements for water resources optimization in the future. (4) From 2021 to 2100, the temperature, precipitation and runoff of the Jinsha River are continually increased compared with the pre-changed period. It should be noted that the runoff from September and October is significantly reduced in most scenarios, increasing the insufficient storage risk of cascade reservoirs; man-made floods may be caused by the increasing runoff from April to June and the concentrated discharge of reservoirs before flood season. This study can provide theoretical support for reservoir operation and provide technical references for the impact mechanism of climate change on water resources and their management.

How to cite: Jia, W., Fu, G., Chen, M., and Wang, S.: Adaptive operation of reservoirs in the Lower reaches of Jinsha River at the dry season under climate change, EGU General Assembly 2023, Vienna, Austria, 23–28 Apr 2023, EGU23-3855, https://doi.org/10.5194/egusphere-egu23-3855, 2023.

EGU23-4388 | Orals | HS5.1

Integrating farmers' risk aversion in climate change behavioral modelling to improve decision-making processes 

Sandra Ricart, Paolo Gazzotti, Lisa Ferrari, Claudio Gandolfi, and Andrea Castelletti

Agricultural systems are adversely influenced by climate change through increased temperatures, change in run-off patterns and seasonality fluctuation. Farmers are, hence, a valuable source of first-hand observations of climate change as they may provide a deeper understanding of their manifestation and relevance. Farmers are aware of climate change impacts and promote adaptation measures such as changing crop varieties, adjusting planting dates, introducing agroforestry practices, and promoting soil and water conservation practices. However, some adaptation barriers persist such as the limited knowledge of potential adaptation strategies, high adaptation cost, or poor institutional support. Understanding why and how farmers aim to adapt to climate change is imperative to provide informed decisions to policy-makers and the first step to minimizing misconceptions or maladaptation practices. Consequently, drivers and influencing factors of farmers’ behavior toward climate change have received increasing attention in the last two decades.

Social and behavioral sciences have investigated the influence of farmers’ experiences in increasing climate change adaptation capability and improving decision-making processes at the system level, concluding how local perceptions provide sufficient baseline information for understanding individual and collective exposure to climate risks and risk aversion patterns, an essential element for effective policy formulation and implementation. Traditional management approaches based on simple, linear growth optimization strategies, overseen by command-and-control policies, have proven inadequate for effective adaptation to climate change. Conversely, accurate bottom-up approaches focused on social learning can complement the system transformation by building collaborative problem solving. In this line, associative processing methods, such as interviews and surveys, have been discussed for their ability to delve into knowledge-based data and monitor the nature, significance, and influence of personal experience on climate change adaptation.

Agent-Based Models (ABM) can include feedback between social and physical environments, define individuals’ narratives, and map the social network with agents’ interactions. This proposal aims at presenting a transdisciplinary approach that integrates survey data, with behavior and agrohydrological modelling in order to support policy-makers and managers to understand and re-think water management and climate change policies at the regional scale, which is essential to address climate change risks. From a system dynamics perspective, we characterize farmers’ risk aversion patterns and examine how ABMs can most effectively integrate these insights to increase robustness in decision-making processes while attending to farmers’ adaptive capacity. In the application to the case study of a large irrigated area in northern Italy, we surveyed 460 farmers to deepen a triple loop analysis on climate change awareness, perceived impacts, and adaptation measures and barriers. Statistics and computer-assisted data analysis were applied to gain insights from farmers’ profiles and risk perception. We included the profiles in an ABM coupled with a distributed agrohydrological model that covers the whole irrigated area. We expect farmers’ profiles influence agents’ risk perception and their ultimate decision on the adopted crop types and irrigation methods. Provisional results indicate that the approach can provide new insights across complexity in modelling farmers’ behavior and human adaptation to climate change and enrich the discussion about the gaps and benefits of including qualitative data in ABM.

How to cite: Ricart, S., Gazzotti, P., Ferrari, L., Gandolfi, C., and Castelletti, A.: Integrating farmers' risk aversion in climate change behavioral modelling to improve decision-making processes, EGU General Assembly 2023, Vienna, Austria, 23–28 Apr 2023, EGU23-4388, https://doi.org/10.5194/egusphere-egu23-4388, 2023.

EGU23-5644 | Posters on site | HS5.1

The Circular Economy of Water -  Developing a Strategy to Transition to a Water Smart Society 

Liam McCarton, Sean O'Hogain, and Ahmed Nasr

Many countries have implemented universal metering, increased water tariffs, delivered comprehensive demand management campaigns and reduced mains water network leakage rates. The next frontier in innovation is implementing a Circular Economy of Water (CEW). This is where used water is reused (without treatment), recycled (with treatment) and/or valuable products embedded within the used water stream are recovered and reused within different processes. Understanding the potential to supplement mains water with fit for purpose water is critical to implementing a CEW. However, there are limited studies which quantify micro component household water use in Ireland and Europe. This study sets out to address this gap in knowledge. The results presented in the paper show that for every 100 L of potable mains water supplied daily, 28 L was flushed down the toilet, 22 L was used in the hot water system, 17 L was supplied to cold water taps for personal hygiene uses and 33 L was used in the kitchen.  By proving that water supplied is utilised by different micro-components of a domestic household and through quantifying the amount consumed by each micro-component, the author justifies the concept of fit for purpose water, where function governs quality. The authors propose a Circular Economy of Water hierarchy focused on Reduce, Reuse, Recycle and Recover. A detailed twelve-step strategy is suggested to facilitate this transition to a water smart society. 

How to cite: McCarton, L., O'Hogain, S., and Nasr, A.: The Circular Economy of Water -  Developing a Strategy to Transition to a Water Smart Society, EGU General Assembly 2023, Vienna, Austria, 23–28 Apr 2023, EGU23-5644, https://doi.org/10.5194/egusphere-egu23-5644, 2023.

EGU23-5695 | Orals | HS5.1

Computationally inexpensive robust design of run-of-river hydropower plants 

Veysel Yildiz, Solomon Brown, and Charles Rougé

Run of River hydropower plants (RoR) are characterised by a negligible storage capacity and by generation almost completely dependent on the quantity and variability of river flows. RoRs designed today will be deployed in a world characterised by a changing climate and uncertain economic conditions (electricity prices, interest rates, cost overruns). Investments need to be financially robust to these perturbations, but both design optimisation and robustness analyses traditionally incur large computing times and resources to explore a large range of potential futures. This hinders widespread uptake of these methods, and the emissions associated with large computing costs mitigate the environmental benefits of an otherwise renewable energy source.

Here we demonstrate a computationally inexpensive method for the optimisation (including multi-objective optimisation) and robustness analysis of run-of-river plants. It is based on the remark that the daily flow duration curve (FDC) can be approximated by a limited number of points, supporting a much faster evaluation of performance for a given FDC. Our method carries out the following steps:  (1) we approximate the daily FDC with N regularly spaced points, (2) we couple a multi-objective evolutionary algorithm with our state-of-the-art toolbox to optimise technical and financial indicators of performance, (energy production and economic profit) and generate design alternatives, (3) we sample uncertain factors to generate an ensemble of plausible future states of the World (SOWs), (4) we approximate the future FDC of each ensemble member with N points, (5) we quantify the robustness of selected alternative designs across the entire ensemble of SOWs.

We test our method with N=25, 50, 100, 250 and 500 points. We compare these results with traditional analysis (TA) done without approximating the FDC, and evaluated the trade-off between quality of results and required computational resources. Computational time required for performing optimisation with historical record (27 years of daily discharge) using 100,000 function evaluations is reduced by 98% and 92% for N = 25 and 500 respectively. The resulting Pareto optimal set has a good diversity and hypervolume performance for N ≥ 50 points is close (> 95%) to that of the set found by using 1,000 years of synthetic data for the optimisation. Likewise, the time required for analysing robustness across S = 500 SOWs is 98% less than TA in which we use an HPC platform and take 1,000 (synthetic stream flow) years into account. The performance evaluation of alternatives across the entire ensemble of SOWs is very similar to the robustness values based on TA. These preliminary results suggest that optimisation and robustness analysis can be performed with the proposed methodology for RoRs by using far less computational resources.

How to cite: Yildiz, V., Brown, S., and Rougé, C.: Computationally inexpensive robust design of run-of-river hydropower plants, EGU General Assembly 2023, Vienna, Austria, 23–28 Apr 2023, EGU23-5695, https://doi.org/10.5194/egusphere-egu23-5695, 2023.

EGU23-8697 | Posters virtual | HS5.1

Risk-based flood and drought management for multiple reservoirs in a non-stationary climate: application to the Seine River 

David Dorchies, Olivier Delaigue, Idris Kahiyeh-Moumin, Florian Ricquier, and Guillaume Thirel

Mitigation of drought and flood rely on objectives that are often a combination of several flow thresholds to be respected for different locations downstream the reservoirs. In this context, multi-objective optimisation techniques quickly show their limits due to the curse of dimensionality (Bellman, 1957). To tackle this issue, we propose an approach in which we first evaluate the risk of non-achievement of each objective independently for a given climatology and a given state of the system. Then, we derive management rules by prioritising the riskiest objectives in the daily decision making.

This approach is applied on the Seine catchment (located in the North of France), which is equipped with a system of four large reservoirs to protect against floods and water shortages multiple locations downstream including the Paris region.

First, catchment naturalized flows are modelled at a daily time step with a semi-distributed GR4J model based on the R package airGRiwrm (Dorchies et al., 2022) and forced by 11 GCM/RCM scenarios for both RCP4.5 and RCP8.5 between 1950 and 2100.

Then, these flows are used to assess the risk of non-achievement of each objective taking into account the current reservoir volume, the day of the year and a selection of climate scenarios and periods. This assessment is derived from the statistical distribution of the minimum (resp. maximum) volume required in the reservoirs for a given drought (resp. flood) objective calculated by a single objective dynamic programming optimisation. The result of this assessment is available to the public through an interactive Shiny interface (http://irmara.g-eau.fr) that allows to experiment management scenarios in real time.

Finally, management rules are derived by prioritising the riskiest objectives and balancing proactive and reactive decisions taking into account a hedging policy. The performance of this management is compared to the current management of the reservoirs over the historical and future periods.

This approach has the advantage of providing a decision based on a risk assessment and prioritisation process that allows the manager to justify the decision and paves the way for an operational application.

References

Bellman, R. Dynamic programming. Princeton, N.J.: Princeton University Press, 1957.

Dorchies, David, Olivier Delaigue, et Guillaume Thirel. « airGRiwrm: Modeling of Integrated Water Resources Management based on airGR. R Package version 0.6.1 ». Portail Data INRAE, 7 mars 2022. https://doi.org/10.15454/3CVD1I.

How to cite: Dorchies, D., Delaigue, O., Kahiyeh-Moumin, I., Ricquier, F., and Thirel, G.: Risk-based flood and drought management for multiple reservoirs in a non-stationary climate: application to the Seine River, EGU General Assembly 2023, Vienna, Austria, 23–28 Apr 2023, EGU23-8697, https://doi.org/10.5194/egusphere-egu23-8697, 2023.

EGU23-8971 | ECS | Posters on site | HS5.1

Institutionalizing river basin management in Central Asia 

Aliya Assubayeva, Jenniver Sehring, and Bota Sharipova

Since the dissolution of the Soviet Union, fundamental water governance reforms have been introduced in Central Asia, here referring to Kazakhstan, the Kyrgyz Republic, Tajikistan, Turkmenistan, and Uzbekistan. One major reform effort, aligned with the dominant global discourse and promoted by international donors, has been the reorganization of governance arrangements according to the river basin management. This approach aims to consider the water needs of multiple stakeholders and sectors in a holistic water policy and planning.  Creating new governance mechanisms is always inherently political as it entails decisions on mandates, funding, and decision-making power.

In this paper, we attempt to understand better the politics of institutionalizing river basin management in Central Asia. We focus on the national and sub-national levels and look specifically at the establishment of basin organizations to replace earlier administrative management units and the establishment of basin councils for stakeholder participation. For this, we reviewed academic literature and policy reports and conducted semi-structured interviews with national and international experts.

The results show that the differences in perception of water problems signal an overall different understanding of the needs to change water governance approaches. The cases of Kazakhstan and Tajikistan reveal that institutionalization of river basin management can work when donor support and national ownership come together, and the lead water agency has the power to coordinate both international and national actors. Stakeholder participation through basin councils is still only partially implemented and weakened by the political culture of the countries. Nevertheless, examples indicate that basin councils are also used for bottom-up cooperation and communication, discussion, and solution of the water problems and, with incentives from donors, are slowly opening up for more diverse membership.

The paper shows that in the politics of water governance in Central Asia, the interests and activities of national and international actors are closely interwoven. The exposure to global discourses and good water governance norms promoted by international donors fostered legal changes in all countries of the region but were embraced in various degrees. Ultimately, depending on the capacities and commitment (or opposition) of national actors, the institutionalization of river basin management plays out differently in each country. River basin management was at the core of many of such donor projects as well on the top of some government agendas. Donors are criticized for limited coordination among themselves, lack of knowledge of the regional context, and transfer of global blueprints with insufficient adaptation to local realities. On the side of Central Asian countries, the political and socio-economic context, weak institutions, and limited capacity of national water agencies are often mentioned as unfavorable for implementing reforms that aim for decentralization and participation.

How to cite: Assubayeva, A., Sehring, J., and Sharipova, B.: Institutionalizing river basin management in Central Asia, EGU General Assembly 2023, Vienna, Austria, 23–28 Apr 2023, EGU23-8971, https://doi.org/10.5194/egusphere-egu23-8971, 2023.

EGU23-9340 | ECS | Orals | HS5.1

Adaptive river system and economy-wide planning framework for Nile water resources management 

Mohammed Basheer, Victor Nechifor, Alvaro Calzadilla, and Julien Harou

Climate change is projected to affect precipitation and evapotranspiration over the Nile Basin, resulting in modifications to streamflow, irrigation water demands, and evaporation from open water bodies. Future socioeconomic pathways are a key input to climate change projections as they incorporate assumptions regarding economic systems through population and economic growth and climate policies. However, there are huge hydrological and socioeconomic uncertainties and the complex interlinkages of the climate, hydrological, river, and economic systems represent a challenge for planning a resilient future. This study introduces a planning framework for designing adaptive management plans for the Nile infrastructure system. The framework combines climate change projections from CMIP6, a semi-distributed hydrological model, a river infrastructure system model, economy-wide models of Ethiopia, Sudan, and Egypt, and a multiobjective design algorithm. The framework's hydrological, river system, and economy-wide components are linked to the climate projections, ensuring coherence in socioeconomic development. The multiobjective design algorithm provides the ability to search for efficient adaptive management plans for Nile infrastructures. The adaptive planning framework was used to design efficient options for an adaptive management policy of the Grand Ethiopian Renaissance Dam (GERD), considering economy-wide and river system interests of Ethiopia, Sudan, and Egypt in 2020-2045. We compared the performance under the adaptive policy designs to the performance under a recent proposal discussed in Washington, D.C. Results show that under an example compromise solution, the mean discounted real GDP increases by 0.77, 0.67, and 0.18 billion USD in 2020-2045 for Ethiopia, Sudan, and Egypt, respectively, compared to the Washington Draft Proposal. These economic benefits are higher in extreme climate projections, with rises in discounted real GDP of up to 15.8, 6.3, and 3.0 billion USD over 2020-2045 for Ethiopia, Sudan, and Egypt, respectively.

How to cite: Basheer, M., Nechifor, V., Calzadilla, A., and Harou, J.: Adaptive river system and economy-wide planning framework for Nile water resources management, EGU General Assembly 2023, Vienna, Austria, 23–28 Apr 2023, EGU23-9340, https://doi.org/10.5194/egusphere-egu23-9340, 2023.

EGU23-10136 | ECS | Orals | HS5.1

Potential Greenhouse Gas emissions reductions from simple changes to residential showering 

Xiaohong Liang, Steven Kenway, Julijana Bors, Andrew Radion, and Francis Pamminger

As part of the Net Zero Carbon Water Cycle Program (NZCWCP) for Victoria state in Australia, we have sought to understand the potential to reduce household energy consumption and related Greenhouse Gas (GHG) emissions by influencing water use. Digital metering data disaggregated into 57 million discrete water usage events across 105 households at a resolution of 10 millilitres at 10 second intervals from June 2017 to March 2020, from a previous Yarra Valley Water (Melbourne, Australia) study, was analysed, together with the dynamic relationship between the multiple energy sources (natural gas, grid electricity, solar) used to heat water for showers in each hour of the day. Water-related energy (WRE) use, including water desalination and treatment, pumping, heating, wastewater collection and treatment, comprised 12.6% of Australia’s primary energy use in 2019. Water heating (by natural gas and electricity) comprised the largest component of WRE use for across residential, commercial, and industrial sectors. Furthermore, 69% of Victoria’s total water usage was by residential customers in 2020-2021. WRE GHG emissions were around 3.8% of Victoria’s total GHG emissions in 2018. Showers (~50% of residential WRE), system losses (~27% of residential WRE), and clothes washers (~9% of residential WRE) are the three largest components of WRE consumption. The main objective of this work is the creation of industry-accessible tools to improve knowledge and management options from the understanding of reductions in cost and GHG emissions from household showering WRE use. Potential options considered, to reduce water and energy use, as well as associated GHG emissions and customer utility bills, include (a) behaviour management such as water and energy pricing to change time of use behaviours, and (b) the adoption of efficient shower head improvements. Shower WRE and GHG emissions were found able to be strongly impacted by small changes in daily routines. GHG emissions reduction from showering could be reduced up to 20 (in summer) - 22% (in winter) by shifting demand time of showering or replacing residential showerheads. Extrapolated to state and Australian scales, reductions in water usage could be up to 14 GL (Victoria) and 144 GL (Australia), and reductions in GHG emissions 1,600 ktCO2eq (Victoria) and 17,300 ktCO2eq (Australia). It provides fundamental new information which could inform a suite of new management options to impact water-related energy from showers, and related GHG emissions and customer water and energy cost.

How to cite: Liang, X., Kenway, S., Bors, J., Radion, A., and Pamminger, F.: Potential Greenhouse Gas emissions reductions from simple changes to residential showering, EGU General Assembly 2023, Vienna, Austria, 23–28 Apr 2023, EGU23-10136, https://doi.org/10.5194/egusphere-egu23-10136, 2023.

Significant climate variations have decreased the stability of water resource systems, leading to multiple uncertainties in streamflow response, reservoir operation optimization, decision-making, and adaptive adjustments for water resource scheduling. Understanding the impact of climate change on reginal streamflow is necessary and crucial to identifying reservoir operation strategies and decision-making responses. In this study, we created an integrated systematic “uncertain streamflow responses”– “reservoir operation”– “optimization”– “decision-making risk analysis” chain. Three bias-corrected and downscaled general circulation models (GCMs) were used to analyze the inter-model uncertainties under three representative concentration pathways (RCPs). The streamflow responses and uncertainty in the future were determined using a distributed hydrological model and the fuzzy extension principle under predefined scenarios and uncertainty levels. Then, a stochastic simulation model and modified stochastic multi-criteria decision-making model were applied to identify the effects of climate change projections and streamflow responses on reservoir multi-objective operation and decision-making. Moreover, risk quantification indices were used to determine the uncertainty propagation and potential risks accumulated in the chain. We applied this framework to cascade reservoirs in the Qing River Basin. The results indicate that the mean annual streamflow projected using selected GCMs will increase, enhancing the hydropower response and weakening the ecological benefit response. The Pareto non-dominated solutions optimized based on the streamflow projections obtained using the GCMs (under the same RCP) and hydrological model are more distinct than those based on different RCPs and the same GCM. Moreover, a high emission scenario may increase the uncertainty of the streamflow projections and reservoir operation responses, which is consistent with the finding that the decision-making process becomes more variable and sensitive with increasing streamflow uncertainty. Finally, we identified the preferred solutions for reservoir operation under different uncertainties, the respective expected values, and the 95% confidence interval bands to enhance the adaptability of future reservoir operation.

How to cite: Yang, Z. and Wang, Y.: Multi-Objective Operation- Decision-Making-Risk Propagation Analysis for Cascade Reservoirs Affected by Future Streamflow Process Variations, EGU General Assembly 2023, Vienna, Austria, 23–28 Apr 2023, EGU23-10603, https://doi.org/10.5194/egusphere-egu23-10603, 2023.

EGU23-10605 | ECS | Orals | HS5.1

Climate whiplash in California: too much to bear, too little to handle? 

Gustavo Facincani Dourado, David E. Rheinheimer, John T. Abatzoglou, and Joshua H. Viers

Inter- and intra-annual water availability is naturally highly variable in Mediterranean regions, with swings between extremes costing nations potentially billions of dollars in damages and threatening lives. In California, future projections foresee an increase in the bimodal distribution of hydrological extremes, leading to greater hydroclimatic whiplash. Here, we quantify the relative impact of hydroclimatic whiplash on hydropower systems, flood control and water deliveries in the Central Sierra Nevada, California. We aim to explore at what point these services become less resilient to drought, and if wet whiplash years can re-establish an ‘average’ system state. To represent a wide range of wet, dry and dry-to-wet transitions, we sampled water years from upper (floods) and lower (droughts) quintiles, with replacement, across 30 years of future streamflow projections (2030-2060) from 10 global circulation models. Synthetic hydrological sequences of 2 to 5 dry years, followed by 1 to 2 wet years form a total sample of 200 whiplash sequences for the Stanislaus, Tuolumne, Merced and Upper San Joaquin River basins. This stress test indicates that the intensification of whiplash cycles would seriously challenge existing hydropower production, water storage and flood control operating rules. Compared to baseline averages, all basins had negative impacts on hydropower generation, with losses varying from 6% in the Merced to almost around 67% in the Upper San Joaquin, depending on the whiplash sequence. Agricultural and/or urban demands are most impacted in the Tuolumne and the Upper San Joaquin, in particular for all sequences. Historically, this basin has had more than 70% of outflows delivered to irrigation districts, therefore whiplash sequences tend to disrupt these services more easily. Meanwhile, carryover storage is negatively affected in all basins, but more noticeably in the Merced and Stanislaus basins, with losses of 7-60% and 15-31%, respectively, due to their small overall storage capacity. The small reservoirs in the upper watersheds and inflexible operating flood control rules constitute a challenge to accommodate whiplash impacts in the region. These results show heterogenous sensitivities of flood control releases, environmental flows and agricultural/urban deliveries with projected climate whiplash conditions, with varying degrees of annual, time and volumetric reliability. These services compete for scarce water supply within the low-elevation terminal dams in each basin. This analysis identifies perspectives on the challenges and risks of regional climate whiplash effects and adaptation strategies to include extremes and their impacts on water allocation to human and environmental purposes.

How to cite: Facincani Dourado, G., Rheinheimer, D. E., Abatzoglou, J. T., and Viers, J. H.: Climate whiplash in California: too much to bear, too little to handle?, EGU General Assembly 2023, Vienna, Austria, 23–28 Apr 2023, EGU23-10605, https://doi.org/10.5194/egusphere-egu23-10605, 2023.

EGU23-11888 | ECS | Posters on site | HS5.1

Optimisation management of multi-purpose reservoir in the dry season: case study of Hoa Binh reservoir, Viet Nam 

Hai Yen Nguyen, Le Long Ngo, Minh Cat Vu, Le An Ngo, Thi Hien Nguyen, Tewelde Hagos Gebremedhin, Marco Peli, and Roberto Ranzi

Reservoir operation is a complicated problem to cope with regarding the complexities and the conflicts among the different stakeholders interest. The study presents the set of operating policies for a multi-purpose reservoir, case study of Hoa Binh reservoir, Viet Nam, focusing on two main objectives: Hydropower and Irrigation demand in the dry season, when the other main target, i.e. the flood control, is less crucial. In addition, another environmental objective under consideration for the dry season is the discharge needed to limit the salinity intrusion into the Red river delta surface water. This is a somehow novel objective to be taken into account when climate change scenarios, observed and projected sea level rise and saline intrusion are considered. The weight of this objective compared to the other ones can be set according to the policy adopted. The study is based on an evolutionary algorithm, namely Genetic Algorithm (GA) to find a Pareto optimal set under different scenarios. The results offer more flexible policies where the reservoir operator may see the trade-off between objectives to decide which is more suitable with the instant interest. Finally, it is shown that the GA model is promising to improve the performance of reservoir operation compared to strict regulations, which are now applied.

How to cite: Nguyen, H. Y., Ngo, L. L., Vu, M. C., Ngo, L. A., Nguyen, T. H., Gebremedhin, T. H., Peli, M., and Ranzi, R.: Optimisation management of multi-purpose reservoir in the dry season: case study of Hoa Binh reservoir, Viet Nam, EGU General Assembly 2023, Vienna, Austria, 23–28 Apr 2023, EGU23-11888, https://doi.org/10.5194/egusphere-egu23-11888, 2023.

EGU23-12160 | ECS | Posters on site | HS5.1

Build and evaluate climate change adaptation with a parsimonious integrated agro-hydrological model over a catchment in northeastern France 

Myriam Soutif-Bellenger, Guillaume Thirel, Sara Fernandez, and David Dorchies

Considering the emergency to adapt agriculture to climate change, it seems essential to develop generic tools to build and evaluate potential solutions. We combine here a prospective based on stakeholders’ interviews and an integrated agro-hydrological model to evaluate the impacts of scenarios on the Seille catchment in 2050. The prospective and stakeholders’ interviews aim at understanding agriculture and water management drivers on the modelled catchment and designing appropriate inputs for future scenarios modelling. The model simulates flows at a daily time step with GR rainfall-runoff models, and simulates daily irrigation demand thanks the to single Kc method of FAO, allowing estimating hydrological and agronomic impacts of climate change and scenarios. The integration of the two models is made thanks to the airGRiwrm package. Depending of the research advancement, results of simulations in a climate change context and conclusions about climate change impacts for designed scenarios will be presented.

How to cite: Soutif-Bellenger, M., Thirel, G., Fernandez, S., and Dorchies, D.: Build and evaluate climate change adaptation with a parsimonious integrated agro-hydrological model over a catchment in northeastern France, EGU General Assembly 2023, Vienna, Austria, 23–28 Apr 2023, EGU23-12160, https://doi.org/10.5194/egusphere-egu23-12160, 2023.

EGU23-13649 | ECS | Orals | HS5.1

Climate change adaptation through integrated management of water reuse technologies 

Matteo Sangiorgio, Enrico Weber, Davide Cananzi, Jazmin Zatarain Salazar, Marco Micotti, and Andrea Castelletti

The integrated management of water reuse technologies and their coordination with the operations of the other water system components are fundamental to fully exploit the reuse potential. Yet, these technologies are usually designed considering their individual parameters (e.g., efficiency, durability, maintenance costs, energy consumption), more than the integration with traditional water management practices, and the impacts on the final users at the system scale.

Here, we adopt a portable framework based on optimal control methods and machine learning to evaluate the cross-sector impacts of water loops. The framework is developed for the Apulia Region, Southern Italy, a drought-prone area characterized by the presence of a complex water distribution network and multiple conflicting users across agricultural districts, industry, and drinking water supply.

The robustness of each adaptation strategy is comprehensively investigated through a scenario-based approach, including the analysis of climatic, socio-economic (drinking, irrigation, and industrial water demand pattern), legal (environmental flow constraints), and technological (water reuse implementation) aspects.

Results show that the combined effect of climate and socio-economic changes will dramatically affect the Apulia water system, leading to unsustainable pressure on freshwater resources. In addition, the implementation of the environmental flow constraints will further reduce the operation space. Future water deficit is thus expected to increase at half-century (2050-2059) as well as in the long-term (2090-2099), especially under the more extreme climate projection (RCP 8.5).

Results also show that water reuse actions remarkably improve the situation, but the effect is only partial and far from entirely closing the gap with the current situation. This means that the specific adaptation actions here adopted are not sufficient and that it is necessary to further promote the spread of the reuse technologies and increase their efficiency.

The proposed framework is a decision support system that aims at assisting policy-makers in the transition to a circular water economy by integrating water management and treatment-reuse technologies.

How to cite: Sangiorgio, M., Weber, E., Cananzi, D., Zatarain Salazar, J., Micotti, M., and Castelletti, A.: Climate change adaptation through integrated management of water reuse technologies, EGU General Assembly 2023, Vienna, Austria, 23–28 Apr 2023, EGU23-13649, https://doi.org/10.5194/egusphere-egu23-13649, 2023.

EGU23-14904 | ECS | Orals | HS5.1

Reusing reclaimed water for irrigation: sustainability solution to alleviate growing water scarcity under climate change? 

Imen Arfa, Maria Blanco, and Adrián González-Rosell

Climate change and increased pressure on natural resources have been identified as some of the major challenges that will affect Europe in the coming decades. This will cause consequences such as migration, food price shocks, water scarcity and imbalances in energy markets. Food and energy security require large amounts of fresh water. Water is one of the essential resources in both sectors, acting as a crucial driver for irrigation. The demand for natural resources is likely to increase over the coming decades due to growing global population numbers and economic development. At the same time, climate change may lead to lower overall water availability. Consequently, water scarcity, variability and uncertainty are becoming more prominent, which could lead to vulnerabilities within the energy and food sectors. In this sense, The EU is promoting initiatives to address water scarcity, such as investments to improve water use efficiency and the reuse of wastewater for irrigation. The objective of this research is twofold. Firstly, we assess the impact of changes in irrigation water availability, crop water requirements and yields under climate change on EU agriculture. Secondly, we analyse how promoting the reuse of treated water for agriculture may contribute to the reduction of water stress in coastal areas.

Using agro-economic modelling (CAPRI), we implement climate change scenarios (RCP7.0 and RCP8.5) - taking into account not only yield changes but also changes in irrigation water availability and crop water requirements - to assess the impact of climate change on agricultural production and water stress across EU regions (NUTS2 regions). Furthermore, to capture the contribution of water reuse for irrigation to mitigate climate change impact on water scarcity, we simulate scenarios with increased treated water potential as an additional water supply at NUTS 2 level.

Results provide insights into how climate change impacts agricultural production, food prices and international trade. For example, irrigation water availability limitations with a reduction in crop yields in some heavily irrigated Southern regions could necessitate reversion of cropland from irrigated to rainfed management. However, climate change could lead to increased irrigated cropland in some less water stressed regions. The reuse of reclaimed water is an opportunity to favour the management and efficient use of water resources and can be a solution to water deficit problems. Model results reveal the potential of treated water as an alternative supply source to address water stress and promote sustainable water management under climate change in the EU provided that some conditions are met. It is necessary to invest in the construction of purification infrastructures in areas where there is no control of discharges, as well as in infrastructures that bring this water closer to the consumers. A price competitive with traditional water sources must be achieved in order for its use to become widespread. It is essential to achieve consumer acceptance of the product obtained through the use of reclaimed water, influencing farmers’ decision-making.

Acknowledgements:  This research has received funding from the European Union’s Horizon 2020 research and innovation programme under the GoNEXUS project (grant agreement No 101003722). 


How to cite: Arfa, I., Blanco, M., and González-Rosell, A.: Reusing reclaimed water for irrigation: sustainability solution to alleviate growing water scarcity under climate change?, EGU General Assembly 2023, Vienna, Austria, 23–28 Apr 2023, EGU23-14904, https://doi.org/10.5194/egusphere-egu23-14904, 2023.

EGU23-15271 | Posters on site | HS5.1

Water Efficient Allocation in a Central Asian Transboundary River Basin 

Jingshui Huang, Max Linsen, Timo Schaffhauser, and Markus Disse

Mountainous regions in Central Asia are vulnerable to the consequences of climate change. Making appropriate decisions for the allocation of water over communities, the environment and key economic sectors, such as agriculture and energy, is increasingly challenging due to economic and population growth as well as climate-induced changes in hydrological regimes in Central Asia’s main transboundary river basins. The Water Efficient Allocation in a Central Asian Transboundary River Basin (WE-ACT) Project proposes establishing a climate-sensitive Decision Support System for water allocation in two sub-catchments of a transboundary river basin in Central Asia, namely the Naryn and Kara Darya catchments of the Syr Darya River Basin (covering parts of Kyrgyzstan and Uzbekistan). Based on an innovative water information system that captures a thorough understanding of water availability, demand, footprint and allocation in a glacier-fed river basin, WE-ACT will enable water managers to interact with an accessible and intuitive DSS to alleviate water stress for communities, the economy and the environment on the short- and long-term. WE-ACT will enable them to adapt the allocation of water resources to the known and expected effects of climate change, while encouraging the improvement of policies to correctly set water tariffs, reduce water footprints and increase water use efficiency in agriculture and energy sectors. The backbone of the project is a reliable data supply chain based on real-time monitoring, integrated water demand-, availability- and use modelling approach, machine-learning, and data storage in a transboundary context. This will be matched with an in-depth understanding of water policies and priorities that face increasing pressures of climate change, growing demand and water dependency. End-users of the project outcomes (hydrometeorological stations, integrated models, DSS for water allocation) will be carefully mapped, invited, involved, and trained to establish and use meaningful results from the outset of the project.

How to cite: Huang, J., Linsen, M., Schaffhauser, T., and Disse, M.: Water Efficient Allocation in a Central Asian Transboundary River Basin, EGU General Assembly 2023, Vienna, Austria, 23–28 Apr 2023, EGU23-15271, https://doi.org/10.5194/egusphere-egu23-15271, 2023.

To improve the effectiveness of water management policies aimed at water conservation, human behaviour and public preferences regarding water availability and supply are expected to play a key role but must be better understood. Water scarcity status can strongly influence stakeholders’ support for water resources management and significantly drive public willingness to pay (WTP) for water conservation measures. To account the full benefits of adopting conservation measures to improve urban water security, it is of paramount importance to understand what prevents people from investing in practices that protect and improve water yield in basins responsible for their water supply.

The main objective of this study is to inform water conservation programs in Brazil about public preferences for improving water security aspects (i.e., water supply and conservation measures) in the basins feeding water to urban city centers. To also test for possible influence of water scarcity experiences on public preferences for conservation measures and water security aspects, a choice experiment was carried out in two capital cities in Brazil that have faced different water restrictions and rationing efforts: the Metropolitan Region of Sao Paulo and Campo Grande city. We interviewed 400 people in each city in November 2021, and simple multinomial logit models using Apollo in R were used to estimate WTP for the reduction of the frequency and duration of future water shortages, as well as three different conservation practices: agroforestry, afforestation, and water harvesting technologies.

A model is estimated for each city, the Metropolitan Region of Sao Paulo (MRSP) and Campo Grande, as we wanted to test whether the different public experiences with water use restrictions and rationing lead to a different public WTP for water conservation measures. In both samples, the status quo alternative significantly decreased respondents’ utility, indicating an avoidance of the current water security status even though the respondents faced different water shortage experiences in each city. Twice as many residents in MRSP (77%) in the survey faced at least one episode of water restriction in the last decade than Campo Grande residents (36%). As a result, a decrease in the duration of water supply interruption has a significant effect on the respondents’ utility, considering the model estimated for the MRSP. In contrast, a reduction in the frequency of future water shortages was not significant. In Campo Grande, none of the attributes related to water security significantly impacted public preferences. Only the proposed measures had a significant influence on the utility of the respondents form Campo Grande. Our findings indicate that previous experiences with water scarcity affects not only the preferences for conservation initiatives, but also whether society perceives that these measures contribute to improving the water security. This study provides insightful information to policymaking for effective initiatives to improve water security with the involvement of society. Unveiling people’s preferences for water conservation practices and improvements in water availability and supply is fundamental to promote protection and conservation of water ecosystem services provided by river basins and, consequently, improve current and future water security.

How to cite: Sone, J., Wendland, E., and Brouwer, R.: Using choice experiment to inform water conservation initiatives under different water scarcity backgrounds to improve water security, EGU General Assembly 2023, Vienna, Austria, 23–28 Apr 2023, EGU23-15603, https://doi.org/10.5194/egusphere-egu23-15603, 2023.

EGU23-16061 | ECS | Posters virtual | HS5.1

Discovering future vulnerabilities of the Jucar River Basin under climate change 

Irene Galbiati, Matteo Giuliani, Hector Macian-Sorribes, Manuel Pulido-Velazquez, and Andrea Castelletti

Today the management of water systems requires robust policies capable of withstanding deviations from the conditions for which they were originally designed due to the large degree of uncertainty about future inflows and water demands. Under evolving and deeply uncertain hydroclimatic inputs, the performance of these systems may degrade to a point where they become unable to meet the primary objectives for which they were built, potentially causing declines in water resource system performance or even complete system failure.

Here we present a Multi-Objective, Robust Decision Making analysis applied to the case study of Jucar river basin in Spain, where the balance between water demand and available resources is already precarious. As in most Mediterranean basins, climate change is expected to further reduce water availability, increasing the intensity of drought episodes, and challenging the long-term sustainability of water use. Using a hydroeconomic model of the basin, we assessed the performance of the current system’s operations in terms of agricultural and hydropower benefits, along with ecosystem services under different CMIP6 scenarios over the time horizon 1980-2100. These climate projections are then synthetically perturbed to generate a larger ensemble of future scenarios, which is used to complement the robustness analysis and identify via scenario discovery the most critical drivers under which the system is expected to fail.

Preliminary results using the nominal IPCC scenarios indicate substantial system vulnerabilities emerging over the next decades, especially under the pessimistic SSP5-8.5 projection. These findings suggest the need of identifying candidate adaptation options to be triggered according to the future evolution of the system in order to ensure a timely adaptation of water management strategies to future changes.

How to cite: Galbiati, I., Giuliani, M., Macian-Sorribes, H., Pulido-Velazquez, M., and Castelletti, A.: Discovering future vulnerabilities of the Jucar River Basin under climate change, EGU General Assembly 2023, Vienna, Austria, 23–28 Apr 2023, EGU23-16061, https://doi.org/10.5194/egusphere-egu23-16061, 2023.

EGU23-16758 | Orals | HS5.1

Developing Drought Indicators for Assessing Multi-Sectoral Impacts Using a Systems Approach 

Alvar Escriva-Bou, Michael Dettinger, Jeffrey Mount, and Annabelle Rosser

California’s water storage and conveyance infrastructure—called the “water grid”—serves as a hedge against droughts. However, water operations—and more broadly the role of humans in reshaping drought risk and socio-environmental impacts—are usually not considered in characterizing drought status. The overall goal this project is to develop a framework for linking drought hazard indicators with sector-specific impacts in highly managed water storage and conveyance systems, such as those of the American West. To achieve this goal we have developed sector-specific drought hazard indicators for California that take into account water availability considering the built infrastructure, and management operations from both local and more distant water sources. After obtaining drought hazard indicators, we show case studies developing drought impact risk profiles for four sectors—agriculture, cities, small communities, and the environment—that reflect the capacity of these different sectors to respond and adapt to drought conditions.

One of the most innovative parts of this project is the co-development of decision support tools. Working with five different stakeholder advisory groups—science, agriculture, cities, small communities and environment—we are identifying the usefulness of the indicators, and thresholds and triggers that can be tailored for local, state, and federal drought response.

To conclude we will discuss the benefits and challenges of the current methodology, including data availability, the challenges associated with non-stationarity, and the co-development process with stakeholders.

How to cite: Escriva-Bou, A., Dettinger, M., Mount, J., and Rosser, A.: Developing Drought Indicators for Assessing Multi-Sectoral Impacts Using a Systems Approach, EGU General Assembly 2023, Vienna, Austria, 23–28 Apr 2023, EGU23-16758, https://doi.org/10.5194/egusphere-egu23-16758, 2023.

EGU23-133 | ECS | Posters on site | HS5.3

Adoption of rainwater harvesting systems for agricultural irrigation to improve water management 

Juan F. Velasco Muñoz, Belén López Felices, Gabriella Balacco, and José A. Aznar Sánchez

In many production areas, water is the main limiting factor for agricultural development. The consequences of global climate change, population growth, changes in land use and overexploitation due to economic growth have caused water resources to be subject to severe degradation. As the main consumer of water resources, water use in this sector is of great importance. However, the wide variety of stakeholders and the need for food supply make the management of agricultural systems very complex. In this context, it is necessary to incorporate water management practices and technologies that contribute to the sustainability of agricultural activity. To ensure the success of these practices, their choice and adoption must take into account the interests of different stakeholders. Therefore, the first objective of this work is to identify the sustainable water management practices that are best suited to the context of the study area, as well as the main barriers and facilitators to their incorporation. For this purpose, several qualitative research tools are used in consecutive phases (literature review, in-depth interviews, Delphi method and workshop). The results show that the most suitable practice for mainstreaming is rainwater harvesting (RWH). Facilitators for the adoption of this practice include the existence of farmer networks and access to the necessary technology, while installation costs and certain characteristics of the study area and farms act as main barriers. The second objective of this work was to identify the factors affecting farmers' decision to adopt RWH systems to use harvested water for agricultural irrigation. For this purpose, farmers in the study area were surveyed and a binary logistic regression model was carried out. The variables found to be significant in explaining farmers' behaviour were age, educational level, farm size, pond capacity and volume, income and level of environmental awareness.

How to cite: Velasco Muñoz, J. F., López Felices, B., Balacco, G., and Aznar Sánchez, J. A.: Adoption of rainwater harvesting systems for agricultural irrigation to improve water management, EGU General Assembly 2023, Vienna, Austria, 23–28 Apr 2023, EGU23-133, https://doi.org/10.5194/egusphere-egu23-133, 2023.

EGU23-609 | ECS | Orals | HS5.3

A New Weighted Modularity-Based Approach for DMA Demarcation in Large and Complex Water Distribution Networks 

Jyotsna Pandey and Venkata Vemavarapu Srinivas

Water distribution networks (WDNs) need restructuring/sectorization into District Metered Areas (DMAs) depicting smaller communities for ease in ensuring equitable water distribution and pressure management. DMA demarcation also helps in systems operation and management, apart from leak and contaminant localization. Many different strategies for DMA demarcation are in use, as none is established to be universally superior. Hence, there is ambiguity in the choice of a strategy for DMA demarcation. A WDN can be viewed as a complex network due to strong interconnections among its components and imposed limitations (being a 2D network). Against this backdrop, the recent decade witnessed the use of community detection approaches from complex network theory (CNT) for DMA demarcation. Community detection is a very basic yet pivotal task in the field of CNT. Modularity maximization is the most widely used approach for community detection. The modularity index defines the quality of the subgraphs or communities delineated from a network. In the case of a WDN, some nodes may be shared by more than one DMA, in which case the conventional and existing variants of the modularity index cannot be used for assessing the quality of the delineated DMAs. A more comprehensive community (DMA) detection procedure must incorporate such nodes with multiple associations among communities. Facilitating this, the present study proposes a comprehensive approach for DMA demarcation in large and complex WDNs considering a weighted modularity index. Edge weights are assigned to incorporate the hydraulic behaviour of a network and the association of nodes among various communities. The efficacy of the proposed approach vis-à-vis existing methods is demonstrated through a case study on a benchmark WDN. Effective demarcation of DMAs helps in their prioritization (based on the existing network level measures) to devise mitigation strategies for improving their performance.

How to cite: Pandey, J. and Srinivas, V. V.: A New Weighted Modularity-Based Approach for DMA Demarcation in Large and Complex Water Distribution Networks, EGU General Assembly 2023, Vienna, Austria, 23–28 Apr 2023, EGU23-609, https://doi.org/10.5194/egusphere-egu23-609, 2023.

EGU23-2449 | Orals | HS5.3

Copernicus services and data to support a sustainable and adaptive water resource management 

Alessandra Capolupo, Carlo Barletta, and Eufemia Tarantino

An effective, efficient, and sustainable allocation of resources has gained prominence on a global scale in recent years, taking into account far more than in the past the environmental needs of the ecosystems linked to them. Proper resource management and planning, as well as the detection of specific sustainable indicators, are required to respond to increasing demand while keeping in mind that its increase corresponds to a gradual reduction in the availability and usability of resources, which is also a result of climate change. This becomes even more important when the resource under consideration is water, which is essential for human survival and well-being as, after all, agricultural production. In comparison to other European countries, Italy has an abundance of meteoric inflows, albeit unevenly distributed across its entire territory. Because of this, the Italian country is particularly vulnerable to water crises, which are becoming more common, particularly in South Italy. The management of water resources, which is already complex, becomes even more so when dealing with scarcity situations, an area in which it is critical, to begin with the cognitive assumption of hydrological balance. Remote Sensing (RS) approaches are essential for investigating and assessing water bodies, meteoric inflows, and water balance parameters, allowing for effective surface water management support. RS is widely used for the aforementioned purposes due to the increasing availability of novel medium-high-resolution remote sensing big data, as well as Copernicus services and data related to water management (https://climate.copernicus.eu/water-management). Thus, the goal of this study is to take a "snapshot" of the current state of natural water resource availability in the Apulian region by extracting and estimating the main hydrological balance components introduced by the BIGBANG model (Braca et al., 2021) by exploiting Copernicus services and freely available medium-high resolution satellite data. Following the collection of all necessary input data, such as high-resolution Digital Elevation Model (DEM), Corine Land Cover maps, remote sensing-based soil sealing maps, mean monthly air temperature and rainfall, Google Earth Engine (GEE) environment, a free cloud platform recently released by Google to manage big geospatial data, were used to handle and estimate the main hydrological balance components. The proposed approach, based on the integration of Copernicus services and the BIGBANG model, appears as a useful and operational tool for supporting sustainable and adaptive resource management activities, particularly in water crisis situations. In fact, it allows extracting trustworthiness water balance components quickly.


How to cite: Capolupo, A., Barletta, C., and Tarantino, E.: Copernicus services and data to support a sustainable and adaptive water resource management, EGU General Assembly 2023, Vienna, Austria, 23–28 Apr 2023, EGU23-2449, https://doi.org/10.5194/egusphere-egu23-2449, 2023.

EGU23-4269 | Posters on site | HS5.3

Optimal Irrigation Water Allocation among Different Growth Stages 

Yu-Syuan Cai and Gene Jiing-Yun You

With the increasing impact of global climate change, the effective utilization of water resources become more and more important. Among different water use sectors, agricultural irrigation accounts for about 70% of global water use. Different from other water uses which can be utilized at any time, irrigation is not only a matter of quantity, it is more important to accurately schedule according to the water demand of crops. However, in many studies in the field of water resources or agriculture, the non-rejuvenation of crop growth is usually ignored when calculating crop yield. These studies usually simply assume that irrigation water is effective in each period, and finally add up the yield of each period as the total benefit of irrigation. To solve this problem, the study aims to explore the dynamic decision-making of irrigation schedules with the consideration of uncertainty under water scarcity. Considering the characteristics of crop growth, we propose an analytical model in the form of a max-inf problem to investigate a two-stage stochastic optimal allocation of water to maximize the yield expectations of the two stages. We first assume that the rainfall in the first stage is known, and the rainfall is described by a given probability distribution. With FAO 33, an empirical production function assessing the yield response to water, we need to apply the concept of max-inf to determine the expected yield. Accordingly, we found the optimal condition which maximizes the yield, satisfying a linear relationship between the probability of the first stage dominance and the water demand and yield response factor of the two stages. With this optimal condition, we can use the known crop water demand and yield response factor to estimate the probability of the first stage dominance and adjust the irrigation water to achieve the condition of maximum yield expectation, to achieve the goal of maximum yield. Following, this study proposes four scenarios to examine the optimal decision with numerical experiments, not only to verify the analytic solution but also to examine the decision-making under different conditions. So far the decision is still discussed within the two-stage framework, assuming that the rainfall in the first and second stages is known, and adding the rainfall uncertainty in the third stage to analyze irrigation water. It will extend to the multi-stage framework which could more reasonable presentation of crop yield decisions. In this way, this study can better help us to understand irrigation decision-making among different water supply stages under uncertainty.

How to cite: Cai, Y.-S. and You, G. J.-Y.: Optimal Irrigation Water Allocation among Different Growth Stages, EGU General Assembly 2023, Vienna, Austria, 23–28 Apr 2023, EGU23-4269, https://doi.org/10.5194/egusphere-egu23-4269, 2023.

EGU23-4511 | Orals | HS5.3

Using spatial crop modeling to improve the regional agricultural water planning. 

Qaisar Saddique, Ali Ajaz, and Shubham Jain

Climate change is increasingly affecting agriculture water resources. This adverse situation can be addressed by developing approaches focusing on optimization for agricultural water management.  Groundwater depletion is a serious issue for the sustainability of irrigated agriculture in the southern and central parts of the High Plains Aquifer (HPA), USA. Crops that require more water to grow (e.g., maize) may not receive sufficient irrigation due to decline in pumping capacities, and growers can experience yield loss, jeopardizing the farm profits. Geospatial crop modeling can be seen as a tool to simulate different scenarios of water availability for crops in regions like Texas and Oklahoma Panhandle. Open-source version of AquaCrop (AC-OSPy) was run under a gridded environment on the maize pixels of crop frequency layer developed by National Agricultural Statistics Service. Long-term simulations for past 30-year period (1991-2020) were run using the historical weather data for multiple irrigation application rates. Also, deficit irrigation was tested to assess the impact of skipping irrigation in different crop stages. The simulations were able to capture the variation of weather and soil patterns in the region. Mean irrigation requirement ranged between 78 mm and 314 mm under 50% available water capacity irrigation threshold, and mean yield varied from 8.8 to 14.3 Mg-ha-1. Deficit irrigation showed a potential of water saving during initial and vegetative stages (up to 113 mm), whereas a significant decline in yields was noted for skipping irrigation during flowering. Overall, the results of the study showed great potential of using geospatial crop modeling approach for regional agricultural water planning and drought mitigation efforts.  

How to cite: Saddique, Q., Ajaz, A., and Jain, S.: Using spatial crop modeling to improve the regional agricultural water planning., EGU General Assembly 2023, Vienna, Austria, 23–28 Apr 2023, EGU23-4511, https://doi.org/10.5194/egusphere-egu23-4511, 2023.

EGU23-4652 | Posters on site | HS5.3

A Cost-Agnostic Model to Identify Infrastructure Projects to Improve Rain-flow Allocations in a Growing Demand Environment 

Guillermo Gallego, Yihua He, Mengqian Lu, and Jin Qi

Climate change has led to the redistribution of water resources in many regions due to changes in global and regional water cycles. Sustainable water management is essential to ensure further socioeconomic development in the fastest-growing megalopolitan region, such as the Greater Bay Area (GBA) in China. Although optimal water allocation policies for various jurisdictions, provinces, cities, and areas in the GBA have been widely explored, most studies have focused on solutions within the context of existing infrastructure. Optimizing allocation on such a regional scale is a significant challenge due to differences in objectives, decision-makers, long-term contracts, trade deals, and other factors that are difficult to model or that make obtaining reliable data difficult. The presented study is part of a 3-year collaborative efforts among experts in climate change, water resources and operation research funded by the Hong Kong government (CRF Ref. No. C6032-21GF). And instead of focusing on determining optimal allocation, we intend to investigate the sustainability of the current scheme in line with the area’s rapid development under intensified climate variability and provide supportive information on the alleviation of system stress and bottlenecks over time.

We start with developing an aggregate rain-flow allocation model over a relevant time horizon to minimize shortage and overage costs. The model is infrastructure cost-agnostic and focuses on the marginal value of added storage capacity and network connectivity. We use the dual variables of the optimization problem, aggregated over different demand and supply scenarios, to identify infrastructure projects that can best improve the performance of the system based on projected but uncertain demand growth. Specifically, we first obtain the allowable range that can be solved by a linear programming based on the dual problem and subsequent problem reformulation for a single project. Then we introduce the approximated allowable range by aggregating over multiple scenarios to improve accuracy and computational efficiency. Combined with the aggregated marginal value, these features are used to create a list of the most promising projects in terms of their ability to improve the matching of supply and demand. The model can use feedback from decision makers to eliminate from consideration projects that are too expensive to build. The analysis can be used recurrently to obtain further improvements leading to a feedback loop with a finite number of rounds. This feedback loop can save significant time and effort compared to cost-based models that require obtaining cost data for many projects that will never be built. Based on our current results, we find that this process is quite efficient, and the feedback loop will basically end in a few rounds. These results can be extended in several directions including the discounting of cash flows. Moreover, we identify pairs of projects that have positive synergies making one more effective in the presence of the other.

* The author list is in alphabetical order

How to cite: Gallego, G., He, Y., Lu, M., and Qi, J.: A Cost-Agnostic Model to Identify Infrastructure Projects to Improve Rain-flow Allocations in a Growing Demand Environment, EGU General Assembly 2023, Vienna, Austria, 23–28 Apr 2023, EGU23-4652, https://doi.org/10.5194/egusphere-egu23-4652, 2023.

EGU23-4674 | ECS | Orals | HS5.3

A Water Resource Allocation Model Based on Coupled Socio-economic-Environment-Ecology-Resources System 

Yujia Shi, Zhongjing Wang, Jiahui Chen, and Jibin Chen

With the ongoing economic development and population growth, the shortage of water resources has become a severe problem which involves conflicts and tradeoffs among society, economy, environment, and ecology. Although previous researches proposed multi-objective optimization models, human-water coupled models, and hydro-economic models to deal with these conflicts and tradeoffs, they still did not address water demands’ integration and lacked future vision of water resource allocation. This paper proposed a Water Resource Allocation Model based on coupled Socio-economic-Environment-Ecology-Resources System (WRAM-SEERS) which considered integrally optimization objectives of socio-economic, environmental, and ecological subsystems under the constraints of water and land resources. The proposed model has the following advantages: (a) It could reflect all the closely related elements of the evolution of human society including urban and ecological space planning, cultivated structure and scale, population structure and size, industrial structure and scale, and so on, (b) It could generate the Pareto frontier surface, which maximized the socio-economic interest while minimizing the adverse externalities reacting in environment and ecology, and (c) It could forecast the future development range of each subsystem under hydrologic uncertainties. We applied WRAM-SEERS to allocate water resources of Yinchuan City in China in 2021-2035 and explained issues related the future perspective of Yinchuan: (a) “what is the lower and upper limits of subsystems’ development targets”, (b) “how to set targets consistent with sustainable development”, and (c) “how to achieve the settled targets”. The above explanations provided a scientific basis and decision-making reference for improving the water safety guarantee ability of Yinchuan's economic and social development and promoting a green, sustainable and high-quality development.

How to cite: Shi, Y., Wang, Z., Chen, J., and Chen, J.: A Water Resource Allocation Model Based on Coupled Socio-economic-Environment-Ecology-Resources System, EGU General Assembly 2023, Vienna, Austria, 23–28 Apr 2023, EGU23-4674, https://doi.org/10.5194/egusphere-egu23-4674, 2023.

EGU23-5186 | ECS | Posters on site | HS5.3

Precision Irrigation Scheduling through High Frequency Data Monitoring. Implementation in Apple Orchard Cultivations - central Greece. 

Ioannis Tsakmakis, Konstantinos Babakos, Anna Chatzi, Vassilios Pisinaras, Cosimo Brogi, Heye Bogena, Olga Dombrowski, and Andreas Panagopoulos

Pinios River Basin in central Greece (PRB) is region of highly productive agriculture where irrigation intensification and climate change have caused a significant depletion of groundwater resources. In the framework of the EU-Horizon 2020 project ATLAS, a precision irrigation scheduling service has been developed that aims at improving irrigation water management at the field scale. Such service is intended to protect crops from water stress by keeping the soil moisture (SM) in the root zone above the maximum allowable deficit (MAD). The presented approach is developed in two highly instrumented apple orchard pilot fields (~1.2 ha extent each) located at the Pinios Hydrologic Observatory ILTER site in PRB. In each pilot field and for two consecutive cultivation periods (2021 and 2022), intensive monitoring of meteorological parameters plus SM in 12 locations and at three depths (5, 20, 50 cm) was performed. To determine the time and volume of the next irrigation event, the forecast of meteorological variables for the next six days provided by the Global Forecast Model (GFS) was included in the service. The irrigation service performance was evaluated via comparison of the model estimated crop evapotranspiration (ETc) values against the SM content distribution monitored by the cluster of the installed SM sensors. The potential service contribution to reduce irrigation water consumption was assessed via comparison of the modelled irrigation water demands against the actual water consumption monitored at the irrigation blocks that divide each field. Statistical metrics demonstrate a good agreement between modeled crop evapotranspiration (ETc) and the monitored SM dynamics as captured by the SM sensors. Comparisons between the calculated irrigation demands and the actual water consumption monitored at the irrigation blocks of the pilot fields show that irrigation water applied in the fields may be reduced from 15% up to 50% or more in some instances, without considerably impacting crop health and yield. On the contrary, significant gains may be achieved on water saving and consequently on energy consumption to abstract irrigation water, thus contributing considerably to the region’s water-energy-food nexus sustainability.

How to cite: Tsakmakis, I., Babakos, K., Chatzi, A., Pisinaras, V., Brogi, C., Bogena, H., Dombrowski, O., and Panagopoulos, A.: Precision Irrigation Scheduling through High Frequency Data Monitoring. Implementation in Apple Orchard Cultivations - central Greece., EGU General Assembly 2023, Vienna, Austria, 23–28 Apr 2023, EGU23-5186, https://doi.org/10.5194/egusphere-egu23-5186, 2023.

EGU23-5592 | Posters on site | HS5.3

Management of alternative water resources for variable rate irrigation - a Hungarian case study 

Attila Nagy, Zsolt Zoltán Fehér, Andrea Szabó, Erika Buday-Bódi, Tamás Magyar, and János Tamás

Most of the climate scenarios predict increased water scarcity in arid areas, such as Hungary. However, the irrigated area in Hungary covers 2% of agricultural land, mostly with outdated irrigation technology. The aim of the research was to develop the basis of a variable rate irrigation for water-saving precision sprinkler irrigation system on an arable area (85 ha) which is located in the reference area of the Tisza Riven Basin. There is limited available water resources at the site, therefore alternative water sources utilization system was set up for irrigation to adapt to climate change and reduce fertilizers. The basis of the alternative water resources are excess water, treated wastewater, biogas fermentation sludge which is collected in a water reservoir with 114000 m3 capacity. For proper irrigation scheduling, heterogeneity of topography, hydrological, soil and crop conditions has to be explored and monitored. Therefore physically-based modelling of the water balance and remote sensing-based surplus water and  vegetation status surveying are tested to use for accurate irrigation scheduling.

Shallow groundwater and/or soil compaction can also contribute to excess inland water. This may occur even if there are drought periods in a year (e.g. in the Pannonian region), resulting in spots with a low crop yield. A LiDAR-based digital elevation model was found to provide appropriate data to identify sites affected by excess inland water. The spots identified can be used as spatial input data to compile a variable rate irrigation prescription map for imposing reduced (or zero) irrigation at areas more vulnerable to the occurrence of excess inland water. The water balance was also assessed for sites with physically-based models. Hydrus was used to model soil moisture changes at the Hungarian case study site.

A model concept for crop evapotranspiration estimation was also developed based on vegetation indices calculated from satellite imagery. Several combinations of sensors and remote sensing products were tested to use in ETc modelling potentially. This approach was tested both at the Hungarian case study sites. Remote sensing-based analysis of crop evapotranspiration, combined with physically-based modelling, appears to be a promising method in water balance modelling of maize fields, especially if these fields are in summer when the crop is fully developed. However, the remotely sensed information verification is essential for the proper utilization of the remote sensing data in ETc modelling and predicting the spatio-temporal dynamics of crop yield, evapotranspiration, and irrigation demands.

There is a need further benchmark scenarios to improve both physically-based models and satellite-based crop evapotranspiration models to achieve more accurate and valid simulations.

The abstract was funded by European Union’s Horizon 2020 “WATERAGRI Water retention and nutrient recycling in soils and steams for improved agricultural production” research and innovation programme under Grant Agreement No. 858375. This research was supported by the János Bolyai Research Scholarship of the Hungarian Academy of Sciences.

How to cite: Nagy, A., Fehér, Z. Z., Szabó, A., Buday-Bódi, E., Magyar, T., and Tamás, J.: Management of alternative water resources for variable rate irrigation - a Hungarian case study, EGU General Assembly 2023, Vienna, Austria, 23–28 Apr 2023, EGU23-5592, https://doi.org/10.5194/egusphere-egu23-5592, 2023.

EGU23-8570 | ECS | Orals | HS5.3

Smart irrigation using novel cosmic ray neutron sensors and land-surface modelling approaches 

Cosimo Brogi, Olga Dombrowski, Heye Reemt Bogena, Vassilios Pisinaras, Markus Köhli, Harrie-Jan Hendricks-Franssen, Andreas Panagopoulos, Kostantinos Babakos, and Anna Chatzi

Innovative soil moisture (SM) monitoring and modelling methods are key to reduce irrigation water use in the face of expected water scarcity and increase of droughts related to climate change. A promising irrigation monitoring method is Cosmic-Ray Neutron Sensing (CRNS), which is based on the negative correlation between fast neutrons originating from Cosmic-Ray neutron intensities and SM content. The CRNS key advantage lies in its relatively large sensing volume of several hectares, which allows to use a single CRNS instead of a network of point-scale sensors. Additionally, land surface models such as the Community Land Model (CLM5) that simulate the exchange of water, energy, carbon and nitrogen at the land–atmosphere interface can be a valuable tool to study the efficiency of irrigation and effects on crop growth. In this study, novel CRNS and the newly developed CLM5-FruitTree were tested in two small (~1.2 ha) irrigated apple orchards located in the Pinios Hydrologic Observatory (Greece). In 2020, a climate station (Atmos21) and a network of 12 SoilNet nodes, each with two SM sensors at 5, 20 and 50 cm depth, were installed in each field, as well as water meters to measure irrigation timing and amounts. In addition, a CRNS was installed in each field to test the possibility of monitoring irrigation and informing irrigation models. We found that the CRNS was very sensitive to the weekly irrigation events. However, the magnitude of the SM fluctuations caused by the irrigation was underestimated by the CRNS resulting in an RMSE of up to 0.058 cm3 cm-3. This can be attributed to the fact that the CRNS has a large footprint, and the neutron counts were therefore also influenced by the surroundings of the irrigated field. Therefore, to compensate for this influence, an additional SoilNet node was installed outside one of the two irrigated fields in 2022. By combining these data with neutron transport simulations of the study area, a correction of CRNS-derived SM was developed to better capture both timing and magnitude of SM changes (RMSE reduced to 0.031 cm3 cm-3). In parallel, CLM5-FruitTree was able to reproduce the observed SM response to irrigation when the local irrigation schedule was considered (i.e., defining starting date, timing, and target soil moisture for irrigation). Interestingly, the simulated irrigation in 2021 and 2022 used 10 to 60 % less water than the amount applied by the farmer. This suggests a great water saving potential through a reduction in irrigation amounts or through improvements in irrigation efficiency by reducing losses through evaporation or deep percolation. However, existing model weaknesses in the representation of soil properties and water fluxes need to be further addressed for this modelling approach. Nevertheless, the results of this study are a further step towards the use of novel CRNS and modelling tools as a decision support system in irrigation for more efficient use of water resources.

How to cite: Brogi, C., Dombrowski, O., Bogena, H. R., Pisinaras, V., Köhli, M., Hendricks-Franssen, H.-J., Panagopoulos, A., Babakos, K., and Chatzi, A.: Smart irrigation using novel cosmic ray neutron sensors and land-surface modelling approaches, EGU General Assembly 2023, Vienna, Austria, 23–28 Apr 2023, EGU23-8570, https://doi.org/10.5194/egusphere-egu23-8570, 2023.

EGU23-10741 | ECS | Posters on site | HS5.3

Optimal Operation Rules for Parallel Reservoir Systems with Distributed Water Demands 

weisa Meng, wenhua Wan, jianshi Zhao, and zhongjing Wang

This paper addresses the doubts regarding the spatial characteristics of the commonly used rules for parallel reservoir system operation. The rules based on aggregation-decomposition determine the system total release first and then assign this release to individual reservoirs, without considering the water demand distribution in the river network. In this paper, a conceptual model for parallel reservoir systems with distributed water demands is proposed. Three specific optimality conditions are derived for determining the optimal analytical solution. A rigorous proof shows that the aggregation-decomposition-based rules are a special case of the derived rules. An efficient algorithm is then developed based on the optimality conditions and shortage allocation index (SAI), in which a larger SAI indicates taking a higher percentage of the system water shortage, as release or storage. Unlike traditional algorithms that modify the violated variables empirically, we propose a criterion in terms of relative deviation indicators to determine the crucial priority of variable modification. This criterion can effectively address constraint violations. The optimal rules along with the solution algorithm are then demonstrated by the operation of a parallel reservoir system in the Shiyang River Basin, China. The results show that the proposed rules and algorithm are more efficient and effective than traditional algorithms and aggregation-decomposition-based rules, especially in dry seasons with more binding constraints.

How to cite: Meng, W., Wan, W., Zhao, J., and Wang, Z.: Optimal Operation Rules for Parallel Reservoir Systems with Distributed Water Demands, EGU General Assembly 2023, Vienna, Austria, 23–28 Apr 2023, EGU23-10741, https://doi.org/10.5194/egusphere-egu23-10741, 2023.

In California’s Central Valley, the forecast from climate models is that future precipitation events will be less frequent, more extreme, and deliver a higher proportion of the precipitation as rain. The combination of these effects will challenge the state’s ability to capture and store this critical freshwater resource and will also threaten downstream communities with flooding. A water management strategy gaining popularity in California is managed aquifer recharge (MAR), where excess surface water is captured and directed to selected sites to recharge the underlying groundwater systems. AgMAR is a form of MAR where water is spread over agricultural land to recharge the underlying aquifer over short periods during the wet winter months. One concern with this strategy is the decades of intensive agriculture in the Central Valley. The intense usage of fertilizers such as nitrogen threatens to contaminate the groundwater systems on which municipalities and homeowners rely. Research into nitrate mobilization has shown that the stratigraphic characterization of a site is the dominant factor in determining the infiltration rate and mobilization of contaminants. Therefore, in order to develop a model of nitrate mobilization, detailed information is needed about surface stratigraphy. In this study, a towed-transient electromagnetic geophysical method (tTEM) was used to image the subsurface, in combination with sediment type logs, to characterize the subsurface sediments. tTEM data were acquired on a 56-ha commercial almond farm in the early spring of 2022. The tTEM data were inverted to recover a resistivity model of the site, exhibiting a high degree of spatial variability. Regions of high resistivity typically suggest coarser grained material that is more permeable and hydraulically conductive, whereas regions of lower resistivity tend to be composed of finer grained material and are less hydraulically conductive. We created a site-specific resistivity-to-sediment-type transform to extract sediment-type data from the tTEM data using data from the 1D resistivity models along with twenty co-located sediment type logs and water table measurements. Using the maximum likelihood model, we transformed the recovered resistivity model into a sediment-type model. The integration of tTEM data and well-derived information about sediment types to construct a sediment-type model can provide information about connected pathways for recharge and help inform nitrate mobilization models. This study is allowing us to develop a methodology that can be applied elsewhere for the assessment of a site for agMAR when there are concerns about nitrate mobilization. This work is in support of a larger project on groundwater sustainability in agricultural systems in the southwestern United States.

How to cite: Peralta, J., Knight, R., Goebel, M., and Kang, S.: Geophysical site characterization, with the tTEM system, for studies of nitrate mobilization during recharge in the Central Valley of California, EGU General Assembly 2023, Vienna, Austria, 23–28 Apr 2023, EGU23-10821, https://doi.org/10.5194/egusphere-egu23-10821, 2023.

EGU23-12411 | Posters virtual | HS5.3

Thermal and digital images as a tool for detecting water status in Grapevine 

Alessandra Piga, Carla Cesaraccio, Andrea Ventura, Angelo Arca, and Pierpaolo Duce

Viticulture in recent decades is particularly affected by reduction of water availability due to rising temperatures, drought and heat waves. Climate change projections towards global warming and drought set grape production at risk. Vineyards are largely located in semi-arid areas, such as Mediterranean regions, where the intensity of the drought season largely affect the final yield and quality of production. In order to complete its vegetative cycle, the vine needs large quantities of water. However, an optimal use of irrigation water is imperative for performing a sustainable cultivation, and this can only be achieved through a number of cultural practices, including regulated deficit irrigation and soil management. Moreover, robust techniques to accurately detect plant water stress are necessary.

The development of new technologies related to proximal sensing are assuming great importance in vineyard management. Among them, are non-invasive methodologies based on infrared thermography for assessing plant water status, and supporting tools for irrigation scheduling. Moreover, proximal sensing techniques based on digital images are becoming a valuable tool for detecting crop physiological status.

In this study, thermal and visible images of three varieties of grapevine, under two deficit irrigation regimes, were analysed and evaluated as a tool for supporting crop irrigation management. The experiment was conducted in two vineyards located in Sardinia, Italy, and consisted of two regulated deficit irrigation (RDI-1 moderate and RDI-2 severe) treatments and two reference treatments maintained under stress and well-watered conditions. Digital images were acquired daily, during the entire growing season, using Campbell CC5MPx digital cameras. Thermal images were acquired using the InfRec R500Pro thermal camera (Nippon Avionics Co., Ltd.). Artificial surfaces were used as target reference for wet and dry temperature. Vegetation indices from thermal and digital images, i.e. Crop water stress index (CWSI) and green and red chromatic indices (ExG, GRVI, REI), were then calculated for each observation day.

The analysis of thermal images gave an accurate estimation of the differences in the water status of the vineyard over the RDI treatments. This technique proves to be able to well-differentiate different regimes in water management, confirming its good performance. The differences in CWSI values between moderate or severe water deficit treatments (RDI-1 and RDI-2) were in almost all cases (sites and varieties) statistically significant. These results were also confirmed by the seasonal pattern of both green and red chromatic indices (RGBs indices: ExG, GRVI, REI).

The development of non-destructive, cost-effective and easy-to-use methods for continuous monitoring of grapevine water status is a challenge to be faced in the future. In this context, proximal sensing techniques tested in this study, can provide useful information to develop tools and models for irrigation management.

How to cite: Piga, A., Cesaraccio, C., Ventura, A., Arca, A., and Duce, P.: Thermal and digital images as a tool for detecting water status in Grapevine, EGU General Assembly 2023, Vienna, Austria, 23–28 Apr 2023, EGU23-12411, https://doi.org/10.5194/egusphere-egu23-12411, 2023.

EGU23-12723 | ECS | Posters on site | HS5.3

Modelling a complex lowland irrigation channel network to optimize management operation under future scenarios of climate change 

Gabriele Farina, Luca Milanesi, and Marco Pilotti

Irrigation in northern Italy takes advantage of the Maggiore, Como, Iseo, Idro and Garda pre-alpine lakes, whose management rules and structures allow to stock rain and snowmelt outside the irrigation season and share it among the downstream users during late spring and summer. Consorzio Irrigazioni Cremonesi founded in 1883 (CIC in the following) is the most important irrigation consortia in the province of Cremona (northern Italy) in terms of amount of discharged water for irrigation purposes and manages a channel network that dates back to the 16th century. The maximum discharge derived from the Oglio river and the Adda river by CIC is 57.8 m3/s transported to the different withdrawal points (271) by an open channel network with a length of approximately 261 km. The water distribution provided by CIC is regulated by a complex and rigid timetable of the water turn, which defines the amount of water delivered to each user and the time duration. The intakes of the channel network are provided by the regulation of pre-alpine Lake Iseo and Lake Como, whose level regulation dates back to 1930 and was defined by law considering a set of conflicting constraints as well as the water demand of the irrigated areas. The water distributed by CIC provides a set of ecological services that go beyond simple irrigation.  Although the management of these Lakes is expected to change under the effects of the climate change, on the other hand the management of the irrigation water system is very stiff, being based on pure historical custom and relying on the practical experience of a small group of people. Accordingly, it is likely that this traditional management will become unsuitable in the future and practical experience could be of little use in search of new optimized water distribution frameworks. To manage this transition, CIC is building a mathematical model of the channel network that will be used to test different management options, following the reduction of available discharge caused by different conditions of the lake. The mathematical model, based on the one-dimensional formulation of the Saint-Venant equations, should be able to perform long time simulations for a set of complex interconnected channels in order to capture the different regulations of the gates in correspondence of the withdrawal points along the channel and to take into account the large number of structures which affect the flow along the channel network.

How to cite: Farina, G., Milanesi, L., and Pilotti, M.: Modelling a complex lowland irrigation channel network to optimize management operation under future scenarios of climate change, EGU General Assembly 2023, Vienna, Austria, 23–28 Apr 2023, EGU23-12723, https://doi.org/10.5194/egusphere-egu23-12723, 2023.

EGU23-13258 | ECS | Orals | HS5.3

Modeling innovative approaches for agricultural production with a case study for small vegetable production in Egypt 

Davide Danilo Chiarelli, Saeed Karimzadeh, Paolo d'Odorico, and Maria Cristina Rulli

The search for innovative approaches to agricultural production is fundamental to face the challenge of providing sustainable food production without depleting natural resources for growing population. Therefore, an accurate assessment of the green and blue water needs of cultivated land under different agricultural strategies is essential for systematic water management in agriculture. Among the limits to global food production, water availability, and soil and water salinity play key roles, especially in semi-arid and arid regions. In those areas, a possible solution for a sustainable increase in crop production while preserving natural resources is shifting small vegetable crop productions in a controlled environment, as greenhouses, where temperature, humidity, light, and other factors can be adjusted to meet the plant's needs. Here, we propose a method to estimate the water needed to grow small vegetables under different crop production techniques, from the more traditional approach in the field to innovative soilless cultivation techniques in greenhouses, with a case study in Egypt. To do so, we use the spatially distributed agro-hydrological model WATNEEDS to simulate the plant growth, including the effect of greenhouse production on crop water demand. Moreover, we simulate the possible use of brackish water for irrigation. Results show that by shifting to protected cultivation, the reduction in crop water requirement is 60%,65%, and 30% for tomato, watermelon, and pepper, respectively. This model could be used for irrigation planning and resource management policies. Besides, it can be helpful on multiple scales, from farm to global scale.

How to cite: Chiarelli, D. D., Karimzadeh, S., d'Odorico, P., and Rulli, M. C.: Modeling innovative approaches for agricultural production with a case study for small vegetable production in Egypt, EGU General Assembly 2023, Vienna, Austria, 23–28 Apr 2023, EGU23-13258, https://doi.org/10.5194/egusphere-egu23-13258, 2023.

EGU23-13408 | ECS | Orals | HS5.3

AquaCitrus: Soil water balance model for irrigation management in citrus orchards 

Najib Boubakri, Alberto Garcia-Prats, and Manuel Pulido-Velázquez

Climate change scenarios have projected that more frequent and severe droughts are likely to occur, especially in arid and semi-arid regions such as a gran part of the Mediterranean basin, where the effects of climate change on irrigated agriculture are more accentuated. These regions are generally characterized by an agroecosystem based on perennial crops that are sensitive to water scarcity. Citrus is among perennial crops in the Mediterranean area currently facing climate change effects and water scarcity. In the Mediterranean region, the changes in rainfall patterns and the increase in temperature caused by climate change will lead to higher evapotranspiration and consequently, increased irrigation needs for this crop that already has high water requirements.

Thus, it is mandatory to develop climate change adaptation measures to reduce their impacts on water resources in arid and semi-arid regions with intensive use of water for irrigation to increase capacity and efficiency for irrigation and ease the projected water stress.  One approach to ensure efficient water management is the development of decision-support tools to improve water management efficiency in irrigation. Crop simulation models are a key tool in extrapolating the impacts of climate change on irrigation water management.

In this context, our study aims at developing an agronomic model for woody crops, especially for citrus, since agronomic models for woody crops are practically absent, in contrast to the wide range of alternatives for annual crops, to define water resource management strategies. The model, named AquaCitrus, is a new functional soil water balance for citrus that simulates on daily time step water fluxes in the soil-plant-atmosphere complex. In short, AquaCitrus is composed of a set of sub-models computing the fluxes of effective precipitation, infiltration, runoff, soil evaporation, drainage, and crop transpiration. The model includes the routine of rainfall interception by the canopy, and computes the soil evaporation and crop transpiration separately. Soil evaporation is calculated using the model of Ritchie and citrus transpiration is calculated by the transpiration coefficient method. AquaCitrus considers the heterogeneity of the soil, given that localized irrigation keeps a small fraction of the soil frequently wet while the remaining area remains dry, unless it rains. Therefore, the model is divided into two compartments that solve the water balance separately for each soil zone.

To assess its predictive power, AquaCitrus was evaluated using a 2-year period of soil moisture data from an experimental field conducted in a citrus orchard in Valencia, Spain.  The results pointed out a good agreement between simulated and measured soil water contents at different soil depths; the model predicts the water balance of the system satisfactorily. We concluded that AquaCitrus is a useful tool to simulate strategies for improving irrigation water use efficiency in citrus crops, highlighting that there is additional room for improving its robustness. 

Acknowledgements:

This research has been supported by the ADAPTAMED project (RTI2018-101483-B-I00), funded by the Ministerio de Economía y Competitividad (MINECO) of Spain including EU FEDER funds; and by the GoNEXUS project (GA. 101003722), funded by the European Union Horizon Programme call H2020-LC-CLA-2018-2019-2020.

How to cite: Boubakri, N., Garcia-Prats, A., and Pulido-Velázquez, M.: AquaCitrus: Soil water balance model for irrigation management in citrus orchards, EGU General Assembly 2023, Vienna, Austria, 23–28 Apr 2023, EGU23-13408, https://doi.org/10.5194/egusphere-egu23-13408, 2023.

EGU23-14625 | ECS | Posters on site | HS5.3

Response of yield for a deficit irrigated crop rotation system: sensitivity of soil hydraulic parameters 

Xiangyu Fan and Niels Schütze

Multiple cropping is an effective measure to increase the intensity of land use. The North China Plain is one of China's most important grain production areas, with 70 % of the arable land under double rotation of winter wheat and summer corn. Soil water flow affects the distribution of irrigation water between the two cropping seasons, as the final soil moisture condition of one season is the initial soil moisture condition of the next season. Therefore, yield response and deficit irrigation scheduling are sensitive to soil hydraulic characteristics. The study analyzes this sensitivity depending on factors such as initial soil moisture condition, soil texture, and irrigation scheduling under different levels of limitation in irrigation water. Simulation results indicate that under most scenarios, the impact of initial soil moisture conditions on yield was much more significant than that of soil hydraulic characteristics. However, the impact can also vary depending on the selected irrigation strategy and water limitations. Therefore, for optimal full and deficit irrigation in a crop rotation system, the intra-annual irrigation water allocation should consider the soil water flow between two cropping seasons. In addition, an optimal irrigation strategy can largely mitigate the adverse effects of unfavorable soil hydraulic characteristics. Furthermore, the optimal irrigation strategy improves crop water productivity and food security at the same time.

How to cite: Fan, X. and Schütze, N.: Response of yield for a deficit irrigated crop rotation system: sensitivity of soil hydraulic parameters, EGU General Assembly 2023, Vienna, Austria, 23–28 Apr 2023, EGU23-14625, https://doi.org/10.5194/egusphere-egu23-14625, 2023.

EGU23-14825 | ECS | Orals | HS5.3

Spatial and temporal estimation of the green and blue Remote Sensing-based Agriculture Water Accounting and Footprint at the Pinios River Basin 

Jesús Garrido-Rubio, José González-Piqueras, Alfonso Calera, Konstantinos Babakos, Vassilios Pisinaras, Andreas Panagopoulos, and Anna Osann

Indicators on the sustainability of productive human sectors help boosting societal awareness and provide remarkable information for political decision-making and resources management. Prominent examples of relevant environmental indicators currently available are those that form the footprint family. In agriculture, the water footprint approach provides indicators that integrate direct and indirect freshwater usage. While a considerable number of studies developed so far used tabulated values for crop parametrization, the less explored application of dense remote sensing time series provides huge benefits.

This paper aims to present the spatiotemporal estimation of the green and blue Remote Sensing-based Agriculture Water Footprint (RS-AWAF) at the Pinios River Basin (11,000 km2) in Greece (year 2017), combining two globally accepted and operational methodologies: the Soil Water Balance published by the Food and Agriculture Organization in its irrigation and drainage paper 56 for water accounting purposes, and the standardized methodology for Agricultural Water Footprint estimation of growing a crop or tree published by the Water Footprint Network. Initially, the RS-AWAF applies dense temporal series of the Normalized Difference Vegetation Index produced by Sentinel-2 data at 10m spatial resolution to monitor the crops provided by local authorities through the Land Parcel Information System and derive the biophysical parameters along its development, such as the basal crop coefficient and the fraction of soil surface covered by vegetation. Those are then integrated into a validated and operational Remote Sensing-based Soil Water Balance that day after day and within a pixel spatial scale, estimates among other components of the balance, the adjusted crop evapotranspiration (ETcadj) and the net irrigation requirements (NIR). In a second step, both previous components are combined to estimate the blue crop water use (CWUblue), related to the NIR, and the green crop water use (CWUgreen), related to the fraction of the ETcadj that comes from other freshwater sources different than irrigation, the precipitation. Finally, crop yield values collected from official statistics per crop or crop group are used to estimate the blue water footprint (WFblue) and the green water footprint (WFgreen).

Once the green and blue RS-AWAF is estimated, a collection of thematic maps over the Pinios River Basin is ready for use by local stakeholders at their desired working scale. In that sense, monthly and annual thematic maps of ETcadj, NIR, CWUgreen and CWUblue are available, as well as annual thematic maps of WFblue and WFgreen. In parallel, tabulated values are created from these parameters using zonal statistics through GIS at the spatial scale appropriate to the final user (i.e. water user associations).

These results are part of the EU Horizon 2020 project REXUS (Managing Resilient Nexus Systems Through Participatory Systems Dynamics Modelling), in which stakeholders from water user associations to river basin water managers are evaluating the information. At this stage, our final goal is to provide spatiotemporal distributed accounting of agricultural freshwater resources over large areas that enhance regional knowledge and increases efficiency in water management and subsequently contributing to energy-saving, since the major agricultural water volume is abstracted from deep groundwater wells.

How to cite: Garrido-Rubio, J., González-Piqueras, J., Calera, A., Babakos, K., Pisinaras, V., Panagopoulos, A., and Osann, A.: Spatial and temporal estimation of the green and blue Remote Sensing-based Agriculture Water Accounting and Footprint at the Pinios River Basin, EGU General Assembly 2023, Vienna, Austria, 23–28 Apr 2023, EGU23-14825, https://doi.org/10.5194/egusphere-egu23-14825, 2023.

EGU23-15080 | ECS | Posters on site | HS5.3

Assessing soil moisture and salinity dynamics in an irrigated olive orchard using the HYDRUS 2D/3D model 

Giasemi Morianou, Konstantinos Tzerakis, Georgios Psarras, and Nekatrios Kourgialas

Irrigated agriculture is the world’s largest water consumer, while at the same time water resources are under increasing pressure from rapidly growing demands and climate change. In Greece, about 45% of the total cultivated area is being irrigated and groundwater is the main source of irrigated water supply. Due to the scarcity of fresh water, the islands of Greece face serious problems by saltwater intrusion in coastal aquifers. In these areas, it is a common practice to utilize saline groundwater in irrigated olive orchards. Thus, estimation of all water fluxes temporally and spatially within and out of the crop root zone, and evaluation of issues like salinity are necessary to fully assess the efficiency of irrigation systems and methods. Simulation models can be used to investigate these issues over several seasons and scenarios. In this study, HYDRUS 2D/3D was used to evaluate data measured during one season (2022) in an olive (Olea europaea) orchard in Crete, Greece. The model efficiency was assessed by comparing model simulations against the observations of θ and EC obtained by an IoT-based monitoring system installed in the frame of HORIZON 2020-Agricapture project in irrigated fields of the Merabello area (Eastern Crete). The system includes the monitoring of soil moisture and atmospheric sensors, providing information on irrigation scheduling to farmers. Three IoT-devices were established in the study field, connected with an advanced soil moisture, temperature, and electrical conductivity sensor Teros12 (METER group, Inc. USA) installed at 0.3 m depth. Meteorological data collection was possible through a weather station (Davis Vantage Pro2™) installed in the area. Comparison of simulated against observed θ and EC showed a good precision of HYDRUS 2D/3D model for olive trees irrigation, with the Nash-Sutcliffe and the Root Mean Square Error (RMSE) being within the acceptable ranges. Model results can be used to improve the decision-making IoT system and advise farmers on various aspects of irrigation under saline environment, as, for example, in scheduling irrigation events for leaching salts, to avoid crop damage.

The authors acknowledge contribution of the AgriCapture CO2 - Horizon 2020 project. This project has received funding from the European Union’s Horizon 2020 research and innovation programme under grant agreement No. 101004282.

How to cite: Morianou, G., Tzerakis, K., Psarras, G., and Kourgialas, N.: Assessing soil moisture and salinity dynamics in an irrigated olive orchard using the HYDRUS 2D/3D model, EGU General Assembly 2023, Vienna, Austria, 23–28 Apr 2023, EGU23-15080, https://doi.org/10.5194/egusphere-egu23-15080, 2023.

EGU23-16060 | Posters on site | HS5.3

Decision-making irrigation system based on MIKE SHE model for addressing water scarcity in Mediterranean olive orchards 

Nektarios Kourgialas, Giasemi Morianou, Konstantinos Tzerakis, Afroditi Malandraki, and Georgios Psarras

In the Mediterranean area, Greece is considered as one of the most important olive producing countries. Specifically, olive (Olea europaea) is the main crop covering more than 75% of the total tree cultivation area, while about 45% of the total cultivated area is being irrigated. Groundwater is the main source of irrigated water in Greece, but the growing demand and the climate change are putting this resource in risk.  The design of an optimal irrigation plan, based on detailed measurements and modeling tools, can effectively contribute towards water saving with no loss on crop yield, in the area. In this study, an IoT-based decision-making system for the management of irrigation water resources of olive orchards in a small sub-basin of Lasithi, Crete, Greece is presented.  The system integrates monitoring of soil moisture and atmospheric parameters in four fields within the study area and modeling approaches, using the modules of MIKE-SHE model, to simulate water flow in the unsaturated zone at the sub-basin level.  Additionally, 45 soil samples (from 3 different soil depths) have been collected and analyzed from the study area for soil texture, bulk density, rock percentage, pH, organic matter, and mineral nutrients. After the successful calibration of the model (comparison of simulated against observed soil moisture values) the spatio-temporal representation of soil moisture is used as guidance for developing optimal irrigation scheduling, considering olive tree water requirements, for the entire study area (sub-basin), even for olive orchards with lack of monitoring equipment installation.

ACKNOWLEDGEMENTS

The authors acknowledge contribution of the AgriCapture CO2 - Horizon 2020 project. This project has received funding from the European Union’s Horizon 2020 research and innovation programme under grant agreement No. 101004282

How to cite: Kourgialas, N., Morianou, G., Tzerakis, K., Malandraki, A., and Psarras, G.: Decision-making irrigation system based on MIKE SHE model for addressing water scarcity in Mediterranean olive orchards, EGU General Assembly 2023, Vienna, Austria, 23–28 Apr 2023, EGU23-16060, https://doi.org/10.5194/egusphere-egu23-16060, 2023.

EGU23-17022 | Orals | HS5.3 | Highlight

On assesssing water supply availability, land idling and economic impacts of agricultural droughts: Cases studies from recent California climate extremes 

Josue Medellin-Azuara, Alvar Escriva-Bou, Jose Rodriguez-Flores, Spencer Cole, John Abatzoglou, Joshua Viers, and Daniel Sumner

Climate extremes bring both challenges and opportunities for increasing resilience in agriculture and communities. Drought impact assessments are useful to identify systemwide vulnerabilities and downstream effects from water shortages to agriculture, and aid governments, irrigation user organizations and farmers in both short-term response and planning. The recent climate extremes in California, USA over the past 2012-2022 decade provide a useful case study as one of the largest irrigated agricultural systems which are applicable to other semi-arid areas in the world. We present a framework to gather water supply availability for irrigation in California’s large and complex water supply system, estimate idle land, potential cropping patterns response and economic costs to irrigated agriculture, downstream food processing sectors and regional economies. Recent groundwater regulation forcing sustainable pumping rates at a local level bring additional challenges to cope with water scarcity. We employ regional water balances which consider diverse water supply portfolios for agriculture, remote sensing, and economic models which estimate profit-maximizing crop response and economic costs of water shortages to agriculture and related sectors. We also discuss data challenges in quantifying ultimate impacts of low precipitation, surface water reserves and groundwater restrictions, in a highly engineered and diversified water supply system.  Estimated impacts on agriculture and regionwide income and employment from the 2012-2016 and the more recent 2019-2022 drought in California are discussed along with insights for short-term response, and longer-term water management, planning and policy.

How to cite: Medellin-Azuara, J., Escriva-Bou, A., Rodriguez-Flores, J., Cole, S., Abatzoglou, J., Viers, J., and Sumner, D.: On assesssing water supply availability, land idling and economic impacts of agricultural droughts: Cases studies from recent California climate extremes, EGU General Assembly 2023, Vienna, Austria, 23–28 Apr 2023, EGU23-17022, https://doi.org/10.5194/egusphere-egu23-17022, 2023.

Water resource management strategies are often identified and evaluated using performance metrics within a simulation-optimization framework. These metrics are likely to have varying levels of sensitivity to input variables such as inflows, model-related choices, and errors from the implementation of the strategies. Quantifying the sensitivity of the performance metrics to the aforementioned uncertain factors may therefore be useful for decision-makers in understanding the relative importance of these factors and their interactions. Furthermore, the total variation in the performance measures, arising as a consequence of the uncertain factors, may be useful to quantify the stability of the performance measures. Here, we quantify the first, second, and total order sensitivity of the performance metrics to uncertain factors using Sobol’s variance-based sensitivity analysis. The stability of the performance metric is quantified as the coefficient of variation of the metric evaluated for varying input factors.


We then assess these sensitivity and stability indices for four performance metrics of the multi-purpose Nagarjuna Sagar reservoir, the largest reservoir in the Krishna river basin in southern India. The reservoir supplies water to meet irrigation, industrial and domestic demands while also generating hydropower with an installed capacity of 810MW. The performance metrics evaluated in this study are: (i) maximize hydropower generation, (ii) maximize the reliability of maintaining minimum environmental flows, (iii) maximize the reliability of avoiding high flow exceedance, and (iv) minimize demand deficits. We identify the Pareto approximate set of reservoir operation strategies using evolutionary multi-objective direct policy search (EMODPS), which employs a state-aware operating rule based on radial basis functions. We consider the following uncertain factors in our analysis: (i) the length of the planning horizon (varied from 1 to 15 years), (ii) model timestep (daily, 15-day, monthly timesteps), (iii) imperfect operations while applying optimized strategies, (iv) stochastic and deep uncertainties related to inflows. Our results show that the objective related to hydropower generation is the most sensitive to the model choices. In contrast, high flow non-exceedance reliability, demand deficits, and minimum environmental flow reliability objectives are most sensitive to deep uncertainties in inflows. We find that hydropower generation, environmental flow reliability, and demand deficits are not sensitive to the interaction effects of these factors. On the other hand, high flow non-exceedance-related objectives are sensitive to the interactions between deep uncertainties and model uncertainty. We also find that the first-order sensitivity indices can be calculated with a greater confidence level than the total-order sensitivity indices. We identify that the flood reliability objective is the most stable, and the demand deficits objective is the least stable when subjected to uncertainty. Our framework can be used to identify the relative importance of the uncertain factors and the stability of the performance measures in any water management problem.

How to cite: Molakala, M. and Singh, R.: Quantifying the sensitivity and stability of the performance of a multi-purpose reservoir to model, inflow, and operational uncertainties , EGU General Assembly 2023, Vienna, Austria, 23–28 Apr 2023, EGU23-630, https://doi.org/10.5194/egusphere-egu23-630, 2023.

Obtaining optimal reservoir operation policies is a challenging task and a strategic concern for policymakers. These policies are typically derived through a complex decision-making process with conflicting objectives, represented by nonlinear, nonconvex and multi-modal functions. The information on available inflow and various demands play a key role in developing optimal operation rules. However, they are characterized by various uncertainties which reduce the practical applicability of deterministic policy solutions. In literature, most of the studies handle streamflow uncertainty with single-demand scenarios. Although Stochastic Dynamic Programming (SDP) is a widely-used method for reservoir operations optimization under uncertainty, it suffers from the dual curses of dimensionality and modeling. This study considers the uncertainties for streamflow and various demands such as municipal, industrial, hydropower and irrigation water requirements. Here, we present a reinforcement learning framework that utilizes uncertainty-aware streamflow forecasts and demand requirements to yield optimal operation policies for Sardar Sarovar Dam, India. The proposed methodology incorporates the uncertainties of the underlying inflow and demand behavior, and demonstrates better performance than SDP in terms of net benefit. Overall, this work offers reliable techniques that can be used to develop multi-objective reservoir operation policies which are more adaptable in real-time.

How to cite: Upadhyay, D., Dubey, S., and Bhatia, U.: Deriving optimal single-reservoir operating policies with reinforcement learning based approach incorporating uncertainties of demand and streamflow, EGU General Assembly 2023, Vienna, Austria, 23–28 Apr 2023, EGU23-776, https://doi.org/10.5194/egusphere-egu23-776, 2023.

EGU23-856 | ECS | Orals | HS5.5

A Review on the Water-Energy-Food-Ecosystems Nexus Research in the Mediterranean: Evolution, Gaps and Applications 

Enrico Lucca, Jérôme El Jeitany, Giulio Castelli, Tommaso Pacetti, Elena Bresci, and Enrica Caporali

Over the last few years, the Water-Energy-Food (WEF) Nexus has been brought forward by scientists as a novel way of analysing the interconnectedness of global resources systems, and by policy makers as an approach to achieving water, food and energy security while preserving the environment.  Implementing such an integrated thinking is crucial for the Mediterranean, a region characterised by increasing demand for food and energy, and vulnerable to water scarcity, impact of climate change and degradation of natural ecosystems.  Through an integrative review of scientific literature, we examined the evolution of Nexus research in the Mediterranean in terms of critical interlinkages being investigated, explored topics, methods and scales of analysis, and context of operationalizations. The 136 reviewed articles revealed that (a) water-energy interlinkages dominates Nexus research in the Mediterranean, driven by the need of satisfying water demands for drinking and irrigation through energy-intensive water resources; (b) the expansion of Nexus thinking to additional components is mostly limited to assessing the impact of Nexus sectors on the physical environment and the climate, without capturing feedback dynamics; (c) there are only few Nexus studies working  at the entire Mediterranean scale which would provide a much needed contextual setting to the impact of isolated case studies; (d) there is promising evidence that Nexus research in the Mediterranean is going beyond the biophysical dimension to encompass socio-economic interactions and governance aspects; yet, (e) their analysis often remain segregated in silos because of a limited integration of methods across disciplines; (f) Sustainable Technology and Natural Resources Management are the key drivers of Nexus research operationalization and would  benefit from an harmonisation to coherently advance Nexus implementation in the Mediterranean region. This review concludes that Nexus research in the Mediterranean would benefit from an integration of the knowledge developed so far in multi-scale, multi-sector, and multi-dimensional frameworks, which would be capable of supporting technological, socio-economic and governance interventions.

How to cite: Lucca, E., El Jeitany, J., Castelli, G., Pacetti, T., Bresci, E., and Caporali, E.: A Review on the Water-Energy-Food-Ecosystems Nexus Research in the Mediterranean: Evolution, Gaps and Applications, EGU General Assembly 2023, Vienna, Austria, 23–28 Apr 2023, EGU23-856, https://doi.org/10.5194/egusphere-egu23-856, 2023.

EGU23-1266 | Orals | HS5.5

NASAaccess – earth observation data tool 

Ibrahim Mohammed, Giovanni Romero, John Bolten, and Jim Nelson

NASA has launched a new initiative; the Open-Source Initiative (OSSI) to enable and support science towards openness. The OSSI new initiative supports open-source software development and dissemination. This presentation highlights an open-source platform (i.e., NASAaccess) for accessing, reformatting, and presenting quantitative remote sensing earth observation data products. The main objective of developing the NASAaccess platform is to facilitate exploration, modeling and understanding of the data for scientists, stakeholders, and concerned citizens aligning with the new OSSI initiative goals. NASAaccess platform is available with an open-source software packages (i.e., R and python libraries), and an interactive format web-based environmental modeling application for earth observation data. NASAaccess software program is also linked to various downscaled climate change data products processed by NASA. The NASAaccess web application development and hosting environment is based on Tethys Platform (Swain et al., 2016). NASAaccess current capabilities (v.3.3.0) covers various NASA datasets and products that include the Global Precipitation Measurement (GPM) data products, the Global Land Data Assimilation System (GLDAS) land surface states and fluxes, and the NASA Earth Exchange Global Daily Downscaled Projections (NEX-GDDP) CMIP5 & CMIP6 climate change dataset products. NASAaccess installation instructions and documentations along with tutorial materials are available at Open Science Framework repository ‘NASAaccess Home’ (doi:10.17605/OSF.IO/CTJ2K).

How to cite: Mohammed, I., Romero, G., Bolten, J., and Nelson, J.: NASAaccess – earth observation data tool, EGU General Assembly 2023, Vienna, Austria, 23–28 Apr 2023, EGU23-1266, https://doi.org/10.5194/egusphere-egu23-1266, 2023.

EGU23-1529 | ECS | Orals | HS5.5

Smallholder farming and water scarcity: contributions, benefits, and limitations 

Han Su, Timothy Foster, Maarten S. Krol, Rick J. Hogeboom, Bárbara Willaarts, Diana V. Luna-Gonzalez, Oleksandr Mialyk, and Joep F. Schyns

Smallholders make up the vast majority of farms globally in terms of numbers (over 400 million), cultivate around 20% of global cropland, and produce 30% of global food. Although 70-80% of smallholders are located in areas already facing water scarcity which may be further exacerbated by climate change and population and economic growth, little is known about the relationship between smallholder farming and water scarcity. This study aims to shed light on this relationship, both regarding how water scarcity affects smallholders’ production and vice versa, how smallholders’ production and water productivity contribute to local water scarcity.

Hereto, we first estimated smallholders’ green and blue water consumption using ACEA 2.0 (AquaCrop-Earth@lternatives 2.0) in 56 countries around 2010, for main crops, and three farming systems. ACEA 2.0  is an updated version of the ACEA global gridded crop model based on AquaCrop-OSPy with a soil fertility module. It leverages a recently developed gridded global crop map that is both farm-size-specific and crop-specific. This inclusion allows us to incorporate the effects of soil fertility stress at an unprecedented level of granularity based on GAEZv4, which is highly relevant for evaluating the low-input rainfed, high-input rainfed, and (high-input) irrigated farming systems separately. The water productivity of smallholders was assessed in terms of a unit of water footprints and nutritional water productivity. Water scarcity was evaluated at the subnational basin level using global hydrological models PCR-GLOBWB, H08, and WaterGAP2-2C through ISIMIP 2a. The individual and combined effects of water and soil fertility stress on smallholders’ production were assessed and compared.


How to cite: Su, H., Foster, T., S. Krol, M., J. Hogeboom, R., Willaarts, B., V. Luna-Gonzalez, D., Mialyk, O., and F. Schyns, J.: Smallholder farming and water scarcity: contributions, benefits, and limitations, EGU General Assembly 2023, Vienna, Austria, 23–28 Apr 2023, EGU23-1529, https://doi.org/10.5194/egusphere-egu23-1529, 2023.

EGU23-1572 | ECS | Orals | HS5.5

Modelling the impacts of policy, climate and socioeconomic change on water security in China 

Danyang Gao, Albert S. Chen, and Fayyaz Ali Memon

The management of water resource in China has been under pressures due to rapid socioeconomic growth that escalates the demands in food, energy and domestic sectors, which rely on reliable water provision. Together with climate change, water security is expected to face greater uncertainty in the future. To support sustainable water resource management, this study established a system dynamic model to investigate the impacts of policy, socioeconomic and climate change on water security in China during 2025 to 2100. Five policy options related to carbon neutrality and water management, three socioeconomic and climate scenarios (SSP1-RCP2.6, SSP2-RCP4.5 and SSP5-RCP8.5) were considered. The results show that water demand and water resource will both be greater in the future. Under BAU, water demand will reach 514, 544 and 717 km3 while water resource will increase to 989, 992 and 1032 km3 in 2086-2100 under SSP1-RCP2.6, SSP2-RCP4.5 and SSP5-RCP8.5, respectively. Future water demand for food sector is expected to decrease slightly and then increase under SSP1-RCP2.6, while it shows continuous increase under SSP2-RCP4.5 and SSP5-RCP8.5 due to the changes of planted area, livestock and temperature. Water demand for domestic sector will decrease under three SSP-RCPs because the population will reach a peak around 2030 and then decrease with time. Water demand for energy is expected to decrease under SSP1-RCP2.6 while it will increase under other SSP-RCPs because of more energy demand under SSP2-RCP4.5 and SSP5-RCP8.5. China may face low water security pressure without policy intervention in the future especially under SSP5-RCP8.5. The analysis shows that bioenergy-oriented agriculture cannot mitigate water scarcity risks in China, while low-carbon agriculture strategies can potentially ensure water safety under carbon neutral goal. Water scarcity can be averted if we follow the development path of SSP1-RCP2.6 as well as apply interventions on water management combining with carbon neutral policies that focus on low-carbon agriculture and supplemented by low fossil energy.

How to cite: Gao, D., Chen, A. S., and Memon, F. A.: Modelling the impacts of policy, climate and socioeconomic change on water security in China, EGU General Assembly 2023, Vienna, Austria, 23–28 Apr 2023, EGU23-1572, https://doi.org/10.5194/egusphere-egu23-1572, 2023.

EGU23-1708 | Orals | HS5.5

WEFE Nexus governance approach to tackle water management issues in a transboundary aquatic ecosystem 

Maria P. Papadopoulou, Orfeas Roussos, Leto Papadopoulou, and Dionissia Hatzilacou

Prespa Lakes is a transboundary (Greece-Albania-North Macedonia) aquatic ecosystem with a unique ecological value that includes a great variety of habitats and life forms, endemic and rare species. The water quality of this ecosystem is essential to sustain ecosystem services, as well as local economic activity. Climate change may lead to a potential decrease in water quality and availability, increasing the competition among the different water users. Integrated water management and policy approaches that will engage all competing water users is the answer to achieve the sustainability of sensitive and high-value aquatic systems, as the one found in Prespa Lakes. This challenge is even greater when these aquatic systems are transboundary and belong to the Natura2000 network.

Recognizing the need for a rational management of high-value water ecosystems, the Greek administration adopted, in 2020, a new governance system, with the establishment of the Natural Environment and Climate Change Agency (NECCA), an agency responsible for all the protected areas in Greece, with an emphasis on the conservation and protection of biodiversity in the 446 Natura2000 sites in the country . Within this new administrative system, all 446 Natura2000 sites are grouped into 24 decentralized protected area units (DPAU) and at each DPAU, a Local Management Committee (LMC) is appointed, in order to  bring together all interested stakeholders at local level such as regional and municipal authorities, technical economic chambers, forest management authorities, environmental NGOs and professional associations. The LMC functions as a consultation body to the DPAU. Its primary focus is on the implementation of the relevant protected area management plan and monitoring scheme, for the conservation of protected habitats and species, but it also participates in every other action related to sustainable development, mitigation and adaptation to climate change. Special concern will be given to actions related to water quality, food production, ecosystem health and climate resilience, as critical elements of WEFE Nexus.

In this frame, climate resilience of all environmental, economic, and social sectors related to water use is analyzed in the Orhid/Prespa Lakes ecosystem as a whole, to secure a balanced use of available water resources in this transboundary ecosystem. A System Innovation Approach is implemented through the development of Working Groups functioning at national level followed by a transboundary Living Lab focusing on water scarcity issues. Stakeholders related to water management and representing all sectors at local level take part in these Working Groups and in the transboundary Living Lab to shape common pathways of innovations on climate adaptation and resilience. It is envisaged that the results will support the work of the LMC, as well as that of the transboundary Prespa Park Management Committee, and could also be transferred, by NECCA, to other protected areas with similar ecosystem characteristics, and challenges.

How to cite: Papadopoulou, M. P., Roussos, O., Papadopoulou, L., and Hatzilacou, D.: WEFE Nexus governance approach to tackle water management issues in a transboundary aquatic ecosystem, EGU General Assembly 2023, Vienna, Austria, 23–28 Apr 2023, EGU23-1708, https://doi.org/10.5194/egusphere-egu23-1708, 2023.

Hydrological alteration refers to any modification to different components of the natural flow regime of a river that human interventions may cause. The interventions are built to store excess water for different purposes, such as hydropower generation, irrigation, and domestic uses. The headwaters of the Peace River in Canada that flows from the Rocky Mountains of British Columbia became regulated by two large dams, the W. A. C. Bennett dam in 1968 and the Peace Canyon dam in 1980. The objective of the paper quantified the hydrological alterations caused by the cascade of dams across the Peace River. We have used a powerful tool 'River Flow Health Index' to quantify the alterations in different flow regime components on a 0-1 scale (0 means unaltered and one means completely altered). Historical hydrological data is obtained from the Water Survey of Canada (http://www.ec.gc.ca/rhc-wsc/) at a gauge station, Peace River near Taylor (coordinates: 56° 8'8.99"N, 120°40'13.01"W) for the years 1945-2015. 1945-1962 is chosen as the reference state because the dams were constructed after 1963. The altered period is referred to the period 1970-2015 after the operation of the dams started. We scrutinized 171 hydrologically relevant parameters grouped into seven components of the flow regime: magnitude, variability, duration, frequency, timing, rate of change, and others. The methodology for estimating the River Flow Health Index (RFHI) consists of four steps: (1) segregation of the flow data based on preimpact and postimpact periods, (2) identification of important hydrological parameters, (3) assessment of the alterations, and (4) development of an index indicating the health of the river flow during the altered period on a 0–1 scale. The flow health of the river changed significantly due to the dams, with an overall alteration of 0.897. The degree of alterations in different components of the flow regime is magnitude (0.646), variability (0.978), duration (0.941), frequency (1.000), timing (0.978), rate of change (0.801), and others (1.000).

Daily flows at the downstream site during 1945–2015 reveal substantial reductions in flows after the construction of the W. A. C. Bennett and Peace Canyon dams. Homogenization of flows in the post-impact period altered the variability component of the flow regime. The duration and frequency of the extreme events are stunted post-dam regulation. This might result from water storage and release, and these multiple dams can store and attenuate all high-and low-pulse events. Alterations in the timing component resulted in the seasonal shift in streamflow by storing flood flows and releasing or utilizing them during lean seasons. Changes in Group 6, i.e., rate of change after the construction of the dams, indicate dam operations for energy production (i.e., peaking operations). Thus, the results indicate that the large dams across the Peace River can substantially change the natural flow regime. Our results may help upgrade the design and implementation of reservoir operation policies that consider downstream hydrological alterations.

How to cite: Mohanty, M. and Tare, V.: Method to quantify hydrological alterations due to anthropogenic interventions: A case study of Peace River, Canada, EGU General Assembly 2023, Vienna, Austria, 23–28 Apr 2023, EGU23-4054, https://doi.org/10.5194/egusphere-egu23-4054, 2023.

EGU23-4116 | Orals | HS5.5

Consistent linkage of distributed food, water, energy, environmental (FWEE) models: perspectives of data and modeling platform for integrated FWEE security NEXUS analysis and planning. 

Tatiana Ermolieva, Anatolij G. Zagorodny, Vjacheslav L. Bogdanov, Gang Wang, Petr Havlik, Elena Rovenskaya, Nadejda Komendantova, Taher Kahil, Jose- Pablo Ortiz-Partida, Juraj Balkovic, Rastislav Skalsky, and Christian Folberth

In this presentation we discuss methodologies, modeling tools and case studies on linking distributed disciplinary food, water, energy, environmental (FWEE) systems’ models into multi-systems multi-disciplinary integrated models for truly integrated analysis and managing of FWEE security NEXUS. Models’ linkage approaches enable to operationalize the concept of modeling and data platforms for distributed independent models’ “integration” and integrated FWEE security NEXUS management.

Local, national and global FWEE security in the presence of climate change and risks of various kinds depend on the consistent coordination between and within the interdependent FWEE systems regarding sustainable resource supply and utilization. Detailed independent sectoral and regional systems’ models are often used to address these challenges. However, the independent approaches overlook the close linkages and feedbacks between and within the systems and, therefore, possible cross-sectoral implications. Critical cross-sectoral FWEE systemic supply-demand imbalances can trigger a disruption in a FWEE systems network. Disruptions and failures can be induced by human decisions in combination with natural shocks. For example, overuse of water in one system, e.g., agricultural, can lead to drying up of wells, decrease of reservoir water level, shortage of water in other systems, e.g., for colling power plants or hydropower production; an extra load in a power grid triggered by a power plant or a transmission line failure can cause cascading failures with catastrophic systemic outages; a hurricane in combination with inappropriate land use management can result in a catastrophic flood and human and economic losses, similar to the induced by Hurricane Katrina. These are examples of systemic risks motivating the development of proper models’ linkage approaches and integrated systems analysis.

The linkage algorithms are becoming widely demanded in connection with the need for decentralized planning of distributed systems and technologies emerging in agriculture, water, energy, environmental systems, e.g., distributed precision agriculture technologies; hydro-economic models’ linkages; bio-physical crop modeling; distributed energy production.

In this presentation we define and illustrate the two main linkage methodologies:

  • linkage of distributed FWEE optimization models (land use, water, energy systems models);
  • linkage of simulation and optimization models (crop-yield meta-model from EPIC and a land-use GLOBIOM model).

Both methodologies are based on iterative sequential stochastic quasigradient (SQG) procedures of, in general, non-smooth nondifferentiable stochastic optimization, which converge to socially optimal solution maximizing an implicit nested nondifferentiable social welfare function. The linkage problem can be viewed as a general endogenous reinforced learning problem. The models act as “agents” that communicate with a “central hub” (a regulator) and take decisions in order to maximize the “cumulative reward". The procedure does not require models to exchange full information about their specifications. The distributed models can operate on distant computers of individual agents and “negotiate” with a central computer of a regional planner through the linkage procedure.

How to cite: Ermolieva, T., Zagorodny, A. G., Bogdanov, V. L., Wang, G., Havlik, P., Rovenskaya, E., Komendantova, N., Kahil, T., Ortiz-Partida, J.-P., Balkovic, J., Skalsky, R., and Folberth, C.: Consistent linkage of distributed food, water, energy, environmental (FWEE) models: perspectives of data and modeling platform for integrated FWEE security NEXUS analysis and planning., EGU General Assembly 2023, Vienna, Austria, 23–28 Apr 2023, EGU23-4116, https://doi.org/10.5194/egusphere-egu23-4116, 2023.

EGU23-4178 | ECS | Orals | HS5.5

Reasons for urban water utilities’ hesitance towards dynamic system operation – and solutions to mitigate these 

Nadia Kirstein, Morten Rungø, and Roland Löwe

Dynamic operation of urban water infrastructure has many times been demonstrated as an efficient way to manage storm- and wastewater flows with a minimum of cost and material resources, and to improve the health of surface water environments by reducing, for example, combined sewer overflows. Adopting dynamic, real-time control strategies become even more important as climate change is challenging existing water infrastructure with increasing precipitation intensities and volumes. Nevertheless, urban water managers are hesitant to adopt such strategies and rather fall back to upgrading the infrastructure with e.g. underground basins and tunnels. Based on a series of semi-structured interviews and workshops with operators and planners from six Danish utilities, we can demonstrate that many aspects make utility employees feel uncomfortable with dynamic control schemes, e.g.:

  • lack of knowledge on the environmental improvements that can be achieved with dynamic operation
  • lack of understanding of the algorithms in applied control schemes
  • lack of experience with dynamic operation
  • lack of knowledge of the effect of system changes (e.g. construction work) on the dynamic control performance
  • lack of collaboration across different departments within the utility
  • lack of motivation from the operators

Furthermore, there is a general lack of time of the interviewed employees to engage in these aspects.

While the identified issues span across different stages of the planning and operation process, several issues (such as the lack of knowledge on potential environmental improvement, or the lack of collaboration between disciplines) arise in initial planning stages where strategic decisions are made. For this purpose, we have developed an automated screening approach for the potential environmental effects of dynamically operating urban water systems, where the approach and visualizations were developed iteratively and in close collaboration with the stakeholders.

Environmental improvements are in scientific literature often reported for the entire catchment (e.g. the total potential overflow volume reduction); however, a key learning from our work is that the environmental effects need to be visualized for each individual control point in the system. This makes it much more tangible for stakeholders to compare the potential environmental effect with the needed effort and cost, and the detailed result visualization of the dynamic control thus aligns much better with the decision-making process of the stakeholders. Furthermore, the stakeholders prefer simple, understandable control algorithms, even if these don’t fully exploit the potential of dynamic operation. This preference stands in direct contradiction to academic literature, which focuses on advancing control algorithms rather than making sure that existing algorithms are implemented.

Our results are currently implemented in a dashboard for screening the potential of dynamic operation of urban water systems, and will form the basis for generic rule-based operation strategies for urban water systems.

How to cite: Kirstein, N., Rungø, M., and Löwe, R.: Reasons for urban water utilities’ hesitance towards dynamic system operation – and solutions to mitigate these, EGU General Assembly 2023, Vienna, Austria, 23–28 Apr 2023, EGU23-4178, https://doi.org/10.5194/egusphere-egu23-4178, 2023.

EGU23-4304 | Posters on site | HS5.5

Valuing seasonal streamflow forecasts in power system operations 

Stefano Galelli and Rachel Koh

The value of seasonal streamflow forecasts for the hydropower industry has long been assessed by considering metrics related to hydropower production. However, this current approach overlooks the role played by hydropower dams within the power grid, therefore providing a myopic view of how forecasts could improve the operations of large-scale power systems. There are, in particular, two points worth stressing. First, the inherent uncertainty of streamflow forecasts could be easily propagated into the grid, especially if the power system is highly reliant on hydropower. Second, the relationship between water and power systems is not unidirectional: failing to capture feedback mechanisms may add uncertainty to exercises aimed at characterizing the value of seasonal forecasts. To fill in this gap, we developed a novel modelling framework that (i) hard-couples a reservoir system model with a power system model, and (ii) is subject to reservoir inflow forecasts with different levels of accuracy. We implement the framework on a real-world case study based on the Cambodian grid, which relies on hydropower, coal, oil, and imports from neighboring countries. In particular, we evaluate the performance of both systems in terms of power production costs, CO2 emissions, and the amount of curtailed hydropower. Through this framework, we demonstrate that the value of streamflow forecasts is affected not only by their skill, but also by the dynamic behavior of the coupled water-power system.

How to cite: Galelli, S. and Koh, R.: Valuing seasonal streamflow forecasts in power system operations, EGU General Assembly 2023, Vienna, Austria, 23–28 Apr 2023, EGU23-4304, https://doi.org/10.5194/egusphere-egu23-4304, 2023.

EGU23-4342 | ECS | Orals | HS5.5

Managing the water-energy-food-ecosystems nexus under future climate water stress scenarios in the Ebro Basin (Spain) 

Safa Baccour, Jose Albiac, Frank Ward, Taher Kahil, Encarna Esteban, Javier Uche, and Elena Calvo

Increasing climate water stress and excessive and unbalanced water withdrawals by sectors are triggering substantial water depletion and environmental degradation in arid and semi-arid basins. Addressing the problem requires the integration of sectoral policies based on interdisciplinary knowledge and sustainable management strategies. The Water-Energy-Food-Ecosystems (WEFE) nexus is an innovative and comprehensive tool to guide river basin managers and stakeholders towards sustainable development goals. Several nexus approaches have been advanced for different sectors, basins, and time periods. However, none to date has presented a monthly dynamic optimization framework that includes ecosystems in order to assess the WEFE nexus for entire large basins. The contribution of this paper is to address water related challenges and highlight the gap in users engagement, by presenting the results of the cross-sectoral integration under future climate water stress (CC-2070; CC-2100), and by designing policy interventions to achieve sustainable outcomes. The WEFE nexus is analyzed for the Ebro River basin; first the analysis identifies the trade-offs and synergies among sectors and spatial locations, and then policy interventions under future climate water stress are evaluated for enhancing water, food and energy security, and for ecosystems protection. Findings provide efficient water allocation plans between competing sectors, emphasizing the importance of ecosystem services in maintaining biodiversity under future climate water stress scenarios. The policy analysis offers insights into the synergies between environmental and economic outcomes, although the costs of certain policies could be high for some groups of stakeholders. Results show that irrigation modernization, increasing reservoir storage capacity, and water trading policies provide efficient water use patterns, enlarging basin stream flows, protecting ecosystems and augmenting the private and social benefits. Sustainable agriculture and water storage management are crucial policies that promote food, water, and energy security and ecosystems protection. These critical results from interventions could help decision makers to bring about efficient water allocation planning among sectors, and advance resilience and adaptation to climate water stress.


How to cite: Baccour, S., Albiac, J., Ward, F., Kahil, T., Esteban, E., Uche, J., and Calvo, E.: Managing the water-energy-food-ecosystems nexus under future climate water stress scenarios in the Ebro Basin (Spain), EGU General Assembly 2023, Vienna, Austria, 23–28 Apr 2023, EGU23-4342, https://doi.org/10.5194/egusphere-egu23-4342, 2023.

EGU23-4574 | Orals | HS5.5

Emerging Opportunities and Challenges of Anticipatory Actions for Disaster Preparedness 

Paul Block, Kylie Southard, Donghoon Lee, and Juan Bazo

Disasters and their associated physical and social risks pose challenges for local, national, and international relief agencies and disaster management organizations globally.  Novel approaches are desperately needed for vulnerable communities.  Combining season-ahead predictions, proactive management strategies, and communication efforts in disaster planning represents an emerging field in disaster management, particularly when paired with short-term early warnings and post-disaster response.  However, these long-lead action protocols are still in their infancy as only a few have been activated - triggering and financing preparedness actions.  While these protocols have generally been rigorously established, a holistic evaluation of the framework, including interactions, feedbacks, and dynamic components, is urgently warranted.  Open questions across both physical and social aspects remain, including agreeable triggers for action, clarity of roles and responsibilities, and sufficiency of funding.  The large number of disparate actors involved and the highly interdisciplinary nature lead to a complex decision-making setting.  Further, most protocols are static plans, yet disasters, impacts, infrastructure, communities, and vulnerability states are all dynamic, changing in time; how can protocols better reflect a changing world?  Surveys of disaster agencies and communities help to highlight how decision-makers perceive flood-related risk and vulnerability, and how these perceptions impact disaster preparedness and risk communication. These insights, paired with additional holistic analysis for hazard planning and management, are critical for developing proactive preparation and response strategies.  We will discuss the current state of anticipatory actions related to disaster management, followed by current barriers and potential opportunities toward reduction of disaster impacts and community vulnerability.

How to cite: Block, P., Southard, K., Lee, D., and Bazo, J.: Emerging Opportunities and Challenges of Anticipatory Actions for Disaster Preparedness, EGU General Assembly 2023, Vienna, Austria, 23–28 Apr 2023, EGU23-4574, https://doi.org/10.5194/egusphere-egu23-4574, 2023.

 Agriculture is one of the largest consumers of water and energy. This paper evaluated
the agricultural sustainability of the Chenmengquan irrigation district of China based on the
water–energy–food nexus. One objective weighting method and one subjective weighting method
were integrated, based on game theory, and a matter–element model was constructed to evaluate
agricultural sustainability for the research region. The sensitivity of each index to the evaluation class
was also analyzed. The results showed that agricultural sustainability was moderate in 2006–2012
and high in 2012–2015. The indexes, which represent water-use e
fficiency and yield per unit area
of crops, had higher sensitivities in the context of the present case study. The results also indicated
that agricultural sustainability had a comparatively positive trend between 2012 and 2015, and that
pesticide utilization was the most important issue for agricultural sustainability. The approach
of using the combination of a weighting method, based upon game theory, and the use of the
matter–element model provides a guide for the evaluation of agricultural sustainability
 

How to cite: Liu, C.: Evaluating Agricultural Sustainability Based on theWater–Energy–Food Nexus in the ChenmengquanIrrigation District of China, EGU General Assembly 2023, Vienna, Austria, 23–28 Apr 2023, EGU23-4655, https://doi.org/10.5194/egusphere-egu23-4655, 2023.

The impacts of multiple changes in climatic and socioeconomic conditions within countries and regions are spatially heterogeneous, thus complicating stringent agricultural water management. Here we developed a framework for the dynamic identification of zone types and provided targeted agricultural water management strategies for each zone in response to global change. Considering China as an example, eight zones of typical major grain crop production prefectures were identified based on an analysis of the spatial and temporal evolution characteristics at four levels (agricultural, natural, social, and economic) according to the water footprint of major grain crop production at the prefecture level for the past 15 years (2004-2018). We then presented the response of China's future zoning landscape for 2030, 2050, and 2080 under three representative scenarios by combining shared socioeconomic paths (SSPs) and representative concentration paths (RCPs). Results show that, by 2080, the national water consumption of the major grain crop production will increase under all scenarios. Half of prefectures facing function shifts are likely to change from low to high water consuming zones. Different zonal prefectures react differently under global changes, especially those that are prone to functional transformation, should pay attention to their instability. Consideration of the water footprint in agricultural zoning is of great importance for national sustainable water resources management. This study proposes a more explicit approach to coping with global change, that is, to propose locally appropriate agricultural water management strategies and measures for China and beyond.

How to cite: Ji, X., Zhuo, L., and Wu, P.: Spatial and temporal explicit and dynamic zoning of crop water consumption under past and future climate and socioeconomic changes: a case study of China, EGU General Assembly 2023, Vienna, Austria, 23–28 Apr 2023, EGU23-4699, https://doi.org/10.5194/egusphere-egu23-4699, 2023.

EGU23-5637 | ECS | Posters on site | HS5.5

Multi-objective trade-off analysis of conflicting water demands in the Chilean Laja River basin 

Zoë Bovermann, Elahe Fallah-Mehdipour, and Jörg Dietrich

Due to population growth, urbanization, industrial and agricultural development, water demands have increased especially during the recent decades. On the other hand, shortage of the available water resources is a considerable challenge for water allocation and conflict resolution particularly in the semi-arid regions. The Laja Lake is a natural reservoir located in the Bío-Bío Region of Chile. It provides water for different stakeholders including energy and agriculture. This lake releases water to the downstream river by natural seepage through the volcanic barrier and by a controlled outlet via a transmission line. Two hydropower plants have been constructed on the mentioned river and transmission line and four other hydropower plants have been built in a series downstream. However, agricultural stakeholders have rights to supply their irrigation water demands from the lake. Accordingly, the control of the upstream hydropower plant effects all other water users. In this research, optimal trade-offs between energy generation by the hydropower plants (transmission line and river) and supply of agricultural irrigation water have been determined by applying NSGA-II (non-dominant sorting genetic algorithm). A water balance simulation model has been coupled with NSGA-II to be applied for monthly time series of water availability and demand. Using TOPSIS (technique for order preference by similarity to ideal solution), a multi-criteria analysis method, the non-dominated solutions from ten runs have been reduced to a few solutions. They were used to perform a trade-off analysis among stakeholders to achieve an acceptable optimal operation. The results have been compared to those of the SOP (standard operating policy) and the actual reservoir operation. The application of trade-off analysis based on simulation-optimization results allowed finding a better compromise between different stakeholder utilities. Furthermore, the system’s analytic tool can be applied for different hydro-meteorological inputs and thus be used for predictive development of operation policies under changed climate.

Keywords: multi-objective optimization, conflict resolution, water-energy trade-offs

How to cite: Bovermann, Z., Fallah-Mehdipour, E., and Dietrich, J.: Multi-objective trade-off analysis of conflicting water demands in the Chilean Laja River basin, EGU General Assembly 2023, Vienna, Austria, 23–28 Apr 2023, EGU23-5637, https://doi.org/10.5194/egusphere-egu23-5637, 2023.

EGU23-6034 | ECS | Orals | HS5.5

From rain-fed to irrigated agriculture? Projecting the future irrigation water demand in Germany using a hydro-economic multi-agent system model 

Jasmin Heilemann, Mansi Nagpal, Christian Klassert, Michael Peichl, Bernd Klauer, and Erik Gawel

Climate change increases the frequency and severity of droughts in Central Europe and thereby threatens food production in the German agricultural sector, which is mostly rain-fed and heavily dependent on precipitation. Farmers need to adapt to these changing conditions, for instance by shifting to irrigated production systems. This increases the future agricultural water demand and may result in competition for water use and higher groundwater depletion. Simultaneously, farmers adapt their land-use patterns towards an optimal crop mix, responding to changes in climatic and economic conditions. This land-use adaptation also affects the irrigation water demand.

To project the future irrigation water demand in Germany considering land-use adaptation, we present the spatial multi-agent system (MAS) model DroughtMAS which simulates agricultural land-use adaptation of the 8 major field crops using a positive mathematical programming (PMP) approach. Each agent captures the behavior of farmers in one of Germany’s 401 NUTS-3 regions, is individually calibrated to the observed production conditions for a 20-year historic average, and is empirically validated for the same period. Therefore, the agent-based structure portrays the agroeconomic and biophysical heterogeneity of Germany. To consider uncertainties concerning future climate change levels and socioeconomic developments, we project the future land-use adaptation and irrigation water demand using integrated RCP-SSP scenarios. To this end, the MAS model is coupled to a statistical crop yield model driven by meteorological indicators and soil moisture, derived from the mesoscale Hydrologic Model (mHM). Projections of the agricultural crop prices are based on the SSP scenarios. The integrated hydro-economic model consequently reflects the adaptive behavior of agents responding to changing crop yields and prices.

The results emphasize the importance of accounting for land-use adaptation to accurately project farmers’ irrigation water demand and to consider changes in biophysical and socioeconomic variables simultaneously. Such estimates are crucial in planning for future agricultural water demands to prevent user conflicts and water resource depletion.

How to cite: Heilemann, J., Nagpal, M., Klassert, C., Peichl, M., Klauer, B., and Gawel, E.: From rain-fed to irrigated agriculture? Projecting the future irrigation water demand in Germany using a hydro-economic multi-agent system model, EGU General Assembly 2023, Vienna, Austria, 23–28 Apr 2023, EGU23-6034, https://doi.org/10.5194/egusphere-egu23-6034, 2023.

EGU23-6203 | ECS | Orals | HS5.5

A stochastic MPC framework for the control of pumping stations in polder systems with regard for uncertainty in inflow and hourly electricity prices 

Ties van der Heijden, Nick van de Giesen, Peter Palensky, and Edo Abraham

The Netherlands is a low-lying country situated in the Rhine-Meuse delta. A significant portion of the Netherlands is located below sea level, making the proper management of local and national waterways essential. Polders are used to manage groundwater levels, drain excess rainwater, and store water during times of drought. These polders often have pumping stations that pump water into drainage canals, like the Noordzeekanaal-Amsterdam-Rijnkanaal (NZK-ARK), which receives water from the Rhine river and four local water authorities and connects to the North Sea at IJmuiden through a pumping station and a series of undershot gates.

The operators of the NZK-ARK utilize Model Predictive Control (MPC) to schedule the discharge of water through the gates and pumps. The combination of the pump and gate discharge allows the NZK-ARK to discharge excess water to the North Sea when the sea water level is both higher and lower than the water level in the canal. However, traditional MPC can lead to suboptimal schedules when uncertainty is introduced, resulting from, for example, incoming discharge, fluctuating electricity prices, and the availability of renewable energy. Stochastic MPC allows for the consideration of uncertainty in decision-making, optimizing control actions based on a range of potential scenarios. In the future, the objectives for the control system of the gates and pumps may become more complex and may need to take into account factors like renewable energy availability and electricity prices. Ensuring the effective and efficient management of water in the Netherlands is critical, and the use of polders for water storage and control of groundwater tables, and techniques like MPC and stochastic MPC play important roles in achieving this goal.

In this study, we present a framework that combines probabilistic forecasting, scenario generation and reduction, and stochastic MPC to minimize energy costs associated with pumping at the NZK-ARK. This framework is based on probabilistic forecasts of electricity prices and incoming discharge and is specifically designed for use at the NZK-ARK. By considering the uncertainty present in electricity prices and incoming discharge, our framework allows for the optimization of control actions through the use of stochastic MPC. The ultimate goal of this approach is to reduce energy costs at the NZK-ARK by effectively managing the discharge of water through the pumps and gates while complying with local constraints.

How to cite: van der Heijden, T., van de Giesen, N., Palensky, P., and Abraham, E.: A stochastic MPC framework for the control of pumping stations in polder systems with regard for uncertainty in inflow and hourly electricity prices, EGU General Assembly 2023, Vienna, Austria, 23–28 Apr 2023, EGU23-6203, https://doi.org/10.5194/egusphere-egu23-6203, 2023.

EGU23-6817 | ECS | Orals | HS5.5

Modeling Sustainable Intensification of Agriculture under Resource Constraints 

Julian Joseph, Sylvia Tramberend, Diana Luna Gonzalez, Günther Fischer, and Taher Kahil

Sustainable Intensification of agriculture is a means to meet increasing future food demand in regions with rapidly growing populations and economies. In many of these regions, productivity is currently low. Increasing productivity while limiting additional use of resources such as water and land is therefore key to providing demanded and nutritious food in these countries. To model sustainable intensification, we build an optimization model. In its main economic specification, the objective of the model is to maximize farmer profit while at the same time respecting ecological boundaries. Therefore, constraints of the model are given by land availability and agronomic and climatic constraints to crop growth from the Global Agroecological Zones (GAEZ) method, as well as water availability derived from the Global Hydro-Economic Model (ECHO). The framework can be applied for either a single crop or multiple crops. The results of our analysis provide guidance on where and under which circumstances production of a crop can most efficiently be intensified. This can include the spatial distribution of irrigation or the allocation of several crops to optimally meet estimated demand. Demand is derived from projections of human population, economic growth and income elasticities. We use scenario analysis to examine how optimal sustainable intensification strategies change under different trade regimes for agricultural products and under different levels of climate resilience. Application of the model focuses on the East African extended Lake Victoria Basin (eLVB). In eLVB agroecological conditions are favorable for a wide range of crops, sufficient water is available in several sub-basins and population and food demand are projected to rapidly expand.

How to cite: Joseph, J., Tramberend, S., Luna Gonzalez, D., Fischer, G., and Kahil, T.: Modeling Sustainable Intensification of Agriculture under Resource Constraints, EGU General Assembly 2023, Vienna, Austria, 23–28 Apr 2023, EGU23-6817, https://doi.org/10.5194/egusphere-egu23-6817, 2023.

EGU23-7018 | ECS | Orals | HS5.5

Evaluating the global wastewater’s untapped irrigation potential 

Dor Fridman, Taher Kahil, and Yoshihide Wada

Wastewater has been increasingly considered an untapped resource rather than a waste. It can be used for water supply, aquifer recharge, energy generation, and fertilizer production, contributing concurrently to achieving multiple Sustainable Development Goals. Currently, treated wastewater is used for irrigation in different water-scarce countries like Israel and Spain. Recent estimates suggest that treated wastewater irrigates 6 million hectares (Mha) of cropland worldwide, with global potential for irrigating 31-42 Mha. Nevertheless, these estimates often do not account for environmental, social, and economic conditions that may limit this potential, including irrigated crops’ spatial distribution, water quality requirements, and water conveyance options.

Our study advanced a spatial-explicit analysis of four different technological scenarios and estimated the untapped potential of wastewater irrigation at a global, regional, and national scale. We found that utilizing treated wastewater for irrigation can satisfy up to 4% of the global irrigation demand. Considering only water-scarce regions, reduce this global potential to roughly 2%. However, intensification and expansion strategies or scenarios can increase this irrigation share. For example, in ten countries, delivering treated wastewater to croplands by canals adds over 5% to the share of treated wastewater relative to total irrigation demand. An increase of over 1% is evident in 30 countries, mainly in the Middle East, North Africa, and Western Europe.

Increased wastewater treatment capacity (i.e., expansion strategy) potentially increases the share of global irrigation demand satisfied with treated wastewater to 6% -12%. Some regions’ potential exceeds 20% of their irrigation demand, e.g., China and North America. An increase in potential wastewater irrigation becomes significant when considering expansion scenarios (e.g., increased capacities to treat the wastewater).

Considering the changes in different regions’ water scarcity, we find that the potential share of irrigation demand satisfied by treated wastewater is significantly increased in North America, the United Kingdom, Europe, and Western Asia. We conclude that irrigation with treated wastewater in these regions can be an important climate change adaptation measure. Besides, we show that intensifying and expanding wastewater reclamation systems can help manage droughts in regions with high drought risk, like the Italian Po and French Loire River basins.

By exploring expansion and intensification strategies to reclaim treated wastewater, this work establishes an essential step towards planning the global and regional pathways to utilize this untapped resource, abating current and future water scarcity risks.

How to cite: Fridman, D., Kahil, T., and Wada, Y.: Evaluating the global wastewater’s untapped irrigation potential, EGU General Assembly 2023, Vienna, Austria, 23–28 Apr 2023, EGU23-7018, https://doi.org/10.5194/egusphere-egu23-7018, 2023.

EGU23-8152 | ECS | Orals | HS5.5

Policies to Achieve Sustainability in the Colorado River Basin under Climate Change Conditions and Growing Demand: A Hydro-economic Analysis 

Daniel Crespo, Mehdi Nemati, Ariel Dinar, Zachary Frankel, and Nick Halberg

Colorado River Basin faces a supply crisis that makes the water system vulnerable to failure, economic losses, conflicts between regions and water users, and ecosystem degradation. The crisis results from water management that allows excessive water withdrawals, legal restrictions established on historical facts, and decreased water availability due to climate change. The agricultural sector, urban centers, hydropower production, and aquatic ecosystems compete for the exhaust water resources in the basin. Despite the reduction in per capita urban water usage and reduction of irrigated land, projections of population and economic growth and increasing crop evapotranspiration indicate an expansion of water demand. The shrinking water availability and growing demand for water will exacerbate existing problems, hampering water management. This article evaluates several alternatives to water management to identify the sectoral and spatial trade-offs of water use by the agricultural sector, urban centers, hydropower production, and aquatic ecosystems. A hydro-economic model is developed to assess current and alternative water allocation’s economic impact on drought, climate change, and growing population. The model examines coalition arrangements among some or all basin states, Tribal Nations and Mexico and the implementation of institutional reforms such as water markets, proportional sharing, and mechanisms that promote water savings. The development of existing but unused Tribal Nation rights is analyzed to evaluate its impact and to determine the potential for new agreements. Simulation shows that shrinking water allocation promotes efficiency improvements and strengthens the sustainability of the water system. However, droughts and climate change erode the benefits of water use and environmental conditions. Reductions in hydropower generation results in economic losses and higher greenhouse gas emissions. Urban centers endure heavy welfare reductions due to water use restrictions, but purchasing water from irrigation districts alleviates the burden and enhances the social surplus. Water markets and cooperation mitigate benefit losses but increase the pressure on ecosystems. Water exchange and side payments (for improved water savings) between states and irrigation districts indicate potential improvements in water use efficiency. Crops with high economic value that are irrigated with advanced technologies are maintained in production. Instead, field crop producers suffer from water shortages. Improvements in irrigation technology reduce the risk of exposure to water scarcity but curtail water returns than sustain ecosystems and downstream activities. Maintaining tribal Nations' rights and establishing environmental flows rectify the inefficient use of water by other users.

How to cite: Crespo, D., Nemati, M., Dinar, A., Frankel, Z., and Halberg, N.: Policies to Achieve Sustainability in the Colorado River Basin under Climate Change Conditions and Growing Demand: A Hydro-economic Analysis, EGU General Assembly 2023, Vienna, Austria, 23–28 Apr 2023, EGU23-8152, https://doi.org/10.5194/egusphere-egu23-8152, 2023.

EGU23-8799 | Orals | HS5.5

Water, Energy, Food and Ecosystems NEXUS: Gaps and opportunities to increase the policy impact of nexus research in Europe 

Barbara Willaarts, Sarah Milliken, Serena Caucci, Zeynep Okzul, Francesca Girotto, and Stanislav Martinat

Water, energy, food, and ecosystems (WEFE) are key resources that support human well-being and, as such, are security concerns for countries across the world. Awareness about the interconnection and interdependence between resource securities, the so-called “WEFE nexus”, is not new but the combination of intensifying resource demands, growing global uncertainties related to the ongoing climate crisis, and the geopolitical atmosphere, have intensified the interlinkages and amplified the cost of inaction and mismanagement of existing policies.

Promoting the development of sound and effective policies to deal with the growing security challenge and its spillovers on other sectoral domains, require actions across different fronts. A fundamental one is to strengthen the nexus research agenda in such a way that sufficient evidence is available and well communicated to inform the development of a more coherent and aligned policy framework.  This requires developing analytical frameworks that can help to unravel the complex interlinkages across sectors. But as important is to research how greater policy coherence can be achieved in practice and how to create the appropriate enabling environment i.e. nexus governance.

Scientific evidence on WEFE in Europe is substantial, and there is a wealth of scientific evidence probing the high interconnectedness that exists between natural resources, and how the sustained pressures we are exerting over them are generating cascading impacts and trade-offs. Despite the level of nexus science, there is barely any information available on the level of impact nexus research projects have had in shaping the policy agenda at the national or European level.

Our research builds on the efforts developed within the COST ACTION NEXUSNET (CA 20138) to map the nexus research projects funded by key European funding schemes (FP7, H2020, HORiZON, JPI Urban Europe, PRIMA) in the course of the last decade, and explore the type of nexus challenges addressed, main policy recommendations provided and the level of implementation of the proposed measures. Preliminary results show that between 2013 and 2022 more than 70 research projects and innovation actions have been funded, with over 222 case studies and demonstrators across European countries. A survey targeting case studies showcased that the level of implementation and adoption of proposed nexus policy measures was below 20%. These preliminary findings showcase that while the research effort in Europe on nexus has been substantive, the policy impact of such research remains unclear, and efforts are required to understand barriers and enablers to increase the relevance and policy impact of nexus research.

How to cite: Willaarts, B., Milliken, S., Caucci, S., Okzul, Z., Girotto, F., and Martinat, S.: Water, Energy, Food and Ecosystems NEXUS: Gaps and opportunities to increase the policy impact of nexus research in Europe, EGU General Assembly 2023, Vienna, Austria, 23–28 Apr 2023, EGU23-8799, https://doi.org/10.5194/egusphere-egu23-8799, 2023.

EGU23-9106 | Orals | HS5.5

Operations Eclipse Sequencing in Multipurpose Dam Planning 

Matteo Giuliani, Wyatt Arnold, Jazmin Zatarain Salazar, Angelo Carlino, and Andrea Castelletti

A resurgence of dam planning and construction is under way in several river basins where untapped hydropower potential could meet growing energy demands. In Africa, more than 300 new hydropower projects are under consideration. Yet, hydropower expansion is a contentious issue given the uncertainty in water and energy demand as well as the negative impacts of these infrastructures on other sectors. Despite calls for a more comprehensive evaluation of hydropower projects, most dams continue to be planned with traditional methods that neglect interdependencies between planning and management and the cumulative impacts of multiple new dams. Here, we use the transboundary Zambezi Watercourse in southern Africa to present a novel dam planning approach that integrates sequencing of planned reservoirs with adaptive, multipurpose operations to address increasing and competing demands for water, energy, and food in the region.

Results show how seeking compromise through operations while constructing dams early improves environmental and irrigation objectives by 50% and 80%, with an 8% loss in hydropower compared to an operation and sequencing strategy that singularly maximizes hydropower. Alternatively, seeking compromise only through delayed dam construction yields modest environmental and irrigation improvements of 6% and 9%, respectively, with a 22% loss in hydropower. Our findings indicate that while additional hydropower capacity reduces structural energy deficits, operating policies emerge as the main driver of human-environmental tradeoffs. Consequently, traditional single-objective operating policy selection may lead to erroneous perceptions of tradeoffs across infrastructure options. The robustness of this result is tested under an ensemble of stochastic hydrologic projections where environmental flow and irrigation deficits are found more sensitive to operations than shifts in water availability. The predominance of operating policies is relevant for improving multi-objective dam planning in other river basins already fragmented by dams built in the 20th century.

How to cite: Giuliani, M., Arnold, W., Zatarain Salazar, J., Carlino, A., and Castelletti, A.: Operations Eclipse Sequencing in Multipurpose Dam Planning, EGU General Assembly 2023, Vienna, Austria, 23–28 Apr 2023, EGU23-9106, https://doi.org/10.5194/egusphere-egu23-9106, 2023.

EGU23-9180 | ECS | Orals | HS5.5

Exploratory modeling and analysis to inform adaptive water management under deep uncertainty in the Peruvian Andes 

Randy Muñoz, Saeid Vaghefi, Fabian Drenkhan, Maria J. Santos, Daniel Viviroli, Veruska Muccione, and Christian Huggel

Mountains are an important source of freshwater for ecosystems and the livelihoods of around two billion people worldwide. However, this abundance of water resources is jeopardized by climatic and socioeconomic changes, particularly in the tropical Andes which are considered one of the most vulnerable regions to these impacts worldwide. Those changes not only impact water availability for local populations but also contribute to the declining health of the aquatic ecosystems reducing their provision of services to society. Adaptive water management has emerged as a concept to address such social and environmental challenges. However, there is limited information on how such an adaptive approach can be systematically implemented. Other important challenges in mountain regions include data scarcity (e.g. hydroclimatic or socioeconomic data), knowledge gaps (e.g. groundwater contribution to total runoff), and uncertain future climatic and socioeconomic changes (obtained from e.g. climate models or socioeconomic projections). All these knowledge gaps and limitations lead to deep uncertainties in water policies, the condition where experts do not know or cannot agree on which initial conditions and corresponding results are most relevant.

To deal with such deep uncertainties we tested the Exploratory Modeling and Analysis (EMA) framework to support adaptive water management. Therefore, we set a case study in the high-Andean Pitumarca catchment in the glaciated headwaters of the Vilcanota basin, Southern Peru. Three policy options were assessed along a large set of uncertainties to achieve water security for human and environmental needs by 2050. A total of 12,000 simulations were run, driven by three climate scenarios (SSP1-1.9, SSP1-2.6, and SSP5-8.5) and 15 climate models, and a wide range of irrigation and domestic water use scenarios.

Results from the applied EMA framework show that in 43% of simulations (5,182) the water system failed to supply water for human and environmental needs mostly driven by the way of implementation of water policies than by climatic or socioeconomic changes. The implemented framework also contributed to identify that a two combination of improvements of irrigation efficiencies and reservoir schemes can avoid system failures under a wide range of changes and uncertainties. These results highlight the importance of focused policy actions to deal with climatic and socioeconomic changes. Such a framework facilitates moving from traditionally broad problems that center on the impact of climate change to more specific and locally tailored questions, e.g. which reservoir scheme should be implemented to avoid system failure. In order to reduce uncertainties and optimize local water use, EMA should be combined with other methods such as citizen science, sensitivity analysis, joint knowledge production. Furthermore, EMA should be implemented through semi-distributed glacio-hydrological models to fully combine the advantages of different approaches and assess the spatio-temporal occurrence of water demand. We also encourage the use of socio-hydrological models where socioeconomic and environmental factors can actively interact.

How to cite: Muñoz, R., Vaghefi, S., Drenkhan, F., Santos, M. J., Viviroli, D., Muccione, V., and Huggel, C.: Exploratory modeling and analysis to inform adaptive water management under deep uncertainty in the Peruvian Andes, EGU General Assembly 2023, Vienna, Austria, 23–28 Apr 2023, EGU23-9180, https://doi.org/10.5194/egusphere-egu23-9180, 2023.

EGU23-10277 | ECS | Orals | HS5.5

Governing Common Pool Resources in Fragile Political Systems: Modelling Behaviour, Institutions, and Social-Ecological Dynamics 

Sophie Erfurth, Matthias Wildemeersch, Jacopo Baggio, Reetik Kumar Sahu, and Dustin Garrick

Groundwater user groups in Tunisia face severe collective action problems. Aquifer depletion leads to empty wells and farmers’ unwillingness to pay water fees leads to bankrupt user groups – both disastrous for the many communities that rely on irrigation agriculture for their livelihoods. What conditions or combination of conditions drive water user behaviour in a system that is governed by institutional uncertainty and bounded rationality? What conditions or interventions are effective in avoiding or delaying system collapse? What is the role of social norms, particularly trust and leadership, in overcoming collective action problems? Based on and expanding on the theory of common pool resource governance, this paper ties institutional results to environmental outcomes. The complex common-pool resource system studied here is simulated by an Agent-Based Model (ABM) of groundwater user decision-making. This systematic coupling of social and biophysical data and models offers new insights into simulating dynamic interactions between human behaviour, social norms, and the underlying resource. The project aims to provide a guideline for alternative modes of policy-making and implementation to address the main water governance challenge in Tunisia, i.e. groundwater overexploitation. 

How to cite: Erfurth, S., Wildemeersch, M., Baggio, J., Sahu, R. K., and Garrick, D.: Governing Common Pool Resources in Fragile Political Systems: Modelling Behaviour, Institutions, and Social-Ecological Dynamics, EGU General Assembly 2023, Vienna, Austria, 23–28 Apr 2023, EGU23-10277, https://doi.org/10.5194/egusphere-egu23-10277, 2023.

Economic analysis has considerable power to guide a number of water development proposals to inform climate adaptation planning.  Much work has appeared in recent years on valuing water resources to support that planning, but little theoretically rigorous analysis exists on valuing resources in over a wide range of physical and economic conditions in a general equilibrium setting.   Moreover, no published work to date has solved the inverse problem of inferring the parameters of a system of water production functions when observed data are constrained by a single observation.  This paper addresses an important inverse problem in water economics, namely the process of inferring from a single observation on land and water use the parameters of the underlying production functions. It solves an inverse problem by going from data on observed factor use, factor prices, commodity production, and commodity prices to the underlying production function parameters.  From the recovered production function parameters, marginal values of water are calculated over a wide range of water supply and economic conditions.   An example is illustrated for land and water development planning in the American Southwest.  This paper’s original contribution can inform policy debates internationally over competing proposals for climate adaptation planning.

How to cite: Ward, F.: A Simple Method of Water Valuation for Climate Planning, EGU General Assembly 2023, Vienna, Austria, 23–28 Apr 2023, EGU23-10363, https://doi.org/10.5194/egusphere-egu23-10363, 2023.

EGU23-11240 | ECS | Orals | HS5.5

The more wastewater reclamation, the less water stress? 

Dan Wang, Reetik Kumar Sahu, Taher Kahil, Ting Tang, Yuli Shan, and Klaus Hubacek

Wastewater treatment removes water pollutants and wastewater reclamation provides an alternative water supply. It is believed that increasing the rate of wastewater reuse and reclamation can reduce water stress. This study aims at understanding whether reusing more wastewater can help mitigate water stress in China. Through scenario analysis, it is found that the potential for reuse of reclaimed water under a water conservation scenario is only 12-56% of the actual situation, but regional water stress under a water saving scenario is 10-82% lower than the current reality. The results show that a higher amount of reclamation does not necessarily lead to a lower water stress in one region. The potential for wastewater treatment and reuse is determined by return flows, which can reduce water use efficiency and exacerbate water stress. To effectively alleviate water stress, it is important to not only increase wastewater reuse, but also prioritize water conservation.

How to cite: Wang, D., Sahu, R. K., Kahil, T., Tang, T., Shan, Y., and Hubacek, K.: The more wastewater reclamation, the less water stress?, EGU General Assembly 2023, Vienna, Austria, 23–28 Apr 2023, EGU23-11240, https://doi.org/10.5194/egusphere-egu23-11240, 2023.

EGU23-11645 | Posters on site | HS5.5

Microscale physicochemical- and biological configurations regulate microbial biogeochemical processes and functionality 

Gang Wang, Kun Zhu, David R. Johnson, Chujin Ruan, Josep Ramoneda, Guram Gogia, Hongyu Ran, and Peixuan Zhang

The microscale spatiotemporal heterogeneities of physicochemical- and biological properties and their variational dynamics are key factors regulating microbial activity, soil quality and functionalities. Yet little is known about the underlying mechanisms and impacts on the functioning biogeochemical processes of the earth-surface ecosystems typically the soil-water-microbe-climate nexus. Employing microscale experiments, we illustrate how small-scale water and nutrient configurations as well as those of biological (populations) and chemical (such as O2 and pH) gradients regulate microbial interactions and functionality, and impacts on soil carbon (C) and nitrogen (N) cycling. We firstly use pairs of fluorescently labelled bacterial strains and a hyphae-forming fungal strain that expand together across a nutrient-amended surface, and show that flagellar motility drives bacterial dispersal along the hyphal network, which counteracts the purifying effects of ecological drift at the expansion frontier and thereby increases the spatial intermixing and extent of range expansion of the bacterial strains. We further demonstrate that fungal hyphae are important regulators of bacterial diversity and promote plasmid-mediated functional novelty during range expansion in an interaction-independent manner. In addition, we employed a soil column experiment and illustrated that sufficient labile carbon from plant residues such as straw induced fast O2 consumption with microoxic development in the straw-soil interfaces. In the meantime, the porous structure of straw materials could enhance O2 diffusive inputs in the core area, and subsequently formed a a concentric ring-like microoxic area around the straw patch. Such enriched oxic-microoxic transient zones would induce nitrification coupled denitrification, which led to the high N2O emissions. Additionally, the microbial degradation of straw resulted in a pulse decline of soil pH, which possibly inhibited the N2O reductases, yielding enhanced N2O emissions. These results contribute to a better understanding of the driving factors for microbial interactions and possible impacts of soil key element (such as C and N) cycling.

How to cite: Wang, G., Zhu, K., R. Johnson, D., Ruan, C., Ramoneda, J., Gogia, G., Ran, H., and Zhang, P.: Microscale physicochemical- and biological configurations regulate microbial biogeochemical processes and functionality, EGU General Assembly 2023, Vienna, Austria, 23–28 Apr 2023, EGU23-11645, https://doi.org/10.5194/egusphere-egu23-11645, 2023.

EGU23-11769 | Orals | HS5.5

Strategies for Climate Smart Water Management in Awash River basin, Ethiopia 

Meron Teferi Taye, Sirak Tekleab, Robel Tilaye Geressu, Muluken Alemu, and Abdulkarim Seid

Awash River is the most utilized river basin in Ethiopia. The basin has a total of 110,000 km2. The water resources are exploited for various competing needs; domestic, agriculture, livestock's, energy, industry and environment. This study is aimed at enhancing the existing water resources management practices to make them climate resilient in light of climate variability and change. Frequent rainfall extremes, floods and droughts, an imbalance in water availability and demand, water over use in irrigated fields, water use competition and water quality deterioration are the key water management challenges of the basin. Small scale food producers reliant on rain-fed agriculture, small scale irrigators, pastoral and semi-pastoral communities are vulnerable to climate variability and experiencing its impact already. This study identified that their livelihoods are being impacted due to rainfall failure to produce adequate production in the growing period and shortage of fodder for their cattle due to limited soil moisture availability. Based on the identified problems and the existing water management practices, this study developed a conceptual framework, that encompass Climate Smart Water Management (CS-WM) definitions, CS-WM strategies, actions and recommendations to enhance the existing practices on multiple spatial scales. The proposed strategies briefly include improving data and information for more adaptive water resources planning and management, raising awareness and community engagement for improved water management; enhancing effectiveness of water management via technology and innovations, and enhancing alternative clean energy sources to support economic development while minimizing negative consequences of climate variability and change. The strategies and recommendations proposed are tailored to site specific locations and based on societal needs that could solve the identified water management problems and manage tradeoffs among different sectors in the basin.

How to cite: Taye, M. T., Tekleab, S., Geressu, R. T., Alemu, M., and Seid, A.: Strategies for Climate Smart Water Management in Awash River basin, Ethiopia, EGU General Assembly 2023, Vienna, Austria, 23–28 Apr 2023, EGU23-11769, https://doi.org/10.5194/egusphere-egu23-11769, 2023.

EGU23-11772 | Orals | HS5.5

Enhancing decision making tools for climate-smart water management in the Awash Basin, Ethiopia. 

Abdulkarim Seid, Robel Geressu, Sirak Tekleab, Muluken Alemu, and Meron Teferi Taye

Decision analysis techniques to meet water systems management challenges under climate change uncertainty have improved with advances in computational technology in the last decades. Infusing improved design and decision analysis techniques in developing countries can be of paramount importance given their higher vulnerability to climate change, fewer professionals with sufficient capacity, and generally high incentive for rapid expansion of low-cost solutions.  However, a large gap exists between scientific progress and practical and policy applications, especially in global south countries. In this paper we discuss the observed challenges in design, analysis and decision making process to achieve climate smart water management in the highly utilized Awash Basin of Ethiopia. The approach we followed is key-informant interviews with water professionals working across multiple disciplines (i.e., water supply, irrigation, hydropower infrastructure design) and working for different organizations (i.e., government ministries, research institutions, consultancy offices) and freelancers and academicians. Efforts were made to represent informants from different academic levels, gender, and professional responsibilities. The results demonstrate multiple but related challenges including the lack of incentive to apply changes at individual or institutional levels, cultural and policy inertia against transparency and public debate in decision making. Technical challenges emanate from the non-inclusion of up-to-date climate change science at higher education level along with lack of access to computational and communication technology. We present tailor made decision support tools to improve management by leveraging advances in computational and visualization of large data to reveal tradeoffs and synergies of water and food systems at multiple watershed scales.  Efficient and timely solutions for vulnerable small-scale producers can be best achieved by changing the role of institutions to reflect local capacity in the water system management sector.  Proposed solutions to help tackle these challenges include overhaul of the skill requirement for water resources professionals along with continuous skills training and evaluation.

How to cite: Seid, A., Geressu, R., Tekleab, S., Alemu, M., and Taye, M. T.: Enhancing decision making tools for climate-smart water management in the Awash Basin, Ethiopia., EGU General Assembly 2023, Vienna, Austria, 23–28 Apr 2023, EGU23-11772, https://doi.org/10.5194/egusphere-egu23-11772, 2023.

Droughts are among the most severe natural disasters, but are difficult to prepare for because of their slow
onset. In absence of effective drought early warning systems and response plans, water users often
continue to pursue short-term economic gains that ultimately come at the expense of longer-term
economic and ecological sustainability. Fortunately, seasonal forecasts have shown promise for informing
adaptive water management policies that can reduce these impacts. One avenue of adaptation is through
reservoir operations, where seasonal streamflow forecasts can enable hedging of releases to favor more
frequent but less impactful water shortages over more devastating impacts down the line. This can be
achieved by optimizing reservoir operating policies that define how much water to release from a network
of reservoirs as a function of these seasonal forecasts. However, the best functional form for such policies
is an open research question.

The goal of this project is to compare alternative formulations of reservoir operating policies conditional
on seasonal climate forecasts to see which is most effective in reducing economic and ecological drought
impacts. We investigate this question in the Colorado River Basin (CRB). Commonly termed the
“lifeblood of the West,” the Colorado River provides irrigation water for over 5.5 million acres of
agricultural land, drinking water for more than 40 million people, and over 4000 MW of installed
hydropower capacity. Yet managing this system is becoming increasingly challenging due to ongoing
climatic and anthropogenic drought conditions that jeopardize water security and endanger the river’s
ecological health. To improve water security in the basin, this project aims to optimize reservoir operating
policies in Lake Mead, Lake Powell, and three upstream reservoirs by coupling a RiverWare reservoir
model of the CRB with Borg, a multi-objective optimization algorithm, to reduce the frequency and
severity of water shortages to the Upper Colorado River Basin (UCRB), Lower Colorado River Basin
(LCRB), and Mexico. In this study, we explore different ways of incorporating seasonal forecasts of the
inflows to these five reservoirs into their operating policies considering different functional forms of the
operating policies using a model-free, closed loop optimal control method called Direct Policy Search
(DPS). Specifically, we compare using logistic and Gaussian Radial Basis Functions (RBFs) for the
reservoir rules. Our work illustrates the value of integrating streamflow forecasts into reservoir operating
rules for drought management, while also providing insights into how to formulate the policies to
maximize that value.

How to cite: Singh, S., Quinn, J., Wiens, N., and Smith, R.: Determining the best functional form of reservoir operating policies to maximize the value of integrating seasonal streamflow forecasts into reservoir operations in the Colorado River Basin, EGU General Assembly 2023, Vienna, Austria, 23–28 Apr 2023, EGU23-12001, https://doi.org/10.5194/egusphere-egu23-12001, 2023.

EGU23-12212 | ECS | Posters on site | HS5.5

Revised Min-Max (RMM) Approach for Two-Objective Reservoir Operation 

Tewelde Hagos Gebremedhin, Paolo Colosio, Marco Peli, Thi Hien Nguyen, Hai Yen Nguyen, Stefano Barontini, and Roberto Ranzi

Due to the changing climate, rapid development, and population growth, the current management of water resources is expected to be critically affected. The majority of reservoirs are multipurpose including water supply, flood control, hydropower production, etc., and often involve several competing interests. Most of the current reservoir management practices are ineffective, outdated, and highly subjective. Therefore, it is necessary to re-evaluate the current management rules for optimizing the objectives, reduction of water stress, and mitigation of climate change impacts.

Lake Como is a regulated lake in Northern Italy and the third largest lake, receiving water from the upper Adda River and controlled downstream by the “Olginate” regulation dam. The regulation dam has been constructed to manage the release according to irrigation and hydropower demand. In addition, it regulates the water level in the Lake within a certain threshold (i.e., upper, and lower bounds), to prevent flooding in the town of Como and to allow navigation and for environmental reasons.

This research mainly focuses on optimizing two conflicting objectives, the satisfaction of irrigation demand which is parametrized by α (the ratio between the actual release and the agricultural demand), and upstream flood regulation in the city of Como parametrized by β (the ratio between the actual active storage and the reference storage). Considering the characteristics of the reservoir and the targeted objectives, an optimal operating strategy has been developed by adopting a deterministic Revised Min-Max (RMM) approach. It focuses on the determination of the minimum water level required to satisfy the irrigation demand and the maximum water level to avoid flooding for a specified value of α and β. This approach is based on simulating the continuity equation for a set of 71 years of inflow and outflow time series, from 1946 (the operation of the Olginate dam began) to 2016. besides, the outflow time series was used to simulate the current management policy and historical efficiency of the system in terms of α and β.

Out of the several feasible solutions (combinations of α and β), we are interested in efficient (Pareto optimal) solutions, where there are no other solutions that can improve either α and/or β. We evaluate three possible management strategies depending on the storage condition and the feasible solutions with different combinations of α and β through a trade-off analysis. The first tends to approach historical average levels (BAUL: Business As Usual Level); the second approaches the historical average releases (BAUR: Business As Usual Release); the third one allows to modulate of the releases with the parameter delta (0< δ <1), which tends to satisfy irrigation demand (δ=0) or flood control (δ=1). In summary, this study shows that the current operating rule can be substantially improved with respect to both objectives, with an improvement of 19% in terms of irrigation demand satisfaction and 69% in terms of flood control.

How to cite: Gebremedhin, T. H., Colosio, P., Peli, M., Nguyen, T. H., Nguyen, H. Y., Barontini, S., and Ranzi, R.: Revised Min-Max (RMM) Approach for Two-Objective Reservoir Operation, EGU General Assembly 2023, Vienna, Austria, 23–28 Apr 2023, EGU23-12212, https://doi.org/10.5194/egusphere-egu23-12212, 2023.

EGU23-13969 | ECS | Orals | HS5.5

Closing the loop between water supply and demand in the Nile River Basin under global change 

Veronica Piuri, Elena Matta, Guang Yang, Matteo Giuliani, George Papagiannis, Athanasios Yannacopoulos, Martina Sardo, Davide Danilo Chiarelli, Maria Cristina Rulli, Phoebe Kondouri, and Andrea Castelletti

Arid and semi-arid regions such as the Middle East and North Africa are increasingly suffering from water scarcity, exacerbated by climate change and population growth. This trend calls for new strategies for managing water demand and supply to face global changes in social-economic development, water system expansions, and cross-border differences.

In this work, we explore the potential to mitigate the existing conflicts over the Nile River Basin, interconnecting water demand and supply using novel technological solutions, such as desalination and aquaponics, combined with traditional uses (i.e., groundwater extraction and water reuse). We analyse the complex dynamics and tradeoffs between energy production and irrigation water supply in Ethiopia, Sudan, and Egypt. We propose innovative portfolios of interventions that combine the coordinated operation of large water dams (i.e., the Grand Ethiopian Renaissance, Merowe, and High Aswan) and the main irrigation diversions with smart water demand management options. Desalination involves the process of removing salt and other minerals from seawater, making it suitable for irrigation and other domestic uses. Aquaponics involves the cultivation of fish and plants in a symbiotic environment, with the waste produced by the fish providing nutrients for the plants and the plants purifying the water for the fish. This technology can be an efficient and sustainable way to produce food with very low water consumption.

Our approach is used to study current and future tradeoffs, generating solutions that are efficient and resilient to future hydroclimatic and demographic scenarios. We first quantified the impacts of dynamically downscaled and bias-adjusted climate projections for three Representative Concentrated Pathways (i.e., RCP2.6, RCP4.5 and RCP8.5) on the runoffs of the main tributaries of the Nile. We also considered stochastic projections of water demand based on Shared Socioeconomic Pathways (SSPs), and a strategic model that reallocates crops according to future climatic and demographic scenarios, according to a balanced diet and agricultural intensification strategy to generate a positive impact on food self-sufficiency.

Our results show that the Nile River Basin features both strong tradeoffs and synergies across riparian countries, with the irrigation supply in Sudan playing a major role in allocating water between competing sectors. The results show a decrease of up to 20% of the Nile River's runoff and a doubling of the Egyptian municipal demand in the most severe scenario that leads to exacerbating tensions between the three countries. Notably, the potential reduction of the Egyptian water demand through different combinations of aquaponics, desalination, reuse, and groundwater pumping in the Nile Delta, along with a substantial decrease in Sudan irrigation demand through crop reallocation, can contribute to mitigating existing and future conflicts. Further technological improvements are needed for attaining large water demand reductions via soilless agriculture and desalination, which today cannot completely substitute reuse and groundwater contributions, whose high exploitation can induce relevant environmental risks.

How to cite: Piuri, V., Matta, E., Yang, G., Giuliani, M., Papagiannis, G., Yannacopoulos, A., Sardo, M., Chiarelli, D. D., Rulli, M. C., Kondouri, P., and Castelletti, A.: Closing the loop between water supply and demand in the Nile River Basin under global change, EGU General Assembly 2023, Vienna, Austria, 23–28 Apr 2023, EGU23-13969, https://doi.org/10.5194/egusphere-egu23-13969, 2023.

Future water security will be determined by climate change along with socio-economic changes, driving water availability, water demands and catchment conditions. Over recent decades, hydrological models have evolved to incorporate the effect of anthropic activities that allow them to explore the main challenges and opportunities regarding global water security. These advances have been underpinned by progress in high-resolution and large-scale data availability, as well as in computational and data storage capabilities. Hydrologists are currently capable of developing high-resolution large-scale hydrological models designed to represent and study the global hydrological cycle, and even to zoom-in on specific regions essentially removing the barriers between global and regional models. However, the use of these modelling approaches is often seen with suspicion by end-users, be it regional water managers or water users, who may consider that their personal knowledge and understanding of the catchments where they carry out their activities is disregarded in favour of novel technologies.

Indeed, despite their growing sophistication, the current generation of LHMs is not yet exempt of limitations in their ability to represent dynamic trade-offs in the water-food-energy-environment nexus, and water competition between upstream and downstream users in complex water resources systems. These limitations hinder the ability of LHMs to provide reliable insights at the regional or local levels, leaving the task of incorporating human water management activities within these models as one of the grand challenges for the hydrologic research community. The inclusion of this local knowledge into LHMs’ modelling process can, therefore, increase their capacity to support rigorous nexus analyses to inform water policy and management decisions. Unfortunately, the access to these data may be limited by several inconveniences such as overprotective water authorities, language access barriers, or simply not existing at all. This work explores to what extent the inclusion of local knowledge can improve the performance of globally formulated models as well as their reliability to support decision making on the ground. We discuss what type of data might be more relevant and what should be the priorities in data acquisition to maximise the output of modellers efforts.

To demonstrate this, we built a CWatM model of the Ebro River catchment in Spain using large-scale datasets to later substitute or enhance such datasets with data obtained from local and regional specific datasets available from local authorities and water users. The additional data/enhancements were included in separate and cumulative steps. The model improvements were assessed comparing the model results against gauged flows, reservoir storage, water demand and supply, and the system’s drought indicator. The findings of this study will assist in the transition of globally formulated models to being applied locally by identifying the priorities in data gathering and advances in modelling capabilities, ensuring that they provide reliable outputs to inform decision making.

How to cite: Haro Monteagudo, D., Momblanch, A., Smilovic, M., and Burek, P.: Do we need better models or more local knowledge? Assessing the added value of using locally sourced data over larger-scale datasets in regional to local hydrological modelling, EGU General Assembly 2023, Vienna, Austria, 23–28 Apr 2023, EGU23-14991, https://doi.org/10.5194/egusphere-egu23-14991, 2023.

EGU23-15150 | ECS | Orals | HS5.5

The water-energy-food nexus through the valuation of ecosystem services in an Andes-Pacific transboundary catchment. 

Alicia Correa, Jorge Forero, Daniele Codato, Mark Mulligan, and Jorge Marco Renau

Global change has economic, environmental, and social impacts that threaten access to water resources for communities and ecosystems globally. Mismanagement in other sectors, such as food and energy, can further reduce water security. Scientists use the water-energy-food (WEF) nexus as a conceptual tool to identify the interactions between these three systems. Its implementation at natural-local scales (catchments) is essential for proposing sound policies for water resource management and adaptation to global change.
This study aims to identify synergies and trade-offs between WEF through the valuation of related ecosystem services in an Andean-Pacific transboundary catchment of Ecuador and Colombia (Mira-Mataje - 11,791 km2). We used remotely- sensed and globally available datasets in the spatially distributed assessment model Co$tingNature, to first screen interactions of the related ecosystems. Subsequently, we analyzed the polycentric knowledge from stakeholder’s: Non-Governmental Organizations (NGOs), community leaders, academics, and State sector workers. Finally, we combined the above analyses into a WEF-related ecosystem services weighted-hypernetwork.
Preliminary results show that some services related to energy and food production have negative impacts on water security throughout the catchment. We identify a significant overlap between areas rich in ecosystem services and ancestral territories of ethnic communities and recognize some key intensive anthropogenic activities that affect water security. In addition, we confirm the paramount dependency of Andean cities on water supply from mountain ecosystems. We identified a widespread perception among stakeholders that WEF-related ecosystem services are at risk due to global change and that, in different ways, all are taking steps to adapt to global change. Finally, there is the potential availability of water service in medium and low catchment areas, although the challenge is to improve distribution and purification systems to supply rural areas and make water service accessible to all.


Keywords: Ecosystem services, water-energy-food, remote sensing, weighted-hypernetwork, local knowledge, transboundary tropical catchment.

How to cite: Correa, A., Forero, J., Codato, D., Mulligan, M., and Marco Renau, J.: The water-energy-food nexus through the valuation of ecosystem services in an Andes-Pacific transboundary catchment., EGU General Assembly 2023, Vienna, Austria, 23–28 Apr 2023, EGU23-15150, https://doi.org/10.5194/egusphere-egu23-15150, 2023.

EGU23-15269 | ECS | Orals | HS5.5

Water, Energy, Food  and Nexus' Weaknesses 

Icen Yoosefdoost and Slim Zekri

The water, food, energy and environment (WFEE) Nexus has recently gained attention from researchers and policymakers. This paper reviews the WFEE Nexus articles. Google Scholar search engine was used for the survey.  By examining the articles, we found that 48 articles focused on this approach. Our systematic review found that existing nexus tools rarely used social science methods and failed to apply replicable methods. Our review indicates that  The environment was considered in the nexus after 2017.  The term “Environment”  was only mentioned in 14% of these articles (Fig.1). In articles, we found close synonyms to “Environment,” such as “Earth”; “Ecosystem,” but also the term “Climate.” WFEE approach survey the interdependencies between water demand sectors and social, economic and environmental changes in water resource and demand management. WFEE is a water-centred approach. Based on the (Zhang et al., 2019) study, it is necessary to strengthen the interaction between resources management in different sectors in a structured way. Otherwise, actions in one system of resources will affect another system of resources.  Hence, the value of WFEE for coproducing adaptation scenarios (Momblanch et al., 2019).  Applying the nexus is complex as it needs many inputs and tools for capturing nexus interactions (Albrecht et al., 2018a; Kaddoura and el Khatib, 2017). In order to accomplish this, it is necessary to use methods from various disciplines (Albrecht et al., 2018a), depending on the analysis's aim, scope, and scale. An integrated systems perspective is enhanced by a multidisciplinary approach(Al-Saidi and Elagib, 2017; Khan et al., 2018), which facilitates sector-specific decision-making and planning. The WFEE has been analyzed using a wide range of modelling tools. There are some tools, such as WEAP (Sieber, 2006) and OSeMOSYS (Akute and Cannone, 2022), that follow a silo-based approach in which only one element of nexus is considered (Albrecht et al., 2018b; Leck et al., 2015; Smajgl et al., 2016). while other integrative application like MuSIASEM [44] combines the three modules, food, energy and Water (Fig.2). A significant gap is the lack of attention to the dynamic concept and the interaction between the components. To assess the effects of climate change, most studies combined various hydrological models, such as hydro-economic models,HEM (Bekchanov et al.,2019), WAEP, LHMs (Monteagudo et al., 2022), with IPCC scenarios. However, downscaling IPCC scenario output with different models is a relatively confident technique for climate data and water resources at the basin level (Yoosefdoost et al., 2022), incorporating this downscale output into the environment models are challenging. It is a big limitation to assess one section of the environment without considering the impact of the other parts. The environment is a complex system with all its parts interconnected. Moreover, since several factors affect the environment, using downscaled data on the environment reduces the reliability of the results. To address these issues, the article (Correa-Cano et al., 2022) proposes a conceptual structure for the WEFE modelling package, a system dynamic model combining hydraulic, environmental, and economic models(Fig.3).

Keywords: WFEE, weaknesses

How to cite: Yoosefdoost, I. and Zekri, S.: Water, Energy, Food  and Nexus' Weaknesses, EGU General Assembly 2023, Vienna, Austria, 23–28 Apr 2023, EGU23-15269, https://doi.org/10.5194/egusphere-egu23-15269, 2023.

EGU23-16179 | Orals | HS5.5

GoNEXUS-SEF: A novel participatory framework to co-design and evaluate water-energy-food-ecosystems nexus solutions 

Adrián González-Rosell, Maria Blanco, and Imen Arfa

Currently, achieving food, energy and water security, and the conservation of ecosystems, are some of the main sustainability challenges. Traditionally, in these sectors, the policy measures and decisions have been taken separately, causing a lack of coordination and high trade-offs across sectors. Consequently, it is necessary to design policies or solutions capable of addressing cross-sectoral challenges. The water-energy-food-ecosystems nexus (WEFE nexus) approach analyses the impacts generated by socioeconomic activities on the production, consumption and management of water, energy and food resources, and the interrelationships with ecosystems. In this sense, the use of this approach can facilitate the identification of coherent solutions that promote the transition toward sustainability.  In this study, an evaluation framework for co-designing and evaluating nexus solutions (GoNEXUS SEF) to improve the governance of the WEFE nexus is presented. GoNEXUS SEF is a new methodological framework developed by the authors and has five main phases: (1) identify nexus solutions; (2) nexus dialogues; (3) model toolbox; (4) nexus evidence; and (5) nexus-coherence assessment. For its development, the ability to evaluate at different spatial scales and forecast at different temporal scales through data projections has been considered. GoNEXUS SEF is a participatory process that integrates qualitative and quantitative methods. On the one hand, we engage stakeholders and experts from the different nexus sectors to understand the cross-sectoral interlinkages, identify challenges, and co-design solutions. On the other hand, we apply system dynamics models (SDM), cross-impact analysis (CIA), and network theory to quantify the synergies and trade-offs.

The framework was applied to a practical case study, an increase in the irrigation water price in Andalusia – Spain for the horizon 2030. Case study results revealed that a water price change could generate synergies since it favours water security and ecosystem conservation. However, trade-offs are observed, mainly undermining the food sector in the region. The main difficulties in applying the framework are the integration of qualitative and quantitative information and the conciliation of the spatial and temporal scales across sectors. Beyond the results obtained, the evaluation of this case allowed us to examine the applicability, usefulness, and potential of the framework. GoNEXUS SEF has proven capable of evaluating nexus solutions; it highlights hidden properties and identifies leverage points and key aspects of complex cross-sectoral systems. In addition, it allows the evaluation and coordination of multiple policies at the same time; in that sense, it can help to achieve nexus-coherence policymaking. The framework can be adapted to fit different case studies, considering their own challenges and their spatial and temporal scales, which gives it a competitive advantage over other methodologies focused on analysing the nexus. Participatory approaches, that combine qualitative and quantitative methods, are adequate to identify and evaluate solutions that aim to improve nexus governance.

Acknowledgements:  This research has received funding from the European Union’s Horizon 2020 research and innovation programme under the GoNEXUS project (grant agreement No 101003722). 

How to cite: González-Rosell, A., Blanco, M., and Arfa, I.: GoNEXUS-SEF: A novel participatory framework to co-design and evaluate water-energy-food-ecosystems nexus solutions, EGU General Assembly 2023, Vienna, Austria, 23–28 Apr 2023, EGU23-16179, https://doi.org/10.5194/egusphere-egu23-16179, 2023.

EGU23-16263 | Orals | HS5.5

Multi-sector assessment and design for large scale water-energy-food-environment systems in Africa 

Julien Harou, Mohammed Basheer, Mikiyas Etichia, Jose Gonzalez Cabrera, Mathaios Panteli, and Alvaro Calzadilla

Interdependencies between resource systems are projected to increasingly complicate efforts to develop individual water, energy, food and environment sectors and set their growth policies. Given the urgent need to mitigate climate change, investments in energy and water supply security are being co-driven by financial and international political incentives to decarbonize, and so the scrutiny of plans to modify interconnected resource systems will continue to increase. Additionally, given multiple government needs and priorities, economic, environment and social dimensions should be explicitly considered in the prioritisation of new interventions, whether they be new policies or new infrastructure. This talk considers two river basins in Africa, the Nile river basin and the Volta river basin. It describes efforts of the ‘Future Design and Assessment of water-energy-food-environment Mega-Systems’ (FutureDAMS) project to understand and recommend new interventions in these systems at country or multi-country scale. To this end four technical pillars were needed: credible and computationally efficient large-scale simulation of individual sectors, a multi-agent software integration framework that connects disciplinary models at run time, an efficient search technology to sift through large intervention spaces given multiple objectives and multiple uncertainties including climate change, and stakeholder facing tools and outputs. The talk reviews in detail two areas of model building and their application: linking river basin and economic analysis and linking river basins and regional power grids for joint intervention assessment. The talk will discuss which issues most complicated modelling, what solutions were found, and how future research might improve upon them to generate more useful understanding and decision-support for multi-sector human-natural systems.

How to cite: Harou, J., Basheer, M., Etichia, M., Gonzalez Cabrera, J., Panteli, M., and Calzadilla, A.: Multi-sector assessment and design for large scale water-energy-food-environment systems in Africa, EGU General Assembly 2023, Vienna, Austria, 23–28 Apr 2023, EGU23-16263, https://doi.org/10.5194/egusphere-egu23-16263, 2023.

EGU23-16277 | ECS | Orals | HS5.5

The benefits of rural electrification to improve water access and irrigation in Sub-Saharan Africa, a water-energy-land assessment framework applied to Zambia. 

Adriano Vinca, Giacomo Falchetta, Gregory Ireland, Marta Tuninetti, Muhammad Awais, Edward Byers, Francesco Semeria, and Vittorio Giordano

Sub-Saharan Africa has a large portion of the population with no access to electricity, piped drinking water, or sanitation services. The lack of these basic services also affects farmers that mostly rely on rainfed agriculture instead of irrigation. Given the expected population growth and potential changes in hydrology and crop yield response due to climate change, future development for the region needs to be carefully studied to achieve increased access to basic services and, potentially, synergetic economic benefits in agriculture.

Within the LEAP-RE 4 AFRI project, we developed a framework that combines three high-resolution, single-sector simulation models (crop water requirements, electricity demand and rural electricity dispatchment) to a long-term water-energy-land integrated assessment model to explore different scenarios of future development for Zambia. This helps understand which regions would benefit of better water access and irrigation potential due to improved rural electrification.

We compare two scenarios of moderate and universal electricity-water access with a current trend scenario, we compare the expected costs and benefits for the rural population, including the economic benefits achievable by improving irrigation standards and crop yields.

Although Zambia is a relatively water-abundant region, we focus on it as a case study with a framework that can be transferred to any other country in Sub-Saharan Africa, where climate change impact might have a significant impact on water scarcity, electricity generation potential and crop yields.

How to cite: Vinca, A., Falchetta, G., Ireland, G., Tuninetti, M., Awais, M., Byers, E., Semeria, F., and Giordano, V.: The benefits of rural electrification to improve water access and irrigation in Sub-Saharan Africa, a water-energy-land assessment framework applied to Zambia., EGU General Assembly 2023, Vienna, Austria, 23–28 Apr 2023, EGU23-16277, https://doi.org/10.5194/egusphere-egu23-16277, 2023.

EGU23-17551 | ECS | Posters virtual | HS5.5

Testing Effectiveness of Forecast Based Financing as Compared to Traditional Emergency Response: A Case Study of West Pokot County -Kenya 

Naomi Wambui Ng’ang’a, Halima Saado Abdillahi, Sarah Nduku Nzau, and Zachary Mwambi Misiani

Extreme weather events such as floods and droughts annually affect thousands of people in Kenya disproportionally affecting the poor, elderly, disabled, women and children. Currently, natural disaster response is frequently reactive rather than proactive resulting in increased suffering among the most vulnerable, high response costs and duplication of efforts among humanitarian actors. Forecast based financing (FbF) can play a critical role in mitigating disaster impacts. Less evidence however, is documented about the effectiveness of implementing FBF compared to traditional emergency response. In 2019, Kenya Red Cross Society (KRCS) in partnership with National FbF Technical Working Group (TWG) began developing National Flood and drought Early Action Protocols (EAP). The goal was to minimise potential damage and loss of life by acting early, before the hazard reached its peak. In 2021, the drought EAP was activated after attaining trigger thresholds indicating below average seasonal rainfall for October-November-December rains. This provided a good opportunity for real-time testing of effectiveness of the selected/prioritised early actions.

This paper presents findings of a study conducted to compare the effectiveness of FBF to emergency response a case study of West Pokot County where the drought EAP was activated. The study adopted quasi-experiment approach to measure different outcomes between beneficiary households of AA and Control group/Emergency Response beneficiaries of similar vulnerability.

A total of 388 respondents participated in the survey where 260 were beneficiaries of AA while 128 were non-beneficiaries. With regards to food security, 24.6% of the AA beneficiaries sampled obtained food from own production compared to 17.2% non-beneficiaries. Few (8.5%) AA beneficiaries borrowed food from relatives compared to 13.3% of the non-beneficiaries. More (41.8%) children under-five from AA beneficiary households had three meals and some food/snack in between compared to 31.6% from non-beneficiary households. Very few (25.4%) adults from AA households ate only one meal compared to 35.2% from non-beneficiary households. The coping strategy index for the AA beneficiaries was (3.1) while for the non-beneficiaries was (3.8).

In addressing water scarcity, more (11.6%) beneficiaries’ households had access to borehole water compared to 7.7% non-beneficiaries. Distance to water sources was higher among the non-beneficiary where 52.5% non-beneficiaries spend between 30 mins-1hour to collect water compared to 43.0% beneficiaries. Beneficiaries noted changes that came as a result of the AA in water to be: reduction in water borne diseases cases (5.0%); access to cleaner/safer water (96.7%); reduced amount of money spent on water (8.3%); meals prepared regularly (12.4%) and improved hygiene (38.8%).

Lessons documented included: Community participation and stakeholder coordination are essential for the successful implementation of AA. To ensure timely implementation of AA, it is necessary to combine community knowledge of seasons with scientific forecasts and streamline institutional readiness. Flexible funding is the most effective way to take early action in the window of opportunity between forecast and disaster.

Study findings show that anticipatory actions have a positive impact on reducing the effects of drought on water scarcity and food insecurity. Furthermore, AA have a higher benefit to cost ratio, indicating their cost-effectiveness and return on investment.

How to cite: Wambui Ng’ang’a, N., Saado Abdillahi, H., Nduku Nzau, S., and Mwambi Misiani, Z.: Testing Effectiveness of Forecast Based Financing as Compared to Traditional Emergency Response: A Case Study of West Pokot County -Kenya, EGU General Assembly 2023, Vienna, Austria, 23–28 Apr 2023, EGU23-17551, https://doi.org/10.5194/egusphere-egu23-17551, 2023.

EGU23-2523 | Posters on site | HS5.6

Investigate the Optimization of Micro-hydropower in Agricultural Channels in the Water-energy-food Nexus 

Jen-Chieh Shih, Fu-Yuan Lin, Ming-Der Hong, Hong-Ru Lin, and Jet-Chau Wen

Micro-hydropower is an excellent source of renewable energy. There is no need to build additional DAMs, so it has the advantages of lower setup costs and construction times and reduces greenhouse gas emissions during the generation process. Central and southern Taiwan is mainly developed by agriculture, especially the Zhuoshui River Basin, which has a large watershed area, developed agricultural irrigation system, abundant water source and stable flow, so it is suitable for the installation of micro-hydropower. Its micro-hydropower generation mainly uses the kinetic energy of water to drive the turbine to generate electricity, and the water in the agricultural channel does not disappear with the installation of the turbine.

Therefore, this study selected Linnei channel in the Zhuoshui River Basin in central Taiwan as the research site. It is Linnei channel, an agricultural irrigation channel with a stable flow rate, and the first group of micro-hydropower generation was installed in Linnei channel in 2018, and the second groups of micro-hydropower generation were installed in 2020. Therefore, this study measured the water level and flow of the Linnei channel from 2018 to 2022 to analyze the flow changes with or without micro-hydropower generation. Using rice planting evaluate the agricultural economic output value brought by irrigation water. Since 2019, the addition of hydropower generation increased the income brought by hydropower generation. The benefits and costs of each year are compared, and the economic analysis method is used to evaluate whether the installation of hydropower generating units is worth the investment and whether they can get benefits. The results showed that the increase of channel water volume could lead to more rice harvest, but there was no positive correlation between power generation and irrigation water volume. The addition of additional micro-hydropower in 2022 with sufficient irrigation increased net profit margin by only 0.02%, compared to 0.07% in 2019 with less irrigation. It shows that the relationship of the water-energy-food nexus has not yet been optimized, and in the future add the interaction between energy and water to optimize the profit of the system.

How to cite: Shih, J.-C., Lin, F.-Y., Hong, M.-D., Lin, H.-R., and Wen, J.-C.: Investigate the Optimization of Micro-hydropower in Agricultural Channels in the Water-energy-food Nexus, EGU General Assembly 2023, Vienna, Austria, 23–28 Apr 2023, EGU23-2523, https://doi.org/10.5194/egusphere-egu23-2523, 2023.

EGU23-3396 | Posters on site | HS5.6

Simulating French hydropower operations in a land surface model 

Laure Baratgin, Jan Polcher, Philippe Quirion, and Patrice Dumas

Climate change and water management are expected to have significant impacts on river flows. Hydropower production is therefore expected to evolve, while low carbon electricity could become more valuable in the context of the transition towards sustainable societies.

Hydrological models have been used to evaluate the potential of hydropower plants based on simulated flows. Some of these studies represent dams and water management. However, dam operation is done independently for each dam or each river basin, without considering the specificities of hydroelectric reservoirs whose operation results from an optimization of the entire power system.

We propose and validate a demand-based method to represent hydropower in the routing module of a land surface model at the scale of a national power grid. First, hydropower infrastructures are placed in coherence with the hydrological network and links are built between reservoir and power plants. Then, coordinated dam operation is simulated by distributing the total electric demand to be satisfied by hydropower over the different power plants.

The method is developed within the routing scheme of the ORCHIDEE land surface model, so that changes in climate or land use can be considered in future studies.

We calibrate and validate the model by simulating hydropower production in France over the period 2012-2018 using SAFRAN climate forcing data and comparing it to available observations of hydropower generation. Several rules for the dispatch of production between the power plants are compared and evaluated.

We show that an operating rule based on climatological inflows, reservoir volumes and hydraulic heads can simulate a dispatch of production that enables the model to replicate hourly hydropower plants output throughout the period.

How to cite: Baratgin, L., Polcher, J., Quirion, P., and Dumas, P.: Simulating French hydropower operations in a land surface model, EGU General Assembly 2023, Vienna, Austria, 23–28 Apr 2023, EGU23-3396, https://doi.org/10.5194/egusphere-egu23-3396, 2023.

EGU23-8275 | Posters on site | HS5.6

Estimating flows for hydropower: leveraging value from national scale hydrological modelling 

Nevil Wyndham Quinn, Michael Horswell, and Declan Wyrill

National-scale estimates of flow for determining hydropower suitability are invariably dependant on some form of the Drainage Area Ratio (DAR) method, where flows at a point of interest for hydropower are assumed to be a proportion of flows measured elsewhere in the catchment, based on a fixed ratio of respective catchment areas. This method is widely used globally.

Recent UK national-scale modelling, using a variety of models, has established a significant set of reconstructed daily flows for many locations (G2G model: 260 catchments (flows: 1891-2015); GR4J model: 303 catchments (flows: 1891-2015); Decipher model: 1366 catchments (flows: 1962-2015)). These reconstructed flows supplement the national set of flow observations maintained in the UK National River Flow Archive but have the advantage that in many cases reconstructed timeseries cover a longer period than observed records. Although these are useful datasets, unless the site of hydropower interest approximates a gauged/modelled location, the problem of estimating flows at a different point, remains.

The reconstructed datasets mentioned above include a national scale 1km x 1km grid of monthly flows generated by the G2G model (1891-2015). As these are gridded flows at high spatial resolution, it may be possible to estimate daily flows at a required location, based on a variable ratio of monthly flows for the respective locations – rather than a fixed area ratio.

We propose and test a method for leveraging understanding from gridded monthly output for several locations within the Trent catchment. Daily flows at these locations are already known and were used for validation. We calculated monthly ratios of gridded flows at the sites of interest to those at a driver site, where daily flow is available. This variable monthly flow ratio was then applied to the daily flow at the driver location to estimate daily flow at the site of interest. Flow duration curves were compiled to compare flows using (i) the DAR method, (ii) the proposed flow factor method and (iii) the observed flows. Results generally indicated that the flow factor method provides good estimates (within 5 to 14% of recorded flow), and a significant improvement in flow estimation compared to the DAR method. However, for some locations, both methods performed poorly, and we explore possible reasons.

How to cite: Quinn, N. W., Horswell, M., and Wyrill, D.: Estimating flows for hydropower: leveraging value from national scale hydrological modelling, EGU General Assembly 2023, Vienna, Austria, 23–28 Apr 2023, EGU23-8275, https://doi.org/10.5194/egusphere-egu23-8275, 2023.

EGU23-8318 | ECS | Posters virtual | HS5.6

Does prioritizing environmental flows compromise demand satisfaction and hydropower production in the Nagarjuna Sagar reservoir? 

Akshay Sunil, Riddhi Singh, and Manvitha Molakala

The trade-offs between human water needs and environmental considerations have always been challenging for water resources management and governance. Multi-purpose reservoirs present a particularly challenging decision context where multi-sectoral water and energy demands have to be balanced, while also considering the instream water requirements downstream. A systematic framework to evaluate the trade-offs between demand satisfaction, hydropower production, and satisfaction of minimum environmental flows (MEFs) would help reservoir operators better understand the consequences of various operational choices. In this study, we designed two formulations of a multi-purpose reservoir operation problem; one that prioritized MEF (PF_MEF) releases over demand satisfaction and another that did not (PF_nMEF). We identified Pareto approximate strategies to operate the reservoir for each formulation using the Borg multi-objective evolutionary algorithm considering multiple objectives related to water demand satisfaction, hydropower production, prevention of flood exceedance thresholds, and satisfaction of MEF. We applied the framework to the Nagarjuna Sagar (NS) reservoir in southern India. Reservoir operation strategies were modeled using direct policy search (DPS), where piecewise nonlinear Gaussian radial basis functions (RBFs) are used to condition decisions, and reservoir releases for hydropower in this case, on reservoir storage states. Results show that the Pareto approximate strategies resulting from optimizing for PF_MEF and PF_nMEF attain MEF - MEF in ranges 86-98% and 56- 79%, respectively. However, the ensuing compromises in water demand satisfaction and hydropower production are not considerably higher. Mean volumetric demand deficits and mean annual hydropower production ranged from 99.9 -818.1 Mm3 (48.13-818.8 Mm3) and 3252-3900 Gwh (3394- 3910 Gwh) for PF_MEF (PF_nMEF). Notably, we were able to identify strategies from PF_MEF that attained low values of volumetric demand deficits and high values of hydropower production, indicating that prioritizing MEFs may not necessarily yield compromises for human-related objectives in this case.

How to cite: Sunil, A., Singh, R., and Molakala, M.: Does prioritizing environmental flows compromise demand satisfaction and hydropower production in the Nagarjuna Sagar reservoir?, EGU General Assembly 2023, Vienna, Austria, 23–28 Apr 2023, EGU23-8318, https://doi.org/10.5194/egusphere-egu23-8318, 2023.

EGU23-11288 | ECS | Posters virtual | HS5.6 | Highlight

Promising future for sustainable hydropower development in the Upper Indus basin 

Sanita Dhaubanjar, Arthur Lutz, Saurav Pradhananga, Sonu Khanal, Wouter Smolenaars, Arun Bhakta Shrestha, and Walter Immerzeel

Hydropower is developing rapidly in Asia with limited concerns for long-term sustainability of hydropower plants. In the Indus, a four-fold increase in the 2020 hydropower capacity is envisioned by 2040 in Pakistan alone. Using the Hydropower Potential Exploration (HyPE) model, we investigate the future of hydropower potential in the Upper Indus basin (UIB) to inform such rapid expansion. HyPE uses a spatial cost-minimization framework to evaluate theoretical, technical, financial and sustainable hydropower potential considering the impact of natural, technical, financial, anthropogenic, environmental, and geo-hazard constrains on hydropower development. The model performs optimal siting and sizing of two run-of-river hydropower plant types under these varied constrains to minimize the unit cost of production at both the individual site and the basin scale. HyPE is run with current and future hydrology simulated using a cryosphere-hydrology model to understand the implication of climate change on the available potential in the UIB. Future hydrology is simulated using ensembles of spatially downscaled CMIP6 general circulation models (GCMs) covering a wide range of possible climatic futures under three combinations of the Shared Socio-economic Pathways (SSP) and the Representative Concentration Pathways (RCPs): SSP2-RCP4.5, SSP3-RCP7.0 and SSP5-RCP8.5.

The majority of the projections suggest an increase in annual average discharge. Over 50% increase in average annual discharge and subsequently theoretical potential is seen by the end of the century in the warm-wet corner under SSP5-RCP8.5. Increases in technical, financial and sustainable potential are slightly lower than that for theoretical potential. Some decline as much as -9% is seen only in the cold-dry corner under SSP2-RCP4.5. Higher increases in potential of all classes are seen in the western parts of the basin than in the eastern parts. Also, changes in low flows (-36 to 190%) are more extreme than in high flows (-52 to 109%) resulting in a boom in small projects in the future hydropower potential portfolios. Consequently, the cost curves at the sub-basin scales shift as the nature of hydropower plants vary more across the sub-basin. Furthermore, simulating the actual energy generation of historical and future hydropower portfolios under future hydrology reveals the robustness gained by considering climate change from the initial stages of hydropower design.

Promisingly, even the sustainable potential remains sufficient to establish energy security with intra-basin energy sharing in the UIB in the future. Fulfilling energy security in the downstream regions of the UIB countries, however, will require closer evaluation of how the spatial variation in sustainable hydropower across the UIB may be best leveraged. Sustainable hydropower development should be combined with other renewable energy sources to balance water utilization for hydropower versus other usage throughout the Indus for simultaneous fulfilment of the sustainable development goals (SDG) for water, energy and food security. Most importantly, the positive future of hydropower potential demonstrates that there is already enough leeway to consider factors beyond technical and financial criterion to also incorporate energy justice in sustainable hydropower development.  

How to cite: Dhaubanjar, S., Lutz, A., Pradhananga, S., Khanal, S., Smolenaars, W., Bhakta Shrestha, A., and Immerzeel, W.: Promising future for sustainable hydropower development in the Upper Indus basin, EGU General Assembly 2023, Vienna, Austria, 23–28 Apr 2023, EGU23-11288, https://doi.org/10.5194/egusphere-egu23-11288, 2023.

EGU23-13625 | ECS | Posters on site | HS5.6

MODWT-based outflow decomposition and individual contribution of regulation sites over Paranapanema river basin 

Thais Fujita, Luz Adriana Cuartas, Juliana Andrade Campos, Caluan Rodrigues Capozzoli, Jorge Alberto Martins, Edmilson Dias de Freitas, and Cintia Bertacchi Uvo

The viability of hydropower production depends on water and energy distribution, storage capacities, and technical constraints. Understanding the sensitivity of runoff variability to hydroelectricity production is a step to better assess its potential and add value to society. In this study, we explored the decomposition of hourly outflow data of hydropower power plants (HPP) operation for a 22-year period into scale-dependent coefficients using the maximal overlap discrete wavelet transform (MODWT) over the Paranapanema river basin. The wavelet analysis of the historical time series shows that the operational coordination of the cascade hydropower system leads the watershed to behave as a space-time filter. This filtering is applied to the process of temporal aggregation of rainfall into the generation of runoff and results in periodic fluctuations due to retention and release of outflow in regulation sites, from run-of-river facilities and regulation dams. These regulated patterns manifest over several scales, dominated by hydropeaking, and diminished seasonal signals.

We found that MODWT effectively describes the broadband of sub-daily and weekly flow cycles from fluctuating electricity demand. The decomposition analysis, which partitions the signal's energy across detail coefficients and scaling coefficients, also showed that the recognition of site-specific, each HPP, infers the individual filtering contributions of regulation points and provides a complementary metric to identify the practices and policies that affect outflows across the watershed. The increase in total energy by scales, the sum of decompositions, from upstream to downstream indicates the presence of spatial and temporal relationships with outflow magnitude. In addition, it highlights the coordination of the joint operation and how its cumulative effects serve energy generation, which implies matching consumer demand and supply.

How to cite: Fujita, T., Cuartas, L. A., Andrade Campos, J., Rodrigues Capozzoli, C., Alberto Martins, J., Dias de Freitas, E., and Bertacchi Uvo, C.: MODWT-based outflow decomposition and individual contribution of regulation sites over Paranapanema river basin, EGU General Assembly 2023, Vienna, Austria, 23–28 Apr 2023, EGU23-13625, https://doi.org/10.5194/egusphere-egu23-13625, 2023.

EGU23-14261 * | ECS | Posters on site | HS5.6 | Highlight

Integrating intermittent renewables via hydropower alone adversely impacts other sectors 

Jose M. Gonzalez, Eduardo A. Martínez-Ceseña, Mathaios Panteli, and Julien J. Harou

Large-scale integration of intermittent renewable sources in Africa, such as solar and wind, can accelerate the transition to low-carbon energy systems, which is critical to mitigate the impacts of climate change and increase electricity access. Hydropower can support this transition because its operational flexibility can be used, in a cost-effective manner, to counteract the variability and seasonality of intermittent renewables. However, using hydropower to provide energy system flexibility services can affect aquatic ecosystems and create intersectoral conflict. We use a multi-objective design framework to address this issue and demonstrate it on a national-scale case study for Ghana. This case study shows that available hydropower flexibility can be deployed to support expanding intermittent renewables by 38%. However, this would increase the sub-daily flow variability of the main national river (Volta) by up to 22 times compared to the historical baseload hydropower operation that does not support intermittent renewables. The increase in sub-daily flow variability is estimated to damage the river ecosystem and reduce national crop yield revenue by up to US$169 million per year. We propose an alternative approach that uses a diversified investment strategy, including intermittent renewables, bioenergy, and transmission network expansion in addition to existing hydropower, and show that such designs can maintain acceptable flow variability and agricultural performance while meeting future national energy service goals and reducing CO2 emissions. The proposed framework can support governments and power system planners by designing efficient diversified energy investment portfolios and highlighting their sectoral and emission trade-offs.

How to cite: Gonzalez, J. M., Martínez-Ceseña, E. A., Panteli, M., and Harou, J. J.: Integrating intermittent renewables via hydropower alone adversely impacts other sectors, EGU General Assembly 2023, Vienna, Austria, 23–28 Apr 2023, EGU23-14261, https://doi.org/10.5194/egusphere-egu23-14261, 2023.

EGU23-15407 | Posters on site | HS5.6

Design of small hydropower plants under uncertainty: from the hydrological cycle to energy conversion 

Panagiotis Pagotelis, Konstantinos Tsilipiras, Antonis Lyras, Anastasios Koutsovitis, Georgia-Konstantina Sakki, and Andreas Efstratiadis

We investigate the design of small hydropower plants under multiple sources of uncertainty and contrast it with the conventional deterministic practice that leads to a unique solution. In particular, we emphasize three sources of uncertainty, referring to: (a) the rainfall process, (b) the rainfall-runoff transformation, and (c) the flow-energy conversion. The first is due to the natural (i.e., hydroclimatic) variability, and is represented through stochastic approaches. Regarding the rainfall-runoff uncertainty, this arises from inherent structural shortcomings and poor parameter identifiability across the calibration procedure. In fact, hydrological model parameterizations using only historical data are often insufficient for accurately predicting catchment behavior over the long term, as they may not capture the full range of hydroclimatic conditions that the catchment may be subjected to. To address this issue, we use synthetic time series as drivers to parameterize the model and validate it against observed data. This approach preserves the probabilistic properties and dependence structure of the observed data while also providing a much wider range of hydroclimatic conditions for model training. In addition, it allows for assessing and quantifying the total model uncertainty. The final source of uncertainty is depicted by means of probabilistic efficiency curves. This Monte Carlo simulation-optimization framework is formalized as a modular procedure, where the different sources of uncertainty, as well as the full context, is tested through the design of a small hydropower plant in Epirus, Western Greece.

How to cite: Pagotelis, P., Tsilipiras, K., Lyras, A., Koutsovitis, A., Sakki, G.-K., and Efstratiadis, A.: Design of small hydropower plants under uncertainty: from the hydrological cycle to energy conversion, EGU General Assembly 2023, Vienna, Austria, 23–28 Apr 2023, EGU23-15407, https://doi.org/10.5194/egusphere-egu23-15407, 2023.

EGU23-16887 | ECS | Posters virtual | HS5.6

How Hydropower Operations Mitigate Flow Forecast Uncertainties to Maintain Grid Services in the Western US 

Daniel Broman, Nathalie Voisin, Jordan Kern, Scott Steinschneider, Henry Ssembatya, Sungwook Wi, and Sean Turner

Hydropower facilities in the United States (US) most often have non-powered objectives, for example storage and release of water for water supply or environmental benefit, or flood control. These objectives can limit the flexibility available to hydropower operations to generate power to provide maximum benefit to the power grid. There does exist however flexibility within a week to optimize hydropower generation while still ensuring non-powered objectives are met. We examine the flexibility available to optimize generation and the value of medium-range inflow forecasts using a dynamic programing reservoir optimization model applied at ~250 hydropower facilities over the US Western Interconnection. Optimization is performed using day-ahead hourly scheduling to reflect existing electricity markets, using Locational Marginal Prices (LMPs) provided by a production cost model, and using three flavors of medium-range inflow forecasts – perfect forecasts representing an upper limit on performance, persistence forecasts representing a lower benchmark, and synthetic forecasts as a surrogate for operational streamflow forecast products. Measures of direct performance and flexibility are examined at the grid-scale for Balancing Authorities within the Western Interconnection. This study highlights where and under what conditions medium-range forecasts influence flexibility in hydropower operations which will be increasingly valuable under an evolving grid with increased renewable penetration.

How to cite: Broman, D., Voisin, N., Kern, J., Steinschneider, S., Ssembatya, H., Wi, S., and Turner, S.: How Hydropower Operations Mitigate Flow Forecast Uncertainties to Maintain Grid Services in the Western US, EGU General Assembly 2023, Vienna, Austria, 23–28 Apr 2023, EGU23-16887, https://doi.org/10.5194/egusphere-egu23-16887, 2023.

EGU23-2006 | ECS | Orals | HS5.7

Soft-linking climate-land-water-energy assessment and planning models for sustainable development in rural Africa: preliminary results from the LEAP-RE RE4AFAGRI project 

Giacomo Falchetta, Muhammad Awais, Edward Byers, Vittorio Giordano, Gregory Ireland, Francesco Semeria, Marta Tuninetti, Adriano Vinca, and Ackim Zulu

In rural areas of Africa most communities live in poverty and lack access to services such as electricity and clean cooking fuels, water supply that is safe for human use, sufficient and nutritious food, crop irrigation systems, and appliances and services that can foster income generation. Promoting sustainable development requires an integrated understanding and planning along such dimensions. In the context of the RE4AFAGRI (“Renewables for African Agriculture”) project of  LEAP-RE (Long-Term  Joint  Research  and  Innovation  Partnership  on  Renewable  Energy between  the European Union and the African Union), four models representing land-water-crop-food-energy requirements and dynamics (WaterCROP, M-LED, OnSSET and MESSAGE-NEST) are calibrated and soft-linked. The ultimate aim is to enable a multi-scale, multi-sectoral assessment and planning of technologies and policies that can promote integrated sustainable development in the region. Here we present preliminary results for a set of scenarios in the country-study of Zambia. Results can inform both public decision-makers and private companies engaging in those sectors. The approach and open-source modelling platform are readily scaled and adapted to other countries and regions.

How to cite: Falchetta, G., Awais, M., Byers, E., Giordano, V., Ireland, G., Semeria, F., Tuninetti, M., Vinca, A., and Zulu, A.: Soft-linking climate-land-water-energy assessment and planning models for sustainable development in rural Africa: preliminary results from the LEAP-RE RE4AFAGRI project, EGU General Assembly 2023, Vienna, Austria, 23–28 Apr 2023, EGU23-2006, https://doi.org/10.5194/egusphere-egu23-2006, 2023.

EGU23-3075 | Orals | HS5.7

Water-energy-food-ecosystem nexus governance: methodological aspects of the assessement of supportive and restrictive contexts 

Isabelle La Jeunesse, Caro E. Mooren, Stefania Munaretto, Frank Hüesker, Claudia Cirelli, Ingrid Canovas, Eva Sievers, and Kaoutar Mounir

Managing water resources in a sustainable way means, a fortiori in the context of increasingly visible climate change impacts, taking into account decisions made by other sectors having a significant effect on the availability and quality of water. Water quality and quantity are often affected by the energy sector on the one hand, and agriculture and food production on the other. Moreover, ecosystem requirements, such as minimum ecological flows or water quality, should always be considered. Thus, facing climate change impacts calls for increasing water-energy-food-ecosystems nexus considerations.

This being said, how can managers of these natural resources and stakeholders using them consider intersectoral coherence needs? Are these needs only theoretical or are they reflected by concrete actions in practice? Last but not least, how to assess the state of WEFE nexus governance in territories?

In order to address these questions, the present paper describes the methodological aspects of the WEFE nexus governance assessment tool (NXGAT) co-developed in the NEXOGENESIS project (H2020-funded). This tool assesses the state of the WEFE nexus governance in catchments. The goal of the NXGAT is to highlight what is actually supportive and what is actually restrictive to WEFE nexus governance.

The NXGAT is the first step in the WEFE nexus governance approach (Hüesker et al., 2022 ; Mooren et al., 2022) aiming at developing WEFE nexus policies. The NXGAT lays the foundation for cross-sectoral dialogue by both raising awareness and identifying solutions for more WEFE nexus governance.  The NXGAT assesses five dimensions (levels and scales; actors and networks; problem perspectives and goal ambitions; strategies and instruments; and responsibilities and resources) and five qualities (extent, coherence, flexibility, intensity of action, and fit) of the governance system. The tool is implemented in the Lielupe transboundary catchment (Lithuania-Latvia) by a team of transdisciplinary experts during face-to-face interviews. Interviewees are selected to cover the multi-scalar levels of all sectors.

The results of the implementation in the Lielupe transboundary catchment provide preliminary results on the efficiency of the method and the importance of the preparatory phases of the field investigation. The implementation of the NXGAT contributed to both underline blockages and leverages to urge for more intersectoral governance in this case study.

How to cite: La Jeunesse, I., Mooren, C. E., Munaretto, S., Hüesker, F., Cirelli, C., Canovas, I., Sievers, E., and Mounir, K.: Water-energy-food-ecosystem nexus governance: methodological aspects of the assessement of supportive and restrictive contexts, EGU General Assembly 2023, Vienna, Austria, 23–28 Apr 2023, EGU23-3075, https://doi.org/10.5194/egusphere-egu23-3075, 2023.

Nexus research is advancing from knowledge creation towards public awareness and inclusiveness for civil society, public-private partnerships, and knowledge partners. Nexus research was mainly focused on a better understanding of interlinkages between the relevant resources at stake (e.g., water, energy, food, and ecosystems), the focus is increasingly searching for building communities, training, and career development. 

Research on the WEFE nexus increasingly aims to create platforms building capacity among institutions, knowledge partners, and capacity development. Educational and learning programs are developed by hot spots of the nexus. Expanding transdisciplinary research methods could facilitate building a community and network of nexus professionals. Capacity development and awareness are also critical for the successful planning and implementation of nexus practices. Some successful examples of knowledge creation for inclusiveness are shared.  The presentation will identify some key enablers and measures to advance the nexus in practice. Nexus research benefits from advancing along this route.


How to cite: Brouwer, F.: Nexus research for sustainability and inclusiveness in practice, EGU General Assembly 2023, Vienna, Austria, 23–28 Apr 2023, EGU23-4370, https://doi.org/10.5194/egusphere-egu23-4370, 2023.

EGU23-5114 | Posters on site | HS5.7

Analysis of Transboundary Water-Food Nexus based on Physical-Virtual Water and Food Trade Network 

Sanghyun Lee, Makoto Taniguchi, Naoki Masuhara, Seung-Hwan Yoo, and Yun-Gyeong Oh

This study aimed to analyze the interaction among watershed, food-producing, and food-demanding areas through the connected system of physical-virtual water flows and local food networks in terms of the transboundary water-food nexus, even though they might not be geographically connected. Here, we analyzed the potential food network of local rice among 47 prefectures in Japan using the gravity model and estimated the physical-virtual water flows (PVWFs) by lining the physical water flow in food-producing areas and virtual water flow embedded in the food network. Through in-and out-degree centralities of the food network, we found that the results of degree centrality revealed which prefecture was more influenced by the changes in self-supply ratios (SSRs) of local rice. As all prefectures intended to increase consumption of local rice that was produced in their area, the scale of the food network was reduced, as shown by the decrease in in-and out-degree centralities. Based on the food network, we analyzed the dependency of food-demanding areas on each watershed based on a connected system of PVWFs. In a case study of the Kansai region, the northern watershed directly affected Hyogo, which was also indirectly influenced by Osaka in terms of PVWFs. In the food network with 20% SSR, the PVWF was estimated to be 189.17 x 10⁶ m3·yr-1 from the northern watershed to Osaka in the food-producing area of the northern watershed, showing higher interaction of Osaka with the northern watershed than with other watersheds.

How to cite: Lee, S., Taniguchi, M., Masuhara, N., Yoo, S.-H., and Oh, Y.-G.: Analysis of Transboundary Water-Food Nexus based on Physical-Virtual Water and Food Trade Network, EGU General Assembly 2023, Vienna, Austria, 23–28 Apr 2023, EGU23-5114, https://doi.org/10.5194/egusphere-egu23-5114, 2023.

EGU23-5826 | ECS | Orals | HS5.7

Systems Innovation Approach: stakeholders’ involvement for a climate resilient region, a Living Lab at the Main River basin 

Teresa Pérez Ciria, Raul Wood, Marion Zilker, Gunnar Braun, and Ralf Ludwig

Climate change poses major challenges globally and is likely to exacerbate competition for water, land, and energy resources. In the Main River Basin (Germany), this will have considerable consequences for agriculture, forestry, water, and energy management. At present, most adaptation measures are sector-focused, but the challenges are interconnected. The region is at risk for being pushed beyond its resilience threshold and therefore, a holistic and multi-sectoral strategy is urgently needed to achieve a new level of responsiveness to cope with climate change impacts.

The co-design and co-production of science-driven technical, social, and cross-sectoral innovations and governance is required to build new and climate resilient transformation pathways. A systemic transformation of the region requires time and broad societal support, which must be considered when formulating development paths. To address these challenges, Systems Innovation Approach (SIA) is implemented. This method aims at going beyond the immediate problems to better understand the underlying patterns, and how we can learn and adapt as the system continues to change. The Main River basin is one of the nine pilot areas of the EU funded ARSINOE project (Climate-resilient regions through systemic solutions and innovation) that are implementing innovative technological approaches. Stakeholders’ engagement is ensured through the so-called Living Labs. In the ARSINOE project, Living Labs are a participatory research tool often used in planning, product design and innovation which brings together a collective of key stakeholders to explore a focal issue. Living Labs act as open innovation spaces which foster co-creation with users and the focus is to better solve stakeholder needs.

Through a series of workshops supported by SIA tools (mental mapping of interconnected challenges, future common vision using Sustainable Development Goals (SDGs) as guiding principles, backcasting) we have created an open atmosphere with committed participants that are willing to collaborate to tackle future climate challenges in the Main River region. This contribution presents our successful experience turning research into practice, lessons learnt and challenges we faced to ensure the participants’ engagement.

The presented study is supported by the project ARSINOE (GA: 101037424), funded under EU’s Horizon 2020 research and innovation programme.

How to cite: Pérez Ciria, T., Wood, R., Zilker, M., Braun, G., and Ludwig, R.: Systems Innovation Approach: stakeholders’ involvement for a climate resilient region, a Living Lab at the Main River basin, EGU General Assembly 2023, Vienna, Austria, 23–28 Apr 2023, EGU23-5826, https://doi.org/10.5194/egusphere-egu23-5826, 2023.

Measures that aim to reduce greenhouse gas emissions also have impacts on achieving other Sustainable Development Goals (SDGs). Given the enormous challenge of achieving the goals of the Paris Agreement and the SDGs, insight into these impacts provides information on how to improve feasibility of climate change mitigation measures by maximizing the co-benefits and managing the risks of possible trade-offs across SDGs. In this paper, we explore the impact of twenty promising climate mitigation measures on achieving the other SDGs for eleven world regions. Using the IMAGE modelling framework, the paper explores the GHG emissions reduction potential of these measures aggregated by sector under three scenarios. Based on peer-reviewed articles, the impact of the measures on other SDGs is assessed for the top three sectors with the highest GHG reduction potential in each region. We conclude that the number of synergies between the selected climate change mitigation measures and other SDGs dwarf the number of trade-offs in all regions. The magnitude of these synergies and trade-offs, however, varies by regional and socio-economic context. In high- and middle-income regions, the mitigation measures show few trade-offs that are generally associated with technology choices that could aggravate inequality and impact biodiversity. In low-income regions, some measures, especially land-use related ones, could interfere with efforts to reduce poverty, end hunger and improve well-being, if not complemented by additional policies that aim to protect the poor from increasing food and energy prices.

How to cite: Dagnachew, A. and Hof, A.: Climate change mitigation and SDGs: modelling the regional potential of promising mitigation measures and assessing their impact on other SDGs, EGU General Assembly 2023, Vienna, Austria, 23–28 Apr 2023, EGU23-7411, https://doi.org/10.5194/egusphere-egu23-7411, 2023.

EGU23-7541 | ECS | Orals | HS5.7

Towards climate resilience: paving dynamic adaptation pathways for regional climate change hot-spots 

Dionysios Nikolopoulos, Iosif Spartalis, Christodoulos Pantazis, Nikos Pelekanos, Georgios Moraitis, Klio Monokrousou, and Christos Makropoulos

Climate change is one of the biggest challenges of recent times, with worldwide economic, societal, and environmental impacts. In response to these challenges, the European Union (EU) proposed the EU Green Deal which sets a blueprint that commits on transforming the EU into the first climate neutral continent by 2050. To this end, innovative solutions for climate-change adaptation and mitigation measures must be implemented in regional and local scales. The H2020 Green Deal project IMPETUS aims to develop and validate a coherent multi-scale, multi-level, cross-sectoral adaptation framework for climate change, paving the way towards a climate-neutral and sustainable future. This will be achieved by building on resilience knowledge and by co-designing together with local communities and stakeholders, innovative packages of methodological, technical, governance and financial solutions. Two such solutions developed within the project are a) the strategic resilience and multi-hazard management tool for identifying dynamic climate adaptation pathways and b) the climate change hot-spot identification and prioritization tool. Through a co-creation approach, stakeholders identify region-specific indicators and metrics of interest that describe climate risk exposure, vulnerability, and adaptation capacity. The hot-spot analysis based on these metrics utilizes collections of spatiotemporal datasets, including future climate scenarios and projections, that describe key parameters from the human and climate dimensions, able to identify hot-spots associated with different climatic and socioeconomic futures. The hot-spot explorer tool is an EU-wide web service and can be used as a screening tool for policymakers to prioritize regions for development of regional adaptations pathways, using the dynamic adaptation pathways tool. A regionally suitable pallet of intervention measures is identified from stakeholder engagement. The pallet is stress-tested for assessing regional climate resilience, under a multitude of different future scenarios, with the objective to generate pathways of progressive implementations of intervention packages that improve the specified indicators and metrics. Some of the intervention options are also operationalized in pilot case studies within the project, such as the employment of sewer mining units in the wastewater system of East Attica for water reuse. The pathways are dynamic and adaptative to changing future conditions, as there are a) key monitored parameters for a region with alarms associated to decision points involving intervention measure implementations, and b) a contingency response module that supports stakeholders to select interventions from different pathways. These tools engage policymakers and stakeholders in order to identify climate change hot-spots within EU, prioritize them, identify suitable intervention measures, and analyze their regions to generate strategic plans for adaptation pathways towards the common climate resilience goal.

Acknowledgement

This work is supported by IMPETUS research project, which received funding from the European Union’s Horizon 2020 research and innovation programme under grant agreement  No. 101037084.

How to cite: Nikolopoulos, D., Spartalis, I., Pantazis, C., Pelekanos, N., Moraitis, G., Monokrousou, K., and Makropoulos, C.: Towards climate resilience: paving dynamic adaptation pathways for regional climate change hot-spots, EGU General Assembly 2023, Vienna, Austria, 23–28 Apr 2023, EGU23-7541, https://doi.org/10.5194/egusphere-egu23-7541, 2023.

EGU23-9994 | ECS | Orals | HS5.7

Bringing knowledge closer to practice: an inferential analysis of EU climate change policies and measures 

Nikos Pelekanos, Dionysios Nikolopoulos, Georgios Moraitis, and Christos Makropoulos

In the context of climate change, European Member States are committed to developing policies and taking corresponding adaptation measures. In this direction, every two years, the European Environment Agency (EEA) publishes an extensive dataset related to climate policies and measures (PaMs) reported in Europe and generated by European research projects, with the aim of improving and disseminating the information covering all actions aimed at reducing GHG emissions. In this study, an inferential data analysis is conducted on the PaMs dataset, setting as the variable of interest the reported quantified GHG emissions savings of each PaM and inferring its variance through a set of related explanatory qualitative factors (i.e., type of measure, sector of policy, related entities, implementation period etc.) together with their higher-level interactions. This is achieved by employing a number of widely used statistical techniques for the analysis of multi-factor data, such as regression analysis, hypothesis testing, influence diagnostics and variable selection methods to (a) investigate the significance and effect of the factors in relation to GHG emissions and (b) model the relationships between the variables of interest. The resulting analysis aims to obtain practical insights from a retrospective view of a wide number of PaMs and generalize their response in a descriptive and explicable way. This will allow the interested parties to gain interpretable feedback from existing measures applied in practice and subsequently ‘feed back’ new knowledge on climate adaptation decision making.

This work is supported by IMPETUS research project that has received funding from the European Union’s Horizon 2020 research and innovation programme under grant agreement No. 101037084.

How to cite: Pelekanos, N., Nikolopoulos, D., Moraitis, G., and Makropoulos, C.: Bringing knowledge closer to practice: an inferential analysis of EU climate change policies and measures, EGU General Assembly 2023, Vienna, Austria, 23–28 Apr 2023, EGU23-9994, https://doi.org/10.5194/egusphere-egu23-9994, 2023.

EGU23-10472 | ECS | Posters virtual | HS5.7

Scenario discovery with an integrated assessment model to identify robust, policy-relevant scenarios for capacity expansion in Latin America 

Jacob Wessel, Jonathan Lamontagne, Gokul Iyer, and Thomas Wild

The ongoing global transition to a deeply decarbonized electricity system represents a complex problem. Deep uncertainty in the future pathways of power system capacity expansion and interactions across sectors has led stakeholders to seek out robust methods capable of informing multi-scale, multi-sector tradeoffs among policy pathways within the energy-water-food nexus. In this study, scenario discovery is applied to a large scenario ensemble generated using a global-scale integrated assessment model with a regional focus on Latin America. Scenario discovery is a powerful method for identifying robust, policy-relevant scenarios from large, many-dimensional ensembles of model realizations. Here, ten uncertain sensitivity factors consistent with previous analyses are varied within the model configuration, representing technological costs and efficiencies, advanced electrification, institutional factors, and national climate pledges, among others. The resulting scenario ensemble maps out the impacts of a combinatorial time-evolving uncertainty space defined by these sensitivity factors, using generation mix, electricity cost, energy burden, and energy intensity as power system performance metrics. Additional metrics are utilized to explore cross-sectoral implications of scenarios. The scenario discovery analysis identifies the key global drivers of regional outcomes in Latin America, as well as tradeoffs and synergies regarding climate change mitigation and the future evolution of the Latin American electric power system. Our results underscore the importance of considering coupled systems and the advantages of large-scale scenario ensembles in capacity expansion analyses.

How to cite: Wessel, J., Lamontagne, J., Iyer, G., and Wild, T.: Scenario discovery with an integrated assessment model to identify robust, policy-relevant scenarios for capacity expansion in Latin America, EGU General Assembly 2023, Vienna, Austria, 23–28 Apr 2023, EGU23-10472, https://doi.org/10.5194/egusphere-egu23-10472, 2023.

EGU23-11101 | ECS | Orals | HS5.7

Supply and demand assessment and mismatch analysis of ecosystem services to support sustainable land management 

Jiwon Kim, Mina Hong, Sol-E Choi, Cholho Song, Chul-Hee Lim, Yun Eui Choi, and Woo-Kyun Lee

Due to the land degradation, the land use conflicts have intensified, and there is an increasing necessity to adapt sustainable land management. Sustainable land management deals with the demands for land in terms of not only human society but also the nature conservation and biodiversity. To persue and realize sustainable land management, the indicators and evaluation system are necessary, and ecosystem services has emerged as the proper indicator for sustainable land management. This study focused on the balance between the demand and supply of ecosystem services. If the balance between them was maintained or supply exceeded demand, the land can be assessed to be managed sustainably. In this study, CO2 sequestration, Heat mitigation, and water provision were assessed as ecosystem service in South Korea. The supply of each ecosystem service was evaluated by using related models which had been developed and used widely in previous studies. The demand of each ecosystem service was defined based on specific figures which had already suggested as policy goals in South Kroea in purpose of drawing social consensus. Afterwards, the ecosystem services supply and demand ratio (ESDR) were calculated to show the balance between supply and demand quantified by region. As a result, the exessive demand for CO2 sequestration service was found compared to supply. The supply of heat mitigation service was found to be sufficient for the demand nationwide. However, in specific areas such as cities, the demand was higher than the supply. In the case of water provision service, the national demand was being met by some regional suppliers. Through these results, it is possible to find out the ecosystem services that need to be supplemented spatially and regionally, and ultimately, it is expected to support the establishment of urban space, green space, and environmental planning at the regional and national levels.

How to cite: Kim, J., Hong, M., Choi, S.-E., Song, C., Lim, C.-H., Choi, Y. E., and Lee, W.-K.: Supply and demand assessment and mismatch analysis of ecosystem services to support sustainable land management, EGU General Assembly 2023, Vienna, Austria, 23–28 Apr 2023, EGU23-11101, https://doi.org/10.5194/egusphere-egu23-11101, 2023.

EGU23-12105 | Orals | HS5.7

A probabilistic framework to assess resilience in regional water systems - exploring the impact of circular water strategies 

Dimitrios Bouziotas, Dionysios Nikolopoulos, Panagiotis Dimas, Jos Frijns, and Christos Makropoulos

Contrary to the ‘make-use-dispose’ linearity seen in conventional resource management, circular economy design principles have been proposed as an  alternative that reduces waste and promotes efficiency. These principles find use in water as well, offering an alternative against centralized water systems planning and management. Despite the intrinsic links between circularity and resilience, few studies have advanced the identification and discussion of linkage beyond a theoretical or conceptual level. Moreover, few studies have estimated resilience with a probabilistic approach to include the inherent future uncertainty located simultaneously at source and demand level. In this study, a probabilistic framework to assess resilience for regional systems across multiple domains (drinking water, wastewater and drainage) is presented. The framework is based on stress-testing using an urban water cycle model, paired with reliability-based Key Performance Indicators (KPIs) that describe system resilience for each domain and for several different stress-testing factors (stressors). For its practical implementation, the framework is then applied to the provincial case study of Delfland, the Netherlands, where different circular water strategies are evaluated in terms of their overall resilience, (a.) firstly deterministically to explore the impact of individual stressors, and (b.) probabilistically to evaluate system performance against future uncertainty. The results quantitatively demonstrate that circular water options lead to water systems of increased resilience. The more circular dimensions are addressed through interventions and management strategies, the more robust resilience profiles become across different urban water cycle domains, thus securing regional water systems against future uncertainty.

How to cite: Bouziotas, D., Nikolopoulos, D., Dimas, P., Frijns, J., and Makropoulos, C.: A probabilistic framework to assess resilience in regional water systems - exploring the impact of circular water strategies, EGU General Assembly 2023, Vienna, Austria, 23–28 Apr 2023, EGU23-12105, https://doi.org/10.5194/egusphere-egu23-12105, 2023.

EGU23-12166 | ECS | Posters on site | HS5.7

Enabling far-reaching living labs through regional Digital Twins 

Georgios Moraitis, Christodoulos Fragkoudakis, Spyridon Tsattalios, Dionysios Nikolopoulos, Nikos Pelekanos, Klio Monokrousou, and Christos Makropoulos

The current and future landscape of our societies is predominantly governed by urgent (and interconnected) resilience challenges such as climate change adaptation, resource efficiency and sustainable WEFE nexus management. To overcome those challenges, the European Union (EU) has set the blueprints of transformational changes with the European Green Deal, that builds on research and innovation to meet the objectives. Despite advances in the field, the uptake pace of relevant innovations is often hindered by the narrow communication paths among research, public administration and citizens -who are the end beneficiaries. This work utilizes the capabilities of Digital Twins (DT) to connect hard and soft sensors with environmental and infrastructure models at regional scale, to create a central hub for related data and knowledge to be turned into action in a co-creation process. By building on existing data driven platform initiatives by the Ministry of Environment and Energy and the Decentralized Administration of Attica, we build the DT of the Region of Attica to provide: (i) access to relevant datasets (environmental, climatic, uses of resources etc.), (ii) access to relevant climate adaptation services (e.g. climate services, services to farmers, services to municipalities), (iii) links to local and regional Communities of Practice (CoP) and (iv) a repository for demonstrations of climate adaptation innovations within the region. This knowledge collaboration scheme forms a living lab constellation that allows rapid and far-reaching sharing, accumulation, transformation, and co-creation of knowledge among the administration parties and local case studies’ stakeholders. Like ancient sailors who used constellations to navigate along route, our modern societies can use the living lab constellations of the regional DT to chart evidence-based pathways towards climate resilience and sustainable WEFE management. This dynamic and expandable ecosystem aims to speed up the introduction of climate adaptation innovations, connect knowledge and bring research closer to practice by allowing for a re-wiring of culture, where science and co-creation are perceived as necessary for successful policy making. 

Acknowledgment: This work is supported by IMPETUS research project that has received funding from the European Union’s Horizon 2020 research and innovation programme under grant agreement No. 101037084.

How to cite: Moraitis, G., Fragkoudakis, C., Tsattalios, S., Nikolopoulos, D., Pelekanos, N., Monokrousou, K., and Makropoulos, C.: Enabling far-reaching living labs through regional Digital Twins, EGU General Assembly 2023, Vienna, Austria, 23–28 Apr 2023, EGU23-12166, https://doi.org/10.5194/egusphere-egu23-12166, 2023.

EGU23-12376 | Orals | HS5.7

On building a general framework for assessing food security risk under probabilistic socioeconomic scenarios 

Georgios Papayiannis, Phoebe Koundouri, Achilleas Vassilopoulos, and Athanasios Yannacopoulos

Food security is a key issue in sustainability studies. In this work, a general framework for providing detailed probabilistic socioeconomic scenarios as well as predictions concerning food security is proposed. Our methodology builds (a) on the Bayesian probabilistic version of world population prediction model and (b) on the dependencies of food needs and food system capacities on key drivers, such as population, gross domestic product (GDP) and other socioeconomic and climate indicators. In this perspective, the concept of the recently developed convex risk measures involving model uncertainty is employed for the construction of a risk assessment framework in the context of food security. The proposed method provides within and across the various probabilistic scenarios predictions and evaluations for food security risk. Our methodology is illustrated by studying food security and quantifying the occurring risk in Egypt and Ethiopia up to the year 2050, in the combined context of the Shared Socioeconomic Pathways (SSPs) and the Representative Concentration Pathways (RCPs).

How to cite: Papayiannis, G., Koundouri, P., Vassilopoulos, A., and Yannacopoulos, A.: On building a general framework for assessing food security risk under probabilistic socioeconomic scenarios, EGU General Assembly 2023, Vienna, Austria, 23–28 Apr 2023, EGU23-12376, https://doi.org/10.5194/egusphere-egu23-12376, 2023.

EGU23-12746 | ECS | Posters virtual | HS5.7

Water-Energy-Food nexus in Algeria; Ain Temouchent case study 

Leila Mostefaoui

Given the complexity of the interactions between water, energy, and food, any alteration to one sector can have impacts on the other sectors of the system.(Sušnik et al., 2018).Scientists are increasingly recognizing the need for an integrative approach to planning and managing resources. Hoff explained that several factors have influenced the demand for water, energy, and food, and listed the following; population growth, sustainable development, climate change, degradation, and scarcity of resources.(Hoff & Ulrich, 2017)

Algeria is ranked 1st among the Arab countries which have exceeded two-thirds of the way to achieving the SDGs (Dahan et al., 2019.), but according to Hoff (Hoff & Ulrich, 2017), the countries in the MENA region have not made remarkable progress in adopting the nexus approach due to several constraints such as lack of experience and insufficient management planning. ((Hoff & Ulrich, 2017).  As part of establishing the nexus approach in Algeria, we have selected the region of Ain Temouchent as a case study known for its agricultural vocation.

Ain Temouchent is located on located in the northwestern of Algeria, 520 km from the capital Algiers, and a hundred kilometers from the border Moroccan. And limited: to the North, by the Mediterranean Sea, to the South West, by Tlemcen, to the South East, Sidi Bel Abbes, and, to the east, by Oran. The region area is about 2,376 km² with a façade sea of 84 km and the population is over 406,000. The agricultural sector represents 15.22%, and the construction sector employs 14.19% of the employed population. The region of Ain-Temouchent is characterized by a Mediterranean climate with a hot summer and a temperate winter. The intensification of agricultural production in this region has led to the overexploitation of groundwater resources, and the establishment of a combined cycle thermal power station has accentuated its path towards a more considerable development, following its satisfaction in electrical energy. The establishment of a reverse osmosis desalination plant (Benisaf Water Company) with a production capacity of 200,000m3/day significantly alleviated the crisis situation, but its energy consumption and environmental impact raise several questions

Considering all these segments, one of the objectives of the study is to determine the key links between segments of the Nexus and understand the dynamics between them using System Dynamics Modeling. ((Aliyev et al., 2019))

This work aims to determine the links between water, food, and energy and to analyze the dynamics between them, also to propose solutions and recommendations for developing effective policies for the region.


How to cite: Mostefaoui, L.: Water-Energy-Food nexus in Algeria; Ain Temouchent case study, EGU General Assembly 2023, Vienna, Austria, 23–28 Apr 2023, EGU23-12746, https://doi.org/10.5194/egusphere-egu23-12746, 2023.

EGU23-12902 | Orals | HS5.7

Experiences from storm surge flood damage modelling driven by local decision makers 

Martin Drews, Kirsten Halsnæs, Per Skougaard Kaspersen, and Bodil Ankjær Nielsen

A large part of the current research on flood damage costs build on a similar methodological framework across studies that integrates climate data (hazard), flood modelling (exposure), damage cost assessments (impact) and calculate risks as the product of the likelihood of events and their consequences. A key question here is how relevant such a methodological framework is in relation to the perspectives of decision makers on establishing safe standards for investments in climate change adaptation in the context of the large uncertainties surrounding both estimates of the extreme event probability and on the damages of these. Particular issues that are often raised by decision makers are related to how extreme precipitation and storm surge levels could be, and on how well the damages of such events are represented in damage estimates recognizing the limitations of monetary evaluations as well as risk preferences of decision makers.

The paper is addressing how the gap between conventional approaches applied to hazard and impact modelling and the needs and practice of decision makers can be diminished based on the experiences with the development and application of a detailed object based spatial DamageCost Model for storm surges. The model has been widely applied by Danish local governments as a basis for developing adaptation plans. Soon after the first version of the model was released, local Danish governments took over leading the model development from a user perspective in a close ongoing dialogue with DTU and the engineering consultants LNH Water, which through several projects, including the EU ARSINOE project continue to support further technical development and model use.

Experiences from how the model development have been inspired by decision maker perspectives gained through model use are reported based on case studies for the Danish cities of Esbjerg, Odense, and Aabenraa.

How to cite: Drews, M., Halsnæs, K., Skougaard Kaspersen, P., and Ankjær Nielsen, B.: Experiences from storm surge flood damage modelling driven by local decision makers, EGU General Assembly 2023, Vienna, Austria, 23–28 Apr 2023, EGU23-12902, https://doi.org/10.5194/egusphere-egu23-12902, 2023.

EGU23-13100 | ECS | Orals | HS5.7

Enhancing the resilience of intermittent water supply systems in Khan Younis, Gaza Strip. Knowledge transfer and lessons learned from the Gaza H2.0 project 

Andrea Cominola, Ivo Daniel, David Tilcher, Ahmed J. S. Alasmar, Rami M. M. Ziara, and Giovanni Pedron

Future water security in Palestine is challenged by the compound effect of water scarcity, operational inefficiencies in water supply infrastructure, and the unstable geo-political setting. Among these factors, water losses represent a major challenge to the environmental sustainability and financial stability of water resources management in the area. The Palestinian Water Authority estimated the amount of non-revenue water (NRW) in the Gaza Strip to approximately 35.7 million cubic meters in 2018. This is equivalent to a direct loss of 37.6% of the total water supplied, further indirectly implying inefficient use of water-related energy and resources to treat and distribute water.

Water loss reduction and more sustainable water supply are key priorities in Khan Younis, the second most populated city in the Gaza Strip. Water supply and sanitation services in Khan Younis are managed by the Khan Younis Municipality (KYM). The KYM water distribution system is currently operated with an intermittent water supply scheme based on empirical and expert-based knowledge. The water loss rate in Khan Younis is rather uncertain and different estimates exist. However, the average water consumption from data provided by KYM in early 2021 was estimated to 74.7 liters per capita per day (lcd), which resides in the range recommended by the World Health Organization to meet the basic water needs, while the daily amount of water supplied via the distribution network was on average 99.5 lcd, indicating a NRW rate of approximately 25%.

In this work, we discuss lessons learned from the ongoing EU funded project “Gaza H2.0: Innovation and water efficiency” which aims at promoting efficient and sustainable water supply and demand, along with knowledge transfer to enhance resilience against water scarcity in the Gaza Strip. First, we analyse the gaps between research and practice which emerged in the project while updating the hydraulic model of the KYM water distribution. A rich body of literature highlights that building and calibrating a hydraulic model of a water distribution network is not a straightforward task that depends greatly on available data, calibration techniques, and modeler’s expertise. This was proven true for building the KYM water distribution network model, as an up-to-date inventory of network components was not available and only limited historical data were recorded. Thus, an extensive surveying campaign was run in 2021 via the installation of 51 pressure sensors logging data with a 1-min frequency throughout the 27 distribution zones in the network. As a result, sufficient measurement data was recorded to perform an initial calibration of the hydraulic model. However, some components of the network remain ungauged. We will thus discuss lesson learned and propose recommendations to enhance hydraulic model calibration for KYM and similar networks. Second, we will describe and discuss the strategies planned and invoked during the Gaza H2.0 project to foster knowledge transfer to and increase involvement from all stakeholders. These actions aim to guarantee the long-term sustainability of the technological solutions proposed in the project, such that they can serve as a starting point to address future climate and infrastructure challenges.    

How to cite: Cominola, A., Daniel, I., Tilcher, D., Alasmar, A. J. S., Ziara, R. M. M., and Pedron, G.: Enhancing the resilience of intermittent water supply systems in Khan Younis, Gaza Strip. Knowledge transfer and lessons learned from the Gaza H2.0 project, EGU General Assembly 2023, Vienna, Austria, 23–28 Apr 2023, EGU23-13100, https://doi.org/10.5194/egusphere-egu23-13100, 2023.

EGU23-13219 | Orals | HS5.7

Opportunities and Challenges in the Efficient Exploiting of Land, Energy and Water Resources within the Volta and Tana Basins in Africa 

Frank Ohene Annor, Viktoria Martin, Eric Antwi Ofosu, Carlos Guerrero Lucendo, Boniface Akuku, Rafatou Fofana, Nick van de Giesen, and Edo Abraham

The design of strategic investments in water, energy and food (WEF) infrastructures is challenging because the size, location, technology mix and pace of development is made uncertain by multiple factors. For example, the return on investment, which comes long after building a hydropower dam, is made uncertain by local, regional and global climate and socio-economic factors. This is exacerbated by the challenges associated with the impacts of climate change, especially in sub-Saharan Africa (SSA) where it is difficult to model these impacts, hence leading to high levels of uncertainty in future scenarios (2050 and beyond).

Long-term investment planning and system operations for energy, depend on and compete with other sectors for, the availability of water (for hydropower and cooling thermal plants) and land resources (e.g. for biofuel production and arability). The efficient exploitation of land, energy and water resources and their synergised use for economic development therefore require an multidimensional integrated optimisation approach co-created with stakeholders in dialogue. This starts with planning followed by prioritised investments based on local, national and regional needs in the energy, agricultural and water sectors. This is mostly lacking in SSA at the moment. We gathered a selected group of experts in Accra, Ghana in November 2022 with a broad mix of experiences and expertise in the energy, water and agricultural sectors, who shared deeper insights and values of the need for integrated WEF planning to begin tackling challenges and opportunities identified in the Volta Basin in West Africa (starting with Ghana) and the Tana basin in Kenya. The main challenge identified was the disjointed planning of WEF infrastructures due to different financing mechanisms and siloed sectoral thinking; and participants raised emerging opportunities for planning infrastructure through transnational and regional cooperation  as well as the need to build on existing and new initiatives devoid of entrenched political goals.

In this contribution, we will present some of the main findings from the meeting in Accra and share knowledge on how transparent WEF modelling can be contextualised for local operational relevance, and through co-creation, how interactive engagement tools can be used for planning, policy- and decision-making.

Keywords: WEF modelling, sub-Saharan Africa, WEF Infrastructures, Investment Planning, Optimisation

The work leading to these results has received funding from the European Horizon Europe Programme (2021-2027) under grant agreement No.101083763 (EPIC Africa). The opinions expressed in the document are of the authors only and in no way reflect the European Commission’s opinions. The European Union is not liable for any use that may be made of the information.

How to cite: Annor, F. O., Martin, V., Ofosu, E. A., Lucendo, C. G., Akuku, B., Fofana, R., van de Giesen, N., and Abraham, E.: Opportunities and Challenges in the Efficient Exploiting of Land, Energy and Water Resources within the Volta and Tana Basins in Africa, EGU General Assembly 2023, Vienna, Austria, 23–28 Apr 2023, EGU23-13219, https://doi.org/10.5194/egusphere-egu23-13219, 2023.

EGU23-14318 | ECS | Orals | HS5.7

Investigating the potential role of pumped hydro storage in the Ethiopian energy system transitions to 2050 using OSeMOSYS 

David de Vries, Jagruti Ramsing Thakur, Viktoria Martin, Frank Annor, and Edo Abraham

Ethiopia’s energy demand is expected to increase sevenfold in the coming 30 years, resulting in increased variable renewable electricity (VRE) production by solar PV and wind. Energy storage acts as a buffer that mitigates the effects of over- or under-capacity in production by VRE. With 97% of global bulk energy storage, pumped hydro storage is the most widely used and mature energy storage technology. With its long operational life, high round-trip efficiency (80%) and stable cost trajectory, it is a competitive option for many VRE-rich (future) energy systems. However, barriers to pumped storage include heavy technical, site-specific restrictions, long construction times and high initial capital investment requirements.

This study investigates if Ethiopia’s energy pathways benefit from adding pumped hydro storage, suitable regions for PHS, and to what extent storage would increase system resilience. The long-term energy planning tool OSeMOSYS is used, which allows for detailed investigation into system dynamics whilst parallelly minimising costs. OSeMOSYS enabled the investigation into Ethiopia by looking at an extensive host of techno-economic specifications and supply and demand dynamics from the electrification of transport and integration of variable renewables to residential cooking demands.

This research studies thirteen scenarios which are separated into three main categories: Base Case (3), Emission Penalty (EMI) (6) and Varying Wind Capacity and Seasonality (WND) (6). The base case introduces pumped storage to the energy pathways, and the EMI scenario characterises three pathways for carbon pricing. In the WND scenario, wind power’s capacity factor and seasonality are altered to investigate the potential effects of using more accurate local data or prioritising some supply zones on the energy system configuration. Additionally, the most favourable locations for solar PV and wind are combined with potential PHS locations to find optimal sites for storage construction.

The results of the research show that pumped hydro storage is adopted into the energy system in all scenarios, following both a diurnal and seasonal (dis)charge pattern. Variable renewable integration increases by an average of 10% from the addition of storage (78 GWh). The emission penalty increases the electrification of residential cooking demand and boosts VRE penetration but does not integrate storage integration further than the base case due to reaching the upper limit of the storage capacity set in the planning experiments.

Pumped hydro storage was found to increase the resilience of the modelled energy systems to climate-driven seasonal uncertainties and prices due to fossil fuel and carbon price uncertainties by making them less dependent on fossil fuels, decreasing vulnerability for potential emission penalties, and seasonal capacity fluctuations. The introduction of PHS was also found not to increase overall system costs, making it, combined with the stable levelised cost of storage and high maturity, a prime candidate for large-scale energy storage in Ethiopia.

How to cite: de Vries, D., Ramsing Thakur, J., Martin, V., Annor, F., and Abraham, E.: Investigating the potential role of pumped hydro storage in the Ethiopian energy system transitions to 2050 using OSeMOSYS, EGU General Assembly 2023, Vienna, Austria, 23–28 Apr 2023, EGU23-14318, https://doi.org/10.5194/egusphere-egu23-14318, 2023.

EGU23-15624 | ECS | Posters on site | HS5.7 | Highlight

How effectively (or not) can science and research be turned into adopted solutions and policies? 

Elena Matta, Andrea Cominola, Chrysi Laspidou, Aitor Corchero Rodriguez, Marco Micotti, Manuel Pulido Velázquez, Matteo Giuliani, and Andrea Castelletti

How to create an impact on policies, operations, and society across the interdisciplinary sectors in which we - as researchers - are involved? Managing the Water-Energy-Food-Ecosystem (WEFE) nexus and pursuing climate resilience is the core task of several European (EU) projects and is in the highest interests of our society. The European Commission’s research funding programs attempt to address a large range of topics and offer unique opportunities for scientists to create a tangible impact on the environment and society.

We are currently involved in different EU projects, including AWESOME (PRIMA), which aims at managing the WEFE nexus across sectors and scales in the South Mediterranean exploring innovative technologies such as soilless agriculture in the Nile Delta; CLINT (H2020), which is developing Machine Learning (ML) techniques to improve climate science in the detection, causation, and attribution of extreme events to advance climate services; IMPETUS (H2020), whose efforts are dedicated on the elaboration of climate data space enhanced with ML algorithms to support the elaboration of climate policies; REACT4MED (PRIMA), which focuses on combating land degradation and desertification by improving sustainable land and water management through the identification of local good restoration practices and their potential upscaling; Gaza H2.0: Innovation and water efficiency (EuropeAid), which aims at promoting efficient and sustainable water supply and demand as well as knowledge transfer to enhance resilience against water scarcity in Gaza; GoNEXUS (H2020), which is developing an evaluation framework to design and assess innovative solutions for an efficient and sustainable coordinated governance of the WEFE nexus; NexusNet (COST), which creates the network and the community of WEF nexus advocates for a low-carbon economy in Europe and beyond; NEXOGENESIS (H2020), which focuses on streamlining water-related policies with artificial intelligence and reinforcement learning; MAGO (PRIMA), which builds web applications for water and agriculture in the Mediterranean; BIONEXT (HEU), which is interlinked with the Intergovernmental Panel on Biodiversity and Ecosystem Services and aims at creating transformative change through nexus analysis.

Despite the efforts of the scientific community, there is still a gap between research and practice. Researchers face difficulties in engaging stakeholders and decision-makers to jointly explore and shape the developed solutions, as well as to truly adopt them. The large-scale implementation of suitable technological solutions might require time and financial resources beyond the project’s lifetime and capacity. The lack of follow-ups and collaboration among projects with similar aims can be some of the reasons lying behind. Also, the complexity of finding open data in data-scarce regions makes results less trustable in the eyes of international agencies, while the pressure of publishing often turns research tasks into pure academic exercises. To what extent does the European strategy work? Is it only gaining scientific advances or also leading to local policy changes? Engaging important local actors (e.g., ministries), small-medium enterprises and societal members in the project consortia, empowering scientists by ensuring feedback loops with local governmental agencies, including the human dimension into modelling, and running effective capacity-building campaigns can be some food for thoughts to shape new strategies.

How to cite: Matta, E., Cominola, A., Laspidou, C., Corchero Rodriguez, A., Micotti, M., Pulido Velázquez, M., Giuliani, M., and Castelletti, A.: How effectively (or not) can science and research be turned into adopted solutions and policies?, EGU General Assembly 2023, Vienna, Austria, 23–28 Apr 2023, EGU23-15624, https://doi.org/10.5194/egusphere-egu23-15624, 2023.

EGU23-15642 | ECS | Posters on site | HS5.7

Developing policy recommendations to support innovation in soilless agriculture within the Nile River Basin: A participatory approach using Multi-Actor Working Groups 

Lydia Stergiopoulou, Ebun Akinsete, Nouran El-Said, and Phoebe Koundouri

Increasing demand for energy, food and water in the Mediterranean along with the decline of freshwater availability due to climate change necessitate the exploration of options for producing more food with less water, land and energy. Innovations in soilless agriculture aim to address this challenge by exploring novel approaches towards food production including aquaponics and hydroponics. However, inadequate and inefficient legislation and policy frameworks are ill equipped to provide the support necessary for the successful uptake and scale out of these new technologies.  This paper examines the implementation of soilless technologies in the water-stressed Nile River Basin. By applying a stakeholder-centered participatory approach developed by the project which takes into consideration the Water-Energy-Food- Ecosystem (WEFE) Nexus, we present targeted policy recommendations for the development of soilless agriculture in the region which inherently embed the views of key local stakeholders. 

How to cite: Stergiopoulou, L., Akinsete, E., El-Said, N., and Koundouri, P.: Developing policy recommendations to support innovation in soilless agriculture within the Nile River Basin: A participatory approach using Multi-Actor Working Groups, EGU General Assembly 2023, Vienna, Austria, 23–28 Apr 2023, EGU23-15642, https://doi.org/10.5194/egusphere-egu23-15642, 2023.

EGU23-15664 | ECS | Posters on site | HS5.7

Establishment of Rural Living Area Boundary for Sustainable Agri-Food System 

Jeongwoo Han, Kihwan Song, and Jinhyung Chon

In general, rural areas are declining due to urbanization and climate change, which affects the agri-food system centered on rural residents. For agri-food systems, the size and connectivity of regional systems are important, and the boundaries of people living in rural areas must be clearly defined. To effectively respond to these problems, the Republic of Korea proposed a policy plan for rural areas. However, there are issues with this approach since it is based on a legal spatial unit—meaning rural residents are not receiving the full breadth of intended benefits. It is necessary to readjust the spatial boundaries by aligning them more closely with the extent of the rural residents' living radius and the standards for services. This study aimed to establish the concept of a living area as it relates to rural areas, present criteria for setting the range and dimensions of a living area, and to then apply it to case studies. The target area was Muju-gun, Korea. It contains rural areas that face various problems such as population decline and aging. First, the concept of the rural living area was established based on insights gained from relevant literature reviews. The rural living area concept was defined as “a unit or range of spaces where rural residents can receive services to live and to support economic activities.” Second, building on the concept of the rural living area, the Muju-gun population, living service facilities, road networks, and watershed items were established, while relevant maps were collected. These materials were leveraged to conduct a network analysis. The closest facility analysis was performed and a network map was developed by overlaying the population and living service facilities with 12 key sectors (childcare, education, welfare, culture, physical education, health, medical care, commerce, finance, administration, transportation, and rest) and using the road network connecting them. Third, the range of living zones classified in order of size (small/medium/large) and by key sector in Muju-gun was derived. Excluding any missing values, a total of 30 Muju-gun living area ranges were drawn and presented. It was asserted that this was due to the fact that life service facilities in Muju-gun vary based on sector and size. The results of this study are particularly meaningful in that they presented a range based on the information that rural residents live in reality, and not an administrative district superimposed by the Republic of Korea—which reflects the existing legal standard unit. Since the derived range was based on the actual living range of rural residents, we expect efficient policy utilization in the planning and management of the agri-food system.

This work was carried out with the support of “Cooperative Research Program for Agriculture Science and Technology Development(Project No. PJ0171102022)” Rural Development Administration, Republic of Korea.

How to cite: Han, J., Song, K., and Chon, J.: Establishment of Rural Living Area Boundary for Sustainable Agri-Food System, EGU General Assembly 2023, Vienna, Austria, 23–28 Apr 2023, EGU23-15664, https://doi.org/10.5194/egusphere-egu23-15664, 2023.

EGU23-16116 | Orals | HS5.7

AquaPlan: Bridging the gap between research and practice in crop-water modeling 

Timothy Foster, Thomas Kelly, Ryan Avery, and Kathryn Berger

Crop-water simulation models are powerful tools to support efficient and sustainable agricultural water use and management globally. However, uptake of these tools beyond the research community in policy and industry has traditionally been constrained by the complexity and closed-source nature of model codes, which limit ability for models to be adapted and applied to address complex real-world agricultural water management challenges. In this talk, we present AquaPlan, an interactive web-based tool crop management tool that enables farmers, businesses, and governments to make more informed decisions about water management, irrigation investments, and climate risks. AquaPlan combines a state-of-the-art open-source crop-water model, AquaCrop-OSPy, with global weather and soil datasets to enable users to conduct rapid on-the-fly assessments of field and regional-scale crop yield and water demands anywhere in the world. The tools also integrates future climate projections from CMIP6 models, providing insights to support efforts to enhance long-term resilience of agriculture and food supply chains to climate change. In this talk, we will present a range of use cases of AquaPlan, highlight how these kinds of interactive tools can strengthen uptake of models developed by researchers in water management policy, practice, and business.

How to cite: Foster, T., Kelly, T., Avery, R., and Berger, K.: AquaPlan: Bridging the gap between research and practice in crop-water modeling, EGU General Assembly 2023, Vienna, Austria, 23–28 Apr 2023, EGU23-16116, https://doi.org/10.5194/egusphere-egu23-16116, 2023.

EGU23-16319 | ECS | Orals | HS5.7 | Highlight

Political instability influence on hydropower planning in Africa: a continental scale analysis 

Teresa Bonserio, Angelo Carlino, Matteo Giuliani, and Andrea Castelletti

As many developed countries prepare their transition to net zero emissions energy systems, Africa must plan a substantial expansion of its energy production sources, to meet the growing demand driven by increasing population and energy access. Among the existing capacity expansion potential, hydropower plays an important role in providing clean and cheap electricity. Yet, large hydropower schemes bring many negative social, environmental, and geopolitical externalities.

Least-cost optimization models constrained to satisfying predefined energy demands are used for large-scale energy system planning. Multi-objective optimization models can also incorporate environmental impacts in energy system planning, for instance by constraining the optimal solutions on GHG emissions or geomorphologic connectivity losses. However, these traditional techno-economic approaches overlook governance considerations, which are relevant to energy security, especially in unstable and conflictual political contexts. In fact, concerns about political instability are ranked among the main investment risks for foreign investors in developing countries. The subject becomes even more significant in transboundary river basins, where institutional stability and the absence of conflicts are crucial for effectively building and operating large hydropower projects.

To assess the political risks associated with the hydropower sector, we examine six pathways of energy generation for the African continent, from 2020 to 2050, developed using the OSeMOSYS-TEMBA energy system model. The model considers more than 600 existing and future hydropower projects in all countries of continental Africa, including available information for each individual power plant. Moreover, it incorporates ISIMIP2b scenarios to integrate coherently final energy demands, land-use change, and climate impacts on water availability.

For each scenario considered, the political risk deriving from the associated electricity generation and exchange patterns is characterized at the country-level using six energy-related dimensions. The more vulnerable transboundary river basins are then selected by intersecting the countries with high energy-related political risk and regions with high hydro-political conflict based on existing literature. We use a worst-case perspective for these basins and assume that electricity generated from planned or existing hydropower projects would not be exchanged between co-riparian countries due to the lack of cooperation. Finally, the impacts on the energy system are re-evaluated for the resulting cost-optimal energy system reconfiguration, and the difference with the fully connected solution is assessed.

Our results show that integrating political stability in energy system planning can produce precise spatial information about potential risks. Indeed, the lack of cooperation in transboundary river basins affected by high political instability can emphasize pre-existing vulnerabilities. Since this issue severely influences decisions related to energy planning on a continental scale, energy analysts can improve energy security using these results to design capacity expansion robust to political shocks.

How to cite: Bonserio, T., Carlino, A., Giuliani, M., and Castelletti, A.: Political instability influence on hydropower planning in Africa: a continental scale analysis, EGU General Assembly 2023, Vienna, Austria, 23–28 Apr 2023, EGU23-16319, https://doi.org/10.5194/egusphere-egu23-16319, 2023.

In recent years, research on the water-energy-land (WEL) nexus has grown significantly not least because of the highly interconnectedness of the respective domains, but also for the crucial nature-economy interactions that underpin the future of our planet. With climate change and biodiversity crises looping, our conventional siloed biophysical and economic models are no longer adequate at providing prudent guidance to the interrelated sustainability questions. A new approach is urgently needed to tackle the issues of nature and the economy. In this research, we are developing a global-scale dynamic system model of nature, macroeconomy and finance that gives guidance on the crucial policy questions on the WEL nexus and biodiversity dynamics. We provide a critique of the existing modeling approaches, our novel conceptualization for a multidimensional model - with crucial elements, interactions, and underlining theories - which provides insights into the underlying source of biodiversity loss and the trade-off between different economic activities to safeguard livelihoods and achieve the so-called ‘nature positive’ pathways.

How to cite: Ilyas, A.: Reconceptualizing macroeconomic dynamics of water-energy-land for nature positive development pathways, EGU General Assembly 2023, Vienna, Austria, 23–28 Apr 2023, EGU23-16496, https://doi.org/10.5194/egusphere-egu23-16496, 2023.

This research investigates the interconnections between water, energy, and land systems in the context of a long-term assessment of transition paths to achieve the Sustainable Development Goals (SDGs). It highlights the importance of integrated methods and addresses the complexity, interdependence, and uncertainty of climate change's impacts on natural systems and technology in the water, energy, and land sectors. The research utilizes two Integrated Assessment Models (MESSAGEix-GLOBIOM and IMAGE) to assess the long-term resources, supply, and demand of these sectors, together with the regional and sectoral reforms required to achieve the SDGs. It demonstrates how various locations and sectors would be affected by climate feedback under various climate mitigation scenarios. 

The study concludes that changes in water availability, that influence agriculture, water and sanitation access, hydropower potential, and power plant cooling technologies, constitute the largest proportion of climate impacts and the prime source of uncertainty. Furthermore, scenario analysis is used to understand the relationship between the SDGs and climate impacts in the absence of climate policies. The findings demonstrate that considerable progress towards the trajectories of the nexus SDGs resulted in strong synergies and interactions across the energy-water and land nexus components, irrespective of climate factors. Additionally, the study demonstrates that ambitious and healthy dietary modifications and a reduction in food waste can result in a decrease in global food demand, irrigation withdrawals, and emissions. Changes in the land sector can reduce overall SDG policy costs and energy and water expenditures, while strengthening the needs of the poor. Improving wastewater treatment and establishing more efficient water management technologies has socioeconomic and environmental advantages and can alleviate stress on freshwater withdrawals in locations that are water stressed. 

The study also shows that some regions, such as the Middle East and South Asia, are more vulnerable to climate impacts on the water sector and may require more extensive investments in water efficiency. In addition, it stresses that supplying households with electricity and clean cooking services can stimulate energy demand in emerging economies, but widespread adoption would require an increase in household incomes, notably in South Asia and Sub-Saharan Africa. Overall, the study highlights the importance of exploring the effects of climate change on natural and technological systems in the water, energy, and land sectors, as well as the relevance of implementing a coordinated strategy to achieving the Sustainable Development Goals. It also demonstrates the inter - dependencies and potentials of various sectors to achieve the SDGs while addressing the challenges they face because of climate change. 

How to cite: Awais, M., Vinca, A., Byers, E., Fricko, O., Frank, S., Krey, V., and Riahi, K.: Leveraging Integrated Assessment Models to access climate feedbacks on Water, Energy, and Land Systems: An Evaluation of Regional and Sectoral Transformations for Achieving the Sustainable Development Goals , EGU General Assembly 2023, Vienna, Austria, 23–28 Apr 2023, EGU23-16585, https://doi.org/10.5194/egusphere-egu23-16585, 2023.

EGU23-16592 | ECS | Posters virtual | HS5.7

Climate mitigation using wood in the Netherlands: a modelling approach from family home to national scale 

Jaap Bos, Jikke van Wijnen, Angelique Lansu, and Winnie Leenes-Gerbens

Abstract

Forests mitigate climate change by storing CO2 as wood and providing wood for products with a long economic residence time. This study examined the extent to which common Dutch homogeneous forests can contribute to climate mitigation if the harvested wood is processed into products. A model was set up which calculates the CO2 stock in the atmosphere for varying residence times of harvested wood in the economy and also determines the influence of this residence time on the optimal harvest age. Existing yield tables of Dutch homogenous forest were used as input data. This study showed that homogeneous forests in the Netherlands can extract a maximum of between 7 and 17 Mg of CO2 per hectare annually, depending on the tree species. For all tree species, the CO2 extracted from the atmosphere approaches this maximum as the residence time in the economy increases. The optimum felling age is not fixed, but varies depending on the economic residence time. The construction of 660,000 wooded single-family homes until 2050 with a lifetime of 150 years will remove an average of 1,5 Tg from the atmosphere annually. If the total forest area in the Netherlands is used to store wood in the economy for 150 years, an average of almost 6 Tg will be extracted annually. This is relatively low compared to the annual Dutch CO2 emissions of 150 Tg, but it is an option that fits well into the mix of other options that can contribute to climate change mitigation.

How to cite: Bos, J., van Wijnen, J., Lansu, A., and Leenes-Gerbens, W.: Climate mitigation using wood in the Netherlands: a modelling approach from family home to national scale, EGU General Assembly 2023, Vienna, Austria, 23–28 Apr 2023, EGU23-16592, https://doi.org/10.5194/egusphere-egu23-16592, 2023.

EGU23-17268 | Orals | HS5.7

Inclusive Outscaling of the Agricultural Land Afforestation Agro-ecosystem REstoration ACTions in Heraklion, Greece 

Ioannis Daliakopoulos, Irene Christoforidi, Ioannis Louloudakis, Dimitrios Papadimitriou, and Thrassyvoulos Manios

Land degradation and desertification are considered major threats for the present and future of Mediterranean arid and semiarid agro-ecosystems (Daliakopoulos et al., 2017). Long-term anthropogenic pressure on forest and agricultural lands, combined with abiotic factors and the global trend of accelerated dryer climate and dryland expansion, create an uncertain and unstable living environment which has been demonstrated to increase poverty and force domestic and even cross-border migration. While our understanding and the flow of information about these threats is unprecedented, challenges persist and uptake of good practices by stakeholders is hindered by constraints and barriers both biophysical and socioeconomic (Daliakopoulos, 2022). For example, in one of the pioneer institutional initiatives aiming to enhance long-term forest resources and combat soil erosion and desertification by promoting forestry as an alternative form of land use, the Agricultural Land Afforestation (ALA) Program (Regulation 2080/92) introduced compensations for the income loss incurred during the non-productive period of afforested agricultural land. However, awareness about the Program by landowners, and the overall effectiveness of afforestation both in forestation success and in reducing soil erosion remains uncertain (Arabatzis et al., 2006; Nunes et al., 2011). In this context, the premise of the REACT4MED Project is that massive and effective land restoration actions need not only to make sense from an environmental point of view, but to also be socially acceptable, economically viable (Daliakopoulos & Keesstra, 2020), and have measurable impact, thus combining good practices with organic and inclusive transformation of all social actors. Here we present an overview of the effectiveness of the former ALA in the REACT4MED Pilot Area of Heraklion and outlines the supporting actions, both top down and bottom up, planned during the REACT4MED Project to increase the effectiveness of the forthcoming ALA Program by combining good practices with organic and inclusive transformation of all social actors.

References

Arabatzis, G., Christopoulou, O., & Soutsas, K. (2006). The EEC Regulation 2080/92 about forest measures in agriculture. International Journal of Ecodynamics, 1(3), 245–257. https://doi.org/10.2495/ECO-V1-N3-245-257

Daliakopoulos, I. N. (2022). Sustainable Soil and Water Management for Combating Land Degradation and Desertification and Promoting Mediterranean Ecosystem Restoration: The REACT4MED Concept. Third World Conference on the Revitalization of the Mediterranean Diet, 28.

Daliakopoulos, I. N., & Keesstra, S. (2020). TERRAenVISION: Science for Society. Environmental issues today. Science of the Total Environment, 704. https://doi.org/10.1016/j.scitotenv.2019.135238

Daliakopoulos, I. N., Panagea, I. S., Tsanis, I. K., Grillakis, M. G., Koutroulis, A. G., Hessel, R., Mayor, A. G., & Ritsema, C. J. (2017). Yield Response of Mediterranean Rangelands under a Changing Climate. Land Degradation & Development. https://doi.org/10.1002/ldr.2717

Nunes, A. N., de Almeida, A. C., & Coelho, C. O. A. (2011). Impacts of land use and cover type on runoff and soil erosion in a marginal area of Portugal. Applied Geography, 31(2), 687–699. https://doi.org/10.1016/J.APGEOG.2010.12.006

Acknowledgements

This work has received funding from REACT4MED: Inclusive Outscaling of Agro-Ecosystem Restoration Actions for the Mediterranean. The REACT4MED Project (grant agreement 2122) is funded by PRIMA, a program supported by Horizon 2020.

How to cite: Daliakopoulos, I., Christoforidi, I., Louloudakis, I., Papadimitriou, D., and Manios, T.: Inclusive Outscaling of the Agricultural Land Afforestation Agro-ecosystem REstoration ACTions in Heraklion, Greece, EGU General Assembly 2023, Vienna, Austria, 23–28 Apr 2023, EGU23-17268, https://doi.org/10.5194/egusphere-egu23-17268, 2023.

EGU23-705 | ECS | Posters on site | HS5.9

Implications of land-use alteration on discharge and sediment delivery using hydrological modelling  

Esraa Tarawneh, Jonathan Bridge, and Neil Macdonald

Sedimentation is a major issue at the Wala Dam, Jordan, and its impact on the serviceable lifetime of the reservoir is the primary driver for proposals to raise the height of the dam. The approach followed in this study involves the application of an optimized SWAT model of the Wala catchment to examine hypothetical and object-based catchment management scenarios, including land-use alteration, on a one-at-a-time basis to simulate discharge and sediment yield delivered to the dam over the period 1979 – 2013. Plantation scenarios study the response of the catchment to cultivation of barley and olive in selected areas. The simulated effect of altering plantation vary spatially with both location and scale. Changes in annual sediment and water delivery to the Wala reservoir are linked to a simple model of dam functional lifetime to establish a rational model framework for integrating hydrological and ecological decision-making in this highly-stressed setting. Considering the Wala Dam raising plan, it is concluded that the current capacity is hypothetically expected to fill up with sediment in 65.63 years based on the existing land-use conditions of the catchment. The ongoing 17 Mm3 expansion of the dam is predicted to lengthen life-span up to about 283 % of the current estimations based on the existing land-use. Longest life-span of the Wala Dam is expected to be achieved by cultivating the northern areas with olive in all cases considereing exisiting and expanded capacity within extreme and average climate conditons. Shortest life-span is relevant to cultivating barley over the whole catchment. Life-span estimated based on an extreme flood condition that occurred in year 1992 varies between 2.92 and 10.02 year. Although such conditions can be rare and highly unpredictable, they must be taken into consideration while designing dams. Land-use alteration plans do not necessarily improve life-span of the dam and therefore, careful studies must investigate end goals and feasibility of management plans. Catchment-scale water and sediment management within the Wala basin is part of a complex system of inter-relationships within the overall framework of the water-energy-food nexus. Retention of water in the landscape for ecological benefit, to the detriment of available resource to support water supplies, carries a significant cost in this context; on the other hand, the model results here suggest that land restoration (at least under the cropping scenarios tested) can be achieved with marginal impacts relative to the benefits of raising the Wala dam. This, however, has its own consequence; by further eroding the downstream export of water to the Dead Sea, schemes such as the Wala contribute to the progressive deterioration of that unique water body, with impacts of global ecological, cultural, economic and geopolitical scale. The variation observed between simulated land-use scenarios emphasises the potential use of catchment modelling to target land restoration measures to those areas where net ecological benefits, including water conservation and reduction of erosion, are maximised.

How to cite: Tarawneh, E., Bridge, J., and Macdonald, N.: Implications of land-use alteration on discharge and sediment delivery using hydrological modelling , EGU General Assembly 2023, Vienna, Austria, 23–28 Apr 2023, EGU23-705, https://doi.org/10.5194/egusphere-egu23-705, 2023.

EGU23-1197 | ECS | Posters on site | HS5.9

Ecosystem Services Assessment in the Upper Catchment of Taiwan River Basins 

Wei-Cheng Chin and Chihhao Fan

    This study used two hydrological models and three economic valuation models to evaluate the ecosystem services of three selected upper river catchment areas of Taiwan and compares the differences among the comprehensive ecosystem service values among them. The differences in the evaluation results could be the basis for developing the related national river catchment management policies. The hydrological balance and Thiessen polygons methods were used to assess soil water conservation in the investigated areas. The replacement cost, market price and surrogate market methods were employed to estimate the supplying, regulating, supporting and cultural service values.

     Based on the survey of the public’s preference for ecosystem services conducted by the Council of Agriculture, Taiwan in 2020, the value of each individual ecosystem service is weighted and added together to represent the comprehensive ecosystem service values. The rank of the comprehensive ecosystem service values of the the three investigated catchment areas from high to low is the Dahan river in northern Taiwan, Dajia river in central Taiwan, and the Zengwen river in southern Taiwan.

    In this study, we analyzed the calculated results and suggested possible future policy for three investigated rivers, helping to allocate limited resources to achieve best cost-effect results. According to the present study, the ecosystem service values of flood control and landslide prevention are the two most-valued indicators. However, these two service values estimated by replacement cost method was significantly higher for the Dahan river than the Dajia river and Zengwen river. In order to enhance the comprehensive ecosystem services and balance for the regional economic development, government policies should aim to increase the ecosystem service values of flood control and landslide prevention in the upper catchment areas of rivers for central and southern Taiwan.

How to cite: Chin, W.-C. and Fan, C.: Ecosystem Services Assessment in the Upper Catchment of Taiwan River Basins, EGU General Assembly 2023, Vienna, Austria, 23–28 Apr 2023, EGU23-1197, https://doi.org/10.5194/egusphere-egu23-1197, 2023.

EGU23-2041 | ECS | Posters on site | HS5.9

How land use and land cover change affect the water retention of alpine landscapes in Austria 

Gabriel Stecher, Severin Hohensinner, and Mathew Herrnegger

Long-term land use and land cover changes (LULCC) are estimated to affect almost one third of the global land area (Winkler et al., 2021). This also alters hydrological processes and has implications on the ability of the landscape to retain water. In alpine areas of Austria, extensive LULCC have occurred since the mid-19th century, which also led to changes in flood hazard and an increase in flood risk, especially in the valley floors.

This contribution analyses, how long-term LULCC from the 1820s until now affect the water retention potential of the Austrian catchments of the rivers Rhine, Salzach and Drava. The Water retention index (WRI) (Vandecasteele et al., 2017) was calculated at a high spatial resolution (100*100 m) for the past and present LULC situation. The WRI is a qualitative indicator and shows the water retention capacity on a relative scale (0-10) by a composition of the governing physical processes (e.g. interception, percolation) through proxy datasets.

The resulting WRI maps of the historic and present state reveal that the general spatial features and characteristics exhibit similar WRI patterns. High values (WRI > 5) occur in valley floors and rather flat areas. Areas dominated by steep topography and alpine characteristics show low WRI values (< 3). The comparison of the two time periods shows a moderate to strong reduction (< -2) of the water retention potential especially in the alpine valleys and low elevations for the current state. This is largely explained by the expansion and development of settlement areas and soil sealing. Additionally, the draining of wetlands, river channelization and disconnection of flood plains and deforestation also strongly reduced the WRI values. In contrast, increasing WRI values occur primarily in areas at higher altitudes. Here, forest areas increased and wasteland transformed to grassland. In addition, new artificial water reservoirs have been constructed to produce hydropower, which have a positive effect on the retention potential. Generally, the spatial and altitudinal changes in the water retention capacity reflects the land and settlement development in the past 150 years. This development resulted in higher flood exposure but might have also reduced flood hazards due to higher water retention capacities.

References:

Vandecasteele, I., Marí i Rivero, I., Baranzelli, C., Becker, W., Dreoni, I., Lavalle, C., and Batelaan, O., 2017. The Water Retention Index: Using land use planning to manage water resources in Europe. Sustainable Development, 26 (2), 122–131. https://doi.org/10.1002/sd.1723

Winkler, K., Fuchs, R., Rounsevell, M., and Herold, M., 2021. Global land use changes are four times greater than previously estimated. Nature Communications, 12 (1), 1–10. https://doi.org/10.1038/s41467-021-22702-2

How to cite: Stecher, G., Hohensinner, S., and Herrnegger, M.: How land use and land cover change affect the water retention of alpine landscapes in Austria, EGU General Assembly 2023, Vienna, Austria, 23–28 Apr 2023, EGU23-2041, https://doi.org/10.5194/egusphere-egu23-2041, 2023.

EGU23-2115 | ECS | Posters on site | HS5.9

Identifying optimal type and locations of natural water retention measures using spatial modeling and cost-benefit analysis 

Merav Tal-maon, Dani Broitman, Michelle Portman, and Mashor Housh

Water management has recently changed from relying purely on technical and engineering methods towards nature-based solutions. These solutions can potentially benefit beyond hydrological concerns, such as improving life quality and biodiversity conservation. These measures are referred to as Natural Water Retention Measures (NWRM) in the water sector. Identifying the optimal type and locations of these measures is challenging due to the abundance of possible solutions, with different potential benefits and varying effects, depending on the characteristics of each place. Most research into sustainable runoff management addresses quantity, quality, and economic issues; few studies link these considerations with environmental and social benefits. We propose a methodology for identifying the most effective areas to place NWRMs and offer criteria for selecting appropriate measures based on hydrological, ecological, and social benefits.

To simulate the effect of NWRM, we applied the Open Nonpoint Source (NPS) Pollution and Erosion Comparison Tool (OpenNSPECT) to simulate the hydrological processes in the Tavor basin. We ran the model multiple times; each time, we simulated increased infiltration in a different land parcel and used the resulting change in runoff, sediment, and pollutants to construct a Pareto frontier graph. We then identified a set of appropriate measures for each area using information from the EU Directorate General for the Environment to conduct a cost-benefit analysis of different water retention measures. Different measures were selected when considering social and ecological benefits than only hydrological benefits, further highlighting the importance of accounting for these aspects. This methodology, which links hydrological concerns with the less commonly found ecological and social aspects, could serve as a decision-making tool for planners and stakeholders with sustainable runoff management.

How to cite: Tal-maon, M., Broitman, D., Portman, M., and Housh, M.: Identifying optimal type and locations of natural water retention measures using spatial modeling and cost-benefit analysis, EGU General Assembly 2023, Vienna, Austria, 23–28 Apr 2023, EGU23-2115, https://doi.org/10.5194/egusphere-egu23-2115, 2023.

EGU23-2627 | ECS | Orals | HS5.9

Climate impact on surface-subsurface hydrology considering meteorological and land use projections. 

Muhammad Haris Ali, Ioana Popescu, Andreja Jonoski, and Dimitri Solomatine

Understanding the effects of climate change on surface-subsurface hydrology is critical for improving water resources management in a basin. In such cases, the use of hydrological models to quantify and assess water resources is a common practice. With the increasing population and human interventions, the land use changes drastically. The land cover plays a vital role in hydrology as it defines the properties of land surface in the models. So far, majority-of the studies accessing the future climate change consequences on hydrology take into account only the meteorological variables under different climatic projections, neglecting the future land use changes assuming it as static. However, that is not the case, because majority of the earth's surface has altered as a result of human activities, and these changes are represented in models via land use maps.
The study presented herein, aims to assess the surface-subsurface response of the catchment under combined effect of meteorological variables and land use future projection. The analysis is performed on the Aa of Weerijs catchment which is a meso-scale transboundary watershed between Belgium and the Netherlands. The future projections of the meteorological variable were obtained from the Royal Netherlands Meteorological Institute (KNMI-14) website for the Netherlands and the same trends were implemented for the Belgium part of the catchment. For the land use, the European Space Agency (ESA) Climate Change Initiative (CCI) Land Cover (LC) maps of the study area for the year 1992 to 2021 were downloaded and linearly projected for the year 2050. The developed projected map was also compared with projected land use map of year 2050 by LUISA (Land Use-based Integrated Sustainability Assessment) modelling platform.
To investigate the hydrological regime of the area, the fully distributed physically based hydrological model coupled with a hydrodynamic model using MIKE-SHE and MIKE-11 modeling tools was developed. The base model was set up for the year 2009 to 2016. In addition to discharge, the groundwater heads are used to evaluate the model performance.
After setting up the base model, firstly, we analyzed the surface and subsurface response of the catchment considering that the land use in the area is the same as it was in 1992. Secondly, we analyzed the catchment response for the year 2050 by considering the meteorological variables as well as land use future projection.
The study provides unique estimates of future climate change and associated hydrological implications. The findings of the study will be valuable to plan and suggest significant modifications in the current strategies for water management in the area. Moreover, it can contribute to the efficient integration of spatial planning with water management.

How to cite: Ali, M. H., Popescu, I., Jonoski, A., and Solomatine, D.: Climate impact on surface-subsurface hydrology considering meteorological and land use projections., EGU General Assembly 2023, Vienna, Austria, 23–28 Apr 2023, EGU23-2627, https://doi.org/10.5194/egusphere-egu23-2627, 2023.

EGU23-3142 | ECS | Posters on site | HS5.9

Do land-cover mosaics affect the variability of suspended sediments in rivers? The case of large river basins in Germany 

Safae Aala, Stefano Basso, Dietrich Borchardt, Thomas Hoffmann, and Soohyun Yang

Investigating the influence of land-cover mosaics on water quality is vital for effective management aimed at mitigating the hazard of exceeding regulatory water quality thresholds. In particular, suspended sediments in rivers can easily jeopardize aquatic ecological functions, by transporting significant amounts of pollutants along flow paths. Nonetheless, a relationship between land-cover mosaics and suspended sediment dynamics remains unclear due to the complexity of interactions and feedbacks between geomorphological and hydrometeorological conditions in diverse river basins. Here, we aim to analyse the linkages of landscape metrics describing the spatial patterns of land-cover with the (power-law) rating exponent of suspended sediment concentration SSC and river discharge Q (i.e. SSC = aQb), as an integral property of sediment dynamics. For three major river basins in Germany (Elbe, Rhine, and Weser covering about 66 % of total German territory), the sediment rating parameters are extracted at high flows. Moreover, thoroughly selected descriptors are computed to characterize the composition and spatial configuration of land cover as well as topographic and hydrogeological conditions (e.g., temporal variability in Q and flashiness index). Preliminary results show the existence of correlations between the spatial organization of land cover along the river network and the rating exponent b at high flow regime. In particular, they indicate that high increase in suspended sediments at high flows is generated in catchments with more homogeneous land cover and sediment sources distributed near large streams. Our findings can aid policymakers and watershed managers in making informed decisions and taking necessary actions to improve current and future river water quality issues caused by suspended sediments.

How to cite: Aala, S., Basso, S., Borchardt, D., Hoffmann, T., and Yang, S.: Do land-cover mosaics affect the variability of suspended sediments in rivers? The case of large river basins in Germany, EGU General Assembly 2023, Vienna, Austria, 23–28 Apr 2023, EGU23-3142, https://doi.org/10.5194/egusphere-egu23-3142, 2023.

EGU23-3393 | ECS | Orals | HS5.9

Modeling priority areas for restoration of water-related ecosystem services under epistemic uncertainty: a case study in the Atlantic Forest, Brazil 

Iporã Possantti, Rafael Barbedo, Marcelo Kronbauer, Walter Collischonn, and Guilherme Marques

Hydrological models are crucial tools in planning the restoration of water-related ecosystem services because they help target priority areas for efficient resource allocation. However, when planning the expansion of Nature-based Solutions and Payments for Ecosystem Services, there are four key requirements that need to be taken into account. These are (1) the principle of additionality, which states that restoration policies must seek additional gains in terms of ecosystem services; (2) the representation of multiple runoff mechanisms, which can be fundamentally different in nature; (3) the calculation of farm-scale spatial outputs, which allows for the examination of the impacts of management practices at the level of individual farms; and (4) the estimation of epistemic uncertainty, which is the uncertainty that arises due to a lack of knowledge and information.

While addressing these requirements is important for making future planning more effective it can also be challenging. To address this challenge, this paper presents a comprehensive modeling framework that integrates these requirements in a way that allows for an improved selection of top priority areas with farm-scale spatial resolution, and a deeper understanding of how epistemic modeling uncertainty affects the results. This is particularly important when it comes to evaluating the risks of overestimating water-related ecosystem services benefits.

The modeling approach that we propose, called PLANS, uses the design of TOPMODEL to simulate both saturation-excess and infiltration-excess runoff at the farm-scale resolution. It also employs a novel saturation index based on a combination of the Height Above the Nearest Drainage (HAND) and Topographical Wetness Index (TWI) terrain descriptors. To estimate output epistemic uncertainty, we apply the Generalized Likelihood Uncertainty Estimation (GLUE) method, aided by an evolutionary algorithm. We demonstrate the effectiveness of the PLANS model in a case study watershed in the Atlantic Forest biome of Brazil. Our results show that uncertainty can significantly impact the definition of priorities, with a 97% ranking change. We also find that simulated topographic effects can outweigh local effects of land cover and soil type. By better evaluating uncertainty, we demonstrate that the cost of the restoration program in the study case could potentially be reduced by up to 27%, making it more cost-effective.

Overall, our modeling approach offers a promising way to address the challenges of planning the expansion of Nature-Based Solutions in watersheds and deploying programs of Payments for Ecosystem Services. It allows for the improved selection of top priority areas and a deeper understanding of the impacts of epistemic uncertainty on the outputs. By taking these considerations into account, society can make more informed decisions about how to allocate resources and design restoration programs that are both effective and efficient.

How to cite: Possantti, I., Barbedo, R., Kronbauer, M., Collischonn, W., and Marques, G.: Modeling priority areas for restoration of water-related ecosystem services under epistemic uncertainty: a case study in the Atlantic Forest, Brazil, EGU General Assembly 2023, Vienna, Austria, 23–28 Apr 2023, EGU23-3393, https://doi.org/10.5194/egusphere-egu23-3393, 2023.

EGU23-5142 | ECS | Posters on site | HS5.9

Modeling the Impact of Changing Land Use and Vegetative Cover on Hydrology, Nutrient, and Sediment Loads from an Agricultural Catchment of Lake Michigan (USA) 

Mohamed Aboelnour, Jennifer Tank, Alan Hamlet, Leonardo Bertassello, Dongyang Ren, and Diogo Bolster

High nutrient loads are an indicator of pollution sources in a watershed that need to be identified and quantified. These loads in surface and groundwater have been a major concern that impacts water quality in the Midwestern US, including the Great Lakes Basin. To investigate the influence of land use change, especially at urban/rural interfaces, we used the Soil and Water Assessment Tool (SWAT) to model water, sediment, and nutrient export for the St. Joseph River Basin (SJRB), which drains an area of 12,200 km2 in Southwest Michigan/Northwest Indiana and enters Lake Michigan. The SWAT models were built, calibrated and validated for monthly streamflow, groundwater, total suspended solids (TSS), total nitrogen (TN), total phosphorous (TP), nitrate (NO3-N) and dissolved reactive phosphate (DRP; as orthophosphate), using two stream gages (Niles, USGS ID 04101500; Paw Paw, USGS ID 04102500) in Berrien County, MI. We found that monthly hydrology, sediments, and inorganic nutrients were well captured by the model with very good to excellent performance at the Niles gage, and, good to satisfactory performance at Paw Paw. The simulated average annual groundwater was 137 mm and 129 mm for Niles and Paw Paw, respectively, suggesting that on average 57% and 60% of long-term streamflow in the basin comes from groundwater and shallow subsurface flow. For water quality variables, TSS loads were strongly correlated with streamflow with R2 reaching 0.90. Using this model, we investigated how land use change (e.g., agriculture), and the planting of winter cover crops in the fallow season would impact water and nutrient yields from the SJRB. We found that the impact of changing land use and applying cover crops on water quality components was significant and dependent on the selected spatial scale. The simulated outputs indicated that cover crops have no impact on hydrology but significantly reduced DRP and NO3-N export to Lake Michigan by up to 30% and 50%, respectively. Application of this model will assist regional land and water managers in planning for future impacts of land use and climate change and their impacts on water quality and quantity, enabling stakeholders to implement conservation practices to sustain the SJRB and other similar basins in the Great Lakes region.

How to cite: Aboelnour, M., Tank, J., Hamlet, A., Bertassello, L., Ren, D., and Bolster, D.: Modeling the Impact of Changing Land Use and Vegetative Cover on Hydrology, Nutrient, and Sediment Loads from an Agricultural Catchment of Lake Michigan (USA), EGU General Assembly 2023, Vienna, Austria, 23–28 Apr 2023, EGU23-5142, https://doi.org/10.5194/egusphere-egu23-5142, 2023.

EGU23-6035 | ECS | Orals | HS5.9

Assessing the impacts of land use/land cover (LULC) change and the effects of nature-based solutions in Andean basins. 

Kalina Fonseca, Miguel Ramírez, William Martínez, Edgar Espitia, and Lutz Breuer

The limited spatial scope of Andean basins conservation agreements by nature-based solutions (NbS) in the tropical alpine grassland region (páramos) has led to unequal protection of upstream ecosystems, endangering the water quality downstream of large Andean cities. Simultaneously, the páramos have been converted to other land uses in response to the political, economic, social, technological, ecological, and legal (PESTEL) factors. In this context, we aim to compare the negative impacts associated with land use/land cover (LULC) change and the positive effects of nature-based solutions in the upper Andean basins using remote sensing data, PESTEL analysis, and water quality assessment. The upper basin of the Pita and Cutuchi rivers, located above 3,000 m.a.s.l., which supply drinking and irrigation water to two major Andean cities in Ecuador, i.e., Quito (the capital of Ecuador) and Latacunga (an important city for floriculture and agriculture), were examined in comparison as case studies between 1999 and 2022. Our results reveal significant land-use changes from páramo to agriculture, Pinus plantations, urban growth, and mining areas in the upper basin of the Cutuchi river, driving water quality between low to moderate for drinking and irrigation purposes. According to the PESTEL framework, the main factors contributing to the lack of upper basin protection are (1) short-term policies in line with the political party, (2) state budget planning that does not meet restoration needs, (3) conflicts between the upper, middle, and lower river basin communities, (4) lack of public investment in technological tools, (5) agricultural practices in the páramo due to high soil carbon storage in comparison to other areas and (6) conflicting laws between administrative divisions. In contrast, main páramo areas have remained unaltered or passively restored in the upper basin of the Pita river by the combination of NbS and policies implemented by water funds, conserving good water quality. By using these catchments as ideal natural laboratories, we can demonstrate the positive experiences through NbS in river basin management. Together with our PESTEL analyses, it is possible to develop integral conservation projects that ensure human health and sustainable agricultural productivity in the context of Sustainable Development Goal (SDG) 6: Clean Water and Sanitation.

How to cite: Fonseca, K., Ramírez, M., Martínez, W., Espitia, E., and Breuer, L.: Assessing the impacts of land use/land cover (LULC) change and the effects of nature-based solutions in Andean basins., EGU General Assembly 2023, Vienna, Austria, 23–28 Apr 2023, EGU23-6035, https://doi.org/10.5194/egusphere-egu23-6035, 2023.

ReSET (Restarting Economy in Support of Environment, through Technology) is an EC H2020 research and development project focused on future and emerging technologies (FET) in Environmental Intelligence (EI). EI brings together multiple data streams, employing human reasoning and machine learning to better understand and manage the environment.

As part of ReSET, we are developing and deploying distributed networks of in-field sensors to monitor the hydrological impact of natural flood management, regenerative farming and other ecosystem restoration.  These sensor networks use FreeStation.org, low-cost, internet connected environmental sensing and data logging to provide locally specific evidence for the hydrological impact of a range of restoration investments in different locations and at different scales. More than 100 data loggers  have been deployed for 18 months collecting data every 10 minutes. 

This provides both capacity to directly analyse the effectiveness of investments in water ecosystem services  and co-benefits for non water ecosystem services and helps develop the understanding to better parameterise these restoration investments in spatial models like WaterWorld.  We apply  the WaterWorld Policy Support System  to assess the hydrological impact of novel scenarios for ecosystem restoration at the national and European scale. 

As well as ecosystem restoration, a  key  focus is regenerative agriculture (RA) which is a land management technique that involves no or low tillage, the use of cover crops and diverse crop rotations to help restore soil structure to a more natural state, encouraging infiltration and reducing runoff generation. This management technique has the potential to increase the water storage capacity of the soil, thereby reducing downstream runoff generation and flood risk..

Our local scale monitoring indicates that restoration of Eurasian Beaver habitat and of farmed soil through reduced tillage have the potential to increase flood storage locally and can reduce flood risk at downstream assets if applied at scale. Our national and continental scale modelling indicates that soil and canopy stores are critical to natural flood management since water body and wetland stores have only local influence and floodplain stores often contain important assets that preclude the use of the floodplain.  Ecosystem restoration has the potential to regenerate Europe's waters, but significant effort will be required to reach the level of restoration that will be needed 

How to cite: van Soesbergen, A., Burke, S., and Mulligan, M.: H2020ReSET: Monitoring and modelling the hydrological impact of ecosystem restoration scenarios at scales from local to continental using FreeStation and WaterWorld, EGU General Assembly 2023, Vienna, Austria, 23–28 Apr 2023, EGU23-6801, https://doi.org/10.5194/egusphere-egu23-6801, 2023.

Floods are amongst the most frequent and widespread disaster worldwide, posing enormous development challenges. Also in West Africa, flood risk still needs proper addressing. Ecosystem-based disaster risk reduction (Eco-DRR) approaches are increasingly recognised as cost-effective part of the solution, providing ecosystem services that reduce all three components of risk, namely hazard, exposure and vulnerability. Indeed, Eco-DRR, such as floodplain restoration or agroforestry, can affect hydrological processes, altering the flood hazard and exposure, and provide ecosystem services that reduce people’s vulnerability to floods and/or enhance their adaptive capacities. To fully understand the impact of Eco-DRR on the three components of risk, it is thus important to take an interdisciplinary approach to the assessment of Eco-DRR. Yet, there remains a substantial gap in the comprehensive evaluation of Eco-DRR effects, including guidance on how to depict the flow of ecosystem services and their benefits to people, which undermines the effective use of Eco-DRR measures in flood-prone environments.

Using the case study of flood risk in the Ouémé River Basin, this contribution will share advances in the comprehensive evaluation of Eco-DRR measures. After defining locally-relevant Eco-DRR measures based on administrative plans, the scientific literature, and expert surveys, a systematic literature review has been conducted to understand the impact of selected Eco-DRR measures on both hydrological processes and ecosystem services provisioning, so as to evaluate the Eco-DRR measure against its effects on all risk dimensions. For the hazard, the hydrological model SWAT is used, comparing the flood hazard under different land use and land cover change scenarios. Preliminary results, with a focus on the Eco-DRR measure of agroforestry, and lessons learnt will be presented in the session.

How to cite: Balzer, J., Janzen, S., Merk, F., and Walz, Y.: Ecosystem-based approaches for flood risk reduction: Advances in their comprehensive evaluation using the case of the Ouémé River Basin in Benin, EGU General Assembly 2023, Vienna, Austria, 23–28 Apr 2023, EGU23-7075, https://doi.org/10.5194/egusphere-egu23-7075, 2023.

EGU23-7192 | ECS | Posters on site | HS5.9

Identification of extent and drivers of urbanisation in Ireland: A remote sensing-based approach 

Sonam Sandeep Dash, Bidroha Basu, Fiachra O'Loughlin, and Michael Bruen

Population growth in conjunction with rapid urbanization and industrialization has put immense pressure on global land use and land cover (LULC) patterns, and subsequently, adversely affect the water quantity and quality of associated water resources. The involved rate of change, spatio-temporal distribution of altered LULC classes, and the corresponding trend of LULC classes are quite challenging to monitor by using the conventional field survey-based approach. This study aims to analyse the changes in urbanization extent over Ireland during the past two decades, i.e., 2001-2021 using remotely sensed imageries. In addition, the extent of urbanization and its association with population growth is studied in detail over 43 spatially distributed study catchments of Ireland. One advantage of using remotely sensed LANDSAT observations include high-resolution spatial data available at a high temporal scale and also that the imagery is available for such long period covering the entire study period. The urbanization mapping is confined to two meteorological seasons, viz., summer and winter of every year analyzed. To aid more reliability in the outcomes of this study, the ACOLITE-based atmospheric correction algorithm has been adopted and the imageries were pre-processed before performing the image classification. The urbanisation trend over the period 2001-2021 revealed that the urban area expansion across the chosen catchments has happened at a rate of 0.13 to 1.14 km2/yr with the highest urban expansion rate is confined to the Dublin region of Ireland during the summer season. Furthermore, a correlation-based approach has been extended to study the drivers of increased urbanization in Ireland. The outcome of the correlation analysis revealed that population growth is the major driver behind increased urbanization and does affect the water resource quality adversely. The developed approach could be well replicated at any global catchment/regional-scale applications to generate essential database and analyse its impact on the water resources of the region of interest.

How to cite: Dash, S. S., Basu, B., O'Loughlin, F., and Bruen, M.: Identification of extent and drivers of urbanisation in Ireland: A remote sensing-based approach, EGU General Assembly 2023, Vienna, Austria, 23–28 Apr 2023, EGU23-7192, https://doi.org/10.5194/egusphere-egu23-7192, 2023.

EGU23-8987 | ECS | Orals | HS5.9

Modelling the hydrological responses of a headwater catchment under shifting cultivation in upland Eastern Madagascar 

Bob W. Zwartendijk, Ilja van Meerveld, Adriaan J. Teuling, Chandra Ghimire, Hannes Leistert, and Leendert A. Bruijnzeel

Land cover in catchments undergoing shifting cultivation typically represents a mosaic of agricultural fields, fallows in different stages of regrowth, remnant forest, and degraded grasslands. Although runoff responses of the respective land-cover types are expected to differ, there is little quantitative information on how such a mosaic of land covers affects rainfall-runoff responses at the catchment scale.

From February 2015 to February 2016, we measured rainfall, streamflow, plus plot-scale (saturation) overland flow (SOF), soil water, and shallow groundwater dynamics under different land covers in the 31.7 ha Marolaona catchment in Eastern Madagascar. The catchment has undergone shifting agriculture for over 70 years which has resulted in a mosaic of vegetation at different stages of regrowth. Plot-scale hydrological responses varied between land covers and topographic positions, but catchment stormflow responses were generally small and dominated by pre-event water, suggesting that most storm-runoff was generated in the valley-bottom. However, for events exceeding an antecedent soil moisture storage plus rainfall threshold value, stormflow increased considerably, indicating contributions from the hillslopes as well. Despite lower rainfall in 2015/16, stormflow totals and annual water yield were higher than values reported for the driest years in the 1960s[1]. This is thought to reflect a deterioration of soil physical properties by repeated burning, cropping, and associated loss of topsoil during the intervening years, which has reduced the depth to an impeding layer and increases in amount and frequency of SOF.

To gain further insight into the runoff-responses across the catchment, we applied the RoGeR_Dyn model[2] using field-measured soil physical parameters for the respective land covers, topographic data, and climatic inputs. The simulations thus far highlighted greater deep percolation under tree fallows, while SOF was more common during the early stages of regrowth. Amounts of subsurface stormflow and percolation to deeper layers were highest in concave areas where flows converged. Soil moisture contents were lowest under tree-based land covers during the dry season. For nearly the entire dry season, rainfall events supplied the minimum amount of water needed to maintain soil moisture contents above critical levels for transpiration. This agrees with measured soil moisture and tree transpiration rates for nearby sites.

Although the hillslope modelling results are not expected to provide sufficient evidence to determine the effect of land cover on catchment-scale ecosystem services such as streamflow regulation, the lower runoff and higher deep percolation found along hillslopes under older fallows and forest suggest that these may be beneficial for flood mitigation and dry-season water provisioning to downstream areas. Next, RoGeR_Dyn will be used to determine the effects of regional changes in hillslope land cover and climate change on streamflow dynamics.

[1] Bailly, C., et al. (1974). Étude de l'influence du couvert naturel et de ses modifications á Madagascar. Expérimentations en bassins versants élémentaires. Cahiers Scientifiques, 4. Centre Scientifique Forestier Tropical, Nogent-sur-Marne, France, 114 pp.

[2] Steinbrich, A., Leistert, H., Weiler, M. (2021). RoGeR – ein bodenhydrologisches Modell für die Beantwortung  einer Vielzahl hydrologischer Fragen. In Korrespondenz Wasserwirtschaft, 14. Jahrgang, Heft Nr. 2, Feb-2021.  https://doi.org/10.3243/kwe2021.02.004

How to cite: Zwartendijk, B. W., van Meerveld, I., Teuling, A. J., Ghimire, C., Leistert, H., and Bruijnzeel, L. A.: Modelling the hydrological responses of a headwater catchment under shifting cultivation in upland Eastern Madagascar, EGU General Assembly 2023, Vienna, Austria, 23–28 Apr 2023, EGU23-8987, https://doi.org/10.5194/egusphere-egu23-8987, 2023.

EGU23-9882 | ECS | Orals | HS5.9

Modelling water-related ecosystem services with InVEST - developing guidance on how to select appropriate land cover input data  

Ina Sieber, Malte Hinsch, Artur Gil, and Benjamin Burkhard

Modelling and mapping water-related ecosystem services (ES) are getting more important in the scientific community and decision making contexts. Especially straightforward, easy to operate ES model suites that are based on Land Use / Land Cover (LULC) data have gained popularity in the scientific realm, including but not limited to the InVEST Model Suits. Model sensitivity to input factors has been widely assessed. However, little attention has been given to the effect on modelled ES distribution by user decisions such as the selection of LULC dataset. These crucial input data influence model results and hence, validity and credibility of model outputs and maps. Yet, many model applications aim to support policy and decision making, without properly specifying uncertainties of their modelling and underlying data.

Therefore, we investigated how to select appropriate and representative LULC data for model application. To test the effects of input LULC data on modelling results, we modelled the three regulating ecosystem services of water erosion control, water quality and water flow retention using InVEST. Different input LULC datasets were used to analyse how these datasets affect the modelling and mapping of ES supply. Taking a case study on Terceira Island, the Azores (Portugal), 3 LULC datasets were applied: (1) the EU-wide CORINE LULC (2018), (2) the Azores Region official LULC map (COS.A 2018) and (3) a remote sensing-based vegetation map using Sentinel-2 satellite imagery (2018). Output maps were compared by statistical analysis of class for distribution and similarity and visualized in similarity maps, showing the spatial variability between the three input LULC model results.

Model results show significant differences in distribution of water-related ES based on the different input LULCs. For the ES erosion control (Sediment Delivery Module), spatial distribution of modelled output maps differed greatly. Large homogenous agricultural areas in LULC datasets, in combination with steep slopes, present a skewed picture of erosion rates, simplifying the small patch structure with hedges and stone rows found on Terceira island. The modelling of Water quality, based on Nutrient Export Module, and flow retention, based on the Seasonal Water Yield Module, showed a more balanced and similar, yet significantly different spatial pattern of ES supply.

Therefore, we developed a guiding scheme to help researchers and practitioners select appropriate input LULC data for their ES modelling. Hereby, the availability of different LULC data is a first criterion. Factors such as LULC classes, especially linked to aquatic, riparian and agricultural land uses determine the level of detail of water-related ES modelling. Also, the scale of the assessment should be reflected in the average feature size and Minimum Mapping Units of the LULC dataset. Especially for local model applications, availability of high resolution LULC data, including structural elements, is preferred to obtain precise results.

How to cite: Sieber, I., Hinsch, M., Gil, A., and Burkhard, B.: Modelling water-related ecosystem services with InVEST - developing guidance on how to select appropriate land cover input data , EGU General Assembly 2023, Vienna, Austria, 23–28 Apr 2023, EGU23-9882, https://doi.org/10.5194/egusphere-egu23-9882, 2023.

EGU23-11158 | ECS | Orals | HS5.9

High resolution regional climate model points to a wetter UK with widespread afforestation 

Marcus Buechel, Simon Dadson, Louise Slater, Ségolène Berthou, William Keat, and Huw Lewis

Interest continues to grow in the benefit of afforestation for carbon sequestration, yet the potential consequences of largescale afforestation on terrestrial hydrology are still unknown. Furthermore, it is unclear how large land cover changes may alter the surface-atmosphere hydrological connection, particularly as the climate and hydrological cycle evolve. In this study, we investigate how terrestrial and atmospheric hydrological processes in the UK may alter with increases in woodland across the UK, Ireland, and parts of Western Europe. We use a convection permitting physics-based regional climate model (HadREM3-RA11M) at 2.2 km resolution to simulate and identify the responses of afforestation on hydrology. Afforestation scenarios were generated using existing datasets from regional authorities and previous studies, with tree type determined according to pre-existing landcover. We compare modelled scenarios of widespread afforestation and existing land cover for a future period up to 2080 (with Representative Concentration Pathway 8.5) to assess the consequences of expanded woodland on terrestrial and atmospheric processes within the UK in a much warmer climate.


Model results show clear and substantial changes in hydrology in both the atmosphere and land surface with woodland expansion. Soil moisture increases, leading to a commensurate boost to subsurface flows, which is particularly greater in summer months. Although runoff increases throughout the country, there is a proportionally greater increase in the drier south-eastern UK. Evaporation broadly decreases across the country, primarily driven by a reduction in soil evaporation, although this varies seasonally. Precipitation patterns also alter substantially, with increases in the west and slight increases and decreases in the east of the country. These results provide unique insights into how models that couple the land surface with the atmosphere can identify potentially far-reaching consequences of afforestation in temperate regions.

How to cite: Buechel, M., Dadson, S., Slater, L., Berthou, S., Keat, W., and Lewis, H.: High resolution regional climate model points to a wetter UK with widespread afforestation, EGU General Assembly 2023, Vienna, Austria, 23–28 Apr 2023, EGU23-11158, https://doi.org/10.5194/egusphere-egu23-11158, 2023.

EGU23-11424 | ECS | Posters on site | HS5.9

Assessment of land use land cover changes and its impact on groundwater resources of Kamrup along the banks of the River Brahmaputra 

Dhritilekha Deka, Karangat Ravi, and Archana M Nair

Urbanisation induced land use land cover changes (LULC) are irreversible and is an intensifying worldwide phenomenon. The unprecedented urban growth rate affects the hydrological system and its associated ecosystem services. This has led to a situation where even regions with huge water potential such as the Ganga-Brahmaputra basins of India, are experiencing potable water scarce conditions. Hence, this study is an effort to evaluate the role of LULC on the groundwater resources of Kamrup district, along the banks of River Brahmaputra in Assam. The study entails a quantitative analysis using GIS applications, whereas the statistical significance is evaluated using Man Kendall trend analysis. Satellite images of Landsat and Sentinel are clustered and segmented to classify six different classes. The cloud-based platform of Google Earth Engine (GEE) is utilised for the object oriented (OO) classification. A combination of Simple Non-Iterative Clustering (SNIC) and Random Forest Classifier is utilised to obtain an accuracy >85% for all the images. It is observed that the area under agriculture and wetlands has reduced by 58.99% and 44.7% between 1990 to 2020, respectively. On the other hand, the area under urban impervious cover has increased from 1.875% in 1990 to 17.05% in 2020. The Mann Kendall trend analysis of the groundwater levels shows that 69% of the well locations demonstrate a declining trend at 95% confidence interval. The maximum decline rate is of 0.13 m year−1 and minimum decline rate is 0.03 m year−1. Comparative investigation of the groundwater decline and urban growth shows that 47% of the groundwater wells with declining water levels are located in regions urbanised from 1990 to 2020. The decline in the groundwater levels can be attributed to increased impervious surfaces with the urbanisation. Further, the reduced chances of infiltration have led to amplified runoff and floods with reduced groundwater level in the wells. The results from this study indicate that the depletion in groundwater across the study area can be strongly linked to anthropogenic interferences. Such monitoring of LULC changes along with the dynamics in water levels across the study area, provide a necessary database for the protection, decision-making and sustainable management of the existing freshwater resources.

How to cite: Deka, D., Ravi, K., and Nair, A. M.: Assessment of land use land cover changes and its impact on groundwater resources of Kamrup along the banks of the River Brahmaputra, EGU General Assembly 2023, Vienna, Austria, 23–28 Apr 2023, EGU23-11424, https://doi.org/10.5194/egusphere-egu23-11424, 2023.

EGU23-12042 | ECS | Posters on site | HS5.9

Suitable Site Selection for Riparian Buffer Zone Construction in the Han River Basin 

Hojun Choi, Kihwan Song, and Jinhyung Chon

As a transition zone between the aquatic and terrestrial ecosystems in river basins, riparian buffers are important for providing ecosystem services such as water quality purification and biodiversity improvement.

The existing dam basin areas have a problem of weakening or decreasing ecosystem resilience due to damage and disturbance such as non-point pollution sources. Therefore, a suitable site must be selected to create a riparian buffer zone around the area where damage and disturbance occur.

However, the previous studies have limitations in that they do not consider socio-ecological characteristics and the changes that depend on various factors, such as approaches of various spatial scales, structural and institutional support, and physical conditions for each site.

Therefore, the purpose of this study is to derive the final suitable site for a riparian buffer zone in a target site through the quantitative establishment of appropriate site selection indicators that take into consideration the social and environmental factors necessary for the establishment of a riparian buffer zone in a dam basin and the overlapping of established indicator data.

The Han River is the largest in Korea with the largest basin area and its major water resource facilities are distributed. In this study, a suitable site analysis was performed for the Chungju Dam and the Soyanggang Dam among the Han River water systems.

First, the items necessary for field analysis were derived based on a literature review. As a result, the indicators related to geographical conditions, soil environment, water quality environment, environmental ecology, and legal conditions were derived.

Second, data were constructed based on the digital elevation model, land cover map, water quality measurement network, and national environmental assessment map for the selected indicators. As a result, 21 different types of maps were derived according to geographical conditions, soil environment, water quality environment, environmental ecology, and legal standards.

Third, 21 data previously established by type were overlapped and prioritized to determine the appropriate locations for the Chungju Dam and the Soyanggang Dam. The Chungju Dam and Soyanggang Dam areas were ranked in the top 20 per cent among 106 and 42 zones, respectively. Finally, eight fields were derived for each dam through consultations and discussions with related organizations.

This study is meaningful in that it derived suitable items of analysis by considering various socio-ecological and legislative factors and selected suitable sites according to the priorities that were graded based on them. The process of this study can be applied to other studies for the creation of riparian buffer zones in the future.

Acknowledgement

This research was supported by "Development of living shoreline technology based on blue carbon science toward climate change adaptation" of Korea Institute of Marine Science & Technology Promotion (KIMST) funded by the Ministry of Oceans and Fisheries (KIMST-20220526). Also This research is a part of Environmental Fundamental Data Examination project of River Hangang Basin Management Committee


How to cite: Choi, H., Song, K., and Chon, J.: Suitable Site Selection for Riparian Buffer Zone Construction in the Han River Basin, EGU General Assembly 2023, Vienna, Austria, 23–28 Apr 2023, EGU23-12042, https://doi.org/10.5194/egusphere-egu23-12042, 2023.

EGU23-12098 | ECS | Posters virtual | HS5.9

Evaluation of Best Management Practices (BMPs) For WES Conservation in an Agricultural Watershed 

Triveni Majhi and Meenu Ramadas

Implementation of best management practices (BMPs) is essential for conservation of soil and water resources, and for preventing degradation of water related ecosystem services (WES) in agricultural watersheds. Assessment of effectiveness of BMPs to mitigate problems due to erosion and peak runoff at watershed scale can be performed through scenario analyses in hydrological models such as Soil and Water Assessment Tool (SWAT). In this study, we performed spatial assessment of vulnerability of a small watershed (Jambhira) located in eastern part of India to erosion and sediment loading, in order to evaluate the effectiveness of few BMPs to mitigate the negative impacts of erosion. We utilized the SWAT model to simulate watershed management options such as grassed waterways, terracing, filter strips, strip contour cropping and stream bank stabilization as BMPs. After identifying critical soil erosion prone areas in the study watershed, BMPs are implemented targeting a decrease in sediment output, minimizing loss of nutrients, and lowering of peak runoff from the watershed. In a similar manner, critical reach sections are also determined for implementing suitable BMPs. Out of 21 sub basins of the study watershed, 14 sub basins fall under category of “very high” soil erosion (sediment yield is 20-40 t/ha/yr) and among these 14 sub basins, the reach corresponding to 6 sub basins have a significant sediment concentration. Thus, BMPs are implemented in the six critically soil erosion prone sub basins that constitute 34.29% of watershed area. Based on the geography and land use of the study watershed, we found the land management operations: contour farming and strip contour cropping, and channel restoration strategies: buffer strips and grassed waterways, as most suitable. After implementation of contour farming and strip contour cropping, it is seen that the critical sub basins have moved from “very high” to “high” and “moderate” soil erosion categories thus leading to improved WES in the area. Based on simulated results, the effectiveness of strip contour cropping is found to be higher than contour farming in reducing sediment yield of the study watershed. With additional interventions proposed for reach management in this watershed, it is possible to reduce negative effects of erosion substantially.

Key words: Best Management Practices, Soil Erosion, Soil and Water Assessment Tool, Watershed Conservation, Sediment Yield

How to cite: Majhi, T. and Ramadas, M.: Evaluation of Best Management Practices (BMPs) For WES Conservation in an Agricultural Watershed, EGU General Assembly 2023, Vienna, Austria, 23–28 Apr 2023, EGU23-12098, https://doi.org/10.5194/egusphere-egu23-12098, 2023.

The hydrology of a catchment is sensitive to its intrinsic attributes, such as the land use/land cover
(LULC), soil type, and topography, which collectively determines its response to the weather inputs
(e.g., precipitation, temperature, radiation, etc.). The dynamic nature of LULC in both space and time
poses a severe challenge in the reliable prediction of the hydrologic response of catchments.
However, the spatio-temporal variation in LULC is seldom accounted for in hydrological modeling
studies, which leads to an inaccurate characterization of the watershed. In this study, we have
incorporated dynamic LULC (both in space and time) within the Soil and Water Assessment Tool
(SWAT) model, using SWAT-LUT (Land use Update Tool) for the Nowrangpur catchment in India. The
LULC maps corresponding to the years 1985, 1995, 2005, and 2015 are used to generate the
intermediate years’ maps via linear interpolation. The future LULC maps till the year 2035 are
predicted using Cellular Automata- Artificial Neural Network (CA-ANN) algorithm in the GIS
framework. It is observed that there is a reduction in the forest cover from 19.13% in the year 1985
to 7.55% in the year 2015, along with the expansion of urban areas and impervious surface from
0.36% in the year 1985 to 2.47% in the year 2015. Calibration and validation of the monthly
streamflows are performed by accounting for dynamic LULC within the catchment through SWAT-
LUT. The satisfactory performance of the SWAT model is observed in predicting the monthly
streamflows in the Nowrangpur catchment. Further, the comparison of streamflow prediction under
static and dynamic LULC is performed. In these two cases, the observed changes in the values of
water balance components (i.e., with and without using SWAT-LUT), such as evapotranspiration,
surface runoff, infiltration, and water yield, are studied. The changes in the water balance
components are attributed to the LULC changes within the catchment. The results indicate that the
land use update (to account for the Spatio-temporal variability in LULC) needs to be incorporated to
determine the reliable hydrological response of a catchment.

How to cite: Kaur, S. and Chavan, S.: Assessing impacts of Spatio-temporal changes in land use and land cover on the hydrologic response of an Indian Catchment, EGU General Assembly 2023, Vienna, Austria, 23–28 Apr 2023, EGU23-14603, https://doi.org/10.5194/egusphere-egu23-14603, 2023.

EGU23-14983 | Orals | HS5.9

Effects of land use change on water-related ecosystem services in the Amazon Basin 

Maria J. Santos, John C. O'Connor, Kien Nguyen, Obbe Tuinenburg, and Stefan C. Dekker

Land use changes can affect many dimensions of the hydrological cycle which in turn affect the provisioning of water and its related ecosystem services to society. Modification at different spatial and temporal extents due to seasonal changes in water supply and land use intensities may compound and challenge our ability to predict the cascade of processes that lead to the supply of ecosystem services, i.e., ecosystem service cascade (ecosystem property, supply and service). In the Amazon basin, land use changes may affect water supply through modification of moisture recycling periodicity, and a quantification of its effects on other water-related ecosystem services, namely crop production and biodiversity, is scarce. We investigated this process using a moisture-tracking model, to show that upstream land use changes will affect the persistence of cropland in the Amazon arch of deforestation.  We also show that biodiversity trait distributions affect the provision of water that maintains the cascades of moisture recycling, and different trait combinations enable regulation of atmospheric water regulation and land surface temperature. As trait combinations are a result of land use changes, the future of moisture recycling in the Amazon and its dependence downstream may require a better land use planning that incorporates these processes more explicitly.

How to cite: Santos, M. J., O'Connor, J. C., Nguyen, K., Tuinenburg, O., and Dekker, S. C.: Effects of land use change on water-related ecosystem services in the Amazon Basin, EGU General Assembly 2023, Vienna, Austria, 23–28 Apr 2023, EGU23-14983, https://doi.org/10.5194/egusphere-egu23-14983, 2023.

EGU23-15446 | ECS | Posters on site | HS5.9

Forest management strategies to improve water-related ecosystem services in central Italy 

Marco Lompi, Tommaso Pacetti, Giovanni Pasini, and Riccardo Santolini

Forest management can represent a powerful tool to optimise ecosystem services related to water, as water availability is deeply connected with forests and their management. The objective of this study is to improve the understanding of the forest–water connection, developing a methodology that can explain which forest types and management strategies can increase water availability and flood protection in Casentino Forest National Park (Parco Nazionale delle Foreste Casentinesi). The different forest management types for every species considered in the study are abandoned or unmanaged forest, coppice, coetaneous and non-coetaneous high forest. The Casentino Forest National Park in Central Italy on the Apennine Mountains covers a set of 25 small river basins, which have been chosen as a case study to test a methodology based on hydrological modelling and machine learning tool. First, the Soil Water Assessment Tool (SWAT) has been calibrated and used to model the baseline scenario, evaluating the ecosystem services the forest park provides. The baseline scenario has been built in the SWAT model, characterising the forest-related parameters, such as the leaf area index, the leaf-to-biomass fraction, the biomass of the forest or the canopy storage among others. This information has been retrieved with land use data, such as the Corine Land Cover, available forest technical map and MODIS satellite images. The following step has been the analysis of multiple land use scenarios to understand the potential effect of different forest management on water-related ecosystem services. Nevertheless, the SWAT model is hugely time-consuming in modelling several land use scenarios, as each forest management strategy needs to be described with a new set of parameters and model runs. For this reason, a Support Vector Machine (SVM) learning model has been trained to reproduce the hydrological behaviour of the Park using the  SWAT model outputs for the baseline scenario as a training dataset. The SVM has been validated with a Jack-Knife cross-validation to test its reliability in determining the average annual water yield, runoff, evapotranspiration and percolation in the river basins using the different forest management types as input. Then, the SVM has been used to model a set of 4200 different land use scenarios to understand the type of forest with the higher water yield content or lower surface runoff. The results show that the oldest forests, especially with a prevalence of oaks, have great potential in regulating services, while the coppices contribute more to the provisioning services.

How to cite: Lompi, M., Pacetti, T., Pasini, G., and Santolini, R.: Forest management strategies to improve water-related ecosystem services in central Italy, EGU General Assembly 2023, Vienna, Austria, 23–28 Apr 2023, EGU23-15446, https://doi.org/10.5194/egusphere-egu23-15446, 2023.

EGU23-16583 | ECS | Posters on site | HS5.9

Revealing the importance of transpiration from trees and non-tree vegetation to moisture recycling over Africa 

Sofie te Wierik, Jessica Keune, Diego Miralles, Erik Cammeraat, Joyeeta Gupta, Yael Artzy, and Emiel van Loon

The redistribution of biological (transpiration) and non-biological (interception loss, soil evaporation) fluxes of terrestrial evaporation via atmospheric circulation and precipitation is an important Earth system process. Overall, vegetation is the main contributor to terrestrial evaporation and subsequent precipitation over land. Yet, the specific contribution of different vegetation classes remains understudied. Here, we investigate how different vegetation classes (trees and non-tree vegetation) contribute to precipitation patterns through moisture recycling over African watersheds. Our study is based on simulated daily atmospheric moisture trajectories derived from the Lagrangian model FLEXPART, driven by 1° resolution reanalysis data over 1981–2019, aggregated at the monthly level. The data is constrained by evaporation and precipitation products, and unravels the annual and seasonal contribution from trees and non-tree vegetation to precipitation, employing fractional vegetation cover data. Our findings show that trees provide a higher water flux to precipitation over Africa compared to non-tree cover, with contributions of 777 mm year-1 versus  342 mm year-1  respectively. However, the large extent of non-tree vegetation over the continent compensates for this difference and many watersheds depend even largely on non-tree vegetation for precipitation. As non-tree vegetation appears to be important for precipitation over Africa, its current contribution to water availability should not be overlooked and requires further research, particularly in relation to ongoing land use and land cover change that may affect hydrology. Providing an outlook on existing and projected land use and land cover change, we highlight the spatial heterogeneous impact on local and regional water availability over the continent.

How to cite: te Wierik, S., Keune, J., Miralles, D., Cammeraat, E., Gupta, J., Artzy, Y., and van Loon, E.: Revealing the importance of transpiration from trees and non-tree vegetation to moisture recycling over Africa, EGU General Assembly 2023, Vienna, Austria, 23–28 Apr 2023, EGU23-16583, https://doi.org/10.5194/egusphere-egu23-16583, 2023.

EGU23-17370 | Orals | HS5.9 | Highlight

Supporting operational water management and policy making through scale-specific approaches 

Stefan Uhlenbrook, Sulagna Mishra, Luis Roberto Silva Vara, Johanna Korhonen, Washington Otieno, and Hwirin Kim

Societies, economies and ecosystems depend on sustainable and resilient hydrological services provided by in-tact hydrological systems and processes. These services are defined by the inter-dependencies of various drivers of which land use and land cover changes (LULC) as well as climate change are increasingly dominating, often leading to degraded hydrological services and altered ecosystem dynamics with different levels of societal and economic impacts.

Increasing and more frequent hydrological extremes (floods and droughts) and reduced water availability for various users and uses, often accompanied with increasing water demands, require effective operational water management. Therefore, in-depth knowledge of hydrological processes and their links to LULC, climate changes and other human interventions as well as tools are required to guide water management and policy decisions, such as, increasing water storage in grey and/or green infrastructure, caps on water consumption, or ecosystem restoration. This presentation reviews key processes and introduces the Hydrological Status and Outlook System (HydroSOS) and related assessment and reporting approaches to inform decision and policy-making. Therefore, a scale-specific approach is suggested in which LULC, water use and hydrological processes are embedded in a larger systems approach (including natural and human systems) to guide operational management and policies.

How to cite: Uhlenbrook, S., Mishra, S., Silva Vara, L. R., Korhonen, J., Otieno, W., and Kim, H.: Supporting operational water management and policy making through scale-specific approaches, EGU General Assembly 2023, Vienna, Austria, 23–28 Apr 2023, EGU23-17370, https://doi.org/10.5194/egusphere-egu23-17370, 2023.

EGU23-819 | ECS | Posters on site | HS5.11

Drivers influencing the changes in the Composite Flood Vulnerability Index in the Lower Godavari Basin 

Apoorva Singh and Chandrika Thulaseedharan Dhanya

The importance of studying the different dimensions of a flood disaster – hazard, exposure, resilience, and vulnerability has been highlighted in many studies. While concrete methodologies exist for estimating flood hazards and exposure, determining vulnerability remains a hurdle in flood risk assessment. Whereas the hazard and exposure analysis captures the susceptibility of physical assets, it fails to address the vulnerability of its inhabitants, which may be attributed to poverty, occupation, caste, ethnicity, exclusion, marginalization, and inequities in resource availability. Despite efforts in the mapping of flood-prone areas and developing various social vulnerability and flood vulnerability indices, there is limited understanding of the combined effect of physical and socio-economic factors on flood vulnerability. Thus, in this study, a composite flood vulnerability index (CFVI) is conceptualized to study the combined effect of physical and socio-economic factors on flood vulnerability, and the changes in the CFVI are analyzed in the floodplains of the Lower Godavari basin in India. The region between the Bhadrachalam and Konta, located on the banks of the Godavari River, experiences frequent fluvial flooding due to the backwater effect caused by the turbulence generated at the confluence of the Godavari and Sabari rivers. The study of flood vulnerability as a combination of hazard, exposure, and social vulnerability will help diagnose the cause of the vulnerability, and strategize flood mitigation efforts while ensuring social equity. Moreover, studying the spatial distribution and temporal changes in the composite flood vulnerability index at a regional scale can help design a combination of structural flood control and adaptive measures.

How to cite: Singh, A. and Dhanya, C. T.: Drivers influencing the changes in the Composite Flood Vulnerability Index in the Lower Godavari Basin, EGU General Assembly 2023, Vienna, Austria, 23–28 Apr 2023, EGU23-819, https://doi.org/10.5194/egusphere-egu23-819, 2023.

EGU23-1360 | ECS | Orals | HS5.11 | Highlight

Domestic water supply under stress due to future climatic and socio-economic changes: A European-scale analysis 

Linda Söller, Robert Luetkemeier, and Petra Döll

Groundwater resources are essential for human water supply and ecosystem functioning. Against the background of climate change, groundwater use becomes increasingly important, as it serves as a buffer during dry periods and is often less polluted than surface water. However, changing socio-economic factors influence groundwater use patterns (e.g. demographic transition, economic development and efficiency gains) and can lead to high demands during (dry summer) periods of low availability. In addition, there are climate change-related changes in groundwater recharge due to altered precipitation patterns and increased potential evapotranspiration. Therefore, it is necessary to consider scenarios of future groundwater availability and use to support sustainable groundwater management in Europe. We combine groundwater recharge and societal water demand in Europe to identify spatial patterns of groundwater availability and demand mismatches. For the current situation, we use data from the global hydrological model WaterGAP to quantify, with a spatial resolution of 0.5°, groundwater stress across Europe as the ratio of total groundwater abstractions to groundwater recharge. For future recharge estimation, we compile a multi-model ensemble with data from the Inter-Sectoral Impact Model Intercomparison Project (ISIMIP) that includes four global climate and eight global hydrological models to assess the uncertainties that are inevitable in analyzing the future impacts of climate change. We quantify scenarios of future domestic water demand using water use data, population scenarios and climate variables on a national and sub-national scale. By combining current groundwater stress with trends in future groundwater recharge and domestic water demand, we identify hotspots of future stress on domestic water supply. Our approach contributes to the understanding of human-water interactions and highlights the importance of combining physical conditions and human influences. The methodology can be easily adapted to other regions of the world (if data on water use and population are available) to support sustainable groundwater management.

How to cite: Söller, L., Luetkemeier, R., and Döll, P.: Domestic water supply under stress due to future climatic and socio-economic changes: A European-scale analysis, EGU General Assembly 2023, Vienna, Austria, 23–28 Apr 2023, EGU23-1360, https://doi.org/10.5194/egusphere-egu23-1360, 2023.

EGU23-1547 | ECS | Orals | HS5.11 | Highlight

The finance sector: help or hindrance in resolving global water crises? 

Rick Hogeboom and Ioana Dobrescu

Anthropogenic pressures are generating an increasing number of water crises worldwide, including depletion of resources, water scarcity, pollution and water insecurity. One of the most prominent drivers behind these crisis is humanity’s growing water footprint, which measures human appropriation of freshwater resources in terms of volume and assimilation capacity to fulfill human needs and desires. The adverse impacts of our growing water footprint are manifold and spill over from the water and environmental domains to social, cultural, and economic domains.

The finance sector constitutes a powerful actor group that is often overlooked in water management discourses, despite the fact that through their allocation of trillions worth of monetary capital they enable economic activities that use and pollute water. In doing so, they steer and shape the state of Earth’s water resources of tomorrow. Finance may thus prove a crucial lever to help mitigate some of the water crises the world is currently facing and reach global water security by steering economic activity away from detrimental water practices. To date, however, it is unknown if the finance sector in (including banks, pensions funds and insurance companies), are a help or a hindrance in resolving global water crises.

We try to shed light on this issue by developing an assessment framework that is able to evaluate to what extent institutional investors include water aspects in their investment policies. The framework incorporates criteria on water accounting (e.g. do investors know the water footprint of their portfolio assets?); impact assessment (e.g. do investors assess water-related environmental, social and economic impacts of their investments?); impact management (e.g. do investors have mitigation plans in place?); and organizational governance structures and disclosure (e.g. do they report on water in their public facing communications?). We applied the framework to the 50 largest investors worldwide, managing 118 trillion USD in assets, by scrutinizing publicly disclosed policy documents, reporting and analyses on these topics. We scored and ranked the investors assessed to tell apart laggards from frontrunners.

Our study elucidates new interactions between two currently disconnected groups of stakeholders, i.e. the finance community on the one hand and the water science community on the other. Our study helps water scientists to better understand drivers of some of the water-related problems they struggle to address through research, while also assisting investors on their journey to assure water sustainable investment policies fit for a water secure, inclusive and circular global economy.

How to cite: Hogeboom, R. and Dobrescu, I.: The finance sector: help or hindrance in resolving global water crises?, EGU General Assembly 2023, Vienna, Austria, 23–28 Apr 2023, EGU23-1547, https://doi.org/10.5194/egusphere-egu23-1547, 2023.

The Nile is the longest river in Africa and has historically been considered the longest river in the world, north-flowing into the Mediterranean Sea in north-eastern Africa. A research gap is still represented by the analysis of how discourses on food security may have shaped water management, power relationships, and hydro-social dynamics.  

The present contribution will focus on three main countries (Egypt, Ethiopia, and Sudan), with a particular focus on some emblematic events that happened in the last years, mainly related to the development of the Grand Ethiopian Renaissance Dam, the Ukrainian War and its impact on food security, and the recognition of the impacts of Climate Change at the Global level.

Discourse analysis is developed on a database of official documents generated in recent United Nations General Assemblies and Security Councils, based on the framework developed by Bréthaut et al., 2021. Discourses are defined as formal ways of thinking that can be expressed through language. They represent a way of organizing knowledge that structures the constitution of societal relations through the collective understanding of discursive logic and the acceptance of the discourse as a fact. The analysis of discourses created by different actors involved in a hydropolitical dispute, and the power of such discourses in shaping concepts and practices related to water management, can highlight and identify how hydropolitics evolve, and when, why, and how we can expect opportunities for cooperation, or threats of conflicts over water resources.


Bréthaut, C., Ezbakhe, F., McCracken, M., Wolf, A., & Dalton, J. (2021). Exploring discursive hydropolitics: a conceptual framework and research agenda. International Journal of Water Resources Development.

How to cite: Castelli, G. and Bréthaut, C.: Understanding the impact of recent crises on the hydropolitics and food security of the Nile River Basin: a discourse analysis , EGU General Assembly 2023, Vienna, Austria, 23–28 Apr 2023, EGU23-1628, https://doi.org/10.5194/egusphere-egu23-1628, 2023.

EGU23-3748 | ECS | Posters on site | HS5.11

Evaluation of the Effect of Place Attachment and Perceptions of Living Environment on Disaster Preparedness: A Case Study in Nagano, Japan 

Koki Terakawa, Tsuyoshi Tsuyoshi Takano, Fuko Nakai, Kensuke Otsuyama, and Shinichiro Nakamura

Natural disaster preparedness has a significant impact on the magnitude of disasters and damages. Previous studies on disaster preparedness have focused mainly on promoting risk perception by providing disaster information, but this does not have a sufficient mitigating effect because people who are less concerned about disasters have less access to the information. Since disaster preparedness is considered to be defined not only by risk perception but also by the perception of the living environment, it is important to evaluate disaster preparedness mechanisms that take into account the perception of the living environment. On the other hand, Previous studies have pointed out that place attachment promotes preparedness for natural disasters. 

Therefore, this study investigated the effect of place attachment and the perception of living environment, which is also a factor in the formation of place attachment, on preparedness in Nagano City, Nagano Prefecture, Japan. A web-based survey asked about sociodemographic characteristics, perception of living environment, place attachment, and preparedness being implemented, and 1,000 people answered the survey.

The Structural Equation Modeling (SEM) performed on the results of the survey revealed that living environment prompts preparedness, and that the structure of preparedness varies with individual attributes. Furthermore, even if there is no direct relationship (path) from living environment to preparedness, it was found that there are factors that have an indirect effect through place attachment. On the other hand, there were also factors whose indirect effects turned negative when mediated by place attachment. Thus, the results indicate that some factors improve disaster preparedness through place attachment, while others decrease it.

These results suggest that for individuals with personal attributes for whom promoting risk perception alone does not lead to improved preparedness, perception of the living environment and place attachment could lead to improved preparedness. Since the target sites include flood-prone areas, it is possible that the social - environmental perceptions of the residents here might diverge from the general perceptions. Therefore, future case studies should be conducted in other areas to explore more general factors.

How to cite: Terakawa, K., Tsuyoshi Takano, T., Nakai, F., Otsuyama, K., and Nakamura, S.: Evaluation of the Effect of Place Attachment and Perceptions of Living Environment on Disaster Preparedness: A Case Study in Nagano, Japan, EGU General Assembly 2023, Vienna, Austria, 23–28 Apr 2023, EGU23-3748, https://doi.org/10.5194/egusphere-egu23-3748, 2023.

Flood maps are important for the floodplain communities to identify the inundation regions and to make future decisions related to their behavior. The understanding of the flood maps may vary based on several factors, including age, education, previous flood experiences, income level and the length of the residence. Based on the memory/understanding of the flood maps, the risk perception of the communities can change and it may affect the reaction against the impending disasters. The memory of the risk information provided by the flood maps decays over time and it is important to know about this decays process to initiate awareness programs at suitable intervals to increase the risk perception.

To understand the effect of flood maps on the floodplain communities, a study was conducted in the Lower Kelani River Basin (LKRB), Sri Lanka. LKRB is susceptible to frequent flood conditions. Under the changing climatic conditions, the frequency and intensity of floods may further increase in future. To realize the study objectives, maps with return periods of 10-yr, 50-yr and 100-yr were distributed to a selected sample from LKRB and their understanding was assessed based on 2 interview surveys. First survey was conducted in April 2022 after the distribution of flood maps and the second survey was conducted in October 2022 with the participation of the same set of respondents. A total of 124 responses were used for the analysis. The understanding of the flood maps was evaluated based on a defined criterion. Furthermore, the risk perception of the community was assessed during the Survey 1 and 2.

As per the results of the surveys, a significant decline of the memory of the flood maps was observed from Survey 1 to 2. The level of education showed a significant correlation with the memory of the flood map contents. Further, a clear improvement of the risk perception was identified during the Survey 2. The community actions and engagement following the map distribution was crucial to translate the risk perception to actual behavior.

How to cite: Perera, C. and Nakamura, S.: A survey of the effectiveness of flood maps on flood memory and risk perception: a case study from Kelani River Basin, Sri Lanka, EGU General Assembly 2023, Vienna, Austria, 23–28 Apr 2023, EGU23-4083, https://doi.org/10.5194/egusphere-egu23-4083, 2023.

EGU23-4470 | ECS | Posters on site | HS5.11

Linking water-society interactions in Chennai, India through the DPSIR framework 

Daniel Rosado, Valeria Fárez-Román, Felix Müller, Indumathi Nambi, and Nicola Fohrer

Cities in all continents are suffering from water scarcity. Projected rapid population growth and urbanization together with climate change will put even more pressure on urban water resources and, therefore, the number of large cities and global urban population facing water scarcity will significantly increase by 2050. Forecasts look particularly worrying in India, where the urban population facing water scarcity is expected to be the highest in the world by 2050. Chennai, India´s fourth-largest urban agglomeration, had in 2019 its worst water crisis in 30 years, after its four major reservoirs dried up and the city was relying solely on water tankers.

Although addressing water management in cities with complex scenarios requires applying an integrated urban water management approach, there is no internationally standardized indicator framework for it. Therefore, this study aims at applying the Drivers-Pressures-States-Impacts-Responses (DPSIR) framework, a causal framework adopted by the European Environment Agency for describing the interactions between society and the environment, on Chennai’s water resources to help stakeholders implementing sustainable management strategies.

Scientific literature, public administration and interested parties were consulted. The main drivers identified were population growth and economic development which generate pressures on land use, water demand and waste generation. Due to these pressures, Chennai experiences rapid urbanization, water scarcity and pollution, and biodiversity loss. This has led to impacts such as the loss of aquatic ecosystems, low water table and quality, and reduction in biodiversity and human health. As a response, authorities and non-governmental organizations implemented measures to increase the availability of drinking water like dams, inter-basin transfers, desalination plants, groundwater pumping, and rainwater harvesting. Also, the conditions of aquatic ecosystems have been improved through urban planning, new sewage treatment plants, ecosystem restoration projects and the implementation of water regulations. However, Chennai is expected to keep facing difficulties to achieve a proper water management. A mix of measures such as more infrastructure for water harvesting, new sewage treatment plants, or a more efficient waste management system are recommended.

How to cite: Rosado, D., Fárez-Román, V., Müller, F., Nambi, I., and Fohrer, N.: Linking water-society interactions in Chennai, India through the DPSIR framework, EGU General Assembly 2023, Vienna, Austria, 23–28 Apr 2023, EGU23-4470, https://doi.org/10.5194/egusphere-egu23-4470, 2023.

EGU23-5255 | Posters on site | HS5.11

A model-based approach to assessing the balance between groundwater recharge and use in Kumamoto Area, southern Japan 

Masatoshi Kawasaki, Yasuhiro Tawara, Yo-ichi Fukuoka, and Jun Simada

For sustainable use of groundwater, it is important to know the water balance of groundwater as land and water use changes for working with stakeholder collectively.

In order to understand these issues, a distributed hydrological model that includes the key processes of the regional hydrological system is considered to be a powerful tool, as it enables us to understand the impact of human activities at any given site.

In the Kumamoto region, which is almost 100% dependent on groundwater for drinking water, there have been attempts to understand groundwater flow and water balance qualitatively and quantitatively (Ministry of Land, Infrastructure, Transport and Tourism (2011), Rahman et al. (2021)), and uncertainty quantification of model parameters (Kawasaki et al.(2022)).

These models are expected to be applied to understanding the impacts of changes in land and water use, but it is not easy to conduct an evaluation of impacts to derive practical actions, as it requires a large number of calculations with many possible combinations of scenarios, including the area to be changed and the degree of change.

Therefore, in this study, with the objective of understanding the impact of possible anthropogenic and environmental changes on the groundwater balance, the areas that are important for the assessment target were first identified by sensitivity analysis. Then, based on confirmation that no extreme phenomena occur in the identified important areas and in combination with each parameter, an evaluation of the impact was attempted by using what-if simulations, and the results of these simulations are reported.

How to cite: Kawasaki, M., Tawara, Y., Fukuoka, Y., and Simada, J.: A model-based approach to assessing the balance between groundwater recharge and use in Kumamoto Area, southern Japan, EGU General Assembly 2023, Vienna, Austria, 23–28 Apr 2023, EGU23-5255, https://doi.org/10.5194/egusphere-egu23-5255, 2023.

EGU23-9141 | Posters on site | HS5.11

Low flow sensitivity in central and southwestern Europe to water withdrawals under 2K global warming 

Peter Greve, Peter Burek, Luca Guillaumot, Erik van Meijgaard, Emma Elizabeth Aalbers, Mikhail Smilovic, Frederiek Sperna-Weiland, Taher Kahil, and Yoshihide Wada

A sufficient freshwater supply is vital for humans, ecosystems, and economies, but anticipated climate and socio-economic change are expected to substantially alter water availability. Across Europe, about 2/3 of the abstracted freshwater comes from rivers and streams. Various hydrological studies address the resulting need for projections on changes in river discharge. However, those assessments rarely account for the impact of various water withdrawal scenarios during low flow periods. We present here a novel, high-resolution hydrological modeling experiment using pseudo-global warming climate data to investigate the effects of changing water withdrawals under 2K global warming. We find substantial sensitivities in projected low flows to varying water withdrawal assumptions, especially across Western and Central Europe. Our results highlight the importance of accounting for future water withdrawals in low flow projections, showing that climate-focused impact assessments in near-natural catchments provide only one piece of the anticipated response and do not necessarily reflect changes in heavily managed river basins.

How to cite: Greve, P., Burek, P., Guillaumot, L., van Meijgaard, E., Aalbers, E. E., Smilovic, M., Sperna-Weiland, F., Kahil, T., and Wada, Y.: Low flow sensitivity in central and southwestern Europe to water withdrawals under 2K global warming, EGU General Assembly 2023, Vienna, Austria, 23–28 Apr 2023, EGU23-9141, https://doi.org/10.5194/egusphere-egu23-9141, 2023.

To promote sustainable water resource management through collaboration among multiple stakeholders including managers, water users, and residents, it is essential to understand place meanings that people attribute to the water environment. The water environment performs various functions, including flood control, water supply, habitat provision, recreation for people, and serving as an energy source, through the water cycle in the entire catchment. Therefore, it is important to understand which territories or ranges of the water environment within a catchment people find meaningful and to develop initiatives that correspond to these scales.

In recent years, studies have used the concept of “sense of place” and have organized spatial perception patterns of landscape values at spot units using questionnaire surveys. Additionally, there have been attempts to evaluate and interpret the characteristics of cultural ecosystem services from spatial and geographical perspectives. However, the patterns and characteristics of spatial cognition with territoriality have not been clarified.

To better understand the place meanings attributed to the water environment, here we study to clarify the characteristics of people’s spatial cognition with territoriality. Specifically, we conducted a questionnaire survey in Okazaki City, Aichi Prefecture, Japan, to visualize which areas of a tributary river basin people find meaningful. The survey was distributed to residents of various ages, positions, and places in Okazaki City. The municipal area generally coincides with the catchment area of the Otogawa River, a tributary of the Yahagigawa River. A total of 331 responses were received via web and mail.

The questionnaire included two questions about the image of the water environment, and respondents were asked to fill in their answers of any size on the city map. One question asked respondents to describe areas of the catchment as it relates to their own lives and livelihoods, and the other asked respondents to describe familiar places. Respondents were also asked to indicate their attributes, such as residential history, daily river use, occupational history related to rivers, and the functions of rivers that they consider important.

The results of the study showed typical patterns in the spatial perception of the water environment. There was a concentration of responses to certain river spaces corresponding to residential history in the perception of familiar places. On the other hand, for the perception of the range related to life and livelihood, even when respondents had similar residential histories, there were a variety of responses, including responses for several individual spots and a continuous range. It was suggested that these differences were influenced by the respondents’ daily contact with the river and the functions they desired from the river. In the presentation, we will discuss the factors contributing to the formation of each pattern, focusing on spatial and social characteristics such as geographic or historical conditions, and discuss the potential application of these findings to water resource management in the future.

How to cite: Itsumi, Y. and Chibana, T.: Place Meanings People Attribute to Water Environment of Catchment - Patterns of Spatial Perception with Territoriality, EGU General Assembly 2023, Vienna, Austria, 23–28 Apr 2023, EGU23-10641, https://doi.org/10.5194/egusphere-egu23-10641, 2023.

EGU23-13395 | ECS | Orals | HS5.11

An agent-based model of shared irrigation resources using the Theory of Planned Behaviour in arid and semi regions 

Imane El-Fartassi, Alice E. Milne, Rafiq El Alami, Helen Metcalfe, Vasthi Alonso-Chavez, Toby W. Waine, Joanna Zawadzka, Alhousseine Diarra, and Ron Corstanje

The expansion of irrigated agriculture and recurrent drought periods poses a serious threat to the renewability and sustainability of common water resources in arid and semi-arid regions. These shared resources can take the form of dam water which is shared between farmers according to a predefined schedule or groundwater which the farmers independently extract. The dam water is less expensive to use but this source can be limited in drought years risking crop productivity. Groundwater is a more reliable resource but is more expensive to extract and can cause soil salinity. Simulating agricultural management systems requires understanding and quantifying how biophysical and socio-economical constraints influence the decisions of farmers. Therefore, this research aimed to develop an agent-based modelling (ABM) approach to simulate farmer behaviour in irrigation management. The Theory of Planned Behaviour was used as a theoretical framework to simulate decision models that were integrated with a biophysical model describing the interaction of farmers with water resources and how limitations of water resources and salinity impact crop yield. Through modelling, we explore various strategies to improve sustainable water use. The methodology is applied to an irrigated perimeter of Al Haouz Basin, Morocco, as a case study, where there are different stakeholders and water user associations with conflicting objectives. The ABMs were parameterised using data collected by surveying 70 farmers. The findings indicate that the existing irrigation scheduling was usually satisfactory. However, with the exacerbation of drought periods, the use of dam water resources is unreliable. Farmers responded by seeking alternative water resources and changing their irrigation systems and cropping patterns which led to the potential of overexploitation of groundwater and increased accumulated salt content.

How to cite: El-Fartassi, I., Milne, A. E., El Alami, R., Metcalfe, H., Alonso-Chavez, V., Waine, T. W., Zawadzka, J., Diarra, A., and Corstanje, R.: An agent-based model of shared irrigation resources using the Theory of Planned Behaviour in arid and semi regions, EGU General Assembly 2023, Vienna, Austria, 23–28 Apr 2023, EGU23-13395, https://doi.org/10.5194/egusphere-egu23-13395, 2023.

EGU23-14241 | Orals | HS5.11

Linking social metabolism with socioecohydrology in the study of the sustainability of agricultural production in Spain: a methodological approach 

Sergio Salazar-Galán, Jaime Vila-Traver, Gloria Guzmán-Casado, María Jesús Beltrán, Juan Infante-Amate, Eduardo Aguilera, Roberto García-Ruiz, Félix Francés, and Manuel González de Molina

The agricultural sector is challenged to meet the global food needs of mankind and reduce its environmental impacts. It is well known that the industrialisation of agriculture has led to negative effects such as water pollution, increased erosion, loss of biodiversity, increased zoonotic diseases, high water consumption to the detriment of ecosystem needs and other users, and greenhouse gas emissions, among others.

However, the proposition and implementation of adequate solutions for these environmental issues are still limited by the epistemological challenge posed by the complexity of socio-ecological processes associated with food production at different spatial and temporal scales. To that respect, different approaches have emerged such as social metabolism, the water-energy-food nexus, coupled social-natural or socio-environmental systems analysis, socio-ecohydrology, hydro-social and socio-hydrological approaches, life cycle assessment, ecological footprint (water footprint and virtual water), energy and matter flow analysis, extended environmental input-output analysis, among others. However, in our opinion, such approaches usually do not address the complex relations between agricultural production and the water cycle, nor the effects of the socio-economic and political context on the biogeochemical cycles, although they are fundamental in the processes occurring in agroecosystems, and their environmental impacts. The present methodological proposal makes a novel integration of approaches from the social sciences (social metabolism) with those from the earth sciences (socioecohydrology) to incorporate such cycles in the analysis of historical metabolic patterns and possible future trajectories of agroecosystems.

We start with the Agrarian Metabolism approach developed and tested for the metabolic analysis of agriculture in Spain in contemporary history. This methodological core is enriched, including estimations of blue, green, grey and virtual water, estimated through hydrological spatiotemporal-explicit modelling. From this integration, progress is made in the tailoring of new metabolic indicators that account for the thermodynamic cost of landscape alteration over time, as well as the energy efficiency of agroecosystems.

Southern Spanish (Andalusian) is an important agrarian region, accounting for ~17% of the cultivated area of Spain, presenting different types of agriculture, such as olive orchards (main Spanish producer), greenhouse vegetables, paddy rice, and berries, and also exemplifying diverse water-related environmental problems´ associated to the agricultural production. Thus, the industrialization process of Andalusian agriculture, in the period 1951-2018, is taken as a case study. For the analysis of possible future trajectories, climate change scenarios modelled for the Spanish territory as well as different agroecological management scenarios will be analysed. Hence, this proposal is useful for understanding the effects of agriculture in contemporary history, particularly in its industrialisation phase and, also, the expected results will serve as a scientific basis for decision-making on future actions in the territory and as a tool for analysing different types of scenarios and their comparison with patterns already observed in the recent past.

How to cite: Salazar-Galán, S., Vila-Traver, J., Guzmán-Casado, G., Beltrán, M. J., Infante-Amate, J., Aguilera, E., García-Ruiz, R., Francés, F., and González de Molina, M.: Linking social metabolism with socioecohydrology in the study of the sustainability of agricultural production in Spain: a methodological approach, EGU General Assembly 2023, Vienna, Austria, 23–28 Apr 2023, EGU23-14241, https://doi.org/10.5194/egusphere-egu23-14241, 2023.

EGU23-14242 | ECS | Posters virtual | HS5.11

Sustaining the Pearl River: Problems, Chanllenges, and Opportunities 

haidong ou and xiankun yang

The Pearl River is a large water system, which is the second largest river (in terms of mean annual water discharge) in China. The Pearl River Basin consists of three major rivers, the Xijiang River, the Beijiang Riverand the Dongjiang River. It nourishes nearly 200 million people, and the Pearl River Delta is the one of earliest regions benefited from China's “open door and reform” policy and the “Belt and Road Initiative”. Nine cities in the Pearl River Delta contribute to approximately 10% of China's GDP in 2021. Over the past decades, many studies have been performed on the Pearl River Basin. In this study, regarding the integrated study results in the Pearl River Basin on climate change, land use change, river channel change and human activities, we investigated the changes, challenges and impact factors of the eco-environment in the Pearl River Basin. The results indicated that the annual average temperature of the Pearl River basin has increased, especially in the Pearl River Delta region in light of the rapid urban expansion. The precipitation has decreased in summer and autumn, corresponding to an increasing trend in winter and spring, and thus drought is mainly observed in summer; The land cover of the basin has also changed dramatically, the cultivated land and forest land have decreased, while there was a significant increasing in the built-up land. In the middle and upper reaches, vegetation have been recovered benefiting from some regulation measures, including grain for green, reforestation and the control of expansion of rocky desertification. On the other hand, in the lower reaches (Pearl River Delta), many forest land has been occupied by human activities, such as urbanization and industrialization. The construction of dams and reservoirs on the main streams of the basin has led to a reduce in suspended sediment load to the estuary. However, the riverbed of the main stream has become lower because of the sand mining, leading to reduced coastal resources have and the salinity in the estuary. Based on the current situation of the Pearl River basin, we propose some suggestions for policy overhaul for basin management and response to future changes. The government should determine the proprieties for the ecological environment recovery based on the current status and major issues in the ecological environment in the Pearl River Basin, on the basis of the characteristics of the river basin and local real conditions. At the same time, the government should also enhance the collaboration among different local governments, and establish cross-basin, cross-regional, and cross-industry ecological and environmental protection policies; differences in precipitation and temperature in different regions have intensified, and the extreme drought in the west and southwest and the flood disasters in the Pearl River Delta are particularly typical. Technical measures should be combined to establish a drought monitoring and evaluation system and an early warning strategy for flood control to cope with future environmental changes and sustainable development.

How to cite: ou, H. and yang, X.: Sustaining the Pearl River: Problems, Chanllenges, and Opportunities, EGU General Assembly 2023, Vienna, Austria, 23–28 Apr 2023, EGU23-14242, https://doi.org/10.5194/egusphere-egu23-14242, 2023.

EGU23-14555 | Orals | HS5.11

Assessing urban water insecurity under access inequality - coupled human-natural systems analyses in the Upper Bhima Basin, India 

Christian Klassert, Ankun Wang, Anjuli Jain Figueroa, Yuanzao Zhu, Raphael Karutz, Heinrich Zozmann, Bernd Klauer, Erik Gawel, and Steven Gorelick

Adapting to growing urban water scarcity requires accurate assessments of present and future water security challenges. An estimated 1 billion people live in cities with intermittent public water supply, often resulting in highly unequal access to water. Under these conditions, households with below-average water access are most exposed to water insecurity. As a result, the full extent of water insecurity could substantially exceed the impacts identified by aggregate water security metrics. Here, we extend an existing coupled human and natural system model of the entire water sector in the Indian Upper Bhima basin, in order to analyze the degree to which water access inequality exacerbates urban water insecurity. The model integrates hydrologic modeling with urban water allocation institutions and water user agents, using data from a quantitative survey of almost 2,000 households in and around Pune, remote sensing data, as well as village-level census and water supply data. We use the model to assess water security impacts under historical and future droughts and various levels of supply augmentation. We find that a large share of households falls below critical water security thresholds before impacts are detected by aggregate metrics. While an unequal water distribution prevails, supply augmentation projects require several times the scale to meet given per capita water supply targets across the population than they would under a more equitable distribution. The findings demonstrate the extent to which current assessments of future urban water insecurity can underestimate the challenges ahead.

How to cite: Klassert, C., Wang, A., Jain Figueroa, A., Zhu, Y., Karutz, R., Zozmann, H., Klauer, B., Gawel, E., and Gorelick, S.: Assessing urban water insecurity under access inequality - coupled human-natural systems analyses in the Upper Bhima Basin, India, EGU General Assembly 2023, Vienna, Austria, 23–28 Apr 2023, EGU23-14555, https://doi.org/10.5194/egusphere-egu23-14555, 2023.

EGU23-14834 | ECS | Orals | HS5.11

Understanding the hydrology of armed conflicts in the Lake Chad Basin 

Nikolas Galli, Jampel Dell'Angelo, Ilenia Epifani, Davide Danilo Chiarelli, and Maria Cristina Rulli

Both natural and social science have been debating the existence, nature, and relevance of the interconnections between water and conflict. The intrinsic complexity of these interconnections makes representing them in a quantitative way a challenging task. Yet, there are actors in intra-state conflicts allegedly taking advantage of environmental stress, often in contexts where resources such as water and land have a primal role in the local population’s livelihoods. In this regard, the environmental aspects of conflicts become of special interest. We investigate these aspects and interconnections for conflict events occurring in the Lake Chad Basin from 2000 to 2015. We use custom-made spatially distributed hydrological simulations to construct and quantify water availability indicators explicitly accounting for human dimensions of water demand and water utilization, focusing in particular on agriculture as a key sustenance mean. Then, spatial econometric regression models are employed to test conflict occurrence against a set of covariates including water scarcity, but also other biophysical and social stress variables, and accounting for space- and time-specific conflict mechanisms through ad-hoc modeling structures. As a complement to this analysis, we develop a methodology to spatially cluster conflicts in association to water scarcity and so identify specific patterns of water availability recurring in specific conflict dynamics. While from the spatial econometric analysis we find that, in line with previous literature, the self-feeding mechanisms of conflict play a stronger role as conflict drivers than water scarcity, from the clustering analysis emerge complex, context-specific interconnections between water availability, water scarcity and conflict, with particular water utilization processes and specific conflictual mechanisms as intermediary processes. More in general, advanced hydrological simulations and statistical analyses are combined with a critical approach to how socio-hydrological processes are described, making quantitative results able to support qualitative insights. This approach can contribute to close the gap between biophysical environmental stress modeling and qualitative social stress representations, so to build more comprehensive knowledge frameworks for complex socio-environmental issues.

How to cite: Galli, N., Dell'Angelo, J., Epifani, I., Chiarelli, D. D., and Rulli, M. C.: Understanding the hydrology of armed conflicts in the Lake Chad Basin, EGU General Assembly 2023, Vienna, Austria, 23–28 Apr 2023, EGU23-14834, https://doi.org/10.5194/egusphere-egu23-14834, 2023.

EGU23-15847 | Orals | HS5.11

Levee system transformation and its impacts on the human-water system in the Kiso River Basin, Japan 

Shinichiro Nakamura, Fuko Nakai, and Taikan Oki

Societies decide whether to try to protect themselves against floods (fight) or live with floods (adapt). Levees and levee systems are important factors in determining whether a society fights or adapts; however, these factors have been considered as fixed boundaries in previous studies. We analyse a levee system transformation process covering the past century, from the indigenous ring levee system to modern continuous levees, and the impacts of this changes on human-water dynamics in the Kiso River basin, Japan. In this study, historical maps were digitized to detect and analyze changes in the shape of the levee system over the past century in order to spatially and quantitatively analyze the characteristics of the historical landscape. In addition, we performed a quadratic trend and narrative analysis of several socio-hydrological variables.

The results reveal an interactive relationship between technologies and the human-flood system; the transformation of the levee system affects local communities and local culture, while social changes affect the local water management framework, including the levee system. With these interactions, Japanese society has shifted from adapting to and living with floods to fighting against them, thus characterizing the levee system transformation process. The relationship between a levee system transformation and the human-flood system can be represented as a causal loop diagram. First, the levee system transformation in the Kiso River basin shows that there is a trade-off between modern continuous levees and indigenous ring levees. The construction of continuous levees began with the opening of Japan and the westernization of society, and their development was accelerated by social and hydrological drivers/trends such as flooding, war-induced food shortages, industrialization, economic growth, and population growth/urbanization. The increased extension of continuous levees reduced the flooding frequency and reduces people’s memories of flooding . These changes led to an increased population within the floodplain, a decreased mitigation capacity for floods (decrease in the number of flood fighters), and decreased needs for ring levees. On the other hand, the 1976 flood ended this downwards trend in the extension of ring levees, and this reminder of floods potentially triggered a reevaluation of traditional technologies. In general, reevaluations of the versatility and flexibility of traditional or indigenous technologies have often emerged in the face of various water-related crises

This study provides a case of a paradigm shift in society from "adapting to" to "fighting" floods. In the process, these two different societal modes coexisted in one region, though the dominant society transitioned over time alongside technological transformations. These changes dramatically transformed underdeveloped societies, resulting in rapid economic growth while simultaneously causing extreme changes in the original dynamics of human-water interactions, thus generating different challenges. This study strongly suggests the need for water scientists to interdisciplinary observe the historical coevolution between human and water systems to accurately understand related dynamics and processes.

How to cite: Nakamura, S., Nakai, F., and Oki, T.: Levee system transformation and its impacts on the human-water system in the Kiso River Basin, Japan, EGU General Assembly 2023, Vienna, Austria, 23–28 Apr 2023, EGU23-15847, https://doi.org/10.5194/egusphere-egu23-15847, 2023.

EGU23-16115 | ECS | Posters on site | HS5.11 | Highlight

Development of a Governance Resilience Index (GRI) for measuring climate adaptation governance 

Sahana Venkataswamy, Peniel Adounkpe, and Giriraj Amarnath

Climate change is affecting the frequency and intensity of rainfall extreme events worldwide. Despite the growing global awareness, assessing and enhancing adaptive capacity has proven to be a major challenge. To assess the lack of coping capacity measures that a country cannot cope with water-related disasters through the government's effort and existing infrastructure with the impact of the hazard, exposure, and vulnerability for Kenya and Zambia. We combined two global sources, namely Index for Risk Management (INFORM) and the Emergency Events Database (EM-DAT), to assess the existing infrastructure, and governance with climate risk indicators. The study analyzes the linkages of governance indicators to evaluate the performance of resilience using these datasets for the period 2014-2022 for climate adaptation governance. A global cluster analysis using historical governance, hazard, and resilience information was performed to obtain three clusters. Countries such as Zambia and Kenya with similar emergent characteristics are grouped under single cluster. Further, countries such as Guatemala, Morocco, South Africa, Senegal are under developing economy cluster and Germany, Japan and United Kingdom are under the developed economy cluster. With the governance and natural disaster information as the driving variable and resilience as the dependent variable, five regression models-  Bayesian, ridge regression, decision tree, k-nearest neighbors, and support vector machine are built. The best ML model - Bayesian ridge regression is used to model the resilience indicators- Communication, Access to health care and Physical infrastructure with the governance and natural disaster information  For Zambia, climate resilience prediction up to 2035, under the Business-as-usual scenario, with governance worsening by 20%, it is observed that the communication and physical infrastructure are least affected, with the access to health care worsening by 10%. On the other hand, for Kenya, governance improved by 10% and all resilience related indicators have remained unchanged. For the emerging economies, the governance is significantly related to the health care indicator compared to the physical infrastructure and communication indicators. However, for the developing and developed economy, the governance is related to other resilience factors. Also, we should emphasize that these are preliminary findings, and the cause-and-effect relationships are yet to be further examined by detailed studies. In conclusion, we identified the lack of coping capacity and vulnerability are two important aspects relates to the ability of a country to cope with current and future disasters that the country’s government, as well as the building of resilient infrastructure, capacity and awareness raising among policymakers contributes to the reduction of disaster risk.

How to cite: Venkataswamy, S., Adounkpe, P., and Amarnath, G.: Development of a Governance Resilience Index (GRI) for measuring climate adaptation governance, EGU General Assembly 2023, Vienna, Austria, 23–28 Apr 2023, EGU23-16115, https://doi.org/10.5194/egusphere-egu23-16115, 2023.

EGU23-16122 | ECS | Posters on site | HS5.11

Making water models more inclusive and interdisciplinary to underpin sustainable development 

Syed M. T. Mustafa, Pertti Ala-Aho, Hannu Marttila, Marijke Huysmans, Jean-Christophe Comte, Mohammad Shamsudduha, Gert Ghysels, Oliver S. Schilling, Richard Hoffmann, Pekka M. Rossi, Tamara Avellan, Ali Torabi Haghighi, Luk Peeters, Manuel Pulido-Velazquez, Marie Larocque, Anne Van Loon, Ty Paul Andrew Ferré, Philip Brunner, Harrie-Jan Hendricks-Franssen, and Björn Klöve and the Syed M T Mustafa

Reliable predictions of water systems’ response to external pressures and ongoing changes are highly important to ensure informed decision-making to support sustainable water resources management for human use and the functioning of healthy ecosystems. Recent strong development of numerical models offers a potential to understand and forecast water systems under anthropogenic and climatic influences to provide information for decision-making, process understanding of the ‘unseen’ part of the water cycle and hazard risk analysis. However, the reliability of numerical model predictions is strongly influenced by various sources of uncertainties, data qualities and assumptions, and often lacks stakeholders' point-of-view. A new, improved approach is needed and in this paper, we present six basic principles to improve the reliability and accuracy of numerical water model predictions considering explicitly stakeholders' needs and, thereby, better serving the society. Six highlighted principles are: (i) clearly defining the objectives and the purpose of the model, sustaining them during the entire modelling process; (ii) incorporating expert and local community knowledge through stakeholders' feedback; (iii) implementing a multi-model approach in which a range of conceptualizations are explored ; (iv) considering and representing the uncertainties arising from model inputs, parameters, conceptual model structure and measurement/information error; (v) translating the results to concrete and understandable strategies that policymakers can use for their informed decision-making; and (vi) long term capacity building and monitoring data collection to reduce knowledge gaps, test and improve predictions. We argue that implementing these six principles reduces uncertainties, improves the predictive capacity of the numerical water models, and ensures informed decision-making to support sustainable water resources management and thereby serve society better.

How to cite: Mustafa, S. M. T., Ala-Aho, P., Marttila, H., Huysmans, M., Comte, J.-C., Shamsudduha, M., Ghysels, G., Schilling, O. S., Hoffmann, R., Rossi, P. M., Avellan, T., Haghighi, A. T., Peeters, L., Pulido-Velazquez, M., Larocque, M., Loon, A. V., Ferré, T. P. A., Brunner, P., Hendricks-Franssen, H.-J., and Klöve, B. and the Syed M T Mustafa: Making water models more inclusive and interdisciplinary to underpin sustainable development, EGU General Assembly 2023, Vienna, Austria, 23–28 Apr 2023, EGU23-16122, https://doi.org/10.5194/egusphere-egu23-16122, 2023.

EGU23-16470 | ECS | Orals | HS5.11

Understanding behavioral and socio-economic determinants of farmer adoption of efficient irrigation technologies 

Soham Adla, Anja Šaponjić, Ashray Tyagi, Prashant Rajankar, Mohammad Faiz Alam, Dani Daniel, Prashant Pastore, Anukool Nagi, Mario Alberto Ponce Pacheco, and Saket Pande

Smallholder farmers are critical to global food production and natural resource management. Due to increased competition for water resources and/or variability in rainfall due to climate change, chronic irrigation water scarcity is rising particularly in drought prone regions like Vidarbha, Maharashtra (India). Improving irrigation water efficiency is key to sustainable agricultural intensification. Research has recognized that the motivations of farmers to adopt such strategies can go beyond the standard assumptions of utility maximization towards social and cognitive parameters. Understanding such determinants in the local context can provide insight for the design of local advisory services to steer farmer behavior towards water efficient practices. This study analyzes these factors in the Vidarbha through a behavioral lens using econometric methods and a social survey conducted with 419 farmers. The results from the survey contribute to the understanding the factors behind adoption of efficient technologies and their underlying dynamics, which can drive the development of agricultural extension and policy for sustainable agricultural intensification.

How to cite: Adla, S., Šaponjić, A., Tyagi, A., Rajankar, P., Alam, M. F., Daniel, D., Pastore, P., Nagi, A., Alberto Ponce Pacheco, M., and Pande, S.: Understanding behavioral and socio-economic determinants of farmer adoption of efficient irrigation technologies, EGU General Assembly 2023, Vienna, Austria, 23–28 Apr 2023, EGU23-16470, https://doi.org/10.5194/egusphere-egu23-16470, 2023.

EGU23-1399 | Orals | HS5.12

First practical applications of low-data, low-assumptions background leakage determination using mCFPD 

Peter van Thienen, Lydia Tsiami, and Peter Schaap

A new approach to rank a group of District Metered Areas (DMAs) in terms of background and unreported leakage rate and to quantify background/unreported leakage levels for individual DMAs in this group has recently been proposed (Van Thienen, 2022). It is based on an assumption of similarity in demand behavior between different DMAs, and requires no other data than net inflow timeseries for the DMAs or supply areas under consideration, and no assumptions other than that of similarity of demand. As such, it provides a low-data-requirements method for the evaluation of background and unreported leakage that does not share underlying assumptions with the commonly used Minimum Night Flow method and may potentially present a supplement or alternative to it.

In this contribution, we present and explain the method, and discuss its application to datasets from Dutch drinking water utilities. We present and discuss the lower and upper bounds for background leakage and the ranking obtained for the study areas and their interpretation. Finally, we present an outlook for application and further development.


Van Thienen, P. (2022) Direct assessment of background leakage levels for individual district metered areas (DMAs) using correspondence of demand characteristics between DMAs. Water Supply 22 (7): 6370–6388. doi: https://doi.org/10.2166/ws.2022.251

How to cite: van Thienen, P., Tsiami, L., and Schaap, P.: First practical applications of low-data, low-assumptions background leakage determination using mCFPD, EGU General Assembly 2023, Vienna, Austria, 23–28 Apr 2023, EGU23-1399, https://doi.org/10.5194/egusphere-egu23-1399, 2023.

EGU23-1971 | ECS | Posters on site | HS5.12

Inverse transient analysis for detecting multiple branched pipeline segments in a reservoir pipeline valve system 

Dongwon Ko, Jeongseop Lee, Sanghyun Kim, Suwan Park, Jungwon Yu, Kwang-Ju Kim, and In-Su Jang

The managment of water distribution systems is important not only for reliable water conveyance considering water quality but also for effcient asset management of pipeline infrastructure. Abnormality detection is a critical issuefor pipeline management authorities. Unknown side branches and dead ends are detrimental to efficient pipeline operation. Hence, this sudy explores a general method for detecting multiple side branches in a pipeline system. The method of caracteristics was used to simulate the transient responses of a specific branch with or without branched elements. The isolated pressure response of each branch and the interference caused by different elements of the pipeline was subsequently identified. A nonlinear valve action maneuver was considered for water hammer generation using a polynominal equation during mathmatical modeling. Experimental pressure decay patterns for various pipeline structure combinations showed differences between the numerical model and real-life system, which were explained by unsteady friction. The detection and location of side branches was achieved by considering the phase pressure bounce for which the numerical and experiment results were consistent.

How to cite: Ko, D., Lee, J., Kim, S., Park, S., Yu, J., Kim, K.-J., and Jang, I.-S.: Inverse transient analysis for detecting multiple branched pipeline segments in a reservoir pipeline valve system, EGU General Assembly 2023, Vienna, Austria, 23–28 Apr 2023, EGU23-1971, https://doi.org/10.5194/egusphere-egu23-1971, 2023.

EGU23-1990 | Orals | HS5.12

An innovate testbed for smart water infrastructure: the smart water campus 

Martin Oberascher, Carolina Kinzel, Ulrich Kastlunger, Martin Schöpf, Karl Grimm, Daniel Plaiasu, Wolfgang Rauch, and Robert Sitzenfrei

Up to now, information and communication technology is mainly utilised at main points of urban drainage and water distribution network, while the actual system behaviour in the majority of the networks remains unknown. In this regard, the Internet of Things concept can increase the data availability significantly, as the combination of low-cost sensors and innovative wireless data communication technologies enables large-scale installations of measurement equipment even in underground and remote locations. Following, new approaches in management of urban water infrastructure (UWI) are emerging including decentralised and smart approaches (e.g., smart rainwater harvesting). However, these approaches are relatively new and unknown, therefore it is difficult for decision-makers to justify investments.

In this work, the smart water campus of the university of Innsbruck is presented as an innovate testbed for smart and data-driven applications. The campus  is equipped with a large number of measurement devices and parameters are measured in high resolution (1 to 15 min) using different communication technologies for data transmission. Thereby, the quality of service strongly depends on the used communication technology and the installation places. Additionally, low power wide area networks like LoRaWAN operate in the public frequency ranges and data gaps have to be expected. The measured data (all except data from the water distribution network) are freely available under https://umwelttechnik-swc.uibk.ac.at.

The high-resolution data allows for evaluation of system conditions in real- time, enabling new possibilities in operations (e.g., smart rainwater harvesting for cross-system improvements) and fault detection (e.g., leakage and stagnation). Additionally, a special focus of the smart water campus project is on informing the population about the elements of the UWI (e.g., information panel, scavenger hunts to particularly address children) to make the hidden UWI more visible.

As experiences show, smart applications can improve the system performance, but also increase the requirements on the project team for a successful implementation: (1) detailed knowledge about communication technologies (and their limitations), (2) sufficient IT-knowledge for the implementation of the data flow and management, and (3) social sciences for the integration of different participants. Additionally, it requires effective measures to achieve economic (due to investment costs) and ecological (due to battery powered devices) sustainability.

The smart campus shows that it requires a coordination of appropriate communication technologies for each specific application but that smart applications can improve the performance of the integrated urban water infrastructure.

Oberascher, M., Kinzel, C., Kastlunger, U., Schöpf, M., Grimm, K., Plaiasu, D., Rauch, W., Sitzenfrei, R., 2022. Smart water campus – a testbed for smart water applications. Water Sci Technol. 86(11), 2834-2847. https://doi.org/10.2166/wst.2022.369.

How to cite: Oberascher, M., Kinzel, C., Kastlunger, U., Schöpf, M., Grimm, K., Plaiasu, D., Rauch, W., and Sitzenfrei, R.: An innovate testbed for smart water infrastructure: the smart water campus, EGU General Assembly 2023, Vienna, Austria, 23–28 Apr 2023, EGU23-1990, https://doi.org/10.5194/egusphere-egu23-1990, 2023.

EGU23-3890 | Posters on site | HS5.12

Water Distribution Network performance and device placement location schemes assessment under multiple hydraulic transient generative scenarios 

Panagiotis Dimas, Dionysios Nikolopoulos, Nikos Pelekanos, Dimitrios Bouziotas, and Christos Makropoulos

Water Distribution Networks (WDNs) have been thoroughly investigated in terms of uncertainty in the demand at the household level. Meanwhile, novel frameworks exploring the resilience of such systems under contemporary threats (such as cyber-physical attacks) have also significantly contributed to the enhanced security, reliability, and efficiency in the process of their design and operation. On the contrary, other network effects such as hydraulic transients -also known as pressure surges or water hammers- are often overlooked, despite the significant disturbance they could induce to the steady-state flow conditions of the WDN due to the added pressure variability and the heavily increased internal pressure forces exerted on pipelines. Pressure forces and pressure variability are dependent on highly variable phenomena, such as pipe failures and/or operational decisions (i.e., valve closing schedules, pump operations).  Evidently, predicting the behavior of transients under an ensemble of scenarios is of utmost importance, which is not limited only to the network design and operational scopes, but extends to applications such as optimal sensor and protection device placement, dimensioning or placement of pressure neutralizers (e.g., surge tanks/chambers), establishment of appropriate pump shutdown schedules. Avowedly, commercial software for transient simulation in WDNs is available, yet open-source packages suitable for research applications, such as TSNet, have only recently become publicly available and, hence, provide a flexible framework for coupling with other applications. In this work, the python packages WNTR and TSNet are integrated to present a framework for evaluating hydraulic transient conditions via EPANET simulation of multiple scenarios of pipe bursts and valve closures according to control schemes. The results can be utilized to assess the WDN’s performance and monitoring sensors placement location schemes in the light of protection under transient flow occurrence.

How to cite: Dimas, P., Nikolopoulos, D., Pelekanos, N., Bouziotas, D., and Makropoulos, C.: Water Distribution Network performance and device placement location schemes assessment under multiple hydraulic transient generative scenarios, EGU General Assembly 2023, Vienna, Austria, 23–28 Apr 2023, EGU23-3890, https://doi.org/10.5194/egusphere-egu23-3890, 2023.

EGU23-5589 | ECS | Posters on site | HS5.12

Optimizing a water distribution network design on water age. Comparison between implicit and explicit approaches 

Djordje Mitrovic, Karel van Laarhoven, and Bram Hillebrand

A common practice in Dutch and Flemish water utilities is to make masterplans for their network revisions and revise them on a regular basis, approximately every five years. The masterplans represent the ideal redesigns of their networks in terms of company specific objectives and constraints related to existing network infrastructure. The masterplans are used as a guideline when rehabilitating the networks. Among others, one of the objectives is to minimize the residence time, i.e., water age. However, the recurring assessment of water age with traditional methods, within an optimization procedure could take years for convergence for a large network of several thousand nodes. Consequently, the modellers often try to improve the residence time implicitly by minimizing network’s volume via layout optimization and diameter minimization, thus leading to increased velocities in pipes. Recently a graph theory model for estimating water age with satisfying accuracy has been proposed in the literature. The proposed model is estimated to be more than a hundred thousand times faster than the assessment of water age using Epanet, thus enabling the assessment of water age within optimization procedures. This research proposes a novel optimization methodology for simultaneous layout and pipe sizing optimization, employing the proposed graph-based model to explicitly assess the water age objective. To secure the reliability of the optimal solutions the methodology introduces a penalty to limit the size of the branched sections by setting a maximum to the number of customers connected to branched sections. The proposed methodology is applied to a real-world Dutch network. The aim of the research is to compare the optimal designs obtained using implicit (minimizing network’s volume) and new explicit (minimizing maximum water age) approaches.

How to cite: Mitrovic, D., van Laarhoven, K., and Hillebrand, B.: Optimizing a water distribution network design on water age. Comparison between implicit and explicit approaches, EGU General Assembly 2023, Vienna, Austria, 23–28 Apr 2023, EGU23-5589, https://doi.org/10.5194/egusphere-egu23-5589, 2023.

EGU23-5672 | Orals | HS5.12

Scientific machine learning for speeding up distributed simulations – examples and failures for urban water systems 

Roland Löwe, Matthias Kjær Adamsen, Phillip Aarestrup, Franca Bauer, Allan Peter Engsig-Karup, Morten Grum, Frederik Tinus Jeppesen, and Peter Steen Mikkelsen

In this work we illustrate how scientific machine learning algorithms (SciML) can be used to facilitate the development of digital twins for urban drainage systems. Scientific machine learning integrates classical, modelling techniques from scientific computing that are based on first principles, with data-driven machine learning techniques. The main objective is to create models that are robust, fast to run and easier to integrate with data, while largely preserving the level of detail of the widely used hydrodynamic modelling approaches. This concerns both a detailed spatial representation of the drainage system in the models, and an accurate representation of the hydraulics.

We present an initial approach that employs generalized residue networks for the simulation of hydraulics in drainage systems. The main idea is to train neural networks that learn how hydraulic states (level, flow and surcharge volume) at all nodes and pipes in the drainage network evolve from one time step to another, given a set of boundary conditions (surface runoff). The neural networks are trained against simulation results from a hydrodynamic model for a short time series, and achieve Nash-Sutcliffe model efficiency coefficients (NSE) in the order of 0.9 on a test dataset.

The approach achieves simulation times that are in the order of 50 times faster than the corresponding hydrodynamic model. This enables an automated calibration of HiFi model parameters and real-time data assimilation routines, both of which are tuned manually in current practice. We will demonstrate how the runoff parameters in a distributed drainage model can be efficiently calibrated against water level observations, and how an Ensemble Kalman Filter setup can be tuned automatically.

While our SciML setup for simulating drainage networks enables a range of new applications, its disadvantage are the initial training times in the order of 30 to 60 minutes for a system with approximately 100 drainage pipes. Many studies have demonstrated that machine learning approaches can be used to generalize across catchments if they consider physical system properties as an input or as part of the model architecture, and if they are presented with training data from different systems. Graph approaches are an obvious choice for the simulation of drainage systems and can be incorporated in the residue network setup. However, their architecture requires careful design to achieve an accurate simulation of the hydraulics, which is the subject of on-going research.

How to cite: Löwe, R., Adamsen, M. K., Aarestrup, P., Bauer, F., Engsig-Karup, A. P., Grum, M., Jeppesen, F. T., and Mikkelsen, P. S.: Scientific machine learning for speeding up distributed simulations – examples and failures for urban water systems, EGU General Assembly 2023, Vienna, Austria, 23–28 Apr 2023, EGU23-5672, https://doi.org/10.5194/egusphere-egu23-5672, 2023.

As could be seen in recent years, ensuring the water supply-demand balance is a topic of increasing concern to supply companies facing the threat of increased demand scenarios resulting from long-term effects due to climate change. Especially demand peaks of multiple hours during the day or persisting demand peaks of several days caused by prolongued dry periods and more heat days throughout the summer force water suppliers to more efficiently control and manage their resources. Being able to take proactive and informed decisions through reliable short-term probabilistic forecasts is therefore crucial in this context.

This research proposes two probabilistic deep learning architectures based on long short-term memory (LSTM) networks to forecast hourly water demand up to 10 days in advance. Both models processes different temporal sequences of data, including past observations of water demand and regressors as well as future regressors with different time lengths. The models encode long-term historic information of the water demand and features, including historic meteorological information, and simultaneously incorporate short-term future information on calender- and weather features using statistically optimized point forecasts (DWD MOSMIX) of the latter. Through implementing the models in an autoregressive manner, the output is fed back into itself at each step and predictions are made conditioned on the previous one to account for correct path dependency between consecutive hours. This way the model produces multi-step-ahead forecasts of variable length by using future information together with the historic context.

In a case study of central Germany, the performance of the proposed deep learning models was compared to a Lasso estimated high-dimensional time series model and a conventional AR(p) model. Results indicate the potential of the proposed approach of using weather forecasts in short-term water demand prediction especially for lead times larger than 24 hours.

How to cite: Johnen, G., Kley-Holsteg, J., and Ziel, F.: Incorporating Weather Forecasts into Short-Term Water Demand Prediction using Probabilistic Deep Learning with Long Short-Term Memory Networks, EGU General Assembly 2023, Vienna, Austria, 23–28 Apr 2023, EGU23-5731, https://doi.org/10.5194/egusphere-egu23-5731, 2023.

EGU23-6650 | Posters on site | HS5.12

Exploring the performance of topological approach for sensor quality placement in water distribution network 

Giovanni Francesco Santonastaso, Armando Di Nardo, and Roberto Greco

Water distribution networks (WDNs) are an important critical infrastructure, but they are increasingly at risk from contamination (WHO, 2014). The causes can be several: chlorination equipment malfunctioning, low pressure, contaminant intrusion in water tank, accidental cross-connection between drinking-water and non-drinking-water, etc... To limit potential threat to public health, it is advisable to install a network of sensors that can monitor water quality in real time and provide information about potential contamination risks. With the proliferation of IoT technologies and low-cost sensors capable of monitoring water quality parameters, it is now possible to implement a real-time monitoring network by overcoming the difficulties associated with biochemical analyses of water samples in a laboratory. Despite the modern technologies, the placement of sensors in the water network is still an open task for researchers. The main sensor placement methodologies use optimization techniques to minimize or maximize either single- or multi-objective functions (Ostfeld et al., 2008), but they require a calibrated model of the network, which is not always available because the calibration process is expensive and time-consuming.

Recently, a novel approach (Santonastaso et al., 2021) based on the use of the topological centrality metric, which does not require hydraulic information and simulations, has been proposed, showing good effectiveness and easy applicability by water utilities to define locations for quality sensors, owing to its simplicity compared to optimization-based approaches.

In this work, different weights such as the length of pipes, the diameter and the water demand were used to improve the performance of the adopted topological approach, as well as to evaluate the impact of the weight, used to compute centrality metrics, in relation to the most used objective functions: number of people exposed to the contaminant; number of detected contamination events; length of contaminated pipes; amount of contaminant consumed by users; detection time of contamination.


References

World Health Organization. (‎2014)‎. Water safety in distribution systems. World Health Organization. https://apps.who.int/iris/handle/10665/204422

Ostfeld A, Uber JG, Salomons E, Berry JW, Hart WE, Phillips CA, Watson JP, Dorini G, Jonkergouw P, Kapelan Z, di Pierro F, Khu ST, Savic D, Eliades D, Polycarpou M, Ghimire SR, Barkdoll BD, Gueli R, Huang JJ, McBean EA, James W, Krause A, Leskovec J, Isovitsch S, Xu J, Guestrin C, VanBriesen J, Small M, Fischbeck P, Preis A, Propato M, Piller O, Trachtman GB, Wu ZY, Walski T (2008) The battle of the water sensor networks (BWSN): a design challenge for engineers and algorithms. J Water Resour Plan Manag 134:556–568. https://doi.org/10.1061/(ASCE)0733-9496(2008)134:6(556)

Santonastaso, G., Di Nardo, A., Creaco, E. et al. Comparison of topological, empirical and optimization-based approaches for locating quality detection points in water distribution networks. Environ Sci Pollut Res 28, 33844–33853 (2021). https://doi.org/10.1007/s11356-020-10519-3

How to cite: Santonastaso, G. F., Di Nardo, A., and Greco, R.: Exploring the performance of topological approach for sensor quality placement in water distribution network, EGU General Assembly 2023, Vienna, Austria, 23–28 Apr 2023, EGU23-6650, https://doi.org/10.5194/egusphere-egu23-6650, 2023.

EGU23-6670 | ECS | Posters on site | HS5.12

SAFE T WATER : an eco-sustainable technology to replace aluminum salts with natural coagulants. 

Miguel Año Soto, Pura Almenar, and Javier Macián

More than 243000 Hm3/year of drinking water is used in Europe. The popularity of metallic coagulants is due to their comparatively low cost, high availability, and efficiency in removing turbidity and color and sometimes helped by flocculants as polyacrylamides, starch or PolyDadmacs. Water & wastewater treatment drives the market to reach $14.7 Billion by 2024 in this kind of reagents. In this project, a synthetic coagulant will be replaced by a single improve multifunctional organic polymer based on natural plant extracts as a three-step treatment procedure, encompassing coagulation, flocculation and neutralization of pH.

The main drawback of synthetics coagulants is the negative impact on human health and the environment. There are corrosive reagents that contribute undesirable elements such as metals , chlorides or sulphates to drinking water. The sludge generated is known as “alum sludge”, which is the most common residual from water treatment plants. They can cause a deterioration of the pipeline network and produce a waste that finally end in soils or landfills. Moreover, the sludge contains a 7-17% of aluminum concentration, which is mainly used in the agriculture and can be adsorbed, finally, by plants.  Thus, there are two ways to reduce aluminum concentration, one is the efficiency of the coagulation process and reduction of complementary reagents and the other is the substitution of this reagents by a natural one.

Natural coagulants are an alternative of aluminum or iron salts and avoid dissolved aluminum control as required by Directive (UE) 2020/2184, as well as lower costs in complementary reagents. Complementary flocculants as polyacrylamides are limited by the World Health Organization to 0.5 μg/L and are considered harmful to human health. The sludge obtained with the natural coagulant provide organic matter and adsorbs phosphorus so can be used as an active substrate and once saturated, as an agricultural substrate, thus participating in the concept of circular economy.

The main objective of Safe T Water project is to validate a new innovative and environmentally friendly technology in two drinking water treatment plants (DWTP) located in Spain. The first one it is located in Valencia, with a daily production of 48,000 m3 and 750,000 inhabitants and the second one in Madrid, with a daily production of almost 700,000 m3 and supplying 3.2 million inhabitants representing a hard and soft water qualities.

There is a first stage of natural coagulant production in a batch, focused on the start-up and continuous production and manufacturing the product necessary to feed both pilot scale treatment plants. This batch has a production of 4000  Kg/month.

The natural coagulant is evaluated in a 6 m3/h pilot plant flow rate , consisting of a homogenization tank and a coagulation-flocculation and lamellar settling stage followed by a  sand filtration. A Full-scale implementation phase including the validation of the new technology through real drinking water facility is going to reproduce the outcomes.

The comparison between both coagulants must be made under the same conditions, establishing the effectiveness of the natural one as a real and sustainable alternative and this provides to Safe T Water Project a relevant role.

How to cite: Año Soto, M., Almenar, P., and Macián, J.: SAFE T WATER : an eco-sustainable technology to replace aluminum salts with natural coagulants., EGU General Assembly 2023, Vienna, Austria, 23–28 Apr 2023, EGU23-6670, https://doi.org/10.5194/egusphere-egu23-6670, 2023.

EGU23-7355 | ECS | Orals | HS5.12

From Correlation to Causation: Discovering the Drivers of Urban Water Demands in the Contiguous United States 

Wenjin Hao, Andrea Cominola, and Andrea Castelletti

Urban water demands vary across spatio-temporal scales, driven by multiple socio-demographic, climatic, and urban form factors. Identifying influential drivers, along with their individual and compound effects on urban water consumption, is essential to forecasting future water demand, addressing urban water security, and informing water governance. Model-free and model-based Input Variable Selection (IVS) has been extensively applied to investigate important predictors of urban water demands. However, most IVS methods identify correlations and mutual information between variables, which do not imply causation. More recently, causal discovery has developed as an active area of research in many research fields, including, e.g., neuroscience, finance, and climate science. Causal discovery improves IVS by identifying causally meaningful relationships between variables, distinguishing indirect from direct dependencies, and recognising relevant drivers among multiple variables.

In this work, we investigate predictive and causal factors of urban water use across the Contiguous United States (CONUS). We rely on open data of monthly municipal water consumption from 126 cities in the US for the period 2010-2017 and data on candidate socio-demographic, climatic, and built environment predictors from multiple sources, including the U.S. Census Bureau, the American Community Survey, and the PRISM climate data set. We first test the state-of-the-art W-QEISS wrapper method to identify equally-informative subsets of predictive factors for urban water demands. These subsets are the solutions of a four-objectives optimisation problem that maximises the predictive accuracy of a data-driven model and feature relevance while minimising the number of selected predictors and their redundancy. Results show that historical water consumption is the most relevant factor to predict future demands, followed by some socio-demographics, climatic factors, and building characteristics, including the median number of rooms in housing units, unemployment rate, Palmer Drought Severity Index (PDSI), and building construction years. Preliminary results for individual climate regions also highlight local effects, with PDSI becoming more relevant for arid regions than the continental-scale results. Second, we extend our analysis to causal discovery by applying a neural Granger model to interpret non-linear Granger causality and temporal structures within time series. Granger causality describes whether past values of a time series xt could predict future values of another series yt, assuming causal effects are ordered in time (i.e., cause before effect). This allows for finding the specific causes of urban water demands in our case (in a Granger’s sense). We finally compare the causality results with the results of IVS to illustrate the different interpretations of urban water demand drivers.  

How to cite: Hao, W., Cominola, A., and Castelletti, A.: From Correlation to Causation: Discovering the Drivers of Urban Water Demands in the Contiguous United States, EGU General Assembly 2023, Vienna, Austria, 23–28 Apr 2023, EGU23-7355, https://doi.org/10.5194/egusphere-egu23-7355, 2023.

Hong Kong is one of the fast-urbanized cities in the world with a population of more than 7.4 million, consuming about 21% more freshwater per capita than the global average. However, local yields only account for 30% of the city’s total water supply due to its mountainous terrain, making it hard to collect or store rainwater. Considering its high demand but low supply, this city adopted a dual water supply system to extend the use of seawater and lower-grade water for non-potable purposes; and has been actively pursuing water reclamation as a valuable alternative source which is more calculable in quantity. Decentralized water reuse (WR) emerges as a potential option that can enhance urban water security and sustainability by mitigating the reliance on freshwater imports and energy consumption for water transmission and distribution. Despite technological developments, the implementation and guidance for water reuse applications are still lacking. There are minimal spatial planning concepts or practices to drive water reuse deployments across different scales. To fill the gaps, we developed an integrated spatial water-energy modeling and multi-objective optimization framework to support the citywide implementation of WR facilities using Hong Kong as a testbed. The framework starts with calculating daily freshwater & seawater demands and wastewater production of each urban community based on water consumption surveys of residential, commercial, and industrial uses. Based on the estimation, we calculated the hydraulic flows and energy consumptions at different water transmission stages, from water sourcing, treatment, and distribution to wastewater collection, treatment, and discharge. The spatial water-energy accounting highlights regions with intensive water and wastewater services and serves as a benchmark for further optimizing WR deployments and their impacts. In the optimization phase, we used Genetic Algorithm to evaluate and optimize the implementation of WR facilities from the perspectives of minimizing the freshwater import, electricity use, and investment costs. Afterward, we simulated the water age of the freshwater supply network as an external constraint to eliminate infeasible solutions from the optimal ones (i.e., Pareto-fronts), including those of which the water age would either double or exceed 28 calendar days in over 5% of total urban communities. Our optimization results spatially identify the optimal location and treatment capacity for designing each WR facility and the service allocations between WR facilities and urban communities as investment increases. The reduction in freshwater & seawater withdrawal and electricity use was evaluated as the impacts/benefits on urban water systems. Overall, our framework can provide a systematic view of spatial electricity intensities for the urban water system and help cities adaptively integrate the water reuse concepts into urban water infrastructural planning to realize holistic-integrated water resource management in a more sustainable and cost-effective way. 

How to cite: Li, Y. and Lu, Z.: Multi-objective Spatial Optimization of Decentralized Water Reuse Implementation and Service Allocation in Hong Kong, EGU General Assembly 2023, Vienna, Austria, 23–28 Apr 2023, EGU23-7418, https://doi.org/10.5194/egusphere-egu23-7418, 2023.

The Building-Information Modelling (BIM) of hydraulic engineering structures introduces new opportunities for analysis. It is the digital core of the automation of design, construction, and operation processes in water management. Managing the communication of BIM with other hydraulic engineering specific platforms is a relevant current field of research.

Site characteristics, interconnected urban infrastructure and construction methods significantly influence the Infrastructure Engineering and Water Resource Management design process. Digitization and BIM development including its accompanying technologies create the needed prerequisites for hydraulic engineering facilities to be designed and constructed in parallel where any influences from the site influence the design process in real time .

The present study illustrates such a technology development implemented and tested on an example from the practice - a project for a river correction in a settlement. The approach takes advantage of the ability to automate the workflow and communication between Civil 3D and HEC-RAS using Dynamo for Civil 3D. The procedure makes it possible to generate data from design options to fill in a desired sets of parameters. Experiments are being made to create a Deep Learning model -replacement of HEC-RAS for the verification of necessary changes in BIM, as imposed by the general development of the project in the parts roads and sewage system in real time.

The application of Deep Learning techniques requires large volumes of data. The results show that BIM and its automation create prerequisites for using Deep Learning more often. Herein, the possibility of blunders is avoided as such a volume of data would be difficult to obtain manually.

How to cite: Mavrova-Guirguinova, M.: The Digital Era in Hydraulic Engineering Comes with Applications of Artificial Intelligence, EGU General Assembly 2023, Vienna, Austria, 23–28 Apr 2023, EGU23-8870, https://doi.org/10.5194/egusphere-egu23-8870, 2023.

EGU23-9159 | ECS | Posters virtual | HS5.12

The use of a low-cost monitoring dataset for sewer model autocalibration 

Paul Schütz, Oriol Gutierrez, Silvia Busquets, Michel Gunkel, and Nicolas Caradot

The management of urban wastewater systems and the associated modelling of these systems has become indispensable in today's world. In order for these models to represent reality as accurately as possible, a reliable calibration is essential. Water level data is used as a standard, but due to expensive sensors and harsh conditions in the sewer, data can only be collected at a few key points of the system. One novel solution, that has experienced an upswing in recent years, is collecting data using low-cost temperature sensors. Two sensors are needed; one is placed in the stream; the other is placed at the crest of the weir. In the case of dry weather, the sensor measures the air phase, whereas, in the case of Combined Sewer Overflow (CSO), the discharged storm and wastewater is measured. The start and end of a CSO event can be determined via the merging of measured temperature values in both points of the overflow structure. Due to this method, the duration of CSO events in a sewer system can be detected.

In this work, the potential benefits of this novel method for model calibration are assessed. Therefore, autocalibration runs with water level data and fictional temperature data were carried out via OSTRICH for a SWMM model located in Berlin. Furthermore, calibration runs with a different number of measuring sites were performed, to evaluate the amount of necessary measuring sites for a reliable calibration. In order to be able to compare the different approaches, a calibration period of 19 events was first required for the respective datatype. Next, a validation period which consisted of 18 events was carried out and evaluated by the R² of three water level measuring sites for both approaches to ensure comparability. It was revealed that the calibration with duration data based on temperature sensors was able to achieve results as good as the conventional approach using water level data. Due to low spatial distribution of the measuring sites in the model, it could not be finally answered if more measuring sites would yield to even better results. However, already with one measuring site, promising calibration outcomes could be achieved and thus, offers an alternative for water utilities and practitioners.

How to cite: Schütz, P., Gutierrez, O., Busquets, S., Gunkel, M., and Caradot, N.: The use of a low-cost monitoring dataset for sewer model autocalibration, EGU General Assembly 2023, Vienna, Austria, 23–28 Apr 2023, EGU23-9159, https://doi.org/10.5194/egusphere-egu23-9159, 2023.

EGU23-9311 | ECS | Orals | HS5.12

Numerical optimization of drinking water distribution network design: ideas and questions provided by practice 

Karel van Laarhoven, Bram Hillebrand, Djordje Mitrovic, and Ina Vertommen

In the past decades, the potential of numerical optimization for the automated design of drinking water distribution networks has been extensively studied. In particular, evolutionary algorithms have been shown to be a powerful and versatile tool for several design tasks. In the past few years in the Netherlands, drinking water utilities have started to embrace this approach more and more to explore new design philosophies as well as to address immediate asset management decision challenges. Key to meaningful application has been the possibility to iteratively and flexibly develop the optimization problem throughout the design process. The traditional 'benchmark problems' from academia provide a strong starting point for a design process, giving utility experts a taste of the possibilities. Subsequently, however, the problem definition has to be adapted and fine-tuned in order to keep up with the evolving perspective of the utility experts on the design problem. During this type of practical implementation, it frequently occurs that questions emerge which greatly increase the complexity of the optimization task without an approach being readily available from scientific literature, requiring workarounds to be created on the spot. Here, we present recent examples of such questions and their workarounds, which we ran into while tackling different practical design challanges, namely: how to incorporate topology optimization into regular pipe dimension optimization for a network in Belgium; how to incorporate topology and project cost optimization into sectorization of the network of The Hague; and how to incorporate optimal utilization of different water sources into regular pipe dimension optimization of the water distribution network of Amsterdam.

How to cite: van Laarhoven, K., Hillebrand, B., Mitrovic, D., and Vertommen, I.: Numerical optimization of drinking water distribution network design: ideas and questions provided by practice, EGU General Assembly 2023, Vienna, Austria, 23–28 Apr 2023, EGU23-9311, https://doi.org/10.5194/egusphere-egu23-9311, 2023.

EGU23-11190 | ECS | Posters on site | HS5.12

Burst detection in water distribution systems with LSTM 

Konstantinos Glynis, Zoran Kapelan, Martijn Bakker, and Riccardo Taormina

This study presents a data-driven method for detecting pipe bursts in water distribution systems using Long Short-Term Memory (LSTM) neural networks. These types of neural networks are able to process sequential data more effectively than traditional neural networks because they have feedback connections between neurons. The proposed method involves performing one-step ahead predictions about the flow and pressure at different sensor locations in the system, using past time series data along with additional time-related features as inputs. The difference between predictions and actual observations is used to classify bursts and trigger alarms by comparing the errors against a time-varied error threshold. The model is trained using data from burst-free periods in the system. The method was tested using simulated fire hydrant bursts as well as real-world bursts in 8 district metered areas (DMAs) located in the United Kingdom. By harnessing transfer learning, the model can incorporate additional data streams from new sensors, performing well even in data frugal conditions, achieving precision scores of up to 98.1% for the analyzed case studies

How to cite: Glynis, K., Kapelan, Z., Bakker, M., and Taormina, R.: Burst detection in water distribution systems with LSTM, EGU General Assembly 2023, Vienna, Austria, 23–28 Apr 2023, EGU23-11190, https://doi.org/10.5194/egusphere-egu23-11190, 2023.

Leakages in drinking water distribution systems (DWDSs) are caused by structural failures of piping infrastructure and result in unnecessary loss of water. Prompt and accurate leakage detection is paramount for water utilities as it is both of public interest to prevent ecologic hazards and property damage as well as company interest to minimize revenue losses, insurance claims, and customer dissatisfaction from interrupted water supply.

An essential prerequisite for leakage detection is data gathered from sensors installed throughout a DWDS. With a hypothetical full coverage of flow meters, the leakage detection problem becomes trivial because leakages can be identified by a mass-balance calculation within delimited district metered areas. However, this scenario is not financially and practically viable. In most other cases, leakage detection is enabled through data gathered by a limited number of pressure sensors distributed throughout the DWDS. These pressure data are utilized to identify pressure losses from leakages caused by higher wall friction due to the augmented flowrate. Most of the methods utilising pressure data rely on a well-calibrated hydraulic model of the DWDS and some form of calibrated water demand patterns to capture the difference between the legitimate water demand, due to water usage in normal conditions, and additional flows due to leakages. Water demand calibration, however, becomes especially challenging if irregular or non-periodic water demands that do not follow the usual diurnal patterns and, hence, cannot be extrapolated into the future, are present. This type of demand may describe, for instance, certain industrial water usages.

In an earlier work developed as part of the Battle of the Leakage Detection and Isolation Methods (BattLeDIM), an international competition on leakage detection and localization, we introduced LILA, a purely data-driven approach to leakage detection and localization based on pressure data, without the need for a calibrated hydraulic model or physical parameters or water demand. LILA employs a linear regression model of the pressure losses between different sensor locations to establish a baseline and raises an alarm if deviations from that baseline are detected. However, in the presence of irregular demands, if unknown, the establishment of a linear baseline is only possible to a very limited extent, resulting in high fault tolerances and extremely long detection times. On the other hand, we demonstrated that known irregular demands may be incorporated into the linear regression model as an additional regressor.

In this work, we present an approach to predict unknown industrial water demands in an implicit fashion employing a physics-informed neural network (PINN), thus, enhancing the detection capability of LILA. The PINN incorporates the physics of the DWDS in the form of a loss function that reflects a modification of the Bernoulli principle. The input to the model is the pressure data, while the output is directly fed to the linear leakage detection model, training the PINN in an implicit manner. Preliminary results show that the time to detection of an abrupt leak can be reduced by up to a factor of 20 using PINN in comparison to the original LILA.

How to cite: Daniel, I. and Cominola, A.: Physics-Informed Neural Networks to enhance leakage detection in drinking water distribution systems, EGU General Assembly 2023, Vienna, Austria, 23–28 Apr 2023, EGU23-12186, https://doi.org/10.5194/egusphere-egu23-12186, 2023.

EGU23-13730 | ECS | Posters on site | HS5.12

Identifying the Critical Pipe in Water Distribution Network: Sensitivity Matrix Approach 

Sohee Kim and Donghwi Jung

Water distribution network (WDN) is a civil infrastructure for reliable water supply. Among many components in WDN, the pipe delivers the required water demand to users. Pipe bursts, the rupture of pipe wall, cause water losses out of the network and low pressure at the customer’s tap, while its impact varies at different locations. It is important to identify such critical pipes (CPs) and to minimize the failure severity. However, previous CP identification methods are generally complicated and difficult to adopt in practice, highlighting the need for the development of a novel, but practical and simple method. To that end, this study proposes a CP selection approach based on a sensitivity matrix constructed with pipe burst simulation. A sensitivity matrix is constructed by simulating a single pipe failure condition (row) and computing the variation of resulting nodal pressures (column). Then, the summation of the column element’s absolute values is formulated as a new CP index. Finally, the pipe with the maximum CP index value is defined as the most critical pipe. Moreover, this sensitivity matrix can be visualized by the heatmap, which shows the relative influence by using a color density. CP index is presented as the darkest part in the heatmap. The proposed method is demonstrated in two benchmark networks of different layouts, Hanoi and Mays. Despite its simplicity, the proposed method could identify the source pipes which are generally considered to be critical in the engineering sense.

How to cite: Kim, S. and Jung, D.: Identifying the Critical Pipe in Water Distribution Network: Sensitivity Matrix Approach, EGU General Assembly 2023, Vienna, Austria, 23–28 Apr 2023, EGU23-13730, https://doi.org/10.5194/egusphere-egu23-13730, 2023.

EGU23-14124 | ECS | Posters on site | HS5.12

Predicting future water demand in Austria due to climate change and demographic development 

Anika Stelzl and Daniela Fuchs-Hanusch

Due to the climate change, it is expected that there will be longer dry and hot episodes in the future in Central Europe. As a result, temporary water shortages are to be expected in certain parts of Austria. Due to these changes, it is assumed that the future water demand will increase, caused by a change in consumption behavior and the increase of garden irrigations. Furthermore, an increasing population is expected, which may also lead to a shortage, especially in small supply areas.

For water supply companies it is especially important to know the future change in water demand in order to be able to adapt to these changes. Therefore, a water demand forecasting model is derived in this study. In a first step, this study analyses the change in water demand in recent years and the relationship between water demand and climate indices. Furthermore, the change of the future water demand depending on the different climate change scenarios (RCP 2.6, RCP4.5 and RCP8.5) is estimated. For this purpose, different modeling approaches (e.g. multiple linear regression, random forest,…) were tested and a suitable approach is selected. The water demand forecasting model is trained and tested with water demand and weather data reaching back several years. To estimate the future change in water demand, the model is applied to the climate projections and the change between the selected reference period and the two future periods is calculated. The change in demographic development is considered in the last step.

So far, we found that for the selected study site peak water demand will increase by an average between 1.5% and 5.5%, depending on the different climate change scenario for the period 2051-2070 compared with the reference period (2001-2020). It was also determined that demographic development is responsible for the majority of the increase in water demand.

Acknowledgements: The presented research is funded by the Federal Ministry for Agriculture, Forestry, Regions and Water Management of the Republic of Austria

How to cite: Stelzl, A. and Fuchs-Hanusch, D.: Predicting future water demand in Austria due to climate change and demographic development, EGU General Assembly 2023, Vienna, Austria, 23–28 Apr 2023, EGU23-14124, https://doi.org/10.5194/egusphere-egu23-14124, 2023.

EGU23-14739 | Orals | HS5.12

Drinking water temperature model for urban environments validated with measurements from real-life distribution networks 

Joost van Summeren, Andreas Moerman, Mirjam Blokker, and Pan Quan

The Dutch drinking water sector distributes treated drinking water without a disinfecting residual. Among many other microbiological safety measures, Dutch water utilities are legally obliged to distribute drinking water to the customers’ tap at a maximum temperature of 25 °C. Ongoing urbanization, climate change, and subsurface infrastructure intensification related to the energy transition pose a growing risk to meet this requirement.

Previous research at KWR has shown that the temperature of drinking water converges to the temperature of the surrounding soil that, in turn, is influenced by weather conditions and the presence of anthropogenic heat sources, such as electric power distribution stations and district heating pipes. During a hot summer, cool drinking water reaches the soil temperature within hours. The rate of warming up depends on hydraulic conditions, dimensional and thermal properties, and a delaying effect caused by the continuous supply of drinking water that cools down the surrounding soil.

KWR has developed numerical tools to predict the temperature of distributed drinking water in the presence of subsurface heat sources and fluctuating weather conditions. These tools can be used to assess the impact of climate change and the urban environment on drinking water temperatures and investigate the optimized design of distribution networks and the urban environment.

Our contribution describes the validation of the numerical model using drinking water temperatures measured in a real-life Dutch DWDS. The case study concerns Ø300 mm pipes in the city of Leeuwarden (Vitens drinking water company). We discuss the results in the context of two additional case studies that compare model predictions and temperature measurements in a Ø100 mm drinking water distribution network and a Ø160 mm single pipe. Finally, we discuss future applications that can improve codes of practice regarding the organization of subsurface infrastructure; a central point of attention is the installation of drinking water and district heating pipes at safe distances.

How to cite: van Summeren, J., Moerman, A., Blokker, M., and Quan, P.: Drinking water temperature model for urban environments validated with measurements from real-life distribution networks, EGU General Assembly 2023, Vienna, Austria, 23–28 Apr 2023, EGU23-14739, https://doi.org/10.5194/egusphere-egu23-14739, 2023.

EGU23-15223 | ECS | Posters on site | HS5.12

Piloting a Water Data Management Ecosystem to Enable an Efficient and Resilient Decision Support System for the IJsselmeer 

Siddharth Seshan, Dave Ebbelaar, Joris Ebbelaar, Eric de Vos, Mollie Torello, Koen Zuurbier, and Lydia Vamvakeridou-Lyroudia

The water sector faces great challenges and stresses on the major water system due to climate change and increasing population. As a result, water utilities are increasingly undergoing a digital transformation, to achieve more resilient and sustainable water services while implementing more data-driven decisions. To tackle challenges such as cybersecurity, data ownership and poor quality of data, the European Commission proposes the creation of Data Spaces, as part of the European strategy for Data. Within the Horizon Europe project called WATERVERSE, a holistic approach is being developed to drive the development of data spaces for water utilities. The project involves the development of a Water Data Management Ecosystem (WDME) to enhance the adoption of data management practices that are affordable, accessible, secure, fair and easy to use, while improving the usability of data. In this work, the piloting of a WDME for the Netherlands case study will be presented. The lake IJsselmeer, is used by the water company PWN as a crucial source of drinking water supply for almost 2 million customers in the North-West region of the Netherlands. However, due to population growth, sea level rise, and climate change, the lake IJsselmeer faces extreme variability in water quality in the future. Furthermore, the lake IJsselmeer is at the end of the Rhine Delta, and therefore faces varying water quality challenges from upstream users and stakeholders and saltwater intrusion from the Wadden Sea. Therefore, the development of a digital twin for the lake IJsselmeer is needed to predict chloride (Cl-) and other important water quality parameters for operational (daily basis) and strategic (coming decades) decision making. Such a digital twin requires various data as input from heterogeneous sources. Therefore, to enable the deployment and efficient use of the digital twin as part of a decision support system, the Cl- source prediction model is being piloted within the WDME. An open-source data exchange system called FIWARE is deployed within the pilot. FIWARE serves as the primary broker to exchange contextual information between the various components. Raw data from various sources such as – PWN’s internal data on water quality, data from the national weather agency, water level data of lake Ijsselmeer from the governmental water management agency, are accessed in real-time and fed into the WDME. The data is then processed and prepared as input to the digital twin, which provides predictions over multiple forecasting horizons. Finally, all relevant data, including the predictions, are relayed to a dashboard.

How to cite: Seshan, S., Ebbelaar, D., Ebbelaar, J., de Vos, E., Torello, M., Zuurbier, K., and Vamvakeridou-Lyroudia, L.: Piloting a Water Data Management Ecosystem to Enable an Efficient and Resilient Decision Support System for the IJsselmeer, EGU General Assembly 2023, Vienna, Austria, 23–28 Apr 2023, EGU23-15223, https://doi.org/10.5194/egusphere-egu23-15223, 2023.

EGU23-15226 | ECS | Orals | HS5.12

Stakeholder Engagement Risks and Opportunities to pilot a Water Data Management Ecosystem 

Mollie Torello, Siddharth Seshan, Lydia Vamvakeridou-Lyroudia, and Suze van der Meulen

Data-driven decision making, and the use of data-intensive technologies are on the rise within the water sector. Such a paradigm shift warrants for more efficient management of data. To address this, within the European Union Horizon Europe project WATERVERSE, Water Data Management Ecosystems (WDME) are being developed. The aim of this project is to research a way to make water data management affordable, accessible, secure, fair and easy to use.  WATERVERSE has demonstration cases in six different countries (Cyprus, Finland, Germany, The Netherlands, Spain, and the UK).

Stakeholder engagement is key to ensure the proper development of WDME. Each stakeholder is bound to strict regulations, policies, societal norm, etc. Through proper stakeholder management, this project aims to implement a strategic policy and commitment across stakeholders to reduce data management risks and provide data sharing opportunities. These goals were accomplished through the mapping of the main actors (e.g. end-users, policy makers, citizens) along with the challenges and expectations. In the Dutch case, stakeholder engagement involves gathering all the main actors in the development of a digital twin of the IJsselmeer for chloride predictions.  

Many challenges and drivers effect the technological development of a digital twin of the Ijsselmeer. Challenges such as tough data ownership rules and security polices hinder water data management and transfer. There are drivers for more data from new sources and advanced analytics.  

Additionally, to foster communication, Multi-Stakeholder Forums (MSF) are used to facilitate the dialogue process. MSF arranged dialogue on the topics of objectives and roles, challenges, and future vision of digital spaces in the water sector.  Stakeholders established in the MSFs their level of commitment, interest, and influence in data management.

Data gathered through stakeholder engagement will provide the technical side of WATERVERSE to develop critical infrastructure for the development of data spaces. This will ultimately lead to better decision making and more resilience water utilities in the water sector. 

How to cite: Torello, M., Seshan, S., Vamvakeridou-Lyroudia, L., and van der Meulen, S.: Stakeholder Engagement Risks and Opportunities to pilot a Water Data Management Ecosystem, EGU General Assembly 2023, Vienna, Austria, 23–28 Apr 2023, EGU23-15226, https://doi.org/10.5194/egusphere-egu23-15226, 2023.

Urban residential water uses entail energy consumption and associated carbon emissions. Reducing residential water uses thus can simultaneously save water and energy and help reduce carbon emissions. However, residential water uses are strongly affected by the choices of household appliances and fixtures, and water use behaviors. In this study, we first conducted a household water use survey in Shanghai, the largest city in China, to understand residential water use behaviors in different seasons. A two-stage stochastic optimization model is developed to optimize water and energy conservation decisions so as to minimize the expected total cost of water and water-related energy uses and maximize carbon emission reduction. Data collected through questionnaire surveys are used to parameterize the optimization model. Water and energy conservation choices are categorized into long- and short-term decisions. The results show that in Shanghai residential water uses has a strong impact on urban carbon emission reduction. Typical temperature range in different seasons strongly affects the effectiveness of short-term conservation actions. The results support a subsidy policy for water-saving appliances that can incentivize citizens in water-saving. Model results are useful for exploring the water-energy-carbon nexus of urban households considering seasonal factors

How to cite: Zhou, J. and Zhu, T.: Optimization of Water-Energy-Carbon Nexus in Urban Residential Water Uses for Shanghai, China, EGU General Assembly 2023, Vienna, Austria, 23–28 Apr 2023, EGU23-15728, https://doi.org/10.5194/egusphere-egu23-15728, 2023.

EGU23-16156 | ECS | Posters virtual | HS5.12

An EPANET metamodel based on Simplicial Convolutional Networks 

Bulat Kerimov, Franz Tscheikner-Gratl, and Riccardo Taormina

Metamodels reproduce the response surface of physics-based models while significantly reducing simulation times. Such techniques are widely employed in water distribution system analysis since they enable the application of computationally expensive methods in designing, controlling, and optimizing water networks. Recent works proposed graph neural networks as candidates for metamodels. These models bear inductive biases as one can draw analogies between links and nodes in the graph with the pipes and junctions. This implies that new metamodels using this approach can be applied to an unseen water network topology without re-training. However, there is no evidence of the transferability properties of those metamodels so far. This work introduces Simplicial Convolutional Networks (SCNs), which offer the potential of developing transferable metamodels that can generalize across different systems.  We test the suitability of SCNs to estimate pipe flowrates and nodal pressures emulating steady-state EPANET simulations. We compare the accuracy of SCN metamodels against graph neural networks on several benchmark water networks available in the literature. Moreover, we show that SCNs are able to generalize better than graph neural networks by evaluating and measuring the performance of the metamodel in an unseen setting.

How to cite: Kerimov, B., Tscheikner-Gratl, F., and Taormina, R.: An EPANET metamodel based on Simplicial Convolutional Networks, EGU General Assembly 2023, Vienna, Austria, 23–28 Apr 2023, EGU23-16156, https://doi.org/10.5194/egusphere-egu23-16156, 2023.

EGU23-16427 | Orals | HS5.12

Gamification of Hydraulic Modeling to Create Awareness for the Effects of Climate Change and Urbanization on Water Supply 

Daniela Fuchs-Hanusch, Georg Arbesser-Rastburg, Valentin Adler, Anika Stelzl, David Camhy, Michael Pointl, and Johanna Pirker

Dealing with the effects of urbanization and climate change has become a central task in urban water management. In this paper we present the web-based water distribution system modelling tool EWA, which was developed with the purpose to raise awareness for some of these tasks. We have linked gamification elements with modelling and have involved potential users of the tool into tool-development, following a participatory research approach. In EWA we provide tasks and challenges that have to be fulfilled by the user to guarantee a reliable water supply in future. Therefore, the UI provides a map view where model components can be added, removed, selected and are visualized. Forms are provided to edit selected components. For hydraulic modelling we use Epanet 2.2 (Rossmann, 2020) with OOPNet (Steffelbauer & Fuchs-Hanusch, 2015). Water demand prediction is based on regression models incorporating climate change projections and population development for Austria. To provide an overview of system performance, indicators like the resilience index (Creaco et al.,2016) or the number of unsatisfied nodes are used. The change of these indicators over time is visualized in graphs. To follow a participatory approach, we are testing the usability of the tool with a group of engineers from governmental institutions, water utilities and members of the Game Lab and the Institute of Urban Water Management at TU Graz. In these tests the participants have to fulfil challenges related to a) basics, like editing parameter of an existing hydraulic system and adding new components to the system b) add additional components representing an urban development area and c) simulate and interpret system performance under climate change for different conditions like component failure. Such challenges can be generated by using the “challenge editor”, which was created by a master student of the TU Graz Game Lab, mainly to allow quick and flexible adaption of challenges defined by the urban water management team. The usability tests with water engineers have shown that the “challenge-editor“ is also of interest for staff training at water utilities. Hence, we decided to put more effort in the design of the “challenge-editor” in a next step. Further a generation gap in user performance was identified, mainly in context of the time to fulfil the given challenges but also in preferences for structure and appearance of the UI. From this we derived to focus the adaptions of the UI on the feedback from the younger participants which we assumed to be our major target group.

Acknowledgements: EWA is funded by the Federal Ministry for Agriculture, Forestry, Regions and Water Management of the Republic of Austria

Creaco, E., Franchini, M., & Todini, E. (2016). Generalized Resilience and Failure Indices for use with Pressure-Driven Modeling and Leakage. Journal of Water Resources Planning and Management, 142(8), Art. 8. https://doi.org/10.1061/(ASCE)WR.1943-5452.0000656

Rossman, L., Woo, H., Tryby, M., Shang, F., Janke, R., & Haxton, T. (2020). EPANET 2.2 User Manual. U.S. Environmental Protection Agency.

Steffelbauer, D., Fuchs-Hanusch, D., 2015. OOPNET: an object-oriented EPANET in Python. Procedia Eng. 119. 710e719 https://doi.org/10.1016/j.proeng.2015.08.924.


How to cite: Fuchs-Hanusch, D., Arbesser-Rastburg, G., Adler, V., Stelzl, A., Camhy, D., Pointl, M., and Pirker, J.: Gamification of Hydraulic Modeling to Create Awareness for the Effects of Climate Change and Urbanization on Water Supply, EGU General Assembly 2023, Vienna, Austria, 23–28 Apr 2023, EGU23-16427, https://doi.org/10.5194/egusphere-egu23-16427, 2023.

EGU23-16656 | ECS | Posters on site | HS5.12

Optimizing chlorination for water safety and acceptability in emergency water supplies in humanitarian crises using a deep composite neural network 

Michael De Santi, Syed Imran Ali, Usman T Khan, James Elliott Brown, Gabrielle String, Camille Heylen, Doreen Naliyongo, Daniele S Lantagne, Vincent Ogira, Jean-François Fesselet, and James Orbinsiki

Unprecedented global population displacement in recent years has increased the burden of waterborne illnesses in refugee and internally displaced person (IDP) settlements. Preventing outbreaks of waterborne diseases can be particularly challenging in urban-scale refugee and IDP settlements since recontamination commonly occurs post-distribution period. In this period users manually collect water from public tapstands, transport it to their dwellings where they store and use it over several hours. Unlike contexts where water is piped directly to the home, in urban-scale refugee and IDP settlements effective chlorination in these settlements requires that free residual chlorine (FRC) at tapstands be sufficient to ensure at least 0.2 mg/L of FRC throughout the period of storage and use, while remaining palatable to consumers. Thus, chlorination practice must account for both site-specific dynamics of chlorine decay as well as local attitudes towards chlorinated water taste and odor (T&O). In response to this need, we developed the Safe Water Optimization Tool (SWOT), a “digital water” tool that uses machine learning provide generate evidence-based chlorination decision support that balance over- and under-chlorination risks.

We used data collected from the Kyaka II refugee settlement in Uganda to calibrate a tapstand FRC target using the SWOT that maximizes household water safety while minimizing T&O rejection. We evaluated the water safety risk using a deep composite quantile regression neural network (DCQRNN), an artificial intelligence model that predicts the full probabilistic distribution of point-of-consumption FRC concentration using routine monitoring water quality data. We used ordinary least-squares regression (OLS) to predict the percent of the population rejecting chlorinated water as a function of tapstand FRC using forced choice triangle test and flavour rating assessment test focus group data. The final FRC target was selected to balance both risks of unsafe water and T&O rejection.

By integrating the predicted risk from both the DCQRNN and OLS models, we determined that an FRC target of 0.7 mg/L in Kyaka II produces the most balanced tradeoff of both risks (38% probability of rejection, 36% probability of unsafe drinking water). The lowest combined probability for both risks was achieved at a tapstand FRC of 1.4 mg/L which would produce only 7% risk of unsafe drinking water but 46% risk of rejection. This integrated risk-based approach allows water system operators to select a target based on their preferred tradeoff of these risks, in consideration of site conditions, especially the safety of alternative sources.

This study presents an important digital water solution to ensure safety of water supplies in humanitarian contexts, using the SWOT’s advanced artificial intelligence modelling and analytics to address uncertainty in FRC decay as well as using a data driven approach to quantifying T&O behaviour. This approach yields chlorination guidance that balances risks of both under- and over-chlorination, maximizing access to safe water and improving public health protection. The approach taken in this study can be applied in a range of contexts where water users lack continuous water supply, including in large urban intermittent water supply systems.

How to cite: De Santi, M., Ali, S. I., Khan, U. T., Brown, J. E., String, G., Heylen, C., Naliyongo, D., Lantagne, D. S., Ogira, V., Fesselet, J.-F., and Orbinsiki, J.: Optimizing chlorination for water safety and acceptability in emergency water supplies in humanitarian crises using a deep composite neural network, EGU General Assembly 2023, Vienna, Austria, 23–28 Apr 2023, EGU23-16656, https://doi.org/10.5194/egusphere-egu23-16656, 2023.

EGU23-17062 | Posters on site | HS5.12

VlinderNET – a tool for Probabilistic Hydraulic Water Distribution Modelling and Visualization 

Mark Morley, Peter van Thienen, Ina Vertommen, and Mollie Torello

Modelling and, as a consequence, decision-making for water distribution networks is ordinarily performed using the deterministic paradigm in which a single set of input conditions gives rise to a single output “truth”.  Reality is not so accommodating, however, and it is readily apparent that significant uncertainties remain in both our knowledge of the condition and the operating constraints of the network.  These uncertainties include variables such as the effective diameter of pipes, characterised by degradation with age and water chemistry, and the quantities of water demanded by consumers.  Traditionally, where these uncertainties have been accommodated in the decision-making process this has been by considering multiple scenarios to model a small number of model states. 


The application of probabilistic modelling for water distribution networks has gained significant traction in the literature in recent years – particularly in the context of decision support systems where stochastic parameter sampling is employed to improve the robustness of the obtained solutions.  Nevertheless, the wide interest in probabilistic modelling has yet to be reflected in the emergence of tools to apply this paradigm. 


This paper introduces VlinderNET a novel tool developed by KWR which seeks to bridge this gap by allowing the user to evaluate and visualize the impact of the manifest uncertainties in the network through the use of probabilistic hydraulic simulation.  VlinderNET permits the specification of complex, cascading Probability Density Functions for the input parameters for a hydraulic simulation.  These PDFs are extensively sampled to produce a wide range of stochastic input variables which are evaluated in a succession of hydraulic simulations which can be parallelized either on a local computer or with cloud support.  The results of the simulations are aggregated and the effects of the uncertain inputs are presented by the tool graphically and spatially both at the component and network level.  The tool further provides an API for third-party applications to integrate the probabilistic paradigm directly into decision support tools in a straightforward and consistent fashion.

How to cite: Morley, M., van Thienen, P., Vertommen, I., and Torello, M.: VlinderNET – a tool for Probabilistic Hydraulic Water Distribution Modelling and Visualization, EGU General Assembly 2023, Vienna, Austria, 23–28 Apr 2023, EGU23-17062, https://doi.org/10.5194/egusphere-egu23-17062, 2023.

EGU23-746 | ECS | Orals | HS5.14

Functional response evaluation of hard and soft adaptation strategies in urban flooding 

Angana Borah, Raviraj Dave, and Udit Bhatia

Intensified climate extremes in changing climate scenarios with rapid urbanization make urban floods a global concern since the population in the cities is increasing. One way to manage urban floods is the adoption of various adaptation measures. The existing infrastructures for flood adaptation are classified as 'hard,' 'soft,' and 'hybrid' adaptation strategies, which constitute the conventional Stormwater Drainage Network (SWD),  Green Infrastructures (GI) practices, and a combination of soft and hard strategies, respectively. As infrastructures are vulnerable to damage because of exceedance in design life, capacity, or any adverse situation, all adaptation methods are likely to become non-functional in the event of a disaster. Under such circumstances, the flood response of an urban region on account of the non-functionality of both soft and hard adaptation strategies is not well understood. We develop a coupled 1D-2D hydrodynamic model using MIKE+ and generate scenarios to compare the damages in the functional capacity of all three adaptation strategies. We implement this model for Ahmedabad city, India, and our Initial results show the hotspots which are highly prone to urban flooding. Here, we evaluate the hydrodynamic interaction between flood propagation on the surface with components of SWD structures and GI facilities and determine the consequence of their functional damages. Our analysis unfolds all the aspects of utilizing certain adaptation pathways, including the merits and demerits of the success and failure of a project. Our framework could aid in determining the trade-offs between different adaptation pathways from the perspective of building flood-resilient cities. 

How to cite: Borah, A., Dave, R., and Bhatia, U.: Functional response evaluation of hard and soft adaptation strategies in urban flooding, EGU General Assembly 2023, Vienna, Austria, 23–28 Apr 2023, EGU23-746, https://doi.org/10.5194/egusphere-egu23-746, 2023.

EGU23-2223 | ECS | Orals | HS5.14

Societal interest and willingness to pay for green roofs in Sardinia 

Elena Cristiano, Roberto Deidda, and Francesco Viola

Among the different nature-based solutions proposed for the sustainable development of urban areas, green roofs are becoming more and more popular, thanks to their multiple benefits. Indeed, these nature-based solutions reduce the pluvial flood risk during rainfall events, contribute to the thermal insulation of buildings, mitigate the urban heat island effect, and improve the air quality. The knowledge that citizens have about green roofs, the interest and willingness to pay for their installation are still poorly investigated and quantified, although this meta-information could be a valid support and guidance for policy makers and urban planners. In this work, we investigated, through an anonymous online survey, the perception of people living in Sardinia on the most common urban environmental issues (i.e., urban flood, increase of temperature, energy consumption, air pollution and lack of green spaces), and the willingness to pay for green roof installation on both public and private roofs. We estimated the empirical relation among environmental issues awareness and the willingness to pay for a specific green solution while trying to relate the latter to socio demographic characteristics. Results show that citizens are very interested in having green roofs on public building, and on average they are willing to pay around 35 euro per year for their installation and maintenance. The interest for green roofs on private building is, on the other hand, lower than on public ones, due to the high installation and maintenance costs. Moreover, when possible, citizens would rather have solar panels instead of green roofs, since they fully perceive the economic advantages deriving from the installation and are not fully aware of the green roof benefits.

How to cite: Cristiano, E., Deidda, R., and Viola, F.: Societal interest and willingness to pay for green roofs in Sardinia, EGU General Assembly 2023, Vienna, Austria, 23–28 Apr 2023, EGU23-2223, https://doi.org/10.5194/egusphere-egu23-2223, 2023.

Nature-based Sustainable Drainage Systems (SuDS) have been promoted for enhancing urban drainage, as well as offering additional benefits to urban greening and amenity, and engaging communities in the design and adoption of schemes. However, a lack of data on the efficacy of nature-based options means that schemes often use traditional engineering approaches instead of nature-based designs. Where nature-based options are used, most schemes lack long-term monitoring to understand their effectiveness; interventions are rarely designed to maximise their potential and often underperform once constructed. Existing practices also mean that most schemes are led by technical expertise and hence proceed with token public engagement, and lack support for community acceptance and adoption. This is unsustainable and undermines SuDS as a crucial tool for climate adaptation and sustainable urban development.

The SuDS+ approach argues for a radical rethink of the benefits of SuDS, de-prioritising drainage as their primary driver, and instead conceptualising ‘SuDS+’ as a multi-benefit urban development tool with a range of co-, not additional, benefits. In this approach SuDS become a vehicle for enhancing urban design, amenity, and health and wellbeing which can be adapted to meet community needs and aspirations.

The SuDS+ project, a 5-year Defra funded study in the Northeast of England, aims to develop and deliver community-centred SuDS, embedding innovation in collaborative design, as well as pushing forward new technologies and approaches for nature-based urban water management, and co-developing our understanding of what and how to monitor interventions to develop a robust evidence-base for the future.

This paper outlines the key challenges and how the project will aim to tackle these as a call to reimagine SuDS as a vehicle for delivering greener, healthier, more sustainable, and more resilience urban communities.

How to cite: Starkey, E. and Rollason, E.: SuDS+: establishing a new vision for sustainable drainage in delivering  sustainable and resilient urban communities, EGU General Assembly 2023, Vienna, Austria, 23–28 Apr 2023, EGU23-3381, https://doi.org/10.5194/egusphere-egu23-3381, 2023.

EGU23-4190 | Posters on site | HS5.14

On the effectiveness of green infrastructure to reduce stormflow at catchment scale 

Julian Klaus, Paulina Busch, and Michael McHale

Population growth and climate change alter the urban water cycle resulting in increasing frequency and magnitude of urban floods. In this study, we compared stormwater response in an urban drainage system between two adjacent urban sewersheds in Buffalo, NY, USA. At the first site (DEL), comprehensive installations of green infrastructure (GI) (i.e. bioretention cells) were carried out, while the second site (SQ) was minimally influenced by GI practices. Stormflow was monitored as pipeflow at both sites for an observation period of five years, three pre-construction and two post-construction years. We identified storm events and calculated event runoff, as excess flow above baseflow. Additionally, we evaluated annual total flow and peakflow (annual and seasonal) between the sites and between pre- and post-construction. Our analyses were confined to snow-free seasons because storage of precipitation in the snowpack confounds the evaluation of the precipitation-runoff relation. The analysis showed that the GI implementation was highly effective in reducing stormflow. Total annual flow was reduced at DEL between pre- and post-construction, while no trend was observable at the minimally influenced by GI SQ. Also, event-based stormflow was reduced through GI implementation across all snow-free seasons. Last, median event peakflow was clearly reduced through GI, especially in spring and summer, whereas results during fall were less clear. Through this hydrometric analysis, this study is among the first that provided evidence for the efficiency of GI in reducing stormflow beyond the plot-scale and thus provides future guidance on flood mitigation in urban environments.       

How to cite: Klaus, J., Busch, P., and McHale, M.: On the effectiveness of green infrastructure to reduce stormflow at catchment scale, EGU General Assembly 2023, Vienna, Austria, 23–28 Apr 2023, EGU23-4190, https://doi.org/10.5194/egusphere-egu23-4190, 2023.

EGU23-4666 | ECS | Orals | HS5.14

Integrated urban water management modeling under future water demand and climate scenarios for the city of Bangalore, India 

Snigdha Sarita Mohapatra, Meenakshi Arora, Wenyan Wu, and Manoj Kumar Tiwari

Climate change and population growth have a significant impact on urban water supplies. This is due to the fact that meeting urban water demand with the available water resources is quite challenging due to ever-growing water demand, variable supply as a result of climate uncertainties, and water pollution. In many urban areas around the world, the concept of integrated urban water management (IUWM) has become quite prominent in recent decades to tackle the challenges of urban water supply and management. The main principle of IUWM is to incorporate non-conventional water supply sources, such as stormwater, rooftop rainwater, and recycled wastewater, to augment the water supply and provide fit-for-purpose water. IUWM, if implemented successfully, has the potential to mitigate multiple challenges outlined above including enhanced water security during droughts, reduced waste streams, reduced floods, and enhanced groundwater recharge as well as reduced water pollution.

In this research, an IUWM principles incorporated water balance model (i.e., developed using eWater Source Version 5.4.0.11797) was used to identify the most suitable supply options from multiple water sources to satisfy the water demands under future demand and climate scenarios for the city of Bangalore, India. Five different water supply configurations were generated based on available water sources and within the policy framework to meet water demand. The effect of climate change has been incorporated into the IUWM model configurations through the runoff responses from future precipitation and temperature changes. Future climate change scenarios for four IPCC emission scenarios i.e., ssp126, ssp246, ssp323, and ssp586 have been incorporated from thirteen Coupled Model Intercomparison Project-6 (CMIP6) models (i.e., 0.25° spatial resolution available at the study location). Three water demand scenarios i.e., low (150 liters per capita per day), average (175 liters per capita per day), and high (200 liters per capita per day) for the projected population were considered as per the Indian Standards. The selected configurations were evaluated for water supply reliability (i.e., time and volumetric reliability) in the study area. Further, as multiple future scenarios resulted in multiple water supply reliability solutions under five IUWM model configurations, the robust solution was identified using robustness metrics.

How to cite: Mohapatra, S. S., Arora, M., Wu, W., and Tiwari, M. K.: Integrated urban water management modeling under future water demand and climate scenarios for the city of Bangalore, India, EGU General Assembly 2023, Vienna, Austria, 23–28 Apr 2023, EGU23-4666, https://doi.org/10.5194/egusphere-egu23-4666, 2023.

Floods have devastated many urban socio-ecological systems, adding to urban planners' concerns. Floods caused by typhoons and heavy rain are common in South Korea during the summer, and especially Seoul has experienced urban flooding due to unusually localized heavy rains since 2010. According to the Intergovernmental Panel on Climate Change scenarios (IPCC, 2014), flood damage in Korea is expected to increase due to summer-concentrated precipitation. As an example of what happened, record-breaking rainfall in the summer of 2022 caused severe damage in the Gangnam, a prime district in Seoul, Korea, that has been most vulnerable to flood damage due to drainage problems.

Green infrastructure's socio-ecological system aspect has been recognized for its ability to improve the provision of urban ecosystem services and is increasingly being used for stormwater management. Flood resilience necessitates the ability of urban socio-ecological systems to maintain their structures and functions during and after flooding events. In terms of achieving sustainable outcomes for municipalities, green infrastructure has practical limitations, such as a limited capacity for storing and infiltrating stormwater. As an interdisciplinary approach, green infrastructure necessitates the involvement of multiple stakeholders with conflicting interests, and it is critical to identify the best measures to apply in each context for effective flood mitigation strategies. There is, however, a knowledge gap in investigating an urban water system as a social-ecological system that coevolves because of interactions between actors, institutions, and water systems.

Gangnam district has quickly become the focal point for discourses on socio-economic inequality in Korea, consolidating both socio-economic segregation and political conservatism, making social-economic-ecological context critical for any urban planning to be sustainable. The aim of this research is to develop a system for selecting appropriate green infrastructure for resilient urban stormwater management in Seoul's Gangnam district using simulation-based modeling.

The first step will be to identify suitable green infrastructure practices for Gangnam district’s socio-economic context based on a co-benefits analysis, which will include incorporating co-benefits and human well-being into flood management decision-making while taking stakeholders' perceptions into account using a multi-criteria decision support system. The second step involves using the "Green Values Stormwater Management" model (Jaffe et al., 2010) to assess the green infrastructure's ability to adhere to the "4R" principles of resilience: robustness, rapidity, redundancy, and resourcefulness based on simulation results.

The volume of rain captured or retained by the area's green infrastructure, providing feedback on construction and maintenance costs, as well as an estimate of the percentage of the desired volume retention goal being met will be estimated by the simulation model. Additionally, co-benefits such as cost savings and increased real estate value will be calculated and presented. This research framework will assist city planners decide which green infrastructure practices to use for resilient urban flood management.

References

IPCC (2014). Climate Change 2014: Synthesis Report. IPCC, Geneva, Switzerland.

Jaffe, M., Zellner, M., Gonzalez-Meler, M., Cotner, L. A., Massey, D., Ahmed, H., & Elberts, M. (2010). USING GREEN INFRASTRUCTURE TO MANAGE URBAN STORMWATER QUALITY: A Review of Selected Practices and State Programs.

How to cite: Rahman, M. R., Kim, H., Kwon, D., and Lee, J.: A Simulation-based Modeling Approach to Adapt Social-Ecological Green Infrastructure System for Resilient Urban Flood Management, EGU General Assembly 2023, Vienna, Austria, 23–28 Apr 2023, EGU23-4830, https://doi.org/10.5194/egusphere-egu23-4830, 2023.

Green roofs are beneficial in urban drainage systems due to their role in mitigating the hydrological response of the largely impervious surfaces to intense rainfall events. Such benefit is often assumed to hold also in case RainWater Harvesting (RWH) is implemented to exploit the collected rainwater for non-potable usages and to save valuable potable water resources. However, the role of green roofs on the RWH efficiency is not obvious and requires detailed investigation by accounting for the local rainfall climatology.   

On the one hand, retention of rainwater operated by the vegetation would reduce the total volume of collected water made available for exploitation. On the other hand, rainwater detention in the green roof substrates would add to the storage capability of the RWH system, therefore improving the delayed supply of water during inter-event dry periods. The resulting efficiency at the annual scale depends on the distribution of precipitation within the year (duration of dry periods, intensity of rain events, frequency of extremes, etc.).

In this work, a behavioural model is developed to investigate the impact of the inflow modulation due to an interposed green roof on the efficiency of a generic RWH system located in the Mediterranean environment (Cauteruccio and Lanza, 2022). Various configurations of both the green roof characteristics (retention and detention performance) and the RWH system (rainwater collection area and storage volume) are compared with the collection from impervious surfaces in terms of non-dimensional reliability indices.

Furthermore, the annual usage volume per unit tank capacity is used as an indicator of the economic benefit associated with the exploitation of the resource, and its variation in case of the various green roof/RWH system design configurations is assessed. In particular, the reduction of the significant overflow ratio that is typical of RWH systems in the Mediterranean climate is calculated, which is interpreted as a positive feature since overflow represents the unused portion of the collected water.

Cauteruccio, A. and L.G. Lanza (2022). Rainwater harvesting for urban landscape irrigation using a soil water depletion algorithm conditional on daily precipitation. Water, 14(21), 3468. https://doi.org/10.3390/w14213468.

How to cite: Cauteruccio, A. and Lanza, L. G.: Competing roles of green roof in rain water harvesting systems: accounting for retention and detention in a behavioural model simulation, EGU General Assembly 2023, Vienna, Austria, 23–28 Apr 2023, EGU23-8630, https://doi.org/10.5194/egusphere-egu23-8630, 2023.

EGU23-8836 | ECS | Posters on site | HS5.14

Engaging local communities in planning Nature-Based-Solutions for urban drainage systems - the MUDAR project 

Livia Serrao, Susanna Ottaviani, Corrado Diamantini, Alessandra Marzadri, Marco Ragazzi, Wilson Alberto Munguita Paulino, Félix Cândido Cláudio Eduardo Macueia, Harold Juvenal Chate, Americo Da Stela Valdimir Msopela, Alfredo Manhota Antonio, and Guido Zolezzi

Urban population has been increasing worldwide in recent decades and it is expected to continue growing in the coming years. Cities are facing the effects of the climate crisis, which primarily impact the most vulnerable contexts, first and foremost informal settlements. In this context, the growth of informal neighborhoods, home to one billion people1, poses complex challenges for the cities of today and tomorrow. In these urban areas traditional, informal and formal social dynamics coexist, strengthened by strong community identities and bonds. Major problems are due to the lack of basic services and infrastructure, making these areas more vulnerable to the increasingly frequent and intense extreme rainfall events. 

In this work, we present the recently launched Europeaid-funded project MUDAR (Mozambique integrated Urban Development by Actions and Relationships), and specifically focus on its component that addresses the dynamics and effects of flooding  in an informal urban area: the Macuti neighborhood in the city of Beira, Mozambique. Macuti is situated on the coast, making it particularly vulnerable to frequent cyclones, one of all Idai, which damaged 49% of its buildings in March 20192. Moreover, it is located on a marshy, purely flat area at the end of an inadequate open drainage network serving the entire city, which is unable to drain the flow at high tide. Macuti, with its almost 17 thousand people (2017), since the early 2000s has been experiencing a rapid growth in spontaneous settlements, which has resulted in a higher population density, with the unbuilt area decreasing by 40% from 2004 to 2022, and soil permeability further reducing in a context where the clayey soil composition already strongly limits rainfall infiltration. These changes, in addition to the inadequate water infrastructure, have exacerbated flooding problems associated with heavy rainfall events (the maximum daily precipitation of the 1990-2020 period was 288.5 mm/day). Investigating the socio-hydrology of flooding in these informal settlements is particularly complex because its requirements for high-resolution topographic, soil, land use and meteorological data, which are very limited in these informal settlements. 

More specifically, we present preliminary outcomes and the proposed project strategy to cope with the intrinsic data scarcity of such context, which is based on carefully designed participatory surveys with local actors. To fill this data gap, a multi-disciplinary approach has been adopted by combining elaborations from satellite image processing (SAR) with in-situ measurements and interviews to inhabitants and professionals. In addition to being involved in providing information about the area, the inhabitants are a crucial actor in the decision-making process for choosing the technical solutions to be implemented. Preliminary results on  flooding dynamics in Macuti neighborhood, as well as on three Nature-Based-Solutions scenarios emerging from the participatory process highlight promising factors that can allow adapting the participatory procedure in similar contexts.


1French, M., Trundle, A., Korte, I., Koto, C. (2020). Climate Resilience in Urban Informal Settlements: Towards a Transformative Upgrading Agenda. Climate Resilient Urban Areas, 129-153

2UNOSAT-REACH (2019). Mozambique- Beira City -Macuti - Neighbourhood Damage Assessment- As of 26 March 2019. URL: https://m.reliefweb.int/report/3056948

How to cite: Serrao, L., Ottaviani, S., Diamantini, C., Marzadri, A., Ragazzi, M., Paulino, W. A. M., Macueia, F. C. C. E., Chate, H. J., Msopela, A. D. S. V., Antonio, A. M., and Zolezzi, G.: Engaging local communities in planning Nature-Based-Solutions for urban drainage systems - the MUDAR project, EGU General Assembly 2023, Vienna, Austria, 23–28 Apr 2023, EGU23-8836, https://doi.org/10.5194/egusphere-egu23-8836, 2023.

EGU23-10523 | ECS | Posters virtual | HS5.14

Sensitivity analysis of green roof design parameters in SWMM for its improved understanding of hydrological performance 

Husnain Tansar, Huan-Feng Duan, and Ole Mark

Improved understanding of dynamic hydrological performance of green roof (GR) design parameters towards different model responses is important for maximizing its target design goals at the unit-scale. Replication of an optimally designed GR unit at the catchment-scale significantly contributes to achieving its target design goals (i.e., surface runoff reduction, urban flood reduction, peak flow control, etc.). Moreover, adequate efforts are required to explore and provide appropriate knowledge about the categorization of influential and non-influential design parameters with their suitable design spaces to guide researchers, drainage engineers, and stormwater management practitioners for effective and efficient planning, designing and optimization of GR at catchment-scales.

This study employs a robust and comprehensive global sensitivity analysis (GSA) method known as the variogram analysis of response surfaces (VARS) for sensitivity analysis of GR design parameters. Firstly, a total of 13,999 sample points for 14 GR parameters of three layers (i.e., surface, soil and drainage mat) are generated by using the latin hypercube sampling technique and their factor spaces are decided based on design guidelines in current SWMM manuals. Following that, the PySWMM is used to simulate these design samples in a Monte-Carlo-type setting on a conceptual catchment of 0.01km2 (100m2 × 100m2) with 50% treatment area of GR, and the model responses (e.g., surface infiltration, surface outflow, storage volume, and peak flow) are estimated and applied for sensitivity analysis. Finally, VARS evaluates different sensitivity analysis metrics by using different model responses corresponding to their designed samples.

Overall, the senstivity analysis results demonstrate that 8 out of 14 design parameters are highly influential on different model responses, however, the parameters’ sensitivity varies towards different model responses under different perturbation scales and rainfall conditions. Moreover, the selection of an effective range of design space of design parameters is necessary as it has a higher influence on model responses, while the parameters’ rankings and contributions to total sensitivity indices change with the range of design spaces. Furthermore, this research also provides an opportunity through VARS directional variogram index (an integrated sensitivity index) to study and understand the underlying mechanisms of design parameters under different perturbation scales with no extra computational burden. Senstivity analysis results will be presented with insights and recommendations for other regions, which will be helpful for decision-makers for effective planning, designing and implementation of GR. The findings of this parametric study would be helpful for the calibration and optimization of design parameters of GR for different case studies.


How to cite: Tansar, H., Duan, H.-F., and Mark, O.: Sensitivity analysis of green roof design parameters in SWMM for its improved understanding of hydrological performance, EGU General Assembly 2023, Vienna, Austria, 23–28 Apr 2023, EGU23-10523, https://doi.org/10.5194/egusphere-egu23-10523, 2023.

Green infrastructure (GI) has become a common solution to mitigate stormwater-related problems such as water quality and flooding hazards. Despite  widespread acknowledgement of GI benefits, there is a lack of decision support methods that allow practitioners to identify optimal locations and evaluate the costs and benefits of numerous spatially distributed small GI practices at larger scales (subwatershed to entire watershed) under uncertainty. To address these needs, an online Cloud-based interactive tool coupling SWMM (Storm Water Management Model) and the Water Research Foundation LID life cycle model, , called Interactive DEsign and Assessment System for Green Infrastructure (IDEAS_GI), is optimized using a noisy genetic algorithm (GA) with life cycle costs and stormwater volume reduction as the primary objectives. To overcome the computational challenge of probabilistic sampling with the noisy GA and to identify significant features for preferable locations, the GA  is merged with an artificial neural network, which acts as a meta-model (surrogate) for the numerical simulation model (SWMM). Post-optimization, machine learning decision trees are also generated that classify the numerous potential solutions generated by the noisy GA into GI coverage classes based on sub-watershed parameters. This framework is applied to a watershed in Baltimore, Maryland, U.S., under multiple budgetary scenarios. The results suggest that the greatest GI investments under the highest and lowest budgetary scenarios should be allocated to subwatersheds closest to the watershed outlet. For the lowest scenario, GI practices should be installed only in subwatersheds closest to the watershed outlet. When the budgetary scenario is highest, GI is sited across the watershed but highest priority is still given to subwatersheds closest to the watershed outlet. On the other hand, the importance of total distance to the watershed outlet is lower for the medium budgetary scenario. In fact, the impacts of different features for preferable GI coverage for these solutions are more complex, don’t follow a consistent pattern, and require more depth to capture the patterns in their corresponding classifier decision trees. In addition to these GI findings, the results showed that the addition of meta-models decreases average computational time required to reach Pareto frontiers similar to the ones generated by the noisy GA by more than 95%.

How to cite: Minsker, B. and Heidari Haratmeh, B.: Optimization of Green Infrastructure Networks to Maximize Stormwater-Related Benefits and Minimize Life Cycle Costs Using a Noisy Genetic Algorithm and Machine Learning, EGU General Assembly 2023, Vienna, Austria, 23–28 Apr 2023, EGU23-10670, https://doi.org/10.5194/egusphere-egu23-10670, 2023.

Infiltration-based green infrastructures (GIs) are commonly constructed to effectively storage the excessive stormwater runoff. These GIs exploit infiltration process, as the key natural phenomenon in the hydrological water balance, to detain excessive stormwater volume, especially at the outlet of the peri-urban watershed. Beside many factors playing significant roles in the performance of the infiltration-based GIs, implementing them in shallow groundwater area still represents a challenge that can restrict their widespread adoption. In fact, the groundwater level, if close to the bottom of infiltration-based GIs, can strongly influence the infiltration process. Basically, the shallow groundwater may theoretically play as a boundary conduction and subsequently reduces the infiltration rate.

The present study investigated the activation of an infiltration-based GI located at the outlet of the combined sewer system in the municipality of Sedriano (12,000 inhabitants in province of Milan, North Italy), monitoring the inflow and the water depth over a period of almost two years. Meantime, groundwater level and meteorological measurements were observed (including precipitation, air temperature, solar radiation, wind velocity, and relative humidity). Using these observations, a Water-Balance Model (WBM) was calibrated on the hydrological response of the infiltration-based GI and then, used to simulate how much time is required to empty under a specific precipitation event, and to understand the spatial distributed performances of these measures under different groundwater levels.

The implementation of an accurate WBM can be a useful tool for designing and assessing the performance of the infiltration-based GIs in shallow groundwater environments in peri-urban areas. This study is an integral part of the project Smart-Green (www.smartgreen.unimi.it) that developed online tools for supporting the water utilities to accelerate the transition towards the sponge cities utilizing GIs techniques.

How to cite: Masseroni, D., Niazkar, M., and Cislaghi, A.: Implementing Water Balance Model for Stormwater Management: the case of an Infiltration-Based Green Infrastructure Under Shallow Groundwater Levels, EGU General Assembly 2023, Vienna, Austria, 23–28 Apr 2023, EGU23-11430, https://doi.org/10.5194/egusphere-egu23-11430, 2023.

EGU23-13446 | ECS | Orals | HS5.14

Modelling reference evapotranspiration for vertical green (in urban areas) 

Karin A. Hoffmann, Rabea Saad, Björn Kluge, and Thomas Nehls

Vertical green is promoted as climate change mitigation and adaptation measure, and it provides green space for the urban population. However, it could be used in urban water management as well if its evapotranspiration, thus its water demand would be predictable.

For optimal performance, plants need to be provided with water, nutrients, and rooting space. But irregular precipitation, drought periods, and lack of natural water storage necessitate additional irrigation preferably by local water sources (such as rainwater runoff and greywater).

The amount of water needed for irrigation can be calculated using the Penman-Monteith approach which quantifies evapotranspiration of vegetated horizontal surfaces. For Vertical Green, the Penman-Monteith equation has already been tested. In that way, water demand of VGS can be calculated for hourly time steps based on radiation, wind speed, and vapor pressure deficit expressed by air temperature and relative humidity data.

The needed meteorological data can be measured on-site or derived, thus adapted – verticalized - from remote climate stations, depending on data availability, and needed accuracy of the results. This study models water demand using (1) on-site measured meteorological data, (2) ‘verticalized’ remote station data, and (3) remote station data. We then compare simulated evapotranspiration with measured lysimetry data for a ground-based Vertical Greenery system of Fallopia baldschuanica monitored in Berlin, Germany.

This study finds radiation and vapor pressure deficit to have the highest impacts on the variance of the results while wind speed has the lowest impact. In this contribution, we present the developed model, verticalization methods for the input parameters and validate the performance of the model based on measured water demands.

How to cite: Hoffmann, K. A., Saad, R., Kluge, B., and Nehls, T.: Modelling reference evapotranspiration for vertical green (in urban areas), EGU General Assembly 2023, Vienna, Austria, 23–28 Apr 2023, EGU23-13446, https://doi.org/10.5194/egusphere-egu23-13446, 2023.

EGU23-13499 | ECS | Posters on site | HS5.14

Have roofs in Berlin become greener? Evaluation of Berlin's green roof subsidy program performance using geodata and deep learning 

Siling Chen, Margaux Antonia Huth, and Andrea Cominola

Green roofs are one of the most widely applied blue-green infrastructure in urban regions to serve several purposes moving towards climate change mitigation and urban adaptation. Their large-scale adoption is critical in enhancing resilience against urban hazards, such as urban flooding, urban heat island effects, and biodiversity loss. Currently, the most popular policy format to encourage their roll-out is subsidy programs. However, the success of such programs is oftentimes evaluated based on siloed governmental data, local evaluation reports, and non-recurrent monitoring campaigns, which may become inconsistent and incomparable across temporal scales and different geographical regions. Due to the lack of open data, complementary metadata, and standard quantitative evaluation tools, monitoring and consistently comparing the effectiveness of different green roof incentivization policies is a challenge in practice. This lack of data and high cost of frequent large-scale monitoring campaigns also hinders city-wide spatial distribution analysis of green roofs and identification of green roof development potential, which could support policymakers in devising effective and sustainable urban management strategies.

Moving towards an automated frequent monitoring of green roof development, previous work by Wu and Biljecki developed “Roofpedia”, an open-source deep learning algorithm for green roof mapping and urban sustainability evaluation using satellite imagery. In this work, we validate Roofpedia and evaluate its accuracy in automatically identifying and classifying green roofs from satellite images with public ground truth data in Berlin, Germany. Furthermore, we develop a Berlin-based case study where Roofpedia is applied using geospatial data across temporal scales to assess the efficacy of Berlin’s green roofing subsidy program "GründachPLUS", which has provided 2.7 Million Euros of funding for green roof construction since 2019. We first retrieve open-access orthoimagery data, then extract green roof coverages in Berlin across two temporal steps (i.e., before and after subsidy program instigation), and finally evaluate how effectively and promptly the subsidy program fostered the development of green roofs. This study contributes a Machine Learning-based add-on to the current evaluation protocol of the Berlin municipality, which is implemented via threshold-based spectral analysis. We analyze the spatial distribution of green roofs and provide insights into further green roof potentials in the city of Berlin, by identifying interesting hotspots for future green roof development. Upon imagery availability, this automated assessment may be extended to multiple cities to enable comparative studies of various green roofing incentivization policies and offer a transferrable and scalable policy evaluation framework.

How to cite: Chen, S., Huth, M. A., and Cominola, A.: Have roofs in Berlin become greener? Evaluation of Berlin's green roof subsidy program performance using geodata and deep learning, EGU General Assembly 2023, Vienna, Austria, 23–28 Apr 2023, EGU23-13499, https://doi.org/10.5194/egusphere-egu23-13499, 2023.

EGU23-13613 | ECS | Posters on site | HS5.14

The role of urban trees in water cycle restoration 

Giacomo Marrazzo and Anita Raimondi

Urban development leads to an increment of impervious cover that drastically reduces infiltration rates and increases the risk of stormwater floods, also reinforced by the rise of extreme events due to climate change.

In this context, urban trees represent a valid system for sustainable stormwater management. They decrease the runoff discharged in the sewer network and/or in the receiving water bodies.

Trees impact the hydrological cycle through the processes of interception, evapotranspiration and infiltration strictly depending on several factors such as tree features, soils properties, climate, and storm event characteristics.

The objective of the study is to propose an analytical-probabilistic approach to model the contribution of urban trees to the restoration of the water cycle, with particular focus on the evapotranspiration component.

How to cite: Marrazzo, G. and Raimondi, A.: The role of urban trees in water cycle restoration, EGU General Assembly 2023, Vienna, Austria, 23–28 Apr 2023, EGU23-13613, https://doi.org/10.5194/egusphere-egu23-13613, 2023.

EGU23-14713 | Posters on site | HS5.14

Investigation of thermal cooling potential of Permeable Paving at an urban trial site in London, UK 

Adrian Butler, Thomas Rowan, and Athanasios Paschalis

The built environment is being forced to adapt to rising global temperatures and severe weather events such as more intense storms, longer heatwaves etc. The proliferation of impermeable surfaces has over time led to many urban design problems, such as storm surges overwhelming sewers. Increasing urban temperatures are also caused by the built environment, the Urban Heat Island (UHI) effect. These impacts can be tackled through better infrastructure. Permeable paving offers an alternative to many impermeable surfaces, providing a robust surface with the advantage of drainage. Its ability to mitigate heat, however, remains poorly understood.

To address this, a detailed performance evaluation of two permeable paving pads, one a control and the other actively (mains supply) and passively (rainwater retention) watered, was undertaken. The 16 m2 permeable paving pads were installed at Imperial College London’s White City campus (London, UK) and monitored over 4 months (July to October 2021). The pads were bounded by a raised impermeable barrier and consisted of a block layer with foundations of grit underneath. Both pads were placed on a slope enabling them to be drained, a weir prevented flooding and a tap allowed for complete drainage. The pads were instrumented with internal heat and water content sensors, as well as surface thermal sensing, and a dedicated weather station. Several artificial wetting events were conducted during the summer of 2021 alongside controlled laboratory work. A significant cooling effect was found (average of 1, and up to 5 of cooling), which was around half that computed for well-watered green space. It was found that the evaporation rate of the wetted pad was dependent on the degree of saturation, with the greatest heat loss efficiency occurring when the grit layer was partially saturated. A variety of secondary observations were also made, including issues around water fouling, and porous bricks. Whilst permeable paving can assist with flood alleviation, is it hoped, through minor design modifications, that it can also help tackle extreme urban heat impacts.

How to cite: Butler, A., Rowan, T., and Paschalis, A.: Investigation of thermal cooling potential of Permeable Paving at an urban trial site in London, UK, EGU General Assembly 2023, Vienna, Austria, 23–28 Apr 2023, EGU23-14713, https://doi.org/10.5194/egusphere-egu23-14713, 2023.

EGU23-15672 | ECS | Orals | HS5.14

The effect of Nature Based Willow system deployment at a catchment scale for flood control 

Arunima Sarkar Basu and Laurence Gill

Extreme hydro-meteorological events have caused massive devastations in European territories. The rising frequency and severity of hydro-meteorological events such as floods appear to be associated with climate change and land cover change. Flooding can be broadly classified into three types, fluvial flooding, pluvial flooding and coastal flooding. Fluvial flooding occurs when rivers and streams break their banks and water flows out onto the adjacent low-lying areas (the natural floodplains). Many factors are responsible in understanding the impact of rainfall events to fluvial flooding. The factors are size and slope of catchment, permeability of the soil, urbanization and soil compaction, presence of dams upstream to the floodplain and degree to which water can be stored in the dam and the rate of water release.

Pluvial flooding occurs when the amount of precipitation received exceeds the capacity of storm water drainage systems or the capacity of ground to absorb it.

Due to urbanization process, the surface cover of the land alters leading to increasing impervious areas and decreasing infiltration of the soil

The main focus of the research is to understand the effect of willow plantation at a catchment scale for improving pervious areas for flood control. Willow plants have shown high rate of evapotranspiration and improved infiltration. Willow based systems are used to understand the improvement in the rate of evapotranspiration and infiltration in the presence of appropriate climate and representative soil conditions in Ireland.

The willow systems are being monitored in the western, eastern and northern catchments in Ireland which are regulating the evapotranspiration and also the rate of infiltration at a catchment scale. A statistical rainfall runoff model has been deployed to understand the rainfall-runoff relationship. The evapotranspiration has been estimated based on the Penman–Monteith equation, which requires values of mean temperature, wind speed, relative humidity and solar radiation at daily scale. An inter-comparison for rainfall-runoff relationship is made for estimating the percentage change for improvement in runoff in the presence and absence of the willow plantations.

How to cite: Sarkar Basu, A. and Gill, L.: The effect of Nature Based Willow system deployment at a catchment scale for flood control, EGU General Assembly 2023, Vienna, Austria, 23–28 Apr 2023, EGU23-15672, https://doi.org/10.5194/egusphere-egu23-15672, 2023.

EGU23-15822 | ECS | Posters virtual | HS5.14

Sludge valorisation to obtain high quality water from WWTP 

Nuria Oliver, Miguel Año, Pura Almenar, Angela Baeza, Carmen Hernández-Crespo, and Miguel Martín

In the face of insufficient water resources and the intensification of extreme events caused by climate change, the generation of non-conventional water sources is an option that should become a priority. Wastewater treated is a water resource that with proper post-treatment can be suitable for maintaining the environmental quality of rivers and wetlands or be used for productive activities such as agricultural uses.

Returning water to the environment in similar conditions to its original state is vital to promote its reuse and to help maintain biodiversity. In this sense, the project Integrating circular economy and biodiversity in sustainable water treatments based on constructed wetlands LIFE RENATURWAT aims to demonstrate that it is possible to obtain high quality water from Waste Water Treatment Plants (WWTP) effluents by combining Nature-Based Solutions (NBS) and industrial wastes.

One of the disruptive issues of this project is exactly the use of a waste generated in the integral water cycle itself, concretely during the production of drinking water, to produce quality water from WWTP. This sludge (DWTS) has inert and non-toxic properties, so usually is disposed in landfills, not taking profit of the economic and environmental benefits derived from its valorisation. Nevertheless, the DWTS has adsorbent capacities due to the coagulant used in the drinking water treatment process.

LIFE RENATURWAT plans to use the DWTS as an active substrate in constructed wetlands (CWs) aimed at upgrading treated urban wastewater. This sludge is dewatered and milled to obtain a grain size similar to sand. The DWTS reinforces the wetland technology so that it can be more efficient and can efficiently remove phosphorus and other pollutants at the same time as generating a habitat in itself.

The solution includes two kinds of CWs operating in series. The first is a vertical subsurface flow constructed wetland with DWTS as a filter medium and the second one is a free water surface constructed wetland. The described system is able to remove phosphorus from wastewater even at very low concentrations, achieving an average total phosphorus concentration in the effluent below than 0.1 mgP/l. This is considerably lower than the legal limit set by Directive 91/271/EEC, UWWTD (1 or 2 mg P/l), as well as the so-called sensitive area 0.6 mg P/l. In this way, a wastewater effluent with a very low phosphorus concentration is obtained, without additional consumption of reagents, addressing one of the main problems faced by WWTP managers, which is the eutrophication of the natural environment and compliance with phosphorus discharge limits. Within the framework of this project, two pilot projects have been implemented, one in the Valencian town of Carrícola, and the other in the Los Monasterios urbanisation (Puçol).

How to cite: Oliver, N., Año, M., Almenar, P., Baeza, A., Hernández-Crespo, C., and Martín, M.: Sludge valorisation to obtain high quality water from WWTP, EGU General Assembly 2023, Vienna, Austria, 23–28 Apr 2023, EGU23-15822, https://doi.org/10.5194/egusphere-egu23-15822, 2023.

Unprecedented famine and rocketing food prices are expected to grow as the emerging shocks continue to reshape our world. Lying at the interface of the resource nexus, the agri-food systems are identified as a primary consumer of global freshwater resources and the main contributor to food security. As a result of external shocks, limitations on human activities have resulted in unexpected disturbances in the global agri-food chain, decreasing the functionality and efficiency of agri-food systems and raising the alarm for a need to transform our food systems. Candidating Peri-urban Green Belts as agents of transformation, this research investigates the potential of adding decentralized and coupled Citizen Science and Nature-Based Sanitation Solutions (CS-NBSS) to cause a transformation in urban and peri-urban contexts. Utilizing existing knowledge from researchers and practitioners in the field, alternative NBSs have been identified which interconnect the WASH sector to the food sector, e.g., evapotranspiration tanks (TEvap). We hypothesize that adding such systems to the existing grey infrastructure can increase food and urban resilience and promote marginalized communities' participation in urban governance. CS and NBS have been prominently highlighted in literature due to their merits in constructing and promoting sustainable attitudes and contexts, causing the underlying systems to behave sustainably. Considering the vital role of governance in steering the technical, economic, social, and environmental dimensions of transformation, a critical question remains on how to go beyond existing public policy research on the participation variable. Current research primarily emphasizes ‘what is (status quo) and what needs to be’ rather than proposing methodological approaches towards the latter. With this objective in mind and focused on the food and WASH sector as primary concerns of peri-urban communities, their local governments, and academia, this project will apply mixed-method research to collaboratively design, implement, monitor, and evaluate CS-NBSS living lab experiences in three case studies, incorporating and assessing the effect of such systems on the participation variable, food, and urban resilience, as well as their potential to cause a transformation.

How to cite: Loghmani Khouzani, S. T.: Peri-Urban Green Belts: Introduction of Decentralized and Coupled Citizen Science and Nature-Based Sanitation Solutions in the Context of Urban Transformation, EGU General Assembly 2023, Vienna, Austria, 23–28 Apr 2023, EGU23-16391, https://doi.org/10.5194/egusphere-egu23-16391, 2023.

EGU23-130 | ECS | Posters on site | HS5.16

Hydrogeological proxies of urban weathered hard rock aquifers in Central Africa: Contribution for a sustainable water management and supply in high populated city 

Enoh Jeanot Fongoh, Helene Celle, Bertil Nlend, Suzanne Ngo Boum-Nkot, Ako Andrew Ako, Frederic Huneau, Nicolas Caillon, and Marie Joseph Ntamak-Nida

Shallow groundwater resources, especially in hard rock environment, constitute an important part of urban water supply in developing countries, appropriate to the low level of economic development. However, increasing urban population and dependence on shallow groundwater systems make it imperative to evaluate the availability and the contamination of these resources, and define new strategies of water exploitation taking into accounts these findings and constrains. This study has been carried out on the shallow groundwaters of Yaounde, central Africa. Based on head slug-in tests, chemical and isotope analyses, we demonstrate the importance of geomorphological and geological settings that constrain hydrogeology, urban occupation and therefore, water exploitation and contamination.  Slug test results show spatial variability of well recovery rates with higher values recorded in the valleys compare to the hills, presenting saturated hydraulic conductivity of 10-6-10-8 m/s. Groundwater evolves from recharge zone as Ca-HCO3 in the hillside lateritic system to discharge zone in the slope/valley colluvium/alluvium system as NaK-NO3. The groundwater composition dominated by silicates/water interaction in the hillside lateritic system, and anthropogenic processes in the slopes and valleys. δ15N and δ18O of nitrates indicates that nitrate pollution of groundwater is mainly from sewage and human waste. Shallow groundwater in the hillside/new urban district and to a lesser extent slopes should therefore be protected and prioritised for usability and sustainability of the resources while ensuring the abstraction of the deeper part of the shallow aquifer in the valley/central districts due to the presence of denitrification. The proposed conceptual scheme for Yaounde can then be used as a guide in the development, exploitation and management of local wells in hard rocks system of Africa.

How to cite: Fongoh, E. J., Celle, H., Nlend, B., Ngo Boum-Nkot, S., Ako, A. A., Huneau, F., Caillon, N., and Ntamak-Nida, M. J.: Hydrogeological proxies of urban weathered hard rock aquifers in Central Africa: Contribution for a sustainable water management and supply in high populated city, EGU General Assembly 2023, Vienna, Austria, 23–28 Apr 2023, EGU23-130, https://doi.org/10.5194/egusphere-egu23-130, 2023.

EGU23-421 | ECS | Posters on site | HS5.16

Global groundwater recharge assessment over the last two decades 

Sara Nazari and Nils Moosdorf

Groundwater is the largest global liquid freshwater source and is vital for providing reliable water resources for growing water consumption. To meet an increasing freshwater demand, the groundwater resources have been excessively exploited, which can cause groundwater depletion and its further consequences, such as land subsidence. Groundwater recharge is a major factor for the sustainable management of groundwater abstraction. One of the most uncertain parts of our knowledge of the global scale hydrological cycle is global groundwater recharge. Yet, measuring groundwater recharge requires detailed knowledge of environmental parameters and is observation-intensive. Therefore, we developed a global groundwater recharge model to analyze global groundwater recharge and estimate its spatial and temporal distribution.

The model is a global hydrology grid-based concept implemented in python with a spatial resolution of 0.1°×0.1° and daily temporal resolution. The model comprises three soil layers: topsoil (root zone), subsoil, and aquifer. It simulates the exchange between topsoil and atmosphere performed by meteorological variables, as well as surface runoff, topsoil recharge, soil layers water volume, subsoil recharge, capillary rise from the subsoil to the topsoil, and groundwater recharge. Meteorological and soil properties data from various sources such as ERA5, IMERG, and SoilGrid250m were gathered to build the model and simulate fluxes. The groundwater recharge model applies the water balance budget concept on each soil layer to simulate the daily cell average fluxes values.

With the implementation of the global groundwater recharge model from 2001 to 2020, each global basin’s groundwater recharge was calculated. It is estimated that the global average groundwater recharge is 150 mm a-1 varying from zero to 1260 mm a-1. Moreover, a linear regression was applied for the decades 2001-2010 and 2011-2020 to evaluate how recharge has changed. An increasing trend in groundwater recharge was identified found in 68% of the world’s basins in the period 2001 to 2010. For the period from 2011 to 2020, this percentage has decreased to 48%. Basins with declining recharge show the opposite trend, comprising 32% of the basins in the first period and 52% in the second.

Global groundwater resources status and the possibility of groundwater shortage can be discovered by applying global groundwater recharge model results. An increasing number of river basins show a decreasing trend of groundwater recharge. These outputs provide insight into uneven global groundwater recharge spatial and temporal distributions and indicate that the groundwater recharge decline in recent years threatens more basins. In addition, the results can be used to identify the regions where groundwater resources are or will be at risk of unsustainability.


How to cite: Nazari, S. and Moosdorf, N.: Global groundwater recharge assessment over the last two decades, EGU General Assembly 2023, Vienna, Austria, 23–28 Apr 2023, EGU23-421, https://doi.org/10.5194/egusphere-egu23-421, 2023.

EGU23-491 | ECS | Orals | HS5.16

Groundwater Quality Assessment and Geochemical Mechanism of Groundwater of Komadugu-Yobe Basin, West Africa 

Abdulrahman Shuaibu, Robert M. Kalin, and Vernon Phoenix

The assessment of groundwater quality and its geochemical mechanism is crucial for the sustainable use and management of groundwater resources in arid and semi-arid regions of developing nations. 120 groundwater samples were collected from the Komadugu-Yobe basin to determine its overall quality and the factors that controls the geochemical mechanisms of the groundwater of the study region. The pH, electrical conductivity (EC), and total dissolved solids (TDS) of the groundwater samples were analysed in situ using a handheld (Model 99720 pH/Conductivity meter). The concentrations of Na+, Ca2+, Mg2+, and K+ were analyzed using ICP-OES, iCAP 6200, Thermo Fisher Scientific while Cl-, F-, SO42-, and NO3- were analysed using Ion Chromatography (Metrohm 850 Professional IC). Moreover, the total Alkalinity and bicarbonate were determined using KONE Aquakem v. 7.2.AQ2 equipment by titrimetric method. The hydrochemical analysis results reveals that less than 10% of the groundwater samples exceeded the maximum permissible limits for Electrical conductivity, total dissolved solids, total hardness, sodium, potassium, calcium, magnesium, chloride, sulfate, and fluoride for drinking purposes as recommended by the world Health Organization (WHO, 2018) standards except for bicarbonate and nitrate. The Gibbs diagrams reveals that rock-weathering/rock water interaction is the dominant mechanism controlling groundwater of the study region. However, the chemical relationships in Piper trilinear plots identified Ca2+-Mg2+- HCO-3 water type predominated the study area constituting about 59% of the groundwater samples collected. The findings of the study are paramount for implementing a sustainable management strategy of groundwater resources in the Komadugu-Yobe basin towards the realization of Goal 6 of sustainable development goals.

Keywords: Groundwater, Komadugu-Yobe basin, Geospatial analysis, Water quality, Rock-water interaction

How to cite: Shuaibu, A., M. Kalin, R., and Phoenix, V.: Groundwater Quality Assessment and Geochemical Mechanism of Groundwater of Komadugu-Yobe Basin, West Africa, EGU General Assembly 2023, Vienna, Austria, 23–28 Apr 2023, EGU23-491, https://doi.org/10.5194/egusphere-egu23-491, 2023.

This research contributes to the protection of members of the West Rand communities from radiological harm emanating from drinking water through the establishment of radionuclide levels in drinking water and the associated health risks of ingestion. The long-standing history of gold mining and processing in the Witwatersrand Basin has resulted in an exponential increase in the amount of radionuclides released into the environment, including the water system. As such, it is paramount to ensure the public and environment are protected from any pollution related to gold mining. The aim of this study was to assess and quantify radionuclide levels in drinking water (groundwater and municipal water) and the health risks associated with the ingestion of the water in residential communities of the West Rand region. Activity concentrations of 238U, 235U, 234U, 232Th, 230Th, 228Th, 228Ra, 226Ra and 224Ra in 22 drinking water samples were determined using alpha spectrometry, which were subsequently used to evaluate the radiological risks related to the ingestion of 238U in the water. The results indicate that groundwaters largely contain elevated activity concentrations of most radionuclides owing to the untreated nature of the water as opposed to the municipal-supplied water. Similarly, annual effective dose and cancer morbidity and mortality risk estimates were found to be higher in groundwater. Annual effective dose estimates in all samples were well below the prescribed limit of 0.1mSv/y, with a range of 0.0237–0.3106 mSv/yr. Cancer morbidity and mortality risk estimates were higher in females than males in all samples due to the higher life expectancy of females. Nevertheless, all morbidity and mortality risk estimates were significantly lower than the prescribed radiological risk limit of 0.001. All sampled drinking water was found to be radiologically safe for human consumption. Based on the findings of this study, continuous monitoring of the drinking water with an emphasis on groundwater should be implemented to ensure that radionuclide levels and associated health risks remain below local and international prescribed regulatory limits.


Keywords: Gold mining, drinking water, radionuclides, annual effective dose, cancer risk

How to cite: Mohuba, S. and Abiye, T.: Assessment of radionuclide levels in drinking water from communities in the West Rand region of the Gauteng Province, South Africa, EGU General Assembly 2023, Vienna, Austria, 23–28 Apr 2023, EGU23-784, https://doi.org/10.5194/egusphere-egu23-784, 2023.

EGU23-880 | ECS | Posters on site | HS5.16

Isotopic Characterisation and Conceptualisation of Linthipe River Basin to underpin Sustainable Groundwater Development and Management 

Limbikani Chitsundi Banda and the Limbikani Chitsundi Banda

The future of Malawi depends on the sustainable development of groundwater resources, and this study provides a detailed stable isotopic-hydrochemical baseline characterisation and conceptualisation of the Linthipe River Basin in the Lake Malawi Basin at the southern extreme of the East Africa Rift System. The Linthipe River Basin is essential for Lilongwe, Malawi's capital city, when it comes to key water supplies. It is also critical to the water supplies for the rural population whose reliance on groundwater resources is predominant. The study flagged groundwater as a potential source of water supply because the key source of water supply in the basin, the Kamuzu Dam along Lilongwe River, is constrained and imperilled by severe catchment degradation among other adverse factors. Sustainable groundwater resource development and management require proper monitoring and assessment, and isotope hydrology is a valuable tool for conducting comprehensive groundwater monitoring and assessment. The study showed the usefulness of isotope hydrology as an effective tool for examining groundwater conditions, its seasonal variations over time, its interactions with surface water, and its replenishment. The study also showed that isotope hydrology is a good way to look at the saltiness of groundwater and other chemical contaminants, considering that high salinity and other chemical contaminants limit and threaten its availability and quality, making it harder to reach the Sustainable Development Goals (SGDs). The study demonstrated how an understanding of the relationship between the stable isotopic composition of groundwater and surface water is crucial for the development of a conceptual model in a hydrologically complex river basin The study developed a stable isotopic-hydrochemical signature conceptual model that has the potential to shed new light on the most pressing issues in Integrated Water Resources Management (IWRM) systems in Malawi. The hydraulic complexity of the groundwater and surface water interactions revealed by the study is critical to IWRM and warrants high-resolution studies, for which the use of isotopic tools plays a critical role in tracking SDG 6 targets. The stable isotopic-hydrochemical baselines developed will improve the forensic study of potential future consequences stemming from environmental drivers like land development, climate change, and water mixing, all of which influence IWRM systems. Hence, the study valuably contributes to Malawi’s drive of achieving SDG 6 by 2030.

Key references:

  • Monjerezi, M.; Vogt, R.D.; Aagaard, P.; Saka, J.D.K. Using δ87Sr/δ86Sr, δ18O and δ2H isotope data along with major chemistry composition to assess groundwater salinization in lower Shire River Valley, Appl. Geochem. 2011, 26, 2201–2214. [CrossRef]
  • Chavula, G.M.S. Malawi. In Groundwater Availability and Use in Sub-Saharan Africa: A Review of Fifteen Countries; Pavelic, P., Giordano, M., Keraita, B., Ramesh, V., Rao, T., Eds.; International Water Management Institute: Colombo, Sri Lanka, 2012; Available online: http://www.iwmi.cgiar.org/Publications/Books/PDF/ groundwater_availability_and_use_in_sub-saharan_africa_a_review_of_15_countries.pdf (accessed on 15 October 2019).
  • Rivett, M.O.; Robinson, H.L.; Wild, L.M.; Melville, J.; McGrath, L.; Phiri, P.; Flink, J.; Wanangwa, G.J.; Mleta, P.; MacLeod, S.S.P.; et al. Arsenic occurrence in Malawi groundwater. J. Appl. Sci. Environ. Manag. 2018, 22, 1807–1816. [CrossRef]

How to cite: Chitsundi Banda, L. and the Limbikani Chitsundi Banda: Isotopic Characterisation and Conceptualisation of Linthipe River Basin to underpin Sustainable Groundwater Development and Management, EGU General Assembly 2023, Vienna, Austria, 23–28 Apr 2023, EGU23-880, https://doi.org/10.5194/egusphere-egu23-880, 2023.

EGU23-891 | ECS | Orals | HS5.16

Triggering social accountability for failed groundwater supply infrastructure in rural Malawi: Chiradzulu case study 

Steve Kumwenda, Muthi Nhlema, Given Ngwira, Peter Banda, and Tony Nyasulu

Key Words: Groundwater Infrastructure, Functionality, Accountability, Right to water

The Malawi 2018 Sector Performance Report produced by the Ministry of Water and Sanitation found that the proportion of people with access to safe water in the country was 86%, with 57% of improved water points in rural areas being boreholes with hand-pumps. However, a persistent sustainability challenge plagues the water sector: for over 20 years, the functionality of improved water points has remained between 69% and 77%. A study on borehole forensics conducted by the CJF programme found that 30% of hand-pumps fail within five years of installation.

Over the past decade hand pump non-functionality has been attributed to poor community ownership and lack of responsibility to manage the operation and maintenance of the wells. However, in some cases this has been merely hypothetical as the non-functionality of some boreholes has been due to factors that are beyond what communities can manage in terms of operation and maintenance.

BASEflow with support from the Scottish Government conducted Borehole Forensics, which is a detailed investigation of a borehole and hand pump performance.  Twenty one (21) boreholes were technically assessed and out of these, 13 were found to have unacceptable low yield as per the required Government constant pumping rate test standard of 0.25 liters per second for not less than 4 hours. The failure of the 13 boreholes indicate that the boreholes were developed and constructed to completion and handed over to users when they did not have enough water to meet the required standards.

These findings were shared with the relevant stakeholders at Community, District and National level. One major policy recommendation at National level is for the need for adherence to water infrastructure construction standards and the need to empower citizens of rights to water and to hold service providers accountable for failed groundwater supply infrastructure.

How to cite: Kumwenda, S., Nhlema, M., Ngwira, G., Banda, P., and Nyasulu, T.: Triggering social accountability for failed groundwater supply infrastructure in rural Malawi: Chiradzulu case study, EGU General Assembly 2023, Vienna, Austria, 23–28 Apr 2023, EGU23-891, https://doi.org/10.5194/egusphere-egu23-891, 2023.

EGU23-2090 | ECS | Orals | HS5.16

A DSS for the dynamical assessment and mapping of the groundwater vulnerability: the pesticide and the nitrate fate tools   

Marialaura Bancheri, Marco Acutis, Marco Botta, Francesco Fusco, Giuliano Langella, Daniele Lezzi, Alessia Perego, and Angelo Basile

This work presents two web-based, freely-available dynamical tools for the assessment and the mapping of the groundwater vulnerability to both pesticides and nitrate, within the geospatial Decision Support system (s-DSS) LandSupport (www.landsupport.eu).

The pesticide fate tool simulates the transport of reactive solutes, i.e., pesticides, and maps the percentage of pollutant mass that reaches the groundwater depth within a user defined time-interval. The tool is based on the extended transfer function model (TFM-ext) and its main inputs are: the soil and, eventually, the vadose zone physical and hydrological properties, the climate, the groundwater table depth, the investigated crop and its management (sowing and harvesting dates, pesticides doses and time of application).

The nitrate fate tool simulates the crop growth dynamics and assess the transport of nitrate through the unsaturated zone till the groundwater table depth. The output maps represent the number of years for the arrival to the groundwater of the 50% of the mass of nitrate leachate from the root zone. The tool is based on the coupling of the dynamical crop-growth ARMOSA model and of the TFM-ext model and its main inputs are: the type of crop and/or crop-rotation and related managements (tillage, irrigation, fertilization and residues), the soil physical and hydrological properties, the climate and the groundwater table depth.

Eventually, both tools were extended using the COMPSs programming framework that allows to parallelize the execution of multiple model runs.

The work presents the implementations of both tools for different case studies across three European regions (Campania Region-IT, Marchfeld Region-AT, Zala County-HU), characterized by different spatial scales, pedo-climatic conditions and land-use, showing some examples of applications in support of local farmers, public authorities and environmental planners for the Water, Pesticides and Nitrate Directive applications.

How to cite: Bancheri, M., Acutis, M., Botta, M., Fusco, F., Langella, G., Lezzi, D., Perego, A., and Basile, A.: A DSS for the dynamical assessment and mapping of the groundwater vulnerability: the pesticide and the nitrate fate tools  , EGU General Assembly 2023, Vienna, Austria, 23–28 Apr 2023, EGU23-2090, https://doi.org/10.5194/egusphere-egu23-2090, 2023.

Insufficient and fragmented management of TBAs might affect sustainable development both within and beyond a country's borders. There are several examples worldwide of disagreements over whether a certain infrastructure scheme planned by one riparian country would have negative impacts on a riparian state. Transborder cooperation and knowledge of transboundary aquifers (TBAs) has evolved through an inventory under the convention on the protection and use of transboundary watercourses and international lakes (Water Convention) from 1992. Within EU countries, the Water Framework Directive (WFD), 2000/60/EC, intends to contribute to achieve the objectives of the Water Convention. The national groundwater management systems in Norway and Sweden and their implementation of the WFD has been studied as a case area. Emphasis has been placed on international river basin districts (IRBD) and transborder cooperation. The findings offer recommendations for authorities and policymakers on how they could improve the long-term management and ensuring transparent decision-making of transboundary groundwater management.

In Norway and Sweden, TBAs play a minor role in supplying freshwater resources and sustaining socio-economic development in transborder areas. The analysis shows that surface water overrules ‘the invisible’ groundwater. The study highlights several factors that need to be addressed. First, the Norwegian national water management systems are fragmented and over-complex, which complicates national and transnational cooperation. Second, Swedish legislation must be revised to meet the requirements of the WFD regarding IRBD delineation. Finally, transborder dialogue and joint projects on groundwater mapping are necessary for mobilising resources and the necessary political support to obtain knowledge on TBAs.

More information on the study preformed through funding from the EEA and Norway Grants Fund for Regional Cooperation can be achieved from Flem at al., (2022).

Acknowledgements:

This study has been done within project No.2018-1-0137 “EU-WATERRES: EU-integrated management system of cross-border groundwater resources and anthropogenic hazards” which benefits from a € 2.447.761 grant from Iceland, Liechtenstein and Norway through the EEA and Norway Grants Fund for Regional Cooperation. The aim of the project is to promote coordinated management and integrated protection of transboundary groundwater by creating a geoinformation platform.

References:

Flem, B., Stalsberg, L., Seither, A., 2022. Groundwater governance in international river basins - An analysis of the Norwegian-Swedish transborder area. J. Hydrol. Reg. Stud, 44, 2022, 101216. https://doi.org/10.1016/j.ejrh.2022.101216

How to cite: Flem, B. and Stalsberg, L.: International River Basin Planning Under the Water Framework Directive and the SDG indicator 6.5.2 – Case area: Norway - Sweden, EGU General Assembly 2023, Vienna, Austria, 23–28 Apr 2023, EGU23-2342, https://doi.org/10.5194/egusphere-egu23-2342, 2023.

EGU23-2565 | Orals | HS5.16

Why do our models underestimate regional groundwater trends? 

Gunnar Lischeid and Jörg Steidl

In the course of climate change serious effects on groundwater resources are expected. Future groundwater recharge is usually assessed via hydrological models. Various studies have shown that most models fail in depicting pronounced trends observed in groundwater monitoring data at regional scales. Likewise, global hydrological models seem to systematically underestimate the low-frequency dynamics of regional water storages in the GRACE mission data (Scanlon et al. 2018) or long-lasting memory effects in terms of discharge (Fowler et al. 2022). Thus groundwater recharge modelling appears to have some fundamental problems that go far beyond the usual model uncertainties in each individual case.

This was systematically investigated. The empirical basis was given by the analysis of groundwater data of the authorities’ monitoring networks in Northeast Germany, covering an area of more than 50,000 km2. About 240 long-term time series of groundwater head and lake water level were studied. It could be shown that at weekly or monthly time scales lake water level dynamics very closely mimicked that of the adjacent groundwater body.

A very close correlation between the direction and strength of the trends and the degree of damping of the signal of groundwater recharge was found. The probability of long-term trends systematically increased with the thickness of the vadose zone. This indicates the crucial role of long-term accumulation of soil moisture deficits in the deeper unsaturated zone.

In contrast, models of groundwater recharge generally consider only the uppermost soil layers. In addition, modellers usually assume initial steady-state equilibrium conditions and thus ignore long-term memory effects in the subsurface. Simulations with different models clearly showed that this resulted in a systematic underestimation of long-term trends. Finally, it was found that model parameterizations which had been optimized with respect to discharge or topsoil moisture dynamics were not necessarily optimal for the simulation of groundwater recharge. Based on these findings clear recommendations for monitoring and model-based assessment of groundwater recharge will be given.


References:

Scanlon et al. (2018), PNAS, http://ww.pnas.org/cgi/doi/10.1073/pnas.1704665115

Fowler et al. (2022), WRR, https://doi.org/10.1029/2021WR031210

Lischeid et al. (2021), JHyd, https://doi.org/10.1016/j.jhydrol.2021.126096

How to cite: Lischeid, G. and Steidl, J.: Why do our models underestimate regional groundwater trends?, EGU General Assembly 2023, Vienna, Austria, 23–28 Apr 2023, EGU23-2565, https://doi.org/10.5194/egusphere-egu23-2565, 2023.

EGU23-4052 | ECS | Orals | HS5.16

Hyper resolution hydrological modeling: the need and benefit of improving spatial resolutions of global models 

Barry van Jaarsveld, Frances Dunn, Edwin H. Sutanudjaja, Rens van Beek, Marc F. P. Bierkens, and Niko Wanders

If not addressed and remedied, the unsustainable use of non-renewable groundwater will negatively impact many future generations. To effectively manage global groundwater reserves, we first need accurate estimates of its current availability and how much of this we can feasibly extract. Landscape characteristics have a high impact on local groundwater recharge, groundwater-surface water interactions, and abstractions. It is therefore key to model groundwater at an appropriate spatial resolution so that landscape heterogeneities are captured. Our objective is to enable groundwater modelling at fine spatial (~ 1 km) resolution, with the final aim to assess the physical limits of groundwater withdrawal by providing the first global estimates of fresh groundwater availability (attainable volumes and supply) subject to past human water use. The first step to attaining this objective is the ability to simulate groundwater recharge and surface water levels at 1 km spatial resolution using a global hydrological model. In this study, we aim to tackle this challenge and present the first global case of the PCR-GLOBWB at the 1 km spatial resolution. To do this, we implemented a statistical downscaling routine for meteorological forcing, created a new global 1km land surface parameterization and improved the parallelization of the PCR-GLOBWB model. The meteorological downscaling approach followed here provides outputs that are at a finer resolution than the original meteorological forcing products. This approach relies on Worldclim data to provide realistic sub-grid distributions of precipitation and temperature. In addition, sub-grid distributions of potential reference evaporation were retrieved from the Global Aridity Index and Potential Evapotranspiration Climate Database, which uses Worldclim data to calculate potential reference evaporation following the Penman-Monteith formulation.

We investigate whether these high-resolution meteorological fields, in combination with an improved 1km land surface parameterization, provided improved outcomes by validating against remote sensing observations (soil moisture, total water storage) and local observations of discharge and compare these to simulation at coarser 10 & 50km resolutions. Furthermore, we discuss the computational challenges encountered along the way and outline future directions and opportunities in high-resolution groundwater modelling.

How to cite: van Jaarsveld, B., Dunn, F., Sutanudjaja, E. H., van Beek, R., Bierkens, M. F. P., and Wanders, N.: Hyper resolution hydrological modeling: the need and benefit of improving spatial resolutions of global models, EGU General Assembly 2023, Vienna, Austria, 23–28 Apr 2023, EGU23-4052, https://doi.org/10.5194/egusphere-egu23-4052, 2023.

EGU23-6325 | ECS | Posters on site | HS5.16

Continental mapping of groundwater-dependent ecosystems based on a high-resolution global groundwater model 

Nicole G. Otoo, Edwin H. Sutanudjaja, Michelle T.H. van Vliet, Aafke M. Schipper, and Marc F.P. Bierkens

The increase in global population has led to the expansion of water demands for agriculture, domestic and industrial use in areas with limited precipitation and surface water sources, increasing the dependency on groundwater resources. An increase in groundwater pumping combined with low recharge rates has increased the rate of groundwater depletion globally. An increase in water demand alongside a decrease in recharge rates can lead to reductions in groundwater levels and groundwater discharge, which may adversely affect groundwater-dependent ecosystems (GDEs) and their unique biodiversity and ecosystem services.

Mapping and classifying groundwater-dependent ecosystems (GDEs) are key steps for understanding ecosystem-groundwater interactions as well as for optimizing the allocation of groundwater resources. However, manual mapping of GDEs is tedious, especially across large areas. Here, we aim to calibrate and apply a global groundwater model to map and classify GDEs across large extents. Our initial focus is on Australia, which is characterized by a large dependency of ecosystems on groundwater and for which GDE locations have been mapped across the continent, facilitating model calibration and validation.

We use a recently developed high-resolution (30 arc-seconds) global groundwater model GLOBGM hydrology forced with recharge and surface water levels from the global hydrological model PCR-GLOBWB 2, to map three types of GDE, namely aquatic (streams, rivers and lakes), wetlands (fens, marshes and swamps) and terrestrial GDEs (phreatophytes). The model maps all ecosystems that depend on groundwater recharge in a steady state. To validate model output, it is compared to the Australian GDE atlas using a hit rate analysis and a 90% hit rate was found with aquatic GDEs. In the next steps, we seek to quantify the dependency level of these GDEs on groundwater recharge by running the groundwater model in a transient state globally. This assessment is useful for decision-makers in terms of groundwater allocation and biodiversity conservation within high-dependency GDE regions.

How to cite: Otoo, N. G., Sutanudjaja, E. H., van Vliet, M. T. H., Schipper, A. M., and Bierkens, M. F. P.: Continental mapping of groundwater-dependent ecosystems based on a high-resolution global groundwater model, EGU General Assembly 2023, Vienna, Austria, 23–28 Apr 2023, EGU23-6325, https://doi.org/10.5194/egusphere-egu23-6325, 2023.

EGU23-6892 | ECS | Posters on site | HS5.16

Similarities and differences in groundwater responses to droughts across Germany 

Pia Ebeling, Rohini Kumar, Rafael Chávez García Silva, Jan H. Fleckenstein, and Andreas Musolff

Regional groundwater resources are crucial for water supply, maintaining environmental stream flows and the integrity of aquatic ecosystems. At the same time, however, these resources are increasingly threatened by the effects of climate change. More extreme weather conditions like exceptional droughts are expected to increase water stress by increasing water demand and decreasing water availability even in humid regions such as Germany. To identify consistent long-term trends and areas vulnerable to droughts, it is important to characterize and understand similarities and differences in groundwater dynamics across sites. Herein, we analyze groundwater head responses to climatic variability at more than 6500 groundwater wells over the last 30 years in Germany to identify response clusters. Principal component analysis (PCA) revealed that about two-thirds of the observed groundwater level variability across all wells can be explained by five typological time series. These time series represent different response patterns to climatic forcing capturing distinct dampening effects and time lags, with different weights (loadings) being assigned to each groundwater well. The subsequently identified clusters of the wells reveal clear regional structures suggesting underlying spatial controls. In the next step, groundwater drought characteristics (e.g., severity, duration) will be considered and linked to climate and landscape properties. This study may help to understand regional controls and to identify zones vulnerable to groundwater droughts where water supplies are at risk in the long term and mitigation measures are needed.

How to cite: Ebeling, P., Kumar, R., Chávez García Silva, R., Fleckenstein, J. H., and Musolff, A.: Similarities and differences in groundwater responses to droughts across Germany, EGU General Assembly 2023, Vienna, Austria, 23–28 Apr 2023, EGU23-6892, https://doi.org/10.5194/egusphere-egu23-6892, 2023.

EGU23-7947 | ECS | Posters on site | HS5.16

Modeling the water balance of transboundary aquifers for assessing groundwater flow along the Latvia-Estonia national border 

Marlen Hunt, Dāvis Borozdins, Andres Marandi, Magdaleena Männik, Jekaterina Demidko, Krišjānis Valters, Jānis Bikše, Konrāds Popovs, Inga Retiķe, and Liina Hints

Coordinating transboundary aquifer management is becoming increasingly important worldwide to minimize adverse transboundary impacts. Moreover, the global trend of groundwater consumption is increasing, and groundwater abstraction exceeds sustainable limits in many parts of the world. To avoid future international disputes and maximize the rational and equitable use of common transboundary aquifers, it is imperative to accurately and comprehensively assess groundwater resources' development potential in these aquifers.

As part of this study, a transient hydrogeological model using MODFLOW-NWT was developed to assess the changes in groundwater balance and groundwater flow in the transboundary area between Estonia and Latvia in northeast Europe. The model consists of eleven layers that discretize four main aquifers (Quaternary aquifer, Upper-Devonian aquifer, Upper-Middle-Devonian aquifer, and Lower-Middle-Devonian-Silurian aquifer) and represents an area of 45 000 km2. The cell size of the model varies from 0.25 to 1.00 km. The model was used to simulate three scenarios: (1) the base case scenario, which involved no abstraction, (2) the current abstraction, and (3) the maximum abstraction allowed. A detailed water balance for eight transboundary groundwater bodies for all three scenarios was calculated to assess water balance changes and groundwater flow along the national border.

Model results indicate that the groundwater balance between groundwater bodies remained the same in Simulations 1 (base case scenario) and 2 (current water extraction), which indicates that the existing water extraction in the territory does not significantly affect the transboundary groundwater flow. Some minor changes were observed in Simulation 3 (maximum water abstraction rates), mostly in the Upper-Devonian groundwater bodies. However, significant changes in cross-border groundwater flow patterns were not expected even with the maximum possible water abstraction.

The study has been founded by Iceland, Liechtenstein and Norway through the EEA and Norway Grants Fund for Regional Cooperation project No.2018-1-0137 “EU-WATERRES: EU-integrated management system of cross-border groundwater resources and anthropogenic hazards”.

How to cite: Hunt, M., Borozdins, D., Marandi, A., Männik, M., Demidko, J., Valters, K., Bikše, J., Popovs, K., Retiķe, I., and Hints, L.: Modeling the water balance of transboundary aquifers for assessing groundwater flow along the Latvia-Estonia national border, EGU General Assembly 2023, Vienna, Austria, 23–28 Apr 2023, EGU23-7947, https://doi.org/10.5194/egusphere-egu23-7947, 2023.

EGU23-8380 | ECS | Orals | HS5.16

Mountain Block and Front Recharge to the aquifers in sedimentary basins in Kazakhstan: evidence from geothermal studies and water isotopes 

Vadim Yapiyev, Ashirgul Kozhagulova, Leila Karabayanova, Aisulu Kalitova, Vyacheslav Zavaley, Antoine Dillinger, Ayana Karakozhayeva, John Holbrook, Saken Kurbaniyazov, Nurlan Ongdas, Catalin Stefan, and Milovan Fustic

The mountains often “subsidize” water resources to lowlands in arid and semi-arid regions. In the case of Central Asia (CA), the mountain cryosphere is the “water tower” for the population residing in the intermountain valleys and lowland plains. Much of the water research in CA is focused on surface water provision by mountain glaciers and snow such as rivers, lakes, and reservoirs, whilst groundwater recharge is much less investigated. The preliminary hydrogeologic models of deep (up to 3km) groundwater recharge for sedimentary basins (southern Kazakhstan) in the upper Ily and lower Syr Darya river valleys are derived from interpretations of stable isotopes of oxygen, hydrogen, and tritium. The results show that in these basins groundwater at different depths (both shallow and deep) bears depleted abundance of heavy stable-isotope species indicative of winter precipitation (snow). In Ily basin (Zharkent depression) the proportion of snow(melt) contribution increases with depth with water from very deep geothermal wells (~3000 m, the upper cretaceous aquifer) being more isotopically depleted compared to shallower geothermal wells (i.e. depths up to 650m) and shallow groundwaters. Additionally, formation water in the deep geothermal wells (Zharkent area) had no detectible tritium (< 0.71 TU) pointing to an absence of modern recharge (within the past ~ 70 years). Geothermal water from wells (shallow ground water and depth of ~ 1200 m) and a spring in the lower Syr Darya river and the North Aral area, also shows deleted stable water isotope imprints suggesting strong winter recharge contributions. This is surprising as the Aral Sea depression has very low precipitation (less than 200 mm/year) and very little snowfall. These isotope data suggest regional aquifers are recharged primarily by lateral groundwater flows via deep flow paths from mountain regions. This is further corroborated by low salinity (< 1 g/l) of most deep geothermal water samples pointing to dilution by snowmelt. We suggest the aquifers in these CA regions may be replenished mostly by Mountain Block and/or Front recharge mechanisms, but this hypothesis requires further investigation.

How to cite: Yapiyev, V., Kozhagulova, A., Karabayanova, L., Kalitova, A., Zavaley, V., Dillinger, A., Karakozhayeva, A., Holbrook, J., Kurbaniyazov, S., Ongdas, N., Stefan, C., and Fustic, M.: Mountain Block and Front Recharge to the aquifers in sedimentary basins in Kazakhstan: evidence from geothermal studies and water isotopes, EGU General Assembly 2023, Vienna, Austria, 23–28 Apr 2023, EGU23-8380, https://doi.org/10.5194/egusphere-egu23-8380, 2023.

EGU23-8930 | ECS | Orals | HS5.16 | Highlight

Global groundwater archetypes: a new typology of groundwater interactions with social and ecological systems and an outlook for sustainable development 

Xander Huggins, Tom Gleeson, Karen G. Villholth, Juan C. Rocha, and James S. Famiglietti

Groundwater resources do not exist in isolation but are deeply connected with social and ecological systems. As humans continue to modify the land surface, drive climate change, and place greater pressures on global freshwater resources, it is increasingly necessary to assess global groundwater resources through their relationships to these coupled systems. While several global classifications of physical groundwater systems exist, there is no data-driven global typology based on groundwater interactions with connected social and ecological systems. Though physical attributes remain hydrogeologically important, a more expansive systems-oriented classification is needed for policy development, applied research, and to develop the next generation of global hydrological models.

We fill this gap by producing a spatially-explicit, moderate resolution (5 arcminute) global map of groundwater system archetypes based on groundwater interactions with social and ecological systems. These include interactions with streamflow, ecosystems, climate, agriculture, the economy, and water governance and management, all underpinned by existing global data. Archetypes, each with a unique set of interaction strengths and combinations, form a finite set of characteristic “fingerprints” that represent the dominant modes of interactions between groundwater and connected social and ecological systems. We find all WHYMAP large aquifer systems of the world are characterized by multiple social-ecological archetypes, suggesting that differentiated, context-appropriate approaches are necessary within large aquifers that are often assumed as uniform in global assessments and initiatives.

We derive archetypes using multiple clustering algorithms and assign archetype membership based on majority agreement across clustering methods after cluster reclassification to create comparable maps. This multiple-method approach renders the archetypes more robust and less contingent on a single clustering algorithm while simultaneously enabling greater representation of archetype uncertainty.

We additionally provide an outlook on sustainable development opportunities and challenges for each archetype. We summarize data sets that represent notable social-ecological outcomes  related to the UN Sustainable Development Goals (SDGs), including: crop yield gaps (SDG 2), remotely sensed groundwater storage trends (SDG 6), economic inequality (SDG 10), human modification of terrestrial systems (SDG 15), and likelihood for hydropolitical interaction (SDG 16), among others. 

This work provides a number of useful contributions. First, the combination of archetyping (i.e., system characterization) and archetype-specific SDG outlook analysis provides a robust, data-driven overview of the role of groundwater in the global sustainability discourse. Secondly, the archetypes identify social-ecological system similarities across the globe, which may support interregional cooperation and networking, coordinated investment and interventions. Thirdly, as we harness the rapid growth in global data that document groundwater system interactions as the basis for our analysis, we simultaneously provide a synthesis and snapshot of the pertinent global data space. This snapshot can be used to identify the need for further data collection, especially on socio-economic interactions that remain underrepresented in global data. And finally, the archetypes raise awareness, build capacity, and shift mental models about the emerging perspective that it is necessary to conceptualize groundwater as a socially and ecologically connected resource.

How to cite: Huggins, X., Gleeson, T., Villholth, K. G., Rocha, J. C., and Famiglietti, J. S.: Global groundwater archetypes: a new typology of groundwater interactions with social and ecological systems and an outlook for sustainable development, EGU General Assembly 2023, Vienna, Austria, 23–28 Apr 2023, EGU23-8930, https://doi.org/10.5194/egusphere-egu23-8930, 2023.

EGU23-9452 | Orals | HS5.16

Global hydro(geo)logical modeling: are we missing an uncanny valley? 

Nils Moosdorf, Robert Reinecke, and Kevin Befus

The spatial and temporal resolution of global-scale hydrological modeling has enormously increased in recent years. Outputs are becoming available at spatial resolutions of 1x1 km, showing regional structures and changes, often in beautiful figures and large datasets covering the entire globe. The complexity of the underlying models has increased in parallel, as did the amount of input data. Model outputs start more and more to look like the actual planet.

If humanoids start to look more and more like actual humans, an adverse emotional reaction can be seen in humans. In robotics and other disciplines, the term “uncanny valley” was coined for this phenomenon of the creepy impression that humanoids that are too human-like leave on humans.

The increasing resolution of global hydro (geo)logical modeling outputs is partly mirrored by the increasing resolution of input data, e.g., satellite-derived climate data or vegetation information. However, input data based on in-situ observations can remain limited in resolution and remain highly uncertain. In addition, higher resolution models do not necessarily entail that our process understanding has improved. Here, we review and analyze the primary input data of global hydro(geo)logical models, identify critical datasets and discuss the implications of the reliance on these datasets for modern hydro(geo)logical model results. Moreover, we discuss if results that look more and more like the real planet should lead to skepticism in their interpretation similar to the emotional reaction to the uncanny valley in robotics.  

How to cite: Moosdorf, N., Reinecke, R., and Befus, K.: Global hydro(geo)logical modeling: are we missing an uncanny valley?, EGU General Assembly 2023, Vienna, Austria, 23–28 Apr 2023, EGU23-9452, https://doi.org/10.5194/egusphere-egu23-9452, 2023.

EGU23-10289 | ECS | Orals | HS5.16

G3P: A global data set of groundwater storage variations based on satellite gravimetry 

Ehsan Sharifi, Andreas Güntner, Julian Haas, Wouter Dorigo, Adrian Jäggi, and Claudia Ruz Vargas and the G3P team

The Global Gravity-based Groundwater Product (G3P) developed a satellite-based groundwater storage anomaly (GWSA) data set as a prototype for a future product within the EU Copernicus Climate Change Service. As the world’s largest distributed freshwater storage, GW is a key resource for mankind, industrial, and agricultural demands. In Copernicus, there is no service available yet to deliver data on this fundamental resource, nor is there any other data source worldwide that operationally provides information on changing groundwater resources in a consistent way, observation-based, and with global coverage. Therefore, G3P developed the global data set of groundwater storage variations as a cross-cutting extension of the existing Copernicus portfolio. G3P capitalizes from the unique capability of GRACE and GRACE-FO satellite gravimetry as the only remote sensing technology to monitor subsurface mass variations, and from other satellite-based water storage products to provide a data set of groundwater storage change for large areas with global coverage. G3P is obtained by using a mass balance approach, i.e., by subtracting satellite-based water storage compartments (WSCs) such as snow water equivalent, root-zone soil moisture, glacier mass, and surface water storage from GRACE/GRACE-FO monthly terrestrial water storage anomalies (TWSA). For a consistent subtraction of all individual WSCs from GRACE-TWSA, the individual WSCs are filtered in a similar way as GRACE-TWSA, where optimal filter types were derived by analyses of spatial correlation patterns. G3P groundwater variations are provided for almost two decades (from 2002 to 2020), with a monthly resolution, and at a 0.5-degree spatial resolution globally.

In this contribution, we also illustrate selected results of the G3P-based GWSA data set, including the global trends of groundwater storage and the uncertainties of the GWSA data as well as of the contributing storage compartments. The GWSA is also evaluated against in-situ groundwater observations, using 13 large aquifers worldwide with available in-situ groundwater observations. Results show a high correlation between the variations of in-situ groundwater data and G3P-based GWSA for most of the aquifers, such as the Ogallala aquifer, Floridan aquifer, Paris Basin, South of Outer Himalayas aquifer.

This study has received funding from the European Union’s Horizon 2020 research and innovation programme for G3P (Global Gravity-based Groundwater Product) under grant agreement nº 870353.

How to cite: Sharifi, E., Güntner, A., Haas, J., Dorigo, W., Jäggi, A., and Ruz Vargas, C. and the G3P team: G3P: A global data set of groundwater storage variations based on satellite gravimetry, EGU General Assembly 2023, Vienna, Austria, 23–28 Apr 2023, EGU23-10289, https://doi.org/10.5194/egusphere-egu23-10289, 2023.

EGU23-11454 | Orals | HS5.16 | HS Division Outstanding Early Career Scientist Award Lecture

Groundwater availability and sustainability 

Inge de Graaf

Groundwater is het largest available freshwater resource on earth and is critical to humans and the environment. Groundwater is especially important for irrigated agriculture, and thus for global crop production and food security; approximately 40% of the today’s irrigated agriculture depends on groundwater. In many regions around the world, unsustainable groundwater pumping exceeds recharge from precipitation and rivers. This leads to substantial drops in groundwater levels and losses of groundwater from its storage, especially in intensively irrigated regions, as well as reduction of river flows with possible devastating impacts on freshwater ecosystems.

In my research I simulate groundwater flows and groundwater surface water interactions globally, using a high resolution coupled groundwater and surface water model, and study the impacts of groundwater pumping from the recent past until the far future. In this talk I will present recent findings on current and projected impacts of groundwater pumping on river flows, including an estimate where and when environmentally critical thresholds for groundwater discharge are reached. Second, I will present novel developments and future research steps me and my team will take towards estimating global groundwater availability that can be sustainably exploited and the trade-off between sustainable groundwater use and crop production.

How to cite: de Graaf, I.: Groundwater availability and sustainability, EGU General Assembly 2023, Vienna, Austria, 23–28 Apr 2023, EGU23-11454, https://doi.org/10.5194/egusphere-egu23-11454, 2023.

EGU23-11510 | ECS | Posters on site | HS5.16

Impact of groundwater pumping on river flow 

Inge de Graaf

In many regions of the world more groundwater is used than recharged by precipitation or infiltrating river water. While overuse of groundwater can have a variety of undesirable effects, among the most immediate and visible effects are reduction of river flows and the impact on freshwater ecosystems can be devastating.

In an alluvial aquifer, groundwater pumping can reduce the flow of water in a river in two ways: 1) pumping can intercept water that would otherwise discharge into the river; 2) pumping draws groundwater levels down below the level of the river and river water will infiltrate. In this study the impacts of groundwater pumping on river flow are estimated using a coupled global-scale groundwater-surface water model. Results show that nearly half of the pumped groundwater reduces river flow. Globally, approximately 20% of the pumped groundwater comes from increased river capture and 16% from a reduction in storage (averaged over the model period 1960-2010). Critical thresholds for groundwater discharge to support ecological integrity have already been crossed due to groundwater pumping in 15-21% of all river basins and are likely to be crossed in more than half of all river basins by 2050.

How to cite: de Graaf, I.: Impact of groundwater pumping on river flow, EGU General Assembly 2023, Vienna, Austria, 23–28 Apr 2023, EGU23-11510, https://doi.org/10.5194/egusphere-egu23-11510, 2023.

EGU23-11998 | Posters on site | HS5.16

Nationwide groundwater recharge evaluation for a sustainable water withdrawal over Italy 

Mauro Rossi, Marco Donnini, and Giulio Beddini

Groundwater recharge (GR) is the amount of water that infiltrates into the soil recharging aquifers. For Italy, we applied a water balance method for estimating GR, along with other balance components, using gratis/libre open access data and open source software. The results were compared with the data available from the literature on Central Italy, to validate the model and to investigate the variation in the GR, while considering different lithologies. The comparison of the GR results with anthropogenic water withdrawals enabled the evaluation of sustainable water use in Italy. The results show that in Italy the annual averaged GR is ~110 × 109 m3. This estimate may vary for specific years; in 1992 and 2015, the GR exceeded the value by 3% and 27%, respectively. According to these and related estimations, the 1981–2010 average groundwater withdrawals for civil, industrial and agricultural use were estimated to be ~14% of the averaged GR for the same period. In 1992, the withdrawals for the mineral water industry was about 0.01% of the GR and that for civil use was ~10% in 2015. In this study, we observed significant differences in the GR at the regional level, mostly influenced by the precipitation distribution and elevation. The proposed approach can provide quantitative data in line with the Goal 6 (Targets 6.4 and 6.5) of the 2030 Agenda for Sustainable Development of United Nations (https://sdgs.un.org).

How to cite: Rossi, M., Donnini, M., and Beddini, G.: Nationwide groundwater recharge evaluation for a sustainable water withdrawal over Italy, EGU General Assembly 2023, Vienna, Austria, 23–28 Apr 2023, EGU23-11998, https://doi.org/10.5194/egusphere-egu23-11998, 2023.

EGU23-12044 | Posters virtual | HS5.16

Estimation of transmissivity across the conterminous US using large water table and surface water datasets 

Elco Luijendijk and Etienne Bresciani

The transmissivity of the subsurface controls groundwater flow but is highly variable and often uncertain. Here we use large datasets of groundwater level measurements and surface drainage to calculate transmissivity for 5000 points in the conterminous US. We designed a new algorithm that uses water table data, elevation and surface water location data to reconstruct the groundwater flow path, the groundwater discharge location and the groundwater divide for each data point. We subsequently calculate the ratio of recharge over transmissivity for each point using an analytical solution of the groundwater flow equation. Finally, we use independent estimates of groundwater recharge to estimate transmissivity. The results demonstrate the viability of combining large sets of water level data to quantify the spatial distribution of transmissivity. The algorithm will be published as an open-source code that can be used to automatically find groundwater flow paths and estimate transmissivity for large water level datasets.

How to cite: Luijendijk, E. and Bresciani, E.: Estimation of transmissivity across the conterminous US using large water table and surface water datasets, EGU General Assembly 2023, Vienna, Austria, 23–28 Apr 2023, EGU23-12044, https://doi.org/10.5194/egusphere-egu23-12044, 2023.

EGU23-13845 | ECS | Posters on site | HS5.16

Groundwater response to historic climate variability and change 

Xinyang Fan, Tim Peterson, Benjamin Henley, and Meenakshi Arora

Climate change is projected to impact water resources in many countries around the world, but the projections are highly uncertain due to numerous assumptions of the hydrological stationarity, model structures, and complex hydrodynamics in the surface and subsurface. Quantifying the historic impact of climate variability and change on water resources allows for an improved understanding of the hydrological and climate processes which is necessary for accurate projections. Due to the long memory in groundwater systems of the impacts of climate variability and change, there is an opportunity to investigate the historic impact of long-term changes on water resources. Analysing groundwater hydrographs over multiple decades potentially allows for the quantification of the response of groundwater head to climatic changes. However, there are challenges in using this long-term information to quantify historic climate impacts. One of the challenges is to separate the impact of climatic change on groundwater from other influential drivers, such as pumping for agricultural irrigation, land use and land cover changes, and natural climate variability. In addition, the often short and interrupted nature of groundwater records limits the investigation of long-term impacts. In this study, we establish and test methods to quantify the response of groundwater to climate variability and change at natural sites (not affected by anthropogenic activities) identified across Australia, overcoming the aforementioned challenges. Results show that location, climate, and aquifer hydraulic property play a role in controlling the response of groundwater head and recharge to climate variations, compared with land use changes. This implies that future climate change may significantly impact groundwater availability by altering the response of groundwater. Quantifying the response of groundwater to climatic changes is needed to understand the future of groundwater systems globally. With this improved understanding we can work towards effective adaptive water management strategies for both human and natural systems.

How to cite: Fan, X., Peterson, T., Henley, B., and Arora, M.: Groundwater response to historic climate variability and change, EGU General Assembly 2023, Vienna, Austria, 23–28 Apr 2023, EGU23-13845, https://doi.org/10.5194/egusphere-egu23-13845, 2023.

EGU23-13896 | Orals | HS5.16

Restoring an overexploited aquifer: insights from the Val di Cornia coastal aquifer (Italy) 

Rudy Rossetto, Esteban Rafael Caligaris, Laura Ercoli, Alessio Barbagli, Alessandra Francini, Federico Lazzaroni, Alessandra Pei, Valentina Menonna, Marco Masi, Mirko Brilli, Claudio Benucci, Franca Palumbo, Roberta Maggiorelli, Lorenzo Rotelli, and Alessandro Fabbrizzi

While several studies deal with description and causes leading to aquifer overexploitation, relatively few face the challenge of reverting unbalanced situations. Since 60 years, intensive exploitation of groundwater of the lower Cornia valley aquifer system (Tuscany, Italy) resulted in consistent head lowering and water balance deficit, subsidence, reduction of groundwater dependent terrestrial ecosystems, and salinization of freshwater resources. There, groundwater is the only source of water for drinking, irrigation, industrial purposes and it also contributes to the water needs of the nearby Elba island. We present here the main results achieved within the EU funded LIFE REWAT project (sustainable WATer management in the lower Cornia valley through demand REduction, aquifer Recharge and river REstoration; http://www.liferewat.eu) aiming at rebalancing the water budget of the Cornia river hydrologic system by means of innovation and participatory processes.

Since 2018, five demonstration measures (river restoration works; Managed Aquifer Recharge; reuse of treated wastewater for irrigation; high irrigation efficiency scheme; leakage management in water distribution systems) were built and set in operation for promoting sustainable groundwater resource management, along with capacity building and participatory actions.

Results show an increase in recharge/storage of about 2.5 Mm3 per year, with noticeable effects related to the increase in natural recharge from the Cornia riverbed to the aquifer (for about 1.5 Mm3/year) due to morphological restoration works. The Managed Aquifer Recharge two-stage infiltration basin of Suvereto guaranteed an increase in recharge of about 0.5 Mm3/year. Additional storage increase is related to the reduction in leakage losses from drinking water network and thanks to a more careful use of irrigation water in farming. In about two years, thanks also to favorable hydrologic conditions, the groundwater head generally arose of about 2 to 3 m in the Cornia plain. All the technical works have been complemented by a two years long participatory process leading to the signature of The Cornia River Contract. This is a voluntary agreement among the main stakeholders to promote a shared vision on next 50 years needed actions to achieve environmental sustainability along with proper water resources management. The results achieved so far provide a clear trend towards the Cornia aquifer restoration by means of low-impact and nature-based solutions along with a large involvement of the main stakeholders in creating a shared knowledge on the value of the groundwater resource.

Acknowledgement

This contribution is presented within the framework of the LIFE REWAT project. The LIFE REWAT project received funding from the European Union's Life Programme LIFE 14 ENV/IT/001290.

How to cite: Rossetto, R., Caligaris, E. R., Ercoli, L., Barbagli, A., Francini, A., Lazzaroni, F., Pei, A., Menonna, V., Masi, M., Brilli, M., Benucci, C., Palumbo, F., Maggiorelli, R., Rotelli, L., and Fabbrizzi, A.: Restoring an overexploited aquifer: insights from the Val di Cornia coastal aquifer (Italy), EGU General Assembly 2023, Vienna, Austria, 23–28 Apr 2023, EGU23-13896, https://doi.org/10.5194/egusphere-egu23-13896, 2023.

EGU23-15124 | Orals | HS5.16

Groundwater evolution in Europe - comparing recharge model outputs with spring discharge from hydroclimatic sensitive karst areas 

Markus Giese, Jean-Baptiste Charlier, Andreas Hartmann, and Yvan Caballero

Groundwater resources are generally evaluated by quantifying groundwater recharge and its storage into the aquifer using for example conceptual or numerical models. Recharge modelling provides a preliminary estimation of the renewable part of the groundwater resource. Moreover, results of regional groundwater recharge models may be used as input data for models on a smaller scale, i.e. at the catchment scale dedicated to water management for present and future conditions. It is thus necessary to constrain the recharge models for example by comparing their outputs to historical long-term observations of groundwater flows that can be derived from time series of groundwater levels or spring discharge.

Karst systems with their high infiltration rate and preferential flow in enlarged conduit networks, react quickly to climatic events and changes. Thus, they can be used as proxies to evaluate the impact of global change on groundwater resources. Karst systems are present in different climatic regions of Europe, which allows comparing long-term trends of groundwater recharge with spring discharge (similar or opposing trends). In our study, two different regional recharge models covering entire Europe – one calculating potential groundwater recharge using simple soil water balance methods and one calculating groundwater recharge over karst areas only using 1-D physical equations for infiltration – are compared to the measured spring discharge from a large European database of more than 100 monitored karst systems. To identify and highlight changes in dominant recharge processes related to changing climatic or physiographic (land cover / land use) conditions, different variables used in the regional recharge models will be correlated to indices describing dynamics of karst spring discharge. The results of our study will help to understand the impact of climatic and groundwater recharge related influences on various geographic locations and give insights on uncertainties in the model structure of the applied regional groundwater recharge models.

How to cite: Giese, M., Charlier, J.-B., Hartmann, A., and Caballero, Y.: Groundwater evolution in Europe - comparing recharge model outputs with spring discharge from hydroclimatic sensitive karst areas, EGU General Assembly 2023, Vienna, Austria, 23–28 Apr 2023, EGU23-15124, https://doi.org/10.5194/egusphere-egu23-15124, 2023.

EGU23-16714 | ECS | Orals | HS5.16

Driving processes of long-term large scale groundwater recharge in cold and humid climates 

Dubois Emmanuel and Larocque Marie

Large scale and long-term estimates of groundwater recharge (GWR) are strategic for assessing the relative impacts of climate change and land cover (LC) change on groundwater resources. This is especially true in cold and humid climates where global change has a high disrupting potential. Therefore, this work aims to determine the driving processes of long-term and large-scale GWR in cold and humid climates. Using a parsimonious model, GWR was simulated in the cold and humid region of southern Quebec, Canada (35 800 km2) over the past decades (1961-2017) and for potential future conditions (12 scenarios, 1951-2100). Constant and time-variant LC were used, with a monthly time step and a 500 m x 500 m spatial resolution. The datasets and model are open source. The simulated past and future results showed the importance of seasonality for GWR and the key role of annual temperature in the spatial distribution of GWR rates. They highlighted the high responsiveness of the cold and humid region hydrology to long-term interannual climate variability and the importance of simulating the snow and freezing processes when estimating GWR in these climates. In the future, warmer temperatures during the cold months (less precipitation as snow, earlier snowpack melting) led to more liquid water available when the vegetation was dormant, leading to higher GWR. Warmer temperatures during the rest of the year extended the growing period and increased plant water uptake, directly decreasing the water available for GWR. The direction of the annual changes in GWR thus depended on whether the increase during the cold months could offset the decrease during the rest of the year. The sensitivity of GWR to climate change increased with the increase in LC change intensity. The spatial distribution of LC changes was identified as another driver of GWR change as afforestation took place on agricultural areas, located on the flattest and clayey areas, thus reducing the GWR rates for forested area over time. This work called for a more systematic inclusion of LC changes in long-term groundwater resource simulation and proposes a computationally-affordable methodology to tackle it.

How to cite: Emmanuel, D. and Marie, L.: Driving processes of long-term large scale groundwater recharge in cold and humid climates, EGU General Assembly 2023, Vienna, Austria, 23–28 Apr 2023, EGU23-16714, https://doi.org/10.5194/egusphere-egu23-16714, 2023.

HS6 – Remote sensing and data assimilation

EGU23-481 | ECS | Orals | HS6.1

Multiple information sources to characterize surface soil moisture dynamics in flood-prone rainfed agricultural areas 

Lucía María Cappelletti, Anna Sörensson, Mercedes Salvia, Romina Ruscica, Pablo Spennemann, Maria Elena Fernández-Long, and Esteban Jobbágy

Important progress has been made in recent years in characterizing surface soil moisture (SSM) dynamics at regional scales, both through remote sensing estimates and new in situ networks. Each of these databases has intrinsic features, such as the dynamic range of SSM, the temporal frequency of acquisition and the occurrence of data gaps periods. Improving the understanding of the limitations and the biases that these features can introduce in the characterization of the SSM dynamics is crucial to increase the potential and the consistency of the data sources validations. As a case study, we consider an area of the Argentinean Pampas dedicated to rainfed agro-industrial production. The region is extremely flat and has a sub-humid climate with a high seasonality of both rainfall and cropping. It is also subject to flooding and waterlogging that can last from days to months. The combination of their characteristics makes the region a natural laboratory that is distinguished by a wide dynamic range of SSM conditions. In this context, we study two types of bias. First, considering that data gaps in SSM registries are not usually taken into account in the calculation of representative statistics, we explore if these data gaps are given by spurious behaviors and their impact on SSM statistical metrics. Secondly, and taking into account the characteristics of the region, we assess the bias introduced by the placing of in situ devices on a land cover that is not representative, but which are contained in the remote sensing estimation area. As SSM satellite data we employed estimates from the SMOS and SMAP missions, in conjunction with SSM in situ data preceding from a network belonging to the Argentina National Commission for Space Activities. During the study period (2015-2019), we found a month-long gap resulting from the filtering of high SSM values in the SMAP data. These values are not spurious but typical for this flood-prone region, according to reports from national institutions and comparison with other data sources that identify high soil water content at the same period. In the case of the SMOS data, it presents a period of more than a year with very low data frequency due to radio-frequency interference. We found that ignoring the lack of SMOS data for periods on the seasonal scale, biases in simple statistics are introduced, which might cause erroneous conclusions to be drawn. We also identified that using the in situ data is not possible to represent the transition between growing and fallow seasons. Furthermore, the in situ data fail to capture waterlogging situations, which only became evident with the extensive integration of the satellite data. In this context, our study shows the importance of using multiple sources of information, avoiding taking any one source as absolute truth, with caution about the temporal and spatial biases introduced by both in situ and remote data.


How to cite: Cappelletti, L. M., Sörensson, A., Salvia, M., Ruscica, R., Spennemann, P., Fernández-Long, M. E., and Jobbágy, E.: Multiple information sources to characterize surface soil moisture dynamics in flood-prone rainfed agricultural areas, EGU General Assembly 2023, Vienna, Austria, 23–28 Apr 2023, EGU23-481, https://doi.org/10.5194/egusphere-egu23-481, 2023.

To compute optimal sampling locations for a lower Himalayan watershed various methods were used. The methods were compared at various scales: watershed scale, landform scale and seasonal scale. The methods compared for the evolution of optimal sampling strategy are statistical sampling, geostatistical sampling, stratified sampling, bootstrap methods and random combination method. To examine the methods, field experiments were conducted in a sampling domain of 425 km2 to study the patterns. At the watershed scale total number of 24 locations were evaluated which were distributed into 12 agricultural, 6 forest and 6 grassland landforms. To study the seasonal patterns comparison for the Rabi and Kharif seasons was done. The results indicated that the random combination method provides a simplified and efficient sampling strategy compared to the other methods. Further the random combination method has an inherent advantage of requiring very minimal input information whereas, the statistical and stratified sampling strategy requires data that has to be independent and normally distributed. The geostatistical methods requires a semi variogram model to get the necessary results. To obtain the results at the same level of error the random combination method gives lesser number of sampling locations required. Additionally the computational efficiency of the random combination method can be increased generating smaller groups of samples for the optimality estimation.  

How to cite: Sharma, S., Swami, D., and Dubey, A.: Estimating Optimal Sampling Locations of Surface Soil Moisture at Different Scales Using Various Methods and comparing them for a Lower Himalayan Watershed Region, EGU General Assembly 2023, Vienna, Austria, 23–28 Apr 2023, EGU23-590, https://doi.org/10.5194/egusphere-egu23-590, 2023.

During Data Assimilation (DA) in a hydrological model, observations of soil moisture (SM) and streamflow (Q) at interior locations are often assimilated together during the multivariate case to improve streamflow estimates at the catchment outlet. In addition to model states, model parameters need to be updated periodically to account for the variations caused by climatic and human factors during the assimilation period. Therefore, in this study, time-varying multivariate assimilation of ASCAT SM observations and streamflow gauge data from interior sites are ingested into a conceptual two-parameter model, which simulates streamflow using a water budget equation. The Bharathapuzha river basin, lying in the Western Ghats of Southern India is chosen as the study area. In this study, the Ensemble Kalman filter (EnKF), a sequential assimilation approach, is utilized to update the model’s states and parameters at a daily time step. Meanwhile, the computational burden of assimilating such a massive observation needs to be dealt with. A plausible solution is to perform assimilation only at those timesteps when the model is sensitive to the assimilating variable. Consequently, two assimilation scenarios were performed apart from the open-loop (OL) simulations. In the first scenario, all the available SM observations are assimilated irrespective of their sensitivity (DA1). Whereas, in the second scenario, only sensitive SM observations are assimilated into the model (DA2). Results revealed that during both the assimilation scenarios, the model showed improved performance as compared to the open-loop simulations. KGE value improved from 0.68 (during OL) to 0.85 (during DA1) and 0.81 (during DA2). An intriguing fact is that during the second scenario (DA2) when only a subset of sensitive observations was assimilated, the model still showed similar results as DA1. Results highlight that assimilating only spatiotemporally sensitive observations would not affect the model’s performance substantially. Instead, the assimilation efficiency can be enhanced by abbreviating the computational burden.

How to cite: Visweshwaran, R., Ramsankaran, R., and T i, E.: Improving Streamflow Estimates using an Efficient Time Variant Multivariate Assimilation of Soil Moisture and Streamflow Observations, EGU General Assembly 2023, Vienna, Austria, 23–28 Apr 2023, EGU23-937, https://doi.org/10.5194/egusphere-egu23-937, 2023.

EGU23-1116 | Orals | HS6.1

Soil moisture monitoring at kilometre scale: assimilation of Sentinel-1 products in ISBA 

Oscar Javier Rojas Muñoz, Jean-Christophe Calvet, Bertrand Bonan, Nicolas Baghdadi, Jean-Pierre Wigneron, Mehrez Zribi, and Catherine Meurey

In a warming climate where the frequency and intensity of extreme events (such as droughts and floods) are increasing, a better representation and estimation of land surface variables remains a crucial step to study their response to climate change. Soil moisture is a key variable of the water cycle. Monitoring soil moisture, either by in situ measurements or by satellite observations allows better prediction and anticipation of droughts and floods, especially in agricultural regions. In order to fully exploit the growing number of satellite observations data, assimilation techniques can be used to integrate these data into land surface models.

In this work, surface soil moisture (SSM) observations from Sentinel-1 (S1) satellite are assimilated into the ISBA model at the kilometer scale. The main objective is to evaluate the added value of the SSM assimilation and its impact on the ISBA model simulations, driven by atmospheric variables from the AROME weather forecast model. The Land Data Assimilation System tool (LDAS-Monde) of Météo-France is used. The SSM S1 product covers the period 2017-2019, over two regions in south of France and one in Spain. The native resolution of the S1 product is 10 m, and the aggregated 1 km product only covers areas where radar signal interpretation is possible. The two areas of interest in France are the Toulouse and the Montpellier regions. In these two areas, in situ soil moisture measurements are available (SMOSMANIA network and Meteopole-Flux stations of Meteo-France). The area of interest in Spain is located between Salamanca and Valladolid, where the REMEDHUS network of in-situ soil moisture measurements is located. In situ SSM observations at a depth of 5 cm were gathered from all stations at an hourly temporal resolution. The S1 SSM shows a good agreement with the in situ observations, including over the Météopole-Flux site which is located in a semi-urban area.

The impact of assimilating SSM products is evaluated over three surface variables: SSM at the 1 – 4 cm soil deph layer (WG2), at the root zone at 30 cm soil depth (WG5) and on the Leaf Area Index (LAI). Three experiments are then carried out over the three regions: assimilation of the S1 SSM product alone, assimilation of the LAI retrieved from the Copernicus Global land Service (CGLS), and one last experience where S1 SSM is jointly assimilated with LAI.

The results of these experiments on one hand show that when SSM alone is assimilated, almost no improvement is observed on WG2 between the ISBA model outputs and the assimilation outputs when compared to in situ measurements. On the other hand, when SSM is jointly assimilated with LAI, there is a stronger impact on WG2 and thus the outputs are closer to the in situ observations. Concerning WG5, the impact of assimilating SSM and LAI is found to be even stronger.


How to cite: Rojas Muñoz, O. J., Calvet, J.-C., Bonan, B., Baghdadi, N., Wigneron, J.-P., Zribi, M., and Meurey, C.: Soil moisture monitoring at kilometre scale: assimilation of Sentinel-1 products in ISBA, EGU General Assembly 2023, Vienna, Austria, 23–28 Apr 2023, EGU23-1116, https://doi.org/10.5194/egusphere-egu23-1116, 2023.

EGU23-1419 | Orals | HS6.1

Recent Improvements in the SMAP Level-4 Soil Moisture Product 

Rolf Reichle, Qing Liu, Joseph Ardizzone, Michel Bechtold, Wade Crow, Gabrielle De Lannoy, John Kimball, and Randal Koster

The NASA Soil Moisture Active Passive (SMAP) mission Level-4 Soil Moisture (L4_SM) product provides global, 9-km resolution, 3-hourly surface (0-5 cm) and root-zone (0-100 cm) soil moisture from April 2015 to present with a mean latency of 2.5 days from the time of observation.  The product is based on the assimilation of SMAP L-band (1.4 GHz) brightness temperature (Tb) observations into the NASA Catchment land surface model as the model is driven with observations-based precipitation forcing. 

In this presentation, we describe three recent improvements in the L4_SM algorithm.  First, satellite- and gauge-based precipitation from the NASA Integrated Multi-satellitE Retrievals for the Global Precipitation Measurement mission (IMERG) are used in two ways: (i) The climatology to which all L4_SM precipitation forcing inputs are rescaled is based on IMERG-Final (Version 06B) data, replacing the Global Precipitation Climatology Project v2.2 data used in previous L4_SM versions, and (ii) the precipitation forcing outside of North America and the high latitudes is corrected to match the daily totals from IMERG, replacing the gauge-only, daily product or uncorrected weather analysis precipitation used there in earlier L4_SM versions.  Second, the Catchment model now includes the recently developed PEATCLSM hydrology module for peatlands and uses an updated global map of peatlands.  Third, revised parameters are used in the L-band radiative transfer model that converts the simulated soil moisture and temperature estimates into Tb predictions for use in the radiance-based L4_SM analysis.  Specifically, climatological parameters for the scattering albedo, soil roughness, and (seasonally-varying) vegetation opacity were derived from the SMAP Level-2 radiometer soil moisture retrieval product.   

The revised precipitation inputs result in considerably improved anomaly time series correlation skill of L4_SM surface soil moisture in South America, Africa, Australia, and parts of East Asia.  Particularly large improvements are seen in central Australia and Myanmar, where the quality of the gauge-only precipitation product used in earlier L4_SM versions was particularly poor.  In peatlands, the dynamics of water table depth, surface soil moisture and evapotranspiration are considerably improved when evaluated against in situ measurements.  Moreover, the time series correlation of surface and root-zone soil moisture vs. in situ measurements is slightly improved, owing to the improved annual cycle phasing of the Level-2 derived vegetation opacity parameters.  Collectively, these improvements are also manifested in smaller Tb observation-minus-forecast residuals.

How to cite: Reichle, R., Liu, Q., Ardizzone, J., Bechtold, M., Crow, W., De Lannoy, G., Kimball, J., and Koster, R.: Recent Improvements in the SMAP Level-4 Soil Moisture Product, EGU General Assembly 2023, Vienna, Austria, 23–28 Apr 2023, EGU23-1419, https://doi.org/10.5194/egusphere-egu23-1419, 2023.

EGU23-1850 | ECS | Posters on site | HS6.1

A network of in situ soil moisture observations operational since 2009 

Paul Vermunt, Rogier Van der Velde, Harm-Jan Benninga, Bas Retsios, and Mhd. Suhyb Salama

In situ soil moisture measurement networks are essential for developing, improving and validating satellite soil moisture products. In the east of the Netherlands, an area susceptible to droughts, a monitoring network for soil moisture and – temperature has been operational since 2009. Spread across an area of 45 by 40 km, twenty profile monitoring stations observe moisture and temperature in the root zone. Four field campaigns were conducted in order to calibrate the sensors and to assess the spatial representativeness of the measurements.

The network has proven to be of great value for validation of satellite products (e.g. for SMAP soil moisture). In addition, continuation of the measurements will increase its value for climate studies. Currently, the network is being redesigned to better suit operational water management in the region, while preserving the value of long time series for climatological research, and taking into account its potential value for future missions. Here, we present an overview of the network and the observations since its establishment, including the adjustments that are being made to the network and research opportunities.

Van der Velde, R., Benninga, H.J.F., Retsios, B., Vermunt, P.C., Salama, M.S. (2022) - Twelve years profile soil moisture and temperature measurements in Twente, the Netherlands. Earth System Science Data Discussions, 1-44.

Velde, dr. ir. R van der (University of Twente) (2022): Twelve years profile soil moisture and temperature measurements in Twente, the Netherlands. DANS. https://doi.org/10.17026/dans-znj-wyg5

How to cite: Vermunt, P., Van der Velde, R., Benninga, H.-J., Retsios, B., and Salama, Mhd. S.: A network of in situ soil moisture observations operational since 2009, EGU General Assembly 2023, Vienna, Austria, 23–28 Apr 2023, EGU23-1850, https://doi.org/10.5194/egusphere-egu23-1850, 2023.

EGU23-1903 | ECS | Posters on site | HS6.1

Uncertainty Estimation for SMAP Level-1 Brightness Temperature Assimilation at Different Timescales 

Alexander Gruber and Rolf Reichle

In this study, we assimilate Soil Moisture Active Passive (SMAP) mission brightness temperature (Tb) observations into NASA's Catchment Land Surface Model using an Ensemble Kalman filter to update surface and root-zone soil moisture simulations. Different time series components of the Tb observations are assimilated including anomalies, inter-annual variations, and high-frequency variations. To optimize the weights that the data assimilation (DA) puts on the observations, the ratio between the uncertainties of modeled and observed Tb is approximated using modeled and observed soil moisture uncertainties estimated using triple collocation analysis. Results are compared to a benchmark experiment that mimics the operational SMAP Level-4 algorithm, which assimilates Tb observations using a spatially-constant 4 Kelvin (K) observation uncertainty. 

All DA experiments exhibit notable skill improvements in most regions. Improvements are greatest for the inter-annual variations in the simulations of both surface and root-zone soil moisture (mean improvements in terms of Pearson correlation (-) are 0.08 and 0.06, respectively). Anomaly simulations improve similarly (0.07), and improvements in the high-frequency variations are only observed for surface soil moisture simulations (0.06). Strikingly, however, no notable difference in skill—neither improvement nor deterioration—is observed between the experiments that use optimized observation uncertainty parameters and the 4 K benchmark experiment. We show, analytically, that this may be explained by the presence of large observation operator errors, which have the potential to render post-update uncertainty insensitive to inaccuracies in the Kalman gain. 

How to cite: Gruber, A. and Reichle, R.: Uncertainty Estimation for SMAP Level-1 Brightness Temperature Assimilation at Different Timescales, EGU General Assembly 2023, Vienna, Austria, 23–28 Apr 2023, EGU23-1903, https://doi.org/10.5194/egusphere-egu23-1903, 2023.

EGU23-2128 | ECS | Posters on site | HS6.1

Bias detection of ISMN soil moisture measurement through soil water balance model and data assimilation 

Peijun Li, Yuanyuan Zha, Chak-Hau Michael Tso, Liangsheng Shi, Danyang Yu, Yonggen Zhang, Wenzhi Zeng, and Jian Peng

The international soil moisture network (ISMN) provides an important in-situ soil moisture dataset, which is widely utilized for hydrology, agriculture, environmental sciences, and remote sensing validation studies. ISMN soil moisture measurements are generally based on the relationship between soil moisture and other directly observable variables (e.g., dielectric constant) and therefore tend to be influenced by many factors at different installation sites, such as temperature, bulk density, texture, and mineralogy. Based on a previous study (Li, et al., 2020), it is found that coupling a linear bias-aware physical soil water model with data assimilation can effectively detect and calibrate the soil moisture measurement bias. The utilization of a sophisticated physical soil water model can accurately identify the bias but generally requires high costs, which makes extensive evaluation of the ISMN dataset on a large scale difficult. Therefore, a simplified model with less computational cost and satisfying simulation accuracy is needed. Herein, an efficient and bias-aware soil bucket balance model with a data assimilation scheme is developed. The newly developed model without significant accuracy loss has been used to evaluate ISMN data in the Conterminous United States (CONUS). Results show that the proposed model can effectively identify the bias direction based on soil water balance, and that there are many measurements with bias in the ISMN dataset over CONUS.

How to cite: Li, P., Zha, Y., Tso, C.-H. M., Shi, L., Yu, D., Zhang, Y., Zeng, W., and Peng, J.: Bias detection of ISMN soil moisture measurement through soil water balance model and data assimilation, EGU General Assembly 2023, Vienna, Austria, 23–28 Apr 2023, EGU23-2128, https://doi.org/10.5194/egusphere-egu23-2128, 2023.

EGU23-2739 | Orals | HS6.1

Analysis of GLORI GNSS-R airborne measurements for soil moisture estimation 

Mehrez Zribi, Karin Dassas, Pascal Fanise, Vincent Dehaye, Michel Le Page, and Aaron Boone

Soil moisture plays an essential role in understanding the soil-vegetation-atmosphere interface and in managing water resources for irrigation. In recent years, the Global Navigation Satellite System Reflectometry (GNSS-R) technique has shown great potential in estimating and monitoring this parameter. In this context, various global operational products are already offered based on data from the CYGNSS satellites. In this study, we propose an analysis of an airborne campaign with measurements from the GLORI instrument at the Urgell agricultural site, in Spain. It is a polarimetric instrument allowing acquisitions in both LHCP (Left Hand Circular Polarized) and RHCP (Right Hand Circular Polarized) polarizations and L1 frequency band.

In parallel with three flights carried out on the study site in July 2021, various in situ measurements are carried out on twenty reference plots (soil moisture, Leaf area index, soil roughness). An analysis of the incidence angle effect on the GNSS-R reflectivity measurements is proposed. It illustrates larger effects for RHCP polarization. A normalization of data for one incidence angle is proposed. A sensitivity analysis of GLORI measurements to soil moisture is then discussed. The effect of vegetation cover on the degradation of this sensitivity is highlighted. The LHCP polarization displays a higher sensitivity to soil moisture.

An inversion model based on the two-omega approach is calibrated and validated with the in situ data acquired on the reference plots. Reflectivity is simulated as a function of soil moisture and the optical Normalized Difference Vegetation Index (NDVI) index which describes the dynamics of the plant cover. An RMSE close to 0.07m3/m3 is retrieved for soil moisture validation.

Soil moisture maps, based on the application of the inversion model, are proposed at a spatial resolution of 100 m for three realized flights. A correlation with precipitation events, as well as the presence or absence of irrigation is clearly observed.

How to cite: Zribi, M., Dassas, K., Fanise, P., Dehaye, V., Le Page, M., and Boone, A.: Analysis of GLORI GNSS-R airborne measurements for soil moisture estimation, EGU General Assembly 2023, Vienna, Austria, 23–28 Apr 2023, EGU23-2739, https://doi.org/10.5194/egusphere-egu23-2739, 2023.

EGU23-3057 | ECS | Posters on site | HS6.1

Spatiotemporal characteristics of soil Moisture and land – atmosphere coupling over the Tibetan Plateau derived from three gridded datasets 

Beilei Zan, Huiming Wang, Jiangfeng Wei, Yuanyuan Song, and Qianqian Mao

Soil moisture is a crucial component of the water cycle and plays an important role in regional weather and climate. However, owing to the lack of In Situ observations, an accurate understanding of the spatiotemporal variations of soil moisture (SM) on the Tibetan Plateau (TP) is still lacking. In this study, we used three gridded SM products to characterize the spatiotemporal features of SM on the TP during the warm season (May to August). We analyzed the fifth-generation European Centre for Medium-Range Weather Forecasts atmospheric reanalysis (ERA5), Global Land Data Assimilation System (GLDAS), and Soil Moisture Active Passive (SMAP) datasets and used station observation data and triple collocation to quantify product accuracy and consistency. Results of the evaluation based on observation data show that both ERA5 and GLDAS overestimate SM, while the accuracy of SMAP is high. In terms of capturing the temporal variations of SM measured at stations, the performance of ERA5 and that of SMAP are superior to that of GLDAS. According to the evaluation based on triple collocation, SMAP exhibits the smallest random error over the TP and the highest temporal correlation with the unknown true SM in eastern TP. For SMAP, SM variability is the largest in the southern TP. For ERA5 and GLDAS, variability in the western TP is substantially larger than that for SMAP. Low-frequency (30–90 days) variations are the largest contributor to TP SM intraseasonal variability. Relative to SMAP, the contribution of high-frequency variations is low in ERA5 and GLDAS. Land-atmosphere coupling is stronger (weaker) in the western (southeastern) TP, which is relatively dry (wet). Our evaluation of SM product performance over the TP may facilitate the use of these products for disaster monitoring and climate and hydrological studies.

How to cite: Zan, B., Wang, H., Wei, J., Song, Y., and Mao, Q.: Spatiotemporal characteristics of soil Moisture and land – atmosphere coupling over the Tibetan Plateau derived from three gridded datasets, EGU General Assembly 2023, Vienna, Austria, 23–28 Apr 2023, EGU23-3057, https://doi.org/10.5194/egusphere-egu23-3057, 2023.

EGU23-3403 | ECS | Posters on site | HS6.1

Time series profiles of CRNS derived soil moisture content compared to remote sensing and meteorological derived products: insights for up- and downscaling 

Alby Duarte Rocha, Stenka Vulova, Christian Schulz, Michael Förster, and Birgit Kleinschmit

Drought events and environmental disturbances related to water scarcity have become more severe and frequent, affecting food security and endangering vulnerable biomes. Reliable soil moisture content (SMC) estimations at the landscape scale are therefore essential to understand patterns in drought events and vegetation response to such occurrences. Accurate soil moisture predictions can support actions to mitigate water scarcity effects in vegetation, for instance, by precisely managing crops to avoid further depleting limited water resources. However, most available SM products derived from remote sensing (RS) or meteorological data are supplied at a coarse spatial scale and are unsuitable for heterogeneous landscapes in terms of topography and land cover. The gaps between significant changes in SMC levels at the root zone and the vegetation response during the dry and wet seasons are still unknown. Before defining whether up-scaling (or modelling) in situ data using RS or downscaling coarse images to a landscape scale would resolve this research gap, a better understanding of temporal and spatial contributions and uncertainties of different technologies to SMC products is needed. Despite the advance in sensors and processing capacity, a combination of spatial and temporal resolution required for SMC retrieval is unlikely to be available soon globally. Satellite sensors (e.g. microwave, optical, thermal) present different limitations and rely on proxies and assumptions to indirectly derive SMC at the root zone. Moreover, the relationships across time can be biased by weather conditions, masked by land cover type and clouds, or misled by spurious correlations between meteorological and plant trait variables (phenology). For instance, microwave signals can be affected over dense forests, snow cover, or steep topography. Furthermore, optical data are often unavailable due to cloud cover or have their reflectance drastically change from living vegetation to bare soil between two acquisitions in non-permanent crop fields. Therefore, multi-platform approaches, combining technologies and resolutions to derive a versatile and accurate SMC product, should be prioritized. As the model relies on indirect relationships with plant traits or moisture from the topsoil rather than the underlying hydrological processes, the spatial-temporal patterns (and autocorrelation) should not be neglected as they carry crucial information about water balance. In this study, we analyze 38 soil moisture probes installed in landscapes with different vegetation cover, topography, and soil type in Germany. The SMC measurements are provided by cosmic-ray neutron sensors (CRNSs), a non-invasive technology that provides measurements at a field scale (130 to 240m radius). The CRNS time-series measurements are compared to RS and meteorological products. Auxiliary variables such as precipitation, evapotranspiration, and vegetation parameters (e.g. LAI) are also aligned with the SMC and RS-derived products. The similarity and mismatching of the explanatory time-series patterns compared to the reference SMC for different vegetation cover (forest, grassland, and crops), season, regional characteristics (climate, soil properties, and topography), and resolutions (temporal and spatial) are presented. The results can support the development of a soil moisture retrieval approach at a medium to high spatial resolution based on a data cube combining different RS platforms and auxiliary variables.

How to cite: Duarte Rocha, A., Vulova, S., Schulz, C., Förster, M., and Kleinschmit, B.: Time series profiles of CRNS derived soil moisture content compared to remote sensing and meteorological derived products: insights for up- and downscaling, EGU General Assembly 2023, Vienna, Austria, 23–28 Apr 2023, EGU23-3403, https://doi.org/10.5194/egusphere-egu23-3403, 2023.

EGU23-4279 | ECS | Posters on site | HS6.1

Temporal water table dynamics derived from optical satellite data 

Iuliia Burdun, Michel Bechtold, Mika Aurela, Gabrielle De Lannoy, Ankur R. Desai, Elyn Humphreys, Santtu Kareksela, Viacheslav Komisarenko, Maarit Liimatainen, Hannu Marttila, Kari Minkkinen, Mats B. Nilsson, Paavo Ojanen, Sini-Selina Salko, Eeva-Stiina Tuittila, Evelyn Uuemaa, and Miina Rautiainen

Water table constitutes a master control of the general biogeochemistry in northern peatlands. The performance of peatland simulations in global ecosystem models is strongly hampered by the accuracy of the water table predictions. We examined the applicability of the Optical TRApezoid Model (OPTRAM) to monitor the temporal fluctuations in water table over 53 intact, restored, and drained northern peatlands in Finland, Estonia, Sweden, Canada, and the USA from 2018 through 2021. Various OPTRAM were computed based on Sentinel-2 data with the Google Earth Engine cloud platform. We found that (i) the choice of vegetation index utilised in OPTRAM does not significantly affect OPTRAM performance; (ii) the tree cover density is a significant factor controlling the sensitivity of OPTRAM to water table dynamics; (iii) the relationship between water table and OPTRAM often disappears for deep water tables. Based on an anomaly analysis, we further found that OPTRAM seems to be in particular suitable to monitor long-term (i.e., interannual) water table variability while the performance for short-term changes (e.g., response to individual rain events) was lower. Overall, our results support the application of OPTRAM to monitor water table dynamics in intact and restored northern peatlands with low tree cover density when the water table is shallow to moderately deep.

How to cite: Burdun, I., Bechtold, M., Aurela, M., De Lannoy, G., Desai, A. R., Humphreys, E., Kareksela, S., Komisarenko, V., Liimatainen, M., Marttila, H., Minkkinen, K., Nilsson, M. B., Ojanen, P., Salko, S.-S., Tuittila, E.-S., Uuemaa, E., and Rautiainen, M.: Temporal water table dynamics derived from optical satellite data, EGU General Assembly 2023, Vienna, Austria, 23–28 Apr 2023, EGU23-4279, https://doi.org/10.5194/egusphere-egu23-4279, 2023.

EGU23-4916 | ECS | Orals | HS6.1

Downscaling the ESA CCI Soil Moisture: a new European dataset at 1 km for the period 2008-2020 

Luca Zappa, Stefan Schlaffer, and Wouter Dorigo

The European Space Agency (ESA) Climate Change Initiative (CCI) provides long-term surface soil moisture (SM) records with daily temporal resolution. However, the coarse spatial resolution of approximately 25 km limits their use in many hydrological applications, such as agricultural water management, drought monitoring, and rainfall-runoff response.  

To address this constraint, we downscaled the CCI SM product to 0.01° (~ 1 km) using machine learning and a set of static and dynamic variables affecting the spatial organization of SM. In particular, datasets describing the vegetation status throughout time, as well as land cover class and soil and topographic attributes were fed into a Random Forest model. 

Here, we will first present in detail the methodological framework that allowed us to generate the high-resolution dataset. Then, we will thouroughly evaluate its accuracy against in-situ measurements from across Europe, and further compare it to other SM products (e.g., from Sentinel-1). Finally, we will highlight the strengths and limitations of the downscaled SM dataset and discuss possible improvements.

How to cite: Zappa, L., Schlaffer, S., and Dorigo, W.: Downscaling the ESA CCI Soil Moisture: a new European dataset at 1 km for the period 2008-2020, EGU General Assembly 2023, Vienna, Austria, 23–28 Apr 2023, EGU23-4916, https://doi.org/10.5194/egusphere-egu23-4916, 2023.

EGU23-5733 | ECS | Posters on site | HS6.1

Establishment of soil moisture data using satellite information and calculation of hydrological drought index using it 

Yoon-Jeong Kwon, Sumiya Urangchimeg, Minwoo Park, and Hyun-han Kwon

The drought risk in Korea has been gradually increasing, and the southern part of South Korea has experienced prolonged exposure to extremely low precipitation from the summer of 2021 until 2022, leading to the depletion of available water within two months. Droughts can be classified into meteorological, agricultural, and hydrological droughts under different definitions. The drought indices are routinely used to effectively monitor and cope with different drought conditions. In this perspective, various hydrometeorological factors (precipitation, temperature, streamflow, and soil moisture) are required to derive the drought indices according to the classification. Among the factors, the lack of soil moisture data has been an issue in effectively deriving the agricultural drought index compared to precipitation and temperature-based drought indices such as SPI and SPEI. Currently, research on satellite (i.e., C-band SAR) for water resources management is being conducted in South Korea. The agricultural drought index is commonly based on the satellite-based soil moisture and vegetation index, thus, an accurate estimation of soil moisture from the satellite information could be viewed as a main issue in terms of monitoring agricultural drought. In this study, we develop a novel hybrid stochastic simulation model for soil moisture at multiple locations (or grids) with relevant predictors, including hydrometeorological variables and satellite information.


Acknowledgement : This work was supported by Korea Environment Industry & Technology Institute(KEITI) through Water Management Program for Drought, funded by Korea Ministry of Environment(MOE)(2022003610001)

How to cite: Kwon, Y.-J., Urangchimeg, S., Park, M., and Kwon, H.: Establishment of soil moisture data using satellite information and calculation of hydrological drought index using it, EGU General Assembly 2023, Vienna, Austria, 23–28 Apr 2023, EGU23-5733, https://doi.org/10.5194/egusphere-egu23-5733, 2023.

EGU23-5888 | ECS | Orals | HS6.1

Common high-frequency variations of water storage in remotely sensed soil moisture and daily satellite gravimetry 

Daniel Blank, Annette Eicker, and Andreas Güntner

Information on water storage changes in the soil can be obtained on a global scale from different types of satellite observations. While active or passive microwave remote sensing is limited to investigating the upper few centimeters of the soil, satellite gravimetry can detect changes in the full column of terrestrial water storage (TWS), but cannot distinguish between storage variations occurring in different soil depths. Jointly analyzing both data types promises interesting insights into the underlying hydrological dynamics and may enable a better process understanding of water storage change in the subsurface.

In this study, we investigate the global relationship of (1) several satellite soil moisture (SM) products and (2) non-standard daily TWS data from the GRACE and GRACE-FO satellite gravimetry missions on a sub-monthly time scale. The analysis of these GRACE data on a daily basis could be beneficial for identifying hydro-climatic extreme events such as heavy precipitation or flood events that occur on a sub-monthly basis.

We sample all TWS and SM data sets to a common 1 degree spatial resolution and decompose each signal to sub-monthly frequencies by high-pass filtering. We find increasingly large correlations between the TWS and SM for deeper SM integration depths (root zone vs. surface layer). Even for high-pass-filtered (sub-monthly) variations, significant correlations of up to 0.6 can be found in regions with large high-frequency variability. Time spans with particularly large signal variability, that might hint at extreme events, are identified and compared in both in the TWS and the SM time series. Precipitation data were added to the analysis to provide further evidence for the causes/generation of SM and TWS variations.

How to cite: Blank, D., Eicker, A., and Güntner, A.: Common high-frequency variations of water storage in remotely sensed soil moisture and daily satellite gravimetry, EGU General Assembly 2023, Vienna, Austria, 23–28 Apr 2023, EGU23-5888, https://doi.org/10.5194/egusphere-egu23-5888, 2023.

The NISAR mission will provide global data sets of Earth land surface dynamics that are critical to multiple Earth Science disciplines including observations of ecosystem carbon and water cycles. Soil moisture is a surface hydrosphere state variable and plays a key role in global terrestrial hydrology.  It controls the partitioning of water and energy fluxes at the land surface.  NISAR's L-band SAR backscatter measurements are similar to those planned for the L-band radar of the Soil Moisture Active/Passive (SMAP) mission, although at much finer spatial resolution.

NISAR soil moisture using a time-series ratio algotrithm is currently being developed. The final NISAR soil moisture product will have 200m spatial resolution with 12-day exact revisit time. A time-series ratio algorithm was implemented using UAVSAR (SMAPVEX12 field experiment) and SMAP radar observations. In this paper, the performance of the time series ratio algorithm was assessed using in situ observations. Performance of the soil moisture retrieval algorithm was also assessed for dual polarization and quad-polarization observations modes.

How to cite: Bindlish, R.: NISAR Soil Moisture retrievals using the Time-Series Ratio Algorithm, EGU General Assembly 2023, Vienna, Austria, 23–28 Apr 2023, EGU23-6589, https://doi.org/10.5194/egusphere-egu23-6589, 2023.

EGU23-6773 | Orals | HS6.1

An InSAR-based Soil Moisture Product for Arid Regions 

Francesco De Zan

High-resolutions soil moisture products from remote sensing are very valuable but are not free from limitations. Products based on back-scatter change can give conflicting results over dry areas, when the penetration in dry soils becomes significant.[1]

The interferometric phase of Synthetic Aperture Radar acquisitions (in short, the InSAR phase) contains information about the soil moisture variations of the observed target.

This work shows the characteristics of a novel In-SAR-based soil moisture product derived from Sentinel-1 radar observations. The algorithm is based on phase closure inversion, an observable which is immune from atmosphere and deformation contributions to the phase.[2]

The proposed soil moisture product has a resolution of about 200 m and a good coverage in arid and semi-arid regions. It has the potential of filling the gaps of existing high-resolution products based on backscatter change.

An example of the InSAR-based soil moisture product is given in the following figure, which shows a moisture pattern over a rare rain event in the Namibian gravel plain in 2021. Notice the fine structure of channels present in the product. The colorscale units are m3/m3.


Validation

The figure below presents a comparison with the ERA5 weather model and a radiometer-based product (C3S passive), which, despite the low resolution, seem to be reliable also over dry areas. The InSAR soil moisture time series corresponds to one year of Sentinel-1 acquisitions over eastern Spain from the ascending orbit direction. The standard deviation of the difference between the InSAR soil moisture and ERA5 surface soil moisture is just under 3% (m3/m3). Notably, the errors are concentrated on a few dates. As expected, products derived from scatterometry (C3S active) are rather unreliable over this site.

Comparisons with weather radar precipitation data validate the high resolution patterns seen in the InSAR product. The match between the two is typically very good.

So far, all the results indicate that the InSAR-based soil moisture can be a reliable product on arid regions and can complement back-scatter change methods in areas with significant penetration. It is expected that InSAR-based soil moisture product will be able to cover larger portions of the land areas with sensors operating at longer wavelengths.

---

References

[1] F. De Zan and G. Gomba, “Vegetation and soil moisture inversion from SAR closure phases: First experiments and results,” Remote Sensing of Environment, vol. 217, pp. 562–572, 2018

[2 ] W. Wagner, R. Lindorfer, T. Melzer, S. Hahn, B. Bauer-Marschallinger, K. Morrison, J.-C. Calvet, S. Hobbs, R. Quast, I. Greimeister-Pfeil, and M. Vreugdenhil, “Widespread occurrence of anomalous C-band backscatter signals in arid environments caused by subsurface scattering,” Remote Sensing of Environment, vol. 276, 2022

How to cite: De Zan, F.: An InSAR-based Soil Moisture Product for Arid Regions, EGU General Assembly 2023, Vienna, Austria, 23–28 Apr 2023, EGU23-6773, https://doi.org/10.5194/egusphere-egu23-6773, 2023.

EGU23-6976 | ECS | Orals | HS6.1

Added value of machine learning in the assimilation of ASCAT observations into the ISBA land surface model 

Timothée Corchia, Bertrand Bonan, Nemesio Rodriguez-Fernandez, Gabriel Colas, and Jean-Christophe Calvet

In the context of global warming, the frequency and intensity of extreme events such as droughts are increasing, and a better modeling of vegetation response to climate is needed. Monitoring the impact of extreme events on land surfaces involves a number of soil-plant system variables such as soil water content, soil temperature and vegetation leaf area index (LAI). These variables control the carbon, water, and energy land surface fluxes. They can be monitored either by using the unprecedented amount of data from the fleet of Earth observation satellites or by using land surface models. Alternatively, all available sources of information can be combined by assimilating satellite observations into models.


The LDAS-Monde Land Data Assimilation System is a tool developed by the Centre National de Recherches Météorologiques (CNRM). It allows the joint assimilation of Advanced SCATterometer (ASCAT) surface soil moisture and Copernicus Global Land service (CGLS) LAI retrievals into the ISBA (Interaction Sol-Biosphère-Atmosphère) land surface model of Meteo-France, with the objective of better representing leaf biomass and root-zone soil moisture. The ASCAT C-band radar backscatter coefficients (σ0) contain information on both surface soil moisture and vegetation and its assimilation could prove beneficial. For this, an observation operator that links σ0 to the ISBA land surface variables is needed.


In this work, a method for the assimilation of ASCAT σ0 into ISBA using LDAS-Monde is presented. In a first step, observation operators are built using machine learning. Neural networks (NN) are trained using as inputs modeled soil surface moisture, soil temperature, rainwater interception by leaves and CGLS satellite observations of LAI. Then the observation operators are implemented into LDAS-Monde, making it capable of assimilating the satellite product. The method is implemented over southwestern France, where in situ soil moisture observations are available. It is shown that the assimilation of σ0 alone markedly improves the simulation of LAI and soil moisture in agricultural areas. Results vary from one land cover type to another.

How to cite: Corchia, T., Bonan, B., Rodriguez-Fernandez, N., Colas, G., and Calvet, J.-C.: Added value of machine learning in the assimilation of ASCAT observations into the ISBA land surface model, EGU General Assembly 2023, Vienna, Austria, 23–28 Apr 2023, EGU23-6976, https://doi.org/10.5194/egusphere-egu23-6976, 2023.

While great strides have been made in their accuracy and availability, the overall utility of satellite-derived surface soil moisture (SM) datasets derived from passive microwave radiometry is still reduced by their relatively coarse spatial resolution (typically >30 km). In response to this shortcoming, many independent satellite-based SM downscaling approaches have been introduced recently. However, owing to limitations in the spatial sampling characteristics of existing SM ground-monitoring networks, it has proven difficult to obtain reliable reference SM observations at the target downscaling resolution for these approaches (typically 1 to 10 km). As a result, the objective evaluation of SM downscaling approaches is often challenging and/or limited to very localized conditions. In this talk, we introduce and evaluate a point-scale downscaling (PSD) benchmarking strategy whereby spatially sparse, long-term, point-scale SM observations available from existing ground-based SM networks are utilized for the objective benchmarking of downscaled satellite-based SM products. First, we will define criteria that must be met for a given SM downscaling strategy to add either temporal accuracy or spatial skill relative to its coarse-resolution SM baseline. Next, we will illustrate, both analytically and numerically, that such criteria can be accurately evaluated using sparse, point-scale SM observations available from existing ground-based SM networks. Finally, we apply our new PSD benchmarking approach to evaluate existing fine-scale SM products. Results demonstrate that the PSD approach, in concert with existing ground-based network data, can be leveraged to robustly evaluate SM downscaling approaches.

How to cite: Crow, W., Colliander, A., and Chen, F.: Benchmarking downscaled satellite-based soil moisture products using sparse, point-scale ground observations, EGU General Assembly 2023, Vienna, Austria, 23–28 Apr 2023, EGU23-7437, https://doi.org/10.5194/egusphere-egu23-7437, 2023.

EGU23-7441 | Orals | HS6.1

Improving 1km Sentinel-1 Soil Moisture Retrievals by Optimizing Backscatter Preprocessing Workflows 

Wolfgang Wagner, Samuel Massart, Bernhard Raml, Raphael Quast, Pavan Muguda Sanjeevamurthy, Claudio Navacchi, Felix Reuß, Bernhard Bauer-Marschallinger, and Mariette Vreugdenhil

Most scientific studies dealing with the retrieval of soil moisture data from Synthetic Aperture Radar (SAR) data focus on the formulation, training, and validation of the models used to convert the backscatter measurements into soil moisture data, while paying little attention to how the backscatter data are preprocessed. This is insofar surprising given that the topography of the Earth surface in combination with the variable SAR imaging geometry may introduce strong orbit-related geometric effects that obscure the soil moisture signal in backscatter time series. Furthermore, backscatter mechanisms are characterized by a very high spatial variability, leading to variable sensitivity to soil moisture. Differences in backscatter mechanisms and soil moisture sensitivity are hardly ever accounted for except for masking some obvious soil-moisture-insensitive areas such as water bodies, dense forest and urban areas. In this contribution we give an overview of the ongoing efforts at TU Wien to develop Sentinel-1 preprocessing workflows to produce 1 km backscatter time series that are optimized to the task of retrieving soil moisture data at the same spatial resolution. The following topics are addressed: (i) the use of radiometric terrain corrected backscatter data instead of the standard ground range detected products, (ii) the masking of subsurface scattering areas, dense forest and other soil-moisture-insensitive areas, and (iii) the standardization of the backscatter data to a reference incidence angle using machine learning techniques. Our preliminary results over Europe and the Mediterranean region show a substantial improvement of the Sentinel-1 soil moisture retrievals that would be impossible to achieve by a sole focus on the scientific retrieval algorithm.

Acknowledgements

We acknowledge funding by the European Space Agency (DTE Hydrology and 4DMED), the Copernicus Land Monitoring Service, and the Austrian Space Applications Programme (ROSSHINI and GHG-KIT). The computational results presented have been achieved in part using the Vienna Scientific Cluster (VSC).

How to cite: Wagner, W., Massart, S., Raml, B., Quast, R., Muguda Sanjeevamurthy, P., Navacchi, C., Reuß, F., Bauer-Marschallinger, B., and Vreugdenhil, M.: Improving 1km Sentinel-1 Soil Moisture Retrievals by Optimizing Backscatter Preprocessing Workflows, EGU General Assembly 2023, Vienna, Austria, 23–28 Apr 2023, EGU23-7441, https://doi.org/10.5194/egusphere-egu23-7441, 2023.

EGU23-7562 | ECS | Orals | HS6.1

Towards development of a P- and L-band Tb assimilation framework in the JULES Land Surface Model 

Richa Prajapati, Indu Jayaluxmi, Jeffrey Walker, and Jean-François Mahfouf

The L-band (1.4 GHz) microwave radiometer provides soil moisture (SM) information limited to around 5 cm soil depth. Deeper information (up to 10 cm) can be obtained using low frequency sensors (P-band: 0.3-1 GHz) with reduced effects of surface roughness and vegetation. The present study explored the capability of P-band and/or L-band singly or in combination, via direct assimilation of brightness temperature (Tb) into the Joint UK Land Environment Simulator (JULES) land surface model. JULES was driven by ERA-5 (ECMWF Reanalysis v5) meteorological forcing data and calibrated model parameters for bare soil. The assimilation framework consists of a radiative transfer model to convert simulated SM to Tb and an Ensemble Kalman Filter to generate an observation corrected SM trajectory. This framework was first validated with an open loop experiment in a synthetic environment over Cora Lynn, Victoria, Australia for the period of 9th May to 14th June, 2019. Assimilation experiments with synthetic observations were then set-up to investigate the sensitivity of i) number of ensembles, ii) observation error, iii) incidence angle, iv) assimilation interval, and iv) frequency bands. The diagnostics (Kalman gain and Jacobians) showed that P band was more sensitive to the deeper layers as compared to L-band. The results also showed substantial improvement in the soil moisture analysis state in both the dry and wet period of the study when both L- and P-band Tbs were assimilated. Further study will include investigating improvement in soil moisture estimates when using real field observations and assimilating Tb with multiple incidence angles.

Keywords: Ensemble Kalman filter, Tb assimilation, P-band, JULES Land surface model, Radiative Transfer Model

How to cite: Prajapati, R., Jayaluxmi, I., Walker, J., and Mahfouf, J.-F.: Towards development of a P- and L-band Tb assimilation framework in the JULES Land Surface Model, EGU General Assembly 2023, Vienna, Austria, 23–28 Apr 2023, EGU23-7562, https://doi.org/10.5194/egusphere-egu23-7562, 2023.

EGU23-7778 | ECS | Posters on site | HS6.1

Prediction of Surface Soil Moisture Content using Multispectral Remote Sensing and Machine Learning 

Suyog Khose and Damodhara Rao Mailapalli

Information on near-surface soil moisture content (SMC) is very important for various applications such as irrigation scheduling, precision farming, watershed management, climate change analysis, drought prediction, meteorological investigations etc. Soil moisture information acquired from remotely sensed satellite data has been widely used in the recent past. However, these remote sensing data's low spatial and temporal resolution is a limitation for agricultural applications. Unmanned aerial vehicles (UAV)-based soil moisture predictions are thriving, but the studies are limited with fewer ground truth data. This study aims to predict the surface soil moisture content using UAV-based multispectral data and machine learning techniques. The UAV-based multispectral data are acquired from an altitude of 40 m. Surface soil samples were collected at an interval of two days to estimate gravimetric soil moisture content. Four machine-learning algorithms (Linear Regression, SVR, RFR, KNN) were used to develop the relationship between near-surface SMC and multispectral data. At high surface SMC, the soil has low spectral reflectance as compared to low surface SMC. The linear regression algorithm performed best, with R2 as 0.89 among the other ML algorithms. Also, blue band reflectance was correlated well with the surface SMC as compared to green, red, NIR and red-edge bands. The findings indicated that UAV-based high-resolution multispectral image analytics could accurately predict the surface SMC. The developed approach of estimation of near SMC may be helpful for farmers and irrigation planners to schedule irrigation and crop management accordingly.

Keywords:  Surface soil moisture content; Remote sensing; UAV; Multispectral imageries; Machine learning

How to cite: Khose, S. and Mailapalli, D. R.: Prediction of Surface Soil Moisture Content using Multispectral Remote Sensing and Machine Learning, EGU General Assembly 2023, Vienna, Austria, 23–28 Apr 2023, EGU23-7778, https://doi.org/10.5194/egusphere-egu23-7778, 2023.

EGU23-7837 | ECS | Orals | HS6.1

Soil Moisture Estimation over Crop Fields Combined with Fully Polarimetric SAR and Passive Microwave Products Data 

Hongtao Shi, Kai Qin, Fengkai Lang, Lingli Zhao, Yaqin Sun, Jinqi Zhao, and Jie Qin

High spatial resolution soil moisture (SM) mapping is essential for a wide range of applications, especially for precision irrigation and crop management. This work proposes an SM estimation method combined with time series of L-band fully polarimetric synthetic aperture radar (PolSAR) and passive SM products over crop areas. Regarding the challenge of eliminating vegetation canopy scattering on SM estimation, model-based polarimetric decomposition is implemented as a pretreatment step in which the surface scattering component in both HH and VV channels are extracted. Afterward, dual-pol surface scattering information normalization is dealt with the cosine-squared incidence angle normalization method, which makes it possible for SM inversion with multiple tracks and multi-incidence SAR observations. With the time series of normalized surface scattering information, the alpha approximation-based change detection algorithm (AACD) is used for SM estimation. Since the AACD algorithm is reported with an underdetermined problem of parameter solution and the underestimation issue of soil moisture inversion, an extended AACD which incorporates dual-pol (HH and VV) SAR observations, namely the Dual-pol AACD algorithm, is proposed in this study. Besides, the minimum and maximum values of passive microwave soil moisture data of the whole study area and the entire study period are introduced as constraints in Dual-pol AACD when solving the unknown parameters of the real part of the soil dielectric constant. Finally, the obtained time series of soil dielectric constants are converted to volumetric soil water content using dielectric mixing model. 56 sets of collected UAVSAR L-band data with 4 different flight lines (#31603, #31604, #31605, #31606) of Winnipeg, Manitoba, Canada in 2012 (SMAPVEX12) are used to validate the Dual-pol AACD algorithm. Passive microwave SM constraints are collected from Soil Moisture and Ocean Salinity (SMOS) and Advanced Microwave Scanning Radiometer 2 (AMSR-2) products. The performance of the proposed method is evaluated by comparing the in-situ measurements against the soil moisture estimates of wheat, corn, soybeans, bean, and canola fields at different phenological stages. Results show that the proposed method provides an accuracy of RMSE ≤ 6.5 cm3•cm-3 over all the selected crop fields, which is better than that without the introduction of constraints from passive microwave SM products. This work also compares the SM estimation performance using constraints from SMOS and AMSR-2. In addition, SM estimates in different crop fields and growth stages are also provided regarding the variation of crop morphological characteristics and biophysical properties. It concludes that the proposed SM estimation method has great potential for local and global SM mapping in a high resolution with existing and upcoming L-band SAR data, such as ALOS-2 (Japan), LT-1 (China), NISAR (America and India) and Tandem-L (Germany), etc.

How to cite: Shi, H., Qin, K., Lang, F., Zhao, L., Sun, Y., Zhao, J., and Qin, J.: Soil Moisture Estimation over Crop Fields Combined with Fully Polarimetric SAR and Passive Microwave Products Data, EGU General Assembly 2023, Vienna, Austria, 23–28 Apr 2023, EGU23-7837, https://doi.org/10.5194/egusphere-egu23-7837, 2023.

EGU23-8102 | Orals | HS6.1

Fiducial Reference Measurements for Soil Moisture (FRM4SM): Toward a better understanding of (satellite) soil moisture uncertainties 

François Gibon, Alexander Boresch, Irene Himmelbauer, Daniel Aberer, Raffaele Crapolicchio, Raúl Díez-García, Wouter Dorigo, Philippe Goryl, Alexander Gruber, Yann Kerr, Arnaud Mialon, Wolfgang Preimesberger, Philippe Richaume, Nemesio Rodriguez-Fernandez, Roberto Sabia, Klaus Scipal, Pietro Stradiotti, and Monika Tercjak

The aim of this presentation is to report on recent advances concerning the satellite based soil moisture validation done through the ESA project “Fiducial Reference Measurement for Soil Moisture (FRM4SM)”. The main objective of this two years project (May 2021 - May 2023) is to study the means to inform on the confidence in soil moisture data products for the whole duration of a satellite mission. Composed of three international partners (AWST, CESBIO and TU WIEN), it aims at the identification and creation of standards for independent, fully characterized, accurate and traceable (i.e., fiducial) in situ soil moisture reference measurements with corresponding independent validation methods and uncertainty estimations for a satellite mission. The ground reference data is drawn from the International Soil Moisture Network (ISMN). New quality indicators are created to better characterize the aptness of ISMN measurements for satellite soil moisture validation, and protocols provided to identify a select set of fiducial reference data. The satellite part, in charge of independent validation methods, focuses efforts towards the Soil Moisture Ocean Salinity (SMOS) mission from ESA. Finally, the easy-to-use interface for the comparison of satellite soil moisture data against land surface models and in situ data, the Quality Assurance for Soil Moisture (QA4SM), targets to implement all created FRM protocols from ground measurement to validation methods created within the FRM4SM project.


How to cite: Gibon, F., Boresch, A., Himmelbauer, I., Aberer, D., Crapolicchio, R., Díez-García, R., Dorigo, W., Goryl, P., Gruber, A., Kerr, Y., Mialon, A., Preimesberger, W., Richaume, P., Rodriguez-Fernandez, N., Sabia, R., Scipal, K., Stradiotti, P., and Tercjak, M.: Fiducial Reference Measurements for Soil Moisture (FRM4SM): Toward a better understanding of (satellite) soil moisture uncertainties, EGU General Assembly 2023, Vienna, Austria, 23–28 Apr 2023, EGU23-8102, https://doi.org/10.5194/egusphere-egu23-8102, 2023.

Soil and its water content can remain unfrozen below an insulative snow cover and modulate snowmelt infiltration and runoff. In this article, an emission model is proposed to account for L-band microwave emission of wet soils below a dry snowpack covered with an emerging moderately dense vegetation canopy. The model links the well-known Tau–Omega emission model with the snowpack dense media radiative transfer (DMRT) theory and a multilayer composite reflection model to account for the impacts of a snow layer on the upwelling soil and the downwelling vegetation emission, respectively. It is demonstrated that even though dry snow is a low-loss medium at the L-band, omission of its presence leads to underestimation of soil moisture (SM), especially when soil (snow) becomes wetter (denser). Constrained inversion of the proposed emission model, using brightness temperatures from the Soil Moisture Active and Passive (SMAP) satellite, shows that the retrievals of SM and vegetation optical depth (VOD) are achievable with unbiased root-mean-squared errors of 0.060 m3m3 and 0.124 [–], when compared with the in situ data from the International Soil Moisture Network (ISMN) and VOD-derived values from the normalized difference vegetation index (NDVI) obtained from the moderate resolution imaging spectroradiometer (MODIS) observations.

How to cite: Ardeshir, E. and Kumawat, D.: Passive Microwave Retrieval of Soil Moisture Below Snowpack at L-Band Using SMAP Observations, EGU General Assembly 2023, Vienna, Austria, 23–28 Apr 2023, EGU23-8302, https://doi.org/10.5194/egusphere-egu23-8302, 2023.

EGU23-8489 | ECS | Orals | HS6.1

­­Joint assimilation of ASCAT backscatter and slope into the ISBA land surface model at ISMN stations over Western Europe 

Xu Shan, Susan Steele-Dunne, Sebastian Hahn, Wolfgang Wagner, Bertrand Bonan, Clement Albergel, Jean-Christophe Calvet, and Ou Ku

ASCAT normalized backscatter and slope are jointly assimilating into the ISBA-A-gs land surface model (LSM) to constrain plant water dynamics processes. An Extended Kalman filter is used as the data assimilation (DA) algorithm with a trained Deep Neural Network as the observation operator to link the states and the observations (Shan et al., 2022). DA and model open loop (OL) runs are performed on ASCAT grid points (GPIs) containing ISMN stations in Europe and validated using data from 2017 to 2019. Performances of DA and OL are evaluated against ISMN in-situ soil moisture observations in different layers and satellite-based LAI observations from the 1km v2 Copernicus Global Land Service project (CGLS) product.

Analysis of DA diagnostics suggests that our DA system is free of bias. Domain median values of innovations, residuals and increments are all around zero. The reduction of standard deviation of residuals compared to innovations shows that DA is effective in reducing uncertainties. Median values of O-A/O-F are close to unity, suggesting the weight given to the ASCAT observables ensures that they provide valuable information to constrain the model. Time series standard deviation of normalized innovations are shown to be around 1 which means our DA system satisfies the Gaussian hypothesis. Regional variations in the mean standard deviation suggests that the performance of the assimilation framework varies somewhat across different land covers.

Aggregated across space and time, the improvement in domain median values of ubRMSE and KGE are not statistically significant. However, improvement is observed in some land cover types, and at specific times of year. For example, analysis of the monthly performances in Agricultural grid points shows that DA corrects deeper soil moisture in spring. Results from our previous studies suggest that this may be due to the indirect link between deeper soil water availability and vegetation water status revealed by ASCAT slope. There are also improvements in LAI in fall and winter, suggesting potential values of ASCAT observables in crop senescence. This is consistent with results from Bonan et al. (2014), who found that assimilation of LAI with SSM  could shift the delayed plant phenological cycle simulated by ISBA compared towards real observations (Bonan et al., 2014). In addition, it is important to note that assimilation is performed at the ASCAT resolution scale, while the ISMN provides point-scale soil moisture.

Analysis of DA diagnostics as well as performance statistics suggest that the efficacy of ASCAT assimilation is sensitive to the prescribed model and observation errors. Ongoing research is focused on providing realistic quantitative values of both to ensure that the information contained in the ASCAT backscatter and slope can be optimally used.


How to cite: Shan, X., Steele-Dunne, S., Hahn, S., Wagner, W., Bonan, B., Albergel, C., Calvet, J.-C., and Ku, O.: ­­Joint assimilation of ASCAT backscatter and slope into the ISBA land surface model at ISMN stations over Western Europe, EGU General Assembly 2023, Vienna, Austria, 23–28 Apr 2023, EGU23-8489, https://doi.org/10.5194/egusphere-egu23-8489, 2023.

Superficial soil moisture is a key hydrological variable playing a main role in the fluxes of water and heat between land and atmosphere. Its spatial and temporal variations are indeed crucial for applications such as environmental modelling and agricultural management. Soil moisture direct measurements lack spatial representativeness, while soil moisture spatialized information could be derived from satellite data acquired by active microwave sensors. In recent years, missions such as ESA’s (European Space Agency) Sentinel-1 SAR (Synthetic Aperture Radar) mission has provided open data at high resolution (up to 20 m) and temporal frequency (6 days at the equator latitudes before December 2021).

In the proposed work, high resolution data of Sentinel-1 are analyzed on an agricultural area at a resolution of 20 m over a 4 year period. In particular, it is proposed a hierarchical approach for detecting time and space domains where coherently apply a Change Detection method for retrieving soil moisture from the co-polarized band of Sentinel-1 data. The study is conducted at the field scale. Given the agricultural land use of the study area, the total SAR backscattered signal is modelled as the sum of vegetation and attenuated soil contributions.

At first, a classification for masking out the sub-areas dominated by a volumetric response due to vegetation is performed. For doing this, the adaptive thresholding method proposed by Satalino et al., 2014 [1] is performed on proper SAR parameters, such as the VH band, the RVI (Radar Vegetation Index) adapted to Sentinel-1 data [2], and the cross-polarized Interferometric Coherence. The resulting classifications derived from the different parameters are then compared. When working on an agricultural area at the resolution of 20 m, the effects of the soil roughness changes on the backscattering coefficient could not be neglected. For considering them, since no soil roughness data are available on the study area, a time series analysis for detecting steep changes in the co-polarized band is performed. By doing this, it is expected to detect temporal clusters in which no soil roughness variations occur, and thus where a CD method can be applied. The results of the latter classification may be compared with an optical roughness index.

REFERENCES

[1] G. Satalino, A. Balenzano, F. Mattia and M. W. J. Davidson, "C-Band SAR Data for Mapping Crops Dominated by Surface or Volume Scattering," in IEEE Geoscience and Remote Sensing Letters, vol. 11, no. 2, pp. 384-388, Feb. 2014, doi: 10.1109/LGRS.2013.2263034.

[2] M. Trudel, F. Charbonneau, R. Leconte, “Using RADARSAT-2 polarimetric and ENVISAT-ASAR dual-polarization data for estimating soil moisture over agricultural fields”. Canadian Journal of Remote Sensing 2012, 38, 514–527.

How to cite: Graldi, G. and Vitti, A.: Hierarchical clustering of Sentinel-1 SAR data for soil moisture estimation at the field scale, EGU General Assembly 2023, Vienna, Austria, 23–28 Apr 2023, EGU23-8533, https://doi.org/10.5194/egusphere-egu23-8533, 2023.

EGU23-8638 | ECS | Orals | HS6.1

Joint assimilation of SMAP soil moisture and AMSR2 vegetation optical depth retrievals into the Noah-MP land surface model 

Zdenko Heyvaert, Samuel Scherrer, Wouter Dorigo, Michel Bechtold, and Gabriëlle De Lannoy

As soil moisture and vegetation water content both affect the emissivity from the land surface, each of them can be derived from satellite-based passive microwave measurements. In this study, we use soil moisture retrievals from the 36 km SMAP L2 product and X-band vegetation optical depth (VOD) from AMSR2 LPRM version 6. VOD is a proxy for vegetation water content, linked to the leaf area index (LAI). We developed a machine learning-based observation operator to map LAI to VOD.

We assimilate the SMAP and AMSR2 products into the Noah-MP land surface model (LSM) with dynamic vegetation. This is done by means of a one-dimensional Ensemble Kalman Filter (EnKF) within the NASA Land Information System (LIS). SMAP soil moisture retrievals update soil moisture in each of the four soil layers of the LSM, while AMSR2 VOD retrievals update the LAI. A cumulative distribution function (CDF) matching approach rescales the soil moisture retrievals to the model climatology. Model LAI is mapped to VOD by means of the above-mentioned observation operator. The resulting data assimilation (DA) system produces consistent estimates of all land surface variables on a quarter-degree regular grid over the European continent from 1 April 2015 through 31 March 2022.

This joint SMAP and AMSR2 DA system is validated by assessing a number of geophysical variables. The surface and root-zone soil moisture estimates are evaluated using in situ observations from the ISMN. Gross primary production (GPP) and evapotranspiration are evaluated using FLUXNET data. Estimates for LAI are compared with optical satellite data from MODIS. The results are compared with open loop (model-only), and SMAP- and AMSR2-only DA experiments.

SMAP-only DA primarily improves soil moisture estimates, while AMSR2-only DA mainly improves estimates of GPP and ET. Preliminary results indicate that the joint DA has the potential to combine the improvements of both individual assimilation systems.

How to cite: Heyvaert, Z., Scherrer, S., Dorigo, W., Bechtold, M., and De Lannoy, G.: Joint assimilation of SMAP soil moisture and AMSR2 vegetation optical depth retrievals into the Noah-MP land surface model, EGU General Assembly 2023, Vienna, Austria, 23–28 Apr 2023, EGU23-8638, https://doi.org/10.5194/egusphere-egu23-8638, 2023.

EGU23-9685 | ECS | Orals | HS6.1

Improved uncertainty estimates for the exponential filter method in a long-term error characterised root-zone soil moisture dataset. 

Adam Pasik, Alexander Gruber, Wolfgang Preimesberger, Domenico De Santis, and Wouter Dorigo

Root zone soil moisture, as the water available for plant uptake, effects evapotranspiration and has an important role in predicting droughts and agricultural yields. While microwave remote sensing retrievals are limited to observing the topmost few centimetres of the soil, they can be used with a variety of methods to infer the water content in the root zone due to the existing link between the dynamics in both layers. Regardless of their methodologies, most root zone soil moisture datasets do not provide uncertainty estimates.
Among the techniques for approximating root zone soil moisture, the exponential filter method stands out as a relatively non-complex approach essentially smoothing and delaying surface observations which are generally characterized by greater temporal dynamics. The uncertainties of the exponential filter method are poorly analysed and typically unavailable. 
To address this gap, we extend the standard law for the propagation of uncertainties to characterize the random error variances of the exponential filter-based root zone soil moisture estimates. The proposed method considers the uncertainties of the input surface soil moisture retrievals and their availability in time as well as those of the exponential filter’s parameter and the method’s model structural error. The latter two components of the uncertainty budget are temporally-static values estimated from ground reference measurements at various depths. The resulting time-variant uncertainty estimates are realistic both in magnitude and temporal variations. 

How to cite: Pasik, A., Gruber, A., Preimesberger, W., De Santis, D., and Dorigo, W.: Improved uncertainty estimates for the exponential filter method in a long-term error characterised root-zone soil moisture dataset., EGU General Assembly 2023, Vienna, Austria, 23–28 Apr 2023, EGU23-9685, https://doi.org/10.5194/egusphere-egu23-9685, 2023.

EGU23-11066 | Posters on site | HS6.1

Sentinel-1 Soil moisture validation with Multiple sources of observations in the mountainous area in Korea 

Seongkeun Cho, Jaehwan Jeong, and Minha Choi

Soil moisture is a key factor in analyzing the water cycle on the land surface. Active microwave sensor has been widely used for spatially representative soil moisture content regardless of weather conditions. Especially C-band microwave sensors (Scatterometer and Synthetic Aperture Radar) loaded on a satellite were adopted for capturing soil moisture over the vegetated area. However, in heterogeneously or thickly vegetated areas, it is difficult to get accurate soil moisture content with SAR sensor for high spatial resolution (< 1 km). In this study, high-resolution soil moisture content in mountainous areas is estimated and evaluated with in-situ soil moisture observation and a Cosmic-Ray Neutron probe (CRNP) sensor. To evaluate the satellite-based soil moisture product, the SMC Soil Moisture observation site, designed for monitoring soil moisture content, was used. The site has 16 FDR sensors for 10 cm, 20 cm, and 30 cm. At the center of the site, CRNP is operated for measuring spatial soil moisture content. Firstly, the Sentinel-1 backscattering signal, strongly affected by land surface conditions in the mountainous areas, was analyzed. Then, canopy attenuation and the relation between the backscattering signal and the local incidence angle on the mountain were evaluated. Secondly, Sentinel-1 images on the observation site were resampled to 10 m, 50 m, 100 m, and 150 m. Water Cloud Model and change detection method were applied to estimate soil moisture content for the 4 scales. Lastly, estimated soil moisture content was compared with CRNP soil moisture data and ASCAT data on observation sites. Error analysis for each pixel included in ASCAT pixels was conducted to figure out the main obstacles of soil moisture estimation on mountains. With the result of this study, high-resolution soil moisture estimation on the Korean peninsula which mainly consists of the mountainous area would be suggested.

Acknowledgment: This work was supported by the National Research Foundation of Korea (NRF) grant funded by the Korea government (MSIT) (NRF-2022R1A2C2010266). This research was supported by Basic Science Research Program through the National Research Foundation of Korea (NRF) funded by the Ministry of Education(2021R1A6A3A01087645)

How to cite: Cho, S., Jeong, J., and Choi, M.: Sentinel-1 Soil moisture validation with Multiple sources of observations in the mountainous area in Korea, EGU General Assembly 2023, Vienna, Austria, 23–28 Apr 2023, EGU23-11066, https://doi.org/10.5194/egusphere-egu23-11066, 2023.

EGU23-11433 | Orals | HS6.1

Satellite-based soil moisture product performance assessment among the EU Ecoregions  

Raffaele Albano, Arianna Mazzariello, Teodosio Lacava, Salvatore Manfreda, and Aurelia Sole

Several remote sensing (RS) microwave-based SM products are available in recent years and offer an extraordinary opportunity to quantify land surface soil moisture (SSM). These products provide soil moisture (SM) estimates with different levels of accuracy which are influenced by  climate, vegetation, and soil features. For this reason, several studies aimed at assessing satellite SM data performance also for comparison with in situ measurements (e.g., the International Soil Moisture Network – ISMN),  have already tried to investigate the relationship among SM and the type of coverage or the climatic conditions.

In any case, no one of these studies (i) have considered together climate, vegetation, and soil features when characterising accuracy of SM derived from RS, or (ii) analysed separately the uncertainty due to interaction with the water-soil cycle variables and the uncertainty due to the wetting condition of the upper layer; indeed, the topsoil wetness variability affects the penetration depth of microwave radiation bringing additional errors when comparing information collected at different depths, from surface to the root zone.

In this context, the present study aims (i) to assess the accuracy of SSM measurement through the implementation of an intercomparison between satellite and the terrestrial International Soil Moisture Network data among the European ecoregions which are considered the largest homogeneous area in terms of climate, vegetation and potentially investigable soil cover. Furthermore, considering that soil characteristics add further uncertainty due to the soil saturation condition when the upper soil layer is excessively dry or excessively wet, the study explores (ii) the local dynamics of soil moisture described by the probability density function of SM. 

Five satellite SM products have been studied, considering those derived from the National Aeronautics and Space Administration (NASA) mission (SMAP), as well as those generated by the European Space Agency (ESA) mission (SMOS, ASCAT, ESA CCI, SENTINEL -1) while the ISMN data were considered as a ground truth.

The results show the best or worst performance of the above cited satellite retrievals in different climate, vegetation, and soil features by looking at their variability at ecoregion scale. Moreover, the approach of multimodality using the ASCAT product, which is provided in % of saturation, validated by the test of the excess mass of Ameijeiras-Alonso, following the removal of phenological seasonality, has proven to be an excellent tool for characterising errors in dry areas, confirming that worse performance occurs in areas with a dry phase observed.

How to cite: Albano, R., Mazzariello, A., Lacava, T., Manfreda, S., and Sole, A.: Satellite-based soil moisture product performance assessment among the EU Ecoregions , EGU General Assembly 2023, Vienna, Austria, 23–28 Apr 2023, EGU23-11433, https://doi.org/10.5194/egusphere-egu23-11433, 2023.

EGU23-12269 | ECS | Posters on site | HS6.1

Mitigating the impact of dense vegetation on theSentinel-1 surface soil moisture over Europe 

Samuel Massart, Mariette Vreugdenhil, Bernhard Bauer-Marschallinger, Claudio Navacchi, Bernhard Raml, Alena Dostálová, and Wolfgang Wagner

The current generation of Synthetic Aperture Radars (SAR) has a high potential to retrieve surface soil moisture (SSM) at a kilometer-scale resolution. Research has shown that a change detection approach applied to the backscatter from the Sentinel-1 mission was able to yield a consistent kilometer-scale SSM product over Europe. This product is operational and available on the Copernicus Global Land Service (CGLS) website (https://land.copernicus.eu/global/). A known problem of the CGLS algorithm is its reduced performance over areas with dense vegetation. The combined influence of vegetation water content and geometry on the backscatter signal results in a lower sensitivity to SSM. This effect is especially observed over woody vegetation such as broadleaved or coniferous forests. In addition, a wet bias is detected in the CGLS SSM data during the growing season over land cover with seasonal variation of vegetation.

This study utilizes the native resolution of Sentinel-1 in its interferometric wide swath mode (20x22m), resampled to a 20m pixel spacing, to assess three dense vegetation masks over Europe. The masks are derived from forest/tree cover maps based on Sentinel-1, Sentinel-2, or a combination of both. At 20m, the backscatter pixels are selectively filtered to discard the ones flagged as non-soil moisture sensitive. The masked backscatter at 20m sampling is then resampled to a kilometer scale and used as input for the CGLS change detection model algorithm. The resulting SSM product is compared to in-situ stations from the International Soil Moisture Network (ISMN) and with modeled soil moisture from ERA5-Land. The results sug gest that masking dense vegetation consistently improves the SSM signal over regions containing both forested areas, and croplands or grasslands.

This study highlights the potential of masking non-soil moisture sensitive pixels at the native resolution of the Sentinel-1 backscatter. The results demonstrate the ability of high-resolution forest masking to mitigate the effect of dense vegetation on the CGLS SSM product.

How to cite: Massart, S., Vreugdenhil, M., Bauer-Marschallinger, B., Navacchi, C., Raml, B., Dostálová, A., and Wagner, W.: Mitigating the impact of dense vegetation on theSentinel-1 surface soil moisture over Europe, EGU General Assembly 2023, Vienna, Austria, 23–28 Apr 2023, EGU23-12269, https://doi.org/10.5194/egusphere-egu23-12269, 2023.

Drought events have multiple adverse impacts on environment, society, and economy. It is thus crucial to monitor and characterise such events. Here, we compare the ability of selected current reanalysis and merged remote-sensing products to represent major seasonal and multi-year drought events of the last two decades globally. We consider the ERA5, and the related ERA5-Land, as well as the MERRA-2 reanalysis products, and the ESA CCI, and the corresponding near-real time C3S remote-sensing soil moisture products (both encompassing an ACTIVE, a PASSIVE and a COMBINED product). In addition, an ESA CCI-based root-zone soil moisture estimate derived from the COMBINED product is used. The considered products offer opportunities for drought monitoring since they are available in near-real time.

We focus on soil moisture (or agroecological) drought and analyse documented events within pre-defined spatial and temporal bounds derived from the scientific literature. Based on standardised daily anomalies of surface and root-zone soil moisture, the drought events are characterised by their magnitude, duration, spatial extent, and severity (i.e., the combination of duration and standardised anomalies below -1.5).

All investigated products capture the investigated drought events. Overall, responses of surface soil moisture are weakest for the ACTIVE remote-sensing products in all metrics. The magnitudes (i.e., the minimum of the standardised anomalies over time) are also reduced in MERRA-2. This is also the case for the spatial extents of most of the remote-sensing products. These differences in drought severity and magnitude for single events are also consistent with inter-product differences in dry-season trends in soil moisture, which are diverse and party contradictory. In the case of MERRA-2, the reanalysis shows regional biases in surface air temperature trends compared to a ground observational product, which suggests that this reanalysis product underestimate drought trends. In the case of the microwave remote sensing products, their lower penetration depth compared to that of the top layer of the involved land surface models, as well as sensing issues of active microwave remote sensing under very dry conditions are likely to explain their partly weaker drought responses. In the root zone (based on the reanalysis products and the ESA CCI root-zone soil moisture estimate), the drought events often show prolonged durations, but weaker magnitudes and smaller spatial extents. Based on the overall observational evidence and the consideration of the respective performance and limitations of the included products, the present analyses suggest a consistent global tendency towards drying during the last two decades in several regions.

How to cite: Hirschi, M., Crezee, B., Dorigo, W., and Seneviratne, S. I.: Characterising recent drought events in the context of dry-season trends using current reanalysis and remote-sensing soil moisture products, EGU General Assembly 2023, Vienna, Austria, 23–28 Apr 2023, EGU23-12832, https://doi.org/10.5194/egusphere-egu23-12832, 2023.

EGU23-13224 | Orals | HS6.1 | Highlight

ESA CCI and C3S Soil Moisture - New developments and recent applications 

Wolfgang Preimesberger, Pietro Stradiotti, Remi Madelon, Robin van der Schalie, Nemesio Rodriguez-Fernandez, Martin Hirschi, Adam Pasik, Alexander Gruber, Wouter Dorigo, Richard de Jeu, Richard Kidd, and Clement Albergel

ESA CCI Soil Moisture (SM) is a long-term global Climate Data Record of soil water content stored in the surface soil layer, derived from satellite observations in the microwave domain. To make it suitable for long-term analyses of the climate system, ESA CCI SM merges observations from a total of 19 satellite radiometers and scatterometers (active and passive systems) into harmonized records covering a period of more than 40 years (from 1978 onwards). ESA CCI SM is currently in its 8th development cycle. Following every development cycle, the CCI algorithm is adopted to create the Copernicus Climate Change (C3S) soil moisture data records. These operational records are extended on a regular basis to provide input data for time-critical applications such as monitoring systems. 

The data sets have been widely used (100+ scientific publications per year) in studying the water, energy and carbon cycles over land, understanding land surface-atmosphere hydrological feedbacks, assessing the impact of climate change on the occurrence of climatic extremes, assimilation into and evaluation of climate models. ESA CCI SM has been the main input for assessing global soil moisture conditions as presented in the BAMS “State of the Climate” reports for more than 10 years, while C3S has been used in the yearly “European State of the Climate” reports for several years now

In this presentation we give an overview over the algorithm underlying the ESA CCI SM product with a focus on new scientific developments included in the latest version. These comprise an improvement in the estimation of intra-annual uncertainties and two additional, experimental versions of the COMBINED product: 1) a gap-filled version in which data points between satellite overpasses are interpolated using statistical methods without the use of ancillary data; and 2) a model-independent version in which all merged sensors are scaled to L-band observations, as opposed to model values in previous versions. We show how both ESA CCI and C3S have been used in recent years to monitor droughts and floods globally and in Europe, respectively.

The development of ESA CCI and C3S SM has been supported by ESA’s Climate Change Initiative for Soil Moisture (Contract No. 4000104814/11/I-NB & 4000112226/14/I-NB) and the Copernicus Climate Change Service implemented by ECMWF through C3S 312a Lot 7 & C3S2 312a Lot 4 Soil Moisture.

How to cite: Preimesberger, W., Stradiotti, P., Madelon, R., van der Schalie, R., Rodriguez-Fernandez, N., Hirschi, M., Pasik, A., Gruber, A., Dorigo, W., de Jeu, R., Kidd, R., and Albergel, C.: ESA CCI and C3S Soil Moisture - New developments and recent applications, EGU General Assembly 2023, Vienna, Austria, 23–28 Apr 2023, EGU23-13224, https://doi.org/10.5194/egusphere-egu23-13224, 2023.

EGU23-13940 | ECS | Orals | HS6.1

Accounting for Seasonal Soil Moisture Retrieval Errors in the Generation of Climate Data Records 

Pietro Stradiotti, Alexander Gruber, Wolfgang Preimesberger, Rémi Madelon, Robin van der Schalie, Nemesio Rodriguez-Fernandez, Martin Hirschi, Wouter Dorigo, Richard Kidd, and Clément Albergel

Multi-decadal climate data records of soil moisture (SM) are generated by merging distinct satellite microwave remote sensing data sets to serve countless Earth System applications. Such products generally outperform the individual sensor records as they provide a least squares solution to the merging of SM. Within the well known European Space Agency's (ESA) Climate Change Initiative (CCI) for SM product, it was demonstrated that a performance leap is achieved by informing the averaging of multiple retrievals with Triple Collocation Analysis (TCA)-based uncertainty estimates of the input data sets. However, while the approach taken to generate the ESA CCI SM product assumes a constant random error variance for an entire sensor period, it has become evident that errors in SM remote sensing retrievals fluctuate throughout the year. This has been linked to the fact that environmental parameters---foremost vegetative growth---are characterized by a seasonality, such that their impact on the SM retrieval varies with the same cycle. Therefore, taking this seasonal component into account in the least squares formulation of the merging problem is a logical next step. This study examines whether a seasonal adaptation of TCA leads to a performance improvement in the merging, using input data from the ASCAT, AMSR2, and SMAP missions and the GLDAS2.1 model as a climatology baseline. The two key findings are that i) since seasonal uncertainty variations affect all sensors in a similar way, they cause only marginal changes in their relative weighting, which leads to the merged SM estimates not changing significantly from the static to the seasonal merging; yet ii) an evaluation against in situ data suggests that the estimated uncertainties of the new merged product are more representative of their actual seasonal behavior. Such improved uncertainty representation is potentially beneficial to various applications, for instance in the weighting of SM observations for assimilation in physical models. Based on these findings, we conclude that using a dynamic TCA approach can add value to merged products such as the ESA CCI SM by providing a more realistic characterization of data set uncertainty---in particular its temporal variation.

How to cite: Stradiotti, P., Gruber, A., Preimesberger, W., Madelon, R., van der Schalie, R., Rodriguez-Fernandez, N., Hirschi, M., Dorigo, W., Kidd, R., and Albergel, C.: Accounting for Seasonal Soil Moisture Retrieval Errors in the Generation of Climate Data Records, EGU General Assembly 2023, Vienna, Austria, 23–28 Apr 2023, EGU23-13940, https://doi.org/10.5194/egusphere-egu23-13940, 2023.

EGU23-14267 | ECS | Orals | HS6.1

QA4SM: a service for transparent and reproducible evaluation of satellite soil moisture products 

Daniel Aberer, Wolfgang Preimesberger, Pietro Stradiotti, Samuel Scherrer, Monika Tercjak, Alexander Gruber, Wouter Dorigo, Alexander Boresch, Irene Himmelbauer, François Gibon, Philippe Richaume, Arnaud Mialon, Yann Kerr, Ali Mahmoodia, Raffaele Crapolicchio, Roberto Sabia, Raul Garcia, Philippe Goryl, and Klaus Scipal

Quality assessment is an integral part of creating climate data records. Producers of satellite based records want to evaluate whether their products fulfill certain quality requirements, such as the ones set by the Global Climate Observing System (GCOS) of the World Meteorological Organization (WMO) or by the Committee on Earth Observation Satellites (CEOS). Users of these data, on the other hand, are usually interested in their fitness-for-purpose in terms of specific applications, temporal/spatial subsets, and how different data sets of the same variable compare to each other.
Quality Assurance for Soil Moisture (QA4SM) is an online validation service for (inter)comparing soil moisture records and assessing their quality, incorporating best practices, in a standardized, traceable way via an easy-to-use graphical user interface. The processing chain includes automatic preprocessing (filtering, temporal/spatial matching, scaling) of input data and computation of a set of quality metrics (e.g., correlation, bias, signal-to-noise-ratio). It provides an open and flexible framework in which users can upload their own data for comparison to state-of-the-art records that are already integrated in the service. These include reference data from the International Soil Moisture Network (ISMN), reanalysis data from ERA5 and GLDAS Noah, and various satellite based records such as SMOS, SMAP, Sentinel-1, ESA CCI, and C3S. 
In this presentation we give insight into the scientific and technical background of developing a cloud-based validation service and its current capabilities. We explain the advantages a service like this has, and how it can benefit users of climate data records with minimal effort.

The service was launched as part of the Quality Assurance for High Spatial and Temporal Resolution Soil Moisture Data (QA4SM-HR) project through the Austrian Research Promotion Agency (FFG) and is currently developed within the framework of the European Space Agency’s Fiducial Reference Measurement for Soil Moisture (FRM4SM) project. It can be accessed at: https://qa4sm.eu

How to cite: Aberer, D., Preimesberger, W., Stradiotti, P., Scherrer, S., Tercjak, M., Gruber, A., Dorigo, W., Boresch, A., Himmelbauer, I., Gibon, F., Richaume, P., Mialon, A., Kerr, Y., Mahmoodia, A., Crapolicchio, R., Sabia, R., Garcia, R., Goryl, P., and Scipal, K.: QA4SM: a service for transparent and reproducible evaluation of satellite soil moisture products, EGU General Assembly 2023, Vienna, Austria, 23–28 Apr 2023, EGU23-14267, https://doi.org/10.5194/egusphere-egu23-14267, 2023.

EGU23-14842 | ECS | Orals | HS6.1

Soil moisture products underestimated plant-relevant dry-down during the recent drought in Germany 

Toni Schmidt, Martin Schrön, Zhan Li, Till Francke, Steffen Zacharias, Anke Hildebrandt, and Jian Peng

In the last decades, a variety of soil moisture products from remote sensing and process-based modeling have been created to study the terrestrial water cycle on a large scale. While satellite-based products are only representative of the water content at the topmost soil surface, model-based products aim at overcoming this limitation by estimating the water content in the deeper soil. In order to map the water content in the course of droughts and to analyze plant water absorption and transpiration, the water content in their rooting depths is of particular interest but out of scope for satellite-based products. Ground-based cosmic-ray neutron sensors are able to estimate soil water content at depths from 0 to 20 or 70 cm, depending on the soil water content. Their data offer a promising reference for the vertical extrapolation of satellite-based soil moisture products. In most soil moisture product assessment studies, assessment metrics are usually provided as single values over a certain period of time. However, this disregards the temporal dynamics of the metrics and the underlying processes. Here, we analyze the temporal dynamics of biases of cutting-edge soil moisture products from remote sensing and process-based modeling, in order to assess their potential to monitor plant-available soil water content. As a reference, we use soil moisture estimations from different sites of the Cosmic-Ray Soil Moisture Observation System (COSMOS) in Germany, covering a six-year time span (2015–2020) that includes the drought of 2018. We found that the biases have an annual frequency with a peak in summer for all selected products. Distinct peaks in 2018 and 2019 are outstanding and show the underestimation of the dry-down in subsurface soil layers caused by the drought. Additionally, there is a positive trend of the biases, even across different depths of multi-layer model-based products. The results suggest that the biases during the 2018 drought and subsequent years are due to soil drying at depths that are both below the coverage of the satellite sensors and not captured by the models. This demonstrates that the dry-down during droughts cannot be replicated by the chosen satellite- and model-based soil moisture products. For the accurate estimation of plant-relevant soil water content during droughts, a careful assessment of soil moisture products along with ground-based measurements is necessary. Our findings serve as a basis for improving current soil moisture products.

How to cite: Schmidt, T., Schrön, M., Li, Z., Francke, T., Zacharias, S., Hildebrandt, A., and Peng, J.: Soil moisture products underestimated plant-relevant dry-down during the recent drought in Germany, EGU General Assembly 2023, Vienna, Austria, 23–28 Apr 2023, EGU23-14842, https://doi.org/10.5194/egusphere-egu23-14842, 2023.

For the purpose of defining soil moisture in vegetated areas, abstraction from vegetation-soil interactions must be taken into account, and it must be quantified based on multiple scattering effects, due to the various phases of agricultural crop and its effect on vegetation growth due to the wave signal effect. Entropy-alpha cluster-based (entropy and alpha band clusters are obtained by using K-means unsupervised classification) decomposition approach has been utilised using the Sentinel-1 SAR data to determine the principal scattering contributions from the soil and the vegetation in order to take the effects of plant-soil interactions into consideration. The variation of entropy and alpha is plotted in the target decomposition because the first and second eigenvalues of the covariance matrix for dual-pol data, which indicates a controversial second scattering mechanism. However, anisotropy must be taken into consideration in order to account the impact of vegetation-soil multiple scattering interactions.

The entropy, alpha, and anisotropy bands of considered crop pixels were extracted, and examined the correlation of determination (R2) of crop pixels with each band of decomposition. The R2 for entropy-alpha was achieved less compared to alpha-anisotropy and entropy-anisotropy bands combination. Even though the R2 is high with anisotropy element, anisotropy indicates the presence of a second scattering mechanism and is particularly useful where entropy is high to improve scattering mechanisms. The coefficient of determination between the multiple scattering effects and the backscattering coefficient varies with the crop growth stage. During the initial stages of paddy crop, the R2 is very less whereas as the stage of crop changes, the R2 showed significant varaition at the late vegetative stage of paddy crop due to the vegetation-soil multiple interactions of wave signal. Hence, from the analysis, it is concluded that, the crops can contribute the multiple-scattering effect irrespective of the dominance of either vegetation or soil contribution, which needs to be properly accounted for retrieving soil moisture.

How to cite: Salma, S. and Dodamani, B.: Monitoring the effect of multiple scattering using Sentinel-1 SAR data: A case study of paddy fields, EGU General Assembly 2023, Vienna, Austria, 23–28 Apr 2023, EGU23-15089, https://doi.org/10.5194/egusphere-egu23-15089, 2023.

Data assimilation techniques allow for optimally merging remote sensing observations in ecohydrological models, guiding them for improving land surface flux predictions. Nowadays freely available remote sensing products, like those of Sentinel 1 radar, Landsat 8, and Sentinel 2 sensors, allow for monitoring land surface variables (e.g., radar backscatter for soil moisture and the normalized difference vegetation index, NDVI, for leaf area index, LAI) at unprecedented high spatial and time resolutions, appropriate for heterogeneous ecosystems, typical of semi-arid ecosystems characterized by contrasting vegetation components (grass and trees) competing for water use. An assimilation approach that assimilates radar backscatter and grass and tree NDVI in a coupled vegetation dynamic-land surface model is proposed. It is based on the Ensemble Kalman filter (EnKF), and it is not limited to assimilate remote sensing data for model predictions, but it uses assimilated data for dynamically updating key model parameters (the ENKFdc approach), the saturated hydraulic conductivity, and the grass and tree maintenance respiration coefficients, which are highly sensitive parameters of soil water balance and biomass budget models, respectively. The proposed EnKFdc assimilation approach facilitated good predictions of soil moisture in an heterogeneous ecosystem in Sardinia, for 5 years period with contrasting hydrometeorological (dry vs wet) conditions. Contrary to the EnKF-based approach, the proposed EnKFdc approach performed well for the full range of hydrometeorological conditions and parameters, even assuming extremely biased model conditions with very high or low parameter values compared to the calibrated (“true”) values. The EnKFdc approach is crucial for soil moisture and LAI predictions in winter and spring, key seasons for water resources management in Mediterranean water-limited ecosystems. The use of ENKFdc also enabled us to predict evapotranspiration and carbon flux well, with errors less than 4% and 15%, respectively, although the initial model conditions were extremely biased.

How to cite: Montaldo, N., Corona, R., and Gaspa, A.: On the Assimilation of Remote Sensing Data for Soil Moisture Predictions Using an Ensemble-Kalman-Filter-Based Assimilation Approach in an Heterogeneous Ecosystem under water-limited conditions, EGU General Assembly 2023, Vienna, Austria, 23–28 Apr 2023, EGU23-15691, https://doi.org/10.5194/egusphere-egu23-15691, 2023.

EGU23-16006 | ECS | Posters on site | HS6.1

Analyzing the reliability of in situ soil moisture measurements for satellite product validation: What makes fiducial reference measurements fiducial? 

Irene Himmelbauer, Alexander Gruber, Daniel Aberer, Wolfgang Preimesberger, Pietro Stradiotti, Wouter A. Dorigo, Alexander Boresch, Monika Tercjak, Francois Gibon, Arnaud Mialon, Philippe Richaume, Yann Kerr, Raul Diez Garcia, Raffaele Crapolicchio, Roberto Sabia, Klaus Scipal, and Philippe Goryl

To this day, in situ soil moisture data is viewed as ground truth by the satellite soil moisture (SSM) community. In general, little is still commonly known regarding the traceability of ground measurement uncertainty and their overall in uncertainty budget, which can impact satellite SSM product quality assessments.

Within ESA’s “Fiducial Reference Measurement for Soil Moisture (FRM4SM, May 2021 - May 2023)” project, objectives are set towards building fully characterized and traceable (i.e., fiducial) in situ measurements following community-agreed guidelines from the GEOS/CEOS Quality Assurance for Soil Moisture (QA4EO) framework. These so called “fiducial reference data” (FRM) should have associated Quality Indicators (QI) attached to evaluate their fitness for purpose building upon agreed reference standards (SI if possible). Moreover, such data should be easily and openly accessible, validation case studies should demonstrate their utility and reliability, and protocols and procedures should be established for the usage of such FRM datasets to make scientific studies intercomparable and reproducible.

As part of the FRM4SM project, the following questions were addressed using the International Soil Moisture Network (ISMN) as a ground reference database and the Soil Moisture and Ocean Salinity (SMOS) mission as an example satellite product:

(1) What makes “fiducial reference data” fiducial?

(2) Is the creation of a globally-representative FRM subset already feasible for SSM?

(3) What are the current limitations of in situ observations that limit fiduciality?

(4) What is needed to create a full traceability chain from in situ point measurements to the satellite footprint scale?

In this presentation, we will discuss these questions in detail and report on related findings of the FRM4SM project.

How to cite: Himmelbauer, I., Gruber, A., Aberer, D., Preimesberger, W., Stradiotti, P., Dorigo, W. A., Boresch, A., Tercjak, M., Gibon, F., Mialon, A., Richaume, P., Kerr, Y., Diez Garcia, R., Crapolicchio, R., Sabia, R., Scipal, K., and Goryl, P.: Analyzing the reliability of in situ soil moisture measurements for satellite product validation: What makes fiducial reference measurements fiducial?, EGU General Assembly 2023, Vienna, Austria, 23–28 Apr 2023, EGU23-16006, https://doi.org/10.5194/egusphere-egu23-16006, 2023.

EGU23-16908 | ECS | Orals | HS6.1

A multiscale deep learning model integrating satellite-based and in-situ data for high-resolution soil moisture predictions 

Jiangtao Liu, Chaopeng Shen, Farshid Rahmani, and Kathryn Lawson

Detailed and accurate soil moisture is critical for many applications, such as forecasting agricultural drought and pests and mapping landslides. Deep learning can perform extraordinarily well in soil moisture, streamflow, and model uncertainty estimation. However, these models may inherit disadvantages of training data, such as limited coverage of in situ data or low resolution/accuracy of satellite data. Here, we propose a novel multiscale DL scheme that learns from satellite and in situ data to predict daily soil moisture at 9 km. The model outperforms land surface models, the SMAP satellite product, and a candidate machine learning model. Based on spatial cross-validation, it achieved a median correlation of 0.901 and a root-mean-square error of 0.034 m3/m3 over sites in the conterminous United States. Our scheme generally applies to topics in the geosciences with multiscale data, breaking the limitations of a single dataset.

How to cite: Liu, J., Shen, C., Rahmani, F., and Lawson, K.: A multiscale deep learning model integrating satellite-based and in-situ data for high-resolution soil moisture predictions, EGU General Assembly 2023, Vienna, Austria, 23–28 Apr 2023, EGU23-16908, https://doi.org/10.5194/egusphere-egu23-16908, 2023.

EGU23-16966 | ECS | Posters on site | HS6.1 | Highlight

Using Earth Observations to Measure Hydrological Effects of Wildfires in the Feather River Basin 

Avery Walters and Venkataraman Lakshmi

The Feather River Basin is home to California’s deadliest wildfire, the 2018 Camp Fire, and to the largest single fire in the state’s history, the 2021 Dixie Fire (CalFire, 2022). Each of these events took place in the last five years. In 2021 alone, the Dixie Fire and the Beckwourth Complex Fire combined to burn over 1 million acres of land in the Feather River region (FRLT, 2022). The Dixie Fire burned despite taking place within the burn scar of the 2012 Chips Fire (Graff, 2021). Such exceptional wildfire activity is a cause for further studies.

Our research proposes analyzing satellite data for the Feather River Basin to measure the hydrological effects of wildfire. This study aims to produce monthly observations of major hydrological conditions (i.e. precipitation, soil moisture, vegetation index and streamflow) over the past five to ten years. A one-kilometer sub-daily soil moisture dataset will be used to characterize soil moisture anomalies. Additionally, visual as well as infrared imagery will be collected from commercial high-spatial resolution satellite sensors, which have revisit times of about one hour and resolutions of about one meter. This should help characterize fire extent as well as understand the effects of fire on soil moisture. In situ measurements, when available, will be used to validate satellite-derived observations. 

The Feather River Basin is a high-profile area of the United States with 27 million people dependent upon it for water. The Feather River is the Sierra Nevada’s largest and northernmost river, and the nearby Oroville Dam is America’s tallest dam. Furthermore, the basin is home to continental America’s largest high-alpine meadow– also an important stopover site for migratory birds (American Rivers, 2022). California’s dry climate, combined with shortened snowmelt periods, steep mountain terrain and strong winds, already make it a hotbed for wildfire. A warming climate threatens this landscape with even higher likelihoods of extreme wildfire events. The results of this study will help understand how increasingly common and severe wildfires affect watershed hydrology.

How to cite: Walters, A. and Lakshmi, V.: Using Earth Observations to Measure Hydrological Effects of Wildfires in the Feather River Basin, EGU General Assembly 2023, Vienna, Austria, 23–28 Apr 2023, EGU23-16966, https://doi.org/10.5194/egusphere-egu23-16966, 2023.

EGU23-17157 | Orals | HS6.1

Assessment of of high-resolution L-band radiometry application in precision irrigation 

Andre Daccache, Derek Houtz, Mohammad Emani, and Armand Ahmadi

Spaceborne microwave radiometers are historically used to estimate and analyze global soil moisture and ocean salinity. Despite providing valuable inputs to global hydrological models, the use of satellite-based L-band radiometry in agriculture was limited by the coarse spatial resolution not pertinent to field level observations or by the cost and size of the ground-based system.  TerraRad has recently developed a portable dual polarization passive L-band radiometer (PoLRa) for meter-scale retrievals of soil moisture (SM) and vegetation optical depth (VOD) suitable for field level application. PoLRa is designed to be mounted on UAV, fitted on ATV’s, or fixed on a tripod for continuous measurement. To examine the potential of L-band microwave radiometry in precision irrigation, the retrieved VOD and SM from PoLRa were compared against high resolution vegetation indices (i.e NDVI), plant parameters (i.e. LAI), surface soil moisture and  soil apparent electrical conductivity (ECa) from multi-frequency EMI soil scanner. We will summarize the findings from measurements conducted over bare soil, alfalfa, tomatoes, almonds and olive fields in California. We will also discuss the performance of the L-band radiometer in detecting spatial soil variability, surface soil moisture content, plant water status and vigor. We will also identify research gaps and limitations for L-band use for precision irrigation.

How to cite: Daccache, A., Houtz, D., Emani, M., and Ahmadi, A.: Assessment of of high-resolution L-band radiometry application in precision irrigation, EGU General Assembly 2023, Vienna, Austria, 23–28 Apr 2023, EGU23-17157, https://doi.org/10.5194/egusphere-egu23-17157, 2023.

EGU23-439 | ECS | Posters on site | HS6.3

Expressive fluxes over Amazon floodplain units revealed by high resolution 2D modelling 

Alice Cesar Fassoni-Andrade, Rodrigo Paiva, Sly Wongchuig, Cláudio Barbosa, and Fabien Durand

Water fluxes in the Amazon River floodplain affect hydrodynamic and ecological processes from local to global scales. These fluxes remain poorly understood due to difficult access and limited data in the Amazon basin. In this study, we characterize the hydrodynamics of eight floodplain units of the central Amazon River (40'000 km2) using the 2D hydraulic model HEC-RAS. Remote sensing data, such as floodplain topography estimated by Landsat images, water surface elevation from altimetry, and surface water extent products, were used for model validation. High resolution modeling improved the representation of river and floodplain discharge, water surface elevation (77 cm accuracy) and flood extent (~80% - high water period, ~52% -low water period). The floodplain is organized in units of about 80 km with upstream inflow and downstream outflow. These gross flows are much larger than the net flows with values of up to 20% of the Amazon River discharge and a residence time around 6 days during floods (several months during low water period). Water extent does not a have strong interannual variability during floods as the volume stored in the floodplain, possibly due to topographic constrains. Significant flood extent and volume hysteresis, as well as active flow and storage zones on the floodplain, highlight the complexity of floodplain hydrodynamics. Extreme floods strongly impact the onset and duration of the flood of up to 2 months and, consequently, on the period of high connectivity with the river. These findings are important for understanding carbon and sediment fluxes, and the effects of climate change on water fluxes and riparian communities.

How to cite: Fassoni-Andrade, A. C., Paiva, R., Wongchuig, S., Barbosa, C., and Durand, F.: Expressive fluxes over Amazon floodplain units revealed by high resolution 2D modelling, EGU General Assembly 2023, Vienna, Austria, 23–28 Apr 2023, EGU23-439, https://doi.org/10.5194/egusphere-egu23-439, 2023.

EGU23-576 | ECS | Posters on site | HS6.3

Flood Risk Mapping in Southern Brazil using a terrain descriptor and socio-economic indices 

Deborah Dotta Correa, Pedro Luiz Borges Chaffe, and José Vinícius Boing de Souza

Floods are the most frequent natural disaster impacting society and all inhabited continents. Accurately mapping the extent of flooding is challenging as it requires a detailed, computationally demanding and data-limited representation of hydrological processes. This study focused on mapping the flood risk of the Itajaí River Basin, an important basin with an extensive history of flooding in Southern Brazil, using the HAND terrain descriptor and socio-economic indices.  A combination of three factors was used to define the flood risk: hazard, exposure and vulnerability. In order to characterize hazard, we use a parallel implementation in GPU of the HAND terrain descriptor combined with flood frequency analysis. Vulnerability was determined by combining the Human Development Index and population spatial distribution. Finally, the exposure was determined by using nightlights. Floods observed extent maps of the September 2011 50-year event in different municipalities of the Itajaí River Basin were used to determine the performance of the HAND terrain descriptor as a flood mapping tool. The best performance of the model was obtained for Rio do Sul municipality, with a correctness index of 86% and a fit index of 75%. Most of the Itajaí River Basin (93%) was classified as low risk. Of the remaining 7%, 90% was classified as medium risk, 8% as high risk and 2% as severe risk. By using the HAND terrain descriptor and socio-economic indices, a flood risk map of the Itajaí River Basin in Southern Brazil was developed which can be used as a valuable resource in urban planning, including the development of flood mitigation and response measures.

How to cite: Dotta Correa, D., Borges Chaffe, P. L., and Boing de Souza, J. V.: Flood Risk Mapping in Southern Brazil using a terrain descriptor and socio-economic indices, EGU General Assembly 2023, Vienna, Austria, 23–28 Apr 2023, EGU23-576, https://doi.org/10.5194/egusphere-egu23-576, 2023.

EGU23-1061 | ECS | Posters on site | HS6.3

Multi-scenario flood risk assessment: A case of Sagar Island, West Bengal, India 

Praneta Nadupalli, Aishwarya Narendr, and Bharath H. Aithal

Coastal landscapes are the major source of income and resources. Despite their high vulnerability to
coastal hazards, they are the homes of millions worldwide. Coastal floods are one of the most life-threatening
incidents affecting the coastal living. Bound by water on three sides, the flood sensitivity of coastal India largely
depends on the spatial exposure of under-equipped population groups. This spatial impact of the coastal flood
is likely to rise with the changing climate and exponential rise in the coastal population. The local governments
and stakeholders rely on spontaneous methods of coastal flood mitigation, that are temporary, and do not help
in long-term resilience.
Disaster resilience using spatial planning has been an intensely researched topic by many in this domain for
the past few decades. The development and availability of high-resolution remote sensing data and free and
open source spatial models have further facilitated the development of down-to-earth interventions for
resource-crunched developing nations. The research presents a comparative assessment of Business as Usual
Scenario (BAU) and Flood resilient scenario modelling (FResMO), emphasizing the role of spatial
planning in reducing coastal flood risk during cyclone YAAS (2021) on Sagar Island, West Bengal. In this
analysis, the flood hazard scenario of Sagar Island is developed and validated using a connected bathtub
model. The flood risk in the region is estimated as the product of various vulnerability and exposure
parameters. The vulnerability is dependent on socio-economic parameters, and exposure is related to the
spatial proximity of the region to coastal floods. The vulnerability and exposure parameters are ranked using
a multi-criteria decision using Analytical Hierarchical Process and finally integrated for estimating present
and future flood risk. The future flood risk scenario for 2030 is developed based on the built-up prediction
model ‘FUTURES’ that integrates the temporal landuse map, demography and socio-economic factors using
a multi-level logistic patch growing algorithm.
Keywords: Coastal flood risk, Flood risk modelling, FUTURES, Spatial adaptation, Vulnerability

How to cite: Nadupalli, P., Narendr, A., and Aithal, B. H.: Multi-scenario flood risk assessment: A case of Sagar Island, West Bengal, India, EGU General Assembly 2023, Vienna, Austria, 23–28 Apr 2023, EGU23-1061, https://doi.org/10.5194/egusphere-egu23-1061, 2023.

EGU23-1358 | ECS | Posters on site | HS6.3

A sustainable approach to evaluate the impact of urban sprawl on coastal flooding in Oshiwara watershed, Mumbai, India 

Shray Pathak, Audithan Sivaraman, and Geetha Sambandam

Urban sprawl has emerged to be the most important and expensive part of the ecosystem with so many hazardous effects on the natural environment. Flooding has a tremendous impact on the cities, encompassing the water cycle management by collective disciplines of engineering, environmental, social, and economic sciences. This study focuses on analysing urban flooding and incorporating site-specific sub-catchment spatial strategies and management techniques considering human interactions. The Oshiwara watershed in Mumbai, India was delineated which is responsible for urban flooding along with the storm surges in the study region. The flood inundation mapping was obtained for different return periods by implementing hydrologic-hydraulic modeling and further, spatial hazard zones were identified concerning non-heuristic drivers for the 100-year return period. Subsequently, four impact maps namely infrastructural, social, economic, and environmental were identified along with the overall risk. Management interventions involving flood risk mitigation, stormwater harvesting, and water reuse were analyzed to mitigate these impacts. This provides a sustainable approach to spatially mitigate effects at vulnerable zones, instead of adopting a lumped approach for decision-making. Further, it assists the water planners to deploy planning and management interventions at specific risk locations. Thus, this study provides a suitable platform for urban planners to incorporate decisions by focusing on spatial high-risk locations.  

How to cite: Pathak, S., Sivaraman, A., and Sambandam, G.: A sustainable approach to evaluate the impact of urban sprawl on coastal flooding in Oshiwara watershed, Mumbai, India, EGU General Assembly 2023, Vienna, Austria, 23–28 Apr 2023, EGU23-1358, https://doi.org/10.5194/egusphere-egu23-1358, 2023.

EGU23-1374 | Posters on site | HS6.3 | Highlight

The FluViSat project: Measuring streamflow from space with very high resolution Planet satellite video 

Nick Everard, Harry Dixon, Sunita Sarkar, Mark Randall, and Guy Schumann

The measurement of streamflow in the world’s rivers is critical to the management of water as a resource and to predicting and managing the impacts of potentially damaging hydrological events such as major floods. The European Space Agency sponsored FluViSat (Fluvial Video from Satellite) project has successfully demonstrated the potential of very high resolution satellite imagery for the determination of water flow speeds, and hence streamflow rates, using established surface velocimetry techniques.

Video imagery kindly provided by Planet Labs PBC from the 21 satellites in their SkySat constellation was pre-processed to stabilise and georectify it, and then analysed using Space Time Imaging Velocimetry (STIV) techniques to provide water speed vectors across the river’s surface. The method was successfully demonstrated on rivers in Australia, the UK and Africa, with field based validation undertaken where possible. Additionally, a series of six videos was obtained and analysed to provide near a sequence of observations of flood flows on the Indus River in Pakistan during the devastating flooding of 2022.

Benefits of the FluViSat innovation include the ability to observe water flow rates almost anywhere on the planet, the potential for multiple daily repeat observations and largely eliminating the need for locally based people, equipment and infrastructure.

This presentation presents results from the research, explains the methods employed to derive and validate flow speeds, and explores opportunities to further enhance the FluViSat methodology.

How to cite: Everard, N., Dixon, H., Sarkar, S., Randall, M., and Schumann, G.: The FluViSat project: Measuring streamflow from space with very high resolution Planet satellite video, EGU General Assembly 2023, Vienna, Austria, 23–28 Apr 2023, EGU23-1374, https://doi.org/10.5194/egusphere-egu23-1374, 2023.

Floods are among the most disruptive and widespread natural disaster that kill and displace millions of people every year. To cope with the impacts associated with ongoing floods, it is fundamental to acquire a rapid, accurate and comprehensive overview of inundated areas. Imageries sensed by satellites are becoming indispensable for this purpose, especially those acquired in the radar frequencies (SAR), as they can detect floods during the night and with cloudy skies. However, SAR-based remote sensing has serious limitations when it comes to flood mapping in urban and/or vegetated areas (because of low sensitivity or over-detection issues). Furthermore, satellite-based flood delineation does not provide any information on flood depths, which are critical for emergency response planning and for post-event impact evaluation. This contribution introduces a new framework to estimate water depth and to augment flood mapping where satellites cannot sense floodwater. As input, the method simply requires flood delineation (including the areas excluded from mapping because of the aforementioned limitations) and land surface topography. Although the framework is designed to be coupled with the recently release Global Flood Monitoring system of the Copernicus Emergency Management Service, its range of applicability is wide, provided that the basic input needs are met. The approach is especially suited to enhance flood mapping in systematic large-scale applications that require minimum supervision. 

How to cite: Betterle, A. and Salamon, P.: A parsimonious approach to estimate flood depths — also in urban areas — for satellite-based flood maps, EGU General Assembly 2023, Vienna, Austria, 23–28 Apr 2023, EGU23-1603, https://doi.org/10.5194/egusphere-egu23-1603, 2023.

EGU23-2284 | ECS | Orals | HS6.3

Random forest models based on Sentinel-2 multispectral indices for flood mapping 

Cinzia Albertini, George P. Petropoulos, Andrea Gioia, Vito Iacobellis, and Salvatore Manfreda

Optical satellite sensors represent a reference for Earth imaging applications, including land monitoring and flood management, directly allowing the visual interpretation of acquired scenes or the exploitation of surfaces’ spectral signatures. An extensive literature exists that proves the ability of multispectral satellite sensors in mapping flooded areas and water bodies (Albertini et al., 2022). Several multispectral indices have been developed for water segmentation in different contexts of varying degrees of landscape complexity. Simultaneously, the advancements in Machine Learning (ML) methods led to a proliferation of supervised and unsupervised algorithms applied to classification problems in the field of flood hazard and risk mapping. In the present study, four random forest (RF) models were used in combination with three spectral indices, namely the Modified Normalized Difference Water Index (MNDWI), the Normalized Difference Moisture Index (NDMI) and the Red and Short Wave Infra-Red (RSWIR) index, to map the extent of the flood event occurred along the Sesia River (Vercelli, Italy) in October 2020. A Sentinel-2 scene was acquired soon after the flooding event and spectral bands at 20m resolution were used in the analyses. The performances of the RF methods implemented with the use of the mentioned spectral indices were evaluated and compared using as reference map the delineation product delivered by the Rapid Mapping service of the Copernicus Emergency Management Service (CEMS). Results revealed some very interesting findings regarding the performances of the examined methods, which can become a well-established operational technique. Last but not least, the validation framework itself underlined the added value of Sentinel-2 and the Copernicus platform as a robust, rapid and cost-effective solution in flood mapping.

Keywords: floods mapping, spectral indices, machine learning, Sentinel-2, Italy

References:

Albertini, C.; Gioia, A.; Iacobellis, V.; Manfreda, S. Detection of Surface Water and Floods with Multispectral Satellites. Remote Sens., 14, 6005, 2022. (doi: https://doi.org/10.3390/rs14236005).

How to cite: Albertini, C., Petropoulos, G. P., Gioia, A., Iacobellis, V., and Manfreda, S.: Random forest models based on Sentinel-2 multispectral indices for flood mapping, EGU General Assembly 2023, Vienna, Austria, 23–28 Apr 2023, EGU23-2284, https://doi.org/10.5194/egusphere-egu23-2284, 2023.

EGU23-4918 | Posters virtual | HS6.3

Flood Occurrences in Tropical Coastal Intensified by Exacerbating Extreme Weather Events 

Wenxin Zhang, Edward Park, and Xiankun Ynag

Extreme weather events attributed to global climate change brought disasters into view, the 2021-2022 Malaysian Flash Flood that crushed eight states across the peninsula astonished the world. With a death toll of 56 and total damage of $14,600,000, western Peninsular Malaysia, which has withstood acute and large amounts of precipitation in a short time, suffered the worst flood since the one that occurred in 2014. This study combined recorded sociological statistics with remote sensing data, specified the historical extreme rainfall and flash flood events since 1981 in Peninsular Malaysia, including the 2021-2022 Malaysian Flash Flood, to explicit and compare the temporal and spatial characteristics of these events. Study found since 2000s flood events occurred frequency has significantly increased, including flash floods. In addition, precipitation ditribution in Peninsular Malaysia expreienced a spread to western from concentrating in east coast. A series of factors might have exacerbated flood vulnerability of this tropical peninsular coast under the intensified extreme rainfall events in the 40 years are disscussed. 

How to cite: Zhang, W., Park, E., and Ynag, X.: Flood Occurrences in Tropical Coastal Intensified by Exacerbating Extreme Weather Events, EGU General Assembly 2023, Vienna, Austria, 23–28 Apr 2023, EGU23-4918, https://doi.org/10.5194/egusphere-egu23-4918, 2023.

EGU23-5858 | ECS | Posters on site | HS6.3

Development and validation of flood inundation models for estuaries 

Grigorios Vasilopoulos, Tom Coulthard, Peter Robins, Charlotte Lyddon, Andrew Barkwith, Nguyen Chien, and Matt Lewis

Estuaries, at the interface between catchment and coast, are vulnerable to flooding from the combination of riverine and marine inputs. High river flows generated from intense precipitation can occur synchronously with high tides and storm surges, amplifying flood hazard. In the United Kingdom 20 million people are estimated to live near estuaries, with estuarine flooding regarded as the costliest impact to these areas and second highest hazard to civil emergency. On-going global warming increases sea-levels and modifies hydroclimate variability, thus affecting river fluxes, tidal maxima and the intensify of storm surges. There is therefore a need for improved methods and tools to understand compound flooding events, their impacts and how they may change into the future. In the present paper we developed a validated flood inundation model for the Conwy estuary in North Wales, one of the flashiest catchments in Britain where flooding makes headline news at least once every year. The Caesar-Lisflood 2D hydrodynamic flow model was combined with a range of publicly available datasets to represent channel bathymetry, land elevation, location and heights of flood defences and the hydraulic roughness across the model domain. The model was forced with recorded time-series (15-minute resolution) of tidal oscillations and river discharge data and validated by comparing simulated water levels against observations from existing water level gauges within the estuarine channel. Flood predictions were validated against observed flood extents extracted from SAR imagery using the Google Earth Engine. Calibrated, ortho-corrected (GRD) C-band interferometric Synthetic Aperture Radar (SAR) images captured by the Sentinel-1 constellation of satellites using a dual-band cross-polarization (VH) was used. SAR images were filtered to remove speckle noise and Otsu’s method of thresholding was adopted to automatically extract inundated areas from each available image. Comparison of model-based simulated flood extents against their SAR-derived equivalents was used as a means to validate the flood inundation model.

How to cite: Vasilopoulos, G., Coulthard, T., Robins, P., Lyddon, C., Barkwith, A., Chien, N., and Lewis, M.: Development and validation of flood inundation models for estuaries, EGU General Assembly 2023, Vienna, Austria, 23–28 Apr 2023, EGU23-5858, https://doi.org/10.5194/egusphere-egu23-5858, 2023.

EGU23-7558 | Orals | HS6.3

Rapid Flood inundation mapping using SAR data with Google Earth Engine cloud platform 

Qin Wang, Lu Zhuo, Chen Li, Miguel Rico-Ramirez, Zitong Wen, and Dawei Han

Flood events are becoming increasingly common with the increase in the frequency of extreme weather driven by climate change. The present state of the technologies for flood risk mapping is typically tested on small geographical regions due to limitation of flood inundation observations, which hinders the implementation of flood risk management activities. Synthetic aperture radar (SAR) measurements represent an indispensable data source for flood disaster planners and managers, given their ability to scan the Earth's surface nearly independently of weather conditions and the time of day. The decision by the European Space Agency (ESA) Copernicus program to open data from its Sentinel-1 SAR satellites to the public marks the first time of global, operational SAR data freely available. Combined with the emergence of cloud computing platforms like the Google Earth Engine (GEE), this development presents a tremendous opportunity to the disaster response community, for whom rapid access to analysis-ready data is needed to inform effective flood disaster response interventions and management plans. Here, we present an algorithm that exploits available Sentinel-1 SAR images in combination with historical Landsat and other auxiliary data sources hosted on the GEE to rapidly map surface inundation during flood events. Our algorithm relies on multi-temporal SAR statistics to identify historical floods. Additionally, historical Landsat-based surface water class probabilities are used to distinguish floods from permanent or seasonally occurring surface water. Using this algorithm, we can get a flood inundation map of the region of interest in less than 10 seconds. We tested the algorithm over Houston, Texas following the Hurricane Harvey in late August 2017 and the results showed an accuracy of 89.9%. The flexibility of our algorithm will allow for the rapid processing of future open-access SAR data, including data from future Sentinel-1 missions.

How to cite: Wang, Q., Zhuo, L., Li, C., Rico-Ramirez, M., Wen, Z., and Han, D.: Rapid Flood inundation mapping using SAR data with Google Earth Engine cloud platform, EGU General Assembly 2023, Vienna, Austria, 23–28 Apr 2023, EGU23-7558, https://doi.org/10.5194/egusphere-egu23-7558, 2023.

EGU23-7672 | ECS | Orals | HS6.3

Imagery and Terrain Data Fusion with the Flood Inundation Surface Topology (FIST) Model 

Kevin Dobbs and James Phillips

Satellite imagery provides a unique reference for estimating flood inundation extent that can help characterize flood magnitudes and impacts in support of scientific studies and for operational disaster response. All imagery modalities (multispectral/hyperspectral, panchromatic, synthetic aperture radar (SAR)) suffer from factors that confound accurate spatial representation of flood extent, whether using traditional image classification methods or machine learning-based approaches. Clouds, cloud shadows, tree canopy, tall vegetation, and other factors either obscure the water surface or confuse the classifiers. These can yield results that vary widely when compared to actual flood extents, whether referencing observed data like high-water marks or high-quality hydrodynamic models. In addition, opportunities for imagery collection often do not coincide with maximum flood extent due to satellite access windows, cloud cover impacting optical sensors, or a combination of both. That said, the proliferation of existing and planned commercial and civil sensors across all modalities presents increasing opportunities for timely collection.

In recent years, the quality of terrain data at regional, country, continental, and global scales has continued to rapidly improve. The data include WorldDEM, NASADEM, MERIT DEM, EarthDEM, among others, and many regional to country-scale lidar-derived datasets. The availability of this high-quality data allows for new methods that integrate terrain data with remotely sensed imagery data, to yield accurate and timely representations of flood extent in new ways to support both scientific investigations and disaster response.

However, few methods have been developed that integrate satellite and/or aerial imagery data with terrain data to improve imagery-derived flood products. This paper will present new methods, based on the novel Flood Inundation Surface Topology (FIST) Model, for integration of terrain data with the limited data derived from imagery to provide a more accurate representation of maximum flood extents that overcomes many of the aforementioned limitations of using imagery alone. In addition, The FIST model also produces flood depth grids at the resolution of the native terrain data, which represents a major advance in imagery-derived flood products. We present the fundamental directed graph algorithm that is unique to the FIST model; the data architectures that support a range of applications; and case studies for the use of active flood and post-peak flood imagery to generate inundation extents and depth grids for peak-flood conditions.

How to cite: Dobbs, K. and Phillips, J.: Imagery and Terrain Data Fusion with the Flood Inundation Surface Topology (FIST) Model, EGU General Assembly 2023, Vienna, Austria, 23–28 Apr 2023, EGU23-7672, https://doi.org/10.5194/egusphere-egu23-7672, 2023.

EGU23-8520 | Orals | HS6.3 | Highlight

A framework for improved near real-time flood mapping 

Tapio Friberg, Ambika Khadka, and Arnaud Dupeyrat

ICEYE has been a leader in the mapping and monitoring of global floods for the insurance sector and governments over the last two years. Current operational flood monitoring is based on the large-scale and systematic availability of synthetic aperture radar (SAR) data from the small satellite constellation deployed and operated by ICEYE. The main advantages of SAR images are that they provide synoptic views over wide areas, day and night and in all-weather conditions. However, SAR can be less suitable for providing flood extent information in dense urban areas and under tree canopy cover. In addition, SAR-based flood depth generation methods struggle to provide accurate depth estimations in steep terrain. There is currently a demand to aid observational flood models with physically-based flood modeling in urban areas.

Most operational real-time flood estimates are based on predictions of discharges at river flow monitoring stations using 1D hydrological models. 2D inundation models are computationally expensive and thus require special tooling for creating rapid flood maps. In this presentation, ICEYE will describe a framework that can be used for improving the robustness and accuracy of near real-time flood predictions.

How to cite: Friberg, T., Khadka, A., and Dupeyrat, A.: A framework for improved near real-time flood mapping, EGU General Assembly 2023, Vienna, Austria, 23–28 Apr 2023, EGU23-8520, https://doi.org/10.5194/egusphere-egu23-8520, 2023.

EGU23-9120 | Orals | HS6.3

Bank Height Estimates and Flood Models - Challenges, current practices and recent developments 

Laurence Hawker, Jeffrey Neal, and Richard Boothroyd

Estimating river bank heights is crucial for the accuracy of global flood models. Bank heights determine river-floodplain connectivity, and are used to parametrise channel capacity. Poor bank height estimates can lead to incorrect timings and locations of flood overtopping and erroneous channel capacity, resulting in unsatisfactory flood predictions.

In the current implementation of global flood models, bank heights are estimated by extracting elevations from global Digital Elevation Models (DEMs) at river edges. These elevations, even with the latest DEMs, are often noisy and thus need to be heavily filtered and smoothed. Additionally, the surface water masks used to define river edges often do not match the time of acquisition on the DEMs, leading to inconsistencies. These simple methods for estimating bank heights were introduced during the early stages of global flood model development and have not been revisited in depth. With the emergence of new global DEMs (ALOS AW3D, Coperncius, FABDEM), improved surface water masks from multi-temporal, multi-sensor satellite data and novel image processing techniques, we revisit this problem. We present a new method to estimate bank height across scales, comparing estimates derived from global DEMs with high-quality LiDAR. We map the bank height estimates onto a new FABDEM based river network. Using examples from the UK and USA, we demonstrate the impact of bank height estimates on flood inundation.

How to cite: Hawker, L., Neal, J., and Boothroyd, R.: Bank Height Estimates and Flood Models - Challenges, current practices and recent developments, EGU General Assembly 2023, Vienna, Austria, 23–28 Apr 2023, EGU23-9120, https://doi.org/10.5194/egusphere-egu23-9120, 2023.

The 2017 flash flood affecting Storelva in Utvik (West Norway), with an average slope of >10% in the ungauged reach, was reconstructed using visual observations during the event, as well as post-event field data and remote sensing. The dataset was then used for i) roughness calibration and sensitivity analysis, ii) validation of a 2D hydrodynamic model (morphodynamic data was insufficient) and reconstruction of the maximum flood extent, critical locations, and preferential flow paths, and its comparison to other modelling studies, and iii) analysis of the impact of mesh refinement on model precision for optimal model design in IberPlus.

Water levels and flow discharge were measured after the flood. The observations were used to calibrate the model in the 400m-long most downstream reach. Similarly, visual flood documentation during the event was used to model the event and validate it in the 800m-long most downstream reach.

To calibrate the model, GIS-classified wet and dry areas in the computational domain were compared with wet and dry areas observed along both banks, calculating the BIAS and RMSE for each calibration Manning. According to the sensitivity analysis, the model with Manning’s roughness coefficient of 0.065 in the upper and middle reach and 0.075 downstream showed the lowest global errors (i.e. RMSE= 1.1cm), although the numerical models generally underestimated the observed water levels (i.e. -8cm <BIAS< -1cm).

Two of the critical locations are located near bridges and the other two near a bank with very fine material, easy to erode. The preferential flow paths indicate that the erosion occurred mainly in the left floodplain. IberPlus simulated satisfactorily the observed maximum flood extent, i.e. F and C indices of 60%–87%. The results for the 2017 flood using IberPlus were compared to the (non-calibrated) hydraulics from literature using TELEMAC-MASCARET and FINEL2D. The IberPlus hydrodynamic model had the highest roughness coefficients from all the modelling studies. This might explain the significantly higher hydraulic values observed, in agreement with those obtained by the morphodynamic models. The paths preferred by the flow during the flood and the flood extent are resembling in all three models.

The F and C indices and the incremental precision between scenarios were estimated for 44,000–11.6 million cells models with uniform and variable mesh sizes. The optimal precision-gain was at model size <150,000 cells for variable mesh (R2 =0.65) versus >700,000 cells for uniform mesh (R2 >0.94), with a precision gain limited to 5–7% at best when using a finer grid. Uncertainties in the flood mapping used for validation, the hydrodynamic model set-up and input data contributed to the offset. The model precision is limited by the on-site flood protections implemented to protect private property during the flood event. These protections were effective and reduced the flood damage by 43%, yet they could not be implemented in the numerical model. Also, the model validation was carried out against a fully water-covered area, where some local dry cells were considered wet. Remotely sensed data helps understand flood dynamics and monitor flood risk in data-scarce regions.

How to cite: Moraru, A.: Reconstruction and optimal modelling of a flash flood in a steep Norwegian river using remotely sensed- and in-situ data, EGU General Assembly 2023, Vienna, Austria, 23–28 Apr 2023, EGU23-9709, https://doi.org/10.5194/egusphere-egu23-9709, 2023.

EGU23-11021 | ECS | Orals | HS6.3

Inundation and water quality assessment of the Karun river before and after flooding using remote sensing 

Kiana Yahyazadeh Shourabi, Mohammad Hossein Niksokhan, and Soroosh Roozitalab

Natural hydrological phenomena such as floods are among the most crucial hazards, damaging both urban and rural areas. River floods not only result in human and financial losses, but also alter the quality parameters and biological diversity of the river. Karun is one of the largest and wettest rivers in Iran, and its basin experiences numerous floods every year. In this work, satellite data are used to examine how floods affect the Karun River's quality. Specifically, we use NDWI (Normalized Difference Water Index), NDCI (Normalized Difference Chlorophyll Index), and NDTI (Normalized Difference Turbidity Index) data from Sentinel-2 Optical satellite to assess the water quality before and immediately after flooding. Additionally, Sentinel-1 Synthetic-aperture radar (SAR) satellite data are used to observe changes in the river bed and its inundation. This study demonstrates how Sentinel-2 and Sentinel-1 satellites could be effectively used to study variations in water quality and waterbodies at various periods. The results also show how the waterbody and water quality change before and after the flood.

How to cite: Yahyazadeh Shourabi, K., Niksokhan, M. H., and Roozitalab, S.: Inundation and water quality assessment of the Karun river before and after flooding using remote sensing, EGU General Assembly 2023, Vienna, Austria, 23–28 Apr 2023, EGU23-11021, https://doi.org/10.5194/egusphere-egu23-11021, 2023.

EGU23-11185 | ECS | Posters on site | HS6.3

Analysis of compound flooding in the Tapi River Basin 

Zafar Beg and Kumar Gaurav

We coupled a hydrologic model Variable Infiltration Capacity (VIC) with the Hydrologic Engineering Center River Analysis System (HEC-RAS-2D) to model the compound impact of flood drivers in the Tapi River basin, India. Our modelling framework consists of two distinct phases; firstly, we calibrate and validate the VIC simulated daily stream flow of the Tapi River using the data observed at the Sarangkheda gauge (upstream of Ukai Reservoir) during the 2005-2012 and 2013-2016, respectively. Secondly, to simulate the high and low flow events, a separate HEC-RAS 2D model is forced with flood hydrograph (Ukai dam release) and stage hydrograph (Tidal level at Hazira) as upstream and downstream boundary conditions, respectively. We calibrated this hydrodynamic model for the 2012 flood event and validated it for the 2006 and 2014 flood events with the observed discharge and water level at the five gauges (Kakrapar Weir, Ghala, Kathor, Singanpur Weir and Nehru Bridge) located along the Tapi River in the Lower Tapi Basin (LTB). We observed that the VIC simulated daily stream flow accords well with the observed in-situ measurements. The Kling-Gupta and Nash Sutcliffe Efficiency values for calibration are 0.84 and 0.86, while, for validation, the values are 0.78 and 0.71, respectively. Furthermore, the hydrodynamic model analysis indicates satisfactory performance with the Root Mean Square Error (RMSE) for discharge and water levels in the range of 300-325 m3s-1 and 0.12–0.43 m, respectively. Finally, we prepare the flood hazard maps to provide critical insights for effective flood management and to enhance the flood resilience of the flood-prone regions of the LTB.

How to cite: Beg, Z. and Gaurav, K.: Analysis of compound flooding in the Tapi River Basin, EGU General Assembly 2023, Vienna, Austria, 23–28 Apr 2023, EGU23-11185, https://doi.org/10.5194/egusphere-egu23-11185, 2023.

EGU23-11794 | ECS | Orals | HS6.3

Observing with Sentinel-1 widespread flood crises of 2022 in Pakistan and Nigeria 

Florian Roth, Mark Edwin Tupas, Bernhard Bauer-Marschallinger, and Wolfgang Wagner

Flood events are a major threat to human lives and are often responsible for a substantial destruction of infrastructure. Unfortunately, the obstruction of transport links often prevents the accessibility of certain regions and the impact cannot be estimated, especially during large scale flood events. In such crises, earth observation data provide the most valuable information. Due to their cloud-independent observations, microwave satellites are well-suited for observing the flood extent in these situations. In 2022, millions of people were affected when large flood events hit Pakistan and Nigeria. Both events were covered by images taken by the European Synthetic Aperture Radar (SAR) satellite Sentinel-1, whereby the event in Pakistan was captured more frequently compared to the one in Nigeria.

The Global Flood Monitoring (GFM) component of the Copernicus Emergency Management Service (CEMS) utilises Sentinel-1 to automatically map floods on a global scale. The service relies on three independent flood mapping algorithms combined to an ensemble solution, and one of them was developed by the Technische Universität Wien (TU Wien). The algorithm (Bauer-Marschallinger et al., 2022) performs a pixel-wise Bayesian decision between flood and no-flood situation. For this, a local no-flood backscatter signature is provided based on a time-series-based harmonic model. The flood backscatter signature is defined by a linear model for water surfaces. Thanks to this setup, the algorithm provides its results without the need for any manual intervention and allows fast and lightweight computation.

This contribution analyses results of the TU Wien algorithm for the two large scale events in Pakistan and Nigeria, and will include the presentation of the affected areas, as well as the temporal progression of the flood crises. The performance evaluation of events of such magnitude generally lacks comprehensive ground-truth data and is commonly performed based on other satellite-derived data. Expanding the scope of a previous study of the Pakistan flood (Roth et al., 2022), we compare the results to other datasets being retrieved from multi-temporal data and cover the larger area of the event. The required reference data were received from a local and global flood mapping service, namely Sentinel Asia and the United Nations, respectively. Finally, the varying Sentinel-1 coverage density in respect to flood progression will be discussed to obtain insights into the impact of the satellite overpass frequency on the flood mapping quality.


Bauer-Marschallinger, B., Cao, S., Tupas, M. E., Roth, F., Navacchi, C., Melzer, T., ... & Wagner, W.: Satellite-Based Flood Mapping through Bayesian Inference from a Sentinel-1 SAR Datacube, Remote Sensing, 14(15), 3673, 2022.

Roth, F., Bauer-Marschallinger, B., Tupas, M. E., Reimer, C., Salamon, P., and Wagner, W.: Sentinel-1 based analysis of the Pakistan Flood in 2022, EGUsphere [preprint], https://doi.org/10.5194/egusphere-2022-1061, 2022.

How to cite: Roth, F., Tupas, M. E., Bauer-Marschallinger, B., and Wagner, W.: Observing with Sentinel-1 widespread flood crises of 2022 in Pakistan and Nigeria, EGU General Assembly 2023, Vienna, Austria, 23–28 Apr 2023, EGU23-11794, https://doi.org/10.5194/egusphere-egu23-11794, 2023.

EGU23-11838 | Posters on site | HS6.3

Surface runoff estimation in urban areas via remotely sensed greenery and composite curve number 

Guy J.-P. Schumann, Paolo Tamagnone, and Ben Suttor

Traditionally, flood risk maps used by city officials and water resource managers for urban planning, by engineers for adequate flood defence infrastructure design, or by insurers and re-insurers for estimating financial risk exposure are the result of modelling flood hazard of rivers and their associated floodplain lands at different return periods. Often, any of these stakeholders would use the 1:100 return period of fluvial hazard to plan accordingly. 

However, with the climate crises signals clearly present during recent flood disasters, and especially with the 2021 Europe floods, water managers, cities and the financial risk sector are now starting to plan differently and are recognizing the need not only for better and more frequently updated flood risk analysis, particularly in urban areas, but also need to consider pluvial and flash floods that can happen in any part of a river basin and oftentimes take place in headwater areas or off the main river floodplains. Flash flooding greatly impacts urban areas where the storm drainage infrastructure is becoming largely insufficient due to the increasing duration and higher frequency of extreme intense rainstorms. Therefore, model simulations of flood hazard that account for these rather unprecedented types of extremely destructive events are required, and those need to be integrating the newest data from all types of sensors. At the same time, we observe that sustainable, nature-based solutions are now sought after because these solutions offer an inviting alternative to ever changing flood risk, particularly under the present and future climate crisis.  

It is stipulated that increasing healthy urban vegetation cover could reduce this risk and is a form of a nature-based solution for urban areas. Here we combine existing methods from the literature and develop a methodology relating  time-series of satellite-based vegetation maps, topography and soil permeability to estimate excess runoff from intense precipitation. The runoff coefficient is mapped through the use of a composite curve number method.. The method of looking at  the partition between rainfall and runoff is highly correlated to change in land use, and thus changes in vegetation cover. Relying on the NDVI index for green vegetation mapping, the methodology is able to capture the differences in the hydrological response even for seasonal or canopy integrity changes. Looking at different vegetation cover scenarios therefore allows the creation of different runoff responses, and therefore a possible reduction in flood risk.In this paper, we present initial results of this flood risk analysis, the goal of which is to produce runoff change maps at city, urban neighbourhood or city post code level using different scenarios in rainfall amounts from design storms coupled with existing or planned urban vegetation cover scenarios.

How to cite: Schumann, G. J.-P., Tamagnone, P., and Suttor, B.: Surface runoff estimation in urban areas via remotely sensed greenery and composite curve number, EGU General Assembly 2023, Vienna, Austria, 23–28 Apr 2023, EGU23-11838, https://doi.org/10.5194/egusphere-egu23-11838, 2023.

EGU23-12183 | ECS | Orals | HS6.3

Flooded area monitoring using SAR image-based water body detection technique 

Wanyub Kim, Seulchan Lee, and Minha Choi

Flood is one of main water disasters and causes damage to human life and property. The spatial and temporal disproportion of precipitation due to recent climate change causes flood worldwide every year. As the severity of flood rises, accurate monitoring of flooded areas is being essential for preparation and adaptation. Due to the wide area-occurring characteristics of flood, the use of remote sensing is effective for detecting of flooded areas. In a SAR image, surface of water body appears smooth, so the backscattering coefficient value is generally low. Conversely, surface of non-water body is rough, so the backscattering coefficient value is high. It is possible to divide water body and non-water body by using the characteristics of the backscattering coefficient and specific threshold value. However, the histogram of the backscattering coefficients around rivers where flood occurs most often has a multi-modal distribution, so there is a limit in detecting water bodies using a threshold value only. In this study, a histogram-based multi-threshold method, an AI-based K-means clustering method, and an object segmentation-based Chan-Vese method were used to detect water bodies before and after floods in Sentinel-1 SAR images. The water/non-water body classification image from the Sentinel-2 optical image was used for validation. If SAR images with high spatial and temporal resolution will be available, it is expected that efficient water disaster management will be possible through near real-time detection of flooded areas. 

How to cite: Kim, W., Lee, S., and Choi, M.: Flooded area monitoring using SAR image-based water body detection technique, EGU General Assembly 2023, Vienna, Austria, 23–28 Apr 2023, EGU23-12183, https://doi.org/10.5194/egusphere-egu23-12183, 2023.

In recent years, heavy rainfall events and resulting flash floods have increasingly caused widespread damage to public and private technical infrastructures in Germany. Flood events occurred often at smaller water bodies or as hillslope surface runoff far from the actual watercourses. During extreme events technical measures are often overloaded, so that in addition to local property protection planned emergency runoff pathways can be designated as an essential element of water-sensitive urban development.

The research project ‘Urban Flood Resilience - Smart Tools’ (FloReST), funded by the German Federal Ministry of Education and Research (BMBF), is exploring those measures to increase the resilience of infrastructures after flash floods.

The aim of this study is the development and demonstration of an experimental setup to improve high-resolution digital mapping of existing surface flow pathways in urban areas using UAV-based thermal imaging in combination with flooding experiments. For this purpose, already known critical points, i.e., dysfunctional emergency drainage sections in the urban infrastructure within the City of Trier, Germany were identified.

Within this setting, during relatively warmer or colder days, respectively, we use artificial water releases as a thermal marker of the potentially emerging surface flow pathways. Combining UAV-based visual (RGB) and thermal (infrared) imaging, high-resolution mapping of the potential surface flow paths and their Thalweg is then possible.

Using a hydrological model allows for determining extreme discharges potentially generated in the connected catchment areas. Based on a digital terrain model the locally surveyed water levels and flow paths are then scaled up to potentially occurring water levels during extreme discharges. Depending on the occurrence probability of the extreme discharges a set of high-resolution GIS-datasets of the emergency surface flow pathways around objects at risk of flooding can be generated.

How to cite: Bartsch, J. and Schuetz, T.: Mapping surface flow pathways in urban areas using UAV-based thermal imaging in combination with flooding experiments, EGU General Assembly 2023, Vienna, Austria, 23–28 Apr 2023, EGU23-13431, https://doi.org/10.5194/egusphere-egu23-13431, 2023.

EGU23-16793 | Orals | HS6.3

Flood rapid mapping for immediate response: from semi-automatized delineation to AI-derived estimations 

Sébastien Delbour, Christophe Fatras, and Vera Gastal

In the frame of the Copernicus Emergency Management Service - Rapid Mapping, reliable flood maps must be delivered to users within six hours from the availability of remote sensing data. This data can be of different types, either from optical or SAR datasets, which all present different properties (wavelengths, band availability, resolution, etc.). This production is currently performed using semi-automatic methods and processes, to avoid misclassification and provide flood maps as accurate as possible. In order to improve service delivery performances including for covering very large areas, there is a need of an accurate automatically produced first guess, to eventually be modified manually. This is the main reason why the use of AI to learn and detect flooded areas is explored here for both optical and SAR data. The FloodML project used a random forest approach mixed with an in-house learning database to assess flood maps from both optical and SAR datasets. It showed good results, and can cover automatically a 10,000 km² area in a few minutes only. The success of this first approach led to both FloodDAM and FloodDAM-DT projects. These follow-ons now focus on the detection of water height level irregularities in local river gauges, to then produce flood maps if needed, to potentially lead to a modelling of the flood event evolution through data assimilation.

How to cite: Delbour, S., Fatras, C., and Gastal, V.: Flood rapid mapping for immediate response: from semi-automatized delineation to AI-derived estimations, EGU General Assembly 2023, Vienna, Austria, 23–28 Apr 2023, EGU23-16793, https://doi.org/10.5194/egusphere-egu23-16793, 2023.

EGU23-17379 | ECS | Posters on site | HS6.3

Flood twin experiment for estimating the potential of satellite observations in shallow-water simulations 

Jean-Paul Travert, Cedric Goeury, Vito Bacchi, Fabrice Zaoui, and Sebastien Boyaval

With more than one billion people exposed to floods throughout the world, this natural hazard is the most common and devastating one, resulting in loss of lives and damaging personal properties or sensitive infrastructures. Numerical models have become essential to forecast and to mitigate their consequences, but they remain uncertain mainly due to the lack of high-resolution data and the inherent uncertainties related to the simplified representation of natural phenomena.

The growing availability of satellite observations distributed in time and space is a valuable source of information for improving flood modelling. Additional data like water level or flood extent can be extracted and used to calibrate numerical models.

This study proposes to analyse the potential of remote sensing data as a complement to in-situ observations (from hydrometric stations) in the calibration process of shallow-water flood numerical models. A two-dimensional twin experiment of an extreme flood event overflowing into the floodplains is carried out on a 50 km reach on the Garonne River in France between Tonneins and La Réole. The roughness coefficients are computed as solutions to an inverse problem mixing both in-situ (pointwise and high-frequency) and satellite observations (spatially distributed but low-frequency) data. Data assimilation combining uncertain model simulations and observations has proven efficient for improving hydraulic models. However, an open question is the choice of the best information to assimilate (water level or/and flood extent maps) into the hydraulic models. We study this problem by testing different assimilation configurations. The satellite observations are not considered perfect, so the numerical solutions are compared with different noise levels.

How to cite: Travert, J.-P., Goeury, C., Bacchi, V., Zaoui, F., and Boyaval, S.: Flood twin experiment for estimating the potential of satellite observations in shallow-water simulations, EGU General Assembly 2023, Vienna, Austria, 23–28 Apr 2023, EGU23-17379, https://doi.org/10.5194/egusphere-egu23-17379, 2023.

EGU23-17400 | Posters on site | HS6.3

Innovating global flood alerting with an ensemble of models and remotely sensed observations 

Bandana Kar, Prativa Sharma, Doug Bausch, Jun Wang, Guy Schumann, and Margaret Glasscoe

At the global level, several flood related tools are available for free, ranging from observations to modeling and forecasting, using field data, remotely sensed observations as well as hydrologic and hydrodynamic models (for more details of available tools, see EOTEC DevNet’s tool tracking capacity building resources for flooding at https://eotec-dev.ceos.org/tools/). In this context, the Global Flood Awareness System (GloFAS) managed by Copernicus, for instance, aims to facilitate response to flooding, particularly in countries that cannot forecast these events on their own.

However, having an EWS available to all globally, with consistent accuracy and reliability, for alerting at different severity levels, will not only aid with reduction of flood impacts, but also assist with improving resilience of these counties. 

In this paper, we present the model of models (MoM), which is an ensembled model that forecasts flood severity daily, globally at sub-watershed level. MoM integrates the outputs of GloFAS, GFMS, and HWRF models to forecast severity and uses MODIS and VIIRS outputs for calibration and validation of severity scores.

The flood severity risk score is used to obtain and process high-resolution Earth observation data to assess flood depth and extent at granular level and estimate flood impact on critical infrastructure.

The flood severity score is used to trigger dissemination of alerts using PDC’s DisasterAWARE® platform.

We present a number of real event cases where MoM has been activated to alert and assist with event response activities, including performance validation with high-resolution satellite flood maps.

How to cite: Kar, B., Sharma, P., Bausch, D., Wang, J., Schumann, G., and Glasscoe, M.: Innovating global flood alerting with an ensemble of models and remotely sensed observations, EGU General Assembly 2023, Vienna, Austria, 23–28 Apr 2023, EGU23-17400, https://doi.org/10.5194/egusphere-egu23-17400, 2023.

EGU23-448 | ECS | Posters on site | HS6.4

Water Extent Measurements with Sentinel-6 Fully - Focussed SAR data 

Adrià Gómez Olivé, Ferran Gibert, Albert Garcia-Mondéjar, and Charlie McKeown

The Sentinel-6 mission, launched in November 2020, carries a radar altimeter operating in open burst with a PRF high enough (~9kHz) to perform the focussing of whole target observation echoes in a fully coherent way. Furthermore, such a feature allows improvement of the along-track resolution down to the theoretical limit of around 0.5 m when processing the data with a Fully-Focussed SAR (FFSAR) algorithm. This resolution increment actually represents a revolutionary step with respect to the ~300 m along-track resolution provided by current operational processors based on Unfocussed SAR algorithms, commonly used in radar altimeters with a closed burst chronogram, such as CryoSat-2 and Sentinel-3. In this contribution, we explore new applications over inland water surfaces, such as reservoirs or lakes derived from the new Sentinel-6 FFSAR products. Indeed, a FFSAR Ground Prototype Processor (GPP), developed by isardSAT and based on the backprojection algorithm [1], has been used to process altimetry data and generate FFSAR radargrams of off-nadir inland targets located within certain observation constraints. As a main outcome, we present a methodology to geo-reference and estimate the extension of water bodies located on unambiguous across-track targets and that present strong seasonal extension variability. Validation of the method has been performed by comparing the FFSAR water extent measurements derived from Sentinel-6 against optical (Sentinel-2) measurements and in-situ observations.


[1] Egido, Alejandro and Walter H. F. Smith. “Fully Focused SAR Altimetry: Theory and Applications.” IEEE Transactions on Geoscience and Remote Sensing 55 (2017): 392-406.

How to cite: Gómez Olivé, A., Gibert, F., Garcia-Mondéjar, A., and McKeown, C.: Water Extent Measurements with Sentinel-6 Fully - Focussed SAR data, EGU General Assembly 2023, Vienna, Austria, 23–28 Apr 2023, EGU23-448, https://doi.org/10.5194/egusphere-egu23-448, 2023.

EGU23-449 | ECS | Orals | HS6.4

Water Surface Height Measurements with Sentinel-6 Fully-Focussed SAR Over Inland Targets 

Robert Molina Burgués, Ferran Gibert, Adrià Gómez, Albert Garcia-Mondéjar, and Mònica Roca i Aparici

The Sentinel-6 mission, launched in November 2020 is a satellite mission carrying an altimeter operating in open-burst, the Poseidon-4 altimeter. This altimeter has a PRF of approximately 9 kHz, able to perform focussing of whole target observation echoes in a totally coherent way. This means that not only we are obtaining measurements with very reduced contaminant contributions coming from along-track replicas, but also the along-track resolution can therefore be narrowed down to its theoretical limit (∼0.5 m) when processing the data with a Fully-Focussed SAR (FF-SAR) algorithm. The latter is what is of interest, especially when compared to the ∼300 m along-track resolution provided by other operational processors based on Unfocussed SAR algorithms, widely used in the bast majority of satellite missions with radar altimeters that operate with closed-burst (e.g. Sentinel-3).

In this study, we apply this algorithm to perform measurements of the water surface height (WSH) over a series of inland targets including relatively small reservoirs and lakes, with typical sizes between 0.1 and 10 km. To do so, a FF-SAR Ground Prototype Processor (GPP) developed by isardSAT and based on the back projection algorithm [1] has been used to process the Sentinel-6’s altimetry data and generate FF-SAR L1B records of the nadir targets being evaluated. This study will present the methodology defined to obtain the WSH measurements using the FF-SAR products alongside the validation process, based on comparison of results with in situ water height measurements.


[1] Egido, Alejandro and Walter H. F. Smith. “Fully Focused SAR Altimetry: Theory and Applications.” IEEE Transactions on Geoscience and Remote Sensing 55 (2017): 392-406.

How to cite: Molina Burgués, R., Gibert, F., Gómez, A., Garcia-Mondéjar, A., and Roca i Aparici, M.: Water Surface Height Measurements with Sentinel-6 Fully-Focussed SAR Over Inland Targets, EGU General Assembly 2023, Vienna, Austria, 23–28 Apr 2023, EGU23-449, https://doi.org/10.5194/egusphere-egu23-449, 2023.

EGU23-754 | ECS | Orals | HS6.4

InSAR-AI-Based Approach for Groundwater Level Prediction in Arid Regions 

Behshid Khodaei, Hossein Hashemi, Seyed Amir Naghibi, and Ronny Berndtsson

Lake Urmia, located in northwestern Iran, is the largest salt lake in the Middle East (ME) and one of the largest hypersaline lakes in the world. The lake has an important role in biodiversity preservation and the economic and cultural aspects of its surrounding region. Over the last two decades, the combined effects of climate change and anthropogenic activities have caused a significant depletion of lake water. The interaction of lake water and groundwater has motivated us to study the surrounding aquifers to determine the impact of human activities on the lake. The Shabestar plain located in the northeast of Lake Urmia is chosen as the research area for the current study. The goal is to find a Remote Sensing (RS) based method to estimate the changes in groundwater level, due to over-exploitation, both in time and space. We use a random forest algorithm to determine the contribution of different factors in the estimation of the aquifer’s hydraulic properties. Input data include the surface deformation rate produced by Interferometric Synthetic Aperture Radar (InSAR) technique between 2016 and 2022, weather-driven parameters including temperature, precipitation, soil moisture, normalized differential vegetation index, and evapotranspiration, and the hydrological factors including observed well and lake water levels. The built model is then used for estimating the spatiotemporal groundwater level changes throughout the aquifer. The groundwater level change and its relationship with the lake water surface is investigated. The model has the potential to be generalized in the estimation of groundwater depletion in similar aquifers.

How to cite: Khodaei, B., Hashemi, H., Naghibi, S. A., and Berndtsson, R.: InSAR-AI-Based Approach for Groundwater Level Prediction in Arid Regions, EGU General Assembly 2023, Vienna, Austria, 23–28 Apr 2023, EGU23-754, https://doi.org/10.5194/egusphere-egu23-754, 2023.

EGU23-870 | ECS | Orals | HS6.4 | Highlight

Major changes in the dynamics of Amazon surface waters revealed by hydrodynamic modeling, in situ and multisatellite data 

Ayan Fleischmann, Fabrice Papa, Alice Fassoni-Andrade, Stephen Hamilton, Sly Wongchuig, Rodrigo Paiva, Jhan Carlo Espinoza, John Melack, Etienne Fluet-Chouinard, André Zumak, Priscila Alves, Adrien Paris, Daniel Moreira, Thiago Silva, Dai Yamazaki, Menaka Revel, and Walter Collischonn

The vast Amazon wetlands support multiple social-ecological systems basin-wide, and influence global water and carbon cycles. Recent environmental changes related to climate and infrastructure expansion have altered their rhythmicity and dynamics in many aspects, and understanding their impacts on hydrological variables such as river and floodplain water levels and discharges, inundation extent and storage, is urgent. The combination of new hydrodynamic modeling approaches with in situ and multisatellite data provides great opportunities to fostering this research agenda.

Here, we present an unprecedented analysis of the Amazon’s surface water dynamics, its status and long-term trends, as well as perspectives with in situ and satellite data. We analyze inundation extent, water levels and river-floodplain interactions based on in situ (water levels across rivers and floodplains) and satellite data (radar altimetry, optical imagery, passive microwave and L-band SAR), as well as hydrodynamic modeling (MGB and CaMa-Flood models). Firstly, we present the outcomes of a recent intercomparison project where 29 inundation datasets were compared across the basin (Fleischmann et al., 2022; WebGIS at <http://amazon-inundation.herokuapp.com/>). While a higher agreement was observed along the Amazon river floodplain, major discrepancies occurred for interfluvial wetlands, stressing the need of pursuing optimal merging techniques to improve local to large-scale inundation estimates. By looking at the dynamic inundation datasets, we were able to analyze long-term inundation trends, revealing a major increase of 26% in the maximum annual inundation across the Amazon River system since 1980, associated with longer flood duration and higher river-floodplain connectivity over multiple areas.

While changes in regional-scale hydroclimatic processes have led to the intensification of the Amazon’s hydrological cycle, local geomorphological processes are able to largely alter river-floodplain interactions. To investigate it, we used long-term optical data from the Global Surface Water dataset to assess changes along the Amazon River channels and the associated erosion/sedimentation processes. Our results evidence major changes along the river over the last decades, and a mapping of the impacts on 238 riparian communities shows that 21% have been largely affected by bank erosion, damaging several properties, while 19% have been affected by sedimentation, impairing transportation and reducing access to the river waters.

Finally, we present the first outcomes of a new floodplain hydrology monitoring network in the Mamirauá region of Central Amazon, which includes the widest floodplain reach of the Amazon. The network under development is the first of its kind in the Amazon, and aims at improving our understanding of river-floodplain dynamics through the optimal combination of in situ (more than 25 in situ water level loggers, several weather stations, among others) and satellite data, especially from current SAR altimetry missions such as Sentinel-3A/B and Sentinel6 and the forthcoming wide-swath SWOT mission. The presented results provide an important step towards a broad understanding of the Amazon surface water dynamics, from basin to local scales, and the sustainable use of the region’s river and wetland resources.

How to cite: Fleischmann, A., Papa, F., Fassoni-Andrade, A., Hamilton, S., Wongchuig, S., Paiva, R., Espinoza, J. C., Melack, J., Fluet-Chouinard, E., Zumak, A., Alves, P., Paris, A., Moreira, D., Silva, T., Yamazaki, D., Revel, M., and Collischonn, W.: Major changes in the dynamics of Amazon surface waters revealed by hydrodynamic modeling, in situ and multisatellite data, EGU General Assembly 2023, Vienna, Austria, 23–28 Apr 2023, EGU23-870, https://doi.org/10.5194/egusphere-egu23-870, 2023.

EGU23-1206 | Orals | HS6.4

Passive Microwave Emission Theory and Applications to Satellite Measurements of Global Rivers 

Son Nghiem, Robert Brakenridge, Zsofia Kugler, and Anna Podkowa

River stage (surface water level H), discharge (volumetric water flow rate Q), and seasonal ice cover (freeze-up timing F, and break-up timing B) are crucial observables for hydrology and water cycle science.  In-situ river gauging measurements of H, Q, F, and B are laborious and costly to install and maintain at a limited number of locations.  It will be a breakthrough to use satellite data for global river measurements on a nearly-daily basis with multi-decadal data records.  Passive microwave radiometer (PMR) data have been collected from space globally since the 1980s.  Nevertheless, the typical satellite PMR resolution is coarse (10s km), which is much larger than general river widths.  The key question is how PMR can possibly measure the river parameters. 

The answer is physically founded on the first principle of Maxwell equations to derive vector wave equations for all polarization combinations in heterogeneous multi-layered geophysical media.  The wave equations are solved with dyadic Green’s functions subject to boundary conditions. The renormalization method is applied to determine the effective permittivity in each layer while all multiple wave-boundary interactions are included. To circumvent the limitation of the isothermal condition in the Kirchhoff approach, the fluctuation-dissipation theorem is used to calculate the brightness temperatureTb(h) for the horizontal polarization (the first modified Stoke parameter), Tb(v) for the vertical polarization (the second parameter), the polarization cross-correlation amplitude U (the third parameter), and the phase V (the fourth parameter).

Based on this physical foundation, a protocol to derive the river observables (H, Q, F, and B) is developed due to the high sensitivity of microwave emissivity of water versus ice and soil conveyed in the brightness temperatures. This overcomes and renders the high spatial resolution requirement unnecessary for river remote sensing by wide-swath PMR for global river observations on a daily or near-daily basis. The PMR method relies on the total areal change of river water within the footprint rather than depending on the river width per se.  As such, PMR can measure a narrow river when its meandering makes a sufficient total surface area in the PMR footprint.  The PMR method is also robust against short-term river channel migration and in-stream sand bars that can be changed by river sedimentation and dynamic processes.

To demonstrate the PMR capability for river monitoring, examples of satellite results for river measurements are compared and validated with in-situ river gauging time-series data records for various rivers from the tropics to cold land regions using PMR data at Ka-band such as AMSR-E, AMSR2, TRMM, and GPM and at L-band such as SMOS and SMAP.  The capability to measure global rivers allows PMR satellite missions to address hydrology and water cycle science as a key contribution, including the future Copernicus Imaging Microwave Radiometer (CIMR) to be launched in the 2025+ time frame, further extending the existing long-term data records for river measurements. Moreover, a significant advance of water cycle science is expected with the synergy of PMR together with SWOT successfully launched by NASA in December 2023.

How to cite: Nghiem, S., Brakenridge, R., Kugler, Z., and Podkowa, A.: Passive Microwave Emission Theory and Applications to Satellite Measurements of Global Rivers, EGU General Assembly 2023, Vienna, Austria, 23–28 Apr 2023, EGU23-1206, https://doi.org/10.5194/egusphere-egu23-1206, 2023.

EGU23-3714 | ECS | Posters on site | HS6.4

Proof-of-concept for the assimilation of multi-mission remote sensing data for large-scale discharge estimation 

Sly Wongchuig, Rodrigo Paiva, Vinícius Siqueira, Sylvain Biancamaria, Fabrice Papa, Adrien Paris, and Ahmad Al Bitar

The understanding and prediction of the variability of the hydrological state of watersheds across the planet is growing, as water is a fundamental human need and therefore important for science and society. In the last 20 years, significant advances have been made toward hydrological modeling of large river basins, and also continental to global-scale land areas. Remote sensing has been widely used in hydrology because, in addition to being a clear advantage in regions with a poor monitoring network, it has proven to be suitable for use in global and continental hydrological applications.

The estimation of river discharge is of paramount importance, as it is considered an aggregator of all water cycle processes in the basin. On the one hand, estimates of discharge solely from space remain limited because they are not the primary focus of current satellite missions. On the other hand, simulations of hydraulic variables have been performed with large-scale hydrologic and hydrodynamic models, but the accuracy of their estimates can be improved with recent techniques such as data assimilation (DA). DA techniques have been developed to use remotely sensed datasets to obtain the best estimate of the current state of a system by optimally combining observations and large-scale hydrological models. Recent studies have also demonstrated the advantages of assimilating several types of datasets at the same time, which can help to further constrain the model state variables to be more physically representative.

Thus, the main objective of this research is to develop a proof-of-concept for estimating hydraulic variables such as discharge and water level by assimilating multiple remotely sensed datasets into a large-scale hydrologic and hydrodynamic model. Experiences on the assimilation of different mission datasets into a large-scale hydrological model are discussed, including radar altimetry-derived water level from JASON, ENVISAT and Sentinel missions, terrestrial water storage from GRACE mission, flooded area extent from SWAMPS database and soil moisture from the SMOS mission.

To develop our proof-of-concept, the Amazon as the study area. We used the hydrologic-hydrodynamic MGB model and the Local Ensemble Kalman Filter as the DA method as it has been commonly used in hydrologic models. Different localization and multivariable assimilation techniques were implemented to improve the effectiveness of the DA.

The results indicate that the multi-mission assimilation approach is able to smooth/average the improvement of the state variables of the model, such as discharge and water level anomaly, compared to the experiment of assimilating the mission datasets individually. This proof-of-concept allows us to spatialize the improvement of the dynamics of hydrological-hydrodynamic variables based on large-scale hydrologic modeling and DA from global remote sensing sources only, without requiring in-situ data. As our proof-of-concept is based on datasets globally available and a hydrologic-hydrodynamic model that can be applied almost everywhere, it is fully replicable in any region of the world and represents a great potential for regional to continental studies.

How to cite: Wongchuig, S., Paiva, R., Siqueira, V., Biancamaria, S., Papa, F., Paris, A., and Al Bitar, A.: Proof-of-concept for the assimilation of multi-mission remote sensing data for large-scale discharge estimation, EGU General Assembly 2023, Vienna, Austria, 23–28 Apr 2023, EGU23-3714, https://doi.org/10.5194/egusphere-egu23-3714, 2023.

EGU23-4806 | ECS | Posters on site | HS6.4

Major Role of Surface-groundwater Interactions for Sustaining Spring Wetlands of the Great Artesian Basin, Australia 

Pankaj R. Kaushik, Christopher E. Ndehedehe, Ryan M. Burrows, Mark R. Noll, and Mark J. Kennard

Groundwater is an essential resource for sustaining human life and associated ecosystems such as rivers and springs. Springs, fed by groundwater on the surface, regulate ecosystem services, including drought mitigation and support for biodiversity. However, climate variability and groundwater extraction for domestic and industrial use in the Great Artesian Basin (GAB) are contributing to groundwater stress, limited surface water in springs, and slowing groundwater recharge processes. Thus, an improved understanding of surface-groundwater interactions in springs is required in the GAB region.  This study demonstrates the potential of the Gravity Recovery and Climate Experiment (GRACE) satellite observations to determine groundwater storage variation through validation with borewell monitoring data in the GAB. An important aspect of this study was to assess the surface-groundwater interactions to better explain the variability of spring extent in the GAB for the five spring supergroup sites: Springvale, Flinders, Eulo, Barcaldine, and Springsure. We used Partial Least Square Regression (PLSR) method to assess the response of groundwater storage to hydrological variables (e.g., surface water extent, rainfall, soil moisture storage, evapotranspiration, and surface water level) and vegetation greenness between 2002 and 2017 in the spring supergroups. The predicted and observed groundwater storage is well correlated with hydrological variables post La-Niña (2011-2017) compared to the pre La-Niña (2002-2010) period. This study revealed the importance of variations in climate in understanding how groundwater responds to predictors (vegetation greenness and soil moisture storage) in spring supergroups. Overall, groundwater responses to several predictors (NDVI, mNDWI, rainfall, SWL, ET, and SMS), even before the heavy rainfall season were the strongest in the Flinders spring supergroup. The preliminary results from this method provide information and directions that underpins sustainable groundwater management in the complex geological GAB region and associated ecosystem services such as nutrient recycling and sustaining biodiversity.   

How to cite: Kaushik, P. R., Ndehedehe, C. E., Burrows, R. M., Noll, M. R., and Kennard, M. J.: Major Role of Surface-groundwater Interactions for Sustaining Spring Wetlands of the Great Artesian Basin, Australia, EGU General Assembly 2023, Vienna, Austria, 23–28 Apr 2023, EGU23-4806, https://doi.org/10.5194/egusphere-egu23-4806, 2023.

Wetland ecosystems have complex interactions of physical and biogeochemical processes, but the first step toward restoring the health of wetland ecosystems is an accurate understanding of the water cycle in wetland ecosystems. In addition, a quantitative understanding of the wetland water cycle is essential to utilize wetlands in regional water balance and ecosystem conservation. However, observational data essential for understanding the wetland water cycle are difficult to obtain through field measurements or are difficult to observe due to cost issues. Therefore, this study proposes a procedure for estimating wetland inflow using Sentinel-2 satellite data. To this end, a classification-based artificial intelligence model using data from major multi-purpose dams located on the Nakdong River in the southeastern part of the Korean Peninsula is designed. Input data for artificial intelligence learning is created by the following procedure. 1) Derivation of the water level-water surface area relationship curve using the water level-water volume relationship of the multi-purpose dam. 2) Using the water level-water surface area relationship curve and DEM, derive an identifier that distinguishes water and land areas. 3) Design a random forest model that compares Sentinel-2 satellite information and water-land identifiers. 4) Derivation of identifiers that can identify water and land in unmeasured wetland areas from water-land information of satellite information. By combining the water surface area of the wetland estimated through this process and the DEM of the wetland area, the wetland water level-water surface area-water volume relationship curve is calculated, and finally the wetland inflow is simulated. The simulated wetland inflow can be used to estimate the parameters of various hydrologic models, and it is expected that the understanding of the wetland water cycle can be improved by using the verified hydrological model.


Acknowledgement

This work was supported by Korea Environmental Industry&Technology Institute (KEITI) through Wetland Ecosystem Value Evaluation and Carbon Absorption Value Promotion Technology Development Project, funded by Korea Ministry of Environment (MOE). (2022003640001)


How to cite: Seo, J., Won, J., Lee, C., and Kim, S.: Wetland inflow simulation using artificial intelligence prediction model based on classification for water surface area identification, EGU General Assembly 2023, Vienna, Austria, 23–28 Apr 2023, EGU23-4884, https://doi.org/10.5194/egusphere-egu23-4884, 2023.

EGU23-4920 | ECS | Posters on site | HS6.4

Investigating InSAR-derived land motion due to aquifer compaction in the northeast regions of Haryana, India                  

Anirudh Sharma, Dr. Naresh Kumar, and Dr. Chandrakanta Ojha

Rapid urbanization and agricultural activities increase the dependency on groundwater (GW)  creating stress on aquifer systems in India. In Northern India, states like Haryana, Punjab, Delhi, and Rajasthan are facing acute freshwater crisis. The agrarian state, Haryana, which lies in the upper Yamuna and Ghaggar river basins with recent alluvial deposits of Indus alluvial plains, has a vast area under paddy cultivation. In particular, Kaithal, Karnal and Kurukshetra districts of Haryana are known for their highest rice cultivation which is continuous since 1970s. Although, Ghaggar and Markanda are the major seasonal rivers, groundwater is the largest source of irrigation in these district. The continuous use of groundwater results in sharp decline of water table. Farmers are using tubewell water instead of canal water due to less labor force and due to technology enhancement. Farmers are using deep tubewells to extract water and most of them have installed underground pipelines in the fields for irrigation. According to Haryana Water Resource Authority (HWRA), most of the villages of these districts are currently falling in the dangerous category of GW decline i.e., “Red Zone” means water level has  been declined more than 40 meters below ground level (mbgl). As per the Central Ground Water Board (CGWB) report, analyzing  monitoring wells depicts decline of water level from 10 to 30 mbgl from 2001 to 2021. So, lack of continuous monitoring mechanisms for investigating the groundwater system may create severe consequences of this high depletion rate and local scale subsidence. This study focused on the understanding of the line of sight (LOS) velocity map and hydraulic head level change over Kurukshetra, Kaithal and Karnal districts. We explore the ascending Synthetic Aperture Radar (SAR) data of the Sentinel-1 A/B sensor of the European Space Agency (ESA) with 183 acquisitions from 2016 to 2022 using path and frame numbers 27 and 91, respectively. We have processed sub swath F2. For the SAR data processing, we used the multi-temporal Interferometric Synthetic Aperture Radar (MT-InSAR) technique using an open-source tool, “GMTSAR-SBAS” by Sandwell et al. (2011). The reference image dated 09 January 2020 is used, and a Digital Elevation Modal (DEM) of Shuttle Radar Topographic Mission (SRTM3) with a spatial resolution of 90m used for topographic removal. Baseline thresholds of 60 (days) & 150 (meters) were used to generate 592 suitable interferograms for velocity and displacement time-series generation.

The unwrapping of interferograms was processed with Snaphu method, and interferograms were used to generate the Velocity time map. Small Baseline Subset (SBAS) analysis was performed for phase inversion and correction. As per the preliminary InSAR-derived LOS Velocity Map studies, these districts show a land movement ranging from -2 to more than -10 mm/year. InSAR-derived results show land motion of more than -10 mm/year in Kaithal,  -4 mm/year in Kurukshetra and -2 to -4 mm/year in Karnal. The preliminary analysis of Panipat district showed land movement of ~ 2 mm/year towards satellite.

The study will help for an effective water management plan and consequences of over-exploitation of groundwater in  Haryana.

How to cite: Sharma, A., Kumar, Dr. N., and Ojha, Dr. C.: Investigating InSAR-derived land motion due to aquifer compaction in the northeast regions of Haryana, India                 , EGU General Assembly 2023, Vienna, Austria, 23–28 Apr 2023, EGU23-4920, https://doi.org/10.5194/egusphere-egu23-4920, 2023.

Satellite altimetry is a technique for measuring height. Originally designed to observe sea level dynamics, it is now also used to monitor inland waters. Using this technique, water levels (WL) are measured at so-called virtual stations (VS), which are defined as areas where satellite ground tracks intersect with the river. One of the assumptions of hydrological analyses based on altimetric data is that a satellite repeatedly flies over exactly the same place and measures WL. However, due to orbit perturbations, the ground track of a given satellite may be shifted by +/- 1 km, and thus the altimetric measurements on a given VS are carried out at different places on the river at different moments of observations. Since rivers are inclined water bodies, measurements taken upstream of the center of a VS have a positive bias, while measurements taken downstream reveal a negative bias.

To correct altimetric measurements for the error described above, it is necessary to calculate the distance of a given measurement from the central point of a VS and to calculate the slope of the studied river section. In this paper, we present two separate approaches to determine the slope: (1) using WL from two adjacent gauges referenced to a common vertical datum (Kronsztadt’86), which allows the determination of river slope at each satellite measurement time (gauge-based approach), as well as (2) using mean water levels from two adjacent VS, which results in one river slope value for the entire study period (VS-based approach). Both approaches resulted in similar river slopes, ranging from 24 cm/km to 30 cm/km. To verify the effectiveness of the proposed method, we consider WL from 16 VS of the Sentinel-3 satellites located on the middle Odra/Oder River (W Poland) and calculated using a modified DAHITI approach (https://dahiti.dgfi.tum.de/en/, last access: 29/12/2022). Finally, three datasets are obtained (WL without the river slope bias correction, WL corrected with the gauge-based slopes and WL corrected with the VS-based slopes), and each of them is compared to water level anomalies from neighboring gauges.

The uncorrected WL time series reveal mean root mean squared error (RMSE) of 22 cm. Both corrections lead to a similar statistically significant improvement by more than 25%, reducing the mean RMSE by 5.64 cm and 5.74 cm for the gauge-based approach and the VS-based approach, respectively. Only on one VS the correction slightly increases the RMSE (by less than 1 cm). In the remaining stations the improvement ranges from 0.7 cm to 13.4 cm, which is a percentage change from 4.99% to 53.23%. The proposed correction is especially recommended for altimetry-based WL of mountain rivers where the river slope bias is usually greater due to higher river slopes. It should also be mentioned that the VS-based approach utilizes only satellite data, therefore it can be applied globally, with no need for in situ observations. The research is supported by the National Science Centre, Poland, through the project no. 2020/38/E/ST10/00295. Our results have recently been published in Journal of Hydrology (https://doi.org/10.1016/j.jhydrol.2022.128761).

How to cite: Halicki, M., Schwatke, C., and Niedzielski, T.: Correcting altimetry measurements on rivers for the satellite ground track shift bias – a case study of the Sentinel-3 altimetry on the Odra/Oder River, EGU General Assembly 2023, Vienna, Austria, 23–28 Apr 2023, EGU23-5549, https://doi.org/10.5194/egusphere-egu23-5549, 2023.

EGU23-6513 | Orals | HS6.4

Comparisons and water level analyses using Sentinel-6MF satellite altimetry data with 1D Mascaret and 2D Telemac models. 

Sophie Ricci, Thanh Huy Nguyen, Sophie Le Gac, François Boy, Andrea Piacentini, Raquel Rodriquez-Suquet, Santiago Peña-Luque, quentin bonassies, and charlotte emery

Remote sensing products provided by satellite missions, airborne and unmanned aerial vehicle (UAV) campaigns have tremendously developed over the last decade. They undoubtedly offer opportunities to improve our ability to monitor and forecast flooding. The observation of inland waters benefits from several altimetry missions that provide along-track water surface elevation observation from nadir (e.g. TOPEX/Poseidon, Jason, SARAL/AltiKa, Sentinel-6) or large-swath altimeters (e.g. SWOT launched in December 2022), as well as other radar/optical missions (Sentinel-1, Sentinel-2) that provide high-resolution water masks. The limitations of each type of sensor are potentially circumvented when data from different satellite sensors are combined; the fusion of multi-source data has thus become one of the mainstream research topics in the remote-sensing community nowadays. Such fusion can be achieved with data assimilation algorithms applied to hydrodynamics models, namely MASCARET-1D and TELEMAC-2D. 

The present work focuses on the validation of water surface height (WSH) data from Sentinel-6MF with respect to in-situ gauge data, UAV and 1D/2D-hydrodynamics model outputs as shown in Figure 1. This work participates in a global effort that aims at combining various remote sensing products to represent and forecast flooding. The study is carried out over a dry period in June 2022 and over a flood event that occurred in December 2021-January 2022 over the Garonne catchment near Marmande, in the southwest of France. The WSH of the river is retrieved from Sentinel-6MF high-resolution fully-focused SAR data with an algorithm that relies on the estimation of the river width and the positioning of the river center line. The impact of these a priori data is investigated and the Sentinel-6MF-derived WSH observations are compared to the WSH simulated with TELEMAC-2D. It should be noted that due to the defection of Sentinel-1B (one of the two satellites in the Sentinel-1 constellation) in mid-December 2021, this flood event is only partly observed by Sentinel-1A and that the additional data from Sentinel-6MF with a 10-day revisit period are of great use. This study shows that hydrodynamic simulations and satellite altimetry time-series compare particularly well during the dry period whereas flooding events are often underestimated by satellite altimetry data. We believe that the combined use of satellite altimetry, hydrodynamics model simulations and independent UAV-borne data is key to a better understanding of the processes involved in the Garonne river flow dynamics and flooding events. We also take advantage of this study to improve our Sentinel-6MF data processing techniques.

Figure 1- Representation of water level height and flood extent with remote sensing data and hydrodynamic models.


How to cite: Ricci, S., Nguyen, T. H., Le Gac, S., Boy, F., Piacentini, A., Rodriquez-Suquet, R., Peña-Luque, S., bonassies, Q., and emery, C.: Comparisons and water level analyses using Sentinel-6MF satellite altimetry data with 1D Mascaret and 2D Telemac models., EGU General Assembly 2023, Vienna, Austria, 23–28 Apr 2023, EGU23-6513, https://doi.org/10.5194/egusphere-egu23-6513, 2023.

EGU23-6619 | Posters on site | HS6.4

Hydrological evaluation of the CryoSat-2 Thematic Data Products for inland water monitoring 

Angelica Tarpanelli, Stefania Camici, and Julien Renou

The monitoring of fresh water is fundamental for political, environmental and economic reasons. The use of satellite altimetry to measure water height is a well-established technique that has advanced over the past three decades. Unlike other repeated orbit missions, CryoSat-2, a Synthetic Aperture Radar satellite launched in 2010 by the European Space Agency, adopts a long repetitive (369 days) drift orbit with the advantages of having short distance between tracks and high spatial coverage.Here, we present the hydrological evaluation of the CryoSat-2 product provided by the ESA Cryo-TEMPO project as a Thematic Data Product. This TDP is an improved version of the CryoSat-2 product as it is specifically dedicated to the inland water theme for non-expert users. The analysis focuses on the evaluation of the water height products based on three retrackers (MLE4, OCOG, TFMRA) during a 10-year period and considering the three different acquisition modes of the CryoSat-2 radar instrument (LRM, SAR and SARin). The study areas are related to two Italian rivers, the Po and the Tiber River, with different characteristics. Results of the validation phase are presented referring to the comparison against ground recorded water level for selected stations over the two rivers. Moreover, the analysis includes the evaluation of the capability of the TDP to fulfil user requirements and to respond adequately to the scientific questions related to 1) flood prediction and forecasting activities, 2) water management demand and supply and 3) climate analysis.

How to cite: Tarpanelli, A., Camici, S., and Renou, J.: Hydrological evaluation of the CryoSat-2 Thematic Data Products for inland water monitoring, EGU General Assembly 2023, Vienna, Austria, 23–28 Apr 2023, EGU23-6619, https://doi.org/10.5194/egusphere-egu23-6619, 2023.

EGU23-7519 | ECS | Posters on site | HS6.4

Correction of River Bathymetry Parameters Using the Stage–Discharge Rating Curve 

Xudong Zhou, Menaka Revel, Prakat Modi, Takuto Shiozawa, and Dai Yamazaki

River bathymetry is an important parameter for hydrodynamic modeling; however, it is associated with large bias because direct large-scale measurements are impractical. Recent studies adjusted river bathymetry data based on assessment of the difference between modeled and observed water surface elevation (WSE); however, model uncertainties in river discharge can lead to unintended errors in correcting river bathymetry. In this study, we propose a simple but robust and rational correction method of river bathymetry using the bias between stage–discharge rating curves rather than WSE time series data. The rating curve represents the internal characteristics of the river section, and is not sensitive to the instantaneous simulated discharge errors. Our results showed that the corrected river bathymetry are robust to bias in runoff as they converged among experiments driven by noise-corrupted or multimodel runoff forcing. Evaluation with the corrected river bathymetry against virtual truth demonstrated that the new method reduced 0.85–1.12 m of the absolute bias than the result from the conventional method. The deviation among the results reduced by more than 70% particularly in river sections with no backwater effects. Evaluation of the corrected river model output also showed the advantage of rating-curve bias correction, as the simulated WSE is reasonably better only with better runoff and it does not conceal errors in runoff inputs. Given the difficulty of eliminating discharge errors and bias in runoff, a method for correcting river bathymetry that is free from discharge and runoff errors is important for improving hydrodynamic modeling.

How to cite: Zhou, X., Revel, M., Modi, P., Shiozawa, T., and Yamazaki, D.: Correction of River Bathymetry Parameters Using the Stage–Discharge Rating Curve, EGU General Assembly 2023, Vienna, Austria, 23–28 Apr 2023, EGU23-7519, https://doi.org/10.5194/egusphere-egu23-7519, 2023.

EGU23-8652 | ECS | Posters on site | HS6.4

IRIS: Global River Surface Slopes from ICESat-2 

Daniel Scherer, Christian Schwatke, Denise Dettmering, and Florian Seitz

The global reach-scale “ICESat-2 River Surface Slope” (IRIS, https://doi.org/10.5281/zenodo.7098113) dataset comprises average and extreme water surface slopes (WSS) derived from ICESat-2 observations between October 2018 and August 2022 as a supplement to 121,583 reaches from the “SWOT Mission River Database” (SWORD, Altenau et al., 2021). WSS is required to calculate river discharge, which is among the Essential Climate Variables as defined by the Global Climate Observing System. 

To gain full advantage of ICESat-2’s unique measurement geometry with six parallel lidar beams, the WSS is determined across pairs of beams or along individual beams, depending on the intersection angle of spacecraft orbit and river centerline. The combined results of both approaches are validated against in-situ data in a regional study at 815 reaches in Europe and North America with a median absolute error of 23 mm/km, almost complying with the SWOT science requirements of 17 mm/km (Scherer et al., 2022). 

IRIS can be used to research river dynamics, estimate river discharge, and correct water level time series from satellite altimetry for shifting ground tracks. Additionally, by referencing SWORD as a common database, IRIS may be used in combination with observations from the recently launched SWOT mission and could be easily compared against WSS measurements from SWOT’s new wide-swath sensor. 

How to cite: Scherer, D., Schwatke, C., Dettmering, D., and Seitz, F.: IRIS: Global River Surface Slopes from ICESat-2, EGU General Assembly 2023, Vienna, Austria, 23–28 Apr 2023, EGU23-8652, https://doi.org/10.5194/egusphere-egu23-8652, 2023.

EGU23-9210 | Orals | HS6.4

Spatial Hydrology for the Operational monitoring of French Guiana rivers 

Adrien Paris, Laetitia Gal, Stéphane Calmant, Romulo Juca Oliveira, Malik Boussaroque, Marielle Gosset, Marjorie Gallay, Marie-Line Gobinddass, and Celia Biancat

In a context of a changing climate and an increasing anthropic pressure on natural resources, it is more than ever necessary to maintain or even improve our capacity to understand and monitor inland waters. It is particularly the case in French Guyana, where, despite its relative density, the in situ monitoring network fails at providing everyday information on rivers all over the territory. The use of free and open spatial datasets and hydrological modeling have shown great skills in complementing existing monitoring networks all over the world.  

Our work illustrates the use of a hydrological model, namely the MGB, set-up for 10 major watersheds in French Guiana (including the transboundary Maroni and Oyapock River - resp. with Suriname and Brazil- and some smaller ungauged basins) fed on a daily and near-real-time basis by IMERG-RT (Integrated Multi-satellitE Retrievals for GPM - Real Time) remote sensing precipitation products within a scheduler (namely HYFAA). In ungauged basins we used model parameters regionalisation to infer model parameters. The model performed well at inferring discharges, with KGE values higher than 0.7 when compared to gages. An extended dataset of rating curve between water surface elevation from nadir altimetry and simulated discharges is extracted using a physical-based processing of radar echoes on ESA Sentinel3 A&B and Jason3/Sentinel6 missions and also the time series available on Hydroweb website (https://hydroweb.theia-land.fr/). The quality of the rating curves confirms the skill of the model even in ungauged locations and watersheds with small contributive area. 

Thanks to this set-up, discharges and water levels are estimated daily all over the territory, and routinely corrected by the use of satellite altimetry. Using statistical rainfall predictions and watersheds concentration time, the system allows short-term forecasts of the discharge. In coordination with the in situ network operator, the critical thresholds were defined and are used to trigger  flood and droughts alerts, accessible online and received by email upon registration. As the methods used in this study have largely proved to be deployable anywhere, this simple framework draws the contour of future operational early warning systems based on space observation. 

How to cite: Paris, A., Gal, L., Calmant, S., Juca Oliveira, R., Boussaroque, M., Gosset, M., Gallay, M., Gobinddass, M.-L., and Biancat, C.: Spatial Hydrology for the Operational monitoring of French Guiana rivers, EGU General Assembly 2023, Vienna, Austria, 23–28 Apr 2023, EGU23-9210, https://doi.org/10.5194/egusphere-egu23-9210, 2023.

The present work aims at assimilating GRACE Total Water Storage Anomalies (TWSA) into hydrological forecasts in order to estimate groundwater level changes. The motivation of our research was to provide information for groundwater levels and storage changes along with the rest of hydrological parameters provided usually by hydrological models, i.e., surface runoff, lateral flow contribution to stream flow, groundwater contribution to stream flow, water percolation below the soil profile, soil water and evapotranspiration. Therefore, we investigated a possible approach to acquire information on the groundwater regime of a watershed assimilating downscaled GRACE TWSA along with two variables related to groundwater flow obtained from the application of SWAT model, i.e., groundwater contribution to stream flow and percolation. The methodology was developed and tested in a medium sized river basin (~360 km2) in NE Greece, namely Vosvozis river basin. Initially we checked for possible correlation of the downscaled GRACE TWSA with the groundwater level anomalies for the period 2013 – 2021. Results indicated that downscaled GRACE TWSA can be used as possible predictor for groundwater level changes. Thereafter, two model approaches were evaluated for their predictive ability regarding groundwater level changes. The first approach is a Multiple Linear Regression (MLR) model whereas the second was an Artificial Neural Network Multilayer Perceptron (MLP-ANN) model. Both models indicated a satisfactory performance with R2 values ranging from 0.76 – 0.78 for the MLR model, in the training and testing phases, whereas the MLP-ANN outperformed in both phases the MLR model, with R2 ranging well above 0.8, indicating its predictive ability for groundwater level changes. The methodology can be applied parallel to SWAT model and groundwater level changes can be acquired simultaneously with the rest of hydrological variables.      

How to cite: Gemitzi, A. and Stathopoulos, S.: Assimilating GRACE Total Water Storage Anomalies into hydrological forecasts in order to acquire information for groundwater level changes, EGU General Assembly 2023, Vienna, Austria, 23–28 Apr 2023, EGU23-9302, https://doi.org/10.5194/egusphere-egu23-9302, 2023.

EGU23-11349 | ECS | Orals | HS6.4

Assessing floodplain dynamics using radar interferometry in the East Ganga Plains, India 

Manudeo Singh and Bodo Bookhagen

Floodplains are essential elements of terrestrial water storage and perform various hydrogeomorphic, ecological, and socio-economic services. Ganga Plains are one of the world's largest and most populous plains. The East Ganga Plain (EGP), other than being densely populated, is also a fluvially highly dynamic region. This region hosts ‘hyperavulsive’ rivers and numerous wetlands, some of which are the largest wetlands of the Ganga Plains. Due to frequent flood hazards, all rivers of the region are embanked on both banks. We are investigating the surface dynamics of the region by calculating the surface displacement using InSAR (Interferometric Synthetic Aperture Radar) time series in ISCE-2 and Mintpy environments. We calculated the InSAR stack for the period Oct 2016 to May 2022 and built the connected network for the next three neighbours. We iteratively chose the multilooking value of azimuth 11 and range 78 to mitigate the low coherence issues due to the vegetation. We used ascending and descending tracks of Sentinel-1 to calculate the horizontal and vertical components of the velocity. Our results show that the entire area is tectonically subsiding. However, the spatial pattern of subsidence rate is varying – surfaces with seasonal water cover, such as active channel belts and wetlands, are exhibiting the highest subsidence rates with up to 7 cm/y and twice the subsidence rates of non-water surfaces. In many regions, the subsidence is accelerating.

We are using satellite-based multispectral indices (MNDWI, NDVI) and in-situ measurements such as groundwater depth and rainfall and land use data to investigate the disparity in the subsidence rates in the region. The preliminary results suggest that the waterbodies are drying, vegetation cover and irrigation are increasing, and rivers are disconnected from their floodplains due to embankments. We emphasise the anthropogenic role in the acceleration of the subsidence due to river embankment, augmented by a high drawdown of groundwater for irrigation purposes.

How to cite: Singh, M. and Bookhagen, B.: Assessing floodplain dynamics using radar interferometry in the East Ganga Plains, India, EGU General Assembly 2023, Vienna, Austria, 23–28 Apr 2023, EGU23-11349, https://doi.org/10.5194/egusphere-egu23-11349, 2023.

EGU23-12986 | ECS | Orals | HS6.4

Estimating river surface slopes from ICESat-2 to inform hydrodynamic models 

Linda Christoffersen, Karina Nielsen, Peter Bauer-Gottwein, and Loiuse Sørensen

ICESat-2 measures the ground surface elevation with 6 laser beams grouped in three pairs of two, and pairwise separated by 3.3 km across track. This measurement configuration provides an unprecedented opportunity to measure local the water surface slope. Local water surface slopes can inform hydrodynamic models and improve performance.

The slopes are estimated by a linear regression of the water surface height as a function of the distance along the river. Water surface slopes are estimated for all intersections, independent of intersection angle, between ICESat-2 crossings and the river centerline where data is available and of reliable quality. The package is applied to the Amur river basin using 3.5 years of ICESat-2 data. More than 3700 slope estimates were produced with a median relative standard error of 2.1% across 1502 SWORD reaches out of 3360 reaches that intersect ICEsat-2 tracks.

In this study, an automatic method for estimating river surface slopes is developed and implemented in an R package. The package uses ICESat-2 ATL13 data and the SWOT River Database (SWORD) as the only compulsory input data. The R package can be tuned to fit the application of interest based on the user settings. This enables slope estimates to be computed globally with minimal additional effort.

This R package provides a tool that is easy to use and systematically gives local water surface slope estimates for a specified area of interest. Studies have shown how information of river slopes from twin in-situ gauge stations can improve discharge estimates from models. The global sparseness of in-situ stations limits the usability of models informed with slope estimates from gauge stations. Water surface slope estimates on local scale from satellite data increases the usability of these models.

How to cite: Christoffersen, L., Nielsen, K., Bauer-Gottwein, P., and Sørensen, L.: Estimating river surface slopes from ICESat-2 to inform hydrodynamic models, EGU General Assembly 2023, Vienna, Austria, 23–28 Apr 2023, EGU23-12986, https://doi.org/10.5194/egusphere-egu23-12986, 2023.

EGU23-13135 | ECS | Posters on site | HS6.4

River coastline detection using maximum likelihood classification 

Matylda Witek, Grzegorz Walusiak, and Tomasz Niedzielski

In frame of the project no. 2020/38/E/ST10/00295 carried out within the Sonata BIS programme, financed by the National Science Centre of Poland, we consider different approaches to delineate the river coastline based only on close-range visible light aerial images (RGB) acquired by unmanned aerial vehicles (UAVs).  Among the scrutinized methods, we use automatic mapping of extent of water bodies  by means of image classification. It was found that the best results of reconstructing inundation extent (even 95%) were obtained using the supervised methods, in particular the maximum likelihood algorithm. The accuracy assessment of this classification, using the confusion matrix visualization, allowed us to notice that the areas incorrectly classified as "water underestimation" (surface where there is real inundation which was not indicated by the classifier) are located mainly on the borders of the water bodies.

In most of the analyzed cases, the incorrectly classified "water underestimation" areas form a narrow zone around the inundated areas, which can be interpreted as the water-land interface zone. Therefore, it is possible to delineate, with high probability, the approximate  water-land boundary line. In low-altitude aerial photographs or orthophotomaps with visible fragments of river channels, the designation of such "water underestimation" zone allowed us to delineate the approximate course of the river channel coastline. This approach was tested on several UAV images acquired over the middle Odra River channel in western Poland. We analyzed several images representing various terrain situations: (1) the river channel completely visible, without vegetation, where the visual determination of the reference coastline by the human expert was not difficult, (2) the river channel partially shaded, where significant classifier errors can be expected, (3) the river channel partially covered, for example by vegetation, where the course of the real coastline is uncertain. The obtained results confirm that the proposed approach allows to reconstruct some courses of the coastline for channels with a width of at least 100 m using the "water underestimation" areas.

How to cite: Witek, M., Walusiak, G., and Niedzielski, T.: River coastline detection using maximum likelihood classification, EGU General Assembly 2023, Vienna, Austria, 23–28 Apr 2023, EGU23-13135, https://doi.org/10.5194/egusphere-egu23-13135, 2023.

EGU23-13144 | ECS | Posters on site | HS6.4

Histogram-based edge detection as a tool for detecting river coastline 

Grzegorz Walusiak, Matylda Witek, and Tomasz Niedzielski

Flood management is very important task in the context of rapid climate changes. Increasing the frequency of extreme weather and fluvial phenomena, such as droughts, water shortages or floods determines that detecting water bodies and boundaries between them and surrounding surface is an important and challenging issue. We elaborated a new approach for delineating river coastline based only on close-range RGB nadir images acquired by means of UAV (unmanned aerial vehicle), converted to HSV (hue, saturation, value) color space. We used spectral characteristics of water surface which has uniform V component, while another land cover types have heterogeneous V. Areas, where character of V changes considerably, are suspected to be  river coastline. Every aerial image was divided into 250 x 250 px cells, within which we calculated some statistical values (kurtosis, concentration around mode) in order to characterize shape of empirical distribution. Among others, we focused on identifying multi-modal or leptokurtic histograms. Results show that the detection rate (also known as the producer accuracy) ranges from 22,22% to 92,00%, while the false hit rate (also known as error of commission) ranges from 5,00% to 82,76%. For 70% of all analyzed images, presenting both narrow (10 m) and wide (more than 100 m) rivers, the detection rate was above 50%. Considering the subset of photos presenting only wide rivers, detection rate above 50% occurred for 75% of these images. For these cases, 56% of images do not exceed the false hit rate above 40%. The research is supported by the National Science Centre, Poland, through the project no. 2020/38/E/ST10/00295.

How to cite: Walusiak, G., Witek, M., and Niedzielski, T.: Histogram-based edge detection as a tool for detecting river coastline, EGU General Assembly 2023, Vienna, Austria, 23–28 Apr 2023, EGU23-13144, https://doi.org/10.5194/egusphere-egu23-13144, 2023.

EGU23-13321 | Posters on site | HS6.4

Multi-variate data assimilation into a large scale hydrological system: a study over the Niger basin 

Vanessa Pedinotti, Gilles Larnicol, Santiago Pena Luque, Lionel Zawadzki, Bachir Tanimoun, and Kone Soungalo

The advent of new satellite missions dedicated to hydrology, such as SWOT launched in December 2022, brings fresh perspectives for monitoring and forecasting continental water resources. But it also requires the set up of fully automated hydrological forecasting systems able to take advantage of these new types of products. It is in this perspective that a platform named HYdrological Forecasting system with Altimetry Assimilation (HYFAA) was implemented, which encompasses the MGB large-scale hydrological model developed within the large-scale hydrology research group of the University of Rio Grande do Sul (Brazil), and an Ensemble Kalman Filter (EnKF) module that corrects model states and parameters whenever discharge observations are available. While discharge is the most classically used variable for data assimilation into hydrological models, it does however have some limitations: i) it only provides 1D information about the hydrological flow and cannot capture lateral processes which are essential in flooded areas; ii) it must be derived from nadir altimetry data, which has limitations in terms of spatial sampling, via rating curves. Combining discharge observations with other types of data can therefore improve models' representation of the complex processes governing the hydrological regime of large basins. The current work is part of a CNES-funded project aiming to implement and evaluate multivariate data assimilation on the Niger river basin based on the HYFAA modeling platform. Three types of observations will be assimilated: water levels and discharge from the Hydroweb database, and surface water bodies from Sentinel-1 and Sentinel-2 data processing. This study presents the preliminary results obtained within the framework of this project. First, we evaluate and compare the performance of the EnKF when assimilating each variable separately. For validation, we use in-situ or independent datasets when they exist. Otherwise, we use a random sample of the assimilated datasets. We then discuss the approach to be taken and the risks to be anticipated for their combined assimilation. This study allows preparing the use of SWOT data as soon as they are available in the course 2023.

How to cite: Pedinotti, V., Larnicol, G., Pena Luque, S., Zawadzki, L., Tanimoun, B., and Soungalo, K.: Multi-variate data assimilation into a large scale hydrological system: a study over the Niger basin, EGU General Assembly 2023, Vienna, Austria, 23–28 Apr 2023, EGU23-13321, https://doi.org/10.5194/egusphere-egu23-13321, 2023.

EGU23-13630 | Posters on site | HS6.4

SAR, SARin, RDSAR and FF-SAR Altimetry Processing on Demand over Inland Water for Cryosat-2, Sentinel-3 & Sentinel-6 at ESA’s Altimetry Virtual Lab 

Jérôme Benveniste, Salvatore Dinardo, Christopher Buchhaupt, Michele Scagliola, Marcello Passaro, Luciana Fenoglio-Marc, Carla Orrù, Marco Restano, and Américo Ambrózio

This presentation provides an update on the ESA radar altimetry processing services portfolio, known as SARvatore, for the exploitation of CryoSat-2 (CS-2) and Sentinel-3 (S-3) data from L1A (FBR) data products up to SAR/SARin L2 geophysical data products. The following on-line & on-demand services compose the portfolio, now hosted in the ESA Altimetry Virtual Lab at the EarthConsole® (https://earthconsole.eu):

  • The ESA-ESRIN SARvatore (SAR Versatile Altimetric Toolkit for Research & Exploitation) for CS-2 and S-3 services. These processor prototypes allow the users to customize the processing at L1b & L2 by setting a list of configurable options, including those not available in the operational processing chains (e.g., SAMOSA+ and ALES+ SAR retrackers).
  • The TUDaBo SAR-RDSAR (TU Darmstadt – U Bonn SAR-Reduced SAR) for CS-2 and S-3 service. It allows users to generate reduced SAR, unfocused SAR & LRMC data. Several configurable L1b & L2 processing options and retrackers (BMLE3, SINC2, TALES, SINCS, SINCS OV) are available.
  • The TU München ALES+ SAR for CS-2 and S-3 service. It allows users to process L1b data applying the empirical ALES+ SAR subwaveform retracker, including a dedicated SSB solution.
  • The Aresys FF-SAR (Fully-Focused SAR) for CS-2 & S-3 service. It provides the capability to produce L1b products with several configurable options and with the possibility of appending the ALES+ FFSAR output to the L1b products. In the future, the service will be extended to process Sentinel-6 data.

The following new services will be made available: the CLS SMAP S-3 FF-SAR processor (s-3-smap, http://doi.org/10.5270/esa-cnes.sentinel-3.smap) and the ESA-ESTEC/isardSAT L1 Sentinel-6 Ground Prototype Processor.                                                     

All output data products are generated in standard netCDF format and are therefore also compatible with the multi-mission “Broadview Radar Altimetry Toolbox” (BRAT, http://www.altimetry.info).

The Altimetry Virtual Lab is a community space for simplified processing services and knowledge-sharing, hosted on the EarthConsole®, a powerful EO data processing platform now on the ESA Network of Resources. This enables SARvatore Services to remain open for worldwide scientific applications, including for R&D studies on the retrieval of radar altimetry measured variables contributing to Inland Water monitoring (write to altimetry.info@esa.int for further information).

How to cite: Benveniste, J., Dinardo, S., Buchhaupt, C., Scagliola, M., Passaro, M., Fenoglio-Marc, L., Orrù, C., Restano, M., and Ambrózio, A.: SAR, SARin, RDSAR and FF-SAR Altimetry Processing on Demand over Inland Water for Cryosat-2, Sentinel-3 & Sentinel-6 at ESA’s Altimetry Virtual Lab, EGU General Assembly 2023, Vienna, Austria, 23–28 Apr 2023, EGU23-13630, https://doi.org/10.5194/egusphere-egu23-13630, 2023.

EGU23-14324 | ECS | Posters on site | HS6.4

Detecting Hydrological Barriers and Fragmentation in Wetlands using Deep Learning and InSAR 

Clara Hübinger, Etienne Fluet-Chouinard, Gustaf Hugelius, Francisco J. Peña, and Fernando Jaramillo

The loss of hydrological connectivity and fragmentation of natural wetlands have driven widespread wetland degradation worldwide. Monitoring techniques are needed to assess the degree of fragmentation and to aid with the restoration of affected wetlands. Hydrogeodetic tools such as wetland Interferometric Synthetic Aperture Radar (InSAR) can be used to monitor wetland hydrology as it provides information on three-dimensional flow dynamics at a high spatial resolution. While this technique has been utilized previously for the manual assessment of hydrological connectivity in wetlands, this study proposes the first deep learning-based approach for the automated detection of barriers to the natural water flow that cannot otherwise be identified by conventional space imagery. To this end, a deep convolutional network is trained by segmenting edge features in ALOS PALSAR-1 L-Band InSAR images captured between 2006 and 2011. The training dataset consists of manually labelled and delineated barriers showing abrupt changes in water surface elevation and 22 wrapped interferograms with high coherence across several sample sites in the Everglades and the wetlands of southern Louisiana, United States. The scenes were processed in the Interferometric synthetic aperture radar Scientific Computing Environment (ISCE). The network is set up using a UNet structure with alternating convolutional and pooling or upsampling layers along a contracting and expanding part. The validation of the resulting pixel-wise segmentation shows that the network can successfully detect hydrological barriers in wetlands. Apart from identifying the location of barriers, the CNN can be applied to identify the type and persistence of the fragmentation over the entire wetland. Utilizing the multitemporal data additionally helps detect seasonal changes in the presence or absence of hydrological barriers in the sample sites. This study demonstrates the potential of deep learning techniques for the automated detection of hydrological parameters in InSAR imagery and sets the groundwork for the automated monitor of wetland fragmentation across the world.

How to cite: Hübinger, C., Fluet-Chouinard, E., Hugelius, G., Peña, F. J., and Jaramillo, F.: Detecting Hydrological Barriers and Fragmentation in Wetlands using Deep Learning and InSAR, EGU General Assembly 2023, Vienna, Austria, 23–28 Apr 2023, EGU23-14324, https://doi.org/10.5194/egusphere-egu23-14324, 2023.

EGU23-14634 | ECS | Orals | HS6.4

Towards assimilating SAR data into an anisotropic model of an underground aquifer 

Sona Salehian Ghamsari, Tonie Van Dam, and Jack S. Hale

In this study, we aim to shed light on the feasibility of assimilating synthetic aperture radar (SAR) data into a partial differential equation-based model of a poroelastic homogeneous aquifer with anisotropic hydraulic conductivity (AHC).

Although other authors [1] have considered the problem of assimilating SAR data into a poroelastic model that uses an inhomogeneous random field model for the hydraulic conductivity, to the best of our knowledge this is the first study to consider assimilating SAR data into a poroelastic model with AHC.

Our study is inspired by the work of [2] where an aquifer test is performed on the Anderson Junction aquifer in southwestern Utah. Due to the inherent preferential direction of the fractured sandstone at the Anderson Junction site, the ratio of hydraulic conductivity along the principal axes can be on the order of 24 to 1.

We build an anisotropically conductive poroelastic finite element model of the Anderson Junction site that can predict the coupled fluid flow and mechanical displacements. Our results show that the effective elastic response of the aquifer on the Earth’s surface has an anisotropic nature driven by the underlying anisotropy in the fluid problem, even when the elasticity problem is assumed to be isotropic. We interpret these results in the context of using SAR data to improve the characterization of aquifer systems, like the Anderson Junction site, with strongly anisotropic behavior.

[1]      A. Alghamdi, “Bayesian inverse problems for quasi-static poroelasticity with application to ground water aquifer characterization from geodetic data,” Thesis, 2020. doi: 10.26153/tsw/13182.

[2]      V. M. Heilweil and P. A. Hsieh, “Determining Anisotropic Transmissivity Using a Simplified Papadopulos Method,” Groundwater, vol. 44, no. 5, pp. 749–753, 2006, doi: 10.1111/j.1745-6584.2006.00210.x.

How to cite: Salehian Ghamsari, S., Van Dam, T., and S. Hale, J.: Towards assimilating SAR data into an anisotropic model of an underground aquifer, EGU General Assembly 2023, Vienna, Austria, 23–28 Apr 2023, EGU23-14634, https://doi.org/10.5194/egusphere-egu23-14634, 2023.

EGU23-15091 | ECS | Orals | HS6.4

Using GRACE Terrestrial Water Storage Data for Groundwater Flow Model Calibration of Alaşehir-Sarıgöl Sub-Basin, Turkiye 

Elif Aysu Batkan, Barış Çaylak, Mustafa Berker Bayırtepe, Ali Hakan Ören, and Alper Elçi

Water resources are under immense stress due to the continuous increase of anthropogenic and natural pressures. Therefore, effective water management backed by advanced tools and methods is essential for the sustainability of water resources. One of these tools is groundwater flow modeling, which can be used to estimate changes in groundwater storage. In this study, we propose an approach to improve groundwater flow modeling by supporting model calibration with remote sensing data. The approach is demonstrated on the Alaşehir-Sarıgöl sub-basin in the east of the Gediz River Basin, a water-stressed basin in western Turkiye. A MODFLOW-2005 based flow model is constructed to determine time series hydraulic head changes and aquifer storage. The model simulation period is from 2013 to 2021. The groundwater recharge input of the model is obtained by a remote sensing-supported water balance method (Batkan et al., 2022). Except for precipitation data measured at meteorological stations, other model parameters are remote sensing products. Evapotranspiration is obtained from the MODIS Global Evapotranspiration product (MOD16A2), and soil water content and runoff are obtained from the ERA-5 Land Model reanalysis dataset. Hydraulic parameters such as hydraulic conductivity and storage coefficient are determined as a result of the calibration of the groundwater flow model. Model performance is improved by using terrestrial water storage (TWS) data from NASA's GRACE mission in the calibration of the storage coefficient. TWS represents the total water content above and below ground in the unconfined aquifer, therefore data needs to be adjusted to obtain an estimate of groundwater storage. Streams in the region can be ignored as a contributor to the TWS as they are intermittent and have typically low discharges. The soil water content in the unconfined aquifer is determined using ERA-5 data. The calibrated model RMSE value is 7.4 m, which was subsequently improved to lower values after the conjunctive use of the GRACE-derived TWS data.

Keywords: groundwater flow modeling, model calibration, remote sensing, GRACE, ERA-5

Acknowledgment: This study is funded by the PRIMA program supported by the European Union under grant agreement No: 1924, project RESERVOIR (sustainable groundwater RESources managEment by integrating eaRth observation deriVed monitoring and flOw modelIng Results).


How to cite: Batkan, E. A., Çaylak, B., Bayırtepe, M. B., Ören, A. H., and Elçi, A.: Using GRACE Terrestrial Water Storage Data for Groundwater Flow Model Calibration of Alaşehir-Sarıgöl Sub-Basin, Turkiye, EGU General Assembly 2023, Vienna, Austria, 23–28 Apr 2023, EGU23-15091, https://doi.org/10.5194/egusphere-egu23-15091, 2023.

EGU23-15123 | Posters on site | HS6.4

Performance of FDRALT Inland Water Thematic Data Products over Rivers 

Stefania Camici, Angelica Tarpanelli, and Beatriz Calmettes

Floods and droughts are widespread natural hazards that cause a huge amount of damages with economic and consequent life losses every year worldwide. Among the best practices for risk reduction and mitigation there are the early warnings and forecast systems that require a robust meteo-hydro monitoring system to efficiently work.

Satellite radar altimetry, at the beginning designed to provide highly accurate measurements of sea surface heights over open ocean areas, has been demonstrated to be a key technique for inland water monitoring. In contrast to open ocean altimeter measurements, reflected radar echoes from other surface types (e.g., floodplains, rivers, reservoirs) show different shapes depending on the reflectors within the altimeter footprint. A careful data editing and reprocessing is required in order to derive reliable and highly accurate range measurements from the received waveforms—a process called retracking. Within the last decade, various investigations on new retracking algorithms have been made in order to enhance the accuracy of coastal and inland water level estimation.

Fundamental Data Records for Altimetry (FDR4ALT) is an ESA project aiming at generating innovative Earth system data records and thematic records (Level 2 products) from the measurements of ERS1, ERS2 and Envisat missions by applying different retrackers for different surface types (inland water, oceans, sea-ice, land-ice). In particular, the Inland Water Thematic Data Product (TDP) addresses the need to bring the altimetry and hydrology thematic together to strengthen the space hydrology thematic.

In this work, we presented the analysis of the TDP generated with Envisat mission. The inland water TDP was compared to in-situ water level measurements recorded from multiple stations over different basins, mainly Po, Amazon and Godavari rivers. The performance was evaluated in terms of relative Root Mean Square Error (rRMSE), coefficient of correlation (R) and Nash-Sutcliffe (NS) between the level 3 TDP and the in-situ water level observations. Results show that FDR4ALT TDP water level is quite accurate in reproducing observed time series especially over the Po river where there is a high confidence on in situ observations.

How to cite: Camici, S., Tarpanelli, A., and Calmettes, B.: Performance of FDRALT Inland Water Thematic Data Products over Rivers, EGU General Assembly 2023, Vienna, Austria, 23–28 Apr 2023, EGU23-15123, https://doi.org/10.5194/egusphere-egu23-15123, 2023.

EGU23-15718 | ECS | Posters on site | HS6.4

Evaluation of runoff estimation from GRACE coupled with different meteorological gridded products over the Upper Blue Nile Basin 

Khaled alghafli, Xiaogang Shi, Awad Mohammed Ali, William Sloan, Ali A.A. Obeid, and Mohammad Shamsudduha

Water balance closure using purely remote sensing products was difficult to achieve until the launch of Gravity Recovery and Climate Experiment (GRACE) satellites in 2002. The accurate quantification of water cycle components (precipitation, evapotranspiration, runoff, and terrestrial water storage) over a large-scale basin is an important step in improving the understanding of the water balance and the response of the basin to different hydrologic extremes. The Upper Blue Nile (UBN) basin contributes about 60% of the streamflow to the main Nile River annually, and hundreds of millions of people heavily rely on the Nile River. Thus, accurate quantification of the hydrological cycle fluxes will help manage the water resources in an effective, sustainable manner. Hydrometeorological data is lacking; nevertheless, remote sensing data provides an alternative approach to estimating the water cycle components. However, prior to incorporating these products into the water budget calculation, their performance over the studied basin should be assessed. In this study, we aim to estimate runoff from the water budget equation and diagnose the estimated runoff with the Eldiem gauge records at the outlet of the UBN basin for the 2003–2014 period. We evaluate the water cycle components for seven rainfall products (CHIRPSv2, CRU TS4.06, ERA5, TRMM 3B43 V7, GPM, CFSR, and SM2RAIN-CCI), three evapotranspiration products (GLEAM, MOD16, and PLM), and two terrestrial water storage solutions (GRACE JPL MASCON, and Spherical Harmonic (SH) products). The Overall Unified Metric (OUM) approach is adopted to choose the best performing combination among the 42 combination scenarios. The OUM is an approach based on summing up the rankings given for the error and linear fit metrics—namely, R2, slope, y-intercept, RMSE, MAE, and PBIAS. Among the 42 combinations, the best rainfall, TWS, and ET combination performance products to estimate runoff are SM2RAIN-CCI, GLEAM, and GRACE SH, respectively. The statistical results for the six chosen metrics are R2 = 0.7, slope = 1.6, y-intercept = - 0.5 cm, RMSE = 3 cm, MAE = 2.8 cm, and PBIAS = 36%. The 95% confidence bound of the combination scenarios was found to be able to bracket the runoff during the dry season, but the runoff was overestimated during the rainy season. The uncertainty analysis revealed that all the combinations were able to estimate the seasonal trend variation, but closing the water balance equation was not achieved. This deviation in closing the water budget equation might be attributed to the uncertainty associated with satellites, the limitation of land surface models to account for anthropogenic activities, and the coarse resolution of GRACE. Additionally, the signal processing uncertainties and the different algorithm assumptions of the remote sensing products may also have an influence. Further studies are needed to improve the reliability of the remote sensing product for the water budget closure, especially for applications on ungauged basins. Moreover, advancement in satellites will lead to accurate estimates in the near future.

How to cite: alghafli, K., Shi, X., Mohammed Ali, A., Sloan, W., A.A. Obeid, A., and Shamsudduha, M.: Evaluation of runoff estimation from GRACE coupled with different meteorological gridded products over the Upper Blue Nile Basin, EGU General Assembly 2023, Vienna, Austria, 23–28 Apr 2023, EGU23-15718, https://doi.org/10.5194/egusphere-egu23-15718, 2023.

EGU23-16105 | Orals | HS6.4

Mapping wetland dynamics in the Congo River basin from GNSS-R and hydrological modeling 

Konstantinos Andreadis and Fiachra O'Loughlin

Wetlands play a crucial role in hydrological and biogeochemical cycles, and particularly in tropical and sub-tropical regions where they account for up to 3/4 of global methane emissions and act as water storage buffers in the landscape. The Congo being the world's second largest river both in terms of drainage area and annual mean discharge as well as the second largest rainforest area, contains large swaths of wetlands that have nevertheless been poorly studied. Remote sensing arguably offers the only viable strategy for mapping wetlands and their dynamics over the entire Congo River basin. Although there have been efforts that combine different type of sensors (microwave, optical etc.), they have been limited by the fact that most of the inundated areas in the Congo are under dense canopies while the bimodality of the river's hydrograph complicates the identification of the basin's hydrography. Global Navigation Satellite Systems Reflectometry (GNSS-R) is a remote sensing technique that has the potential to overcome some of those limitations. Recent work has shown that such observations from the Cyclone Global Navigation Satellite System (CYGNSS) satellite can successfully enable the mapping of inundation dynamics in wetlands on relatively short time scales. Here, we use CYGNSS satellite observations over the Congo River basin from early 2017 to present to quantify changes in wetland inundated area and the identification of hydrographic features such as floodplain channels in the basin. The mapping results are compared against in-situ hydrographic maps, while the dynamics are reconciled with additional satellite observations of precipitation and soil moisture. Furthermore, we use the derived data to inform and validate an existing hydaulic model of the middle reach of the Congo. Finally, we discuss the implications of GNSS-R observations for mapping wetland dynamics globally especially in the context of new and upcoming missions such as SWOT, NISAR, and HydroGNSS.

How to cite: Andreadis, K. and O'Loughlin, F.: Mapping wetland dynamics in the Congo River basin from GNSS-R and hydrological modeling, EGU General Assembly 2023, Vienna, Austria, 23–28 Apr 2023, EGU23-16105, https://doi.org/10.5194/egusphere-egu23-16105, 2023.

EGU23-16581 | ECS | Orals | HS6.4

From real-time monitoring to climate studies in the Congo basin: role of spatial hydrology and remote sensing datasets 

Benjamin Kitambo, Sly Wongchuig, Fabrice Papa, Adrien Paris, Raphael Tshimanga, Laetitia Gal, Romulo Juca-Oliveira, Stephane Calmant, Ayan Fleischmann, Blaise Tondo, and Christophe Brachet

The Congo River Basin (CRB), located in the central region of Africa, is of particular importance for regional and global climate and carbon studies. Being the second largest river basin after the Amazon, it is also the one with the most free-flowing rivers. However, despite these important characteristics, it has not attracted as much attention among the scientific communities as the Amazon Basin or other large tropical rivers in the world. Because of the lack of comprehensive and maintained in situ data networks over time, large-scale monitoring of hydroclimatic variables has not been properly conducted. In this context, near real-time observations of the CRB, such as water surface elevation (WSE) and river discharge, as well as understanding the impacts of climate change in a spatiotemporally distributed manner across the basin present a major challenge. In the last few years, however, the scientific community, supported by the leading operational organism in the CRB (the CICOS), has worked on applying innovative tools, from hydrological and hydrodynamic modeling to the use of space data, to improve this monitoring and understanding of hydrological processes.

Our work illustrates how space Earth Observation (EO) datasets used jointly with a hydrological model improve both near-real-time monitoring and past-period revisiting (from 1980). First, we built and validated an extensive database on long-term time series of water levels (WL) from satellite altimetry using a comprehensive unprecedented in situ database (root mean square error varying between 10 cm to 75 cm). Crossing this database with the Global Inundation Extent from Multi-Satellites (GIEMS) database, we analyzed the normal behavior of surface water in the CRB, and worked  towards understanding the genesis of recent extreme events. The observations permitted to highlight the different travel time of waters from one to three months depending on its origin, and to discriminate the relative contribution of southern and northern sub-basins to the first and second peaks at the outlet of the basin Kinshasa/Brazzaville station. These datasets are then used to calibrate/validate the setting of a large-scale hydrologic and hydrodynamic model, the MGB model, in which lakes representation parameters are tuned using all the aforementioned databases and the long term CHIRPS precipitation product. In terms of discharge estimates, the model run resulted in an average KGE efficiency index value of 0.84 and 0.71 for the calibration (2001-2020) and validation (1981-2000) periods respectively.

When included within a scheduler, this model run validated by space EO datasets now permits the inference of discharge and depths all over the basin in real-time. In addition, data assimilation techniques applied to ingest remote sensing datasets, into the MGB model, improves such real-time estimates. Long term modeling also provides a new look and understanding on recent hydrological extreme events that occurred in the CRB, and permits analyzing the impact of recent global and regional climate change on freshwater in one of the most free-flowing watersheds.

How to cite: Kitambo, B., Wongchuig, S., Papa, F., Paris, A., Tshimanga, R., Gal, L., Juca-Oliveira, R., Calmant, S., Fleischmann, A., Tondo, B., and Brachet, C.: From real-time monitoring to climate studies in the Congo basin: role of spatial hydrology and remote sensing datasets, EGU General Assembly 2023, Vienna, Austria, 23–28 Apr 2023, EGU23-16581, https://doi.org/10.5194/egusphere-egu23-16581, 2023.

EGU23-32 | ECS | PICO | HS6.6

Machine Learning and LiDAR Snowheight Maps from UAVs Reveal Clusters of Snow Variability in a Sub-Alpine Forest. 

Joschka Geissler, Lars Rathmann, and Markus Weiler

Snow plays a crucial role in the hydrological cycle as it serves as an intermediate storage of winter precipitation and renews groundwater reserves. It is therefore of central importance for, among others, our drinking water supply and agriculture. Snow interacts with its environment in many ways, is constantly changing with time, and thus has a highly heterogeneous spatial and temporal distribution. Therefore, modelling snow variability is difficult, especially when additional components such as forests add complexity. To increase our understanding of the spatiotemporal variability of snow as well as to validate snow models, we need reliable validation data. For these purposes, airborne LiDAR surveys or time series derived from snow sensors on the point scale are commonly used. However, these are disadvantageously limited to one point either in space or in time. In this study, we profited from current advances in LiDAR and drone technology, as well as machine learning, to bridge this gap. We present a new dataset on snow variability in forests for the Alptal, a sub-alpine, forested valley in the pre-alps, Switzerland. The core dataset consists of a dense sensor network, repeated UAV-based LiDAR flights and manual snow height and density measurements. Using modern machine learning algorithms, we determine four clusters of similar spatiotemporal behaviour regarding their snowheight. These clusters are characterized and further used to derive daily snow depth and snow water equivalent maps. By using the latter, we obtain spatially continuous key hydrological variables. The results suggest that snow occurs in clusters that reoccur in space. These clusters underline the relation between canopy cover and spatial snow accumulation patterns and (the much more complex) spatial ablation patterns. The presented dataset and derived products are the first to our knowledge that provide daily, high-resolution snow height and hydrologic variables based on field data. The results of this study can therefore improve our understanding of the spatiotemporal variability of snow in forested environments. Moreover, they are ideally suited for the validation of modern snow models.

How to cite: Geissler, J., Rathmann, L., and Weiler, M.: Machine Learning and LiDAR Snowheight Maps from UAVs Reveal Clusters of Snow Variability in a Sub-Alpine Forest., EGU General Assembly 2023, Vienna, Austria, 23–28 Apr 2023, EGU23-32, https://doi.org/10.5194/egusphere-egu23-32, 2023.

Seasonal snow in the northern regions plays an important role providing water resources for both consumption and hydropower generation. Moreover, the snow depth in the northern Finland during winter exceeds 1 m, impacting local agriculture, vegetation, tourism and recreational activities. The objective of this study is to estimate snow depth using an empirical methodology applied to synthetic aperture radar (SAR) images and compare with in situ measurements collected by automatic weather stations (AWS) and snow courses in northern Finland. Snow depth estimates with high spatiotemporal resolution can improve our understand of seasonal snow mass in complex access areas. Here, we use an adapted version of the empirical methodology developed by Lievens et al. (2019) to estimate snow depth using Sentinel-1 constellation (C-band). The algorithm utilizes changes in the cross-polarized backscatter measurements of SAR images repeatedly acquired on the same orbit to avoid geometry distortions. We use SNAP toolbox, combined with the Copernicus digital elevation model (DEM), posted at 30 meters, in the pre-processing stage.  The snow retrievals between 2019 and 2022 are compared to three automatic weather stations and four snow courses measurements collected over the same period. The ongoing Sentinel-1 snow depth retrievals during the winter 2021/2022 demonstrate a correlation of 0.76, when compared to in situ measurements, supporting the potential ability to derive snow changes in regions where in situ measurements of snow are currently lacking. Despite the good agreement between the empirical algorithm and the collected datasets on land, further investigation is still necessary to better understand the backscatter response over frozen lake areas. Thanks to the effort of international space agencies, we have available currently, and in a near future, global coverage at high resolution SAR imagery and, combined with installed automatic weather stations, opens the possibility of a wide spatial monitoring of snow variations.

How to cite: Lemos, A. and Riihelä, A.: Snow Depth derived from Sentinel-1 compared to in-situ observations in northern Finland, EGU General Assembly 2023, Vienna, Austria, 23–28 Apr 2023, EGU23-998, https://doi.org/10.5194/egusphere-egu23-998, 2023.

EGU23-1920 | ECS | PICO | HS6.6 | Highlight

Monitoring the Spatiotemporal Dynamics of Arctic Winter Snow/Ice with MoonlightRemote Sensing 

Di Liu and Qingling Zhang

The Arctic region has been experiencing significant climate change, with the loss of snow and ice accelerating at an alarming rate. Accurate monitoring of the spatiotemporal dynamics of snow and ice is essential for understanding and predicting the impacts of climate change on Arctic ecosystems and their feedback on global climate. In this paper, we use the Visible Infrared Imaging Radiometer Suite (VIIRS) on the Suomi National Polar-orbiting Partnership (SNPP) satellite to monitor the spatiotemporal dynamics of snow and ice in polar regions. The VIIRS/Day/Night Band (DNB) is a unique instrument that can provide high-resolution imagery of the Earth's surface at night, with a spatial resolution of 750 m and a sensitivity of 0.01 nW/cm2/sr. This enables the detection of faint moonlight and artificial light and allows for mapping snow and ice in polar winter when no sunlight is available for months.  Our aims demonstrate the potential of moonlight remote sensing for continuous monitoring of snow/ice in the Arctic region and analyse the importance of continuous monitoring and research on the impacts of climate change on the Arctic ecosystem and the potential for Arctic seaway.

How to cite: Liu, D. and Zhang, Q.: Monitoring the Spatiotemporal Dynamics of Arctic Winter Snow/Ice with MoonlightRemote Sensing, EGU General Assembly 2023, Vienna, Austria, 23–28 Apr 2023, EGU23-1920, https://doi.org/10.5194/egusphere-egu23-1920, 2023.

EGU23-3304 | ECS | PICO | HS6.6

Retrieval of snow layer and melt pond properties based on airborne hyperspectral imagery 

Sophie Rosenburg, Charlotte Lange, Evelyn Jäkel, Michael Schäfer, and Manfred Wendisch

The melting snow layer, as a composition of ice, liquid water, and air, supplies meltwater in the runoff phase inducing the melt pond formation. These melting processes of Arctic sea ice alter the surface reflection properties and thereby affect the energy budget. Such sea ice surface reflection properties were surveyed by airborne hyperspectral imagery within the framework of an Arctic field campaign performed in May/June 2017. A retrieval approach based on different absorption indices of pure ice and liquid water in the near infrared spectral range is applied to the campaign data retrieving the spatial distribution of snow layer liquid water fraction and effective radius of snow grains. For the same sceneries the melt pond depth was retrieved based on an existing approach that isolates the dependence of a melt pond reflectance spectrum on the pond depth by eliminating the reflection contribution of the pond ice bottom. The presented retrieval methods show the potential of airborne hyperspectral imagery to map the transition phase of the Arctic sea ice surface examining the snow layer composition and melt pond bathymetry.

How to cite: Rosenburg, S., Lange, C., Jäkel, E., Schäfer, M., and Wendisch, M.: Retrieval of snow layer and melt pond properties based on airborne hyperspectral imagery, EGU General Assembly 2023, Vienna, Austria, 23–28 Apr 2023, EGU23-3304, https://doi.org/10.5194/egusphere-egu23-3304, 2023.

EGU23-4196 | PICO | HS6.6

Snow cover monitoring in the Arctic (Svalbard) with RADARSAT Constellation Mission (RCM). Comparison with in-situ measurements and TerraSAR-X data 

Jean-Pierre Dedieu, Joep Van Noort, Benoit Montpetit, Manon Levistre, Simon Vauclare, Anna Wendleder, Julia Boike, Eric Bernard, Jean-Charles Gallet, and Hans-Werner Jacobi

Arctic snow cover dynamics exhibit modification in terms of extent and duration due to recent changes in climate, i.e. increasing temperatures and changing precipitation patterns, i.e. winter rain-on-snow events (WROS). Remote sensing methods based on active radar images (SAR) have demonstrated a significant advantage for snow monitoring, (i) capturing physical and dielectric properties, (ii) overcoming the weakness of optical images limited by cloud cover and polar night.

The aim of this study is dedicated to the analysis of the spatial and temporal variability of snow cover in the Ny-Ålesund area on the BrØgger peninsula, Svalbard (N 78°55’ / E 11° 55’). In-situ snow measurements from two automated weather stations (Ny-Ålesund, and Bayelva), regular snowpits around the village and in spring on the Austre Loéven, were compared with the spaceborne dataset.

The RADARSAT Constellation Mission (RCM) is comprised of three satellites into closely coordinated orbits operating in C-band (5.4 GHz, 5.5 cm). The high temporal (4-day repeat cycle) and spatial resolution of the sensors in Quad-Pol mode (9-m) or Compact-Pol mode (5-m) provide a helpful performance for detecting the spatial variability of snow properties. RCM data are also compared to images of the TerraSAR-X satellite (DLR, Germany) operated in X-band (9.6 GHz, 3.1 cm) at 5-m spatial resolution. Both RCM QP mode and TSX data were acquired with medium incidence angles (33° to 39°) providing better snow penetration for volume backscattering. The RCM CP data were only available under low (23°) and high (53°) beam angles.

The following two snow properties were analyzed:

WROS detection: the focus was set on the 16-17 March 2022 event (+ 5.5 °C, 62 mm). RCM data at cross-polarization VH or HV can clearly detect the impact of rain on snow, indicating an intensity drop of -10 dB, even on the glacier at high elevation.

Snow depth retrieval: the study covers spring 2021 (March-June) and the complete winter season 2021-2022 (November-June).

- Concerning QP mode, better correlation between snow depth and SAR backscattering is observed by the cross-pol VH component, retrieving more volume backscattering information than co-pol configuration or total backscattering power (Span). We observe also that descending orbit images (06 :30 AM) provide a better correlation with snow depth than ascending orbit (15 :30 PM) data.

- Concerning CP mode and Span (RH+RV), the low incidence images (23°) do not match the snow depth observations due to main surface backscattering, contrariwise the high incidence images correlate better with in-situ observations. The analyses of the Stokes vector elements showed a satisfying correlation for the g3 element and the Relative Phase polarimetric decomposition.

Finally, a comparison of Span temporal values between RCM at C-band and TSX at X-band indicates similar time profiles, but clearly lower values of -5 to -10 dB at the C-band.

How to cite: Dedieu, J.-P., Van Noort, J., Montpetit, B., Levistre, M., Vauclare, S., Wendleder, A., Boike, J., Bernard, E., Gallet, J.-C., and Jacobi, H.-W.: Snow cover monitoring in the Arctic (Svalbard) with RADARSAT Constellation Mission (RCM). Comparison with in-situ measurements and TerraSAR-X data, EGU General Assembly 2023, Vienna, Austria, 23–28 Apr 2023, EGU23-4196, https://doi.org/10.5194/egusphere-egu23-4196, 2023.

EGU23-6176 | ECS | PICO | HS6.6

Dynamics in mountain SNOW water resources by MODEs of climate variability assessed from satellite observations 

Jonas-Frederik Jans, Ezra Beernaert, Hans Lievens, and Niko Verhoest

Satellite information concerning the snow water equivalent (SWE) stored in the world’s mountain ranges is still lacking. This observation gap hinders the accurate estimation of total seasonal water storage in snow. Therefore, the SNOW-MODE project aims to address this gap by improving and developing two satellite retrieval methods to estimate SWE. Firstly, a recently developed empirical change detection algorithm for SWE retrieval from Sentinel-1 (S1) backscatter observations will be thoroughly analyzed and, if possible, improved. Secondly, a snow (Bic-DMRT), soil (Oh) and vegetation (WCM) radiative transfer model (RTM) will be coupled and inverted to estimate SWE using S1 radar backscatter observations and auxiliary snow, soil and vegetation properties. This method will be applied at the point- and grid-scale. The point-scale approach will make use of detailed in-situ measurements and novel tower-mounted radar measurements for RTM development and validation of the retrievals, whereas the grid-scale approach will utilize data generated from a land surface and a snow model. The inclusion of the grid-scale approach allows to investigate whether spatial patterns in SWE can be accurately represented by the S1 retrievals.

Subsequently, both S1 retrieval methods (i.e., change detection and RTM) will be compared over several mountain regions in the Northern Hemisphere (High-Mountain Asia and European and western United States mountains) to assess their uncertainties, validity conditions and main strengths as well as shortcomings. Furthermore, a physics-based snow model (e.g., SnowClim) will also be utilized to simulate snow depth and SWE on a daily basis. To improve the simulation results, the meteorological forcings will be downscaled to a resolution of 500 meter. Further improvements will be aspired by assimilating the mountainous snow depth retrievals (either from the RTM or change detection method) into the snow model. Finally, the generated SWE dataset will be related to modes of climate variability and will be translated into basin-scale water resources availability for society. 

How to cite: Jans, J.-F., Beernaert, E., Lievens, H., and Verhoest, N.: Dynamics in mountain SNOW water resources by MODEs of climate variability assessed from satellite observations, EGU General Assembly 2023, Vienna, Austria, 23–28 Apr 2023, EGU23-6176, https://doi.org/10.5194/egusphere-egu23-6176, 2023.

EGU23-7050 | ECS | PICO | HS6.6 | Highlight

SWE retrieval in the European Alps based on Sentinel-1 snow depth observations and modeled snow density 

Lucas Boeykens, Hans Lievens, Ezra Beernaert, Jonas-Frederik Jans, and Niko Verhoest

Seasonal snow is an essential source of water, especially in mountainous regions. However, accurate satellite observations of the snow water equivalent (SWE), i.e., snow depth multiplied by the snow density, are still lacking. Therefore, new and robust remote sensing techniques are urgently needed. This study presents a novel method for SWE retrieval in mountainous regions at sub-weekly temporal and 500-m spatial resolution, based on snow depth observations from the ESA and Copernicus Sentinel-1 (S1) satellite mission and model simulations of snow density. The snow depth observations rely on a change detection algorithm which translates the temporal changes in the S1 radar backscatter measurements into the accumulation or ablation of snow. The snow density estimates are obtained from different modeling approaches, including empirical methods (e.g., based on the day of the year, the snow depth, snow climate class, etc.) and a physics-based mass and energy balance model. The performance of the different snow density modeling approaches is here compared, both with respect to their ability to accurately simulate in situ measurements of snow density, as well as their ability to accurately simulate in situ measurements of SWE after combination with the S1 snow depth observations. The performance is evaluated over the European Alps, using a large dataset of in situ time series measurements for the period 2015-2022. The results show that the physics-based snow density modeling approach outperforms the empirical approaches, yielding high spatio-temporal correlation between S1 SWE retrievals and in situ measurements. Therefore, the study demonstrates the capability of the Sentinel-1 satellite mission, in combination with a physics-based snow model, to accurately represent the spatio-temporal distribution of SWE in mountainous regions, which can benefit a large range of applications, including hydropower generation, water management, flood forecasting, and numerical weather prediction.

How to cite: Boeykens, L., Lievens, H., Beernaert, E., Jans, J.-F., and Verhoest, N.: SWE retrieval in the European Alps based on Sentinel-1 snow depth observations and modeled snow density, EGU General Assembly 2023, Vienna, Austria, 23–28 Apr 2023, EGU23-7050, https://doi.org/10.5194/egusphere-egu23-7050, 2023.

EGU23-7343 | ECS | PICO | HS6.6

Using synthetic snow cover maps to determine the degree-day snowmelt factor of a distributed hydrological model 

Pau Wiersma, Fatemeh Zakeri, and Grégoire Mariéthoz

Snowmelt can vary largely across time and space, especially in complex terrain. However, hydrological models often represent snowmelt using a single static degree-day factor that relates the melt runoff with air temperature. Seasonally or spatially varying degree-day factors have been shown to better capture the snowmelt heterogeneity, but still rely on simplified parameterizations. One interesting solution proposed in the literature is to use MODIS satellite imagery to capture the true snowmelt heterogeneity, and use it to inform hydrological models on the temporal and spatial evolution of the degree-day factor on a near-daily basis. However, the limited spatial resolution of MODIS makes this process difficult to apply in complex mountainous terrain. Meanwhile, Landsat or Sentinel 2 satellite imagery could be an interesting alternative as they have a much higher spatial resolution but fall short in terms of temporal resolution. In this study, we overcome both these obstacles with a synthetically generated daily snow cover time series based on Landsat resampling. We use the daily synthetic snow cover maps to derive the snow cover depletion in each coarse resolution hydrological model grid cell, which in turn defines the degree-day factor for each cell using a transfer function. To capture the inherent uncertainty of this methodology, we run an ensemble of models using different meteorological forcings and different stochastic realizations of the synthetic snow cover maps. The resulting degree-day factors are evaluated through the skill of the modeled streamflow and snow water equivalent, using different transfer functions in several snow-influenced catchments in Switzerland. 

How to cite: Wiersma, P., Zakeri, F., and Mariéthoz, G.: Using synthetic snow cover maps to determine the degree-day snowmelt factor of a distributed hydrological model, EGU General Assembly 2023, Vienna, Austria, 23–28 Apr 2023, EGU23-7343, https://doi.org/10.5194/egusphere-egu23-7343, 2023.

EGU23-7537 | ECS | PICO | HS6.6

A new opportunity to measure snow depth from space: evaluation of retrievals from ICESat-2 using airborne laser-scanning data 

César Deschamps-Berger, Simon Gascoin, David Shean, Hannah Besso, Ambroise Guiot, and Juan Ignacio López Moreno

The unprecedented precision of the altimetry satellite ICESat-2 and the increasing availability of high-resolution elevation datasets open new opportunities to measure snow depth in the mountains, a critical variable for ecosystems and water resources monitoring. We retrieved snow depth over the upper Tuolumne basin (California, USA) for three years by differencing ICESat-2 ATL06 snow-on elevations and various snow-off elevation sources, including ATL06 and external digital elevation models. The snow presence of each ATL06 segment (i.e. point measurements regularly spaced every 20 m) can be determined from the number of photons returned by the ground surface. Snow depth derived from ATL06 data only (snow-on and snow-off) provided a poor temporal and spatial coverage, limiting its utility. However, using airborne lidar or satellite photogrammetry elevation models as snow-off elevation source yielded an accuracy of ~0.2 m (bias), a precision of ~0.5 m for low slopes and ~1.2 m for steeper areas, compared to eight reference airborne lidar snow depth maps. The snow depth derived from ICESat-2 ATL06 will help address the challenge of measuring the snow depth in unmonitored mountainous areas.

How to cite: Deschamps-Berger, C., Gascoin, S., Shean, D., Besso, H., Guiot, A., and López Moreno, J. I.: A new opportunity to measure snow depth from space: evaluation of retrievals from ICESat-2 using airborne laser-scanning data, EGU General Assembly 2023, Vienna, Austria, 23–28 Apr 2023, EGU23-7537, https://doi.org/10.5194/egusphere-egu23-7537, 2023.

EGU23-8018 | ECS | PICO | HS6.6

Sensitivity of Sentinel-1 observations to snow properties, comparing radar backscatter, polarimetric decomposition parameters, and interferometric phase changes 

Morgane De Breuck, Hans Lievens, Jonas-Frederik Jans, Ezra Beernaert, and Niko Verhoest

Remote sensing can offer important information on snow properties at the global scale. However, the sensitivity of satellite radar measurements at C-band (5.4 GHz) from the ESA and Copernicus Sentinel-1 (S1) mission to snow properties still requires further investigation. This study provides the first results of a detailed sensitivity analysis, carried out over the European Alps at 1-km spatial resolution. It includes three processing types of radar measurements: radar backscatter observations in vertical-vertical (VV) and vertical-horizontal (VH) polarizations, polarimetric decomposition parameters (e.g., H-Alpha dual polarization decomposition), and interferometric phase change and coherence between successive S1 acquisitions from the same relative orbit. The sensitivity of the different radar measurements is investigated with respect to snow properties (snow depth, snow water equivalent, wet-dry snow state), soil properties (surface soil moisture, soil temperature), and vegetation properties (LAI), and furthermore stratified by snow climatology, land cover, and elevation. Preliminary results suggest that, in regions with significant snowfall and limited vegetation, the VH backscatter correlates strongest with snow depth and SWE, whereas the VV backscatter is more strongly correlated with soil properties. The Alpha polarimetric decomposition parameter increases with snow accumulation, indicating increased contributions of volume scattering and multiple scattering. The often low interferometric coherence is confounding the interpretation of interferometric phase changes in mountainous regions. In conclusion, the first results of this sensitivity study indicate the usefulness of S1 radar backscatter and polarimetric decomposition parameters for snow retrieval algorithm development.

How to cite: De Breuck, M., Lievens, H., Jans, J.-F., Beernaert, E., and Verhoest, N.: Sensitivity of Sentinel-1 observations to snow properties, comparing radar backscatter, polarimetric decomposition parameters, and interferometric phase changes, EGU General Assembly 2023, Vienna, Austria, 23–28 Apr 2023, EGU23-8018, https://doi.org/10.5194/egusphere-egu23-8018, 2023.

EGU23-8142 | PICO | HS6.6

Monitoring the impact of rain-on-snow events across the Arctic with satellite data 

Annett Bartsch, Helena Bergstedt, Xaver Muri, Kimmo Rautiainen, Leena Leppänen, Kyle Joly, Aleksandr Sokolov, Pavel Orekhov, Dorothee Ehrich, and Eeva Marietta Soininen

Rain-on-Snow (ROS) events change snow pack properties and in extreme cases ice layers form which affect wildlife, vegetation and soils beyond the duration of the event. Active as well as passive microwave sensors have been used in the past to document ROS on regional scale. Either wet snow during a ROS event or the formation of crust afterwards are identified in most cases. The fusion of both approaches is promising for circumpolar monitoring.

C-band radar is of special interest due to good data availability including a range of nominal spatial resolution (10 m–12.5 km). Previous studies indicated that radar backscatter is suitable to identify snow structure change. As an example L-band passive microwave observations from SMOS and C-band backscatter from Metop ASCAT have been jointly analysed and compared to snowpit observations in Scandinavia and Northwestern Siberia.

A circumpolar dataset of potential ROS has been created. The gridded information has been eventually aggregated for events. Larger mid-winter events have been eventually extracted for 2012-2021. They occur mostly in the NE part of northern Eurasia (mostly November) and across Alaska (mostly December). The spatiotemporal patters of these events and the magnitude of snow structure change will be presented and discussed.

How to cite: Bartsch, A., Bergstedt, H., Muri, X., Rautiainen, K., Leppänen, L., Joly, K., Sokolov, A., Orekhov, P., Ehrich, D., and Soininen, E. M.: Monitoring the impact of rain-on-snow events across the Arctic with satellite data, EGU General Assembly 2023, Vienna, Austria, 23–28 Apr 2023, EGU23-8142, https://doi.org/10.5194/egusphere-egu23-8142, 2023.

EGU23-8530 | PICO | HS6.6 | Highlight

Advancing science readiness for a new snow mass radar mission 

Chris Derksen, Benoit Montpetit, Vincent Vionnet, Vincent Fortin, Juha Lemmetyinen, Richard Kelly, and Aaron Thompson

Environment and Climate Change Canada (ECCC) and the Canadian Space Agency (CSA) continue to advance a new satellite Ku-band radar mission focused on providing moderate resolution (500 m) information on seasonal snow mass. Like many regions of the northern hemisphere, estimates of the amount of water stored as seasonal snow are highly uncertain across Canada. To address this gap, a technical concept capable of providing dual-polarization (VV/VH), moderate resolution (500 m), wide swath (~250 km), and high duty cycle (~25% SAR-on time) Ku-band radar measurements at two frequencies (13.5; 17.25 GHz) is under development. Parallel to engineering studies to address the technical readiness, a range of activities are in progress to advance scientific readiness. In this presentation, we will review how recent progress within the mission science team and across the snow community has provided a sound science foundation for the mission, and identify risks to meeting the required level of readiness within the required timeline for full mission implementation. Key areas include:

  • Implementation of computationally efficient SWE retrieval techniques, including parameterized forward model simulations for prediction of snow volume scattering, physical snow modeling to provide initial estimates of snow microstructure, and consideration of background characteristics;
  • Incorporation of land surface model SWE estimates to infill gaps with no radar-derived SWE information due to dense forest, wet snow, and swath gaps;
  • Direct assimilation of Ku-band backscatter into environmental prediction systems (analogous to how SMOS and SMAP data have improved soil moisture analysis through radiance-based assimilation);
  • Segmentation of wet from dry snow;
  • Continued advancement of the understanding of the physics of Ku-band backscatter response to variations snow through new experimental tower and airborne measurements.

Ku-band radar is a viable approach for a terrestrial snow mass mission because these measurements are sensitive to SWE through the volume scattering properties of dry snow and can discriminate the wet versus dry state of snow cover. To justify investment in such a mission, however, the scientific pieces must be in place. Balanced and honest assessments of the state of scientific readiness, the likelihood for emerging capabilities, and the level of engagement across the snow community are essential to ensure a healthy mission development process.

How to cite: Derksen, C., Montpetit, B., Vionnet, V., Fortin, V., Lemmetyinen, J., Kelly, R., and Thompson, A.: Advancing science readiness for a new snow mass radar mission, EGU General Assembly 2023, Vienna, Austria, 23–28 Apr 2023, EGU23-8530, https://doi.org/10.5194/egusphere-egu23-8530, 2023.

In order to more quantitatively compare the differences between radar reflectivity and snowfall intensity against ground-observed snow depth, snow depth ground observation data and weather radar observation data were analyzed. For radar observation data, cumulative reflectivity and precipitation intensity derived from reflectivity, differential reflectivity, and specific differential phase (Quantitative Precipitation Estimation) were compared. As a result of the analysis, it was found that the precipitation intensity was similar to the variation according to the snow depth and time compared to the radar reflectivity. However, although the initial accumulation tendency of snow fall was very well matched due to the characteristics of snow cover, which is sensitive to temperature and has accumulation and melting characteristics, the melting tendency from daytime showed a difference. Therefore, it is judged that more accurate snow depth can be estimated only when precipitation intensity estimation method according to temperature is derived and used in addition to methods such as accumulation of reflectivity.


Acknowledgement

This research was supported by a grant(2022-MOIS61-003) of Development Risk Prediction Technology of Storm and Flood for Climate Change based on Artificial Intelligence funded by Ministry of Interior and Safety(MOIS, Korea).


How to cite: Kang, N., Hwang, S., and Yoon, J.: Comparison of correlations between radar reflectivity and radar precipitation intensity for snow depth, EGU General Assembly 2023, Vienna, Austria, 23–28 Apr 2023, EGU23-10436, https://doi.org/10.5194/egusphere-egu23-10436, 2023.

EGU23-11618 | ECS | PICO | HS6.6

Validation of high resolution remotely sensed and modeled snow cover with webcam imagery 

Andreas Kollert, Andreas Mayr, Martin Rutzinger, and Stefan Dullinger
Recently, snow cover has gained a lot of interest as an important driver of plant species distribution in arctic and alpine environments, especially on small spatial scales . However, variation of snow cover at this scale is hardly resolved by open satellite data. Hence, linking remotely sensed snow cover and critical patterns and processes in vegetation can be challenging due to a mismatch in spatial resolution.
We present a study based on a high alpine network of three webcams for the validation of snow cover products covering an entire year. Satellite based snow cover products (Landsat, Sentinel-2, downscaled MODIS products) are benchmarked on webcam-derived snow cover. While optical satellite remote sensing is a valuable tool for characterizing snow cover dynamics at the scale of tens of meters, cloud cover causes considerable data gaps. As a temporally and spatially more continuous estimate, we additionally produce meter-scale snow cover using the openAmundsen model, and we compare this to the webcam derived snow cover as well. For all datasets, ecologically relevant indicators like snow cover duration and the number of snow-free days are aggregated and validated both for the entire year and on a sub-seasonal scale.

How to cite: Kollert, A., Mayr, A., Rutzinger, M., and Dullinger, S.: Validation of high resolution remotely sensed and modeled snow cover with webcam imagery, EGU General Assembly 2023, Vienna, Austria, 23–28 Apr 2023, EGU23-11618, https://doi.org/10.5194/egusphere-egu23-11618, 2023.

EGU23-11702 | ECS | PICO | HS6.6

Seasonal evaluation of morphological indexes in quantifying snow cover patterns in the Zugspitze area 

Lucia Ferrarin, Franziska Koch, Karsten Schulz, and Daniele Bocchiola

The spatiotemporal distribution of snow cover affects several processes at different scales, such as the Earth’s energy balance, the hydrological cycle and ecosystems functions, with important implications on many aspects of human life. Topography, meteorological conditions in general and wind in particular affect the evolution of seasonal snow cover patterns during snow accumulation and ablation. With the help of remote sensing techniques, such as Sentinel-2 imagery, it is feasible to study snow cover patterns also in complex terrain. Satellite based morphological analysis of snow cover patterns may provide i) information on snow cover and its connection to morphology and alpine topography ii) a valuable complement to ground-based data and snow-hydrological simulations. In this study, we evaluate the effectiveness of two types of geometric indexes, i) MN, Minkowsky numbers (representing area, perimeter and Euler characteristic), and ii) CL, Average chord length, in quantitatively describing the morphology of Sentinel-2 derived snow cover patterns within the high-alpine area of Zugspitze at the boarder of Germany and Austria for a five-year period. MN and CL have been used previously in different fields, e.g. soil sciences, but to the authors’ knowledge, these measures have never been applied in the field of snow cover pattern monitoring before. We present the seasonal evolution of MN and CL, as well as their correlation to topographic features (e.g., aspect, slope, curvature) and meteorological and snow variables. The individual indexes show distinct differences during snow accumulation and ablation and a clear annual periodicity. MN and CL can effectively quantify some aspects of the dynamic of snow cover patterns, although further analysis are necessary to conclude if such morphologic pattern descriptors can substantively improve the accuracy of the understanding and the modelling of snow-related processes.

How to cite: Ferrarin, L., Koch, F., Schulz, K., and Bocchiola, D.: Seasonal evaluation of morphological indexes in quantifying snow cover patterns in the Zugspitze area, EGU General Assembly 2023, Vienna, Austria, 23–28 Apr 2023, EGU23-11702, https://doi.org/10.5194/egusphere-egu23-11702, 2023.

EGU23-12126 | ECS | PICO | HS6.6

Evaluation of LDAPS Snow information by MERRA-2 and ASOS over the South Korea 

Hyunho Jeon, Jaehwan Jeong, Yangwon Lee, and Minha Choi

In the past decade, heavy snow has recorded the third-highest disaster damage in Korea after typhoons and heavy rain. In addition, snowfall is one of the important factors in the water cycle, and it directly affects hydrological factors such as evapotranspiration and soil moisture. Due to the topographical features of Korea, snowfall occurs heterogeneously, so it has limitations to use only in-situ data for snow monitoring. Although grid data such as remote sensing and model simulated data has been suggested as an alternative to this, it is also difficult to use only grid data due to the characteristics of snow that influence spectral behavior depending on grain size, age, etc. In this study, snow depth data was evaluated using model simulated data and ground observation data over the South Korea. For data, Local Data Assimilation and Prediction System [LDAPS] (provided with 3 hours of temporal resolution and 1.5 km of spatial resolution), Modern-Era Retrospective analysis for Research and Applications, version 2 [MERRA-2] (provided with 1 hour of temporal resolution and 0.5° × 0.623° of spatial resolution) and Automated Synoptic Observing System [ASOS] (provided with 1 hour of temporal resolution) were used. The applicability of each data was evaluated with topographic data, and long-term trend of snow depth was analyzed. This study can help to predict snow information, with the combination of various reanalysis data and model simulated forecast dataset.


Keywords: Snow Depth, LDAPS, MERRA-2, ASOS


Acknowledgment

This research was supported by the BK21 FOUR (Fostering Outstanding Universities for Research) funded by the Ministry of Education (MOE, Korea) and National Research Foundation of Korea (NRF-2021R1A6A3A01087645).

How to cite: Jeon, H., Jeong, J., Lee, Y., and Choi, M.: Evaluation of LDAPS Snow information by MERRA-2 and ASOS over the South Korea, EGU General Assembly 2023, Vienna, Austria, 23–28 Apr 2023, EGU23-12126, https://doi.org/10.5194/egusphere-egu23-12126, 2023.

EGU23-12702 | PICO | HS6.6

Wet Snow Mapping in the Karakoram using SAR and Topographic Data 

Shiyi Li, Lanqing Huang, Philipp Bernhard, and Irena Hajnsek

Wet snow is a critical component of the cryosphere, and its spatial and temporal distribution has important implications for water resources, natural hazards, and the regional climate. However, mapping wet snow in alpine regions such as the Karakoram is challenging due to complex topography, harsh weather conditions, and limited in-situ observations.

Previous studies have shown that synthetic aperture radar (SAR) can effectively detect wet snow surfaces using the backscattering ratio between the current and reference images (e.g. the average of summer acquisitions). However, its regional application on a large-scale and complex terrain is hampered, as the ratio value is easily affected by the land cover, local topography, surface roughness, and snow wetness.

In this study, we present a new approach for mapping wet snow in the Karakoram using a combination of SAR data and topographic information. The SAR data used in the analysis were obtained from Sentinel-1, and the topographic data included a digital elevation model (DEM), slope angle, and slope aspect ratio. We first used a Gaussian Mixture Model to classify the ratio image of Sentinel-1 into wet snow (WS) and non-wet snow (NWS) classes, then transformed the two classes into a logistic function to characterize the probability of WS based on the backscattering ratio. Secondly, we categorized the image based on the topography and calculated the likelihood of WS for each topographic bin using the WS probability. The joint WS likelihood map was finally obtained by multiplying the WS probability on the backscattering ratio with the WS likelihood on topography, and a binary WS map was generated by setting a threshold on the joint likelihood map.

The proposed method was validated using snow maps generated from Sentinel-2 images. Compared with the traditional method of using only the SAR backscattering ratio, our method significantly reduced false negative detections and preserved the high true positive rate, indicating an improvement of robustness and accuracy by combining SAR and topographic data for regional wet snow mapping.

This study demonstrates a practical method of merging SAR backscattering features and topographic information for robust regional wet snow mapping in complex mountain ranges. It also provides new insights into the incorporation of different datasets using a probabilistic framework. With the proposed method, the operational monitoring of wet snow distribution in the Karakoram using SAR becomes feasible and reliable.

How to cite: Li, S., Huang, L., Bernhard, P., and Hajnsek, I.: Wet Snow Mapping in the Karakoram using SAR and Topographic Data, EGU General Assembly 2023, Vienna, Austria, 23–28 Apr 2023, EGU23-12702, https://doi.org/10.5194/egusphere-egu23-12702, 2023.

EGU23-15295 | ECS | PICO | HS6.6 | Highlight

Analysis of ALOS2 L-band repeat-pass InSAR for the retrieval of Snow Water Equivalent over boreal forest. 

Jorge Jorge Ruiz, Juha Lemmetyinen, Ioanna Merkouriadi, Juval Cohen, Anna Kontu, Jouni Pulliainen, and Jaan Praks

The mass of seasonal snow is a challenging parameter to measure from space. This is a significant observational gap as information on snow mass would be required by diverse applications such as flood prevention, and water resource management. Snow Water Equivalent (SWE) describes the amount of liquid water that is stored in the snowpack. A promising technique to measure changes in SWE over time is repeat-pass Interferometric SAR (InSAR), since it provides high spatial resolution and reasonable temporal resolution. The retrieval technique relies on the phase difference induced by the increase in propagation path due to snow accumulation since snow has a higher permittivity than air [1]. The retrieval has been demonstrated using a wide range of sensors [1-3]. In a recent work [4], the usability of L-, S-, C-, and X- frequency bands (1-10 GHz) was analysed in the context of coherence conservation and SWE retrieval. L-band emerged as a solid candidate, as this band appeared more resilient against temporal decorrelation in snow while enabling retrieval of large amounts of SWE.

The Copernicus Radar Observation System for Europe in L-band (ROSE-L), estimated to be launched in 2028, is one of the six Copernicus high-priority Sentinel Expansion missions selected for implementation. The mission will consist of two satellites with a 180 degrees orbit phasing, allowing a temporal baseline of 6 days. We present an analysis of L-band ALOS2 imagery over Sodankylä, in northern Finland, applied for SWE retrieval using the InSAR method. The landscape is dominated by coniferous forest, presenting a challenge for large-scale retrieval of SWE. Due to ALOS2 revisit time of 14 days, it is prone to suffer from temporal decorrelation. We analysed the coherence conservation considering environmental events, land cover, canopy cover and topography. We introduce SnowModel [5], a high-resolution, spatially distributed physical snow evolution model, for comparison to InSAR SWE retrievals. SnowModel simulations were used to calibrate the interferometric phase, allowing a comparison between the two and demonstrating in which areas and under which conditions the retrieval works.


[1] T. Guneriussen, K. A. Hogda, H. Johnsen and I. Lauknes, "InSAR for estimation of changes in snow water equivalent of dry snow," in IEEE Transactions on Geoscience and Remote Sensing, vol. 39, no. 10, pp. 2101-2108, Oct. 2001, doi: 10.1109/36.957273.

[2] T. Nagler et al., "Airborne Experiment on Insar Snow Mass Retrieval in Alpine Environment," IGARSS 2022 - 2022 IEEE International Geoscience and Remote Sensing Symposium, 2022, pp. 4549-4552, doi: 10.1109/IGARSS46834.2022.9883809.

[3] S. Leinss, A. Wiesmann, J. Lemmetyinen and I. Hajnsek, "Snow Water Equivalent of Dry Snow Measured by Differential Interferometry," in IEEE Journal of Selected Topics in Applied Earth Observations and Remote Sensing, vol. 8, no. 8, pp. 3773-3790, Aug. 2015.

[4] J. J. Ruiz et al., "Investigation of Environmental Effects on Coherence Loss in SAR Interferometry for Snow Water Equivalent Retrieval," in IEEE Transactions on Geoscience and Remote Sensing, vol. 60, pp. 1-15, 2022, Art no. 4306715, doi: 10.1109/TGRS.2022.3223760.

[5] Liston, Glen E.; Elder, Kelly. 2006. A distributed snow-evolution modeling system (SnowModel). Journal of Hydrometeorology. 7(6): 1259-1276


How to cite: Jorge Ruiz, J., Lemmetyinen, J., Merkouriadi, I., Cohen, J., Kontu, A., Pulliainen, J., and Praks, J.: Analysis of ALOS2 L-band repeat-pass InSAR for the retrieval of Snow Water Equivalent over boreal forest., EGU General Assembly 2023, Vienna, Austria, 23–28 Apr 2023, EGU23-15295, https://doi.org/10.5194/egusphere-egu23-15295, 2023.

EGU23-15479 | PICO | HS6.6

Retrieval of snow grain size and albedo using EnMAP spaceborne observations 

Alexander Kokhanovsky, Maximillian Brell, Sabine Chabrillat, Saskia Förster, and Karl Segl

Cryosphere is an integral part of the terrestrial ecosystem with important linkages and feedbacks generated through its influence on moisture fluxes, hydrology, and climate change due to temporal changes in snow/ice extent, impurity load and albedo. Therefore, snow and ice properties including ice and snow albedo and extent are monitored using ground and satellite instrumentation. The measurements are performed at various temporal and spatial scales using passive and active remote sensing instrumentation in a broad spectral range. The high spatial resolution is highly relevant for studies of cryosphere due to the rapid horizontal variability of snow properties and impurity load (dust outbreaks, algae blooms, structures on the snow surface/sastrugi). The instruments with low spatial resolution are not capable to resolve fine scales of snow variability. The accurate information on specific snow features (e.g., spatial distribution of algae blooms) can be hardly detected using measurements performed on the scale 0.3-1.0km.  The Environmental Mapping and Analysis Program (EnMAP) is a German hyperspectral satellite mission (Guanter et al., 2015), which provides information on evolution of aquatic and terrestrial ecosystems including cryosphere on the spatial scale of 30m, is capable to resolve the fine scale variability of snow properties. The measurements of EnMAP can be also used to assess the sub-pixel snow variability for coarse spatial resolution satellite missions and assess the accuracy of satellite products derived on the coarse spatial grid (e.g., snow fraction). This paper is aimed at the adaptation of the previously proposed snow remote sensing technique (Kokhanovsky et al., 2023) to EnMAP measurements. The retrievals are based on the asymptotic radiative transfer theory valid for weakly absorbing multiply light scattering turbid media (Kokhanovsky, 2021). The local optical properties of snow are calculated using the geometrical optics approximation, which is a valid technique for snow due to large size of ice grains as compared to the wavelength of the incident solar light in the spectral range under study. In particular, the spectral snow albedo and snow grain size are retrieved using EnMAP measurements performed by the SWIR EnMAP detector in the spectral range 900 - 1283nm. The snow specific surface area (SSA) and broadband albedo (BBA) are also derived using EnMAP measurements. The example of retrievals over Concordia station in Antarctica is given. It has been found that the effective ice grain diameter is around 0.23mm, SSA=28m*m/kg, and BBA=0.81, which is similar to the values of snow parameters measured at this location at the same season using both ground and satellite instrumentation.

References

Guanter, L., H. Kaufmann, K. Segl, et al., 2015: The EnMAP Spaceborne Imaging Spectroscopy Mission for Earth Observation. Remote Sensing 7: 8830-8857.

Kokhanovsky, A., 2021: Snow Optics, Cham: Springer.

Kokhanovsky, A., B. Vandecrux, A. Wehrlé, O. Danne, C. Brockmann, and J. E. Box, 2023: Improved Retrieval of Snow and Ice Properties Using Spaceborne OLCI/S-3 Spectral Reflectance Measurements: Updated Atmospheric Correction and Snow Impurity Load Estimation. Remote Sensing 15: 1-25.

How to cite: Kokhanovsky, A., Brell, M., Chabrillat, S., Förster, S., and Segl, K.: Retrieval of snow grain size and albedo using EnMAP spaceborne observations, EGU General Assembly 2023, Vienna, Austria, 23–28 Apr 2023, EGU23-15479, https://doi.org/10.5194/egusphere-egu23-15479, 2023.

EGU23-15926 | ECS | PICO | HS6.6 | Highlight

Liquid water content in a seasonal snowpack: a comparison between satellite products and model simulations 

Greta Cazzaniga, Ali Nadir Arslan, and Carlo De Michele

The spatial and temporal quantification of the liquid water content (LWC) of the snowpack in alpine regions provides information on the short-term availability of water, which could eventually lead to wet snow avalanches or river floods. The monitoring and forecasting of snow wetness are hence of paramount importance in many fields, from operational avalanche forecasting to hydropower production and flood prediction, when combined with hydrological models. 
Remote sensing is an essential tool for snow monitoring as it offers observations of the snowpack's physical properties. For instance, Sentinel-1 satellites provide C-band synthetic aperture radar (SAR) data at high temporal and spatial resolutions and are capable to detect the presence of wet snow.  On the other side, many snow models were built in literature to simulate snowpack mass dynamics in space and time (see e.g., Crocus and HyS model) and can provide predictions of variables of interest in snow hydrology, such as the LWC. 
In the present work, we aim at identifying and quantifying the differences between satellite products and model snow estimates. In particular, the comparison is led among (1) Sentinel-1-based wet-snow products, (2) HSAF products, coming from the processing of data from Earth observation satellites and revealing the wet or dry status of the snow mantle, and (3) simulations of the liquid water content from HyS model, a temperature-index model, leveraged in both its one-layer and two-layer version. The case study is the Mallero basin, a middle-size alpine basin, whose flow regime is strongly influenced by snow melting and glacier ablation in the spring and summer seasons. 
The comparison returns a good agreement between Sentinel-1 products and HyS simulations. The short period of mismatches between the two outputs is analyzed to identify the physical processes that the model is not able to reproduce. On the other side HSAF products have a coarser resolution if compared to Sentinel-1 products and for this, they can just provide a qualitative overview of the snow mantle status, over a middle-size basin. Moreover, such products are also limited by the effect of cloud covering that makes it impossible to have information on the snow wetness when it is present.

How to cite: Cazzaniga, G., Arslan, A. N., and De Michele, C.: Liquid water content in a seasonal snowpack: a comparison between satellite products and model simulations, EGU General Assembly 2023, Vienna, Austria, 23–28 Apr 2023, EGU23-15926, https://doi.org/10.5194/egusphere-egu23-15926, 2023.

EGU23-16000 | PICO | HS6.6 | Highlight

Role of snow for changes hydrological regimes in the Lena river basin 

David Gustafsson, Jude Musuuza, Katharina Klemeth, Denica Bozhinova, Andrea Popp, Liudmila Lebedeva, and Tetsuya Hiyama

The study investigates the role of snow for the climate change impacts in hydrological regimes across the Lena river basin in Yakutia, Eastern Siberia using a hydrological model constrained by in-situ and satellite-based snow and river discharge observations. The river runoff observations in large and medium sized rivers show an increase over recent decades that can be associated with increasing air temperature and precipitation, as well as changes in snow, glaciers, and permafrost. We assessed the relation between changes in snow and streamflow using the satellite-based ESA CCI snow data and the hydrological model HYPE. The streamflow trend analysis showed a general pattern of increasing monthly mean and minimum stream flows from October to April, but more frequent in larger river basins, and especially if the last 20 years are included in the trend analysis. This can be explained by the increasing autumn precipitation, but the absence of change in annual maximum flow and streamflow in June also suggests relation to changes in the snow. The snow data shows a pattern of decreasing maximum snow water equivalent in the western part of the study area, and a corresponding decreasing trend of number of days with snow cover. These results are in line with the trends in observed streamflow; a short snow cover period (and increasing amount of autumn and winter rainfall, not shown here) as well as a lower maximum snow water equivalent could contribute both to the increasing winter runoff, and the absence of increasing streamflow in early summer. 

This work was conducted as part of the HYPE-ERAS project funded by FORMAS (project DNR: 2019-02332), RFBR (project No. 20-55-71005), and JST (Grant No. JPMJBF2003) through the Belmont Forum Collaborative Research Action: Resilience in the Rapidly Changing Arctic.

How to cite: Gustafsson, D., Musuuza, J., Klemeth, K., Bozhinova, D., Popp, A., Lebedeva, L., and Hiyama, T.: Role of snow for changes hydrological regimes in the Lena river basin, EGU General Assembly 2023, Vienna, Austria, 23–28 Apr 2023, EGU23-16000, https://doi.org/10.5194/egusphere-egu23-16000, 2023.

EGU23-16822 | PICO | HS6.6

An integrated remote-sensing approach for prairie snowpack 

Eric A. Sproles, Ross T. Palomaki, Madison Woodley, and Samual E. Tuttle

In a low-relief, agricultural landscape we integrate detailed measurements from plane-based L-band SAR (UAVSAR), drone-based LiDAR and photogrammetry, cosmic ray neutron sensor (CRNS), and field assessments to disentangle and quantify how topography, wind, and vegetation influence the spatial distribution snow cover and water equivalent. Seasonal snow in prairie and temperate grasslands environments helps sustain agriculture, socio-environmental systems, and aquifers while also exacerbating flooding in wetter years. Because these expansive landscapes cover roughly 10% of the earth’s surface, quantifying snow and snow water equivalent (SWE) is critical to better resolve water and energy budgets from local to global scales. Present day, remotely-sensed observations and conventional automated ground-based observations (e.g. SWE scales) of seasonal snow in these biomes contain considerable uncertainty. Optical imagery can detect the presence/absence of snowpack, but lacks the capacity to provide estimates of SWE. Synthetic Aperture Radar (SAR) provides a potential path forward to quantify SWE in grassland and agricultural environments, but current measurements are poorly constrained, especially in prairie environments. The Central Agricultural Research Center (CARC) in central Montana, USA (47ºN, 110ºW) served as field site for NASA’s SnowEx 2021 Mission and was distinct from other campaign locations due to its prairie landscape, controlled agricultural vegetation patterns, and ephemeral snow cover. The CRNS measures an integrated snow signal over several hectares, allowing for continuous estimations of SWE that are less influenced than smaller scale observations by the significant spatial heterogeneity of prairie snow. Initial results show that CRNS effectively quantifies an integrated SWE signal at the study site (R2 ≥ 0.90).  Interferometric UAVSAR products and drone flights provide complementary high resolution snow information for narrow time periods that effectively identify snow presence across areas with different crop types (wheat, barley, peas) and stubble heights (0-0.6 m) . The limited number of UAVSAR flights in 2021 preclude a full season or multi-year analysis. However our integrated sensing approach and analysis provides a framework to reduce uncertainty in future efforts, and better constrain measurements from the upcoming L-band NISAR mission that is expected to be launched in January 2024.   

How to cite: Sproles, E. A., Palomaki, R. T., Woodley, M., and Tuttle, S. E.: An integrated remote-sensing approach for prairie snowpack, EGU General Assembly 2023, Vienna, Austria, 23–28 Apr 2023, EGU23-16822, https://doi.org/10.5194/egusphere-egu23-16822, 2023.

EGU23-17234 | ECS | PICO | HS6.6

Tower based C-band measurements of an alpine snowpack 

Isis Brangers, Hans-Peter Marshall, Grabielle J.M. De Lannoy, and Hans Lievens

Measuring snow from space is still a significant challenge in hydrology. Work by Lievens et al. (2019) for the first time showed the potential of the Sentinel-1 C-band radar mission to measure snow depth from space. However, the physical interactions between snow grains and the comparatively long C-band waves are not sufficiently understood. To improve this understanding, a tower based C-band radar experiment was set up in Idaho’s Rocky mountains starting from January 2020. The ultra-wideband radar system recorded the reflections in the time-domain, allowing to study the return throughout the different layers of the snowpack at a fine resolution. Reference data of the stratigraphy and snow properties were collected during ~weekly site visits. Our results indicate that some volume scattering is present at C-band for dry snow, and that the backscatter return increases substantially after melt-freeze cycles and with the appearance of ice features within the snowpack.

How to cite: Brangers, I., Marshall, H.-P., De Lannoy, G. J. M., and Lievens, H.: Tower based C-band measurements of an alpine snowpack, EGU General Assembly 2023, Vienna, Austria, 23–28 Apr 2023, EGU23-17234, https://doi.org/10.5194/egusphere-egu23-17234, 2023.

EGU23-2385 | ECS | Posters on site | HS6.7

Soil moisture simulation at the local scale using satellite remote sensing data towards sustainable irrigation 

Shirin Moradi, David Mengen, Harry Vereecken, and Carsten Montzka

Water plays a crucial role in food security. Currently, agriculture irrigation withdraws about 70% of the world’s fresh water. By 2050, the world population is estimated to increase to over 9 billion (UNDP, 2022). Together with climate change that is increasingly affecting the terrestrial ecosystem such as increasing the temperature, drought and extreme flood, all of which can lead to crop failure (IPCC et al., 2007) and water scarcity, the demand for food and irrigation water is expected to rise, dramatically. Accordingly, novel technologies for innovative, real-time water management for sustainable irrigation are necessary. In this regard, the main objective of this study is to simulate and predict the soil water content at the root zone, as a main factor of defining the irrigation time and quantity. Here, we have chosen a study area of 150km2 which is located in west Europe, covering parts of Netherlands, Belgium, Luxemburg and west of Germany. Therewith, we have relied on the coupled land surface-subsurface CLM-Parflow model for hydrological simulations and the soil moisture data from on-site Cosmic-ray neutron sensor (CRNS) stations, as well as the SMAP (L3_SM_E_P), and high resolution C- and L-band Synthetic Aperture Radar (SAR) are used for data assessment. It is expected that the reliability of the soil moisture magnitude and dynamic will be examined.

How to cite: Moradi, S., Mengen, D., Vereecken, H., and Montzka, C.: Soil moisture simulation at the local scale using satellite remote sensing data towards sustainable irrigation, EGU General Assembly 2023, Vienna, Austria, 23–28 Apr 2023, EGU23-2385, https://doi.org/10.5194/egusphere-egu23-2385, 2023.

EGU23-2510 | ECS | Posters virtual | HS6.7

Assessment of Water Consumption Pattern & Agricultural Production using Water accounting Plus (WA+) Framework: A case study of Mahi River basin  

Pooja Patle, Ashutosh Sharma, Pushpendra Kumar Singh, Ishtiyaq Ahmad, Yutaka Matsuno, Mansoor Leh, and Surajit Ghosh

Concerns about managing water resources and ensuring food security in arid and semi-arid regions have grown due to increasing demands on water resources and food production. The Water Accounting Plus (WA+) approach is employed in this context to determine water consumption pathways occurring on various land uses, crop production (Land Productivity: LP), and Water Productivity (WP) in the Mahi Basin, India. The WA+ framework is appropriate for the data-scarce region since it allows the use of satellite-driven datasets for analyzing hydrological processes. The Budyko curve concept is used to differentiate between irrigation- and rain-fed agriculture by identifying the green and blue water consumption (ET). The WA+ framework uses remote sensing-based datasets from various sources for this purpose, which were used in this study for the period of 2003-2020. The average ETgreen and ETblue in the Mahi basin are found to be 15.8 km3/year and 12.32 km3/year, respectively. The average LP and WP for both the irrigated and rainfed cereals in the basin are found as 2287.71 kg/ha & 1713.62 kg/ha and 0.721 kg/m³ & 0.483 kg/m³, respectively, from 2003 to 2020. The results also indicate that the basin is highly reliant on irrigation for agricultural activities, which are neither efficient nor productive. There is significant potential for improvement in water production and beneficial water usage by using proper water management techniques. This study emphasizes the significance of water accounting and information for decision-makers, researchers, and farmer communities to create realistic goals and increase crop production in water-scarce locations.


How to cite: Patle, P., Sharma, A., Singh, P. K., Ahmad, I., Matsuno, Y., Leh, M., and Ghosh, S.: Assessment of Water Consumption Pattern & Agricultural Production using Water accounting Plus (WA+) Framework: A case study of Mahi River basin , EGU General Assembly 2023, Vienna, Austria, 23–28 Apr 2023, EGU23-2510, https://doi.org/10.5194/egusphere-egu23-2510, 2023.

EGU23-2653 | Posters on site | HS6.7

Optimizing variable rate irrigation using model-based dynamic prescription maps 

Francesco Morari, Davide Gabrieli, Lorenzo Furlan, Jacopo Furlanetto, Davide Misturini, Jose Sobrino, Drazen Skokovic, and Chiara Corbari

Variable rate irrigation is usually based on prescription maps delineated according to a static approach. Irrigation rate and timing are optimised by sensor and/or modelling-based methods applied within homogenous zones whose spatial distribution is kept constant during the crop season. The objective of this study was to develop a procedure based on the combination of the crop-energy-water balance model FEST-EWB-SAFY with remote sensing data of vegetation variables and land surface temperature to generate dynamic irrigation prescription maps. The crop-energy-water balance FEST-EWB-SAFY model couples the distributed energy-water balance FEST-EWB, which allows computing continuously in time and distributed in space both soil moisture and evapotranspiration fluxes, and the SAFY (simple model for yield prediction and plant development).

The model was tested in a 30-ha field cultivated with soybean in 2022 at Ceregnano, in the lower zone of the Po Valley (Italy). Irrigation was provided by 270m long lateral move irrigation machine, equipped with a precision irrigation system with a lateral resolution of 34 m. The model was pixelwise calibrated with remotely sensed land surface temperature (LST, RMSE 1.3 °C) and leaf area index (RMSE 0.45) as well as local measured soil moisture at 10cm and 50cm depth (RMSE 0.04). Four dynamic prescription maps were generated during the season, calculating the pixel-by-pixel difference between the field retention capacity and the daily average of the 50-cm soil moisture profile. Dynamic variable rate irrigation was compared with a conventional irrigation system according to an experimental block design with three replicates and evaluated in terms of crop yield, irrigation volumes and water use efficiency.

FEST-EWB-SAFY allowed the creation of dynamic maps that captured the crop water requirement variability originated by the interaction of ET, soil properties and field management. Compared with the conventional system, there was a significant increase in water use efficiency, but not in crop yield. These results confirm that the model-based dynamic prescription maps could be used to optimize variable irrigation in highly spatio-temporal dynamic cropping systems

How to cite: Morari, F., Gabrieli, D., Furlan, L., Furlanetto, J., Misturini, D., Sobrino, J., Skokovic, D., and Corbari, C.: Optimizing variable rate irrigation using model-based dynamic prescription maps, EGU General Assembly 2023, Vienna, Austria, 23–28 Apr 2023, EGU23-2653, https://doi.org/10.5194/egusphere-egu23-2653, 2023.

EGU23-3250 | ECS | Orals | HS6.7

Irrigation quantification through backscatter data assimilation with a buddy check approach 

Louise Busschaert, Michel Bechtold, Sara Modanesi, Christian Massari, Luca Brocca, and Gabriëlle J. M. De Lannoy

Irrigation is an important component of the terrestrial water cycle, but it is often poorly accounted for in models. When included, irrigation often relies on simplistic assumptions such as soil moisture deficit approaches. In the last years, methods have been developed to detect and quantify irrigation by making use of satellite remote sensing data. Recent developments have attempted to integrate satellite data and land surface models via data assimilation (DA) to (1) detect and quantify irrigation, and (2) better model the related land surface variables such as soil moisture, vegetation, and evapotranspiration. In this study, different synthetic DA experiments are tested to advance satellite DA for the estimation of irrigation. We assimilate synthetic Sentinel-1 backscatter observations into the Noah-MP model coupled with an irrigation scheme. When updating soil moisture, we found that the DA sets better initial conditions to trigger irrigation in the model. However, large DA updates to wetter conditions can inhibit irrigation simulation. Building on this limitation, we propose an improved DA algorithm using a buddy check approach. The method still updates the land surface, but now the irrigation trigger is not based on the evolution of soil moisture, but on an adaptive innovation outlier detection, making the trigger observation-based.

The new method was tested with different levels of model and observation error. For mild model and observation errors, the DA outperforms the model-only 14-day irrigation estimates by about 30% in terms of root-mean-squared differences, when frequent (daily or every other day) observations are available. The improvements can surpass 50% for high model errors. However, with longer observation intervals (7 days), the system strongly underestimates the irrigation amounts. White noise in the signal has a milder impact on the performance, reducing the improvement by 10% compared to the assimilation of perfect observations. The method is flexible and can be expanded to other DA systems and to a real-world case.

How to cite: Busschaert, L., Bechtold, M., Modanesi, S., Massari, C., Brocca, L., and De Lannoy, G. J. M.: Irrigation quantification through backscatter data assimilation with a buddy check approach, EGU General Assembly 2023, Vienna, Austria, 23–28 Apr 2023, EGU23-3250, https://doi.org/10.5194/egusphere-egu23-3250, 2023.

EGU23-4208 | Orals | HS6.7

Evaluation of remotely sensed and reanalyzed irrigation maps over China 

Xin Tian, Jianzhi Dong, Lingna Wei, Xiaoqi Kang, Huiwen Zhang, Xiaosong Sun, Shuaikun Li, Dexing Zhao, and Yuxi Li

The uncertainty of the irrigated area is a key error source of irrigation modeling. Existing irrigation maps, produced by either remote sensing or reanalyzed dataset, are known to contain substantial inter-product differences. However, relatively little work has been done to comprehensively compare and evaluate these irrigation maps. This study uses censored data collected from the National Bureau of Statistics (NBS) of China to evaluate irrigated areas derived eight commonly used irrigation maps at county levels. The spatial distribution and the temporal variability these products are evaluated using more than 1651 country-level data record during the period of 2000 to 2020. Based on our analysis, we seek to provide insights into the reliability of using current available irrigation maps for large scale modeling analysis and future developments of the large-scale irrigated area mapping.

How to cite: Tian, X., Dong, J., Wei, L., Kang, X., Zhang, H., Sun, X., Li, S., Zhao, D., and Li, Y.: Evaluation of remotely sensed and reanalyzed irrigation maps over China, EGU General Assembly 2023, Vienna, Austria, 23–28 Apr 2023, EGU23-4208, https://doi.org/10.5194/egusphere-egu23-4208, 2023.

EGU23-4863 | ECS | Posters on site | HS6.7

The precision of satellite-based net irrigation quantification in the Indus and Ganges basins 

Søren Julsgaard Kragh, Rasmus Fensholt, Simon Stisen, and Julian Koch

Even though irrigation is the largest direct anthropogenic interference with the terrestrial water cycle, limited knowledge on the amount of water applied for irrigation exist. Quantification of irrigation via evapotranspiration (ET) or soil moisture residuals between remote sensing models and hydrological models, with the latter acting as baselines of natural conditions without the influence of irrigation, have successfully been applied in various regions. Here, we implement an novel ensemble methodology to estimate the precision of ET-based net irrigation quantification by combining different ET and precipitation products in the Indus and Ganges basins. A multi-model calibration of 15 models independently calibrated to simulate natural rainfed ET was conducted prior to the irrigation quantification. Based on the ensemble average, the 2003-2013 net irrigation amounts to 233.4 mm/year (74.4 km3/year) and 101.4 mm/year (66.7km3/year) in Indus and Ganges basin, respectively. Net irrigation in Indus basin is evenly split between dry and wet period, whereas 70% of net irrigation occurs during the dry period in Ganges basin. We found that although annual ET from remote sensing models varied by 91.5 mm/year, net irrigation precision was within 25.3 mm/season during the dry period, which emphasizes the robustness the applied multi-model calibration approach. Net irrigation variance was found to decrease as ET uncertainty decreased, which related to the climatic conditions, i.e. high uncertainty under arid conditions. A variance decomposition analysis showed that ET uncertainty accounted for 74% of the overall net irrigation variance and that the influence of precipitation uncertainty was seasonally dependent, i.e. with an increase during the monsoon season. The results underline the robustness of the framework to support large scale sustainable water resource management of irrigated land.

How to cite: Kragh, S. J., Fensholt, R., Stisen, S., and Koch, J.: The precision of satellite-based net irrigation quantification in the Indus and Ganges basins, EGU General Assembly 2023, Vienna, Austria, 23–28 Apr 2023, EGU23-4863, https://doi.org/10.5194/egusphere-egu23-4863, 2023.

EGU23-5692 | ECS | Orals | HS6.7

Assessment of water status in almond trees using optical indices at high and medium spatial resolution 

Elisabet Carpintero, David Moldero, Pablo Zarco-Tejada, and Victoria González-Dugo

The almond tree is one of Spain’s most widespread woody crops, with an annual growth rate of 4% of cultivated area. In recent years, management practices focused on the intensification of plantations to increase almond production have led to higher irrigation requirements in regions with recurrent water scarcity. In this context, an accurate assessment of canopy water stress is key to successfully apply deficit irrigation strategies. They are critical to optimize water resources without causing severe yield reductions. The usefulness of the Crop Water Stress Index (CWSI) for monitoring transpiration and water status in almond trees has been successfully demonstrated, which uses thermal information acquired remotely at very high spatial resolution to target individual tree crowns. However, canopy temperature in open vegetation orchards is currently limited to sensors installed in manned or unmanned aerial vehicles, which could significantly increase production costs in commercial fields.

This work aims to evaluate the ability of a set of optical indices applied to airborne hyperspectral imagery to assess the water status of an almond tree orchard located in Southern Spain during the 2018 campaign. The field was subjected to different deficit irrigation treatments: fully irrigated, moderately stressed and severely stressed. The analysis has been carried out at different spatial scales to explore the effects of pixel size in detecting water stress situations in an attempt to extrapolate the methodology to Sentinel-2 satellite imagery at medium resolution.

The indices were compared with stem water potential measurements collected in randomly selected trees within areas with deficit irrigation treatments. The results support the potential of the shortwave infrared-based indices, Normalized Difference Water Index (NDWI) and Moisture Stress Index (MSI) to monitor the water stress of this complex crop with open canopy structure when thermal data are not available at sufficient spatial resolution.

How to cite: Carpintero, E., Moldero, D., Zarco-Tejada, P., and González-Dugo, V.: Assessment of water status in almond trees using optical indices at high and medium spatial resolution, EGU General Assembly 2023, Vienna, Austria, 23–28 Apr 2023, EGU23-5692, https://doi.org/10.5194/egusphere-egu23-5692, 2023.

EGU23-6547 | Orals | HS6.7

Water Uptake Rates Estimation from Sentinel-1 C-band Synthetic Aperture Radar over Olive Orchards 

Marcel M. El Hajj, Kasper Johansen, Samir K. Almashharawi, and Matthew F. McCabe

Monitoring the water-uptake rate (WUR) in olive orchards is a key parameter for improving irrigation efficiency and represents an indicator of tree health and yield. Commercial olive orchards extend over large areas and therefore, the use of in-situ sensors to monitor tree WUR, such as the installation of sap flow meters, which are costly and time-consuming to install, are not feasible. The aim of this study is to investigate the potential of C-band Synthetic Aperture Radar (SAR) data acquired by Sentinel-1 with 6-days revisit time to estimate the WUR in very high-density olive orchards in the hot and arid desert climate of Saudi Arabia. A random forest regression (RFR) model was used to calibrate the SAR-derived metrics against WUR measurements recorded by sap flow meters in six plots in 2019, 2020, and 2021. Later, SAR-derived metrics and the coincident WUR measurements were used for RFR optimization and validation. A SAR-derived metric to predict the WUR in a plot at a given Sentinel-1 acquisition date was the difference between the SAR backscattering at that image date and the average SAR backscattering in the second-half of January, when WUR was negligible (around 0.1 L.h-1). The optimized RFR approach provided an accurate estimate of WUR (R2 = 0.86, RMSE = 0.13 [L.h-1]). The optimized RFR was used to operationally map the WUR at the plot level between 2019 and 2021 with a revisit time of 6 days. Results showed that the average WUR over the mapped area co-varied with the average daily air temperature (R2 = 0.82) and inversely co-varied with the average daily air humidity (R2 = 0.58), both recorded by a weather station installed at the study site. These observations support the operational mapping results as they are consistent with the principle of soil-plant-atmosphere interactions, where the WUR generally increases with air temperature and decreases with air humidity. Future work should focus on the assimilation of SAR-derived WUR into water-use models to evaluate the added value of SAR-derived WUR for water resource management in olive orchards.

How to cite: El Hajj, M. M., Johansen, K., Almashharawi, S. K., and McCabe, M. F.: Water Uptake Rates Estimation from Sentinel-1 C-band Synthetic Aperture Radar over Olive Orchards, EGU General Assembly 2023, Vienna, Austria, 23–28 Apr 2023, EGU23-6547, https://doi.org/10.5194/egusphere-egu23-6547, 2023.

EGU23-6776 | ECS | Posters on site | HS6.7

Integration of Sentinel-2 Imagery with the AquaCrop-OSPy Model for Simulating Agricultural Crop Requirements and Growth in Desert Farming Systems: A Saudi Arabian Case Study 

Ahmed S. Almalki, Oliver Miguel López Valencia, Kasper Johansen, Marcel M. El Hajj, and Matthew F. McCabe

Integrating remote sensing technology into crop growth models is a viable approach for water resources management and agricultural sustainability assurance since it allows crop water requirements and yield within agricultural fields to be estimated. Saudi Arabia has severely limited renewable water resources and non-renewable groundwater reserves that are rapidly depleting. Unlike rain-fed agriculture, the majority of agricultural water demand in Saudi Arabia is pumped from deep aquifers (up to 1000 m) to irrigate center pivots. This situation entails continuous monitoring of agricultural water use to enhance agricultural water productivity (i.e., producing more crops per drop) and preserve the equilibrium among the water, food, and energy sectors. The main purpose of this study is to calibrate the AquaCrop-OSPy model (an open-source Python implementation of the FAO crop-water productivity model, known as AquaCrop) using field data and Sentinel-2 (S2) images for operational mapping of crop yield, water demand, and water productivity. Another objective is to spatiotemporally estimate the energy requirements and associated CO2 emissions related to groundwater pumping for irrigation. The study area is located in the north of Saudi Arabia. It is a commercial farm with an area of 30,000 hectares comprising more than 200 agricultural fields with center-pivot irrigation systems. The crops cultivated on the farm are wheat and tomato. Field data were collected over three consecutive growing seasons (2019-2020, 2020-2021, and 2021-2022) and include information on wells, pumps, irrigation technique, field management practices, soil parameters, crop parameters, daily meteorological data, actual crop yield, and water use. The AquaCrop-OSPy model was first calibrated and validated using the collected field data as well as S2 images over the three seasons. Subsequently, the fractional vegetation cover (FVC) derived from S2 images was assimilated into the AquaCrop-OSPy model by direct insertion in place of AquaCrop-OSPy's simulated canopy cover (CC). Later, the energy requirements and CO2 emissions associated with irrigation groundwater pumping were estimated using crop water demand information calculated with the calibrated AquaCrop-OSPy model along with pumps and wells data. Coupling the S2-derived FVC and the AquaCrop-OSPy model improved AquaCrop-OSPy predictions of crop water demand, yield, and water productivity as S2 images provide spatialized FVC information every 6-days. This integration further permitted a robust quantification of the energy requirements and CO2 emissions associated with groundwater pumping for irrigation. These results, when applied to larger scales and multiple crops, can help develop a comprehensive understanding of the water-energy-agriculture nexus and indicate potential improvements in AquaCrop-OSPy estimates that could be achieved once remote sensing data are integrated.


How to cite: Almalki, A. S., López Valencia, O. M., Johansen, K., El Hajj, M. M., and McCabe, M. F.: Integration of Sentinel-2 Imagery with the AquaCrop-OSPy Model for Simulating Agricultural Crop Requirements and Growth in Desert Farming Systems: A Saudi Arabian Case Study, EGU General Assembly 2023, Vienna, Austria, 23–28 Apr 2023, EGU23-6776, https://doi.org/10.5194/egusphere-egu23-6776, 2023.

EGU23-6912 | ECS | Orals | HS6.7

Irrigation management with a time-continuous two-source modelling of tree crops calibrated with satellite LST data 

Nicola Paciolla, Chiara Corbari, and Marco Mancini

Agriculture will progressively require more and more attention as changing climatic conditions and reduced water availability threaten food security worldwide. The optimization of the agricultural production is obtained with constant monitoring of the plant health (in terms of e.g., soil moisture, leaf temperature or evapotranspiration), which can be challenging if crop fields are too extensive.

Thermal observations from remote sensing are extensively used in agricultural monitoring to power (mostly-residual) energy balance model that provide evapotranspiration estimates. Two main issues hinder the quality of the results from these models: (a) sub-pixel heterogeneity, in particular related to mixed crops (e.g. row and tree crops), which can be captured only partially by the available LST information and (b) temporal frequency of the information, which for most freely-available products is usually at odds with spatial resolution (e.g., 1 km data from MODIS is available daily, whereas 90 m data from Landsat only once every 7-8 days). Furthermore, tree crops draw water from deep layers of soil, further disconnecting the satellite information from the biophysical processes involved in plant growth.

In this work, the use of a continuous, two-source, double-soil-layer coupled energy-water balance model is displayed as a solution of these issues. The link between the two balances allows to compute surface temperature internally, meaning that satellite LST observations are used, only when available, for the calibration process. Furthermore, the use of a double source in the energy exchanges allows to properly address the intra-pixel heterogeneity. Finally, the double soil layer allows to address the soil water and energy vertical gradient in complex systems, properly framing the surface observation from remote sensing within the overall environment.

Two pear tree fields in the Po Valley have been chosen as focus to study the effectiveness of this model, via a monitoring of the 2022 irrigation season, employing Sentinel 2 observations for the vegetation data and Landsat 8 LST for the calibration process. ET estimates are evaluated against flux tower observations. The increased accuracy of these estimates is key to enforce a more precise and effective irrigation and optimize the use of the water resource.

How to cite: Paciolla, N., Corbari, C., and Mancini, M.: Irrigation management with a time-continuous two-source modelling of tree crops calibrated with satellite LST data, EGU General Assembly 2023, Vienna, Austria, 23–28 Apr 2023, EGU23-6912, https://doi.org/10.5194/egusphere-egu23-6912, 2023.

EGU23-6916 | ECS | Posters on site | HS6.7

First regional-scale and high-resolution (1 and 6 km) irrigation water data sets obtained from satellite observations 

Jacopo Dari, Luca Brocca, Sara Modanesi, Christian Massari, Angelica Tarpanelli, Silvia Barbetta, Raphael Quast, Mariette Vreugdenhil, Vahid Freeman, Anaïs Barella-Ortiz, Pere Quintana-Seguí, David Bretreger, Alessia Flammini, and Espen Volden

Irrigation is widely recognized as the human activity that alters the natural circulation of water on the Earth’s surface the most. It greatly contributes to making the canonical conceptualization of the hydrological cycle incomplete. Nevertheless, irrigation dynamics are still generally unmonitored worldwide, but satellite capabilities have recently proved their suitability for such a purpose.

In this contribution, the first regional-scale and high-resolution data sets of irrigation water use retrieved from satellite data are presented. The products, obtained through the SM-based (Soil-Moisture-based) inversion approach, are an outcome of the Irrigation+ project (https://esairrigationplus.org/) funded by the European Space Agency (ESA). The data have been produced over the Ebro basin (Spain), the Po valley (Italy), and the Murray-Darling basin (Australia) and they are available at: https://zenodo.org/record/7341284#.Y7WHsHbMKUm. The irrigation estimates referring to the Spanish and the Italian pilot areas rely on Sentinel-1 soil moisture obtained through the RT1 (first-order Radiative Transfer) model and are characterized by a spatial resolution of 1 km. A 6 km spatial sampling has been adopted for the Murray-Darling basin; in this case, irrigation water amounts have been retrieved from CYGNSS (CYclone Global Navigation Satellite System) soil moisture. The data sets referring to the European sites cover a time span ranging from January 2016 to July 2020, while irrigation amounts over the Murray-Darling basin are available for the period April 2017 – July 2020. The reliability of the retrieved irrigation estimates has been assessed through comparison against benchmark amounts. Satisfactory performances have been found over the Ebro and the Murray-Darling basins. More in detail, a median value of RMSE, Pearson correlation, r, and BIAS equal to 12.4 mm/14-day, 0.66, and -4.62 mm/14-day, respectively, is found across pilot districts located within the Ebro basin. The analogous results obtained over the Murray-Darling basin are equal to10.54 mm/month, 0.77, and -3.07 mm/month. The evaluation over the Po valley is affected by the limited availability of in-situ reference data for irrigation. This study sheds light on the perspective of building operational systems aimed at monitoring agricultural water use relying on satellite data.

How to cite: Dari, J., Brocca, L., Modanesi, S., Massari, C., Tarpanelli, A., Barbetta, S., Quast, R., Vreugdenhil, M., Freeman, V., Barella-Ortiz, A., Quintana-Seguí, P., Bretreger, D., Flammini, A., and Volden, E.: First regional-scale and high-resolution (1 and 6 km) irrigation water data sets obtained from satellite observations, EGU General Assembly 2023, Vienna, Austria, 23–28 Apr 2023, EGU23-6916, https://doi.org/10.5194/egusphere-egu23-6916, 2023.

Global changes are impacting water availability, which touch a wide range of human activities, especially agriculture. For this reason, hydrological models have been developed in recent years, which are an important support in the management of water resources.

The aim of this study is to setup and calibrate a hydrological model using remote sensing-based evapotranspiration (ET) data, in an area free of natural streams where irrigation channels are the only watercourses, expect for Ticino River. From a hydrological point of view, the study area is quite complex. Rainwater infiltrates into the permeable soils characterizing the area, while the rest of the precipitation leave the soil system through evapotranspiration. In fact, we noticed after periods of rain or irrigation a variation of the discharges of local springs located at the base of the fluvial terrace escarpments of the Ticino River. Moreover, being in a flat area the surface runoff component is almost nil, except for ponding that occur after precipitation or during the period in which the rice fields are flooded. During the spring-summer period, actually, large quantities of water are distributed through a complex network of channels to irrigate the rice and maize fields. So, water distributed for irrigation use is not only important for the agriculture, but also contributes to the recharge of the water table, which then feeds springs, forming a unique cascade system of water reuse that was already created in the15th century. However, calibrating a spatially distributed hydrological model of an intensively irrigated and flat agricultural area is a difficult challenge. In this study the Soil Water Assessment Tool (SWAT) was applied, a physically based model used worldwide for soil and water management studies. The SUFI-2 program for model calibration and uncertainty analysis was utilized and Kling-Gupta Efficiency (KGE) was applied as objective function. In the calibration process we used ET data derived from MODIS sensor with a spatial resolution of 1 km².

The results show that despite the complexity of the area a calibration of the model with ET’s MODIS data yield a KGE of 0.59. The results indeed highlight that the model simulates well the hydrological dynamics of the area. Although there are some differences between observed and simulated data, due to a strong control of the hydrological dynamics by human activities, as well as the difference in model input data and satellite data used for calibration. Model validation through on-site measured soil water content, with 12 TEROS sensors installed on three different land uses, confirm the feasibility of using satellite data for SWAT model calibration in a complex area. Moreover, with these sensors we assessed the differences between the different crops and get information about the irrigation activities that modify the hydrological cycle of the area.

Finally, the calibrated and validated SWAT model allows for a further hydrological analysis of a system altered by human activities in terms of future scenarios. Particularly, we evaluate vertical soil water dynamics and assess the impact of land use change and land management (e.g., irrigation).

How to cite: Bernini, A., Becker, R., and Maerker, M.: Calibration of the SWAT model using remote sensing based ET data of an intensively used and irrigated agricultural lowland area of Lombardy, Italy, EGU General Assembly 2023, Vienna, Austria, 23–28 Apr 2023, EGU23-8202, https://doi.org/10.5194/egusphere-egu23-8202, 2023.

EGU23-10988 | ECS | Posters on site | HS6.7

Spatial Variability of Leaf Area Index from Drone Imaging of Two Irrigated Wheat Fields 

Austin Hopkins, Neil Hansen, Ryan Jensen, and Elisa Flint

Leaf Area Index (LAI) is an indicator of crop and plant growth in agricultural and ecological research. LAI can be used to monitor nitrogen status or estimate crop yield and evapotranspiration (ET). The aim of this study was to evaluate use of a remotely sensed visible vegetation index to characterize the spatial variability of LAI within irrigated wheat fields. Variation of LAI was measured with a ceptometer on random nested grids at two sites with pre-determined management zones in 2019 and 2020. Coincident digital imagery was collected using a consumer-grade unmanned aerial vehicle (UAV). A visible atmospherically resistant index (VARI) LAI estimation model was applied to red, green, blue (RGB) UAV imagery using a ladder resampling approach from 0.06 m to 3 m spatial resolution. There was significant within-field spatial and temporal variation of mean LAI. For example, in May at one of the sites, measured LAI ranged from 0.21 to 2.58 and in June from 1.68 to 4.15. The relationship of measured and estimated LAI among management zones was strong (R2=0.84), validating the remote sensing approach to characterize LAI differences among management zones. There were statistically significant differences in estimated LAI among zones for all sampling dates (P=0.05).  We assumed a minimum difference of 15% between zone LAI and the field mean for justifying variable rate irrigation among zones, a threshold that corresponds with approximately a 10% difference in evapotranspiration rate. Three of the five sampling dates had LAI differences that exceeded the threshold for at least one zone, with all three having mean LAI of less than 2.5. The VARI model for estimating LAI remotely is more effective at identifying LAI differences among management zones at lower LAI.

How to cite: Hopkins, A., Hansen, N., Jensen, R., and Flint, E.: Spatial Variability of Leaf Area Index from Drone Imaging of Two Irrigated Wheat Fields, EGU General Assembly 2023, Vienna, Austria, 23–28 Apr 2023, EGU23-10988, https://doi.org/10.5194/egusphere-egu23-10988, 2023.

EGU23-12292 | Orals | HS6.7

Inversion of irrigation from satellite soil moisture data with a model based on PrISM (Precipitation Inferred from Soil Moisture) 

Giovanni Paolini, Thierry Pellarin, Maria jose Escorihuela, Olivier Merlin, Joaquim Bellvert, Victor Altes, Josep Maria Villar, and Xavier Petit

Accurate irrigation water management is crucial for maximizing crop yield and minimizing water waste. Remote sensing technology offers a promising solution for efficiently estimating irrigation water use at the field scale.

In this study, we adapted the PrISM (Precipitation inferred from Soil Moisture) methodology to detect and estimate irrigation events from soil moisture remotely sensed data. PrISM is a well-known approach to correct precipitation estimates using soil moisture data. Its main application is to provide a near real-time corrected precipitation product. PrISM employs an antecedent precipitation index (API) formula coupled with a particle filter assimilation scheme for soil moisture.

In this study, we adapted the PrISM methodology to estimate irrigation amounts from soil moisture. The methodology uses initial precipitation estimates and soil moisture profile to detect whenever water excess is present in the soil (not caused by precipitation) and estimates its amount, together with its uncertainty. The methodology does not need extensive calibration and it is adaptable to different spatial and temporal scales. A synthetic study was performed to investigate the effect of a degraded soil moisture signal in terms of temporal resolution (lowering the temporal sampling of the soil moisture time-series), spatial resolution (lowering the percentage of irrigated area in a pixel), and random noise (increasing RMSE values). Results from this study suggested that high spatial resolution is critical in order to avoid underestimation of irrigation amounts. Ideally, a field-level soil moisture (with more than 75% of the pixel irrigated) and a product with low RMSE (0.02 m3/m3) is required for precise estimations (in order to keep the error of annual cumulative irrigation below 20%). Temporal resolution has a lower impact, especially when an assumption on the frequency of irrigation events (deduced from the system of irrigation used at the field-level) is included in the algorithm.

Consequently, the developed algorithm was applied to actual satellite soil moisture products at different spatial scales over the same area. Validation was performed using in situ data at the district level of Algerri-Balaguer from the study area in Catalunya, Spain, where ground-based irrigation amounts were available for various years. Additional validation was performed at the field-level at the Segarra-Garrigues irrigation district using in-situ data from a few fields where soil moisture profiles and irrigation amounts were continuously monitored. Our results suggest that PrISM can be used effectively to estimate irrigation from soil moisture remote sensing data and that this methodology could be potentially applied on a large scale, with the only limitation being the quality and spatial resolution of the satellite soil moisture product.

How to cite: Paolini, G., Pellarin, T., Escorihuela, M. J., Merlin, O., Bellvert, J., Altes, V., Villar, J. M., and Petit, X.: Inversion of irrigation from satellite soil moisture data with a model based on PrISM (Precipitation Inferred from Soil Moisture), EGU General Assembly 2023, Vienna, Austria, 23–28 Apr 2023, EGU23-12292, https://doi.org/10.5194/egusphere-egu23-12292, 2023.

EGU23-13621 | Posters on site | HS6.7

Use of the Photochemical Reflectance Index to determine water stress in semi-arid climate conditions 

Iuliia Danylenko, Valérie Le Dantec, Pascal Fanise, Dalenda Boujnah, Hechmi Cheheb, Simon Gascoin, and Gilles Boulet

Water shortage is one of the issues people are facing globally nowadays especially in arid and semi-arid regions. In these regions the increase in air temperature with slightly changing rates of precipitation cause frequent droughts. This determines the necessity for the usage of irrigation in agriculture that, in turn, makes it the most water consuming sector of economy.

The detection of water stress using different approaches is crucial for irrigation scheduling and precise calculation of the volume of water that covers the gap needed for plants’ normal development.

It is known that the Photochemical Reflectance Index (PRI) is highly sensitive to the photosynthetic activity of plants. Especially that can be observed for forests and orchards due to the high heterogeneity of canopy structure. In previous studies it was found that PRI can be used as an indicator for monitoring water stress in plants. However, at present, no full answer is given about the limitations of PRI usability and no clear algorithm is formulated for its use in order to detect water stress of plants.

In this regard, we concentrate on studying the response of PRI to the water stress of olive trees rain-fed conditions for the case of semi-arid climate (Tunisia). We performed the analysis of data sets for 2021 and 2022, which are, respectively, a dry year and a year of normal water availability. The data sets included meteorological data, PRI measurements made every five minutes, sap flow measurements, soil moisture content values, and dendrometer measurements.

On the first stage of our study we processed PRI data sets in order to find an analytic function that best describes daily dynamics of the index. As the result, a new modeling function is constructed to describe an increase in PRI in the middle of the day when minimal PRI values are reached several hours after sunrise and before sunset. Such PRI behavior was mainly observed in sunny days of the dry year.

Further, we looked for the correlations of the characteristics of PRI daily dynamics, particularly minimal of PRI, with the values of sap flow that is a main measurable indicator in the class of transpiration and water stress models (see, e.g., https://doi.org/10.1016/j.agwat.2020.106343 ). In this context, the behavior of PRI was different for 2021 and 2022, which, in our opinion, related with weather conditions. For the dry year of 2021 we found a strong correlation between the minimum of PRI and sap flow in morning hours (R2= 0,68) during the summer season. For the normal year 2022 the same results are not obvious.

In the perspective of our study it is planned to compare the results for the rain-fed site with the measurements obtained under irrigated conditions. The final goal of the research we want to achieve is to propose a reliable approach for separation of physically meaningful part of PRI signal from the noises created by the canopy structure. This will lead us to the reliable algorithm of PRI usage for the detection of plants’ water stress condition.

How to cite: Danylenko, I., Le Dantec, V., Fanise, P., Boujnah, D., Cheheb, H., Gascoin, S., and Boulet, G.: Use of the Photochemical Reflectance Index to determine water stress in semi-arid climate conditions, EGU General Assembly 2023, Vienna, Austria, 23–28 Apr 2023, EGU23-13621, https://doi.org/10.5194/egusphere-egu23-13621, 2023.

EGU23-14091 | Posters on site | HS6.7

Analysis of the impact of different irrigation scenarios on the water balance of the Ebro River Basin by means of a LSM and remote sensing irrigation estimations 

Anaïs Barella-Ortiz, Pere Quintana-Seguí, Roger Clavera-Gispert, Simon Munier, Olivier Merlin, Luis-Enrique Olivera-Guerra, Víctor Altés, Josep-Maria Villar, Luca Brocca, Jacopo Dari, Sara Modanesi, Luca Zapa, and Joost Brombacher

Irrigation consumes around 70% of the world’s freshwater and has a significant impact on the continental water and energy cycles of the basins where it is present. Despite the clear benefits of irrigation, it has a strong impact on the continental water cycle, which must be evaluated to improve water resources management. Land-Surface Models (LSM) and remote sensing data can be used to analyse and quantify how irrigation affects the continental water cycle.

The Ebro basin is located in the Iberian Peninsula and is a representative Mediterranean basin. It is therefore characterised by a variety of different landscapes, as well as an uneven distribution of precipitation. This leads to the construction of a large network of dams and canals to supply water to agricultural irrigated districts. In fact, irrigated agriculture and farming represent 92% of the basin's total water consumption, according to the Ebro Hydrographic Confederation.

This work presents studies using datasets developed at the Ebro Observatory to simulate irrigation related processes over the Ebro basin with a LSM. It is provided at 1 km spatial resolution and contains meteorological and physiographical data, namely vegetation classes, actual irrigated areas, irrigation methods per area, and a new version of the SAFRAN meteorological forcing. All of the simulations used in the work presented here are carried out using the SURFEX LSM v9 version, which has an irrigation scheme implemented.

In the first place, we evaluate how the new physiographic datasets impact irrigation simulation in the area. Then, the datasets are used to perform simulations to analyse the impact of different irrigation scenarios (defined by different model parameters) on irrigation, evaporation, streamflow, and drainage. The scenarios defined are the default configuration of SURFEX’s irrigation scheme, a realistic simulation based on a survey to farmers from several irrigation districts from the Ebro basin, and further scenarios modifying the irrigation event’s frequency and amount of water. For this analysis, the simulations are carried out from 2008 to 2019. 

In the second place, a comparison of our simulation results to remote sensing irrigation estimations from the ESA funded IRRIGATION+ project is performed. For this, the irrigation estimation is added to the precipitation of the SAFRAN forcing, which is then used to force SURFEX simulations. The irrigation products span different periods ranging from 2015 to 2021 and are based on different techniques: data assimilation (Sentinel-1), SM-based DELTA algorithm (Sentinel-1), SM-based inversion algorithm (Sentinel-1, ERA5-Land, GLEAM product), and the Hydrological Similar Pixels (HSP) algorithm.

This work is a contribution to the LIAISE campaign, through the IDEWA project (PCI2020-112043), as well as to the IRRIGATION+ (4000129870/20/I-NB) project.

How to cite: Barella-Ortiz, A., Quintana-Seguí, P., Clavera-Gispert, R., Munier, S., Merlin, O., Olivera-Guerra, L.-E., Altés, V., Villar, J.-M., Brocca, L., Dari, J., Modanesi, S., Zapa, L., and Brombacher, J.: Analysis of the impact of different irrigation scenarios on the water balance of the Ebro River Basin by means of a LSM and remote sensing irrigation estimations, EGU General Assembly 2023, Vienna, Austria, 23–28 Apr 2023, EGU23-14091, https://doi.org/10.5194/egusphere-egu23-14091, 2023.

EGU23-14257 | Posters virtual | HS6.7

Assessment of remote sensing-based soil water balance and FAO56 dual crop coefficient approach on almond orchards 

Juan Manuel Sánchez, Jaime Campoy, Francisco Montoya, Ramón López-Urrea, Yeray Pérez, José González-Piqueras, Vanesa Jiménez, Antonio Rodríguez, Joan Miquel Galve, and Alfonso Calera

The irrigated area cultivated with almond trees (Prunus dulcis) has significantly increased in recent years worldwide. In Spain, the extension covered  by irrigated almond orchards has doubled in the past 5 years, currently accounting for about 14% of the harvested almond area. The high water productivity of this crop jointly with the good market perspectives for the almonds have boosted this expansion in many areas, providing a viable alternative to traditional crops, such as cereals and other woody crops. However, the expansion of irrigated almond orchards in water-scarce areas could compromise the water resources and sustainability of agriculture. In this way, precise irrigation management tools are required to adjust the water supply to the actual crop requirements with suitable temporal and spatial resolutions. Accurate estimates of the net irrigation water requirements allow to improve the water use efficiency and therefore, achieve a more profitable and sustainable management. The soil water balance model (SWB) based on the FAO-56 dual crop coefficient approach (Allen et al., 1998) is a well-recognized procedure for the estimation of daily crop water requirements. This approach considers a single-layer soil water balance estimated at the root zone, jointly with soil evaporation in the surface layer.

This work introduces a Remote Sensing (RS) assisted approach to monitor the soil water balance in almond trees. Our experiment aims at comparing this RS-based technique to the traditional FAO-56 methodology. This RS-based approach integrates a basal crop coefficient (Kcb) derived from time series of satellite images into the daily soil water balance. Although well-documented in the literature for other crops, limited information is available for the application of this RS-based methodology to almond orchards.

This study was carried out in two drip irrigated almond commercial fields, located in the semi-arid province of Albacete (Southeastern Spain). Measurements of soil water content, and stem water potential, were available during the campaigns 2020-2022 in the analyzed fields. A continuous sampling of the canopy structure was registered. Thermal infrared radiometers were deployed to model the surface energy balance, and an eddy-covariance tower was placed to monitor the actual evapotranspiration. This instrumentation provides a unique opportunity to assess the performance of the SWB models. The results show an overall similar performance for both approaches in reproducing the temporal evolution of Kcb during the campaigns analyzed. The assessment of the results indicates the potential of both approaches to accurately estimate the temporal evolution of soil water content in irrigated almond fields under different water management, either comfort or water stress.

The operational application derived from the present study will provide the farmer with accurate information on the actual crop water demand and adjust and distribute water supply to the crop’s spatially and temporally varying water requirements. The information obtained is useful for making management decisions aimed at improving irrigation scheduling, developing controlled deficit irrigation (CDI) strategies, and promoting the optimization of water resources and the development of sustainable agriculture.

How to cite: Sánchez, J. M., Campoy, J., Montoya, F., López-Urrea, R., Pérez, Y., González-Piqueras, J., Jiménez, V., Rodríguez, A., Galve, J. M., and Calera, A.: Assessment of remote sensing-based soil water balance and FAO56 dual crop coefficient approach on almond orchards, EGU General Assembly 2023, Vienna, Austria, 23–28 Apr 2023, EGU23-14257, https://doi.org/10.5194/egusphere-egu23-14257, 2023.

EGU23-14518 | ECS | Posters on site | HS6.7

Modelling current and future water resources availability of the river Rhine 

Devi Purnamasari, Judith ter Maat, Adriaan J. Teuling, and Albrecht Weerts

The Rhine catchment's water resources are likely to continue to experience considerable pressure from growing irrigated land. Concerns regarding the current and future status of water availability to balance conflicting water allocations for maintaining ecosystem services, shipping, and biodiversity are highlighted as freshwater resources become more limited. Contrary to other sectors, agricultural water consumption primarily consists of actual evapotranspiration, resulting in only a small amount of flow returning to receiving water bodies. As a feasible alternative, actual evapotranspiration is therefore increasingly used to quantify agricultural water use.  In hydrological models, agricultural water demand is typically assessed by the volume of water required to fully restore soil moisture to predefined thresholds for sustaining optimal crop growth, under the assumption that there will be enough water available during the growing season to fulfill the demand. However, the assumption of ideal crop growing circumstances (close to potential evapotranspiration) is not necessarily true in dry season, when limited water supply influences irrigation decision-making and will lead to inaccurate estimation of actual water use. This PhD research, as part of the HorizonEurope project Stars4Water, aims to produce historical spatiotemporal estimates of agricultural water use over the Rhine catchment by using satellite observations. To isolate the actual evapotranspiration due from irrigated land, the actual evapotranspiration from the hydrological model wflow_sbm without irrigation scheme will be compared against the actual evapotranspiration derived from satellite retrievals. Land surface temperature observations will be assimilated to constrain the actual evapotranspiration estimates to consider the relationship between the water and energy balance.

How to cite: Purnamasari, D., ter Maat, J., J. Teuling, A., and Weerts, A.: Modelling current and future water resources availability of the river Rhine, EGU General Assembly 2023, Vienna, Austria, 23–28 Apr 2023, EGU23-14518, https://doi.org/10.5194/egusphere-egu23-14518, 2023.

EGU23-15023 | Orals | HS6.7

Thermal infrared earth observation for operational irrigation management 

Florian Werner, Matteo Ziliani, and Albert Abello

Irrigation water use in agriculture is a major drain on the world’s freshwater reserves. Optimizing irrigation water use and accurately assessing crop responses to water stress in near-real-time is becoming increasingly important due to more extreme weather conditions and increasing water scarcity promoted by climate change. Canopy temperature measured by thermal infrared (TIR) is an excellent indicator of crop water stress due to its close relation to relative transpiration rate. Satellites equipped with TIR sensors can provide a cost-efficient global solution for irrigation management and crop water stress monitoring. However, current TIR satellite data products are only available at either high spatial or high temporal resolution, but not both. Hydrosat is launching a 16+ satellite constellation to provide high-resolution global TIR data products every day, multiple times per day. Hydrosat’s data will be a game changer in agricultural monitoring and management, enabling detailed and fully remote sub-field-level irrigation management everywhere in the world.

Assimilating daily crop water stress derived from TIR measurements into soil water balance models provides multiple unique advantages: 1)  Knowledge of the current crop stress increases the reliability of water balance calculations even if physical soil parameters are not known precisely; 2) actual applied water amounts can be estimated, alerting to issues arising from malfunction of irrigation equipment; and 3) crops can be safely maintained at reduced soil moisture, making full use of water reserves in the soil and controlling pathogens which thrive under moist conditions.

Field trials were carried out in Europe, United States, and South Africa, where different crops (including potatoes, tomatoes, maize, soybeans, and dry beans) were studied under various irrigation regimes. Daily thermal infrared data and soil water balance models were employed to estimate crop water stress and soil water content, which provided an optimized irrigation schedule based on the actual current water deficit.

Soil water balance calculations accurately reproduced the volumetric soil water content measured with soil probes, and on two occasions identified malfunctions in the irrigation systems. Beyond yield increases and cost reductions from reduced water consumption and pumping times, precision control of irrigation also has interesting applications in conditions where meticulous control of canopy moisture is required. Potatoes and tomatoes affected by late blight during field trials in South Africa were grown under standard irrigation and under Hydrosat’s optimized irrigation schedule targeting a low surface soil moisture. Blight infection under standard irrigation resulted in drastic yield losses, while optimized irrigation was able to maintain over 80% of the yield obtained in the previous year without blight infection. For tomatoes, which only showed very mild symptoms of blight, the optimized irrigation schedule still achieved a 40% yield increase compared to standard irrigation. In these examples, water balance modeling based on thermal infrared data can turn almost complete crop loss into a reasonable crop yield.

How to cite: Werner, F., Ziliani, M., and Abello, A.: Thermal infrared earth observation for operational irrigation management, EGU General Assembly 2023, Vienna, Austria, 23–28 Apr 2023, EGU23-15023, https://doi.org/10.5194/egusphere-egu23-15023, 2023.

EGU23-16090 | Orals | HS6.7

A remote sensing approach to estimating crop water needs in Mediterranean basins with data scarcity issues 

Esther Lopez-Perez, Adrià Rubio-Martin, Manuel Pulido-Velazquez, Carles Sanchis-Ibor, Alberto Garcia-Prats, Juan Manzano-Juarez, Miguel Ángel Jimenez-Bello, and Marta Garcia-Molla

Irrigated agriculture is a major contributor to global groundwater use, and can sometimes lead to the overexploitation of aquifers. The Requena-Utiel, Campina de Faro and Ain Timguenay aquifers in Spain, Portugal and Morocco, respectively, are facing such a situation, with excessive pumping raising concerns about the aquifer's water levels and the long-term health of the groundwater body. Accurate estimation and remote monitoring of crop water needs are crucial for effectively managing the limited water resources in the region by providing farmers with accurate recommendations on water use.

The eGROUNDWATER project aims to address this issue by applying a water balance method based on Vegetation Index data of croplands. The method uses the Fractional Vegetation Cover (FVC) to estimate bare soil evaporation and vegetation transpiration, agro-climatic data and optical data (CopernicusESA/EROS-USGS). Potential evapotranspiration was calculated using the FAO method. The result of this process was a model for determining the irrigation water needs of crops within the region that allows researchers to differentiate stressed and over-irrigated areas with a high degree of precision.

The model was developed for the Spanish case study and was successfully applied to the Moroccan and Portuguese cases, where data scarcity at the local scale is also an issue. Remote sensing allows for more accurate detection of crop water needs, enabling the alignment of water requirements and agricultural demands. Although evapotranspiration estimates based on remote sensing may be subject to bias, these biases can be identified and corrected using reliable ground data. If daily images are not available, it is possible to upscale daily evapotranspiration estimates to seasonal or annual estimates. At the end, annual crop water needs can be modeled using a yearly map of irrigated areas, which is helpful for planning and managing water resources at the plot scale.

In conclusion, this research has shown that remote sensing can be a valuable tool for accurately estimating and monitoring crop water needs and for improving water resource management in three Mediterranean regions. By using the described methods, it is possible to align water use with agricultural demands more effectively and to ensure sustainable use of the aquifer's limited resources.

Acknowledgements:

This study has received funding from the eGROUNDWATER project (GA n. 1921) a project from the PRIMA programme, supported by Horizon 2020, the European Union's Framework Programme for Research and Innovation.

How to cite: Lopez-Perez, E., Rubio-Martin, A., Pulido-Velazquez, M., Sanchis-Ibor, C., Garcia-Prats, A., Manzano-Juarez, J., Jimenez-Bello, M. Á., and Garcia-Molla, M.: A remote sensing approach to estimating crop water needs in Mediterranean basins with data scarcity issues, EGU General Assembly 2023, Vienna, Austria, 23–28 Apr 2023, EGU23-16090, https://doi.org/10.5194/egusphere-egu23-16090, 2023.

EGU23-16403 | ECS | Posters on site | HS6.7

Toward high resolution and daily thermal infrared measurements for agricultural water management 

Matteo G. Ziliani, Florian Werner, and Albert Abelló

Sustainable water use in agriculture, while ensuring high yield returns, is key to tackling challenges imposed by climate change and population growth. Knowing the crop water status within the field allows for optimized water consumption by matching management practices to the actual crop water demand. Science and applications communities have made clear the needs and requirements for daily, field-scale (< 100 m) evapotranspiration (ET) data for agricultural applications. Current and planned space missions with thermal infrared (TIR) measurements either have high-spatial or high- temporal resolution, but not both, making it hard to capture the field-scale variability required for irrigation and crop growth modeling.

Hydrosat has innovated through the technical barriers to achieving field-scale, global TIR and VNIR measurements for ET every day, multiple times per day. With an upcoming launch en route to a 16+ smallsat constellation, Hydrosat data will be a game-changer and will significantly advance our ability to monitor and manage agricultural systems. An Early Adopter daily 20-m surface temperature product is already available now and can be used to accurately track crop water supply and demand within a specific field.

Here we show the potential of a new method that combines the spatio-temporal advantage of Hydrosat Early Adopter (along with freely available satellite data) with the predictive ability of crop model simulations to overcome the limitations of existing methods of irrigation management at the field and sub-field levels. The method was validated over multiple corn fields in the US Corn Belt, exploring a wide range of environmental conditions and management practices and across multiple growing seasons (2019-2021). ET, soil moisture, and yield data collected during the season were used for validation.

First, high spatio-temporal resolution thermal and multispectral satellite data were used to derive ET and leaf area index (LAI) during the crop growing season. Using these products, phenological development and soil-water components of the APSIM crop model were calibrated to accurately determine (and improve upon) farm-level predictions, both in terms of soil moisture content and end-of-season yield. Our method successfully estimated soil moisture with high accuracy (RMSE of 1.43 mm/mm and rRMSE of 7.47 %) and predicted yield reliably up to 14 weeks before harvest, with a strong correlation to independently collected measurements (RMSE of 1162 kg/ha and rRMSE of 7 %). The proposed approach has the potential for driving irrigation management decisions while quantifying end-of-season yield without the need for in situ data.

How to cite: Ziliani, M. G., Werner, F., and Abelló, A.: Toward high resolution and daily thermal infrared measurements for agricultural water management, EGU General Assembly 2023, Vienna, Austria, 23–28 Apr 2023, EGU23-16403, https://doi.org/10.5194/egusphere-egu23-16403, 2023.

EGU23-5527 | PICO | HS6.9

Assessing lake and reservoir storage change from remote sensing data at a global scale 

Christophe Fatras, Alice Andral, and Jérémy Augot

Lakes and reservoirs monitoring is of sheer interest, as in-situ gauging station coverage is dwindling at a global scale. Water storage change show the impact of not only domestic consumption, low water maintenance in rivers or crop irrigation, but also the impact of climate change. In this frame, different approaches are explored in this study to be able to follow from space remote sensing data the lake storage change, either from water height or surface.

For the ESA CCI Lake Storage Change option, we focus on a few lakes distributed around the world to establish a methodology suitable at a global scale to different lake behaviors. In particular for highly varying water bodies, the automatic production and use of hypsometric curve is investigated This approach is yet suitable for volume variations only.

Complementary to this first approach, an image inpainting algorithm applied to digital elevation models around water bodies is developped to assess their total bathymetry (either for lake or reservoir) where the pixels to be reconstructed are the ones underneath the lake surface. The first results show encouraging estimations that may lead in the near future to the assessment of total water volume of lake and reservoir at a global scale. With the recent launch of SWOT that will provide an unprecedented coverage worldwide, the estimation of global water storage change has a bright future.

How to cite: Fatras, C., Andral, A., and Augot, J.: Assessing lake and reservoir storage change from remote sensing data at a global scale, EGU General Assembly 2023, Vienna, Austria, 23–28 Apr 2023, EGU23-5527, https://doi.org/10.5194/egusphere-egu23-5527, 2023.

EGU23-7453 | ECS | PICO | HS6.9

Extract an accurate river network 

Qiuyang Chen, Simon Mudd, Mikael Attal, and Steven Hancock

Due to the limited resolution of freely available digital elevation models (DEM), DEM-derived river products cannot provide accurate flow lines in inland and lowland areas. Stream burning is used to improve the accuracy of extracted flowlines in addition to other flow routing algorithms (from LSDTopotools). Using the latest DEM products (Copernicus 30m DEM and FAB 30m DEM) and other remote sensing data (Sentinel-1, Sentinel-2), the framework is tested on different geomorphological features (meanders, branches) and weather conditions (with and without clouds). The results show a significant improvement in the accuracy of the flow lines compared with existing global hydrography products.

How to cite: Chen, Q., Mudd, S., Attal, M., and Hancock, S.: Extract an accurate river network, EGU General Assembly 2023, Vienna, Austria, 23–28 Apr 2023, EGU23-7453, https://doi.org/10.5194/egusphere-egu23-7453, 2023.

EGU23-7793 | ECS | PICO | HS6.9

hydroweb.next, an open-data WebGIS platform to bring state-of-the-art products derived from satellite remote sensing to hydrology users 

Nicolas Gasnier, Lionel Zawadzki, Flavien Gouillon, Bernard Specht, Pascal Cauquil, Santiago Pena Luque, Aurore Dupuis, Vincent Martin, Aurélie Sand, Thérese Barroso, Nicolas Picot, Aurélie Strzepek, and Philippe Maisongrande

The hydroweb.next platform is an open-data thematic hub for hydrology. It aims to foster new uses of remote sensing data for water applications by removing the main barriers: data formatting issues, dispersal of access points, and data processing costs,…


Hydroweb.next has been funded by the French government in the frame of Theia (Data and Services center for continental surfaces) and SWOT downstream (Surface Water and Ocean Topography satellite) programs. The hub brings together products from various providers such as Copernicus Land Services along with products from its own production centers. The production centers operate state-of-the-art algorithms that have been developed with scientists from Theia’s Scientific Expertise Centers: SurfWater for Surface Water Extent (SWE) from Sentinel-1 and Sentinel-2 images, Let It Snow for fractional snow cover and OBS2CO for water quality from Sentinel-2 images. As of June 2023, these 3 products will be made available with a 5 million square kilometer coverage. Products from SWOT and Trishna missions will also be distributed by hydroweb.next as they become available. 
In late 2023, SWOT data will include high-level user-oriented products such as river discharges and lake storage changes with global coverage. In 2025, Trishna products will include water quality, water skin temperature, and evapotranspiration. In situ data are also available to allow comparison with satellite data.

The products are distributed using STAC (Spatio-Temporal Asset Catalog) and WMS/WMTS (Web Mapping Services) protocols that follow the FAIR principles. This enables the direct reuse of the data by other services (e.g. UNESCO’s water quality portals).

The WebGIS interface is designed following a User-Centered Development approach. By involving users from various backgrounds such as Water Agencies, NGOs, industry, or academic research in stages of the project: surveys of user needs during interviews, features design involving users, ergonomics improvement through alpha testing, and quick consideration of user feedbacks through continuous integration and deployment. The interface allows searching relevant data using keywords, geophysical variables, and space-time restrictions. It also allows visualizing the products, their temporal evolution, and multitemporal synthesis. Finally, it allows downloading, harvesting, or streaming data, either through the interface or python APIs.

How to cite: Gasnier, N., Zawadzki, L., Gouillon, F., Specht, B., Cauquil, P., Pena Luque, S., Dupuis, A., Martin, V., Sand, A., Barroso, T., Picot, N., Strzepek, A., and Maisongrande, P.: hydroweb.next, an open-data WebGIS platform to bring state-of-the-art products derived from satellite remote sensing to hydrology users, EGU General Assembly 2023, Vienna, Austria, 23–28 Apr 2023, EGU23-7793, https://doi.org/10.5194/egusphere-egu23-7793, 2023.

EGU23-8586 | PICO | HS6.9

Characterization of Copernicus EO products for water modelling 

Ester Prat, Lluís Pesquer, Amanda Batlle, Evangelos Spyrakos, and Silvy Thant

This work presents the characterization and performance evaluation of the existing Copernicus EO products for the monitoring and modelling of water bodies dynamics purposes. This study is carried on the Water-ForCE project (https://waterforce.eu/). Water-ForCE (“Water scenarios For Copernicus Exploitation”) is an European H2020 project to develop a Roadmap for Copernicus Inland Water Services, aiming to better integrate the entire inland water cycle within the Copernicus Services.

From the requirements collected in the project through dedicated working group meetings and stakeholders’ consultation, a list of water quality and water quantity variables which are used in water modelling were identified. All of them were related to five types of modelling into water management: biogeochemical models, hydrodynamic models, river models, crop or pasture growth models and landscape water balance models. The availability of water related products in the Copernicus portfolio was analysed by checking and updating the previous water quantity and water quality project inventories.

This work studies their spatial coverage, data discovery and access, file data formats, validation reports, uncertainty indicators and spatial and temporal resolutions and their utility in the mentioned types of water modelling was analysed. Finally, recommendations on improvements of the existing Copernicus products were made based on the cross analysis between the existing features and user needs.

Main conclusions of the work point to the lack of bathymetry and evapotranspiration as well as some specific water quality products, the need of finer spatial resolution for chlorophyll-a in coastal zones and for soil moisture, surface water and snowmelt products, higher temporal resolution for river discharge and groundwater and water quality variables, the need of validation, increase the coherence between in-situ and remote sensing observations and to provide more quality and uncertainty information. Other demands are to uniform marine and lake products, a global (or at least Pan European) coverage for some local/regional products, improvements in data access and data delivery of new formats, and continuous and consistent long-term archives of vegetation and land cover products.

How to cite: Prat, E., Pesquer, L., Batlle, A., Spyrakos, E., and Thant, S.: Characterization of Copernicus EO products for water modelling, EGU General Assembly 2023, Vienna, Austria, 23–28 Apr 2023, EGU23-8586, https://doi.org/10.5194/egusphere-egu23-8586, 2023.

Emergency planning is the act of preparing for emergencies to reduce losses, human and environmental. The planning process is never complete, threats change and the tools we utilize to address them advance. Drought occurrences within North America and the magnitude of drought impacts reveal the persistent vulnerability of the United States to drought, specifically in the indigenous community. Until recently, drought management was largely response oriented, with little to or no attention to mitigation and preparedness. In 2002, the Navajo Nation developed a drought contingency plan but within the past 20 years no adaptation has occurred. With the increase in adverse impacts of climate change in recent years, an emergent need to revise the drought plan to place more emphasis on mitigation has been expressed by the Water Management Branch of the Navajo Nation. Quantification of the main components of drought mitigation and planning include the assessment of who and what is vulnerable and why. Historically, drought mitigation efforts were restricted by data availability, financial capabilities, and data acquisition. The current contingency plan utilizes the Standardized Precipitation Index (SPI) on a 6-month time scale alone. Yet current research shows that drought is a complex natural hazard where no singular index can adequately capture the impacts across the main categories of drought. As the definition of drought is variable across place, time, and discipline, the addition of diverse indices could provide more insight for the development of a further detailed and tailored drought contingency plan. As such, it has been found that assessing all categories of drought could improve the Navajo Nation’s drought contingency plan by exposing new concepts not yet considered in mitigation efforts. Adding to the currently utilized index that is based off the sole parameter of precipitation, evaluated here is how temperature, humidity, snow cover, vegetation health, and stream flow. These additional factors are able to compare the meteorological drought vulnerability and severity assessment with the Standardized Precipitation Index (SPI) through the development of a web app to display multivariate indices. Hydrological drought should best match meteorological drought both spatially and temporally with agricultural and socioeconomical drought varying the most from the Standardized Precipitation Index (SPI) used for the Navajo Nation Drought Contingency Plan (2002). By applying diverse indices and social data to the Navajo Nation and developing maps across Google Earth Engine and GIS platforms, gaps in risk and vulnerability assessments can be addressed for preparation and mitigation efforts. Predictors for differing categories (hydrological, agricultural, and socioeconomic) may not predict the same important indicator(s) as the meteorological SPI, further establishing a need for multi-index integration and future drought research. This study identifies a methodology for remote and spatial, GIS-based assessment of drought indexing and vulnerability assessment across the Navajo Nation to address broader water management. The identification of insightful drought indices and drought vulnerability is an essential step in addressing the risks and vulnerabilities across the Navajo Nation and may lead to better informed mitigation-oriented drought management for tribal governments, both Navajo and within North America.

How to cite: Castillo, R.: Lessons From Navajo Nation Water Resources, Utilizing Earth Observations to Monitor Drought, EGU General Assembly 2023, Vienna, Austria, 23–28 Apr 2023, EGU23-9207, https://doi.org/10.5194/egusphere-egu23-9207, 2023.

EGU23-9469 | ECS | PICO | HS6.9

Toward a Smart Tool for Irrigation Systems management Using remote sensing 

Halima Taia, Edyta Wozniak, Abdes Samed Bernoussi, and Mina Amharref

In agriculture, water and fertilizer are two limiting elements of plant growth. Indeed, the lack or the excess of one of them disturbs the yields in terms of quality and quantity. Optimal irrigation/fertilization and precisely dosed nutrient supply allow fast growing plants to reach their full potential, offering much larger and better quality yields. The use of remote sensing through satellites images becomes necessary in the case of a large area. To manage properly the use of water and fertilizers in a region it is necessary to know the spatial distribution of crops. So first, we have to discriminate crops. Next the control of doses and plant growth rate must be performed.

In this paper we present a tool for smart management of the water irrigation and fertilizer using remote sensing data and mathematical algorithms by considering crops as a dynamical system.

We give some mathematical algorithms to discriminate dynamical systems (crops) and after we consider the problem of detection of the impact of irrigation and fertilization on the crop through spectral signatures. For this, we consider the problem of detecting the effects of nitrogen and irrigation on the mint  by spectroscopy and we compare the obtained results with other obtained measures for rosemary  without fertilizer. For our case study, we choose potted mint as a plant that grows very fast and we apply our spectral measurement protocol to answer the following problem: Can we detect the effect of water and nitrogen by observing the growth of a given crop using the spectrometer? The results will be used for our tool to manage irrigation and fertilizer.

Keywords: irrigation, fertilizer, crop growth, remote sensing, dynamical systems

This work is the result of a research project: Alkhawarizmi/2020/11: Tool for intelligent management of irrigation water and forest heritage, funded by MESRSFC, CNRST and ADD, Morocco

How to cite: Taia, H., Wozniak, E., Bernoussi, A. S., and Amharref, M.: Toward a Smart Tool for Irrigation Systems management Using remote sensing, EGU General Assembly 2023, Vienna, Austria, 23–28 Apr 2023, EGU23-9469, https://doi.org/10.5194/egusphere-egu23-9469, 2023.

EGU23-10597 | ECS | PICO | HS6.9

Developing a physics-guided neural network to predict soil moisture with remote sensing evapotranspiration and weather forecasting 

Zonghan Ma, Bingfang Wu, Sheng Chang, Nana Yan, and Weiwei Zhu

The short-term prediction of soil moisture variation is a decisive indicator of irrigation scheduling and crop management in agriculture. Traditional soil water dynamic models require complex descriptions of water movement and multiple parameters to calibrate for specific fields, which limit the model’s capability of generalization. Machine learning methods based on large sample datasets can automatically learn the most accurate way of predicting soil moisture with numerous related input variables. However, it could be time consuming in training and model optimization to improve performance. Combining the advantages of both methods, we designed a new soil moisture prediction neural network guided by the water transport driving mechanism. The water balance principle is used to limit the training process with remote sensing-based field-scale evapotranspiration, meteorological rainfall and primary soil water changes calculated from a simplified soil water model. By adding the physics layer to neural network, the demand for large datasets and the requirements of training and optimization are reduced. The prediction of soil moisture is at a half-monthly scale, and we tested the model during the winter wheat growing period. The results show that it requires less training capability to achieve high accuracy. Physics-guided neural networks could act as a better framework for parameter prediction in further researches.

How to cite: Ma, Z., Wu, B., Chang, S., Yan, N., and Zhu, W.: Developing a physics-guided neural network to predict soil moisture with remote sensing evapotranspiration and weather forecasting, EGU General Assembly 2023, Vienna, Austria, 23–28 Apr 2023, EGU23-10597, https://doi.org/10.5194/egusphere-egu23-10597, 2023.

EGU23-12090 | PICO | HS6.9

Stockwater - Advances in reservoir stock monitoring from space 

Santiago Peña Luque, Gael Nicolas, Herve Yesou, Thomas Ledauphin, Sabrine Amzil, Jerome Maxant, Sylvain Ferrant, Manuela Grippa, Afredo Ribeiro, Jean Stéphane Bailly, Jerome Molenat, Fabien Puech, and Rafael Reis

Dams are strategic tools for countries and their management of water resources. Within the Space for Climate Observatory (SCO) initiative and SWOT Downstream program, the StockWater project aims to put in place a system for monitoring water volume in dams. It is based on satellite data, and a specific processing system, thereby facilitating the work of the public authorities in this area.

Water resources monitoring, including surface and groundwater, is a vital issue for governments and public institutions. Water resources are essential for society and economic activity (drinking water, irrigation, hydroelectricity, industry, flood control) and for natural and water ecosystems.

Generally, reservoir stock information is collected and held by the local reservoir managers (public or private). Regional and national authorities might access this information with a certain latency, which depends on national water policies. Central authorities are then confronted with two issues: long latencies to retrieve water stock information and sparse or inexistent information about small reservoirs.

The project proposes a global solution to monitor reservoir stock volumes based on frequent satellite measurements. This solution is based on reservoir water extent monitoring by imaging satellites (Sentinel 1&2) based in the Surfwater processing chain, which integrates a multitemporal approach to improve water masks. Furthermore, StockWater innovation relies on reservoir estimation of Area/Elevation/Volume relationships just from a DEM, even when acquired after the reservoir construction. 

Recent total volume estimations from DEM estimations have been qualified on hundreds reservoirs in France, ranging from 10 to 10000 hectares, providing errors lower than 20% on 77% of the reservoirs. About the general system assesment, Filling rates estimates yield an error lower than 8% on 75% of the measurements.

New versions are evaluated on Spain, France, India and Brazil and deployed on  Burkina-Faso and Tunisia over more than 100 reservoirs. Results are available here: https://www.sco-stockwater.org/  This system will also easily allow volume estimations from Elevation measurements (altimeters Jason, Sentinel3 with limited coverage or SWOT globally).

StockWater project, led by CNES and developed with CS-Group and SERTIT,  holds a partnership initiative with CESBIO, GET, LISAH and FUNCEME/Université Pernambuco laboratories and their local partners in Tunisia, Laos, Burkina-Faso, Brazil and India. StockWater is open to new countries willing to participate in future project expansions.

How to cite: Peña Luque, S., Nicolas, G., Yesou, H., Ledauphin, T., Amzil, S., Maxant, J., Ferrant, S., Grippa, M., Ribeiro, A., Bailly, J. S., Molenat, J., Puech, F., and Reis, R.: Stockwater - Advances in reservoir stock monitoring from space, EGU General Assembly 2023, Vienna, Austria, 23–28 Apr 2023, EGU23-12090, https://doi.org/10.5194/egusphere-egu23-12090, 2023.

Drought within a short time, termed flash drought (FD), severely affects terrestrial ecosystems and water resources. Water use efficiency (WUE) is an essential parameter in understanding the relationship between the water and carbon cycles. However, little is known about the response of WUE to FDs in the Korea peninsula. Therefore, this study identified FD events in Korea using the evapotranspiration (ET) based Standardized Evaporative Stress Index (SESI) and rate of intensification (RI) using soil moisture at flux tower site. Results showed that FD events detected similar patterns in both SESI and RI. At the regional scale, we identified Korea FD frequency and duration via anomalies in SESI using MODerate Resolution Imaging Spectroradiometer (MODIS). Results showed that Korea suffered from 61.3% of FD events for 20 years. The regions with the most FD events were primarily found within the north and east, where the main landcover type is forest, and long FD events (over 30 days) were detected in the northeastern study region. In addition, the effects of FD events on WUE were different based on FD magnitude and landcover types. The changes in WUE response to moderate FD events were obviously driven by the GPP, and the WUE in cropland was observed the highest sensitivity to FD magnitude. To analyze FD impacts on cropland in detail, we focus on monitoring the crop response to FD using microwave remote sensing data such as Synthetic Aperture Radar (SAR) which will be helpful to detect FD effects on crops in a higher resolution.

How to cite: Kang, M. and Choi, M.: Assessing the impacts of flash drought on terrestrial ecosystem based on satellite data, EGU General Assembly 2023, Vienna, Austria, 23–28 Apr 2023, EGU23-12217, https://doi.org/10.5194/egusphere-egu23-12217, 2023.

EGU23-14319 | ECS | PICO | HS6.9

Improvements on the monthly precipitation spatial pattern characterization using a set of remote sensing products. 

Amanda Batlle, Lluís Pesquer, Cristina Domingo-Marimon, Nuria Hernández-Mora, Nikoletta Ropero, Ester Prat, Annelies Broekman, Lucia De Stefano, Miquel Ninyerola, and Micha Werner Werner

Water availability is a limiting factor for many human activities and natural ecosystems processes. Monitoring of water resources, as well as the impacts of water scarcity on human and natural ecosystems, is key for defining adapted water management strategies. Currently, different European and Worldwide organisations are providing several climate services (CS) based on output datasets from weather forecast and climate projection models. To ensure the translation of these CS to actionable knowledge at a local scale, it has been required the tailoring and downscaling of data to fit the user requirements expressed by selected stakeholders representing different relevant sectors. This is one of the main goals of H2020 I-CISK project (https://icisk.eu/) which includes this study carried out at the Guadalquivir River Basin (RB) (small part of Guadiana RB), in the northern part of Andalusia, South of Spain. It is one of the seven established living labs (LL) in I-CISK. This LL is particularly vulnerable to drought impacts.

The present work aims at evaluating the contribution of remote sensing data as an explanatory variable of the spatial pattern of precipitation, a key meteorological variable of water resources models. This characterization is a necessary preliminary step to understand the local relationships between climatic variables and others (topography, vegetation response, etc…) in order to subsequently apply known correlations to downscale  weather forecasting and climate projection models to the spatial resolution required by the user community.

The method is based on the generation of multiple regressions with residual interpolation using weather stations' monthly precipitation data as the dependent variable and a set of independent variables at 250 m spatial resolution such as, squared distance to the Mediterranean Sea and to the Atlantic Ocean, elevation, cosine of aspect,  a set of remote sensing indexes (Normalized Difference Vegetation Index (NDVI), Normalized Difference Water Index (NDWI)), synthetic versions of these indexes and corresponding anomalies.

The NDVI used is generated by monthly aggregation of 16‐day MODIS composite products of MOD13Q1. NDWI has also been calculated from MOD13Q1 surface reflectance products. Synthetic NDVI and NDWI have been generated replacing the original pixel values by the neighbouring vegetation NDVI at the locations of gauge stations where land cover is categorized as impervious surface.  NDVI and NDWI anomalies are calculated based on the climatological monthly mean from the 2000-2021 MODIS data time series. Regressions include independent variables time lags of 0, +1, +2 and +3 months after with respect to the date of precipitation variable.

Preliminary results of single year’s analysis show that including remote sensing data  to the analysis results in a better spatial characterization, obtaining higher correlations in the regressions, which are strongly dependent on seasonality. There is no clear pattern of which index (version and anomaly) is the best contributor and there is also no clear result for the response time lag between precipitation and the indices, although +2 months seems to be the most relevant. Future work will use a full time series analysis to obtain more information on these patterns.

How to cite: Batlle, A., Pesquer, L., Domingo-Marimon, C., Hernández-Mora, N., Ropero, N., Prat, E., Broekman, A., De Stefano, L., Ninyerola, M., and Werner, M. W.: Improvements on the monthly precipitation spatial pattern characterization using a set of remote sensing products., EGU General Assembly 2023, Vienna, Austria, 23–28 Apr 2023, EGU23-14319, https://doi.org/10.5194/egusphere-egu23-14319, 2023.

EGU23-15535 | PICO | HS6.9

Satellite remote sensing based approach for water quality monitoring in a data sparse region 

Bakimchandra Oinam, Vicky Anand, Rajkumari Neetu Sana, and Silke Wieprecht

The application of remote sensing can aid the decision makers and the researchers in the field of water resources for the effective monitoring of water quality in a water sparse region.  The monitoring of water quality in a wetland dominated by the heterogeneous biomass becomes more intricate. This research study was carried out in Loktak Lake, a Ramsar site nestled in the Indo-Myanmar range between the time intervals February 2022 to December 2022. In order to carry out this study, high and very high resolution multispectral satellite imageries were used. The physical water quality parameters namely electrical conductivity, total suspended solids, pH, turbidity, and nitrates were considered for the assessment. The results of this study clearly indicate a strong correlation between the field-measured parameters and reflectance. The prediction algorithms were generally the best fit to derive the water quality parameters. The model performance indices indicates good performance of the model with correlation coefficient greater than 0.80. The outcomes of this study emphasize the use of high and very high multi-spectral satellite imageries for the monitoring of water bodies with complex dynamics.

How to cite: Oinam, B., Anand, V., Sana, R. N., and Wieprecht, S.: Satellite remote sensing based approach for water quality monitoring in a data sparse region, EGU General Assembly 2023, Vienna, Austria, 23–28 Apr 2023, EGU23-15535, https://doi.org/10.5194/egusphere-egu23-15535, 2023.

EGU23-1674 | ECS | Orals | HS6.11

Seasonal and diurnal variations of carbon dioxide and energy fluxes over three land cover types of Nepal 

Bharat Badayar Joshi, Yaoming Ma, and Binbin Wang

This study examines the seasonal and diurnal variations of carbon dioxide and energy fluxes over three land cover types of Nepal by using the eddy covariance method from March to November 2016. The surface energy balance closures were moderate with values of about 56%, 61%, and 64% closure at Kirtipur, Simara, and Tarahara sites respectively. The monthly average values of net radiation flux and latent heat flux peaked in August at Kirtipur and Tarahara sites where as in June at the Simara site respectively. The maximum monthly average measured sensible heat flux was 37 W m−2, 43.6 W m−2, and 36.3 W m−2 in April for all the sites whereas soil heat flux was 5.1 W m−2 and 2.9 W m−2 in April for Kirtipur and Simara sites and 6.2 W m−2 in June for the Tarahara site. The magnitude of the diurnal peak of net ecosystem CO2 exchange (NEE) reached up to 11.04 μmol m−2 s−1 atKirtipur, 15.04 μmol m−2 s−1 at Simara, and 10.44 μmol m−2 s−1 at Tarahara sites respectively. Among the three study sites, the ecosystem at the Kirtipur site was a good carbon source; the ecosystems at Simara and Tarahara sites were low and had good carbon sinks in the growing season. In addition, all three different land cover ecosystem were carbon sources when accounted for during the measurement period.

How to cite: Joshi, B. B., Ma, Y., and Wang, B.: Seasonal and diurnal variations of carbon dioxide and energy fluxes over three land cover types of Nepal, EGU General Assembly 2023, Vienna, Austria, 23–28 Apr 2023, EGU23-1674, https://doi.org/10.5194/egusphere-egu23-1674, 2023.

Lake Nam Co is the third largest lake over the Tibetan Plateau and shows significant influences on the forming and the dvelopement of regional-scale weather and climate. In this study, an integrated analysis of land-atmosphere interaction processes (including meteorological variables, land-atmosphere water, heat and CO2 flux exchange) is introduced based on in situ measurements of meteorological variables and eddy covariance fluxes over land surfaces of grassland, gravel and water surfaces. The meteorological variables measured at 20 m height of two planetary boundary layer towers in the island and over the grass land indicate that: (1) the air temperature is warmer in the island than that over the surrounding grass land during the open water season and air humidity in the island are all higher in the island than those at the surrounding grass land, with difference values of 0.6-0.7 g m-3 during monsoon seasons (June to October) and 0.1-0.3 g m-3 during other months. (2) the measured water, heat and CO2 flux over the water and the grassland show significant differences, where the lake acts as a significant carbon sink during ice-forming periods and the monthly LE over the water surface are obviously higher than those at the grass land and gravel surface. Our results demonstrate that spatial heterogeneity of meteorologival variables and lake-atmosphere water, heat and CO2 flux exist in Lake Nam Co basin, which may show hints for other lake catchment research worldwidely.

How to cite: Wang, B., Ma, Y., Shi, X., and Sun, L.: An integrated analysis of land-atmosphere interaction processes over landscapes of grassland, gravel and water in Lake Nam Co basin, EGU General Assembly 2023, Vienna, Austria, 23–28 Apr 2023, EGU23-1938, https://doi.org/10.5194/egusphere-egu23-1938, 2023.

Using data from cloud radar, ground observations and ERA5 reanalysis data, the factors influencing nighttime precipitation during summer in the Yushu area of the Tibetan Plateau (TP) were investigated. The cloud top height (CTH), cloud base height (CBH) and liquid water content (LWC) were compared between non-precipitating days and precipitating days. The results showed that the average CTH on precipitating days in Yushu was below 10 km above ground level (AGL) in the daytime, whereas it exceeded 10 km AGL at night, with the maximum at 2300 Beijing Standard Time (BST = Coordinated Universal Time + 8 h). The CBH was in-phase with the dewpoint spread. The precipitation intensity and CTH were in-phase with the LWC. The hourly averaged precipitation intensity and convective available potential energy in ERA5 reached their maximums at 2100 BST, which was 3 h ahead of their observed counterparts. There was descending motion in the middle of the day on non-precipitating days, whereas there was ascending motion at night on precipitating days. In addition, the horizontal wind direction in the lower level (below 5000 m) showed clockwise rotation from morning to night. Wind shear occurred in the middle level of the atmosphere, accompanied by a subtropical westerly jet in the upper level. The difference in horizontal wind speed between 200 hPa and 500 hPa was positively related to the LWC, thereby contributing to the formation of upper-level cloud.

How to cite: Cao, B.: Factors Influencing Diurnal Variations of Cloud and Precipitation in the Yushu Area of the Tibetan Plateau, EGU General Assembly 2023, Vienna, Austria, 23–28 Apr 2023, EGU23-1999, https://doi.org/10.5194/egusphere-egu23-1999, 2023.

Since the 1990s, the Qinghai-Tibetan Plateau (QTP) has experienced a strikingly warming and wetter climate that alters the thermal and hydrological properties of frozen ground. A positive correlation between the warming and thermal degradation in permafrost or seasonally frozen ground (SFG) has long been recognized. Still, a predictive relationship between historical wetting under warming climate conditions and frozen ground has not yet been well demonstrated, despite the expectation that it will become even more important because precipitation over the QTP has been projected to increase continuously in the near future. This study investigates the response of the thermal regime to historical wetting in both permafrost and SFG areas and examines their relationships separately using the Community Land Surface Model version 4.5. Results show that wetting before the 1990s across the QTP mainly cooled the permafrost body in the arid and semiarid zones, with significant correlation coefficients of 0.60 and 0.48, respectively. Precipitation increased continually at the rate of 6.16 mm per decade in the arid zone after the 1990s, but had a contrasting warming effect on permafrost through a significant shortening of the thawing duration within the active layer. However, diminished rainfall in the humid zone after the 1990s also significantly extended the thawing duration of SFG. The relationship between the ground thawing index and precipitation was significantly negatively correlated (-0.75). The dual effects of wetting on the thermal dynamics of the QTP are becoming critical because of the projected increases in future precipitation.

How to cite: Fang, X.: Response of Freezing/Thawing Indexes to the Wetting Trend under Warming Climate Conditions over the Qinghai-Tibetan Plateau during 1961-2010: A Numerical Simulation, EGU General Assembly 2023, Vienna, Austria, 23–28 Apr 2023, EGU23-2009, https://doi.org/10.5194/egusphere-egu23-2009, 2023.

The Yarlung Tsangbo Grand Canyon (YGC), one of the world’s deepest canyons, is located within the East Himalayas, which are remote and poorly instrumented. A rain‐gauge network was established around the YGC region. More than three years data collected from the network, disclose that the spatial pattern of rainfall distribution. There are two regions (500 m and 2500 m AMSL) with high precipitation in the YGC. Diurnal cycles showed some variations among sites, but a clear floor was visible around afternoon and peak values exhibited in the early morning. The monthly precipitation in the YGC region shows two peaks in April and July. Vertical convection and vapor transport are important for extreme rainfall in this region.

GPM IMERG evaluation demonstrates that the data reasonably captured the observed seasonal and diurnal variations in the precipitation but with much weaker seasonal and diurnal variations compared with the gauge data. The GPM IMERG overestimated and underestimated the light and heavy precipitation, respectively, leading to a significant underestimation of the rainfall frequency and intensity at both the daily and monthly scales. Some possible mechanism for the underestimation was investigated to help scientists to improve the satellite precipitation product.

Our observations indicate that ERA5 cannot reproduce the diurnal patterns of precipitation in the YGC region. ERA5 showed a wet bias when estimating light cumulus rainfall and a dry bias when estimating heavier (convective) precipitation. The erroneous diurnal variation of ERA5 precipitation (false afternoon rainfall) was due to the CAPE (Convectively Available Potential Energy)-based convective precipitation scheme. The higher ERA5 precipitation than observation was due to the large-scale rainfall scheme in the Integrated Forecasting System (IFS) of ERA5.

These analysis have help us understanding the impacts of YGC valley on the water vapor transport and extreme rainfall outbreak mechanism.

How to cite: Chen, X.: An observational view of rainfall characteristics and evaluation of rainfall products in the Yarlung Tsangbo Grand Canyon, China, EGU General Assembly 2023, Vienna, Austria, 23–28 Apr 2023, EGU23-2196, https://doi.org/10.5194/egusphere-egu23-2196, 2023.

EGU23-2221 | ECS | Posters on site | HS6.11

Increased glacier melt enhances future extreme floods in the southern Tibetan Plateau 

He Sun, Tandong Yao, and Fengge Su

Mountainous areas on the Tibetan Plateau (TP) are of particular hydrological concern as topography and atmospheric conditions can result in large and sudden floods, and pose critical threats to water-related safety and sustainability in neighboring countries. The Yarlung Zangbo (YZ) river basin is the largest river basin on the southern TP, but the ways in which flood discharges in this basin will evolve under 21st-century climate change and the effect of precipitation extremes and glacier melt remain unclear. Here, we comprehensively quantify the future evolution of extreme flood frequency and intensity under 21st-century climate change, and determine the predominant drivers of flood changes in the YZ basin. We show that total runoff is projected to increase owing to continued wetting throughout the 21st century under two different shared socioeconomic pathways (SSPs) in the YZ basin. Both the frequency and intensity of flood extremes are projected to increase under both SSPs, primarily driven by enhanced total days and magnitude when daily precipitation estimates > 95th percentile. Glacier melt is projected to enhance the intensity and frequency of extreme floods by 12%–23% under both SSPs. This study aims to close the knowledge gap regarding future flood risks in the TP’s rainfall- or meltwater-impacted basins.

How to cite: Sun, H., Yao, T., and Su, F.: Increased glacier melt enhances future extreme floods in the southern Tibetan Plateau, EGU General Assembly 2023, Vienna, Austria, 23–28 Apr 2023, EGU23-2221, https://doi.org/10.5194/egusphere-egu23-2221, 2023.

EGU23-2473 | Orals | HS6.11

Extreme Tibetan Plateau cooling caused by tropical volcanism 

Fei Liu and Wenjie Dong

Extreme cooling during boreal winter in Tibetan Plateau (TP) poses great threats to local environment and people’s live safety, and it has usually been attributed to climate internal varaibility. Here we show that the recent five large tropical volcanic eruptions since 1863  induced an extreme TP cooling up to -0.8 K in the first boreal winter post-eruptions, much larger than the global average terrestrial cooling of -0.3 K. This extreme TP cooling response (-0.79 K)  to tropical eruptions is simulated by the multimodel ensemble mean of the Phase 6 Coupled Model Intercomparison Project when realistic sea surface temperature is specified for the atmospheric models, and it is much larger than the direct aerosol cooling (-0.36 K) simulated by the historical runs. The positive North Atlantic Oscillation during the post-eruption winter plays the key role in amplifing the TP cooling through atmospheric teleconnection, which overwhelms the warming response associated the frequently occurring El Niños. Results from this study put into perspective the potential volcanic contribution in certain extreme Tibetan Plateau cooling events. 

How to cite: Liu, F. and Dong, W.: Extreme Tibetan Plateau cooling caused by tropical volcanism, EGU General Assembly 2023, Vienna, Austria, 23–28 Apr 2023, EGU23-2473, https://doi.org/10.5194/egusphere-egu23-2473, 2023.

EGU23-2478 | Orals | HS6.11

Recent climate and hydrological changes in the Tianshan Mountains, Central Asia 

Yaning Chen, Gonghuan Fang, and Zhi Li

Global warming accelerates the water cycle worldwide, and directly affects hydrological changes and may cause changes in water availability. The Tianshan Mountains, known as “water tower of Central Asia”, is situated in the Eurasia hinterland. It serves as the main water source and ecological barrier in Central Asia. Most rives originated from the Tianshan Mountains are recharged with rainfall, glacier melt and snow meltwater. The hydrological processes in the Tianshan Mountains are strongly affected by changes in temperature and precipitation, as well as changes in the snow and glaciers. Increases in temperature have important consequences for the hydrological cycle, particularly in areas dominated by glacier and snow melt.

This study systematically investigated precipitation and temperature changes and their impacts on glaciers, snow cover and hydrological processes in the Tianshan Mountains using station observations, remote sensing data and reanalysis data. In a warming climate, precipitation is more likely to occur as rainfall rather than snowfall. Temperature-induced precipitation shifted from snow to rain since mid-1990s, with S/P experiencing an overall declining trend at a rate of 0.5%/decade. In addition, an overall increase in extreme precipitation was detected, as reflected in 25 indices. The number of consecutive dry days decreased from 87.02 to 69.35 while the number of consecutive wet days increased from 3.89 to 4.61. Changes in extreme precipitation frequency were shown to increase with event rareness. For R95p, the observed changes in frequency are 34.46%, but these jump to 96.58% for R99p.  By creating a long-term, high-quality, daily snow cover extent (HMASCE) product (1982–2019, spatial resolution of 5 km), the spatial and temporal variability in snow metrics (snow cover area and snow cover phenology) has investigated. Snow cover in the Tian Shan region showed a slight increase during this period, mainly in West Tianshan (0.66% a-1), Hissar Alay (0.64% a-1), and East Tianshan (0.24% a-1).

Approximately 97.52% of glaciers in the Tianshan Mountains showed a retreating trend. For the northern TianShan Mountains,  total area and volume of glaciers exhibited negative trends, decreased by 456.43 km2 (16.08%) and 26.14 km3 (16.38%), respectively, from 1990 to 2015. The reduction in the glacier area exhibited an accelerating trend, with a decreasing rate of 0.60% a-1 before 2000, but of 0.71% a-1 after 2000. River runoff responds in a complex way to changes in climate and cryosphere. For example, the runoffs of the Kaidu River and the Aksu River, located in the south flank of the Tianshan Mountains, have increased by 27.4% and 14.4%, respectively, during 1960 to 2021. The total water storage in the Tianshan Mountains also experienced a significant decreasing trend with a rate of 12.12 mm a-1 during 2020~2021..

This study sheds light on current and future changes in water cycle under global warming in the Tianshan Mountains. More efforts should be made on the interpretation of impacts and mechanisms of these changes on runoff, which is a key factor that controls the amount and seasonality of freshwater resources for domestic and agricultural needs.

How to cite: Chen, Y., Fang, G., and Li, Z.: Recent climate and hydrological changes in the Tianshan Mountains, Central Asia, EGU General Assembly 2023, Vienna, Austria, 23–28 Apr 2023, EGU23-2478, https://doi.org/10.5194/egusphere-egu23-2478, 2023.

In this paper, the CLM5.0 organic carbon – gravel (OC – G) parameterization scheme was used to simulate soil temperature and moisture on the Tibetan Plateau from 1990 to 2018. Correlation between the simulated and observed soil temperature or moisture was higher, and the error was smaller, after the modification of the parameterization scheme. This improvement justifies the applicability of the scheme for soil hydrothermal simulations on the plateau. The effects of soil organic carbon (SOC) and gravel content on soil temperature and moisture across the plateau were also evaluated, and show that increasing SOC content increased soil moisture and decreased soil temperature, with the southeastern key area being most sensitive to SOC and gravel content. With increasing gravel content, soil moisture decreased and soil temperature increased, especially in the northwestern key areas. However, in general, soil on the plateau was more sensitive to changes in SOC content, and when the SOC and gravel content changed at the same time, the effects on soil temperature and moisture were a “cumulative” effect. The change directly affected the memory time of soil temperature and moisture in summer over the plateau. Specifically, when the organic carbon content was increased, the memory time of surface soil moisture increased in the northwest and decreased in the southeast. When gravel content was increased, the memory time of surface soil moisture decreased in the northwest but increased in the southeast, and the memory time of soil temperature remained largely unchanged. Changes to the abnormal duration may alter summer weather and climate in Eastern China.

How to cite: Yuan, Y.: Impact of soil organic carbon - gravel parameterization scheme on soil water and heat transport on the Tibetan Plateau, EGU General Assembly 2023, Vienna, Austria, 23–28 Apr 2023, EGU23-2501, https://doi.org/10.5194/egusphere-egu23-2501, 2023.

Mount Emei is located in the eastern edge of the Tibetan Plateau, on the transition zone between the main body of the Tibetan Plateau and the Sichuan Basin in China. It is not only the necessary place for the eastward movement of the plateau system, but also the place where the southwest vortex begins to develop. Its special geographical location makes it particularly important to understand the turbulence characteristics and surface energy balance of this place. Based on the Platenay Boundary Layer (PBL) tower data, radiation observation data and surface flux data of Emeishan station on the eastern edge of Tibetan Plateau from December 2019 to February 2022, the components of surface equilibrium are estimated by eddy correlation method and Thermal Diffusion Equation and Correction (TDEC) method, the characteristics of surface energy exchange in Emeishan area are analyzed, and the aerodynamic and thermodynamic parameters are estimated. The results show that the annual average value of zero-plane displacement d is 10.45 m, the annual average values of aerodynamic roughness Z0m and aerothermal roughness Z0h are 1.65 m and 9.95 m, respectively, and the annual average values of momentum flux transport coefficient CD and sensible heat flux transport coefficient CH are 1.58×10⁻² and 3.79×10⁻³, respectively. Under the unstable stratification, the dimensionless three-dimensional wind fluctuation variance in Emeishan area can better conform to the 1/3 power law of Monin-Obukhov similarity theory. In the near neutral case, the dimensionless velocity variances in the u, v and w directions are 2.412, 2.181 and 1.125 respectively, and the dimensionless velocity variances in the horizontal direction are greater than those in the vertical direction. The diurnal and seasonal variations of each component of surface balance are more obvious. The dominant position of sensible heat flux and latent heat flux during the day varies with seasons. The latent heat flux is dominant in summer and the sensible heat transport is dominant in winter. The diurnal variation range of surface albedo in Emeishan area shows the characteristics of large in the morning and small in the afternoon, which is an asymmetric "U" shape. Its value is between 0.04-0.08. The surface albedo in summer and autumn is higher than that in Emeishan. The influence of underlying surface on surface reflectance is much greater than other factors such as altitude, longitude and latitude.

How to cite: Li, M., Chang, N., and Ma, Y.: Study on surface layer turbulent and energy exchange in Eastern edge of the Tibetan Plateau, EGU General Assembly 2023, Vienna, Austria, 23–28 Apr 2023, EGU23-2539, https://doi.org/10.5194/egusphere-egu23-2539, 2023.

EGU23-2550 | ECS | Orals | HS6.11

Regional and tele-connected impacts of the Tibetan Plateau surface darkening 

Shuchang Tang, Anouk Vlug, Shilong Piao, Fei Li, Tao Wang, Gerhard Krinner, Laurent Z. X. Li, Xuhui Wang, Guangjian Wu, Yue Li, Yuan Zhang, Xu Lian, and Tandong Yao

Despite knowledge of the presence of the Tibetan Plateau (TP) in reorganizing large-scale atmospheric circulation, it remains unclear how surface albedo darkening over TP will impact local glaciers and remote Asian monsoon systems. Here, we use a coupled land-atmosphere global climate model and a glacier model to address these questions. Under a high-emission scenario, TP surface albedo darkening will increase local temperature by 0.24 K by the end of this century. This warming will strengthen the elevated heat pump of TP, increasing South Asian monsoon precipitation while exacerbating the current “South Flood-North Drought” pattern over East Asia. The albedo darkening-induced climate change also leads to an accompanying TP glacier volume loss of 6.9%, which further increases to 25.2% at the equilibrium, with a notable loss in western TP. Our findings emphasize the importance of land-surface change responses in projecting future water resource availability, with important implications for water management policies.

How to cite: Tang, S., Vlug, A., Piao, S., Li, F., Wang, T., Krinner, G., Li, L. Z. X., Wang, X., Wu, G., Li, Y., Zhang, Y., Lian, X., and Yao, T.: Regional and tele-connected impacts of the Tibetan Plateau surface darkening, EGU General Assembly 2023, Vienna, Austria, 23–28 Apr 2023, EGU23-2550, https://doi.org/10.5194/egusphere-egu23-2550, 2023.

 In the context of global warming, glaciers in the Asian High Mountains (AHMs) are shrinking at an accelerating rate.
Projecting their future change is helpful for understanding the hydrological and climatic effects related to glacier retreat. Here,
we projected glacier change in the AHMs from 1979 to 2100 under shared socioeconomic pathway (SSP) scenarios from the
perspective of temperature, equilibrium-line altitude (ELA), and accumulation area. The annual mean temperature in the AHMs
increased by 1.26°C from 1979 to 2014, corresponding to an increase of 210 m in the mean ELA and a decrease of 1.7×10
4 km2
in the glacier accumulation area. Under the SSP2-4.5 (SSP5-8.5) scenario, the annual mean temperature in the AHMs would
increase by 2.84°C (3.38°C) in 2040–2060 relative to that in 1850–1900, leading to the mean ELA reaching an elevation of
5661 m (5777 m). The accumulation area in the AHMs decreased by 46.3% from 1995 to 2014 and was projected to decrease by
60.1% in 2040–2060. Moreover, the annual mean temperature in the AHMs was projected to increase by 3.76°C (6.44°C) in
2080–2100 relative to that in 1850–1900, corresponding to the ELA reaching an elevation of 5821 m (6245 m) and the
accumulation area decreasing to 1.8×10
4 km2 (0.5×10⁴ km2). These data suggest that the conditions for glacier development will
disappear in most of the AHMs, except for extreme high-altitude regions in the Tianshan, Pamir, and Himalaya Mountains.
Under the SSP2-4.5 (SSP5-8.5) scenario, when the global mean temperature increases 1.5°C (2°C) above pre-industrial levels,
the annual mean temperature will increase by 2.12°C (2.86°C) and the accumulation area will decrease by 15% (48%) in the
AHMs compared with that in 1995–2015. Therefore, a 1.5°C increase in global warming would keep 40% more of the glacial
accumulation area (1.5×10
4 km2) in the AHMs compared to a 2°C increase in global warming. 

How to cite: Duan, K.: Changes in equilibrium-line altitude and implications for glacierevolution in the Asian high mountains in the 21st century, EGU General Assembly 2023, Vienna, Austria, 23–28 Apr 2023, EGU23-3126, https://doi.org/10.5194/egusphere-egu23-3126, 2023.

The Sichuan Basin (SCB) located in southwestern China has long been considered the most polluted city cluster with exposure to unhealthy levels of ozone (O3) at times. However, the features of O3 regional transport and source contributions in SCB are poorly understood. In this study, ambient measurements, ERA5 reanalysis dataset, IASI O3 column, and the Weather Research and Forecasting-Community Multiscale Air Quality (WRF-CMAQ) modeling system coupled with the Integrated Source Apportionment Method (ISAM) module were used to investigate the formation mechanism and sources of a severe O3 episode in spring 2020 over the SCB. In the first stage of the O3 episode, a high-pressure system persisted over the western SCB and caused northeasterly wind fields, leading to enhanced regional transport from the northern boundary with the O3 contribution from the boundary exceeding 50% across the SCB. As the synoptic pattern evolved, southeasterly winds dominated the SCB and the stagnant zone over the Chengdu Plain confined O3 originating from the southern SCB and Chongqing city, leading to the accumulation of precursors and elevated O3 levels. During the O3 episode, transportation and industrial sources were major contributors to O3 formation especially for the Chengdu Plain and Chongqing city. In addition, the O3-rich air mass in the nocturnal residual layer that formed over Chongqing city was transported to the Chengdu Plain through southeastern corridor at 400-1600m above ground-level under the prevailing southeasterly winds. With sunrise and the development of the atmospheric boundary layer, the O3-rich air mass in the residual layer (RL) was entrained to the ground-level via vertical mixing, which further enhanced O3 pollution across the Chengdu Plain. Our results revealed the mechanism of regional transport via northeastern and southeastern corridors during an O3 episode and demonstrated the need for joint emission regulation across the SCB to mitigate O3 pollution.

How to cite: yang, X.: Origin of regional springtime ozone episodes in the Sichuan Basin, China: role of synoptic forcing and regional transport, EGU General Assembly 2023, Vienna, Austria, 23–28 Apr 2023, EGU23-3419, https://doi.org/10.5194/egusphere-egu23-3419, 2023.

To explore the driving mechanisms of elevation-dependent warming (EDW) over the Tibetan Plateau (TP), the output from a suite of numerical regional climate models (RCMs) under the Coordinated Regional Climate Downscaling Experiments-East Asia (CORDEX-EA-II) project is examined. Results show that all RCMs can broadly capture the observed temperature distributions over the TP with consistent cold biases, and the spread in temperature simulations could to a large extent be explained by their spreads in the surface albedo feedback (SAF). The simulated EDW during winter is mainly caused by the SAF, and the clear-sky downward longwave radiation (LW) plays a secondary role in shaping EDW. Further analysis suggests that a marked EDW signal over the TP is simulated under the Representative Concentration Pathway emission scenario 8.5 (RCP8.5) for all seasons, particularly in autumn, and the SAF is also the primary contributor to EDW and acts as the main source of uncertainty in EDW projections among RCMs. The LW is the dominant factor in regulating the surface air temperature change over the TP, and its contribution to EDW is model-dependent. Furthermore, the structure and magnitude of projected EDW are sensitive to the RCM physics and driving GCM, as they can alter the projections of snow cover and albedo, which modulate the simulated SAF and its effect on EDW.

How to cite: niu, X.: Contributors to the Elevation-Dependent Warming over the Tibetan Plateau in the CORDEX-EA-II simulations, EGU General Assembly 2023, Vienna, Austria, 23–28 Apr 2023, EGU23-3729, https://doi.org/10.5194/egusphere-egu23-3729, 2023.

The dependence of the feedback signal on atmospheric conditions is still poorly understood and may lead to an underestimation of feedback strength due to opposite responses of precipitation to soil moisture. Based on data from observation stations on the Tibetan Plateau and from satellites, this study evaluated the response of convective clouds to the change of evaporation fraction (EF) and analyzed how surface conditions affect the initiation and development of convection in different coupling regimes. After considering coupling regimes classified by the tropospheric state, the afternoon convective cloud showed a strong response to EF, which is negative feedback in the dry coupling regime and positive feedback in the wet coupling regime. Organized deep convection defined by both the cloud properties and the afternoon precipitation displayed this phenomenon. This shows that the lack of a strong response of convection to EF is due to the dependence of this response on the coupling regime, rather than on the method of defining convection. We also found that the difference in surface heat flux between the two regimes is more significant in the afternoon, while the difference of meteorological elements is most significant before noon. These results provide support for the use of ground-based meteorological data to determine coupling regimes. We also used a regression tree to decompose the effects of coupling regimes and EF into basic near-surface meteorological elements, the results of which provide support for some of our conclusions.

How to cite: Yang, C.: Positive and negative surface feedback and atmospheric control of land surface conditions on convective organization over the Tibetan Plateau, EGU General Assembly 2023, Vienna, Austria, 23–28 Apr 2023, EGU23-3765, https://doi.org/10.5194/egusphere-egu23-3765, 2023.

EGU23-3882 | Orals | HS6.11

Future scenarios for high-mountain wetlands in the Eastern Pamir under the ongoing climate changes 

Monika Mętrak, Łukasz Chachulski, Paweł Pawlikowski, Elżbieta Rojan, Marcin Sulwiński, and Małgorzata Suska-Malawska

The Pamir Mountains are located in the southeastern part of Central Asia. Their eastern part is characterized by cold desert climate, with an annual sum of precipitation below 100 mm, high insolation, strong winds and the presence of permafrost. High-altitude wetlands located there at approximately 3800 m a.s.l., establish in the vicinity of lakes and in the river valleys, and function as complex systems influenced by a combination of arid or hyperarid climate with glacial, cryogenic, fluvial and shore processes. They play several important roles, including that of water sources and forage grounds for people and their livestock. In the presented study we proposed a scenario of potential transformations of high-altitude wetlands caused by climatic changes currently observed and projected in the nearest future for the Eastern Pamir. To obtain this goal, we collected data on the spatial structure and biodiversity of vegetation mosaic accompanying selected water bodies located in the watersheds of Yashilkul and Rangkul lakes, during field expeditions between 2014 and 2019.  Apart from vegetation survey, we also collected soil samples, which were dried, ground and their salinity and CNP content were analyzed with standard analytical methods. Moreover, we identified present changes in temperature and precipitation in both catchments using data from two meteorological stations located there, and analyzed alterations in area of lakes and small water bodies in the vegetation mosaic using Landsat 1-8 data from 1972 to 2018.

Biodiversity observed in the vegetation patchwork around the lakes and along the rivers comprised 110 vascular plant species, forming 10 distinct associations with different environmental requirements and adaptations. Such diversification was possible due to local differences in soil properties resulting from varied terrain features formed as a consequence of intense cryogenic processes. The dominating species belonged to the groups relatively resistant to temperature changes (i.e. graminoids, small shrubs and forbs) and were characterized by rather broad elevational ranges (reaching even below 1000 m a.s.l.). According to the meteorological data, mean annual air temperatures in the studied locations increased over the last 10 years by ~1oC as compared to the period of 1950-1997. Simultaneously, areas of the studied lakes and small water bodies around them have showed an increasing trend since 1972. These observations, combined with the presence of shallow ground ice in the studied area, indicate that wetlands may be currently supplied in water by the thawing processes. Thus, in the nearest future vegetation will expand further from the water bodies, yet its spatial structure may change, in favor of species adapted to growth in brackish stagnant water. Some habitats may be also restricted or damaged due to intensified river flow and local disturbances caused by cryogenic processes. When temperatures become high enough to prevent the renewal of ground ice and to significantly lower the level of impermeable permafrost, vegetation will retreat following receding shoreline of the water bodies, and drought and salinity tolerant species will dominate. The described alterations will heavily impact the use of high-mountain wetland as pastures.

How to cite: Mętrak, M., Chachulski, Ł., Pawlikowski, P., Rojan, E., Sulwiński, M., and Suska-Malawska, M.: Future scenarios for high-mountain wetlands in the Eastern Pamir under the ongoing climate changes, EGU General Assembly 2023, Vienna, Austria, 23–28 Apr 2023, EGU23-3882, https://doi.org/10.5194/egusphere-egu23-3882, 2023.

EGU23-3907 | ECS | Orals | HS6.11

Tibetan Plateau surface albedo responds instantly to both snow coverage and depth 

Xin Miao, Weidong Guo, Wenkai Li, and Yipeng Cao

The Tibetan Plateau snow cover is characterized by rapid changes on a weekly time-scale, which can cause rapid changes in surface albedo. Using snow and surface albedo data from satellite observations, we find that changes in snow coverage on the Tibetan Plateau dominate the rapid changes in surface albedo. However, snow depth also has a distinct effect on rapid changes in surface albedo in some areas especially with unstable snow cover. We test the snow depth-dependent snow albedo parameterization scheme in the land surface model. The results show that whether or not the variation of snow albedo with snow depth is considered directly affects the rapidly changing characteristics of the simulated snow cover on the Tibetan Plateau, which further affects the simulation of surface albedo. These results highlight the rapid response of surface albedo to both snow coverage and depth over the Tibetan Plateau.

How to cite: Miao, X., Guo, W., Li, W., and Cao, Y.: Tibetan Plateau surface albedo responds instantly to both snow coverage and depth, EGU General Assembly 2023, Vienna, Austria, 23–28 Apr 2023, EGU23-3907, https://doi.org/10.5194/egusphere-egu23-3907, 2023.

Containing elevated topography, the Tibetan Plateau (TP) has significant thermodynamic effects for regional environment and climate change, where understanding energy and water exchange process (EWEP) is an important prerequisite. However, estimation of the exact spatiotemporal variability of the land-atmosphere energy and water exchange over heterogeneous landscape of the TP remains a big challenge for scientific community. Focused on the above scientific question, a series of atmospheric scientific experiments and research programs have been conducted since the 1960s, quantitatively evaluating both the spatial distribution and the multi-timescale variation of EWEP via observation, remote sensing, and numerical simulation. Based on the three main approaches, the major advances on EWEP over the past 25 years are systematically summarized in this work. Observations reveal distinct characteristics of the energy balance components and micrometeorological parameters. The roughness length for momentum is generally one order of magnitude higher than that for heat, and a distinct diurnal cycle of the excess resistance for heat transfer (kB-1) is captured. These progresses via observations further contributed to the improvement of remote sensing parameterization and numerical simulation of EWEP, e.g., the daily sensible heat flux can be overestimated by approximately 50% using a fixed , while this overestimation can be mitigated with the observation-captured diurnal variation in  taken into consideration. Moreover, multisource (multispectral, thermal, and microwave) satellite data have been successfully used to retrieve key land–atmosphere properties, which offers a feasible way to monitor EWEP at different spatiotemporal scales: A decreasing trend of sensible heat flux and an increasing trend of latent heat flux over the TP from 2001 to 2012 were reported. Hourly data of land surface heat fluxes over the entire TP were first obtained, with root mean square errors of 76.6 W m−2 (net radiation flux), 60.3 W m−2 (sensible heat flux), 71.0 W m−2 (latent heat flux) and 37.5 W m−2 (soil heat flux), superior to the previous flux products. The total annual evaporation is approximately 51.7 ± 2.1 km3 year-1 for high-elevation lakes with ice sublimation component accounting for around 10-25%. In addition, different numerical models have been evaluated and improved to study EWEP over heterogeneous land surfaces. The simulation accuracy of land surface temperature and surface energy balance in arid and semiarid areas was improved via an improved heat roughness parameterization scheme in Noah. The sensible heat flux was also effectively improved in the CoLM model by adopting an independent method to determine aerodynamic roughness length. All these results advanced the understanding of different aspects of EWEP over the TP by using in situ measurements, multisource satellite data and numerical modeling. Future studies are recommended to focus on the optimization of the current three-dimensional comprehensive observation system, the development of advanced parameterization schemes and the investigation of EWEP on weather and climate changes over the TP and surrounding regions.

How to cite: Ma, Y.: Comprehensive study of energy and water exchange process over the Tibetan Plateau: A review and perspective, EGU General Assembly 2023, Vienna, Austria, 23–28 Apr 2023, EGU23-3999, https://doi.org/10.5194/egusphere-egu23-3999, 2023.

EGU23-4016 | ECS | Posters on site | HS6.11

Microphysical Characteristics of Winter and Summer Precipitation on the Southeastern Tibetan Plateau 

Xin Xu, Xuelong Chen, Dianbin Cao, Yajing Liu, Luhan Li, and Yaoming Ma

The special topography of the southeastern Tibetan Plateau (SETP) provides sufficient moisture for the precipitation in this area. An accurate description of the microphysical characteristics of precipitation is critical for accurate estimation of precipitation rates in the region. In 2022, we used two-dimensional video disdrometer (2DVD) and micro rain radar (MRR) to study the microphysical characteristics and vertical structures of winter (January-March) and summer (May-October) precipitation on the SETP. There were nine snowfall events observed, consisting of weak snowfall processes. The particle number concentration on the SETP is lower than that reported in the low-altitude areas of eastern China. We infer that this may be related to the altitude. The ambient temperature in high-altitude areas is lower than that in low-altitude areas, which affects the collision-coalescence efficiency of snowfall particles. As the snowfall rate increases, the efficiency of collision-coalescence between snowfall particles increases, so that the number concentration of small particles decreases and the number concentration of large particles increases. The shape parameters and slope parameters of the Gamma distribution model of snowfall particles on the SETP are higher than those in low altitude areas. A negative correlation between aspect ratio and diameter of snowfall particles is exhibited. There were 133 rainfall events observed. Compared with the falling speed of raindrops in low-altitude areas, that on the SETP is high. The raindrop diameter corresponding to the peak raindrop number concentration is 0.35 mm. On the SETP, the concentration of raindrops and the maximum raindrop diameter are smaller than those in the low-altitude region in southern China. The frequency distribution histogram of the Dm and log10Nw of stratiform rainfall is unimodal, while that of convective rainfall is bimodal. The average Dm and log10Nw values of stratiform rainfall (Dm=1.02 mm, log10Nw=3.81 mm-1m-3) are smaller than those of convective rainfall (Dm =1.40 mm, log10Nw =3.95 mm-1m-3). The convective rainfall on the SETP is more continental. Compared with stratiform rainfall in low-altitude regions of China, the average Dm value is the smallest and the average log10Nw value is the largest on the SETP. However, the average Dm-log10Nw value of the convective rainfall on the SETP is close to that in southern China. The number concentrations of small raindrops for stratiform and convective rainfall on the SETP are higher than those in low-altitude areas. The Dm and log10Nw of the two types of rainfall increase as the rainfall rate increases. Compared with low-altitude areas, the Dm on the SETP is small and the log10Nw is large. The log10Nw of stratiform rainfall is balanced at a low rainfall rate, while the log10Nw of convective rainfall is balanced at a high rainfall rate. Compared with other regions in China, for a given μ value, the λ value is the highest on the SETP.

How to cite: Xu, X., Chen, X., Cao, D., Liu, Y., Li, L., and Ma, Y.: Microphysical Characteristics of Winter and Summer Precipitation on the Southeastern Tibetan Plateau, EGU General Assembly 2023, Vienna, Austria, 23–28 Apr 2023, EGU23-4016, https://doi.org/10.5194/egusphere-egu23-4016, 2023.

Saline lakes play an important role in the global carbon cycle by burying carbon in sediments and emitting CO2 to the atmosphere. A series of recent studies have found that Saline lakes of the Tibetan Plateau (TP) have a strong carbon sink function, which exhibits very different characteristics from lakes in other regions of the world.

A period of five-year data recorded by the eddy covariance (EC) systems built at Lake Nam-Co (“large lake”, area: more than 2000 km2), Lake small Nam-Co (“small lake”, area: 1.4 km2) and Nam-Co land site (“land station”, plateau meadow) have been used to study on net ecosystem exchange (NEE) characteristics over the different underlying surfaces at Lake Nam-Co Basin. The results revealed that significant differences exist in their carbon exchange processes at diurnal and seasonal variations. (1) COuptake in “large lake” occurs mainly during the freeze period, and the NEE uptake at the “land station” appears mainly in spring and summer, while “small lake” has no significant CO2 uptake during the winter ice covered season。(2) “Large lake” has significant intra-day variation during the ice-forming season; the “land station” has close to zero values in winter but shows significant intra-day variation in spring and summer for the NEE exchange, while the “small lake” shows significant differences for wind direction from the water and from the surrounding land. Under global climate change, the lakes over the TP have expanded a large proportion right now and will continue to enlarge in the future. Our study revealed that there are significant differences in the functions of CO2 source/sink between lakes and land, and even in different sizes of lakes on the TP. This will provide an important reference for the prediction and estimation of the carbon function changes of lakes on the TP.

How to cite: Li, W. and Wang, B.: Analysis of the diurnal and seasonal variations of NEE exchange over a large lake, a small lake and meadow surface of Lake Nam Co basin, Tibetan Plateau, EGU General Assembly 2023, Vienna, Austria, 23–28 Apr 2023, EGU23-4026, https://doi.org/10.5194/egusphere-egu23-4026, 2023.

EGU23-4101 | ECS | Orals | HS6.11

Sensitivity Analysis of the Noah-MP Land Surface Model for Soil Hydrothermal Simulations over the Tibetan Plateau 

Wei Hu, Weiqiang Ma, Zong-Liang Yang, and Zhipeng Xie

The Tibetan Plateau (TP) features unique and highly heterogeneous soils, terrains, vegetation, and climate. Accurately modeling complex freeze-thaw processes and their hydrothermal impacts remains a great challenge. This study focused on deciphering the spatiotemporal variability of diverse parameterization schemes in the soil hydrothermal simulations using the Noah-MP land surface model. We first discussed the spin-up time required by the model to reach the equilibrium state, and then performed a sensitivity analysis of these schemes. The Moderate Resolution Imaging Spectroradiometer (MODIS) land surface temperature and Soil Moisture Active Passive (SMAP) remote sensing products were used as benchmarks to evaluate the schemes’ performance. Results show that longer spin-up times are required in permafrost regions owing to water phase changes. Ground temperature and soil temperature are mainly sensitive to energy-related schemes. Vegetation-related schemes play an important role after the growing season begins on the southeastern TP. Soil water content shows strong sensitivity to schemes related to both water and energy transport. However, the sensitivity of these energy-related schemes is weakened when simulating total soil moisture, including the total amount of water and ice, indicating that these schemes have marked impacts on soil freeze-thaw processes. These results reveal the different spatial (both regional and depth-related) and temporal effects of parameterization schemes; we also provided a preliminary selection of these schemes at a regional scale that could facilitate the further improvement of the soil hydrothermal simulations on the TP.

How to cite: Hu, W., Ma, W., Yang, Z.-L., and Xie, Z.: Sensitivity Analysis of the Noah-MP Land Surface Model for Soil Hydrothermal Simulations over the Tibetan Plateau, EGU General Assembly 2023, Vienna, Austria, 23–28 Apr 2023, EGU23-4101, https://doi.org/10.5194/egusphere-egu23-4101, 2023.

EGU23-4353 | ECS | Posters on site | HS6.11

The integrated observation network of land-atmosphere interactions over heterogeneous landscapes of the Tibetan Plateau 

Zhipeng Xie, Yaoming Ma, Zeyong Hu, Weiqiang Ma, Xuelong Chen, Binbin Wang, and Cunbo Han

The Tibetan Plateau (TP) plays a central role in the water and energy cycle, atmospheric circulation patterns, and regional and global climate, and it is sensitive and vulnerable to global climate change. Land-atmosphere interactions are an important topic in climate change studies because they encompass a wide range of intricate processes and feedback. However, because of the high elevation and harsh climate conditions, knowledge of the land-atmosphere interactions in the TP has been greatly impeded by the extremely sparse and unevenly dispersed in-situ monitoring network in this region. Although automatic weather stations have been widely established throughout the TP, they provide only a single layer of meteorological measurements. Profile measurements of temperature, humidity, and wind may aid in understanding land surface processes and boundary layer dynamics over the complex terrain of the TP. With the support of various agencies in the People's Republic of China and over 17 years of efforts, we have established an integrated observation network of land-atmosphere interactions over heterogeneous landscapes of the TP. The observation network consists of 18 stations covering various landscapes (e.g., alpine meadow, alpine desert, desert grassland, alpine wetland, alpine woodland, glaciers, and alpine lake), measurements made by planetary boundary layer towers, eddy covariance systems, wind profilers, microwave radiometers, radiosonde systems, FlowCapts, and cloud and precipitation radars will be detailed introduced. The contributions of the integrated observations to the understanding of energy and water exchanges, key land surface parameters, turbulent characteristics, atmospheric vertical structures, local circulation characteristics, and the impact of complex terrain on local atmospheric circulation patterns will be demonstrated using the National Observation and Research Station of China for Qomolangma Special Atmospheric Processes and Environmental Changes as an example. Furthermore, a long-term dataset of hourly integrated land-atmosphere observations on the TP has been released and can be freely accessed. We are confident that the integrated observations will benefit a broad multidisciplinary community by enabling the evaluation and development of existing or novel remote sensing algorithms as well as geophysical models for climate research and forecasting.


How to cite: Xie, Z., Ma, Y., Hu, Z., Ma, W., Chen, X., Wang, B., and Han, C.: The integrated observation network of land-atmosphere interactions over heterogeneous landscapes of the Tibetan Plateau, EGU General Assembly 2023, Vienna, Austria, 23–28 Apr 2023, EGU23-4353, https://doi.org/10.5194/egusphere-egu23-4353, 2023.

EGU23-4601 | Orals | HS6.11

Recent hiatus of Tibetan Plateau vegetation greening and the consequence impact on climate 

Yaqiong Lu, Yan Yang, Lihuan Wang, and Jiafeng Liu

The remote sensing products showed significant vegetation greening during 1980-2010 under the “warm-humid” climate changes over the Tibetan Plateau. Several previous studies showed such significant increasing of vegetation NDVI  and LAI resulted an overall cooling effects on climate over the Tibetan Plateau. Our field survey in 2008 and 2018 at 36 alpine grassland sites showed that aboveground biomass increased for legumes and forbs, but decreased for grasses and sedges, resulting in no overall change in the aboveground biomass during the 10-year period. Such hiatus of Tibetan Plateau vegetation greening was also found in three remote sensing products (GLASS, Globmap, GIMMS). We run WRF4.0 model to quantify the recent vegetation impact on climate during 2008-2018 and found the recent hiatus of Tibetan Plateau vegetation greening mainly showed warming effects due to the increasing of the daily minimum air temperature. Such warming effects also increased of the active layer depth and annual thawed fraction over the seasonal permafrost regions. Although the latent heat flux was also increased, the increasing water vapor showed insignificant impact on precipitation except on the cumulus precipitation in Fall.

How to cite: Lu, Y., Yang, Y., Wang, L., and Liu, J.: Recent hiatus of Tibetan Plateau vegetation greening and the consequence impact on climate, EGU General Assembly 2023, Vienna, Austria, 23–28 Apr 2023, EGU23-4601, https://doi.org/10.5194/egusphere-egu23-4601, 2023.

EGU23-4641 | ECS | Orals | HS6.11

Warming of Tibetan Plateau and continual winter-spring drought in Southwest China in the background of global warming 

Huijie Shi, Rongxiang Tian, Xiangyuan Lou, and Zhan Jin

In the context of global warming, the Tibetan Plateau, as the “third pole”, is still unclear about the impact of climate warming on the climate anomalies in the surrounding areas. Using mathematical statistics and climate diagnosis, we compared the anomalies of thermal and dynamic field caused by plateau warming during winter-spring with the continuous drought events in Southwest China from 1991 to 2020. Here we show that, there is a three-year lagged correlation between the plateau climate warming and southwest China precipitation. The correlation coefficient between sensible heat and drought degree exceeds -0.498 and confidence level is greater than the 95%. The warming of the Tibetan Plateau leads to the positive vorticity change around the plateau, which strengthens the westerly circulation of the southern branch, weakens the westerly (cold) wind of the northern branch. Thus, the Southwest China is controlled by a single dry and warm air mass,  and eventually leads to continual winter-spring drought events. When the plateau warming is accompanied by the La Niña event, the drought will last longer and be stronger. The results are of  reference value for the prediction of extreme climate under the action of special terrain, and have certain significance for local disaster prevention.

How to cite: Shi, H., Tian, R., Lou, X., and Jin, Z.: Warming of Tibetan Plateau and continual winter-spring drought in Southwest China in the background of global warming, EGU General Assembly 2023, Vienna, Austria, 23–28 Apr 2023, EGU23-4641, https://doi.org/10.5194/egusphere-egu23-4641, 2023.

EGU23-4693 | Orals | HS6.11

Cryospheric-hydrologic modeling and prediction of a mountainous catchment in the northeast Tibet Plateau 

Hongkai Gao, Zehua Chang, Chuntan Han, Rensheng Chen, Kang Wang, Fabrizio Fenicia, and Hubert Savenije

Increased attention directed at cryosphere hydrology is prompted by climate change. In spite of an increasing number of field measurements and modeling studies, the impact of cryospheric change, especially of frozen soil, on hydrological processes at the catchment scale is still largely unclear. Traditional frozen soil hydrology models have mostly been developed based on a “bottom-up” approach, i.e. by aggregating prior knowledge at point scale, which is an approach notoriously suffering from equifinality and uncertainty. Therefore, in this study, we explore the impact of frozen soil at catchment-scale, following a “top-down” approach, implying: expert-driven data analysis -> qualitative perceptual model -> quantitative conceptual model -> testing of model realism -> future prediction. The complex mountainous Hulu catchment, northeast of the Tibet Plateau (TP), was selected as the study site. Firstly, we diagnosed the impact of frozen soil on catchment hydrology, based on multi-source field observations, model discrepancy, and our expert knowledge. Two new typical hydrograph properties were identified: the low runoff in the early thawing season (LRET) and the discontinuous baseflow recession (DBR). Secondly, we developed a perceptual frozen soil hydrological module, to describe the LRET and DBR properties. Thirdly, based on the perceptual model and a landscape-based modeling framework (FLEX-Topo), a semi-distributed conceptual cryosphere-hydrologic model (FLEX-Cryo) has been developed, considering all cryospheric factors, including glacier and snow accumulation/ablation, and soil freeze/thaw processes. The results demonstrate that the FLEX-Cryo model can represent the effect of soil freeze/thaw processes on hydrologic connectivity and groundwater discharge and significantly improve hydrograph simulation. Furthermore, its realism has been confirmed by alternative multi-source and multi-scale observations, particularly the freezing and thawing front in the soil, the lower limit of permafrost, and the trends in groundwater level variation. In the end, we used the FLEX- Cryo model to predict the impacts of future climate change on hydrology, including the glacier retreat, the decreasing snow cover area, and permafrost degradation. The FLEX- Cryo model is a novel conceptual cryosphere-hydrologic model, which represents these complex processes and has potential for wider use in the vast TP and other cold mountainous regions.

How to cite: Gao, H., Chang, Z., Han, C., Chen, R., Wang, K., Fenicia, F., and Savenije, H.: Cryospheric-hydrologic modeling and prediction of a mountainous catchment in the northeast Tibet Plateau, EGU General Assembly 2023, Vienna, Austria, 23–28 Apr 2023, EGU23-4693, https://doi.org/10.5194/egusphere-egu23-4693, 2023.

EGU23-4722 | Posters on site | HS6.11

Circulation characteristics and formation mechanism of heavy rainfall in summer over the Southeastern Tibetan Plateau 

Dianbin Cao, Xuelong Chen, Yu Du, Yaoming Ma, and Yang Hu

The southeastern Tibetan Plateau (SETP) is the most predominant summer rainfall region in the Tibetan Plateau. However, the atmospheric circulation characteristics associated with regional heavy precipitation over the SETP are still unclear. Based on 35 years of daily precipitation observations in 1980-2014, the types of weather systems causing regional heavy precipitation events over the SETP are objectively classified into two representative patterns, named the Tibetan Plateau vortex type (TPVT) and mid-latitude trough type (MLTT), through hierarchical clustering technique. The classification results show a clear connection between the heavy precipitation and the positive vorticity anomaly, moisture convergence, and southeastward shift of the westerly jet core contributing to anomalous rising motion. It was found that TPVT and MLTT resulting in heavy precipitation events were derived from the eastward development of the Tibetan Plateau vortex related to dry-wet potential vorticity processes and the penetration of deep extratropical trough-ridge circulations, respectively.

How to cite: Cao, D., Chen, X., Du, Y., Ma, Y., and Hu, Y.: Circulation characteristics and formation mechanism of heavy rainfall in summer over the Southeastern Tibetan Plateau, EGU General Assembly 2023, Vienna, Austria, 23–28 Apr 2023, EGU23-4722, https://doi.org/10.5194/egusphere-egu23-4722, 2023.

Analysis of the multi-scale variation characteristics of the land surface energy budget and its causes over the Tibetan Plateau (TP) is helpful to deepen the understanding of local land-air interaction and its climate effects. Based on daily atmospheric reanalysis data during the period of 1981-2018, the intraseasonal impacts of the North Atlantic-East and North Asia (NAENA) teleconnection pattern on TP summer land surface energy budget and the associated mechanism are studied. NAENA is the second mode of 200-hPa meridional wind anomalies over the Eurasian continent, which has significant effects on the multi-scale climatic variability in Eurasia. Composite analysis showed that the NAENA pattern can significantly affect land surface energy budget anomalies in TP by regulating the atmospheric circulation anomalies over and around the TP. On day 0 of positive-phase NAENA events, there is a cyclone to the west of TP, which can lead to anomalous vertical ascending (descend) motion and convergence (divergence) over the lower atmosphere of the northeast (southwest) of the TP. Moreover, it can result in an anomalous increase (decrease) in cloud cover, contributing to weakened (enhanced) downwelling surface shortwave radiation flux and enhanced (weakened) downwelling surface longwave radiation flux, and leading to an anomalous weakening (enhancement) in surface sensible heat flux over the northeastern (southwestern) TP.

How to cite: Fan, W. and Hu, Z.: Intraseasonal influence of the North Atlantic-East and North Asia pattern on TP summer land surface energy budget, EGU General Assembly 2023, Vienna, Austria, 23–28 Apr 2023, EGU23-4827, https://doi.org/10.5194/egusphere-egu23-4827, 2023.

EGU23-4853 | ECS | Posters on site | HS6.11

The interdecadal changes in the pattern of summer precipitation over the Tibetan Plateau around the mid-1990s 

Wei Shang, Keqin Duan, and Xuejuan Ren

The interdecadal changes in the pattern of the summer precipitation over the Tibetan Plateau (TP) are studied around the mid-1990s. During 1961-1996, the dominant mode of the interannual variations of summer precipitation over the central-eastern TP is shown a dipole pattern, with opposite variation between the southeastern and northeastern TP. While during 1997-2019, the dominant mode become a mono-sign pattern. During 1961-1996, the dipole pattern of TP precipitation is essentially driven by the North Atlantic Oscillation (NAO) and the related circulation anomalies. However, the impact of NAO on the TP precipitation has weakened since the mid-1990s. In contrast, more intensified positive height anomalies in the upper troposphere are observed over the whole TP regions during 1997-2019. Meanwhile, the southerly moisture flux from the Bay of Bengal and the Philippine Sea is prevalent significantly with strong moisture convergence. This interdecadal spatial shift is mainly attributed to the significant increasing of the sea surface temperature (SST) in the Atlantic Ocean and Indo-Pacific warming pool. The warming SST could induce Rossby waves and propagate to TP regions. The wave train-related positive height anomalies are in favor for the strengthening of the South Asian high (SAH). Moreover, the SAH-related circulation anomalies are primarily responsible for the intense vertical flow anomalies in the TP. As a result, the summer precipitation anomalies over the entire TP regions are largely increased and formed the mono-sign pattern during 1997-2019. Based on the Coupled Intercomparison Project Phase 6 models projection results, further analysis demonstrates that the dominant pattern of summer precipitation in south and north TP shows robustly consistent variation during the center and end of the 21st century, and would become more pronounced under higher scenario. These findings indicate the significant future transformation of TP precipitation pattern and atmospheric circulations in response to greenhouse warming.

How to cite: Shang, W., Duan, K., and Ren, X.: The interdecadal changes in the pattern of summer precipitation over the Tibetan Plateau around the mid-1990s, EGU General Assembly 2023, Vienna, Austria, 23–28 Apr 2023, EGU23-4853, https://doi.org/10.5194/egusphere-egu23-4853, 2023.

EGU23-4876 | ECS | Posters on site | HS6.11 | Highlight

Atmospheric dynamic constraints on freshwater sourced from the Tibetan Plateau under Paris climate pledges 

Yutong Zhao, Tao Wang, and Chaoyi Xu

Almost one-fifth of the world’s population relies on rivers originating from the Himalayas and Tibetan Plateau. How global warming will impact runoff change in this water tower of Asia has attracted worldwide attention. Yet, their picture under Paris climate pledges is still a montage due to “very low” confidence in future precipitation changes. we introduce an atmospheric dynamic framework to constrain future precipitation changes from climate models by the end of this century. We then constrain runoff changes from scaling laws from precipitation and evapotranspiration and glacier melt contributions. The outcome is a smaller increase of precipitation by about a factor of two, and the net increase of June-to-September runoff is estimated to increase by 3.1% to 6.8% for global warming levels comprised between 1.5 and 4°C. Although ubiquitous increase in upstream runoff is found across basins, the water scarcity conditions alleviated in Yangtze and Yellow basins and degraded in the Indus and Ganges basins. These important findings highlight that the practical water scarcity adaptation measures should be searched in Pakistan and India to secure future food security and environmental sustainability.

How to cite: Zhao, Y., Wang, T., and Xu, C.: Atmospheric dynamic constraints on freshwater sourced from the Tibetan Plateau under Paris climate pledges, EGU General Assembly 2023, Vienna, Austria, 23–28 Apr 2023, EGU23-4876, https://doi.org/10.5194/egusphere-egu23-4876, 2023.

EGU23-5043 | ECS | Orals | HS6.11

Summer Lake Destratification Phenomenon: A Peculiar Deep Lake on the Tibetan Plateau 

Rongmingzhu Su, Weiqiang Ma, Zhipeng Xie, Binbin Wang, Wei Hu, and Zhongbo Su

Lake water temperature and the related thermal structure influence not only the provision of ecosystem services in lacustrine environments but also the interactions with regional climate. However, continuous lake temperature monitoring across the Tibetan Plateau is sparse, limiting our understanding of lake thermal and mixing dynamics and hindering the verification of modeling results in this region. Based on in-situ water temperature and meteorological observations, this study revealed a special summer destratification phenomenon of a deep alpine lake on the Tibetan Plateau, Langa Co. The results indicate that Langa Co is a discontinuous cold polymictic lake, which becomes completely mixed and reaches a homogeneous water temperature frequently during spring and autumn. Further, the intermittent periods of stratification in summer only last a few days, which is rare for such a deep lake (mean depth = 22 m; maximum depth = 49 m). As an example of a discontinuous cold polymictic lake that contrasts with the typical dimictic pattern of alpine lakes, studies of Langa Co help to gain insights into lake thermal processes and thermoregulation mechanisms and establish a reference for lake model evaluation and parameterization on the Tibetan Plateau.

How to cite: Su, R., Ma, W., Xie, Z., Wang, B., Hu, W., and Su, Z.: Summer Lake Destratification Phenomenon: A Peculiar Deep Lake on the Tibetan Plateau, EGU General Assembly 2023, Vienna, Austria, 23–28 Apr 2023, EGU23-5043, https://doi.org/10.5194/egusphere-egu23-5043, 2023.

As a unique climate phenomenon induced by the Tibetan Plateau (TP) heat flux, the TP monsoon is closely connected with the global climate, especially pertaining to the TP. However, the current research focuses more on the influence of the TP monsoon on the TP and eastern China, but not including Central Asia. This paper analyzed the relationship between the TP monsoon index and Central Asia summer precipitation by JRA55 reanalysis data and Global Precipitation Climatology Centre (GPCC) monthly precipitation. The results showed a significant positive relationship between the TP monsoon index and summer precipitation in Central Asia. When the TP monsoon was strong, there was cold advection in the upper troposphere over Central Asia, and the resulting thermal wind caused a cyclonic circulation anomaly in the mid-upper troposphere over Central Asia. This in turn led to a cyclonic circulation anomaly to water vapor transport in the lower troposphere. The abnormal upward movement also caused more precipitation in this area, which explains the positive correlation between the TP monsoon and the precipitation in Central Asia. Based on this physical mechanism, the temperature of the mid-upper troposphere over Central Asia was closely related to the TP monsoon, and it was a key factor that affected summer precipitation changes in Central Asia.

How to cite: Zhang, S.: The Influence of the Tibetan Plateau Monsoon on Summer Precipitation in Central Asia, EGU General Assembly 2023, Vienna, Austria, 23–28 Apr 2023, EGU23-5846, https://doi.org/10.5194/egusphere-egu23-5846, 2023.

EGU23-5857 | Orals | HS6.11

Accelerated release of PFASs from glacier melting on the Qinghai-Tibet Plateau caused by global warming 

Lin Peng, Jing Wu, Bingqi Dong, Yiru Zhuang, Fan Wang, Lixin Yang, Yulong Yan, Junjie Li, Kai Xie, Dayu Zhang, Zhuocheng Liu, and Xiaolin Duan

Due to the characteristics of persistence, bioaccumulation, potential for long-range environmental transport and adverse effects, the emissions and pollution characteristics of long-chain, short-chain and ultra-short-chain polyfluoroalkyl and polyfluoroalkyl substances (PFASs) are affected by International attention, especially in the Arctic, Antarctic and the third pole Qinghai-Tibet Plateau region. The Tibetan Plateau is the highest plateau in the world (averaging over 4,000 metres) and has the largest ice reserves (approximately 7,481 cubic kilometres) except for the polar regions, and is known as the water tower of Asia. Kwok et al. (2013) found that glaciers can act as temporary reservoirs for PFASs, which are released by melting glaciers under the influence of global warming. Chen et al. (2019) found that melting glaciers have become the second major source of PFASs in Lake Nam Co. Since the 1980s, global warming has led to the retreat of more than 80% of the glaciers and the expansion of more than 50% of the lakes on the Tibetan Plateau, which may intensify the release of PFASs from the glaciers. In this study, 17 water samples, 12 sediment samples and 12 soil samples were collected in the east, south, west or north direction, or in the center of Lake Nam Co in August 2020. Moreover, 23 water samples were collected from glaciers and non-glacial runoff around the lake that flow into Lake Namco. 19 PFASs (C2-C18), and their nine isomers and one main precursor FHxSA were analyzed by solid-phase extraction (two-fraction elution) and ultra-high performance liquid chromatography/tandem mass spectrometry. The results showed the concentrations of PFASs in water bodies such as lake water, glacial runoff and non-glacial runoff were the highest, with average concentrations of 3603 pg/L, 9,823 pg/L and 4,089 pg/L, respectively, which were 4 times, 7.4 and 5.6 times those of 2017. The concentrations of PFASs in soil and sediment were significantly lower than those in water bodies, 1.86 and 0.616 ng/g (dry weight), respectively. It was estimated that the PFASs input flux of surface runoff to lake reached 18,926.5mg/d, of which the glacial runoff reached 11,326.2mg/d (7.7 times that of 2017). It is very likely that the melting of glaciers accelerated the release of PFASs from glacier runoff into the water of Lake Nam Co. For all the three media, the linear chain was the most important isomer of PFOA and PFOS, and the order of the proportion of branched chain isomers was consistent (iso->5m->4m->3m-PFOS/PFOA). The PFBA concentrations were highest in lakes and surface runoff, accounting for 55.2% and 81.2% of total PFASs, respectively. PFBA and other PFASs in lake water were poorly correlated, and Cai et al. (2012) found similar results in polar glaciers, suggesting that the PFBA in the Lake Nam Co probably mainly came from the melting of glaciers. In the future, global warming may further accelerate the melting of glaciers and the release of PFASs in glaciers, and the changing trend of PFASs concentrations in water bodies on the Tibetan Plateau should be continuously tracked.

How to cite: Peng, L., Wu, J., Dong, B., Zhuang, Y., Wang, F., Yang, L., Yan, Y., Li, J., Xie, K., Zhang, D., Liu, Z., and Duan, X.: Accelerated release of PFASs from glacier melting on the Qinghai-Tibet Plateau caused by global warming, EGU General Assembly 2023, Vienna, Austria, 23–28 Apr 2023, EGU23-5857, https://doi.org/10.5194/egusphere-egu23-5857, 2023.

EGU23-5897 | ECS | Orals | HS6.11

How Does the Evapotranspiration Over the Tibetan Plateau Affect the Precipitation in Itself and Low Reaches? 

Yingge Tang, Jingyu Dan, Meng Zhang, Haojun Jiang, and Yanhong Gao

Through land-atmosphere interaction, the Tibetan Plateau (TP) directly or indirectly affect the weather and climate globally, nevertheless the majority regions of China. To investigate the influence of the terrestrial evapotranspiration over the TP on precipitation over its own and downstream, the water vapor tracer (WAT) method coupled with the Weather Research and Forecasting (WRF) are used in this study. According to the landing location of precipitation, the termination of the evaporative moisture over the TP could be apart into inside or outside the TP. The process in the former was named as recycling precipitation and the other was named as moving-out precipitation. The recycling precipitation was found dominate the termination of the ET, which showed a decrease gradient from eastern to western TP. The moving-out precipitation mainly spreads to the east with a few to the south. Seasonal variations suggested that more recycling precipitation occurs in summer and winter, and more the moving-out precipitation occurs in spring and autumn. The trade-off between convection and advection results in different reaches of moving-out precipitation in two seasons: the strong convection and diabatic heating plus a relative weak large-scale advection result in short reaches outside the TP in summer, while relative weak convection and strong advection result in far-reaches in autumn. This study is beneficial for the understanding of the water cycle over the TP as well as the TP direct impacts mechanism on the precipitation in central and eastern China.

How to cite: Tang, Y., Dan, J., Zhang, M., Jiang, H., and Gao, Y.: How Does the Evapotranspiration Over the Tibetan Plateau Affect the Precipitation in Itself and Low Reaches?, EGU General Assembly 2023, Vienna, Austria, 23–28 Apr 2023, EGU23-5897, https://doi.org/10.5194/egusphere-egu23-5897, 2023.

Land surface temperature (LST) is an important parameter in land surface processes. Improving the accuracy of LST retrieval over the entire Tibetan Plateau (TP) using satellite images with high spatial resolution is an important and essential issue for studies of climate change on the TP. In this study, a random forest regression (RFR) model based on different land cover types and an improved generalized single-channel (SC) algorithm based on linear regression (LR) were proposed. Plateau-scale LST products with a 30 m spatial resolution from 2006 to 2017 were derived by 109,978 Landsat 7 Enhanced Thematic Mapper Plus images and the application of the Google Earth Engine. Validation between LST results obtained from different algorithms and in situ measurements from the Tibetan observation and research platform showed that the root mean square errors of the LST results retrieved by the RFR and LR models were 1.890 K and 2.767 K, respectively, which were smaller than those of the MODIS product (3.625 K) and the original SC method (5.836 K).

How to cite: Wang, X., Zhong, L., and Ma, Y.: Estimation of 30 m land surface temperatures over the entire Tibetan Plateau based on Landsat-7 ETM+ data and machine learning methods, EGU General Assembly 2023, Vienna, Austria, 23–28 Apr 2023, EGU23-6093, https://doi.org/10.5194/egusphere-egu23-6093, 2023.

EGU23-6210 | Orals | HS6.11

Changing climate and its impacts over the southern slope of the Himalayas 

Deepak Aryal, Dibas Shrestha, and Damodar Bagale

The great Himalayas, the world’s highest mountain system, is home to millions of people and hundreds of unique species. It has one of the world's largest concentrations of cryospheric components (glaciers, snow, and permafrost). The Himalayas supply continued meltwater to some of Asia’s greatest river systems and play a vital role in the South Asian monsoon environment by guarding theIndian subcontinent from the dry, cold air masses of central Asia and blocking the warm, moist airflow from the Indian Ocean. Unfortunately, this water tower has been experiencing rapid changes driven by climate change in recent decades. Changes in this region have had and will continue to have major negative consequences for people living in the area and globally. However, changes in the climate extremes and their consequences have not been understood well yet because of the extreme topography that hinders the establishment and maintenance of monitoring networks. We will introduce some outstanding ongoing research activities in understanding key processes and changes in high-mountain meteorology, climate extremes, and glacier evolution over the southern slopes of the Himalayas. Results suggest that elevation-dependent warming accompanied by rapid glacier retreat is accelerating in the region. In addition, climate extremes are likely to increase with intensifying drought and floods. 


How to cite: Aryal, D., Shrestha, D., and Bagale, D.: Changing climate and its impacts over the southern slope of the Himalayas, EGU General Assembly 2023, Vienna, Austria, 23–28 Apr 2023, EGU23-6210, https://doi.org/10.5194/egusphere-egu23-6210, 2023.

The spatial and temporal distribution characteristics and changes of summer precipitation over the  Tibetan Plateau(TP) is quite complicated, so it is an urgent problem to simulate the precipitation over the plateau accurately. Due to the improved resolution, dynamical downscaling modelling(DDM) at kilometer scale has shown certain value-added effects in the simulation of water vapor transport and the triggering of convection over the Tibetan Plateau, but it may still not be sufficient to simulate the precipitation characteristics of mountain observations. In this study, a DDM at 4 km resolution and a DDM at 28 km resolution were conducted in summer (June 1 to August 31, 2014). Based on the station observation datasets, the hourly precipitation changes of ERA5 reanalysis data and the above simulation results with different resolutions were evaluated. It indicates that CPM has a significant advantage in simulating precipitation in daytime precipitation simulation, but it underestimates the precipitation at night obviously, while the performance of ERA5 and DDM show acceptable performance.Meanwhile, this situation varies greatly among different basins on TP, which is worth further analysis. The key of this study is to to fully consider small-scale physical processes and the turbulence problems involved in boundary layer processes on the basis of 4km resolution simulation, so as to explore the optimal resolution of hourly precipitation simulation over TP. The physical mechanism behind this is related to the different feedback of scale interactions caused by different resolutions, which may involve the different characterization of terrain and underlying surface features.

How to cite: Jiang, H. and Gao, Y.: Simulation of Hourly Precipitation over the Tibetan Plateau by Regional Climate Dynamical Downscaling Simulations with Different Resolutions, EGU General Assembly 2023, Vienna, Austria, 23–28 Apr 2023, EGU23-6694, https://doi.org/10.5194/egusphere-egu23-6694, 2023.

EGU23-8639 | ECS | Orals | HS6.11

Drought analysis under changing precipitation extremes in the Upper Indus Basin Pakistan 

Muhammad Azhar Ali, Yasir Latif, Amna sahar, and Muhammd Yaseen

Upper Indus Basin (UIB) represents three vast mountain ranges of the Himalayan-Karakoram-Hindukush (HKH) ranges in Pakistan. Recent regional warming trends even at high altitudes have confirmed the alteration of the hydrological cycle attributed to global warming. This warming tendency affects the monsoon precipitation in terms of wetting and drought in Pakistan with unprecedented intensity, causing either severe flooding or episodic drought. Therefore, it is worth observing the recent spring and summer monsoon changes in extreme precipitation and drought severity throughout Pakistan. The present study examined 8 precipitation indices in the past 50-year period (1971–2020) (stretched to two data periods) using Mann–Kendall and Sen’s method to investigate the direction and magnitude of the observed trends. For drought estimation, the Percentage Normal (PN), and Percentage Deviation (PD) indexes were analyzed. We observed that spring and summer wet days significantly increased in the central-eastern (Kakul, Kotli, Jhelum) and western (Cherat, Chitral, Peshawar) regions in the 1st data period but significantly decreased in areas including the southern region in the 2nd data period. We further observed the high-intensity precipitation days (R10, R20) in the same seasons. The intensity of summer R20 was much stronger throughout Pakistan in the 1st data period which reduced significantly during the 2nd data period in northern and southern regions. We extended the circle of investigation to very heavy and extreme precipitation (R30 and R50). The intensity of R30 and R50 in summer followed the same pattern as observed for R10 and R20. However, R30 and R50 in pre-monsoon significantly increased in the northern, east-western, and south-eastern regions during the 2nd data period. Similarly, drought analysis proposed an extreme wetting tendency in the western UIB and lower areas of southern Punjab in the last two decades. Summer monsoons and westerly humid regions also experienced severe drought in terms of heavy and very heavy precipitation extremes. Our results concluded that the most significant changes in precipitation extremes and drought severity occurred with higher intensity and recurring frequency for all indices in spring and summer monsoon during the 2nd data period.

How to cite: Ali, M. A., Latif, Y., sahar, A., and Yaseen, M.: Drought analysis under changing precipitation extremes in the Upper Indus Basin Pakistan, EGU General Assembly 2023, Vienna, Austria, 23–28 Apr 2023, EGU23-8639, https://doi.org/10.5194/egusphere-egu23-8639, 2023.

Knowing the Freeze-Thaw (FT) state/ice content/freezing front depth of the land surface is essential for many aspects of weather forecasting, climate, hydrology, and agriculture. Microwave L-band emission contains rather direct information about the FT-state because of its impact on the soil dielectric constant, which determines microwave emissivity and the optical depth profile. However, current L band-based FT algorithms need reference values to distinguish between frozen and thawed soil, which are often not well known. 

We present a series of new frozen soil detection algorithms based on the daily variation of the H-polarized brightness temperature. Exploiting the daily variation signal allows for a more reliable state detection, particularly during the transition periods, when the near-surface soil layer may freeze and thaw on sub-daily time scales. The new algorithms explore and prove that we can get the Freeze-Thaw (FT) state/ice content/freezing front depth of the land surface with a delicate analysis of the L-band passive brightness temperature signals. These studies are expected to extend L-band microwave remote sensing data for improved FT detection.

How to cite: Lv, S.: The L-band passive DAV(Diurnal Amplitude variation) series algorithms for frozen soil, EGU General Assembly 2023, Vienna, Austria, 23–28 Apr 2023, EGU23-10306, https://doi.org/10.5194/egusphere-egu23-10306, 2023.

EGU23-10773 | Orals | HS6.11

Regional map of InSAR-based active layer thickness of permafrost in Qinghai-Tibet Plateau 

Rongxing Li, Tian Chang, Jiangping Han, Yonghong Yi, Tong Hao, Ping Lu, Yuliang Wen, and Zhenshi Li

Accurate assessment of the state and changes of permafrost active layer thickness (ALT) on the Qinghai-Tibet Plateau (QTP) is critical to understanding the underlying processes driven by the global climate change. The Interferometric Synthetic Aperture Radar (InSAR) technology has been proven to be a method for quantifying deformation caused by natural and degradational processes of permafrost changes. Given its high accuracy, this method has been applied to monitoring local and regional permafrost deformation in QTP. However, there is a lack of improved large-scale regional ALT mapping algorithm using the accurate InSAR deformation data. Here, we examine the complex processes where the active layer melts spatio-temporally in depth during the thawing season, and the ground subsides due to the volume difference induced by the ice - water conversion. We developed a new model that infers ALT from the surface subsidence with help of other parameters in the process. This model takes the advantage of long-term InSAR derived deformation data, including both seasonal signal and inter-annual trend. In addition, it introduces an empirical parameter to represent the contribution of the ice-water phase change with consideration of additional water contribution from other sources. We implemented the developed method in Kekexili regional of the QTP. The seasonal deformation was obtained from radar images of Sentinel-1 by using the Small Baseline Subset Interferometry (SBAS-InSAR) technology. The thawing water was estimated in combination with soil moisture, precipitation, evapotranspiration and runoff data. Based on deformation data, vegetation cover information and existing ALT products, the empirical parameter was obtained by a data-driven regression method. Finally, a new InSAR-derived permafrost ALT map in the Kekexili region from 2015 to 2020 is produced. The results show that the average ALT is of 1.94 m with a standard deviation of 0.35 m. A comparative discussion with permafrost maps produced using other methods is given.


How to cite: Li, R., Chang, T., Han, J., Yi, Y., Hao, T., Lu, P., Wen, Y., and Li, Z.: Regional map of InSAR-based active layer thickness of permafrost in Qinghai-Tibet Plateau, EGU General Assembly 2023, Vienna, Austria, 23–28 Apr 2023, EGU23-10773, https://doi.org/10.5194/egusphere-egu23-10773, 2023.

EGU23-13582 | ECS | Posters on site | HS6.11

A comparative study of carbon fluxes measured at two different heights over an alpine steppe 

Nithin Dinesan Pillai, Christian Wille, Felix Nieberding, Yaoming Ma, and Torsten Sachs

Being the most accurate, direct, and defensible method available to date for studying the ecosystem scale gas exchange, the eddy covariance (EC) method was used to examine the net carbon exchange over an alpine steppe ecosystem near the Nam Co Station for Multi-sphere Observation and Research (NAMORS) on the Tibetan Plateau. EC measurements are site-specific and the values represent the total sum of the relative contribution of fluxes from all the components within the footprint over the measurement time. The scattered and uneven distribution of EC towers and their small footprint demand upscaling of the flux observations to a regional scale for improving understanding of the net exchange of CO2 between the terrestrial biosphere and the atmosphere. Regional scale carbon estimates are highly variable and not fully explored as compared to carbon balance studies at extreme ends of the spatial scale spectrum (large continental scale and small vegetation stand scale). Translating the spatially sparse measurements into consistent, gridded flux estimates at the regional scale is a prerequisite for quantifying the current terrestrial carbon cycle. But the uncertainties caused by the representativeness error in the model grids while quantifying the regional estimates of carbon exchange are not fully investigated due to limited data availability as well as knowledge of flux variability at the grid scale. Rather than extrapolating the point scale and/or site-specific scale measurements by fitting any statistical model to predict ecosystem or earth system processes, a systematic upscaling approach is vital for refining mathematical models and accounting for the grid-scale uncertainties for better policy decisions. As an initial step to this, the net ecosystem exchange (NEE) of carbon estimated at two different measurement heights of 3 m and 19 m, in the early growing period of 2019 were used to quantify and analyze the interdependencies in the flux measurements at two heights and the influence of heterogeneity within the footprint in the measured fluxes.

Keywords: Eddy covariance, Carbon flux, Net ecosystem exchange, Tibetan Plateau

How to cite: Pillai, N. D., Wille, C., Nieberding, F., Ma, Y., and Sachs, T.: A comparative study of carbon fluxes measured at two different heights over an alpine steppe, EGU General Assembly 2023, Vienna, Austria, 23–28 Apr 2023, EGU23-13582, https://doi.org/10.5194/egusphere-egu23-13582, 2023.

Precipitation patterns and variations over the Tibetan Plateau (TP) are mainly dominated by the Asian summer monsoon, the westerlies and their interactions. The precise scope of the Asian summer monsoon's influence, however, remains unclear. Referring to the climatological northern boundary index of the East Asian summer monsoon, this paper demonstrates that the 300 mm precipitation from May to September can be used as an index of the northern boundary of the Asian summer monsoon over the TP, and explores the spatial characteristics of the climatological and interannual northern boundary. The results show that the climatological northern boundary of Asian summer monsoon over the TP is located along the eastern Qilian Mountains-Tanggula Mountains-Qiangtang Plateau-Gangdise Mountains-Western Himalayas. It describes the boundary of the dryland during the rainy season and depicts the location of the convergence of westerly wind (westerlies) and southerly wind (monsoon) at lower troposphere over the TP. Precipitation variations in the north (south) area to the climatological northern boundary are considerably positively associated with changes in the latitudinal (longitudinal) water vapour budget. The interannual fluctuation range of northern boundary and the distribution of the TP's vegetation are related. The climatological northern boundary can more accurately reflect the region that is continuously under the influence of the monsoon and has a clearer understanding of the boundaries in the westerlies-monsoon circulation, ecology, and climate than the meteorological northern boundary (the pentad precipitation more than 4 mm/day). The westerlies influence zone, monsoon influence zone, and westerlies-monsoon transition zone are identified based on the interannual fluctuation range of northern boundary. This study can serve as a foundation for further investigation into the linkages between the westerlies-monsoon and the TP's hydrological and ecological systems. 

How to cite: Huang, L., Chen, J., and Chen, F.: The northern boundary of the Asian summer monsoon and division of westerlies and monsoon regimes over the Tibetan Plateau, EGU General Assembly 2023, Vienna, Austria, 23–28 Apr 2023, EGU23-15353, https://doi.org/10.5194/egusphere-egu23-15353, 2023.

High Mountain Asia (HMA), known as Earth’s “third pole” and “Asia’s water tower,” is the largest glacier and snow reservoir on Earth except for the polar ice sheets. Snow is an important component of the HMA cryosphere, and its variability directly affects the water and energy balances in the region. Identifying long-term changes in snow cover in the HMA region is important for the development of downstream water resources, prevention of water disasters, and survival and social stability of the “Third Pole” region.

We had developed a long-term, high-quality, daily High Mountain Asia Snow Cover (HMASCE) product to systematically study the snow cover indicators (SCA and snow cover phenology (SCP)) in different sub-regions and altitudes in HMA over the past 40 years in the context of global climate change. The results show that (1) the accuracy of the HMASCE product was validated using station snow depth data, with OA, PA, and UA values of 81.99%, 84.20%, and 76.39%, respectively. (2) the SCA shows a significant trend of shrinkage (-0.56% a-1), snow cover days (SCD) shortens by 15.5 days, and snow cover start date (SOD) is delayed by about 5.6 daysand snow cover end date (SED) has advanced by 10 d in HMA over the last 40 years. (3) Another important finding is the altitudinal dependence of SCD, where, below 5000 m, higher altitudes experience lead to greater SCD reduction than lower altitudes. The possible mechanisms underlying this phenomenon related to the region's own characteristics, the elevation dependence of warming (EDW), and the increased black carbon.

How to cite: Li, Y. and Chen, Y.: The continuing shrinkage of snow cover in High Mountain Asia over the last four decades, EGU General Assembly 2023, Vienna, Austria, 23–28 Apr 2023, EGU23-16661, https://doi.org/10.5194/egusphere-egu23-16661, 2023.

EGU23-16770 | ECS | Orals | HS6.11

Mapping the vegetation disturbances over the Tibetan Plateau 

Yanyu Wang, Hancheng Guo, Xiaoyong Xu, Yuhong He, and Zhou Shi

The Tibetan Plateau is one of the most sensitive areas responding to global environmental changes, especially global climate change, and has thus been deemed an important indicator of global change. The vegetated areas in Tibetan Plateau are expected to respond to environmental change because vegetation cover is a key part of the ecosystem. However, the vegetation disturbance behavior in the region remains poorly understood. Since the various change detection algorithms perform differently across complex natural systems, the combination of different approaches is currently a mainstream solution for better quantification of vegetation disturbances. The main objective of this study was to map the vegetation disturbances across the Tibetan Plateau using satellite data and a combination of change detection algorithms. We applied an ensemble strategy and satellite data to map the three decades of vegetation disturbances over the Tibetan Plateau. The two leading disturbance detection algorithms (Continuous Change Detection and Classification algorithm, CCDC; Landsat-based detection of Trends in Disturbance and Recovery algorithm, LandTrendr) were involved in the ensemble strategy with a Random Forests-based fusion for aggregating the classifiers. The reference data were taken from a total of 15,680 manually interpreted Landsat pixels, including 1,739 disturbed vegetation points, 3,696 stable vegetation points, and 10,245 non-vegetation points. It is found that a total area of about 105.83 M ha has experienced vegetation disturbance with considerable spatial variability across the Tibetan Plateau over the past three decades, and large differences among the disturbance patches were found. The identified unexpected scale of vegetation disturbance can further facilitate the understanding of the dramatic ecological changes in the ecologically fragile Tibetan Plateau region in response to climate change and more frequent human activities.

How to cite: Wang, Y., Guo, H., Xu, X., He, Y., and Shi, Z.: Mapping the vegetation disturbances over the Tibetan Plateau, EGU General Assembly 2023, Vienna, Austria, 23–28 Apr 2023, EGU23-16770, https://doi.org/10.5194/egusphere-egu23-16770, 2023.

This research utilized GeoSOS-FLUS model to simulate and predict the distribution of vegetation coverage grade in the Tibetan Plateau in the year 2035 under two scenarios: natural development scenario based on historical evolution projection, and ecological protection scenario based on limited transformation policy. First of all, future precipitation and maximum temperature are selected as the main driving factors, supplemented by other factors including relative humidity, sunshine hours, population spatial distribution, slope, slope aspect, elevation, distance to railway and distance to highway, etc.. The vegetation coverage grade of the Tibetan Plateau in 2003 is taken as the base period, and that in 2019 is taken as the end period. Then, a GeoSOS-FLUS prediction model is constructed, based on the cost matrix and neighborhood factors and other related parameters obtained from the two scenarios. Finally, the future vegetation coverage grade distribution in 2035 is predicted by using Markov chain.

The results indicated that:

 ( 1 ) From 1998 to 2019, the bare land of the Tibetan Plateau has the tendency of been transformed into low vegetation coverage, medium vegetation coverage or medium-high vegetation coverage, whereas the area of high vegetation coverage is decreasing.

( 2 ) Under the natural development scenario, the areas of the bare land, medium-high and high vegetation coverage of the Tibetan Plateau in 2035 will be reduced by about 2 % compared with the actual vegetation coverage in 2019; the areas of low and medium vegetation coverage will be increased by 2.8 % and 10.3 % respectively. Under this scenario, the vegetation coverage evolution of the Tibetan Plateau bears a positive trend, although the trend will be weakened compared to the historical period.

( 3 ) Under the ecological protection scenario, compared with the natural development scenario, the areas of bare land and high vegetation coverage will decrease, and the area of low, medium and medium-high vegetation coverage of the Tibetan Plateau in 2035 will increase. Compared with the results predicted under the natural development scenario, under the ecological protection scenario, the improvement of future vegetation coverage of the Tibetan Plateau is very obvious, and the improvement is mainly contributed by the increase of medium vegetation coverage.

How to cite: Dong, X. and Gong, C.: Simulation of Future Vegetation Coverage Prediction under Different Development Scenarios in the Tibetan Plateau, EGU General Assembly 2023, Vienna, Austria, 23–28 Apr 2023, EGU23-17136, https://doi.org/10.5194/egusphere-egu23-17136, 2023.

In this study, SAR (Synthetic Aperture Radar) images are used to validate a method for extracting the waterbody from small and medium-sized streams based on the shortest plane distance (DST). The research area is the Hantangang River and Jungnangcheon in the Hangang River Basin of South Korea. To validate the water body extraction method, SAR satellite image data (Sentinel-1) and high-resolution optical satellite PlanetScope are employed concurrently. After preprocessing, the brightness distribution of the Sentinel-1 photos is equalized using histogram matching. To achieve an efficient stream extraction, a weight is applied that is the DST from the stream centerline. The optimal parameter value is obtained using the k-means method after combining this weight value with Sentinel-1's VH and VV polarizations. Depending on the resolution limit, this value allows the waterbody to be extracted with maximum accuracy from Sentinel-1 images. The waterbody extraction can be calculated using an elliptic equation based on the correlation between the VV, VH, and DST. Results show that the average accuracy is 0.45-0.75, and the average Kappa coefficient is 0.60-0.85. This study demonstrates that the DST can be used to estimate the area of a waterbody. Furthermore, the proposed method extracts the waterbody more easily and quickly than the existing method.

This work was supported by the National Research Foundation of Korea(NRF) grant funded by the Korea government(MSIT) (No. NRF-2021R1A2C2003471).

How to cite: Kim, S. and Kim, D.: Waterbody Extraction from Small and Medium-Sized Streams Using Sentinel-1 Images Based on Shortest Plane Distance, EGU General Assembly 2023, Vienna, Austria, 23–28 Apr 2023, EGU23-332, https://doi.org/10.5194/egusphere-egu23-332, 2023.

The conventional methods used for determination of soil moisture and electrical conductivity are tedious and laborious. It leads to the imperative need to use soil moisture and electrical conductivity sensor and logging to collect the real time data set. These devices detect the change in saturation and salinity levels of the soil. This data has huge application in the precision agriculture, optimised irrigation, soil moisture monitoring and fertilizer application etc. However, the optimal number of sensors and the associated error curtailment is of great significance but cumbersome. Therefore, this study proposes a benchmarking approach to identify the optimum number of sensors required for field scale operations based on feedback from sensor performance under varying range of working conditions such as saturation percentage, salinity and temperature. The experiments were conducted in controlled temperature conditions varying from 2 to 45˚C. The sensor arrays from minimum of three to nine were grouped to collect moisture, salinity and temperature data and associated error. Overlaying the full-scale error band and 95% confidence interval produced by the sensitivity analysis used in determining the outliers. Analysing the sensitivity plots for various sensor combinations suggested seven sensors as the optimum number to minimise the error. Further, these sensors were deployed in gridded heterogenous medium tank for continuous datalogging to study the variation in salinity.

How to cite: Chandel, A. and Swami, D.: Determination of optimal number of Soil moisture and electrical conductivity sensors deployment in field, EGU General Assembly 2023, Vienna, Austria, 23–28 Apr 2023, EGU23-369, https://doi.org/10.5194/egusphere-egu23-369, 2023.

Continuous streamflow prediction in ungauged basin and the quantification of its uncertainty has been challenging over the decades. Regionalization of parameters from gauged basin has been the most promising approach adopted by the researchers. However, the improvement of hydrological model prediction in regionalization with proper alternative observed data has been constantly explored. Various researchers have used remote sensing based products such as soil moisture and evapotranspiration as variables for calibration of hydrological models. While the regionalization based approach result in higher predictive uncertainty, performance of models calibrated using remote sensing products have been found to be sub-optimal. In this context, a combined approach of regionalization and remote sensing data may result in reduced predictive uncertainty and enhanced accuracy. In this study the predictive uncertainty quantification in ungauged basin is proposed using the regression-based regionalization framework between the catchment attributes and probability distribution function (PDF) of hydrological model parameters. The PDF of the hydrological model parameters is derived using the MCMC procedure in the DREAM algorithm. The proposed approach is evaluated using the data pertaining to 12 watersheds in the MOPEX database and assuming one of the catchments as pseudo-ungauged catchment. The uncertainty quantification in regionalization for streamflow prediction analysed by average of the prediction is better performing with NSE of 0.77 in pseudo ungauged basin (Sugar Creek EdinBurgh watershed). Further, the remote sensing soil moisture from GLDAS was compared with the model simulated soil moisture analysed using NSE to sub sample the regionalization parameter space in ungauged basin. The regionalization of the reduced parameter set to assess the change in uncertainty quantification is performed and found to have same performance NSE of 0.77 in ungauged basin for streamflow prediction with reduction in average width of 0.23 mm/day in ensembles of streamflow prediction. The ensemble of the simulations has similar performance compared to the model calibrated using streamflow (NSE 0.77). The outcome of the study indicates that the calibration of hydrological model using remote sensing soil moisture product as simulating variable have improved performance the model prediction in the parameter range obtained from the regionalization framework in the ungauged basin. Thus, the integration of regionalization approach with simulation of hydrological model using remote sensing products in the ungauged basin is recommended to apply in the real time applications of water resources management.

How to cite: Vema, V. and Pattabiraman, B.: Application of Soil moisture in Regionalization framework for Predictions in Ungauged Basin and its Uncertainty quantification, EGU General Assembly 2023, Vienna, Austria, 23–28 Apr 2023, EGU23-400, https://doi.org/10.5194/egusphere-egu23-400, 2023.

EGU23-3065 | ECS | Posters on site | HS6.12

Impacts of Precipitation Forcing on Hydrological Simulation over Monsoon Asia 

seulchan lee, jaehwan jeong, Nurul Syahira Mohammad Harmay, and minha choi

Globally important hydroclimatic variations take place over monsoon Asia. However, sound understanding of hydrological processes is still challenging due to the unevenly distributed observation stations. This rising issue has been partially solved through land surface model (LSM) simulations, which is known as one of the most effective ways to predict hydrological states and fluxes in ungauged regions. Recent advances in remote sensing techniques produced several multi-source-based precipitation data, which serves as a major input forcing for modeling the land surface processes. In this context, this study aims to validate the precipitation estimates from Modern-Era Retrospective analysis for Research and Applications version 2 (MERRA2), Global Data Assimilation System (GDAS), Integrated Multi-satellite Retrievals for GPM (IMERG), and Climate Hazards Group InfraRed Precipitation with Station data (CHIRPS), and also evaluate the LSM-simulated soil moisture (SM) and evapotranspiration (ET) through NASA Land Information System (LIS). Precipitation products are validated with ground measurements-based Asian Precipitation - Highly-Resolved Observational Data Integration Towards Evaluation (APHRODITE) gridded data. Spatiotemporal errors in SM and ET outputs originating from precipitation uncertainty are quantified at locations with dense ground precipitation observations. Overall, the outcomes could possibly reveal additional error sources such as land use land cover (LULC) surface dataset or model parameterizations, which is crucial for more sophisticated LSM simulations.

How to cite: lee, S., jeong, J., Mohammad Harmay, N. S., and choi, M.: Impacts of Precipitation Forcing on Hydrological Simulation over Monsoon Asia, EGU General Assembly 2023, Vienna, Austria, 23–28 Apr 2023, EGU23-3065, https://doi.org/10.5194/egusphere-egu23-3065, 2023.

EGU23-3327 | ECS | Orals | HS6.12

Water and Energy budgets on short and long timescales 

Samantha Petch, Keith Haines, Rob King, Bo Dong, and Tristan Quaife

We have aimed to improve the understanding of regional water and energy budgets in large catchments from observations, focusing on the period 2002-2013. To do this we have utilised new available satellite data from the Gravity Recovery and Climate Experiment (GRACE).  Despite recent improvements in remote sensing capabilities, we still see inconsistencies amongst datasets. Observed surface energy fluxes from CERES and FluxCOM indicate unrealistic increases/decreases in surface energy storage over different catchments. We also see imbalances in the water budget, suggesting inaccuracies in the measurements. In order to assess these imbalances, we introduce a flux-inferred surface storage (FIS) for both water and energy, based on integrating the flux observations. This exposes mismatches in seasonal water storage as well as important interannual variability. We have produced optimised estimates for each component of the terrestrial water and energy budgets based on observations and their relative uncertainties. Our new optimisation approach ensures that flux estimates are consistent with total water storage changes from GRACE on short (monthly) and longer timescales, while also balancing a coupled long term energy budget. Flux adjustments remain small and are evaluated using a chi squared test. By using multiple data products, the optimisation reduces formal uncertainties on the budget variables. When compared with results from previous literature, our estimates show good agreement with GRACE variability and trends on account of the multiple timescale constraints imposed during the optimisation. We next aim to extend our approach to include carbon budgets alongside the water and energy budgets to produce a truly coupled Earth system cycling analysis, with applications such as testing Earth and climate circulation models.

How to cite: Petch, S., Haines, K., King, R., Dong, B., and Quaife, T.: Water and Energy budgets on short and long timescales, EGU General Assembly 2023, Vienna, Austria, 23–28 Apr 2023, EGU23-3327, https://doi.org/10.5194/egusphere-egu23-3327, 2023.

EGU23-3478 | ECS | Orals | HS6.12 | Highlight

Synthetic hydrological data consistent with climate reanalysis to enable long-term hydrological modelling 

Loïc Gerber and Grégoire Mariéthoz

High-density gauging station networks and complete hydrological time-series are needed to adequately model and manage water resources and assess the effects of climate change on hydrological processes. In data scarce regions however, remote sensing data has proven to be a viable alternative, but before the year 2000 satellite records often contain gaps or are not available at all.

We propose to create synthetic images of precipitation, temperature, evapotranspiration, and terrestrial water storage products to complete and extend past data availability to pre-satellite periods. Ideally, the synthetic images should be indistinguishable from real satellite acquisitions. The approach used is based on the relation between meteorological predictors and available satellite images, and the hypothesis that, under similar meteorological conditions, patterns of a particular process may be repeated over the years. Using ERA5 reanalysis data as meteorological predictor, a K-Nearest Neighbor algorithm associated with a process-specific similarity metric is applied to create synthetic images of the different satellite products.

The approach is tested on the Volta River Basin in West Africa, where water resources for millions of people are critically stressed by the effects of climate change. For calibration and validation, the synthetic images are fed to a spatially-distributed hydrological model (the mesoscale Hydrologic Model mHM). Their quality is assessed by their capacity to reproduce historical streamflow time series. This test phase allows improving the generation technique to obtain synthetic imagery that can be considered a reasonable approximate of unobserved processes consistent with the available climate data, and which will help improve modelling accuracy.

Keywords: Remote sensing, Climate reanalysis, Satellite time series, Hydrological modelling

How to cite: Gerber, L. and Mariéthoz, G.: Synthetic hydrological data consistent with climate reanalysis to enable long-term hydrological modelling, EGU General Assembly 2023, Vienna, Austria, 23–28 Apr 2023, EGU23-3478, https://doi.org/10.5194/egusphere-egu23-3478, 2023.

EGU23-5839 | ECS | Posters on site | HS6.12

High resolution soil moisture drought monitoring over Luxembourg 

Theresa C. van Hateren, Marco Chini, Patrick Matgen, and Adriaan J. Teuling

With the emergence of accurate high resolution remotely sensed datasets of hydrological variables, opportunities arise to study hydrological processes at an unprecedented scale and resolution. We took this opportunity to study spatiotemporal drought patterns over the country of Luxembourg. A daily 100x100 m2 soil moisture dataset based on the VanderSat technologya will be analysed in conjunction with a 6-day 60x60 m2 soil moisture dataset retrieved from Sentinel-1 data (Pulvirenti et al., 2018; van Hateren et al., 2021), and the Copernicus 1x1 km2 daily soil moisture product based on the TU Wien algorithmb. First of all, the consistency between the different products will be tested, as well as their ability to resolve small-scale variability in soil moisture. Then, the soil moisture products are compared to in situ soil moisture data, meteorological data and vegetation indices during major droughts in the last decade (2018, 2022). We will compare small scale spatial and temporal patterns of drought indices with land use, geology and elevation to see how the indices developed during these droughts and how they depend on the local landscape.

ahttps://data.public.lu/en/datasets/soil-humidity-in-luxembourg-2002-2022/

bhttps://land.copernicus.eu/global/products/ssm

Pulvirenti, L. et al., ‘A Surface Soil Moisture Mapping Service at National (Italian) Scale Based on Sentinel-1 Data’, Environmental Modelling & Software 102 (April 2018): 13–28, https://doi-org.ezproxy.library.wur.nl/10.1016/j.envsoft.2017.12.022.

van Hateren, T.C. et al., ‘Optimal Spatial Resolution of Sentinel-1 Surface Soil Moisture Evaluated Using Intensive in Situ Observations’, in 2021 IEEE International Geoscience and Remote Sensing Symposium IGARSS, 2021, 6311–14, https://doi-org.ezproxy.library.wur.nl/10.1109/IGARSS47720.2021.9553041.

How to cite: van Hateren, T. C., Chini, M., Matgen, P., and Teuling, A. J.: High resolution soil moisture drought monitoring over Luxembourg, EGU General Assembly 2023, Vienna, Austria, 23–28 Apr 2023, EGU23-5839, https://doi.org/10.5194/egusphere-egu23-5839, 2023.

EGU23-8115 | ECS | Posters on site | HS6.12

A multi-objective approach for calibrating the FLEXG model to improve glacio-hydrological modelling 

Babak Mohammadi, Hongkai Gao, Zijing Feng, Petter Pilesjö, and Zheng Duan

Hydrological models as common simulation tools for water resources management play a key role in improving our understanding of hydrological processes on the catchment and global scales. The reliability of hydrological simulations depends on the model structure, the quality of input data, and the calibration of model parameters. A large number of model parameters and interactions among each hydrological variable increase the complexity of the model calibration. Multi-objective model calibration is beneficial to reduce hydrological modeling uncertainty by different calibration criteria, which can lead to more realistic simulations. The FLEXG model is a conceptual glacio-hydrological model within the flexible modeling framework. The FLEXG model considers the effects of topography on the spatial distribution of temperature, precipitation, and runoff generation to have a better understanding of the impacts of landscape on hydrological processes. The FLEXG can simulate various glacio-hydrological variables such as runoff from different sources (e.g. snow and glacier melt), glacier mass balance, snow cover area, and snow water equivalent. This study aims to evaluate the influences of several calibration strategies on the FLEXG model's performance in simulating simulated runoff, snow cover area, glacier mass balance, and snow water equivalent in a glacierized catchment in Sweden. To this end, the FLEXG model was calibrated based on remotely sensed snow cover area data and compared to the traditional calibration strategy (calibrating merely against gauged streamflow data). The FLEXG model was also calibrated based on both gauged streamflow data and satellite snow cover area data as a multi-objective calibration. Glacio-hydrological simulations from the FLEXG model using different calibration strategies were evaluated with multiple metrics and at different temporal scales. Results showed that calibrating the FLEXG using only one variable (runoff or snow cover area) can provide acceptable results for only one variable, while the multi-objective calibration strategy can have acceptable simulation for both runoff and snow cover area. In addition, calibrating the FLEXG model using only snow cover area may underestimate runoff simulation.

How to cite: Mohammadi, B., Gao, H., Feng, Z., Pilesjö, P., and Duan, Z.: A multi-objective approach for calibrating the FLEXG model to improve glacio-hydrological modelling, EGU General Assembly 2023, Vienna, Austria, 23–28 Apr 2023, EGU23-8115, https://doi.org/10.5194/egusphere-egu23-8115, 2023.

To monitor aquatic habitats and understand physical and biogeochemical processes, the analysis of high-resolution spatial patterns in water temperature is of outmost importance. The spatial resolution of remotely sensed thermal infrared (TIR) data ranges from cm-scale for airborne to m- and km-scale for spaceborne observations, enabling the analysis of a variety of hydrological processes. However, while remotely sensed TIR data reflects temperatures emitted from the direct surface, the temperature of waterbodies may also vary significantly with depth. Hence, there are limits to relying purely on remotely sensed water temperature data to understand 3D water temperature patterns, leading to the need of high-resolution 3D water temperature data.

Here, we combined a novel self-build in-situ sensor system with remotely sensed TIR data to explore high-resolution, natural and anthropogenically influenced 3D spatio-temporal patterns in river water temperature. The study site involved a ~780 m long stretch of a river in the Northeast of Scotland, with a smaller section (~50m long) that is influenced by cooling water being discharged from a local distillery. We applied our new observation system to gain a better understanding on the 3D extend of a thermal plume and how this local anomaly compares to and affects the overall thermal variability within the river. Three surveys were conducted (during April-June 2021) to measure the surface water temperature of the river with an UAV based TIR camera. We additionally installed the novel in-situ sensor system to measure 3D water temperature during each survey. The surveys were planned to acquire data under contrasting ambient conditions as well as at a time when no cooling water was being discharged, allowing us to also observe spatio-temporal thermal variability under natural conditions. While the acquired TIR datasets give an overall view of the thermal variability at the surface, subsets of the TIR datasets were merged with the corresponding data from the in-situ sensor system to spatially interpolate high resolution 3D water temperature of the area influenced by the thermal plume. The results show that (I) the combination of remote sensing and sensor system can detect pattern in 3D in high spatial resolution, (II) surface temperatures and their spatial patterns differ from temperatures and their spatial patterns at greater depth and (III) at this site, local anomalies due to cooling water releases do not alter the overall thermal variability within the river.

The combination of the novel sensor system with remotely sensed TIR data has the potential to be used to observe a broad range of hydrological processes in natural and artificial aquatic environments and to contribute to the understanding of overall energy budgets, infiltration, limnology, groundwater surface water exchange or similar processes.

How to cite: Loerke, E., Geris, J., Pohle, I., and Wilkinson, M.: Combining a novel in-situ sensor system with remotely sensed thermal infrared data to analyse spatial water temperature patterns in 3D, EGU General Assembly 2023, Vienna, Austria, 23–28 Apr 2023, EGU23-8336, https://doi.org/10.5194/egusphere-egu23-8336, 2023.

EGU23-9631 | Orals | HS6.12

Combining OPERA Dynamic Surface Water Extent (DSWx) with in situ measurements to improve product development and application 

John Jones, Sheel Bansal, Jacob Meier, and Christopher Pearl

NASA created the Observational Products for End-Users from Remote Sensing Analysis (OPERA) project to develop satellite-based analysis ready data products for resource management, environmental protection, and science. The OPERA product that is focused on inland surface water detection, Dynamic Surface Water Extent (DSWx), will be produced using data from both optical and synthetic aperture RADAR systems. The first DSWx product release (DSWx-HLS) relies on Harmonized Landsat Sentinel-2 (HLS) data to yield a median observation frequency of 3 days at the equator with near-global coverage. Subsequent DSWx releases will be based on inputs from Sentinel-1, Surface Water Ocean Topography (SWOT), and NASA-ISRO Synthetic Aperture Radar (NISAR).

DSWx accuracy in monitoring open water bodies is estimated through comparison with coincident, higher spatial resolution satellite imagery for locations around the globe. DSWx product suite algorithms also target the detection of mixtures of water and vegetation at input data subpixel scale as well as water under vegetation. The accurate assessment of algorithm performance given these especially challenging targets requires the development and analysis of databases that have as a foundation, data collected in the field.

A DSWx predecessor (USGS DSWE) and provisional DSWx data have been combined with in situ data on river discharge, aquatic species occurrence, water quality, and wetland processes to test and develop product utility. At sites spread across the US, low-cost sensors have been employed to record surface inundation. Trail cameras adapted for scientific research are providing useful information on weather, vegetation, and water conditions. Imagery from multiple high-resolution remote sensing instruments, including uncrewed aerial systems and commercial satellites, as well as sensors on-board the International Space Station, are being periodically collected. During intensive field campaigns, vegetation structure is being measured at each site. The imagery and in situ data are combined to improve DSWx development, uncertainty assessment, and application.

How to cite: Jones, J., Bansal, S., Meier, J., and Pearl, C.: Combining OPERA Dynamic Surface Water Extent (DSWx) with in situ measurements to improve product development and application, EGU General Assembly 2023, Vienna, Austria, 23–28 Apr 2023, EGU23-9631, https://doi.org/10.5194/egusphere-egu23-9631, 2023.

EGU23-10483 | ECS | Posters on site | HS6.12

Evaluation of a global precipitation product in the hydrological modeling of a river in the Amazon basin. 

André Luiz de Campos, Reinaldo Bomfim da Silveira, José Eduardo Gonçalves, Nathalli Rogiski da Silva, Leandro Ávila Rangel, Camila Freitas, Cassia Silmara Aver Paranhos, and Fernando Mainardi Fan

In rainfall-runoff modeling, the main input variable is precipitation, and the understanding of its temporal and spatial variation is the key for good hydrological simulation results. Conventionally, the precipitated volumes are measured by rain gauges, which are representative of its surroundings and, consequently, it is necessary to apply extrapolation techniques to obtain data in ungauged regions. However, classical techniques are based on mathematical interpolation and do not consider the physical evidence for the occurrence of precipitation. Remote sensing represents a valuable alternative to hydrological modeling due to its wide coverage, and from observations by meteorological satellites and radars, quantitative precipitation estimation is possible. In this sense, the integrated use of data from rain gauges and remote sensing has the potential to improve the accuracy of hydrological simulations. This study aims to evaluate the performance of a hydrological model in the Colider River basin (Brazil), when calibrated with a global product that provides precipitation data based on rain gauges observations, satellite and weather radar. The model used was the MGB-IPH and the data source of precipitation was MSWEP (Multi-Source Weighted-Ensemble Precipitation). Two different calibrations were performed: the first, considering only the precipitation data from rain gauges; the second, considering the precipitation estimated by the product. The comparison between the rain datasets indicates that MSWEP tends to overestimate the precipitation in most cases, except during periods of considerable drought, when it underestimates. Nevertheless, the results in the hydrological simulation were satisfactory, with the model calibrated with MSWEP presenting equivalente or slightly better performance metrics than the one with conventional data. This is an indication that the continuous development of remote sensing products can be the key to increase the reliability of tools that comprise hydrological modeling, such as forecasting hydrological events, climatic hazards and also commercialization of electric energy.

Acknowledgments: This work presents part of the results obtained during the project granted by the Brazilian National Electricity Regulatory Agency (ANEEL) under its Research and Development Project PD 6491-0503/2018 – “Previsão Hidroclimática com Abrangência no Sistema Interligado Nacional de Energia Elétrica” developed by the Paraná State electric company (COPEL GeT), the Meteorological System of Paraná (SIMEPAR) and the RHAMA Consulting company.

How to cite: de Campos, A. L., da Silveira, R. B., Gonçalves, J. E., da Silva, N. R., Rangel, L. Á., Freitas, C., Paranhos, C. S. A., and Fan, F. M.: Evaluation of a global precipitation product in the hydrological modeling of a river in the Amazon basin., EGU General Assembly 2023, Vienna, Austria, 23–28 Apr 2023, EGU23-10483, https://doi.org/10.5194/egusphere-egu23-10483, 2023.

EGU23-11055 | Posters on site | HS6.12

Characterization of lake-catchments leveraging remote sensing data 

Junzhi Liu

The management and conservation of lakes should be conducted in the context of catchments because lakes collect water and materials from their upstream catchments. Thus, the datasets of catchment-level characteristics are essential for limnology studies. Remote sensing is an important data source for the characterization of lake-catchments. Leveraging remote sensing data, we constructed the first dataset of lake-catchment characteristics for 1525 lakes with areas from 0.2 to 4503 km2 on the TP. Considering that large lakes block the transport of materials from upstream to downstream, lake catchments are delineated in two ways: the full catchment, which refers to the full upstream-contributing area of each lake, and the inter-lake catchments, which are obtained by excluding the contributing areas of upstream lakes larger than 0.2 km2 from the full catchment. There are six categories (i.e., lake body, topography, climate, land cover/use, soil and geology, and anthropogenic activity) and a total of 721 attributes in the dataset. Besides multi-year average attributes, the time series of 16 hydrological and meteorological variables are extracted, which can be used to drive or validate lumped hydrological models and machine learning models for hydrological simulation. The dataset contains fundamental information for analyzing the impact of catchment-level characteristics on lake properties, which on the one hand, can deepen our understanding of the drivers of lake environment change, and on the other hand can be used to predict the water and sediment properties in unsampled lakes based on limited samples. This provides exciting opportunities for lake studies in a spatially explicit context and promotes the development of landscape limnology on the TP. The details of this dataset can be found in our paper published in Earth Syst. Sci. Data (https://doi.org/10.5194/essd-14-3791-2022).

How to cite: Liu, J.: Characterization of lake-catchments leveraging remote sensing data, EGU General Assembly 2023, Vienna, Austria, 23–28 Apr 2023, EGU23-11055, https://doi.org/10.5194/egusphere-egu23-11055, 2023.

EGU23-11313 | ECS | Orals | HS6.12

Accounting for flux footprint to enhance the representativeness between remote sensing and in-situ data 

Alex Kobayashi, Jamil Anache, Jullian Sone, Gabriela Gesualdo, Dimaghi Schwamback, and Edson Wendland

The Brazilian Cerrado ecoregion, or wooded Cerrado, is considered one of the biodiversity hotspots. Despite the region’s importance in terms of supplying the water, food, and energy demand, there have not been enough ground-based studies. Furthermore, the lack of validation due to scale incompatibility and the great site-specific heterogeneity transpires in difficulty in the validation process.

The eddy covariance method has the potential to directly measure water vapor or trace gases on an in situ scale. Their measurement directly reflects the surrounding study site; thus, each time interval has a corresponding footprint. So, each study site's heterogeneity can affect the target vegetation's representativeness.

Here, we aimed to assess how two approaches for integrating remote sensing products and in-situ data affected representativeness in the wooded Cerrado. We used the Enhanced Vegetation Index (EVI) in both approaches, which are described as follows: (i) a fixed-fetch approach of the surrounding area considering a radius of 2 km and (ii) a lagrangian footprint approach that varied by a 30-minute time interval.  We assessed their performance based on their hourly and seasonal association with canopy conductance, which was carried out using in-situ data.

Compared to the fixed-fetch technique, the EVI footprint-integrated approach has a smaller range between the lower and upper quantiles, which is indicative of better targeting of the vegetation. Furthermore, we discovered that the integrated footprint technique produced a stronger association between EVI and canopy conductance than the fixed-fetch approach throughout most seasons and examined hours. The difference is most pronounced in the winter season, reaching a gain in the correlation of almost 100%, and for the autumn and spring with consistent gains of about 30%. Our findings highlight that integrating remote sensing products with footprint analysis can significantly improve the analysis's representativeness when targeting a specific land use or land cover, hence improving understanding of complex and heterogeneous areas.

How to cite: Kobayashi, A., Anache, J., Sone, J., Gesualdo, G., Schwamback, D., and Wendland, E.: Accounting for flux footprint to enhance the representativeness between remote sensing and in-situ data, EGU General Assembly 2023, Vienna, Austria, 23–28 Apr 2023, EGU23-11313, https://doi.org/10.5194/egusphere-egu23-11313, 2023.

EGU23-11543 | ECS | Orals | HS6.12

Regression-based regionalisation of hydrological parameters using catchment’s spectral signature 

Laura Fragoso-Campón, Pablo Durán-Barroso, and Elia Quirós

Water resources management is difficult due to the uncertainties of the parameters controlling the hydrological response and, this uncertainty is even greater in ungauged basins where parameters are generally defined by regionalisation approaches. Among the available methods, one of the most used is the regression-based approach, which relates the most appropriate parameter values to catchment properties, such as physical properties, topographic, land use, soil and geological data. This approach assumes that the hydrological response depends on the catchment attributes and the hydrological response in catchments with similar characteristics is meant to be similar, and traditionally, these properties are derived from cartographic data sources. Since the spectral response of the territory depends on these attributes, this study uses remote sensing techniques to characterise the spectral response and apply it to the regionalisation of hydrological parameters using a machine learning approach with Random Forest.

The study area is a Mediterranean environment in Spain and corresponds to eighteen gauged watersheds in the region of Extremadura, in which we find two bioclimatic variants: a wetter and a drier one. In this study the algorithm is tested in two scenarios for regionalisation, the new approach using the spectral signature of the catchments and the results are compared with the traditional approach using the physical properties from data provided by the European Soil Data Centre. The spectral response of the catchments is studied using images from the Sentinel-1 (S1) and Sentinel-2 (S2) missions of the Copernicus Program of the European Commission. S1 is a synthetic aperture radar (SAR) sensor (C-band ) and S2 is a multispectral sensor working in the visible, near-infrared and shortwave infrared bands. In addition, several spectral indices and texture metrics derived from the grey-level cooccurrence matrix are also used for a better characterization of the watersheds.

The results perform well in both scenarios showing almost the same goodness of fit and the efficiency depends on the climatic environment. In this sense, the prediction in the wetter catchments exhibits better performance than the driest variant.  Specifically in the latter, the spectral regionalisation outperformed the physical scenario. The new spectral approach shows promising results, especially considering the advantage of having continuous coverage of Sentinel data worldwide, which offers new possibilities in areas where no mapping information is available.

How to cite: Fragoso-Campón, L., Durán-Barroso, P., and Quirós, E.: Regression-based regionalisation of hydrological parameters using catchment’s spectral signature, EGU General Assembly 2023, Vienna, Austria, 23–28 Apr 2023, EGU23-11543, https://doi.org/10.5194/egusphere-egu23-11543, 2023.

Seewinkel salt pans are a unique wetland ecosystem in eastern Austria that serves as habitat for a diverse range of e.g. birds and halophilic species. Due to groundwater drainage by channels and wells, the salt pans are in an increasingly vulnerable state as they are decisively conditioned by duration and timing of water abundance. However, water gauge data are merely given for three salt pans. The dynamics of salt pans in Seewinkel, locally referred to as Salzlacken, remain insufficiently understood in the context of continuously changing seasonal and long-term hydrological, meteorological, and climatological patterns. Based on previous results on salt pan mapping and monitoring, this work advances inundation state prediction for 34 salt pans by using high-resolution remote sensing data and machine learning methods. The random forest classification models build on hydrological and meteorological predictors in 12-monthly temporal resolution, as, e.g., reduced precipitation sums during the preceding winter season affect the recharge rates of salt pans and groundwater and, as a result, drying state in summer. Four models predict summer drying state at respective four points in time, namely in March, April, May, and June of each year between 1984 and 2022. We first show that remotely sensed water extent products, retrieved from Landsat data can serve as a target variable for data-driven modelling of small-scale salt pan water-dynamics. Secondly, we show that the applied models can successfully predict summer drying state and inundation periods of individual salt pans achieving a maximum F1-score of 0.81. Finally, it is demonstrated that very similar model results can be attained without in-situ groundwater measurements. Research based on water gauge measurements with similar model-designs has been done in the context of lakes, whereas the combination of satellite-derived water extent and salt pans, especially for ecosystems of small size, remains underrepresented. As the data retrieval in this work is based on global and freely available remote sensing data, this method is transferable to comparable salt pan ecosystems in other parts of the world. 

How to cite: Schauer, H. I., Schlaffer, S., Bueechi, E., and Dorigo, W.: Data-Driven Modelling of Steppe Wetland Variability in Eastern Austrian Seewinkel Using Satellite-Derived Water Extent and Climatological and Groundwater Data, EGU General Assembly 2023, Vienna, Austria, 23–28 Apr 2023, EGU23-12314, https://doi.org/10.5194/egusphere-egu23-12314, 2023.

EGU23-12695 | ECS | Posters on site | HS6.12

ERA5-Land Data: New Possibilities in Hydrological Modelling and Water Resources Assessment in the Data-Scarce Regions of Sub-Saharan Africa 

Harriette Adhiambo Okal, Peter Molnar, Darcy Molnar, Sukhmani Mantel, Denis Hughes, and Jane Tanner

Successful application of hydrological models requires data to assess the validity, as well as the inherent uncertainty, of the outputs, most importantly streamflow. In parts of Sub-Saharan Africa (SSA), such data is often lacking. Therefore, it is frequently challenging to find the necessary resources for setting up a robust hydrological model and hydrological monitoring platforms. In data-scarce regions within SSA, ground data required to model and make water resources decisions are not always available and therefore, some form of alternative data sources and simplified modelling approaches are required. In recent years, satellite and climate reanalysis data have been intensely explored for watershed modelling in poorly gauged regions with variables such as precipitation, evapotranspiration, soil moisture, runoff etc. Very good potential is provided by the ERA5-Land dataset which is considered one of the best freely available global products for hydrology given its 0.1° x 0.1° spatial resolution and an hourly to monthly temporal resolution spanning from 1950 till present. Here, ERA-5 Land input on a monthly resolution was assessed in the Berg River Basin, South Africa using the Modified PITMAN model. Total precipitation, runoff, and potential evapotranspiration for each of the basin’s 12 quaternary catchments were retrieved using the Google Earth Engine platform for a study period of 40 years (1981-2021). A validation period of 20 years (1985-2005) was used corresponding to the freely available streamflow data. The assimilation of ERA5-Land precipitation data showed satisfactory results across the basin with the best results in the upstream catchment (G10A) with a 0.634 coefficient of efficiency and 0.404 KGE during the initial run. However, runoff for the downstream catchments (G10K) gave positive biases in high-flow months. This paper gives a detailed analysis of the performance of remotely sensed datasets (ERA5-Land) on catchments with varying climatic, land use and cover, water use, and geomorphological characteristics, therefore, offering a valuable reference for its applications in understanding hydrological processes in different river basins across SSA.

How to cite: Okal, H. A., Molnar, P., Molnar, D., Mantel, S., Hughes, D., and Tanner, J.: ERA5-Land Data: New Possibilities in Hydrological Modelling and Water Resources Assessment in the Data-Scarce Regions of Sub-Saharan Africa, EGU General Assembly 2023, Vienna, Austria, 23–28 Apr 2023, EGU23-12695, https://doi.org/10.5194/egusphere-egu23-12695, 2023.

EGU23-13733 | Orals | HS6.12

Mapping suspended sediment dynamics in the Pantanal wetland using remote sensing and ANN-based models 

Juliana Andrade Campos, Alice César Fassoni-Andrade, Olavo Correa Pedrollo, Thais Fujita, Luz Adriana Cuartas, Eeva Bruun, Jenni Attila, and Cintia Bertacchi Uvo

The Pantanal is the largest tropical wetland on earth, covering an area of 158000 km² between Brazil (~70%), Bolivia (~20%) and Paraguay (~10%). The regular flood pulse of this region produces unique ecological and geomorphological processes in the floodplains. Due to the extensive areas with flat topography, the water velocity of the rivers gets reduced, and large sediment deposition processes begin to take place in the Pantanal floodplain. Despite its unique characteristics and great environmental importance, the rivers from this region have very scarce in situ monitoring of suspended sediment concentration (SSC), with approximately one gauge per 8000 km2, and experiences low collection frequency (average of four measurements per year). Therefore, the characterization of sediment dynamics in this region remains challenging, and the spatial-temporal variation of suspended sediments in the Pantanal rivers is still poorly understood.

Remote sensing techniques offer enormous advantages by providing cost-effective systematic observations of large water systems, allowing spatial-temporal mapping of wild areas such as the Pantanal. The suspended matter in water bodies increases the reflectance in the green, red, and near-infrared (NIR) bands, i.e., the backscatter radiation increases as the SSC in water increases. Therefore, reflectance from the visible bands and NIR band can be used as proxies of SSC in water bodies.

The focus of this study is to assess the spatial-temporal variations of SSC in rivers that drain to and through the Pantanal wetland, by using surface reflectance (SR) from satellite images and artificial neural network (ANN)-based models. We used atmospherically corrected SR from Sentinel-2, Landsat 8, and Landsat 9 (bands of blue, green, red and NIR) as input variables, and in situ data on SSC from 23 gauges along the Pantanal rivers as output variables in the models.

Through this methodology, we expect to obtain time series of SSC estimated by the ANN-based model and reflectance data from satellite images for different parts of the Pantanal hydrographic basin.

The resulting time series allows us to:

  • Characterize the spatial variations of suspended sediments along different rivers in the Pantanal wetland.
  • Identify the main drivers of these spatial variations by comparing these differences with land use, vegetation cover, topography, and types of soil within the drainage watershed of the rivers.
  • Characterize the influence of the seasonal hydrological regime on SSC transport.
  • Identify the influence of anthropic activities on the amount of SSC transported to the wetland.

How to cite: Campos, J. A., Fassoni-Andrade, A. C., Pedrollo, O. C., Fujita, T., Cuartas, L. A., Bruun, E., Attila, J., and Uvo, C. B.: Mapping suspended sediment dynamics in the Pantanal wetland using remote sensing and ANN-based models, EGU General Assembly 2023, Vienna, Austria, 23–28 Apr 2023, EGU23-13733, https://doi.org/10.5194/egusphere-egu23-13733, 2023.

EGU23-14778 | Orals | HS6.12 | Highlight

Probabilistic regionalization of soil moisture data measured by Rail-based cosmic ray neutron sensing 

Daniel Altdorff, Ségolène Dega, Martin Schrön, Sascha Oswald, Steffen Zacharias, Peter Dietrich, Sabine Attinger, and Hendrik Paasche

Information about soil water content (SWC) in adequate spatial and temporal resolution is highly desired for a variety of scientific and practical applications. Cosmic-Ray Neutron Sensing (CRNS) has become an established method for passive SWC data collection, providing SWC information over several hectares, either by stationary CRNS sensors (local continuous measurements) or by mobile CRNS roving (expanding the footprint on certain field campaign days). Recent approaches of automatic rail-based CRNS roving (Rail-CRNS) allowed to expand the monitored areas further up to the kilometer scale in high temporal resolution. While a pilot study on Rail-CRNS provided promising results along the railway track, currently in daily resolution, it also raised the question of how transferable these SWC data are for areas not directly adjacent to the footprints along the railway. In this study, we have tested the performance of SWC regionalization by probabilistic predictions based on Rail-CRNS derived SWC data. A Monte Carlo approach was applied in regression random forest, using static (e.g. topographical indices, soil properties) and dynamic (precipitation) predictors and quantified their impact on the prediction accuracy. Using daily SWC values from a ~ 9 km long railway at the Harz mountain, Germany, recorded by the Rail-CRNS between September 2021 and July 2022, we predicted the daily spatial SWC variation for an area of ~ 85 km² and a period of 300 days on a 250 x 250 m grid. The resulting maps of gravimetric soil moisture showed realistic pattern for both, spatial and temporal SWC variation. The maps resolved spatial variation as related to land cover, seasonal SWC dynamics and individual responses of single areas to wetting and drying periods. As the demonstrated data represented the outcome of a relatively narrow area as given by the limited training Rail-CRNS data, the extension of the proposed approach by expanding the railway networks, by future technical improvements and by the automatization of the workflow has the clear potential to offer near real time SWC products for the large scale (> 100 km). 

How to cite: Altdorff, D., Dega, S., Schrön, M., Oswald, S., Zacharias, S., Dietrich, P., Attinger, S., and Paasche, H.: Probabilistic regionalization of soil moisture data measured by Rail-based cosmic ray neutron sensing, EGU General Assembly 2023, Vienna, Austria, 23–28 Apr 2023, EGU23-14778, https://doi.org/10.5194/egusphere-egu23-14778, 2023.

HS7 – Precipitation and climate

EGU23-706 | ECS | PICO | HS7.1

Multi-scale comparison of rainfall measurement with the help of a disdrometer and a mini vertically pointing Doppler radar 

Mateus Seppe Silva, Rodrigo Vieira Casanova Monteiro, Jerry Jose, Auguste Gires, Ioulia Tchiguirinskaia, and Daniel Schertzer

Local rainfall measurements can be done in a significant range of methods which rely on very different underlying measurement concepts and assumptions. As an illustration, mechanical rain gauges collect small rainfall amounts; optical disdrometers assess size and velocity of each drop passing through a sampling area, while  Doppler sensors derive a rain rate from estimated average fall velocity. Hence, the quality of the measurements can vary a lot, depending on factors such as rain drop size, wind velocity, rain rate etc. Understanding the differences between various technologies enables us to determine the most reliable device depending on each raining condition. This research aims to compare the performance of two of those devices: the optical disdrometer Parsivel2 (manufactured by OTT) and a mini Doppler radar part of a mini Meteorological Station (manufactured by Thies). The comparison was done with two research focuses: by evaluating the scaling features of the fields measured by both instruments utilizing the framework of Universal Multifractals (UM) to have a performance assessment valid across scales and not only separated scales, and by analyzing the influence of physical parameters namely drop size, wind velocity and rainfall rate in the performance of the devices.

The data used was collected on a meteorological mast located in the Pays d’Othe wind farm, 110km southeast of Paris. This measurement campaign is part of the RW-Turb project (https://hmco.enpc.fr/portfolio-archive/rw-turb/; supported by the French National Research Agency (ANR-19-CE05-0022). The mast is operated with two sets of devices, one around 75m in height and the other around 45m. The observation time step of the Parsivel2 is of 30 seconds, and it measures full binned drop size and velocity distribution, while the mini station provides data (rainfall, 2D wind, temperature, pressure, humidity) with 1 second time step. In general, the mini-doppler radar is found to measure a smaller amount of rain with regards to the  Parsivel2. More precisely, we found that the mini doppler radar returned very low rain measurements when subjected to rain conditions with a bigger mean drop size (Dm), and that heavy wind was related to a non-detection of the field in situations with light rain. Scaling analysis enabled us to show that mini Doppler radar exhibited white noise from observation scale smaller than 4s. Hence, it was used only with large time steps. UM analysis also revealed different scaling behaviour for mini Doppler radar rain data at finer temporal resolution than that of Parsivel (30 s).


How to cite: Seppe Silva, M., Vieira Casanova Monteiro, R., Jose, J., Gires, A., Tchiguirinskaia, I., and Schertzer, D.: Multi-scale comparison of rainfall measurement with the help of a disdrometer and a mini vertically pointing Doppler radar, EGU General Assembly 2023, Vienna, Austria, 23–28 Apr 2023, EGU23-706, https://doi.org/10.5194/egusphere-egu23-706, 2023.

EGU23-2689 | PICO | HS7.1

Precipitation measurement based on satellite data and machine learning 

Lu Yi, Zhangyang Gao, Zhehui Shen, Haitao Lin, Zicheng Liu, Siqi Ma, Stan Z. Li, and Ling Li

Satellite infrared (IR) data, with high temporal resolution and wide coverages, have been commonly used in precipitation measurement. However, existing IR-based precipitation retrieval algorithms suffer from various problems such as overestimation in dry regions, poor performance in extreme rainfall events, and reliance on an empirical cloud-top brightness-rain rate relationship. To solve these problems, a deep learning model using a spherical convolutional neural network was constructed to properly represent the Earth's spherical surface. With data inputted directly from IR band 3, 4, and 6 of the operational Geostationary Operational Environmental Satellite (GOES), the new model of Precipitation Estimation based on IR data with Spherical Convolutional Neural Network (PEISCNN) was first trained, tested and validated. Compared to the commonly used IR-based precipitation product PERSIANN CCS (the Precipitation Estimation from Remotely Sensed Information Using Artificial Neural Network, Cloud Classification System), PEISCNN showed significant improvement in the metrics of POD, CSI, RMSE and CC, especially in the dry region and for extreme rainfall events. The PEISCNN model may provide a promising way to produce an improved IR-based precipitation product to benefit a wide range of hydrological applications.

How to cite: Yi, L., Gao, Z., Shen, Z., Lin, H., Liu, Z., Ma, S., Li, S. Z., and Li, L.: Precipitation measurement based on satellite data and machine learning, EGU General Assembly 2023, Vienna, Austria, 23–28 Apr 2023, EGU23-2689, https://doi.org/10.5194/egusphere-egu23-2689, 2023.

EGU23-4992 | PICO | HS7.1

The Fresnel Platform for Greater Paris: enhancing the urban resilience with the fully distributed and physically based model, Multi-Hydro 

Guillaume Drouen, Daniel Schertzer, Auguste Gires, and Ioulia Tchiguirinskaia

The aim of the Fresnel platform of École des Ponts ParisTech is to develop research and innovation on multiscale urban resilience. To achieve this goal, it is therefore conceived as a SaaS (Software as a Service) platform, providing data over a wide range of space-time scales and appropriate softwares to analyse and simulate them over this range.

To study the different technical solutions of the water cycle in an urban environment at different scales, RadX now provides a user-friendly graphical user interface to run simulation using a fully distributed and physically based model: Multi-Hydro.

This model that has been developed at École des Ponts ParisTech, from four open-source software applications already used separately by the scientific community. Its modular structure includes a surface flow module, sewer flow module, a ground flow module and a precipitation module. It is able to simulate the quantity of runoff and the quantity of rainwater infiltrated into unsaturated soil layers from any temporally-spatially varied rainfall event at any point of the peri-urban watersheds. The spatial and temporal variation of meteorological, hydrological, geological and hydrogeological data across the model area is described in gridded form of the input as well as the output from the model.

The use of RadX as a graphical user interface gives users the ability to easily customize the input data for their simulation. They can, for instance, modify the land use to study the effect of urban climate mitigation strategies like green roofs. They can select real hydrological events measured by the ENPC X-Band radar as rainfall input, but also generate virtual rainfall events. To ease the interpretation of the simulation, RadX can render interactive 2D and 3D graphics directly in the users' web browser by the use of open source libraries that focus on performance using low level graphic API. For example, it gives the user an intuitive and efficient way to spot singular points of the infiltration output display. Users can also download the file outputs to use in their GIS software.

Other components can be integrated to RadX to satisfy the particular needs with the help of visual tools and forecasting systems, eventually from third parties. Developments are still in progress, with a constant loop of requests and feedback from the scientific and professional world.

How to cite: Drouen, G., Schertzer, D., Gires, A., and Tchiguirinskaia, I.: The Fresnel Platform for Greater Paris: enhancing the urban resilience with the fully distributed and physically based model, Multi-Hydro, EGU General Assembly 2023, Vienna, Austria, 23–28 Apr 2023, EGU23-4992, https://doi.org/10.5194/egusphere-egu23-4992, 2023.

The microphysical processes were found to be vital in facilitating the system evolution for a merger-formation bow echo (MFBE) in southeast China, where the reinforced precipitation enhanced the cold pool strength via evaporation cooling. However, current numerical model failed to accurately perform such processes, suggesting the large uncertainties for microphysical schemes in simulating MFBE events in southeast China. In this study, three microphysics schemes including Thompson (THOM), Morrison (MORR), and Weather Research and Forecasting Double-Moment 6-Class (WDM6) schemes were evaluated by comparing against polarimetric observations and Variational Doppler Radar Analysis System (VDRAS) analyses. The three schemes captured the basic kinematic structures for this MFBE event after assimilating radar radial velocities, but all underpredicted the cold pool strength by ∼25%. Particularly, THOM produced the best raindrop size distributions (DSDs) and precipitation pattern, and the larger raindrop size bias and the weak cold pool strength were owing to the relatively low rain breakup efficiency and inefficient rain evaporation, respectively. By decreasing the cutoff diameter of rain breakup parameterization from the default 1.6–1.2 mm (i.e., increasing breakup efficiency) and increasing evaporation efficiency by threefold in THOM, the simulated DSDs and precipitation were greatly improved, and the cold pool strength was significantly increased from 77% to 99% compared to that in VDRAS analyses. This study illustrated a plausible approach of combining polarimetric radar retrievals and VDRAS analyses as bases to adjust THOM default settings in simulating a MFBE event in southeast China with physical characteristics more consistent with observations. Since microphysical processes vary from convective organizations and climate regions, it is recognized more cases studies are needed in the future to examine the validity and approach in this study to improve simulations and predictions of MFBEs in southeast China.

How to cite: Zhao, K., Zhou, A., Lee, W.-C., and Huang, H.: Evaluation and Modification of Microphysics Schemes on the Cold Pool Evolution for a Simulated Bow Echo in Southeast China, EGU General Assembly 2023, Vienna, Austria, 23–28 Apr 2023, EGU23-6808, https://doi.org/10.5194/egusphere-egu23-6808, 2023.

EGU23-7987 | ECS | PICO | HS7.1

Spatiotemporal pattern of precipitation in the Pearl River basin, China from 1951 to 2015 

shirong Cai, Kunlong Niu, Xiaolin Mu, and Xiankun Yang

Precipitation is one of the most important factors in hydrological cycle and climate change. Due to global climate change, the global and regional hydrological cycle has been changed significantly, and the precipitation pattern has changed, which made natural disasters happened more frequent. In this study, we taken the Pearl River Basin as a case study area and used APHRODITE dataset to investigate the spatiotemporal trend of precipitation during the period of 1951-2015 based on six extreme rainfall indices recommended by the WMO. Then, the MK test was used to verify their trend and analyze the temporal and spatial variability. The results indicated that: (1) The annual PRCPTOT in the Pearl River Basin displayed an increasing trend with an increasing rate of 0.019mm/yr. Although the number of annual rainy days was decreasing, the annual SDII exhibited an increasing trend. The annual R95P and RX1day exhibited an increasing trend, but the R95D and CWD showed a decreasing trend. The seasonal PRCPTOT increased in summer and winter, but decreased in spring and autumn. R95P and SDII displayed an increasing trend in four seasons. (2) The annual variation of PRCPTOT increased from west to east, the trend of SDII, R95P and RX1day were similar with PRCPTOT, but the high value of R95D happened in the middle and lower reaches of Xijiang River, and CWD increased from north to south. Except autumn, the seasonal spatial distribution of PRCPTOT, SDII and R95P were similar. In spring and winter, the spatial distribution of PRCPTOT, SDII and R95P increased from west to east, and from north to south in summer, indicating that the Beijiang River basin and Dongjiang River basin had a higher flood risk. (3) MK test of indices shown that the Yunnan-Guizhou Plateau was becoming drier, and the risk of extreme rainfall was increasing in the Beijiang River basin and Dongjiang River basin. The study results are valuable for future water resources management and ecological environment protection in the Pearl River Basin.

How to cite: Cai, S., Niu, K., Mu, X., and Yang, X.: Spatiotemporal pattern of precipitation in the Pearl River basin, China from 1951 to 2015, EGU General Assembly 2023, Vienna, Austria, 23–28 Apr 2023, EGU23-7987, https://doi.org/10.5194/egusphere-egu23-7987, 2023.

EGU23-9256 | PICO | HS7.1

Improving shape-dependent snow fall speed relationships using different particle size parameters 

Thomas Kuhn, Salomon Eliasson, and Sandra Vázquez-Martín

Meteorological forecast models, notably snowfall predictions, require accurate knowledge of the properties of snow particles, such as their size, cross-sectional area, mass, shape, and fall speed. Therefore, measurements of individual snow particles’ fall speed and their cross-sectional area, from which a size parameter and area ratio can be derived, provide very useful datasets. We have compiled such a dataset from measurements with the Dual Ice Crystal Imager (D-ICI) in Kiruna during several winter seasons from 2014 to 2019. Using that data, we have previously studied shape-dependent relationships between fall speed and particle size, cross-sectional area, and particle mass. While we had used maximum dimension as the size parameter, we have found that it seems unsuitable for certain shapes like columnar particles. Here, we investigate which particle size parameter should be used depending on the shape or if one size parameter is suitable for all shapes. With a more suitable particle size parameter, we aim to improve the relationships between fall speed and particle size and mass.

How to cite: Kuhn, T., Eliasson, S., and Vázquez-Martín, S.: Improving shape-dependent snow fall speed relationships using different particle size parameters, EGU General Assembly 2023, Vienna, Austria, 23–28 Apr 2023, EGU23-9256, https://doi.org/10.5194/egusphere-egu23-9256, 2023.

EGU23-10190 | PICO | HS7.1

A novel methodology for remote sensing retrieval of rainfall rates 

Massimiliano Ignaccolo and Carlo De Michele
We propose a new methodology for rainfall rate retrieval from remote sensing observations using 166 datasets from 76 different locations on Earth's surface. The method rests upon the data science parametrization of the drop size distribution [Ignaccolo and De Michele (2022) : https://doi.org/10.1175/JHM-D-21-0211.1]. It retrieves the possible triplets (drop count, mean diameter of the drop size distribution, skewness of the drop size distribution) associated with given values of the horizontal and vertical reflectivities. We demonstate how this novel approach is superior to a standard one based upon the mass weighted diameter, normalized intercept and gamma functional form for the drop size distribution. 
 

How to cite: Ignaccolo, M. and De Michele, C.: A novel methodology for remote sensing retrieval of rainfall rates, EGU General Assembly 2023, Vienna, Austria, 23–28 Apr 2023, EGU23-10190, https://doi.org/10.5194/egusphere-egu23-10190, 2023.

In previous work [Aguilar Flores et al., Stoch. Environ. Res. Risk Assess. (2021) 35: 1681-1687], distributional convergence of breakdown coefficients (BDCs) to symmetric probability distribution functions of weights in discrete-scale multiplicative cascades has been shown. Asymmetric weights distributions, however, cannot become the limiting functions of symmetric BDC distributions. A procedure has been devised and is presented herein for the computation of the limiting distributions in the aforementioned cases, involving a convolution that is identified with the first-level BDCs probability distribution, and thereby can be used for the purpose of model validation in otherwise non-ergodic single realizations of multiplicative cascade models.

How to cite: Aguilar Flores, C. and Carsteanu, A. A.: Breakdown coefficients of multiplicative cascades having asymmetrically distributed generators with bounded essential range, EGU General Assembly 2023, Vienna, Austria, 23–28 Apr 2023, EGU23-10237, https://doi.org/10.5194/egusphere-egu23-10237, 2023.

EGU23-12061 | ECS | PICO | HS7.1

Classification of snow and rainfall using commercial microwave links 

Erlend Øydvin, Rasmus Falkeid Hagland, Vegard Nilsen, Mareile Astrid Wolff, and Nils-Otto Kitterød

The use of Commercial microwave links (CMLs) to estimate rainfall has been under investigation for the past 15 years. CMLs still seem like a promising supplement to standard measurement methods. So far, CMLs have almost exclusively been applied for rainfall only situations. It is expected that different precipitation types affect the CML signal strength and error sources differently. For CML applications in high latitude countries with frequent and extended periods with snowfall and mixed precipitation, an extension of the classification methods for these precipitation types is needed. 

In this presentation we study how the CML signal attenuation is affected by different precipitation types and how those can be used to classify the different events. We use nearby disdrometers as a ground truth reference and CML data from different climatological conditions in Norway.

How to cite: Øydvin, E., Hagland, R. F., Nilsen, V., Wolff, M. A., and Kitterød, N.-O.: Classification of snow and rainfall using commercial microwave links, EGU General Assembly 2023, Vienna, Austria, 23–28 Apr 2023, EGU23-12061, https://doi.org/10.5194/egusphere-egu23-12061, 2023.

EGU23-12265 | PICO | HS7.1

Using Opportunistic Rainfall Sensing to improve Areal Precipitation Estimates and Run-off Modelling – The Case Study of the Ahr Flood in July 2021 

Jochen Seidel, András Bárdossy, Micha Eisele, Abbas El Hachem, Christian Chwala, Maximilian Graf, Harald Kunstmann, Norbert Demuth, and Nicole Gerlach

On 14 and 15 July 2021, heavy and prolonged precipitation caused flooding in large areas in western Germany and adjacent regions. The Ahr River valley in the Federal State of Rhineland-Palatinate was particularly affected, with numerous fatalities and large-scale damage. Due to the spatio-temporal variability of precipitation and failure of several gauging stations, the estimation of the flood triggering areal precipitation as well as determination of peak discharges is associated with high uncertainties.

In this study, we present results where data from opportunistic sensors (commercial microwave links (CML) and personal weather stations (PWS)) were used to interpolate hourly precipitation sums for the Ahr catchment. The data from the opportunistic sensors was quality controlled, filtered and interpolated using the methods from Graf et al. (2021). This precipitation data was compared to a gauge adjusted weather radar product from the German Weather Service DWD as well as interpolated rain gauge data. In order to determine the maximum discharges at the gauges in the Ahr, flood was simulated with the water balance model LARSIM (Large Area Runoff Simulation Model) using the aforementioned precipitation products as input data.

The results show that the areal precipitation obtained from opportunistic sensors yielded higher sums than the gauge adjusted radar products and the interpolated gauge data, especially in the northern part of the Ahr catchment where the station density of the conventional rain gauges was not sufficient to capture the spatial variability of this extreme event. Furthermore, the modelled run-offs using the precipitation input from opportunistic sensors yielded higher and more plausible peak discharges than the ones with the gauge adjusted weather radar product. This suggests that the radar underestimated precipitation due to attenuation. The difference in the resulting peak discharges point to the fact that due to the saturated soils any additional precipitation during the flood event in July 2021 lead to a direct run-off effect.


References:

Graf, M., El Hachem, A., Eisele, M., Seidel, J., Chwala, C., Kunstmann, H., & Bárdossy, A. (2021). Rainfall estimates from opportunistic sensors in Germany across spatio-temporal scales. Journal of Hydrology: Regional Studies, 37, 100883.

How to cite: Seidel, J., Bárdossy, A., Eisele, M., El Hachem, A., Chwala, C., Graf, M., Kunstmann, H., Demuth, N., and Gerlach, N.: Using Opportunistic Rainfall Sensing to improve Areal Precipitation Estimates and Run-off Modelling – The Case Study of the Ahr Flood in July 2021, EGU General Assembly 2023, Vienna, Austria, 23–28 Apr 2023, EGU23-12265, https://doi.org/10.5194/egusphere-egu23-12265, 2023.

EGU23-12880 | PICO | HS7.1

Modelling Typhoon Rainfall with Universal Multifractal 

Ching-Chun Chou, Auguste Gires, and Li-Pen Wang

Universal Multifractal (UM) has been a useful tool to model rainfall processes across a wide range of spatialtemporal scales. Double Trace Moment (DTM) is a technique that helps estimate parameters for the UM model. Based upon the estimated UM parameters, a discrete random cascade process can be used to generate samples with realistic rainfall properties. UM parameters are of physical meanings, representing the levels of mean intermittence (C1) and the changing rate of the mean intermittency deviating from the average field (α, know as the multifractality index), respectively. Therefore, these parameters are also widely used to characterise rainfall features across scales. UM has been tested in many countries under various weather conditions. However, its applications to extreme storm events, such as typhoons, are limited. In light of this, this study intends to analyse UM’s capacity of capturing and modelling extreme storm events recorded by a rainfall monitoring network in the South of Taipei City. On the roof of the Civil Engineering Research Building at National Taiwan University, an innovative extreme rainfall monitoring campaign has been set up and collecting high-quality rainfall measurements at fine timescales over the past two years. Rainfall data from several extreme rainfall events, including four typhoons and 10+ thunderstorms, has been collected. In this work, high-resolution rainfall time series from the laser disdrometer for typhoon Nalgae is used for analysis. Rainfall measurements are first aggregated from the native 10-second resolution to 80-second and coarser resolution and then downscaled back to 10-second to verify the downscaling results. The UM analysis is conducted in three different ways. The first way is to apply UM analysis to the entire time series. The resulting parameters are α = 1.32 and C1 = 0.108. Then, the time series is equally divided into 16 sections such that the temporal variations in rainfall features can be observed. Similarly to the first way, the second way applies the ’standard’ UM analysis but to each section. This leads to α ranging from 1.1 to 1.9 and C1 from 0.05 to 0.18. Finally, the third way applies ’ensemble’ UM analysis that concatenates divided sections into a single matrix. This results in α = 1.55 and C1 = 0.125. The derived parameters are then used to sample 10-second rainfall estimates with a discrete cascade process. The performance is quantified based upon the capacity of preserving observed extreme features. We first analyse the ranges of α and C1 resulting from the samples downscaled from the first and the third ways. We can see that the resulting α ranging from 1.2 to 1.8 and C1 from 0.06 to 0.16, which fails resembling the aforementioned variability of the UM parameters (i.e. 1.1−1.9 and 0.05−0.18). In fact, only the second way leads to satisfactory result. This preliminary study suggests that typhoon rainfall experiences drastic behaviour changes within a short period, which requires a more ’dynamic’ way to model these changes well. Similar analyses will be conducted over other collected typhoons and thunderstorm events to see if the findings can be generalised.

How to cite: Chou, C.-C., Gires, A., and Wang, L.-P.: Modelling Typhoon Rainfall with Universal Multifractal, EGU General Assembly 2023, Vienna, Austria, 23–28 Apr 2023, EGU23-12880, https://doi.org/10.5194/egusphere-egu23-12880, 2023.

EGU23-13080 | ECS | PICO | HS7.1

Challenges in the usage of commercial microwave links for the generation of transboundary German-Czech rainfall maps 

Nico Blettner, Martin Fencl, Vojtěch Bareš, Christian Chwala, and Harald Kunstmann

Attenuation data from commercial microwave links (CMLs) has proven useful for estimating rainfall. Their major benefits are a high abundance in most regions on earth, a high resolution in time, close to ground measurement, and the absence of installation costs and efforts. The spatial and temporal coverage of CMLs would theoretically enable the generation of continental rainfall maps for various aggregation times.

However, there exist limitations that have so far inhibited rainfall estimation on larger scales. The data is generally obtained on a national basis from different network providers and networks can vary significantly in characteristics such as frequency and length distributions. CML data requires careful processing that depends on these characteristics and which has so far been adjusted to independent data sets only.

In this study we investigate what kind of processing is required to use independent and heterogeneous CML data sets for the generation of transboundary rainfall maps. We use 3900 CMLs from Germany and 2500 CMLs from the Czech Republic. The German data set is rather evenly distributed with respect to spatial coverage, frequencies and lengths. The Czech data set, on the other hand, varies significantly more in all these regards: it is characterized by dense networks of short CMLs in the cities, a large share of CMLs with E-Band frequency, and hence a large range of sensitivities.

We find that quality control is important especially when dealing with independent data sets. We propose several algorithms and the consideration of network characteristics when combining two CML data sets, and show how adapted but straightforward processing allows the generation of transboundary rainfall maps.

How to cite: Blettner, N., Fencl, M., Bareš, V., Chwala, C., and Kunstmann, H.: Challenges in the usage of commercial microwave links for the generation of transboundary German-Czech rainfall maps, EGU General Assembly 2023, Vienna, Austria, 23–28 Apr 2023, EGU23-13080, https://doi.org/10.5194/egusphere-egu23-13080, 2023.

In an attempt to get the best parameter estimations of the theoretically consistent IDF (Intensity Duration Frequency) models of rainfall intensity for the entire state of Baden Wuerttemberg, three well-defined optimization algorithms such as Differential Evolution (DE), Nelder Mead (NM), and TNC Truncated Newton (TNC) are taken into account for comparison.

Seven-parametric IDF model contains mean intensity µ, intensity scale parameters λ1, λ2 , time scale parameter α, fractal/smoothness parameter Μ, Hurst parameter Η, exponent of the expression of probability dry θ,  and tail index ξ, which are obtained by minimizing the error between empirical k-moments and model quantiles. Error metric focusing on distribution quantiles x(k,T) is thus minimized for all available scales k and a series of return periods T . Non-linear solver is chosen to perform this step as these errors are non-linear functions of the parameters.

All results are demonstrated visually, and a final decision is made on the basis of precisely fitted parameter values to the model. This crucial step will also assist us in finding the optimum design values for stormwater and floods.

How to cite: Amin, B. and Bárdossy, A.: Comparative Analysis of Parameter Optimization of Theoretically Consistent IDF Models of Rainfall Intensity, EGU General Assembly 2023, Vienna, Austria, 23–28 Apr 2023, EGU23-14215, https://doi.org/10.5194/egusphere-egu23-14215, 2023.

EGU23-14295 | PICO | HS7.1

OpenMRG: Open data from Microwave links, Radar, and Gauges for rainfall quantification in Gothenburg, Sweden 

Remco (C.Z.) van de Beek, Jafet Andersson, Jonas Olsson, and Jonas Hansryd

In a changing climate accurate measurements and near-real time rainfall monitoring are essential for sustainable societies. Commercial microwave links (CMLs) offer a great alternative, or addition, to traditional sensors, like rain gauges and radar. While CMLs are a great source of opportunistic sensors the data from CMLs are usually limited by their accessibility for both research and actual implementation. To help in gaining better access and research into CML-derived rainfall we present a dataset at 10 second resolution with true coordinates for 364 bi-directional CMLs gathered during a pilot study in Gothenburg, Sweden over a three-month period (June-August 2015). These data are complemented by additional data from 11 high-resolution rain gauges (ten 1 min and one 15 min) and radar data (5 min and 2 km resolution) from the Swedish operational weather radar composite over the Gothenburg area.

Analysis of the data show that data collection is very complete, with 99.99% of the CMLs, 100% rain gauges and 99.6% of the radar data available. The gauge data shows that around 260mm rainfall was measured during this period with 6% precipitation during 15-minute intervals. At the Torslanda gauge on 28 July 2015 one the of the most intense events was observed during the three-month period with a peak intensity of 1.1 mm min−1. The CML data reflect this event well and show a drop of around 27 dB during the peak intensity. Radar data also showed a good distribution of the reflectivity of the precipitation with some measurements above 40 dBZ, which is commonly taken as an indication of convective precipitation. Some low intensity clutter was also found, mostly around -15 dBZ.

The data are accessible at https://doi.org/10.5281/zenodo.7107689 (Andersson et al., 2022). The sharing of these Open high-resolution data of Microwave links, radar and gauges (OpenMRG) should enable further research in microwave-link based environmental monitoring. In the longer term we hope that this dataset will also contribute to easier access of CML data and help in the development of the merging of multi-sensor products.

How to cite: van de Beek, R. (C. Z. )., Andersson, J., Olsson, J., and Hansryd, J.: OpenMRG: Open data from Microwave links, Radar, and Gauges for rainfall quantification in Gothenburg, Sweden, EGU General Assembly 2023, Vienna, Austria, 23–28 Apr 2023, EGU23-14295, https://doi.org/10.5194/egusphere-egu23-14295, 2023.

The safety of autonomous vehicles will depend critically on the performance of sensors (such as 77GHz radar), which will degrade in the presence of propagation losses during severe weather events. Variations in the drop size distribution lead to significant uncertainty in attenuation estimates. As part of the UK government's commitment to the safe introduction of autonomous vehicles, and in collaboration with the National Physical Laboratory, we have set up a series of observing platforms at Met Office Cardington to measure a multitude of weather-related variables such as temperature, pressure, illumination, precipitation particles, fog, etc. In this contribution, I will cover our work on characterising the rain drop size distribution, using a network of 5 disdrometers located 125m apart, and returning a drop size distribution every minute. From the spectra, we derived an estimate of the attenuation, including an estimate of the uncertainty.

How to cite: Husnoo, N. and Jones, D.: The impact of drop size distribution variability and rainfall attenuation on autonomous vehicle sensors, EGU General Assembly 2023, Vienna, Austria, 23–28 Apr 2023, EGU23-14407, https://doi.org/10.5194/egusphere-egu23-14407, 2023.

Weather radar provides rainfall estimates at high resolution in both space and time, which is useful for many hydrological applications. Despite this, the radar rainfall estimation process introduces many sources of error, impacting the reliability of results obtained from the radar rainfall estimates. Key error sources include signal attenuation, radar calibration issues, ground clutter contamination, variability in the drop-size distribution and variation in the vertical profile of reflectivity. To gain an improved understanding of potential limitations, and the corresponding uncertainty of rainfall rates, the impact of these errors has been systematically investigated, developing a radar error model by inverting the rainfall estimation process.

To this end, an ensemble of realistic rainfall events is simulated, and working backwards in a stochastic manner gives an ensemble of weather radar images, corresponding to each rainfall event, at each time step. The radar error model includes random noise effects, drop-size distribution errors, sampling estimation variance and importantly, attenuation effects. To allow for direct comparisons, standard radar processing methods are applied to each radar image, to obtain corrected ‘best guess’ rainfall estimates which would be obtained from each weather radar ensemble member in real world applications. The difference between the simulated and corrected rainfall for each ensemble member is then treated as the uncertainty corresponding to the radar rainfall estimation process.

A simple measure is introduced, to help understand how often errors result in a rainfall signal completely irretrievable, referred to as ‘rainfall shadow’. Areas of rainfall that are ‘shadowed’ are defined as pixels where the simulated ‘true’ rainfall rate is significant, but the ensemble member has less than 10% of the original signal. This is equivalent to considering where a significant rainfall rate has been completely lost, and would therefore be irretrievable using standard correction methods, to quantify the frequency of occurrence in real-world radar rainfall applications. The impact of location of rainfall within images is considered, by introducing the second moment of area for radar images, in order to quantify the proximity of intense rainfall to the radar transmitter.

Results show relationships between rainfall shadows and high bias and uncertainty in rainfall estimates, related to the amount of rainfall (i.e. proportion and rates) in images. More central rainfall also results in higher errors and higher variability. The minimum likelihood of occurrence of rainfall shadows showed that 50% of event images have at least 3% of significant rainfall shadowed. In addition, 25% of images had a shadowed area of over 45km2, with the minimum largest shadow in one area for 5% of images exceeding an area of 50km2. This gap would result in an underestimation of the impact of potential floods, showing that weather radar has potential for important information to be lost. A model framework for representing this uncertainty in the radar rainfall estimation process provides methodology for assessing the impacts of radar rainfall errors on hydrological applications.

How to cite: Green, A., Kilsby, C., and Bardossy, A.: Quantifying the uncertainty corresponding to the radar rainfall estimation process:  an inverse model for radar attenuation error, EGU General Assembly 2023, Vienna, Austria, 23–28 Apr 2023, EGU23-14569, https://doi.org/10.5194/egusphere-egu23-14569, 2023.

EGU23-14766 | PICO | HS7.1

Multiscale Characteristics of West African Summer Monsoon Precipitation Derived from UCadMet Network Observations 

Belen Rodríguez de Fonseca, Luis Durán Montejano, Alvaro González Cervera, Auguste Gires, Cheikh Modou Noreyni Fall, Abdou Lahat Dieng, Amadou Thierno Gaye, and Elsa Mohino

Since 2012 a joint Université Cheikh Anta Diop de Dakar and Universidad Complutense de Madrid meteorological observation network (UCadMet) has been in place in the city of Dakar (Senegal). During the last years, the observation and data storage systems have been considerably improved. Last summer of 2022, a laser disdrometer was installed providing  detailed information on the size and speed of precipitation with a time resolution of one minute. Observations from several tipping bucket rain gauges are available also at the same site. Summer 2022 has been anomalously rainy in West Africa, with large precipitation events during the African monsoon season, which seems to be enhanced by a La Niña situation in the Pacific. These events have proven to be particularly suitable for evaluating the performance of the installed observing systems and for drawing some conclusions about the characteristics of monsoon precipitation in this region not only at different time scales, but also across scales (from 1 min to season). Commonly used rain rate together with drop size distribution are used to access information on rainfall microphysics. This analysis allows the design of future lines of action considering climate change, for which large precipitation events are expected to become more frequent.

How to cite: Rodríguez de Fonseca, B., Durán Montejano, L., González Cervera, A., Gires, A., Fall, C. M. N., Dieng, A. L., Gaye, A. T., and Mohino, E.: Multiscale Characteristics of West African Summer Monsoon Precipitation Derived from UCadMet Network Observations, EGU General Assembly 2023, Vienna, Austria, 23–28 Apr 2023, EGU23-14766, https://doi.org/10.5194/egusphere-egu23-14766, 2023.

EGU23-15902 | ECS | PICO | HS7.1

Correction of hourly radar precipitation data based on rain-gauges values: what is the most efficient method for hydrologic modeling purposes? 

Andrea Citrini, Georgia Lazoglou, Adriana Bruggeman, George Zittis, Giovanni Pietro Beretta, and Corrado Camera

The effectiveness of a hydrologic model is largely driven by the availability and nature of the input data. Among these, many studies proved precipitation to be the most important because it regulates the amount of water entering the system. Spatially continuous precipitation data can be obtained from radar technology. However, radar precipitation values are an indirect measure, and it is widely believed that their use in hydrologic modelling is complicated due to the presence of bias. The use of radar data is increasingly problematic in mountain regions where elevation plays a key role on precipitation, creating significant variations in few kilometers. Also, mountains can lead to a shadow effect of the radar beam.

The research objective is to integrate precipitation data derived from the radar into a partially distributed hydrologic model, running in an area with complex morphology. The study area is a portion of Upper Valtellina valley (about 2300 km2), located within the Alpine belt on the border between Italy and Switzerland, and characterized by an elevation range between 350 and 3400 m a.s.l. The hourly series of 22 rain-gauges (18 Italian and 4 Swiss stations) and hourly precipitation from a radar dataset (1km x 1km resolution, from MeteoSWISS) from 2010 to 2020 are used. The mean bias between the series extracted in the radar cells at the station locations and the series measured by rain-gauge is around -28%, indicating a general underestimation of the radar data. The targets of the correction techniques are the precipitation series at the centroids of the sub-basins defined by the hydrologic model.

For the correction, two approaches are tested: (i) the radar precipitation is corrected in every centroid of the hydrologic model subbasins (point-based correction); (ii) the radar precipitation is adjusted by spatializing the radar-station error (interpolation-based correction). The first approach is based on finding the statistical relations between the radar-station series of the three closet stations to the target centroid and applying the statistical correction (Copula or Cumulative Distribution Function (CDF) matching bias correction) to the precipitation series in the centroid cell. The result of the correction is a combination of the statistical relationships weighted according to a Triangular Irregular Network. The second technique focusses instead on the interpolation of the error (residuals) calculated as the difference between radar and rain-gauge values, which is subsequently added to the original radar raster. Two different interpolation techniques are used: Thin Plate Splines and Inverse Distance Weighting. All methods are evaluated through performance indices (KGE and RMSE) at the station locations by Leave One Out cross validation.

Point-based applications are cost-effective and require less computational effort than spatial interpolations. Preliminary results show that the point-based corrections through Copula and CDF have similar performances. In detail, the KGE increases from 0.18 to 0.52 and 0.55 for Copula and CDF, respectively. RMSE decreases from 0.78 mm to 0.53 mm (Copula) and 0.62 mm (CDF). Interpolation-based corrections are still ongoing, therefore there are no definite results regarding the comparative effectiveness of one type of correction over the other.

How to cite: Citrini, A., Lazoglou, G., Bruggeman, A., Zittis, G., Beretta, G. P., and Camera, C.: Correction of hourly radar precipitation data based on rain-gauges values: what is the most efficient method for hydrologic modeling purposes?, EGU General Assembly 2023, Vienna, Austria, 23–28 Apr 2023, EGU23-15902, https://doi.org/10.5194/egusphere-egu23-15902, 2023.

EGU23-15924 | ECS | PICO | HS7.1

Information-based approach for quantifying uncertainty in precipitation estimates from commercial microwave links 

Anna Špačková, Martin Fencl, and Vojtěch Bareš

Opportunistic sensors have great potential for rainfall monitoring, as the density of their networks can outperform standard rainfall monitoring networks. The commercial microwave link (CML) network enables indirect monitoring of path-averaged rainfall intensity. It is retrieved from signal attenuation caused by raindrops, which can be related to rainfall intensity by a simple power law. Quantitative precipitation estimates from CMLs are, however, affected by uncertainty, which is still challenging to estimate.

This study proposes, for the first time, to use information theory methods to quantify uncertainty in CML QPEs. This method enables measuring the firmness of relationships between different variables using discrete probability distributions and also estimates the uncertainty. The advantage resides also in the fact that it allows any type of data to be used. This approach was recently applied by Neuper and Ehret (2019) to evaluate quantitative precipitation estimates with weather radar.

Data from non-winter periods of 2014 – 2016 are used at a temporal resolution of 15 min. The target (reference) data are the rain gauge adjusted radar observation. The CML data (signal attenuation and its processing) from the Prague network and its hardware characteristics are used as predictors. Additionally, other predictors, e.g., temperature and synoptic types, are used as further predictors. First, the information content of individual predictors of the target rain gauge adjusted radar data is measured. Specifically, we tested how different combinations of predictors reduce uncertainty. Second, the effect of the sample size on uncertainty is investigated. Different sizes of random samples are selected from the dataset and their information content for the target is quantified.

Depending on the choice of the predictor(s), their abilities to estimate the target variable can be compared. Their predictive uncertainties are different, which results in a ranking of suitability of available predictors and their combinations.


References
Neuper, M. and Ehret, U. (2019) Quantitative precipitation estimation with weather radar using a data- and information-based approach, Hydrol. Earth Syst. Sci., 23, 3711–3733, https://doi.org/10.5194/hess-23-3711-2019.


This study is supported by the Student Grant Competition grant of Czech Technical University in Prague no. SGS22/045/OHK1/1T/11.

How to cite: Špačková, A., Fencl, M., and Bareš, V.: Information-based approach for quantifying uncertainty in precipitation estimates from commercial microwave links, EGU General Assembly 2023, Vienna, Austria, 23–28 Apr 2023, EGU23-15924, https://doi.org/10.5194/egusphere-egu23-15924, 2023.

To study climate change we rely on global climate models (GCMs) but their resolution is coarse to investigate impacts at the local scale. Hence, a downscaling task is required for the use of these coarse-resolution outputs. In this sense, statistical downscaling methods (SDMs) are commonly applied to analyse the local impacts. Furthermore, a quantification of the uncertainty share of the SDMs is advised to complement the results. However, many choices need to be done before their application and these decisions can bias the outcome of the analysis. This work examines the SDMs’ uncertainty share to evaluate to what extent the different adopted strategies can impact the climate change signal (CCS) associated with the study. For this, eleven research indicators (six representing precipitation extremes) are used with four future scenarios, 28 state-of-art GCMs, and 15 SDMs of two different types (change factor and quantile mapping methods). The uncertainty involved is quantified by the variance decomposition procedure. Three different decisions are tested:

(i) The selection of the Coupled Model Intercomparison Project (CMIP) era. The uncertainty shares in phases five and six (CMIP5 and CMIP6, respectively) are compared.  

(ii) The selection of the SDM ensemble based on the SDMs’ methodological construction. More specifically, based on an ensemble of five methods of change factor type (including an event-based change factor weather generator) and an ensemble of ten methods of quantile mapping.

(iii) The selection of the optimal SDM ensemble number. Different unique SDMs combinations are tested from k-ensemble members in [2,n] with n as the ensemble with the largest number of members (n=15).

To complement the analysis, the outcomes of the CCSs from all the combinations in (ii) and (iii) are analysed. The results showed that the uncertainty quantification of the SDMs is not sensitive to the selection of the CMIP era. However, this choice is important if the focus is on the GCMs and future scenarios. Hence, it is preferable (but not mandatory) to perform the analysis with the most recent era. The selection of the SDMs based on a methodological construction might bias the conclusions. Therefore, it is better to include methods from all possible types since the results showed that the more methods included in the downscaling, the more reliable the estimation of the SDMs’ uncertainty share. The CCS seems to strongly depend on the choice of the SDM ensemble, and it tends to converge from different k-ensemble members in [2,n] towards the largest ensemble (n). Hence, CCSs from large SDM ensembles will be more reliable. Future work must extend the analysis into different climatological regions and include more methods from all the possible types.

How to cite: Mendoza Paz, S. and Willems, P.: The statistical downscaling methods’ uncertainty share as a measure for adopted strategies in downscaling studies for climate change, EGU General Assembly 2023, Vienna, Austria, 23–28 Apr 2023, EGU23-83, https://doi.org/10.5194/egusphere-egu23-83, 2023.

Rainfall Intensity-Duration-Frequency (IDF) curves are widely used in studies related to planning, design, and operation of various water control (e.g., barrages, dams, levees) and conveyance structures (e.g., culverts, spillways, storm sewers) for mitigating risk associated with floods attributable to extreme precipitation. In many parts of the globe, precipitation data are limited, and the network of gauges is sparsely distributed. Therefore, the use of only at-site data for the construction of IDF curves could have large uncertainties. To overcome this impediment, regional IDF relationships could be developed by regional frequency analyses (RFA) which uses information pooled from several meteorologically similar sites. Recently, there is growth in the use of fine spatial scale remote-sensing precipitation products to arrive at IDF relationships for ungauged locations, as the spatial coverage of these products is exhaustive. However, recent studies indicate that most of the remote sensing products underestimate the precipitation intensities corresponding to different durations and return periods and also perform worse at shorter time scales (e.g., daily and sub-daily). Although remote sensing products can be corrected for biases before use in developing the IDF relationships, there is ambiguity in the choice of bias correction methods. Furthermore, in sparsely gauged locations, the availability of only a limited number of ground observation stations for bias correction enhances uncertainty in the developed IDF relationships. In addition, relying on only one satellite product may not be meaningful, as the skill of different satellite products varies across the globe. Also, the conventional practice of developing IDF curves considering the stationary assumption may lead to large biases in estimates of precipitation extremes in a changing climate. To address these issues, this study proposes a novel methodology to develop non-stationary regional IDF relationships for use in climate change scenarios. The methodology involves nonstationary RFA utilizing fine grid-scale daily precipitation derived by merging multiple satellite-based precipitation products and ground-based precipitation products for homogenous extreme precipitation regions (EPRs). The merging of different products is achieved using a novel random forest-based regression method. Effectiveness of the proposed methodology is demonstrated through a case study on Karnataka state in India, which extends over approximately 0.2 million square kilometers. The homogenous EPRs are delineated in the study area using ensemble cluster analysis of the relevant predictor variables/covariates. Non-stationary regional IDF curves are developed using the proposed methodology corresponding to different CMIP6 climate change scenarios, considering an ensemble mean precipitation derived from eleven GCMs (General Circulation Models). The curves are compared with those obtained using conventional stationary methods considering block-maxima and partial duration series of extreme precipitation.

How to cite: Goel, A. and Srinivas, V. V.: Deriving Regional IDF Curves for Data-Sparse Areas in Climate Change Scenarios using Merged Satellite and Ground-based Precipitation and GCMs, EGU General Assembly 2023, Vienna, Austria, 23–28 Apr 2023, EGU23-304, https://doi.org/10.5194/egusphere-egu23-304, 2023.

EGU23-624 | ECS | Orals | HS7.2

The unintended usage of precipitation reanalysis products: Downscaling of daily precipitation time series to hourly values using reanalysis products for parameter estimation 

Hannes Müller-Thomy, Jana Kellner, Patrick Nistahl, Nejc Bezak, Katarina Zabret, and Kai Schröter

High-resolution precipitation time series are required for numerous applications in hydrology. For data-scarce regions, precipitation reanalysis products (PRP) are a promising data source. We validated two PRP for Slovenia and identified biases, which disable a direct usage of the PRP. However, the PRP were used for the parameter estimation of a cascade model to disaggregate daily time series, which exist for long periods for the whole country. The so assimilated data benefits from the advantages from both datasets: the daily rainfall amounts from the observations and the high-resolution temporal structure from the PRP. The disaggregated time series show a superior representation of the observed high-resolution point and areal precipitation time series in comparison to the PRP themselves, and their usage is recommended instead. The developed concept can be transferred to other data-scarce regions.

In more detail, from the latest PRP two are most promising due to their spatial and temporal resolution: ERA5-Land (raster width ~9 km width, temporal resolution of 1 h) and REA6 (6 km, 1 h). ERA5-Land and REA6 are evaluated in space and time by continuous and event-based characteristics as well as precipitation extreme values for five recording stations and 20 catchments in Slovenia. Both PRP show underestimations of dry spell duration, wet spell amount and average intensity, while wet spell duration is overestimated. For extreme values with 1 h duration both PRP lead to underestimations, whereby the bias increases with the return period. The identified biases are larger for ERA5-Land than for REA6. The PRP time series were used for the parameter estimation of a micro-canonical cascade model to disaggregate observed daily values to hourly values. The so estimated parameters differ from station-based estimations, e.g. probabilities for the generation of dry time steps (P(1/0), P(0/1)) are underestimated. Nevertheless, starting from observed daily rainfall amounts the disaggregated time series show a superior representation of the high-resolution precipitation characteristics in comparison to ERA5-Land and REA6. This conclusion is based on all studied precipitation characteristics.

How to cite: Müller-Thomy, H., Kellner, J., Nistahl, P., Bezak, N., Zabret, K., and Schröter, K.: The unintended usage of precipitation reanalysis products: Downscaling of daily precipitation time series to hourly values using reanalysis products for parameter estimation, EGU General Assembly 2023, Vienna, Austria, 23–28 Apr 2023, EGU23-624, https://doi.org/10.5194/egusphere-egu23-624, 2023.

EGU23-668 | ECS | Orals | HS7.2

Effects of Super-Extremes in the evaluation of the design rainfall: a case study in Northern Italy 

Paola Mazzoglio, Ilaria Butera, and Pierluigi Claps

In recent years, several major rainfall events have been observed in Italy, with amounts that have broken previous all-time records. Several questions concerning the adequacy of the statistical tools that we have at our disposal to determine the "real" rarity of these events emerge, especially considering the limited availability of long and complete rainfall records. In this work, we investigate the influence of "Super-Extremes" on the rainfall regional frequency analysis framework. More specifically, we consider the all-time Italian record events up to now, some of which were observed in 2021 (377.8 mm / 3h, 496 mm / 6h, 740.6 mm / 12h).

The approach is undertaken through a rainfall regional frequency analysis performed over the North-West of Italy based on the patched kriging (PK) technique. PK requires a year-by-year application of ordinary kriging, that overcomes the data inconsistency by considering all the time series, without the need to discard those shorter than a specific length. The morphology of the areas is quite complex, which implies that extremes are expected to be influenced by the elevation: the orographic gradient is computed and removed and, for each duration, the sample variogram is evaluated as the mean of the annual variograms weighted on the number of active rain gauges for any year.

The sequential application of the ordinary kriging allows to reconstruct both a "rainfall data cube" and a "variance data cube" in the (x, y, t) space. A complete series of measured and estimated values are obtained by coring the data cube along the time axis in each location. The cored series are then used to compute the L-moments, in a framework that assigns weights based on the kriging variance, to consider the different nature of the data (measured and estimated). To overcome possible inconsistencies of the L-moment, a bias-correction procedure is applied to preserve the coefficient of variation from the smoothing effect induced by the spatial interpolation.

The methodology is applied to short-duration (1 to 24 hours) annual maximum rainfall depths recorded by rain gauges coming from the Improved Italian – Rainfall Extreme Dataset (I2-RED). The effects in the local frequency curves when introducing new record-breaking data are examined and commented, in view of the role that these values assume in the surrounding region.

How to cite: Mazzoglio, P., Butera, I., and Claps, P.: Effects of Super-Extremes in the evaluation of the design rainfall: a case study in Northern Italy, EGU General Assembly 2023, Vienna, Austria, 23–28 Apr 2023, EGU23-668, https://doi.org/10.5194/egusphere-egu23-668, 2023.

EGU23-736 | ECS | Orals | HS7.2

Parameterization-based uncertainties in RegCM simulations over the Carpathian region in a wet year 

Tímea Kalmár, Rita Pongrácz, and Ildikó Pieczka

Precipitation is one of the most important climate variables in many aspects due to its key impact on agriculture, water management, etc. Furthermore, extreme precipitation events can lead to excess surface water and floods and are becoming an amplifying societal cost as a result of urbanization and our warming climate. However, it remains a challenge for climate models to realistically simulate the regional patterns, temporal variations, and intensity of precipitation. Detailed knowledge about extreme precipitation events is important for advanced predictions on weather-to-climate time scales. The difficulty arises from the complexity of precipitation processes within the atmosphere stemming from cloud microphysics, cumulus convection, large-scale circulations, planetary boundary layer processes, and many others. This is especially true for heterogeneous surfaces with complex orography such as the Carpathian region.

In order to quantify the impact of the use of different parameterization schemes on regional climate model outputs, hindcast experiments were completed applying RegCM4.7 to the Carpathian region and its surroundings at 10-km horizontal resolution using ERA-Interim reanalysis data as initial and boundary conditions. In this study, 24 simulations were carried out by using various combinations of the physics schemes (2 land surface, 2 microphysics, 3 cumulus and 2 boundary layer schemes) for the year 2010, which was the wettest year in the region since the beginning of the regular measurements. Each parameterization combination leads to different simulated climates, so their spread is an estimate of the model uncertainty arising from the representation of the unresolved phenomena. The analysis of the RegCM ensemble indicates systematic precipitation biases, which are linked to different physical mechanisms in the summer and winter seasons.

Based on the results, RegCM is sensitive to the applied convection scheme, but the interactions with the other schemes (e.g., land surface or microphysics) affect not only the total precipitation, but also the convective and stratiform precipitation in some cases. Due to the different treatment of moisture in the schemes, there are differences not only between the representation of the precipitation cycle, but also in other climatological variables such as soil moisture, temperature and cloud cover.

How to cite: Kalmár, T., Pongrácz, R., and Pieczka, I.: Parameterization-based uncertainties in RegCM simulations over the Carpathian region in a wet year, EGU General Assembly 2023, Vienna, Austria, 23–28 Apr 2023, EGU23-736, https://doi.org/10.5194/egusphere-egu23-736, 2023.

EGU23-1126 | ECS | Orals | HS7.2

Developing precipitation datasets for mountain regions in a changing climate 

Keith Shotton, Elizabeth Lewis, David Pritchard, and Nick Rutter

Around 22% of the global population depend on mountain runoff for their water supply. Due to its importance for future water resources, as well as flood and drought planning, an improved understanding of spatial precipitation patterns in mountain regions is needed. Precipitation gauge networks are sparse and traditional methods of interpolation yield inadequate precipitation fields for poorly gauged mountain catchments.

This research project builds on a new method, Random Mixing, to generate multiple random spatial daily precipitation fields, conditioned on gauge observations. The Random Mixing algorithm has so far been tested on larger, densely gauged catchments. This project adapts the approach for a sparsely gauged, small 9.1 km2 mountain catchment, Marmot Creek Research Basin in Alberta, Canada, where elevations range between 1600 m and 2825 m above sea level (a.s.l.). Quality-controlled total precipitation (i.e., rainfall and snowfall) gauge observations, for an 11-year period, from three weather stations around the catchment have been used to condition the random spatial fields.

To optimise selection of the most plausible fields, ensemble hydrological simulations are run, initially using a Python-coded version of the HBV spatially-distributed conceptual model, on a 50 m2 regular model grid. Optimisation involves the use of metrics, primarily Nash-Sutcliffe Efficiency (NSE) and bias, to identify the fields that result in the best match between observed and simulated streamflows. Sensitivity of these fields to seasonality, elevation and precipitation intensity is tested.

Results so far are promising. Even with very few gauges, improving the way that spatial covariance relationships between gauge locations are represented in the model has enhanced the quality of the spatial fields. The biggest improvement to date is from explicitly modelling the precipitation / elevation relationship, introducing gradients, and applying daily dry day and wet day parameters to each grid cell across the model domain.

Intended future work will aim to further refine the process using a physically-based spatially distributed model, the Cold Regions Hydrological Model (CRHM). Spatial fields generated using other random methods will be used to evaluate the performance of the new technique. Long time-period flood frequency curves generated using each approach will be compared. Different methods of phase partitioning will be evaluated to identify impacts on extreme flooding which is often controlled by snowpack melt. Climate change perturbations will be applied to generate potential future flood estimates.

How to cite: Shotton, K., Lewis, E., Pritchard, D., and Rutter, N.: Developing precipitation datasets for mountain regions in a changing climate, EGU General Assembly 2023, Vienna, Austria, 23–28 Apr 2023, EGU23-1126, https://doi.org/10.5194/egusphere-egu23-1126, 2023.

EGU23-1157 | ECS | Posters on site | HS7.2

Spatial downscaling of rainfall fields using a multiple-point geostatistics-based approach 

Wenyue Zou, Guanghui Hu, Pau Wiersma, Shuiqing Yin, Grégoire Mariethoz, and Nadav Peleg

High-resolution gridded rainfall product at sub-daily and kilometer scales is required for many hydrological applications. In ungauged catchments, gridded rainfall data are often obtained through remote sensing, primarily satellites, whose spatial resolution is too coarse and requires to be downscaled to a finer resolution. The challenge is not only to downscale the rainfall intensity but also to downscale the spatial structure of rainfall fields, as both elements are essential for assessing the surface hydrological response. For this purpose, we further developed the stochastic multiple-point geostatistics (MPS) method, which enables the downscaling of long-term coarse-gridded rainfall using only a few years of high-resolution rainfall observations. We describe the methodology and demonstrate an application whereby long time series (1998-2019) of hourly CMORPH rainfall dataset are downscaled from 7 km to 1 km resolution based on training images from the 1-km CMPAS dataset available for a much shorter period (2015-2020), taking the area of Beijing as a case study. We show that the downscaled rainfall fields are following the expected spatial structure. Moreover, the downscaled rainfall intensities are consistent with station-based rainfall observations. And the heavy rainfall intensities at the 99th quantile match those expected due to the change in spatial scale and the application of an areal reduction factor. The results indicate that MPS preserves the spatial structure and downscales rainfall intensities well, especially for heavy rainfall, even if limited high-resolution training data is available. The proposed downscale approach can be applied to other rainfall datasets and in other regions.

How to cite: Zou, W., Hu, G., Wiersma, P., Yin, S., Mariethoz, G., and Peleg, N.: Spatial downscaling of rainfall fields using a multiple-point geostatistics-based approach, EGU General Assembly 2023, Vienna, Austria, 23–28 Apr 2023, EGU23-1157, https://doi.org/10.5194/egusphere-egu23-1157, 2023.

EGU23-1357 | ECS | Orals | HS7.2

Is WaPOR precipitation data reliable over Iran? 

Mohsen Moghaddas and Massoud Tajrishy

As a result of satellite observations, ground observations, and data assimilation, global precipitation datasets have been developed for regions like Iran, where ground observations are limited. This study presents a comprehensive evaluation of WaPOR precipitation dataset over Iran at daily time scale. We considered a period of three years from 2019 to the end of 2021 and 394 synoptic rain gauges are used for the assessment. Daily WaPOR precipitation data at 250m scale downloaded and compared pixel-to-point with in-situ data. In addition, the WaPOR data and stations data were compared based on time classification (seasonal), location in the main catchment basins of Iran, and elevation above sea level. Calculating MSE, R score, RMSE and MSLE between real data(stations) and predict data(Wapor) shows some important result: 1. From the time point of view, WaPOR has best performance in summer (MSE = 4.94 and MSLE = 0.16) 2. Location, the best performance is related to stations of the catchment areas of the eastern part of Iran (Qaraqom basin with MSE = 11.9 and eastern border basin with MSE = 6.26) and the worst performance is related to the catchment area of the Caspian Sea (Mazandaran Sea basin with MSE = 64.06). 3. For analyzing the effect of elevation on precipitation, we divided the stations into 5 groups with an interval of approximately 600 meters (according to the lowest and highest elevation, which is -25 meters and 2965 meters). The best performance is related to stations with an altitude between 572 and 1170 meters (MSE = 21.61) and the worst is related to stations with an altitude between 1768 and 2366 meters (MSE = 43.79). 4. Moreover, on average for each station, in the three years of study (1096 days), we have 166 days (with standard deviation 119 days) that station has recorded precipitation but WaPOR dataset didn’t represent any record, so it’s not appropriate for daily hydrological models. 5. The difference between the three-year precipitation total at the station and the WaPOR precipitation total is 449.6 mm on average (with standard deviation 724.5).

How to cite: Moghaddas, M. and Tajrishy, M.: Is WaPOR precipitation data reliable over Iran?, EGU General Assembly 2023, Vienna, Austria, 23–28 Apr 2023, EGU23-1357, https://doi.org/10.5194/egusphere-egu23-1357, 2023.

EGU23-2705 | ECS | Posters on site | HS7.2

Impact of Spatio-Temporal Disaggregation of Rainfall on Hydrological Modelling 

Vemuri Harini, Abhinav Wadhwa, and Pradeep P. Mujumdar

Uncertainty assessment of rainfall patterns and the accompanying hydrological effects is essential to formulate effective adaptation strategies. Although the problem of equifinality in hydrological modelling has long been debated, its impact on hydrological analysis has not been sufficiently investigated. Traditional calibration techniques assume that input error is minimal, which might add a bias to the parameter estimates and impair the model predictions. Existing methods to overcome this issue are often weak due to both challenges in comprehending sampling errors in rainfall and processing limitations during parameter estimation. Such approaches consider structural and parameter uncertainties, whereas input and calibration data errors are often unaccounted for. This study aims to enhance the computational effectiveness of uncertainty analysis and separate the sources of uncertainty. Also, the implications of model input uncertainty to coupled human-natural-hydrologic systems and environmental changes are evaluated. A regression-based technique is developed to measure the level of uncertainty in the monsoon precipitation patterns for an urban catchment in Bangalore city, India. Sub-hourly rainfall datasets for various stations are estimated using disaggregation techniques such as scale-invariance and k-nearest neighbours-based methods. These datasets are fed into a hydrological model to connect the proposed method with the common framework for hydrological modelling. The findings demonstrate that the performance of a hydrological model is highly dependent on the spatio-temporal scale of the input rainfall in urban catchments where flash flood situations are envisaged.

How to cite: Harini, V., Wadhwa, A., and P. Mujumdar, P.: Impact of Spatio-Temporal Disaggregation of Rainfall on Hydrological Modelling, EGU General Assembly 2023, Vienna, Austria, 23–28 Apr 2023, EGU23-2705, https://doi.org/10.5194/egusphere-egu23-2705, 2023.

EGU23-3697 | ECS | Posters on site | HS7.2

Accounting for Precipitation Asymmetry in a Multiplicative Random Cascade Disaggregation Model 

Kaltrina Maloku, Benoit Hingray, and Guillaume Evin

Multiplicative random cascades (MRC) have been widely used for the disaggregation of coarse-resolution time series (e.g. daily) to high-resolution ones (e.g. sub-hourly). With MRCs, the amount of precipitation at any time step is partitioned into two parts, attributed respectively to the first and second sub-division of this time step. The partition is repeated throughout the cascade levels until the final temporal resolution is achieved.

In the so-called micro-canonical MRCs, the partition is conservative. The rainfall amounts R1 and R2 attributed respectively to the first and second sub-divisions of the considered time step (with rainfall amount R0), are expressed as R1=W1·R0 and R2=W2·R0 where the weights W1 and W2 are complementary, i.e.  W1+W2=1. The possible values of W1 are:

Therefore, for a given time step, the disaggregation is determined by the value of  W:=W1.

The probabilities p01, p10 and the distribution fW+ define the cascade generator of the MRC. For a given location, they have been found to depend on different factors. The cascade generator depends for instance on temporal scale, on precipitation intensity and on precipitation temporal asymmetry, i.e. on the temporal pattern of precipitation amounts Ri-1,Ri,Ri+1 around the amount of precipitation to disaggregate Ri (e.g. Olsson, 1998; Hingray and BenHaha, 2005). p01 tends to be higher than p10 in the case of a so-called "ascending" precipitation pattern (Ri-1<Ri<Ri+1) and,  p01 tends to be smaller than p10  in the case of a "so-called" descending pattern (Ri-1>Ri>Ri+1). Different models have been proposed to estimate p01,p10 and fW+ . Analytical scaling models are used very often because very convenient for simulation, but to date, they have disregarded the dependency on asymmetry (Paschalis et al., 2014).

Our work presents an analytical MRC modelling framework that merges the strengths of some of the different MRC models proposed in past years, allowing the cascade generator to depend in a continuous way on temporal scales, precipitation intensity and precipitation asymmetry.

We first define a precipitation asymmetry index and show how it influences the parameters of the cascade generator. This index is used to model the scaling dependency on asymmetry. We then compare four different analytical MRC models that account for the dependency on the temporal scale, precipitation intensity and/or precipitation asymmetry. An application to 81 stations in Switzerland is presented where the performance of the models is assessed. Including the asymmetry of precipitation in a model brings significant improvements in the reproduction of observed temporal persistence of precipitation in the disaggregated time series. The proposed model, with a simple parametrization, shows a great potential for regionalization, thus for the application of the approach to sites with coarse-resolution data only.


References

Hingray, B., Ben Haha, M., 2005. Statistical performances of various deterministic and stochastic models for rainfall series disaggregation. Atmospheric Research 77, 152–175.doi:10.1016/j.atmosres.2004.10.023.

Olsson, J., 1998. Evaluation of a scaling cascade model for temporal rainfall disaggregation. Hydrology and Earth System Sciences 2, 19–30. doi:10.5194/hess-2-19-1998.

Paschalis, A., Molnar, P., Fatichi, S., Burlando, P., 2014. On temporal stochastic modeling of precipitation, nesting models across scales. Advances in Water Resources 63, 152–166. doi:10.1016/j.advwatres.2013.11.006.

How to cite: Maloku, K., Hingray, B., and Evin, G.: Accounting for Precipitation Asymmetry in a Multiplicative Random Cascade Disaggregation Model, EGU General Assembly 2023, Vienna, Austria, 23–28 Apr 2023, EGU23-3697, https://doi.org/10.5194/egusphere-egu23-3697, 2023.

EGU23-4747 | ECS | Orals | HS7.2

Stochastic Simulation of Realistic Continuous Snow Depth Time Series 

Jeongha Park and Dongkyun Kim

We propose an approach for stochastic simulation of realistic continuous snow depth time series using a snow depth estimation model and a stochastic weather generation model. The snow depth estimation model consists of three steps: (1) determination of the precipitation type, (2) estimation of  the snow ratio, and (3) estimation of the decreased snow depth. In the first step, air temperature and relative humidity are used as indicators to determine the type of precipitation when precipitation occurs. In the second step, when the type is determined as snow, the snow ratio is estimated, converting the depth of precipitation into depth of fresh snow. Here, the air temperature is used as an indicator to estimate the snow ratio using sigomidal relationship with the snow ratio. In the last step, the amount of decreased snow depth was estimated using a novel temperature index snowmelt equation considering a trend of depth-dependent decreasing snow depth. The snow depth estimation model was applied to the four snowiest meteorological stations of Korea and yielded high Nash Sutcliffe efficiency values which ranged between 0.745 and 0.875 for calibration, and ranged between 0.432 and 0.753 for validation. This calibrated snow depth estimation model was then applied to the simulated weather time series (precipitation, temperature, and relative humidity) from the stochastic weather generation model to simulate continuous snow depth time series. The simulated snow depth data accurately reproduced standard and extreme value statistics of the observed data, the latter of which were consistent with the estimates provided in Korean Building Code. Then, the model was extended to investigate the influence of climate change on the future snow depth. For this, future weather statistics were obtained by applying factor of change to the current weather statistics and then were used to calibrate the weather generation model. Lastly, the future snow depth time series for three future time windows (2021-2040, 2041-2070, and 2071-2100) were simulated using future weather time series and snow depth estimation model.


This research was supported by a grant(2022-MOIS61-003) of Development Risk Prediction Technology of Storm and Flood for Climate Change based on Artificial Intelligence funded by Ministry of Interior and Safety(MOIS, Korea).

How to cite: Park, J. and Kim, D.: Stochastic Simulation of Realistic Continuous Snow Depth Time Series, EGU General Assembly 2023, Vienna, Austria, 23–28 Apr 2023, EGU23-4747, https://doi.org/10.5194/egusphere-egu23-4747, 2023.

EGU23-4828 | Posters on site | HS7.2

Investigating the quality of radar composites in a mountainous region in northeastern Thailand 

Punpim Puttaraksa Mapiam, Monton Methaprayun, Apiniti Jotisankasa, and Thom Bogaard

Composite radar products are made by combining radar scans of multiple radar stations into a single product to improve the quality of the radar product in overlapping region and to visualize the distribution and movement of precipitation over a large area. The reliability of radar composites depends on radar data quality, as each radar measurement is influenced by, among others, atmospheric conditions, interference with other sources, and the radar specifications. The quality of rain radar composites is critical as these products will be used for near real-time forecasting of hydrometeorological hazards. This research aims to investigate the controlling factors influencing the quality of radar composites over a hazard-prone mountainous region in northeastern Thailand. In this study we evaluate and quantify the rain radar composites by looking at four quality indexes among the distance to the radar station (DTR), the height of the beam above the ground (HTG), the radar beam blockage fraction (BBF), and the radar reflectivity fraction between the composited radar stations (RRF). For our overarching research to build a near real-time forecasting system for landslide and flashflood warnings in the Khao Yai National Park, Lamtakong basin and surroundings. Hereto, local cells of high intensity precipitation should be derived with highest accuracy. Two rain radar stations were selected: Sattahip, 220 kilometer southwest and Phimai, 140 kilometer North of the Lamtakong basin. Automatic rain gauges in the overlapping area were used to evaluate the radar composite product during storm events in 2020. The results indicated that specific quality indexes could be used to identify areas with inaccurate or unreliable raw data. This was a particular advantage in areas where the radar beam was (partly) blocked by an obstacle and underestimated the intensity of the storm. The BBF was the most important quality index in the study area. Moreover, combining the BBF with the RRF could increase the accuracy and reliability of radar rainfall estimates. Overall, using radar composites with raw radar data quality control can play an essential role in improving near real-time nowcasting for further natural hazard mitigation in the mountainous area.

How to cite: Mapiam, P. P., Methaprayun, M., Jotisankasa, A., and Bogaard, T.: Investigating the quality of radar composites in a mountainous region in northeastern Thailand, EGU General Assembly 2023, Vienna, Austria, 23–28 Apr 2023, EGU23-4828, https://doi.org/10.5194/egusphere-egu23-4828, 2023.

EGU23-5224 | Posters on site | HS7.2

Projected changes in precipitation variability over Europe in CMIP6 climate models 

Eva Plavcová, Romana Beranová, Radan Huth, and Ondřej Lhotka

Changes in the amount, intensity, frequency and type of precipitation are observed in some places over recent decades (IPCC 2021). While much effort has been devoted to analyzing long-term changes in mean values and extremes, studies on changes in precipitation variability have been rather scarce. Long-term changes in climate variability are, nevertheless, an important aspect of the climate change with various impacts on society and environment. Therefore it is necessary to know whether and how the precipitation variability will change in the future. To this end, it is important that it is simulated correctly by recent climate models. In our study, we analyze outputs from an ensemble of different CMIP6 global climate models and several reanalyses and gridded observed datasets. We study long-term changes in day-to-day precipitation variability and how they differ between various datasets for the historical and current climate. We evaluate how successful the climate models are in reproducing precipitation variability, while identifying biases and errors common to all models or to groups of models. We analyze projected changes of short-term precipitation variability in model simulations over the whole 21st century. We focus on the North Atlantic-European sector. We consider wet-to-wet and dry-to-dry transition probabilities as a measure of short-term precipitation variability, focusing on winter and summer seasons separately.


Ref.: IPCC, 2021: Summary for Policymakers. In: Climate Change 2021: The Physical Science Basis. Contribution of Working Group I to the Sixth Assessment Report of the Intergovernmental Panel on Climate Change [Masson-Delmotte, V., P. Zhai, A. Pirani, S.L. Connors, C. Péan, S. Berger, N. Caud, Y. Chen, L. Goldfarb, M.I. Gomis, M. Huang, K. Leitzell, E. Lonnoy, J.B.R. Matthews, T.K. Maycock, T. Waterfield, O. Yelekçi, R. Yu, and B. Zhou (eds.)].

How to cite: Plavcová, E., Beranová, R., Huth, R., and Lhotka, O.: Projected changes in precipitation variability over Europe in CMIP6 climate models, EGU General Assembly 2023, Vienna, Austria, 23–28 Apr 2023, EGU23-5224, https://doi.org/10.5194/egusphere-egu23-5224, 2023.

EGU23-5717 | ECS | Posters on site | HS7.2

Testing the performance of different WRF planetary boundary layer parameterizations schemes in the precipitation simulation under different Weather Regimes 

Joana Martins, David Carvalho, Alfredo Rocha, and Susana Cardoso Pereira

Surface meteorology is dominated by atmospheric boundary layer processes. Due to their typical low spatial resolution, numerical weather prediction models are not able to explicitly resolve such sub-grid scale processes, and as such use physical parameterization schemes to implicitly take into account these processes' influence on atmospheric variables. It is well known that the performance of such physical parameterization schemes depends on the atmospheric state of each location, season, etc.

This work aims to investigate the performance of six different WRF PBL parameterization schemes in the simulation of the precipitation over continental Portugal, under different weather regimes, or weather types. For this, a set of six weather regimes, which represent 96% of Portugal's atmospheric states were identified and for each WR, six different PBL parameterization schemes were tested.

Preliminary results show that for the entire region, the lowest spacial mean difference between observations and simulations is shown by the TEMF scheme parameterization for the positive phase of the North Atlantic Oscillation (NAO +) and Scandinavian height Weather Regimes,  MYJ for Summer Pattern, Anti-blocking (AB) and negative phase of the North Atlantic Oscillation (NAO -), and ACM2 scheme for Blocking (BLO) Weather Regime.

How to cite: Martins, J., Carvalho, D., Rocha, A., and Cardoso Pereira, S.: Testing the performance of different WRF planetary boundary layer parameterizations schemes in the precipitation simulation under different Weather Regimes, EGU General Assembly 2023, Vienna, Austria, 23–28 Apr 2023, EGU23-5717, https://doi.org/10.5194/egusphere-egu23-5717, 2023.

EGU23-6081 | ECS | Posters on site | HS7.2

Investigating the effects of extreme rainfall trends on the flow capacity of streams over the Northeast United States 

Stergios Emmanouil, Andreas Prevezianos, Andreas Langousis, and Emmanouil N. Anagnostou

While various research efforts investigate the direct effects of climate change on hydrometeorological variables, the incidental consequences of extreme rainfall trends on the flow capacity of open channels remains an open question. Hydrological modeling for the assessment of flood events and the organization of protection strategies usually include precipitation fields transformed by climate change factors. The latter, however, simply account for the relation (frequently through a ratio) between past and future Intensity-Duration-Frequency (IDF) values. Along these lines, epistemic uncertainties introduced by the choice of the IDF estimation techniques and/or the extensive incorporation of climate model simulations are accounted for through the application of safety factors on the yielded results. Yet, this practice may lead to a misestimation of flood risk, accompanied by costly, yet ineffective, protective measures. Moreover, the employment of high-resolution distributed hydrological models over extensive areas can be computationally cumbersome, while introducing an additional layer of uncertainty. In this study, we attempt to link the occurrence of channel overflowing to the evolution of the magnitude and frequency of extreme rainfall over the Northeast United States. More precisely, we: a) use measured streamflow data offered by the United States Geological Survey (USGS) during the 41-year period from 1979 to 2019, to assess the rate of occurrence of flood events over gauge locations across the study domain, and b) link the observed evolution of the aforementioned overflow rates to that of extreme rainfall for different return periods and durations of temporal averaging. In this context, we attempt to develop a conceptual basis for studying the effects of climate change on the linkage between rare precipitation events and the reliability of existing channels.

How to cite: Emmanouil, S., Prevezianos, A., Langousis, A., and Anagnostou, E. N.: Investigating the effects of extreme rainfall trends on the flow capacity of streams over the Northeast United States, EGU General Assembly 2023, Vienna, Austria, 23–28 Apr 2023, EGU23-6081, https://doi.org/10.5194/egusphere-egu23-6081, 2023.

EGU23-6267 | ECS | Posters on site | HS7.2

Daily extremes from the MSWEP global rainfall dataset compared to estimates from buoy networks through MEVD-based downscaling 

Giorgio Dalmasso, Emmanouil Anagnostou, Luca Brocca, Elsa Cattani, Gaby Gruendemann, Lanxin Hu, Sante Laviola, Vincenzo Levizzani, Francesco Marra, Christian Massari, Efrat Morin, Efthymios Nikolopoulos, Ruud van Der Ent, Enrico Zorzetto, and Marco Marani

Estimating the frequency of extreme precipitation events, both locally and over extended areas, is key for developing risk reduction measures in present and future climates. Large areas of the world are characterized by sparse or absent rain-gauge networks, which poses significant challenges to the estimation of extreme events in many applications. Remote sensing and reanalysis datasets may contribute to filling some of these gaps, but their use meets some important obstacles: 1) remote sensing/reanalysis rainfall estimates are defined at coarse resolutions, thereby preventing direct validations against ground observations; 2) they usually span a ~20-year observation period, making it difficult to estimate the frequency of large extremes; 3) they suffer from significant uncertainties. Using the novel Metastatistical Extreme Value Distribution (MEVD) and a recent statistical downscaling technique, we compare ground and satellite-based/model estimates of rainfall to quantify the improvement achieved through downscaling in high-quantile quantification. We focus on ocean rainfall observations, which are rarely considered in validating global databases, from the Tao-Triton, Pirata, and Rama buoy networks. We quantify the estimation uncertainty for point extremes associated with the MSWEP rainfall dataset. We find that the MEVD-based extreme value downscaling approach generally improves point extreme estimates. 

How to cite: Dalmasso, G., Anagnostou, E., Brocca, L., Cattani, E., Gruendemann, G., Hu, L., Laviola, S., Levizzani, V., Marra, F., Massari, C., Morin, E., Nikolopoulos, E., van Der Ent, R., Zorzetto, E., and Marani, M.: Daily extremes from the MSWEP global rainfall dataset compared to estimates from buoy networks through MEVD-based downscaling, EGU General Assembly 2023, Vienna, Austria, 23–28 Apr 2023, EGU23-6267, https://doi.org/10.5194/egusphere-egu23-6267, 2023.

EGU23-6571 | ECS | Posters on site | HS7.2

Analysis of Projected Changes in Seasonal Precipitation Amounts for Central Asia Using the CMIP6 Multi-Model Ensemble Approach 

M. Tufan Turp, Nazan An, Zekican Demiralay, B. Cem Avcı, and M. Levent Kurnaz

Particularly due to its arid and semi-arid nature, the environmental, ecological and socio-economic systems of Central Asia are under serious threat of climate change. Depending on the climate change in Central Asia, water resources spread over limited physiographic regions in the domain, grasslands and related livestock are the elements that will be adversely affected by the negative changes. The vital resource in the arid and semi-arid Central Asia region, which is a kind of large continental rain shadow basin surrounded by mountains, is therefore water. For this reason, in this study, the changes in the total precipitation for Central Asia, which is the core region of the Asia continent and one of the 14 main domains of the COordinated Regional climate Downscaling EXperiment (CORDEX), were examined within the scope of Coupled Model Intercomparison Project-Phase 6 (CMIP6) models. In the study, a multi-model ensemble mean approach was applied in order to investigate the projected changes in seasonal precipitation amounts for three different future quarters (i.e., 2025-2049, 2050-2074, and 2075-2099) with respect to the reference period of 1975-1999 under various Shared Socioeconomic Pathways (i.e., SSP1-2.6, SSP2-4.5, SSP3-7.0, and SSP5-8.5).

Acknowledgement: This research has been supported by Boğaziçi University Research Fund Grant Number 19367. 

How to cite: Turp, M. T., An, N., Demiralay, Z., Avcı, B. C., and Kurnaz, M. L.: Analysis of Projected Changes in Seasonal Precipitation Amounts for Central Asia Using the CMIP6 Multi-Model Ensemble Approach, EGU General Assembly 2023, Vienna, Austria, 23–28 Apr 2023, EGU23-6571, https://doi.org/10.5194/egusphere-egu23-6571, 2023.

EGU23-6866 | ECS | Orals | HS7.2

Sub-kilometre resolution climate model data: Added benefits in the representation of extreme precipitation? 

Emma Dybro Thomassen, Karsten Arnbjerg-Nielsen, Hjalte J. D. Sørup, Peter L. Langen, Jonas Olsson, Rasmus A. Pedsersen, and Ole B. Christensen

Climate change impact on extreme precipitation is of great importance to society. Small-scale, short-term events can have massive social and socioeconomic consequences. The present study analyses a new sub-kilometre (750 m) HARMONIE-Climate1 model simulation driven by ERA5 reanalysis data. The new sub-kilometre climate model data (750 m) is compared to NorCP data2 from climate models in 3, 5, and 12 km grid spacing, rain gauge station data and reanalysis data in 31 and 79 km resolution. The study examines a case area covering Denmark for five cloudburst seasons (April – October). The study aims to analyse how convective events are represented in the climate model data across grid resolution, and if an added benefit can be identified moving to sub-kilometre resolution.

Extreme convective events are analysed across datasets with respect to diurnal cycle, intensity levels and spatial structure. This is done at both hourly and sub-hourly scales. The 750 m climate model performs better for most metrics. However, climate models with 3 and 5 km grid spacing also perform well. The added computational and storage cost of the sub-kilometre scale experiments, thus only results in limited added benefit for this specific model set-up. Analysing hourly and sub-hourly temporal scales shows that the model performance varies between different temporal scales. The convection-permitting models, in general, represent hourly extremes much better than sub-hourly extremes. The sub-hourly scale is, therefore, essential to analyse to assess the model performance of convective events.

1 Belušić D, De Vries H, Dobler A, Landgren O, Lind P, Lindstedt D, Pedersen RA, Carlos Sánchez-Perrino J, Toivonen E, Van Ulft B, et al (2020) HCLIM38: A flexible regional climate model applicable for different climate zones from coarse to convection-permitting scales. Geosci Model Dev 13:1311–1333. https://doi.org/10.5194/gmd-13-1311-2020

2 Lind P, Lindstedt D, Kjellström E, Jones C (2016) Spatial and Temporal Characteristics of Summer Precipitation over Central Europe in a Suite of High-Resolution Climate Models. J Clim 29:3501–3518. https://doi.org/10.1175/JCLI-D-15-0463.1

How to cite: Dybro Thomassen, E., Arnbjerg-Nielsen, K., J. D. Sørup, H., L. Langen, P., Olsson, J., A. Pedsersen, R., and B. Christensen, O.: Sub-kilometre resolution climate model data: Added benefits in the representation of extreme precipitation?, EGU General Assembly 2023, Vienna, Austria, 23–28 Apr 2023, EGU23-6866, https://doi.org/10.5194/egusphere-egu23-6866, 2023.

EGU23-6981 | ECS | Orals | HS7.2

High-resolution simulations of tropical island thunderstorms: Does an increase in resolution improve the representation of extreme rainfall? 

Martin Bergemann, Todd Lane, Scott Wales, Sugata Narsey, and Valentin Louf

Recent increases in computational resources have led to the application of kilometre- and sub-kilometre-scale simulations in research, numerical weather prediction, and climate modelling alike. Despite anticipated improvements with resolution, there is still considerable work needed to evaluate how well such models improve the representation of intense convection. In this study we conduct ensemble simulations with kilometre- and sub-kilometre-scale horizontal grids to investigate intense convective events in the tropical island thunderstorm system Hector, which frequently occurs over the Tiwi Islands in North Australia. To avoid losing information through spatio-temporal averaging we apply a tracking algorithm to simulated and observed storms. When compared with observations, the model storms exhibit a lack of propagation across the study domain. In general, simulated storms are too intense but too small and too short-lived. This is especially true for the sub-kilometre simulations, where storms are more intense, smaller, and more numerous than in the kilometre-scale counterparts. We argue that size and duration errors compensate for storm number and intensity errors, which could lead to misleading interpretations when only comparing time and space averages of rainfall fields. Investigating some properties of the simulated storms suggests that storms with high rainfall intensities have stronger updrafts in the sub-kilometre model and are accompanied by an increase in cold pool intensity. The results and their resolution sensitivities highlight that the remaining parametrisations and their many tuning parameters in high-resolution set-ups influence the representation of convective storms in such models.

How to cite: Bergemann, M., Lane, T., Wales, S., Narsey, S., and Louf, V.: High-resolution simulations of tropical island thunderstorms: Does an increase in resolution improve the representation of extreme rainfall?, EGU General Assembly 2023, Vienna, Austria, 23–28 Apr 2023, EGU23-6981, https://doi.org/10.5194/egusphere-egu23-6981, 2023.

EGU23-7682 | ECS | Orals | HS7.2

A stochastic rainfall model with intensity dependent autocorrelations. 

András Bárdossy and Faizan Anwar

The space-time behaviour of precipitation is very complex. The knowledge of the dependence structures in space and time is very important for the assessment of flood risks. There are many different models available for stochastic simulations of precipitation time series. Most of the models are constructed such that the simulated time series match the autocorrelation structure of the observations in time along with the reproduction of spatial correlations. However, both auto and spatial correlations are value dependent i.e., if it is the upper or the lower tail. High and low intensity values have different dependence structures which have a significant influence on simulated extremes in space. In this presentation, first indicator correlations are introduced to show the intensity dependence of precipitation both in space and time at various resolutions. Then, a stochastic simulator based on gradual change of the correlations for the values in different parts of the distributions is introduced. The idea is that value dependent correlation is changed in such a way that the overall values remains same as that of a reference but not when considering values in different sections of the distributions alone. The model is applied to a large number of German catchments with hourly temporal resolution. The results are carefully analysed and compared to classical approaches.

How to cite: Bárdossy, A. and Anwar, F.: A stochastic rainfall model with intensity dependent autocorrelations., EGU General Assembly 2023, Vienna, Austria, 23–28 Apr 2023, EGU23-7682, https://doi.org/10.5194/egusphere-egu23-7682, 2023.

EGU23-7751 | ECS | Orals | HS7.2

A Coarse-to-Fine Deep Learning Framework for High-Resolution Future Precipitation Map Generation 

Shan Zhao, Zhitong Xiong, and Xiao Xiang Zhu

Precipitation nowcasting, aiming to predict the rainfall intensity in the near future (usually 0-2h) [1], is crucial for urban planning, flood monitoring, agriculture management, and so on. Numerical weather modeling (NWP) takes a variety of data sources as the input of complex computer models that use mathematical equations to simulate the behavior of the atmosphere. Limited by the time needed for model spin-up, the performance in the short near future is not satisfactory. Deep learning (DL)-based method fills in the gap by treating nowcasting as a video prediction problem. The Convolutional LSTM [2] extracts spatial information when dealing with temporal series. The Generated Adversarial Network (GAN)-based [3] method shows potential in simulating the realisticness of the precipitation field. However, training such a model is very time-consuming and data-demanding [3] [4]. Different from natural images, the precipitation field to be estimated usually has a larger spatial size. Moreover, the convolutional layers tend to oversmooth the output and eliminate the small patterns that are important for the meteorologists to make the decision. Thus, we proposed a two-stage framework: the first one is to train an RNN-based model on the coarse field. The second is to downscale and style transfer from the coarse field to high-resolution precipitation maps based on GAN and Graph Convolutional Network (GCN). The coarse prediction will act as a constraint to the finer scale output and allows re-assignment of the spatial distribution of intensities. Such probabilistic output prevents the overestimation of the intensity. RNN is good at capturing long-range characteristics, and GCN [5] can extract local and neighborhood information, thus these two channels are naturally complementary to improve both local patterns and global accuracy scores. The GAN is used to make final output similar to real precipitation maps such as radar scans. To train the model, we downloaded the 2006-2016 ERA5 total precipitation at 0.25-degree spatial resolution and the DWD radar map [6] at 1km spatial resolution. We expect our model can capture the overall coverage of rainfall events and depict the spatial details. More importantly, this alleviates the data shortage problem, i.e., high-resolution precipitation nowcasting at places without ground-based radar stations can be acquired.


[1] Shi, Xingjian, et al. "Deep learning for precipitation nowcasting: A benchmark and a new model." Advances in neural information processing systems 30 (2017).

[2]Shi, Xingjian, et al. "Convolutional LSTM network: A machine learning approach for precipitation nowcasting." Advances in neural information processing systems 28 (2015).

[3] Ravuri, Suman, et al. "Skilful precipitation nowcasting using deep generative models of radar." Nature 597.7878 (2021): 672-677.

[4] Sønderby, Casper Kaae, et al. "Metnet: A neural weather model for precipitation forecasting." arXiv preprint arXiv:2003.12140 (2020).

[5] Shi, Yilei, Qingyu Li, and Xiao Xiang Zhu. "Building segmentation through a gated graph convolutional neural network with deep structured feature embedding." ISPRS Journal of Photogrammetry and Remote Sensing 159 (2020): 184-197.

[6] Ayzel, Georgy, Tobias Scheffer, and Maik Heistermann. "RainNet v1. 0: a convolutional neural network for radar-based precipitation nowcasting." Geoscientific Model Development 13.6 (2020): 2631-2644.

How to cite: Zhao, S., Xiong, Z., and Zhu, X. X.: A Coarse-to-Fine Deep Learning Framework for High-Resolution Future Precipitation Map Generation, EGU General Assembly 2023, Vienna, Austria, 23–28 Apr 2023, EGU23-7751, https://doi.org/10.5194/egusphere-egu23-7751, 2023.

EGU23-8567 | ECS | Posters on site | HS7.2

A parsimonious and efficient statistical method to correct large scale precipitation products: Empirical Conditional Probability (ECP)method 

Shima Azimi, Christian Massari, Silvia Barbetta, and Riccardo Rigon

Satellite-based precipitation products show significant bias with respect to ground-based data which prevents their use in several geophysical applications. In this study, we developed a method, the “Empirical Conditional Probability (ECP) method”, to augment the information of remotely sensed precipitation products using ground-based observation. The method relaxes the assumption of Gaussianity typical of many statistical processors which is a strong limitation specifically for the heavily skewed and intermittent daily precipitation signal leading to problems such as extrapolation to extreme values. We proposed a non-parametric and parsimonious approach to optimally merge the satellite and ground-based data.

The performance of our developed method is investigated in different experiments using the Climate Hazards Group InfraRed Precipitation with Station data (CHIRPS) precipitation product. Rain gauges are assumed as a priori information (predictors) about the true precipitation and is used to provide its posterior probabilistic estimation by our proposed empirical conditional probability approach. We compare our method with the classical Quantile mapping (QM) correction method to evaluate the added value of our approach.

The analysis was carried out in Aosta Valley, a region located in northern Italy with a dense rain gauge network. The time series was split into two sub-periods: 2008-2021 was used for generating the posterior distribution of precipitation and 2005-2007 was used for the validation of the method. The results demonstrated that the corrected CHIRPS product by our method is superior with respect to the original CHIRPS product and the corrected one with QM during both split periods (i.e., it performs better in terms of KGE, R, NSE, and RMSE). In a second experiment, using the proposed method, the posterior probability distribution of precipitation has been obtained according to the kriged ground-based precipitation data. In this way, instead of having gridded single-value data, a range of expected values is available for each pixel.

The idea of using uncertainty assessment for the satellite data (specifically precipitation) is going toward having cubic uncertainty-conscious satellite products with a range of expected values. Furthermore, since the ECP method is based on ground data, we investigated the sensitivity of the method to the density of rain gauges.

How to cite: Azimi, S., Massari, C., Barbetta, S., and Rigon, R.: A parsimonious and efficient statistical method to correct large scale precipitation products: Empirical Conditional Probability (ECP)method, EGU General Assembly 2023, Vienna, Austria, 23–28 Apr 2023, EGU23-8567, https://doi.org/10.5194/egusphere-egu23-8567, 2023.

EGU23-9370 | Orals | HS7.2

Stochastic simulation of daily precipitation extremes in West Africa 

Jan Bliefernicht, Manuel Rauch, Marlon Maranan, Andreas Fink, and Harald Kunstmann

West Africa is one of the most data-poor regions in the world. In-situ precipitation observations are not available for many sites or contain many data gaps, thus leading to uncertainties and biases in hydrological studies in this region. To address this fundamental problem, we present a straightforward stochastic approach based on turning bands to simulate daily precipitation fields. Our approach is based on meta-Gaussian frameworks that generate Gaussian random fields, which are transformed into "real-world" precipitation fields using transfer functions. The simulation approach is tested for multiple extremes (1991 – 2016) in the Ouémé river basin in West Africa using different model settings and the most comprehensive station-based precipitation dataset available for this region. The evaluation shows that our approach is a valuable tool for simulation of daily precipitation fields and clearly outperforms classical interpolation techniques (e.g., ordinary kriging). Moreover, the simulation method can be conditioned on observations, uses only a small set of parameters and is an efficient algorithm for ensemble generation of precipitation fields for ungauged areas and design events.  In our West African research projects FURIFLOOD, the precipitation simulations are used as input information for hydrological modeling to reconstruct observed flood events and to create improved hazard maps for this region. Overall, the application of this advanced technique contributes to a better understanding of precipitation uncertainties and to the provision of improved station-based precipitation products for this challenging region.  


How to cite: Bliefernicht, J., Rauch, M., Maranan, M., Fink, A., and Kunstmann, H.: Stochastic simulation of daily precipitation extremes in West Africa, EGU General Assembly 2023, Vienna, Austria, 23–28 Apr 2023, EGU23-9370, https://doi.org/10.5194/egusphere-egu23-9370, 2023.

The knowledge of the statistical variability of precipitation (P) at short durations (≤24 h) is necessary to support engineering applications and hydrologic modeling. In this talk, we provide novel insights into the seasonal and spatial variability of two statistical properties of short-duration P that have received less attention, including the spatiotemporal correlation structure (STCS) and the marginal distribution. To this end, we design a framework based on multisite Monte Carlo simulations with the Complete Stochastic Modeling Solution (CoSMoS) which we test using a dense network of 223 high-resolution (30 min) rain gages with more than 20 years of observations in central Arizona. We first show that an analytical model and a three-parameter probability distribution capture the empirical STCS and marginal distribution of P, respectively, across Δt’s from 0.5 to 24 h and the summer and winter seasons. We then conduct Monte Carlo multisite stochastic simulations of P time series with CoSMoS, which reveal that the statistical properties of short-duration P exhibit significant seasonal differences, especially at low Δt. In summer, the STCS of P is weaker and the distributions are heavy-tailed because of the dominance of localized convective thunderstorms. Winter P has instead stronger STCS and lighter tails of the distributions as a result of more widespread and longer frontal systems. The Monte Carlo experiments also demonstrate that, in most cases, P is characterized by a homogeneous and isotropic STCS across the region, and by parameters of the marginal distribution that are constant for the shape and dependent on elevation for scale and P occurrence. The only exception is winter P at Δt ≥ 3 h, where anisotropy could be introduced by the motion of frontal storms, and additional factors are required to explain the variability of the scale parameter. The findings of this work are useful for improving stochastic P models and validating convection-permitting atmospheric models.

How to cite: Mascaro, G., Papalexiou, S., and Wright, D.: Utility of Multisite Stochastic Simulations to Characterize and Model the Seasonal and Spatial Variability of Short-Duration Precipitation, EGU General Assembly 2023, Vienna, Austria, 23–28 Apr 2023, EGU23-10062, https://doi.org/10.5194/egusphere-egu23-10062, 2023.

The intensity and frequency of extreme rainfall events are likely to increase under projected climate change scenarios. Given the adverse socio-economic impacts of these extreme events, we need to model their risk to develop effective policies for adaptation and mitigation. Simulating local hydrometeorological processes at the resolutions essential for assessing impacts and planning is computationally expensive using global climate models. Thus, there is a demand for efficacious downscaling from the coarse-resolution climate model outputs to the finer local scales of interest. Here, we develop a dynamic data-driven model coupled with physics, to downscale coarse-resolution climate model outputs (0.25° × 0.25°) to high-resolution (0.01° × 0.01°) rainfall. The downscaled rainfall is initially estimated by actively searching data on a manifold to learn the downscaling function incrementally using an iterative Gaussian process (GP). Upon convergence, the “first-guess” downscaled rainfall field, along with a physics-based estimation of orographic rainfall are processed by an adversarial learning framework (GAN) to refine finer-scale details. A stochastic sampling model and optimal estimation are used to correct the biases and obtain the final rainfall super-resolution fields. We assess the skill of the proposed model, using ERA5 reanalysis data and Daymet observation data at different terrain conditions (plain and hilly), and show that the downscaled rainfall closely matches the ground truth spatial patterns and extreme rainfall risk. By comparing the performance of individual components of our model (GAN, GP, and Physics) we find that the combined model outperform the individual components, and the GAN accounts for the maximum performance gain of the downscaling model.

How to cite: Saha, A. and Ravela, S.: Downscaling Precipitation Extremes Using Physics-coupled Dynamic Data Driven Adversarial Learning, EGU General Assembly 2023, Vienna, Austria, 23–28 Apr 2023, EGU23-10931, https://doi.org/10.5194/egusphere-egu23-10931, 2023.

Tuning is now recognised as a key step in climate modelling, and the rise of machine learning techniques is increasing the number of targets used to tune these models. There are several reasons to focus on continental surface tuning. Firstly, a significant part of the sources of uncertainty in regional climate projections lie in the interactions between the atmosphere and the land surface. Secondly, the quality of climate change impact studies highly depends on a good representation of the climate at the surface. Finally, tuning at the surface can benefit from observational sites that provide multivariate, in situ hourly data of many meteorological, radiative and turbulent flux variables.

The objective here is to constrain the water and energy balances at the atmosphere-continental surface interface in the IPSL GCM, using as reference the in-situ observations of the SIRTA instrumented site (Paris suburb). A configuration of the coupled atmosphere (LMDZ) and continental surface (ORCHIDEE) model is set up on a zoomed grid in order to have a 30 km side mesh on the SIRTA point while keeping a reasonable computational cost. In addition, the winds (and possibly the temperature and humidity) are nudged towards the ERA5 reanalyses in order to compare the weather sequences observed at SIRTA with those of the climate model. This nudging technique allows a significant part of the internal variability of the local meteorology simulated by the GCM to be removed and to compare observations and model on a day-to-day basis. An essential step in setting up the tuning of this configuration is to assess the different sources of uncertainty involved. In this presentation, the characterisation of the uncertainties associated with the choice of configuration and the internal variability will be addressed more specifically, with a focus on clouds and precipitation.

In order to characterise the uncertainty linked to the internal variability, we compare the precipitation variability of a simulation ensemble with perturbed initial conditions with that of a perturbed physical ensemble obtained by machine-assisted exploration of the free parameters of the models. The internal variability of the precipitation simulated at SIRTA is found to be of the same order of magnitude as the parametric sensitivity, especially during convective periods, which questions the possibility of a tuning against SIRTA observations. We use a rainfall product (combining radar and rain gauges) from Météo-France in order to evaluate both the representation of spatial and temporal variability in a wider area around SIRTA and the associated uncertainty for tuning. We also present results concerning the uncertainty due to the configuration based on sensitivity tests to the grid configuration and the nudging setup. Finally, we evaluate the part of the precipitation variability due to the soil response by imposing an evaporation factor on the study area. We show how this configuration can be used in the atmosphere model tuning strategy, as it allows to get rid of the rainfall evaporation feedback.

How to cite: Coulon Decorzens, M. and Hourdin, F.: Assessment of precipitation variability sources in a GCM for the implementation of a tuning methodology using in-situ observations, EGU General Assembly 2023, Vienna, Austria, 23–28 Apr 2023, EGU23-12080, https://doi.org/10.5194/egusphere-egu23-12080, 2023.

EGU23-13343 | Posters on site | HS7.2

The Application of Informational Predictability to Rainfall Data 

Alin-Andrei Carsteanu and Félix Fernández Méndez

Informational predictability, as defined in Fernández Méndez et al. [Stoch. Environ. Res. Risk Assess. (2023), submitted for publication] is based on the normalized complement of the expected value of the logarithm of the conditional probability, to be precise, this refers to the probability of the predicted events, when conditioned upon their respective predictors. The present work focuses on balancing the precision of the prediction, as measured by the narrowness of the predicted intervals, against the respective probabilities of a correct prediction, which finally amounts to maximizing the informational predictability. The data are high-resolution temporal rainfall intensity series, measured by an optical rain gauge.

How to cite: Carsteanu, A.-A. and Fernández Méndez, F.: The Application of Informational Predictability to Rainfall Data, EGU General Assembly 2023, Vienna, Austria, 23–28 Apr 2023, EGU23-13343, https://doi.org/10.5194/egusphere-egu23-13343, 2023.

EGU23-13346 | ECS | Posters on site | HS7.2

The impact of vertical mixing schemes on the position of the ITCZ in the eastern tropical Pacific 

Chiara De Falco, Priscilla A. Mooney, and Jerry Tjiputra

The presence of a double Intertropical Convergence Zone (ITCZ) in the tropical Pacific is a persistent feature of global coupled ocean-atmosphere models that gives rise to excessive precipitation south of the equator. The ITCZ position is extremely sensitive to changes in the magnitude and distribution of the Sea Surface Temperature (SST) in the tropical band, due to the strong coupling between SST and convective precipitationThe complexity of the air-sea interactions makes it hard to disentangle the different mechanisms at play to identify the main driving processes behind this ubiquitous bias. Here, we use a coupled ocean-atmosphere regional model, the Coupled-Ocean-Atmosphere-Wave-Sediment Transport (COAWST) Modeling System, to investigate the impact that different parametrizations of the oceanic vertical mixing have on the water column dynamic, SST and subsequently the convective precipitation distribution in the eastern tropical Pacific. The model includes an atmospheric component, the Weather Research and Forecast Model (WRF), and an oceanic component, the Regional Ocean Modeling System (ROMS). The same atmospheric setup, with a resolution of 20km, has been forced with observed SSTs and with two ocean parameterizations. Different temperature gradients and oceanic stratification give rise to a double ITCZ or to a southward shift of the maximum precipitation band. Particularly in late winter and spring, a surface warming of a few degrees south of the equator around 5°S affects the distribution of the sea level pressure. The consequent changes in the surface wind pattern impact the usually asymmetric behavior of the trade winds, the south easterlies are no longer able to cross the equator and converge in the ITCZ in the northern hemisphere.  

How to cite: De Falco, C., Mooney, P. A., and Tjiputra, J.: The impact of vertical mixing schemes on the position of the ITCZ in the eastern tropical Pacific, EGU General Assembly 2023, Vienna, Austria, 23–28 Apr 2023, EGU23-13346, https://doi.org/10.5194/egusphere-egu23-13346, 2023.

EGU23-14002 | ECS | Orals | HS7.2

On the improved ensemble of multi-source precipitation through joint automated machine learning-based classification and regression 

Hao Chen, Tiejun Wang, Carsten Montzka, Huiran Gao, Ning Guo, Xi Chen, and Harry Vereecken

Accurate precipitation representation at local and global scales will greatly improve our understanding of climate system changes. However, no precipitation estimate consistently has the lowest errors (systematic biases, random error, and rain/no-rain classification error) under varying environmental gradients, resulting in considerable uncertainty when investigating mechanisms and making predictions. Multiple Source Precipitation Ensemble (MSEP) is regarded as an indispensable approach to this challenge. Based on an automatic machine learning workflow, we propose an MSPE framework that uses machine learning classification and regression jointly. Six distinct precipitation products (e.g., satellite- and reanalysis-based estimates) and their ensembles based on different framework strategies were examined comprehensively at 818 gauges across China and 500 randomly selected sites (representing ungauged regions). The unique features of MSPE were investigated, including the necessity of assigning spatiotemporal dynamic weights and the usage of machine learning classification and regression jointly. Results demonstrated that MSPE could effectively reduce both random and classification errors associated with precipitation occurrences. In addition, the capacity to generalize and the interpretability of the ML models developed within the framework were compared and discussed in depth. We also summarized the current framework's limitations and potential expansions. The framework presented in this research is expected to be a robust and flexible framework for the global application of ensembles of precipitation estimates from numerous scales, data sources, and time periods.

How to cite: Chen, H., Wang, T., Montzka, C., Gao, H., Guo, N., Chen, X., and Vereecken, H.: On the improved ensemble of multi-source precipitation through joint automated machine learning-based classification and regression, EGU General Assembly 2023, Vienna, Austria, 23–28 Apr 2023, EGU23-14002, https://doi.org/10.5194/egusphere-egu23-14002, 2023.

EGU23-14531 | Orals | HS7.2

A CP conditioned hybrid weather generator 

Ross Pidoto and Uwe Haberlandt

Long continuous time series of meteorological variables such as temperature and precipitation are required for applications such as derived flood frequency analyses. Observed time series are however generally too short, too sparse in space, or incomplete, especially at the sub-daily timestep. Stochastic weather generators allow an alternative to using observations, being able to generate time series of arbitrary length which are then used as input to hydrological models.

A hybrid hourly space-time weather generator has been developed based on a stochastic alternating renewal rainfall model. Modelling of non-rainfall climate variables is achieved using a non-parametric k-nearest neighbour (k-NN) resampling approach, which is coupled to the space-time rainfall model via rainfall state.

Circulation pattern (CP) or weather pattern classifications can be useful as a conditioning variable for stochastic rainfall models and weather generators. One primary use is the downscaling of future climate scenarios. Furthermore, CP conditioned models may better simulate rainfall and other climate variables through a better partitioning of observations into distinct rainfall and weather types.

Previous research has shown that the point rainfall model performs better, particularly regarding extremes, if conditioned on an optimised fuzzy-rule based objective weather pattern classification. Appropriate model revisions have now been made to allow the full hybrid space-time weather generator to also be conditioned on this classification.

This study assesses the performance of the weather pattern conditioned hybrid weather generator compared to the previous seasonal (summer-winter) conditioned model. For testing, 400 meso-scale catchments across Germany were selected. 

How to cite: Pidoto, R. and Haberlandt, U.: A CP conditioned hybrid weather generator, EGU General Assembly 2023, Vienna, Austria, 23–28 Apr 2023, EGU23-14531, https://doi.org/10.5194/egusphere-egu23-14531, 2023.

EGU23-14968 | ECS | Orals | HS7.2

Determination of the spatial scaling relationship of rainfall extremes using radar data 

Golbarg Goshtsasbpour, Uwe Haberlandt@iww.uni-hannover.de, Ashish Sharma, Abbas El Hachem, Jochen Seidel, and Andras Bardossy

Climate models and their future projections, are normally provided in coarse spatial resolutions which makes them an imprecise source of information for certain hydrological purposes. Finding the proficient means of downscaling such data is one of the open questions of climate research. Previous research has shown that, the rainfall extremes show self-similarity in time and that a relatively similar behavior exists in regard to the spatial scale as well (Veneziano et al 2002). This study aims at determining the spatial scaling relationship of the rainfall extremes by using fine grids of radar datasets and upscaling them. In an empirical manner by aggregating the radar rainfall cells in space and for different cell sizes with a = 1, 2, 3, …12 km and for different durations of d = 5 min, 15 min 30 min, 1 hr, 2 hr, 4 hr, …, 24 hr the Annual Maximum Series are extracted. Using the AMS of different spatial and temporal scales and applying the Koutsoyiannis et at. 1998 method for rainfall extreme value analysis, the probability distribution function is fitted. Assessing the changes of the PDF parameters with the scale, with a logarithmic transformation on both variables; ln(parameter) vs. ln(scale), can show the sought relationship. The preliminary results of the study show definable non-linear relationships for location and scale parameters of the GEV distribution and the eta parameter of the Koutsoyiannis et al. 1998 parametrization.


Koutsoyiannis, D. Kozonis, and A. Manetas, A mathematical framework for studying rainfall intensity-duration-frequency relationships, Journal of Hydrology, 206 (1-2), 118–135, doi:10.1016/S0022-1694(98)00097-3, 1998.

Veneziano, Daniele; Furcolo, Pierluigi (2002): Multifractality of rainfall and scaling of intensity-duration-frequency curves. In Water Resour. Res. 38 (12), 42-1-42-12. DOI: 10.1029/2001WR000372.

How to cite: Goshtsasbpour, G., Haberlandt@iww.uni-hannover.de, U., Sharma, A., El Hachem, A., Seidel, J., and Bardossy, A.: Determination of the spatial scaling relationship of rainfall extremes using radar data, EGU General Assembly 2023, Vienna, Austria, 23–28 Apr 2023, EGU23-14968, https://doi.org/10.5194/egusphere-egu23-14968, 2023.

EGU23-15320 | ECS | Orals | HS7.2

High spatial and temporal resolution precipitation over Mediterranean basin for Digital Twin Earth Hydrology and 4dMED projects 

Paolo Filippucci, Hamidreza Mosaffa, Luca Brocca, and Christian Massari

The Mediterranean basin is a complex environment characterized by both exceptional biodiversity and intense human presence. This environment is already highly influenced by the anthropogenic activities, but their importance is expected to rise up due to the forecasted increase of population (from 480 million people to 520-570 million by 2030) and ongoing climate change. These conditions will trigger an increase of human pressures, including urbanization, industrialization, the expansion of intensive agriculture activities (i.e., irrigation) and aquaculture, thus threatening the natural resources availability, and specifically the water availability. Droughts, floods and landslides events are already stepping up in this environment, making it urgent to develop models systems capable to predict the extreme complex and widespread climate variations of this area.

ESA recognized the crucial role of this region by funding the Digital Twin Earth (DTE) Hydrology Evolution and the 4dMED projects, specifically dedicated to reconstruct the Mediterranean terrestrial water cycle at 1km spatial and 1 day temporal resolution and to develop a prototype of Digital Twin for the entire Mediterranean basin, which can be used for the prediction of hydrological extremes, the management of the water resource cycle and the simulation of the changes that the system may undergo. To reach those objectives, the latest developments of Earth Observation (EO) data as those derived from the ESA-Copernicus missions will be exploited together with in situ observations, hydrological and hydraulic models, artificial intelligence tools and advanced digital platform functionalities.

Among the hydrologic variables datasets generated within these projects, precipitation holds a major role due to its influence on the natural hazards occurrence. Here, we show the procedure adopted to generate the high spatial and temporal resolution precipitation product over the Mediterranean region by downscaling and merging different satellite and in-situ precipitation products. The obtained dataset is evaluated against high resolution observed data in several region of the Mediterranean basin, in order to assess its performance with respect to others EO derived precipitation datasets.

How to cite: Filippucci, P., Mosaffa, H., Brocca, L., and Massari, C.: High spatial and temporal resolution precipitation over Mediterranean basin for Digital Twin Earth Hydrology and 4dMED projects, EGU General Assembly 2023, Vienna, Austria, 23–28 Apr 2023, EGU23-15320, https://doi.org/10.5194/egusphere-egu23-15320, 2023.

Of all the natural resources available to humankind, water holds a prominent place, particularly because of its importance for human livelihood. Savelugu district in northern Ghana is characterized by unpredictable rainfall patterns with periodic and perennial water shortages. The distance people travel to fetch water and the person-hours spent in search for water affect productivity, economic livelihood, and health and education benefits. Provision of potable water supply to these communities is expected to bring not only health, education benefits but also increase in sanitation and hygiene practices. Static water levels (SWLs) of 19 wells in the study area were collected, analyzed and compared to the initial SWLs measured when the wells were immediately drilled and constructed. The SWL data was subjected to paired samples T-test (with α = 0.05). From the results, there was significant difference in the SWL immediately after drilling and construction (µ = 12.15, σ = 7.50) and SWL after at least 10 years (µ = 17.81, σ = 10.29); t (18) = -3.7, P = 0.002. Lowered groundwater levels were recorded in all wells measured. This can lead to drying up of some of the wells whose difference between the current SWL and well depth is close. There must be strong advocacy, development and implementation of IWRM plans to help address the problem of inadequate WASH in the study area.

How to cite: Acheampong, A.: Lowering of groundwater levels and their effect on Water, Sanitation and Hygiene services in the Savelugu District, Northern Region of Ghana, EGU General Assembly 2023, Vienna, Austria, 23–28 Apr 2023, EGU23-139, https://doi.org/10.5194/egusphere-egu23-139, 2023.

Agriculture, in general, has a long production cycle and is affected by many endogenous and exogenous uncertainty factors. Changes in rainfall patterns, maximum or minimum temperature, types and amounts of fertilizer input, timing, availability of irrigation water, and soil quality can drastically change the agricultural yield. In developing countries such as India, where more than half of countries population is engaged in agriculture, and the whims of nature may affect the agricultural output, it is essential to check how the entire agricultural system reacts to the changes in climatic parameters and anthropogenic practices. This study analyses agricultural trends in four primary staple crops, trends in climatic parameters, and anthropogenic inputs in Indian districts. Significant trends were detected and quantified using the non-parametric Mann-Kendall (MK) test, modified MK test, and Theil-Sen estimator at a 5% significance level. Spearman’s correlation test is used to determine the contributing factors to the changes in agricultural yield. Rice, Wheat, Pearl Millet, and Maize yields have shown significant increasing trends in a large number of the districts. Despite decreases in the gross cropped area in the majority of the districts, the trends in production are mostly positive. According to Spearman’s Rho correlation test, the increase in fertilizer consumption in most districts and the increase in crop-wise irrigated land in many districts are the significant reasons for the increase in yields. The rainfall did not change much compared to maximum and minimum temperatures at both the annual and seasonal levels. Although there were significant climatic changes in the last three decades, the correlation with agricultural yield is mostly insignificant.

How to cite: Sarkar, N. and Ray, S.: Analysis of Agricultural and Climatic trends in Indian Districts and finding the contributing factors in recent Indian Agricultural Outputs, EGU General Assembly 2023, Vienna, Austria, 23–28 Apr 2023, EGU23-653, https://doi.org/10.5194/egusphere-egu23-653, 2023.

EGU23-1916 | ECS | PICO | HS7.3

Modeling the potential of management options to reduce irrigation demand in Western Switzerland 

Malve Heinz, Christoph Raible, Bettina Schaefli, and Annelie Holzkämper

European Agriculture is experiencing the consequences of summer droughts and heatwaves in form of quality and quantity losses for numerous crops and feed production. Water availability for irrigation in the vital summer and fall months is decreasing and therefore, irrigation will most likely not be able to sufficiently mitigate the effects of droughts and heat in the future. Thus, approaches that reduce the need for irrigation are required. We investigate potential water-use reduction strategies based on a modelling framework applied to a selected case study in Western Switzerland, the Broye catchment. The region is characterized by intensive agricultural use and drought-related irrigation bans in summer. In the first step of our project, we quantify the total irrigation demand under current and future climate conditions using the soil-water-atmosphere-plant model SWAP. SWAP mainly simulates water and solute flow in soil as well as vegetation growth by solving a set of equations such as the Richards equations. Irrigation demand is quantified by applying this 1D model to the full range of climatic, soil and land use conditions prevailing in the selected catchment. The model calculates both the irrigation requirements and the yield of various irrigation-intensive crops currently grown in the region, such as potatoes, maize, or sugar beet. In a second step, we use the model to assess the efficiency of different management options to reduce the water demand, such as mulching, organic amendments, biochar application, different tillage methods or the cultivation of better-adapted crops. In future work, we will couple the field-scale model to a catchment-scale rainfall-runoff model to assess the impact of a large-scale application of such measures on the water balance of the catchment.

How to cite: Heinz, M., Raible, C., Schaefli, B., and Holzkämper, A.: Modeling the potential of management options to reduce irrigation demand in Western Switzerland, EGU General Assembly 2023, Vienna, Austria, 23–28 Apr 2023, EGU23-1916, https://doi.org/10.5194/egusphere-egu23-1916, 2023.

EGU23-2603 | PICO | HS7.3

Rainwater harvesting as climate change adaptation strategy for durum wheat production in Sardinia 

Francesco Viola, Roberto Deidda, Salvatore Urru, and Elena Cristiano

The Mediterranean region is widely recognized as a climate change hotspot, where, mainly due to the increase of CO2 concentration, both historical records and future climate models’ projections reveal an increase of the daily average temperature and a reduction of the mean annual precipitation, with less frequent but more intense rainfall events. These changes could have strong impacts on the durum wheat production, and consequently to the food chain that derives from it. Water availability is expected to be the main limiting factor in the durum wheat growth, which is usually rainfed in Mediterranean region. On the other hand, CO2 increase may act as a counterbalance factor, by increasing the water use efficiency. In this work, within the framework of the H2020 European Union project ARSINOE (“Climate-resilient regions through systemic solutions and innovations”), we investigated the possibility to adapt durum wheat production to climate changes, compensating the rainfall reduction with emergency irrigation derived from a rainwater harvesting system, with the aim to keep constant the durum wheat production or alleviate the yield reduction. The Aquacrop model, a crop growth model developed by FAO’s Land and Water Division, has been calibrated to reproduce the actual durum wheat production in the Campidano region in Sardinia (Italy), implementing the local climate and soil characteristics. The model has been then used to simulate the crop production in correspondence of different bias corrected future climate scenarios, which foreseen an average rainfall reduction and increase of average temperature and CO2 concentration in the atmosphere. A rainwater harvesting system to collect rainfall from the rooftops or impervious surface within the cultivated area (100m2/ha) has been designed and the volume for potential emergency irrigation has been estimated year by year. Preliminary results show the importance of implementing rainwater harvesting systems to provide emergency irrigation and sustain durum wheat production in a context of climate changes.

Acknowledgments

This project has received funding from the European Union’s Horizon H2020 innovation action programme under grant agreement 101037424.

How to cite: Viola, F., Deidda, R., Urru, S., and Cristiano, E.: Rainwater harvesting as climate change adaptation strategy for durum wheat production in Sardinia, EGU General Assembly 2023, Vienna, Austria, 23–28 Apr 2023, EGU23-2603, https://doi.org/10.5194/egusphere-egu23-2603, 2023.

With the impact of climate change and the main rainfall seasons in Taiwan are concentrated in the plum rain season from May to June and the typhoon season from July to September each year.There are significant differences in rainfall and spatial and temporal distribution between the wet season and the dry season,the droughts will occur and even lead to severe water shortages, such as the worst drought in half a century in 2021.From a macroscopic spatial scale, for example, the El Niño phenomenon and solar activity may have a certain impact on the overall climate and water resources of the earth.Therefore, this study analyzes the correlation between rainfall and large-scale influencing factors such as sunspots, El Niño-Southern Oscillation,and uses machine learning models to predict and classify rainfall under different conditions,the prediction accuracy rate through historical data can reach 89.9% , with sunspots as the most significant factor. It is hoped that relevant units can provide reference for water resources management and planning.

How to cite: Weng, Z.-H. and Lin, Y.-C.: Establishing a macroscopic-scale rainfall climate and water resources estimation model by machine learning method, EGU General Assembly 2023, Vienna, Austria, 23–28 Apr 2023, EGU23-3008, https://doi.org/10.5194/egusphere-egu23-3008, 2023.

EGU23-3528 | ECS | PICO | HS7.3

Effects of heat and drought stress and their co-occurrence on winter wheat yields in Germany under climate change 

Rike Becker, Bernhard Schauberger, Ralf Merz, Stephan Schulz, and Christoph Gornott

In our changing climate, heatwaves and droughts and their spatio-temporal co-occurrences are likely to intensify. This will inevitably challenge future agricultural production and calls for adaptation strategies to protect future yields. To find suitable climate adaptation strategies for Germany’s major staple crop - winter wheat - it is important to know how heat stress, drought stress or their compound effects drive wheat yield failures. The principal aim of this study is, therefore, to quantify the impacts of heat, drought, and their compound effects on winter wheat yields in Germany, in a spatially and temporally discrete manner.

To address our aim, we develop a statistical crop-climate model for the time period 1991-2019 at the county level. We first create agroclimatic proxies for heat stress, drought stress and their compound effects and use these to construct a separate time series model with the addition of time-dependent interaction terms. Our approach constructs separate regression models for each county, based on common elements that allow for comparing and jointly interpreting individual models.

Preliminary results show that more than 50% of Germany’s wheat yield variability can be explained by climate effects. Compound effects of heat and drought stresses are responsible for approx. 42% of the variability in Germany’s winter wheat yields. Drought stress alone explains approx. 7%, with higher impacts in the east of the country, and heat stress alone explains approx. 3% of the year-to-year yield variability, with higher impacts in the north-west of Germany. The results confirm the importance of compound effects and underline their dominating impacts on winter wheat yields, when compared to individual heat and water stress impacts – a finding which should guide future adaptation strategies. Furthermore, our study shows that heat stress is becoming increasingly important for wheat yield failure in Germany – alone and in conjunction with moisture stress.

In conclusion, we suggest that climate change adaptation strategies for winter wheat in Germany should focus on combined measures against drought and heat extremes. While the increase of multi-stress resilience should be the main goal for entire Germany, north-western areas should prioritize strategies to increase heat resilience and eastern areas should prioritize strategies to increase drought resilience.

How to cite: Becker, R., Schauberger, B., Merz, R., Schulz, S., and Gornott, C.: Effects of heat and drought stress and their co-occurrence on winter wheat yields in Germany under climate change, EGU General Assembly 2023, Vienna, Austria, 23–28 Apr 2023, EGU23-3528, https://doi.org/10.5194/egusphere-egu23-3528, 2023.

current legislation requires the inspection and calibration of operational survey radiation monitoring instruments used in nuclear medicine and radiotherapy departments as well as in any field that uses ionizing radiation sources. As a result, Morocco's national secondary standard dosimetry laboratory provides reliable calibration results with high accuracy while adhering to national and international radiation protection standards and covering the various measurement ranges, using the attenuators offered by the automated Gamma G10 irradiator or the validated beam qualities produced by the X-ray irradiator type X80-320kV as required. The measurements’ reliability was demonstrated by participation in a comparison program launched by the International Atomic Energy Agency (IAEA).

This work aims to develop a digital graphical user interface designed for the calibration of measuring instruments in radiation protection through the programming language Python, which serves to facilitate the establishment of all operations and calculations related to the determination of calibration factors and measurement uncertainties according to the ISO 4037 standard in a minimum time that allows to process several instruments during the day with high accuracy, while minimizing the sources of errors, this interface allows the recording of calculations as well as the establishment and electronic archiving of the calibration certificate in pdf format ported from PHP FPDF.

How to cite: Belhaj, O. E., Boukhal, H., and Belhaj, S.: Digital graphical user interface as a facilitator for the calibration of radiation monitoring instruments according to ISO 4037:2019 at the national secondary standard dosimetry laboratory of morocco, EGU General Assembly 2023, Vienna, Austria, 23–28 Apr 2023, EGU23-4503, https://doi.org/10.5194/egusphere-egu23-4503, 2023.

Groundwater is an essential source of water in Taiwan, and its long-term overuse has resulted in water resource problems that have become a potential crisis in the Zhuoshui River Basin. This overuse of groundwater may also lead to subsidence, which can have significant consequences for the area and its infrastructure. The lack of complete observations of groundwater extraction in Taiwan due to historical factors has made it difficult to accurately understand and manage the amount of water being taken, particularly for agricultural purposes.In view of this, this study uses time series data from 87 agricultural groundwater wells in Huwei Town, Yunlin County from January 2016 to July 2017, and time series data on agricultural well electricity usage in the Changshui River Basin, combined with other attribute data, to understand farmers' water pumping behavior using data mining methods and to estimate the amount of water taken in the Huwei area using machine learning.This study obtained the spatial and temporal distribution of groundwater withdrawals in the Huwei area in 2018.

How to cite: Tseng, Y. K. and Yu, H. L.: Using Time Series Data and Machine Learning Estimating Agricultural Groundwater Extraction in Huwei Town, Taiwan, EGU General Assembly 2023, Vienna, Austria, 23–28 Apr 2023, EGU23-5173, https://doi.org/10.5194/egusphere-egu23-5173, 2023.

EGU23-5551 | ECS | PICO | HS7.3

Probabilistic modelling of water distribution networks and resilient reduction of leakages: Large scale application to the city of Patras in western Greece 

Athanasios V. Serafeim, George Kokosalakis, Roberto Deidda, Nikolaos Th. Fourniotis, Irene Karathanasi, and Andreas Langousis

Modeling of leakages in Water Distribution Networks (WDNs) is a vital task for all water related professionals and experts towards the development of management practices and strategies, which aim at the reduction of water losses (leakages) and the associated financial cost and environmental footprint. In the current work we develop an integrated, theoretically founded, and easily applicable probabilistic framework for resilient reduction of leakages in WDNs, which combines: a) a set of conceptually and methodologically different probabilistic approaches for minimum night flow (MNF) estimation in WDNs based on statistical metrics (Serafeim et al., 2021 and 2022a), and b) a combination of statistical clustering and hydraulic modeling techniques for the rigorous and user unbiased partitioning of WDNs into pressure management areas (PMAs) or district metered areas (DMAs), which seeks for minimization of leakages while maintaining an acceptable level of the network’s hydraulic resilience (Serafeim et al., 2022b). The efficiency of the introduced framework is tested via a large-scale real-world application to the water distribution network of the City of Patras, the largest smart water network (SWN) in Greece, which covers an area of approximately 27 km2 and serves more than 213000 consumers (based on data from the Hellenic Statistical Authority and the Municipality of Patras), with more than 700 km of pipeline grid (mainly HDPE and PVC pipes).

Acknowledgements

The research work was supported by the Hellenic Foundation for Research and Innovation (H.F.R.I.) under the “First Call for H.F.R.I. Research Projects to support Faculty members and Researchers and the procurement of high-cost research equipment grant” (Project Number: 1162).

References

Serafeim, A.V., Kokosalakis, G., Deidda, R., Karathanasi I. and Langousis A (2021) Probabilistic estimation of minimum night flow in water distribution networks: large-scale application to the city of Patras in western Greece, Stoch. Environ. Res. Risk. Assess., https://doi.org/10.1007/s00477-021-02042-9.

Serafeim, A.V., G. Kokosalakis, R. Deidda, I. Karathanasi and A. Langousis (2022) Probabilistic Minimum Night Flow Estimation in Water Distribution Networks and Comparison with the Water Balance Approach: Large-Scale Application to the City Center of Patras in Western Greece, Water, 14, 98, https://doi.org/10.3390/w14010098.

Serafeim, A.V., G. Kokosalakis, R. Deidda, N. Th. Fourniotis and A. Langousis (2022) Combining statistical clustering with hydraulic modeling for resilient reduction of water loses in water distribution networks: Large scale application to the city of Patras in Western Greece, Water, 14(21), 3493. https://doi.org/10.3390/w14213493.


How to cite: Serafeim, A. V., Kokosalakis, G., Deidda, R., Fourniotis, N. Th., Karathanasi, I., and Langousis, A.: Probabilistic modelling of water distribution networks and resilient reduction of leakages: Large scale application to the city of Patras in western Greece, EGU General Assembly 2023, Vienna, Austria, 23–28 Apr 2023, EGU23-5551, https://doi.org/10.5194/egusphere-egu23-5551, 2023.

EGU23-5567 | PICO | HS7.3

A probabilistic approach for detection and classification of PRV malfunctions in the water distribution network of the city of Patras in western Greece 

Anastasios Perdios, George Kokosalakis, Nikolaos Th. Fourniotis, Demetris Pantzalis, and Andreas Langousis

Effective management of water losses in water distribution networks (WDNs) still remains a demanding task, as the temporal and spatial variability of water resources under changing climatic conditions and the increasing needs for drinking water may lead to freshwater shortages. In this context, pressure management strategies are widely adopted in an effort to reduce the water losses in the supply and distribution parts of water networks and, consequently, deescalate their environmental footprint. Installation of pressure reducing valves (PRVs) at critical locations of WDNs plays a central role in pressure regulation strategies, as PRVs reduce the upstream pressure to a set outlet pressure (i.e., downstream of the PRV), usually referred to as set point. Perdios et al. (2022) developed a novel statistical framework and applied it to an existing pressure management area (PMA) of the city of Patras in western Greece, aiming at early detection of PRV malfunctions that may significantly influence network’s operation and the corresponding lifetime of related infrastructure. The results showed that the suggested methodology allows reliable detection of critical malfunctions at least 2 days prior to flow disruptions. Ιn this study, we calibrate and implement Perdios et al. (2022) statistical framework, using pressure data for a 4-year period from 01/Jan./2017 to 26/Nov./2020 from several important PMAs of the WDN of the city of Patras, aiming towards better understanding of the causes of the malfunctions, by decomposing the observed pressure deviations from the set point to systematic and random error components.

Acknowledgements

The research work has been conducted within the project PerManeNt, which has been co-financed by the European Regional Development Fund of the European Union and Greek national funds through the Operational Program Competitiveness, Entrepreneurship and Innovation under the call RESEARCH – CREATE – INNOVATE (project code: T2EDK-04177).

Reference

Perdios A., G. Kokosalakis, N. Th. Fourniotis, I. Karathanasi and A. Langousis (2022) Statistical framework for the detection of pressure regulation malfunctions and issuance of alerts in water distribution networks, Stoch. Env. Res. Risk Asses., https://doi.org/10.1007/s00477-022-02256-5

How to cite: Perdios, A., Kokosalakis, G., Fourniotis, N. Th., Pantzalis, D., and Langousis, A.: A probabilistic approach for detection and classification of PRV malfunctions in the water distribution network of the city of Patras in western Greece, EGU General Assembly 2023, Vienna, Austria, 23–28 Apr 2023, EGU23-5567, https://doi.org/10.5194/egusphere-egu23-5567, 2023.

EGU23-10057 | ECS | PICO | HS7.3

Building a smart green system to control water leakage and monitor drinking water quality in the water supply system of Paramythia city, Greece: the case of SMASH project 

Angelos Chasiotis, Stavroula Tsitsifli, Konstantinos Panytsidis, Vegard Nilsen, Nikolaos Mantas, Dimitrios Theodorou, Thomas Kyriakidis, Stefanos Chasiotis, Maria Bousdeki, Elissavet Feloni, Harsha Ratnaweera, Panagiotis Nastos, and Malamati Louta

Water leakage is acknowledged as one of the most important issues that drinking water supply systems are facing worldwide. Non-Revenue Water is estimated to 346 million m3 per day and its cost/value is estimated to 39 billion USD per year. At the same time drinking water quality is jeopardized from the water intake points to the consumer’s tap, even during normal operating conditions.

ICT support water utility operators to improve the operational capacity of their water supply system. A smart green system to control water leakage and monitor drinking water quality in the water supply system of Paramythia city will be built in the context of SMASH project. It consists of: (a) IoT system comprising three local control stations, installed in selected parts of the water supply network, monitoring water quantity&quality parameters in real time; (b) the hydraulic simulation model of the water supply system of Paramythia; (c) a virtual sensors system, which will be used for water quality prediction; (d) a Decision Support System (DSS) for leakage detection and optimal management of water supply system parameters in an automated manner.

The DSS will detect and locate water leakages within the DMA zone and inform the operators for excessive values in drinking water quality parameters. The DSS will use as inputs the data from the IoT system, will interact with the hydraulic simulation model, and obtain the water quality data from the virtual sensors. All these data will be processed by the DSS logic in the backend subsystem. The IoT and the hydraulic simulation data, based on the digital twin of the water supply system, are used for the calculation of specific performance indicators related to water leakage, such as well-known IWA indicators: water losses, ILI, etc. Calculating the divergences between the PI values observed & the ones representing the optimal operation of the water network without leakages and setting appropriate thresholds, the DSS will detect the leakage, while several different scenarios will run in hydraulic simulation. The frontend subsystem of the DSS will be able to visualize the water distribution network, statistical values of water quantitative & qualitative parameters. It will provide alarms in case of leakage or exceedance of water quality parameters’ values and it will show the leakage location in a map. The architecture of the smart green system, currently under development, is depicted in Fig.1.

Figure 1. The DSS for the water parameters management in the water supply system

Keywords: Drinking water; water quality; leakage; virtual sensors; smart system; decision support.

Acknowledgement: This work is co-financed by EEA Grants 2014 – 2021 and Greek Public Investments Program.

  • Liemberger, R., & Wyatt, A. (2019). Quantifying the global non-revenue water problem. Water Supply19(3), 831-837.
  • Antzoulatos G., Mourtzios C., et al (2020), Making urban water smart: the SMART-WATER solution. Water Science & Technology, 82(12), 2691–2710.
  • Alegre, H., Baptista, et al (2016). Performance indicators for water supply services. 3rd IWA publishing.

How to cite: Chasiotis, A., Tsitsifli, S., Panytsidis, K., Nilsen, V., Mantas, N., Theodorou, D., Kyriakidis, T., Chasiotis, S., Bousdeki, M., Feloni, E., Ratnaweera, H., Nastos, P., and Louta, M.: Building a smart green system to control water leakage and monitor drinking water quality in the water supply system of Paramythia city, Greece: the case of SMASH project, EGU General Assembly 2023, Vienna, Austria, 23–28 Apr 2023, EGU23-10057, https://doi.org/10.5194/egusphere-egu23-10057, 2023.

By calculating the water demand and programming a fine irrigation project, the management and cultivating efficiency of traditional agriculture can be greatly improved. Taking rotational irrigation for example, the efficiency of irrigation can be maximized by adjusting water distribution routes, irrigation area allocation, and irrigation schedule planning. However, in actual operation, some problems are often encountered, such as how to persuade farmers and promote the designed irrigation project, and the negotiation of various stakeholders. Generally, due to the complexity of the irrigation design model, it is impossible to have an effective and immediate communication or presentation. Therefore, this study introduces the Bayesian network to presents the key points of the irrigation project after simplifying the relationship. In addition to being simpler for stakeholders to understand, it is also possible to adjust various parameters in time to obtain rough estimation results.

The research area of this study is a 100-hectare farmland, which is located in Kinmen County, Taiwan. For many years, local farmers have only relied on precipitation to cultivate sorghum, wheat and other crops. However, the precipitation in Kinmen is semiarid and unstable. In the past five years, the annual rainfall has been lower than the average in previous years, which directly led to a very bleak crop harvest. Therefore, we hope to establish an irrigation project in Kinmen, using recycled water as the water source to provide local farmers with a reliable water source.

The Bayesian network used in this study is a directed acyclic graphical (DAG) model based on conditional probability and Bayesian theorem to express the possible relationship between variables. In terms of operation, the different influencing factors in the research topic are converted into nodes, and the relationship between nodes is given by different conditional probabilities. This study uses GeNIe to establish a Bayesian network that can be used to estimate water profit and loss and other results. This Bayesian network can be divided into four sub-blocks, which are the relevant data of the irrigation area, the water demand, the water supply, and the final result calculation. Therefore, when the stakeholders are negotiating the irrigation project, they can discuss the different estimation results by adjusting each node of the first three sub-blocks.

How to cite: Su, Y. and Yu, H.-L.: Application of Bayesian Network in Analysis and Management of Agricultural Water - Taking Kinmen for Example, EGU General Assembly 2023, Vienna, Austria, 23–28 Apr 2023, EGU23-10515, https://doi.org/10.5194/egusphere-egu23-10515, 2023.

Assessing the Sustainability in Water Use under
Different Agricultural Management Planning
in Yeongsan-River Basin, South Korea


Yujong Jeong1, Hyun-woo Jo1, YanYan1, Minwoo Noh1, Woo-Kyun Lee1*


1 Department of Environmental Science and Ecological Engineering, Korea University, Seoul 02841, Republic of Korea

*E-mail: leewk@korea.ac.kr

(Address: Korea University, Anamro 145, Seongbukgu, Seoul 02841, Republic of Korea)


Abstract:

From the past, South Korea has been experiencing high level of water stress as reported by WRI, in 2013, and chronically imbalanced spatiotemporal water allocation. Yeongsan-river basin, where the biggest national breadbasket is located, is facing unequal water allocation among different water uses and inefficient water management under episodic water shortage conditions. Therefore, the main objective of this study was to analyse current water management and allocation scheme, and to evaluate 3 different agricultural management plans in terms of efficiency and equity. The Soil and Water Assessment Tool(SWAT) was applied to simulate the hydrological process and crop yield in the basin. The model was calibrated and validated using observed outflows to set adequate system parameters for the entire watershed. Crop water productivity and spatial-temporal-sectoral water distribution are utilized as the indices to evaluate different agricultural strategies. The results suggested that there was potential to improve both crop productivity and water allocation at the same time with the suggested plannings. Crop water productivity increased in all three strategies in order of on-farm management measures (precise agriculture), crop diversification (replacing rice to beans) and agroforestry (mixing trees and crops). The crop water productivity of on-farm measurement ranges from 5t/L to 13t/L and rises about 20% on average. In addition, it is found that applying the combination of different agricultural management measures could achieve better water allocation in terms of space and time, and between agriculture and ecosystem. The outcomes of this study can serve scientific-evidence policy and decision-making systems for sustainable agricultural society and ecosystem.

KeywordsHydrological Modelling, SWAT, Crop water productivity, Water allocation, Agricultural Management Planning, Yeongsan-River Basin

Acknowledgements: This work was supported under the framework of international cooperation program managed by the National Research Foundation of Korea (No. 2021K2A9A1A02101519).


How to cite: Jeong, Y.: Assessing the Sustainability in Water Use under Different Agricultural Management Planning in Yeongsan-River Basin, South Korea, EGU General Assembly 2023, Vienna, Austria, 23–28 Apr 2023, EGU23-10943, https://doi.org/10.5194/egusphere-egu23-10943, 2023.

EGU23-10953 | ECS | PICO | HS7.3

Leveraging Hydroclimate and Earth Observation to Predict Grain Production in Sub-Saharan Africa 

Donghoon Lee, Frank Davenport, Shraddhanand Shukla, Laura Harrison, Greg Husak, Chris Funk, Michael Budde, James Rowland, Amy McNally, and James Verdin

The importance of forecasting agricultural production in Sub-Saharan Africa (SSA) is increasing for the management of agricultural supply chains, market forecasting, and targeting of food aid. In particular, agricultural forecasts enable governments and humanitarian organizations to respond more effectively to shocks in food production and price spikes resulting from extreme droughts. In this study, we use hydroclimate, earth observations (EO) and machine learning to develop an operational, sub-national grain production forecast system for a number of SSA countries, including food-insecure regions where rapid response is critical. Before creating the forecast, we collect and organize crop production data from the Famine Early Warning Systems Network in order to identify trends and variability in agricultural technology, climate, and vegetation. In addition, we demonstrate the capability of hydroclimate and EO data to capture favorable or unfavorable crop development conditions during the growing season. In addition, we demonstrate a unique capability that explains how EO characteristics influence current grain production forecasts, thereby enhancing the forecasts' reliability and efficacy. This research lays the groundwork for the development of a large-scale, operational crop yield forecasting system that will provide actionable predictions of food shocks for famine early warning and guide advanced preparedness and response strategies.

How to cite: Lee, D., Davenport, F., Shukla, S., Harrison, L., Husak, G., Funk, C., Budde, M., Rowland, J., McNally, A., and Verdin, J.: Leveraging Hydroclimate and Earth Observation to Predict Grain Production in Sub-Saharan Africa, EGU General Assembly 2023, Vienna, Austria, 23–28 Apr 2023, EGU23-10953, https://doi.org/10.5194/egusphere-egu23-10953, 2023.

EGU23-11183 | ECS | PICO | HS7.3

Implications of 1.50C global warming for agricultural productivity over a global rice exporting region in Central India 

Shoobhangi Tyagi, Sandeep Sahany, Dharmendra Saraswat, Saroj Kanta Mishra, Amlendu Dubey, and Dev Niyogi

Water, food, and energy security are the major climate risks of global warming. The Paris Agreement proposed an ambitious target of limiting the rise in global mean surface temperature to well below 20C, and preferably to 1.50C, compared to the pre-industrial era. However, the implication of this policy discourse on the agricultural system is imperative for ensuring food security in the face of global warming. This research focuses on understanding the changes in water availability and rice productivity under 1.50C global warming over a global rice-exporting semi-arid watershed in Central India. Towards this goal, the mean climate under 1.50C of global warming was computed for 21 Coupled Model Intercomparison Project Phase 6 (CMIP6) Global Climate models (GCMs). For each GCM, the corresponding changes in blue-green water availability and rice productivity at 1.50C warming period were estimated under two global warming scenarios (SSP2-4.5 and SSP5-8.5) based on the semi-distributed Soil and Water Assessment Tool (SWAT). Results suggest that the green and blue water is projected to change by ~ -20% to 10 and ~ -50 to 20%, respectively. The rice yield is projected to reduce in the range of 5% to 50%, with an increase in local temperature (~10C) and a decrease in local precipitation (~20%) being the limiting factor. This study provides useful information on when the 1.50C global warming could reach and how it can affect the agricultural productivity of semi-arid watersheds across different global warming scenarios. This study will help develop appropriate strategies to reduce/alleviate the impacts of global warming and foster food security at the watershed-scale.   

How to cite: Tyagi, S., Sahany, S., Saraswat, D., Mishra, S. K., Dubey, A., and Niyogi, D.: Implications of 1.50C global warming for agricultural productivity over a global rice exporting region in Central India, EGU General Assembly 2023, Vienna, Austria, 23–28 Apr 2023, EGU23-11183, https://doi.org/10.5194/egusphere-egu23-11183, 2023.

        Due to climate change, Taiwan's rainfall has become unstable in recent years, leading to short rainy seasons and low rainfall. In 2021, a severe drought occurred due to the lowest rainfall on record. Groundwater is essential for agricultural development, but less than 10% of wells are legal. Improper or excessive use of groundwater resources can cause serious disasters, such as sea intrusion and land subsidence. However, if the government and farmers extract groundwater effectively and sustainably, it will bring more flexibility to water management.

        In this study, a land subsidence model was conducted based on geological conditions and groundwater level. This study analyzes multi layer compaction monitoring well profiles, and further finds the correlation among the two main factors and subsidence. The goal of this study is to visualize which areas are more suitable for using groundwater and assist the government in water resource management. This study focuses on the Choshui river alluvial fan in Taiwan. A risk map of land subsidence for this area is made by evaluating two main factors, geological conditions and groundwater level.

How to cite: Su, S.-H. and Yu, H.-L.: Assessment of Land Subsidence based on Geological Conditions, Groundwater Levels in the Choshui River Alluvial Fan, Taiwan, EGU General Assembly 2023, Vienna, Austria, 23–28 Apr 2023, EGU23-11879, https://doi.org/10.5194/egusphere-egu23-11879, 2023.

EGU23-12693 | ECS | PICO | HS7.3

Photo-driven processes for the removal of biotoxins derived from Harmful Microalgal Blooms 

Javier Moreno-Andrés, Sandra Lage, Ana Catarina Braga, Leonardo Romero-Martínez, Asunción Acevedo-Merino, Enrique Nebot, and Pedro R Costa

Harmful Algal Blooms (HABs) are increasing in frequency and magnitude globally. These episodes are associated with the generation of biotoxins, which pose a potential risk to human and animal health. Biotoxins notably affect aquaculture activities and shellfish production, which has a clear impact on food and human health. Consequently, it is sometimes necessary to close the harvesting areas until the organisms are decontaminated. These natural detoxification mechanisms depend largely on the type of toxin and physiology of the organism, resulting in lengthy processes that can cause severe economic losses to aquaculture activities. As the main goal of this communication, we propose a technological alternative for the degradation of marine biotoxins through the implementation of UV technology as a treatment for agricultural, environmental, and health-related purposes. Therefore, advanced photochemical processes should be evaluated for the efficient degradation of marine biotoxins. The toxin selected was okadaic acid (OA), which is a very stable diarrheal toxin (DSP) and has a great impact on shellfish production areas, e.g. on the Portuguese coast. First, irradiation experiments were performed under UV-A, UV-B, and UV-C irradiation. In general, the concentration remained similar after different UV exposures, indicating that there was no observable photodegradation of OA after 3 h of UV irradiation, detecting a maximum degradation of 19.5% (± 0.95) in the UV-C region, suggesting that OA is clearly resistant to UV photodegradation. Second, the combined UV/H2O2, UV/HSO5, and UV/S2O82 − processes were tested. Two different UV sources were evaluated: LED and low-pressure lamps (LP), performing OA exposure in distilled water and seawater, with a maximum UV exposure of 3 h. In general, a clear degradation of OA is observed in photochemical processes in distilled water, with a slight decrease in efficiency in the UV/H2O2 process with an LED irradiation source. In the case of UV/S2O82 − and UV/HSO5, both the LP lamp and LED achieved a total degradation of OA. In the case of the marine matrix, the effect is clearly inhibited for the UV/H2O2 process; however, for UV/ HSO5, salinity does not seem to affect OA degradation, obtaining practically 100% removal. The study of new UV-LEDs would favor aquaculture activities by increasing sustainability and health safety. Likewise, the results obtained might provide the basis for a possible scale-up of technological processes specifically designed for the minimization of marine biotoxins.

How to cite: Moreno-Andrés, J., Lage, S., Braga, A. C., Romero-Martínez, L., Acevedo-Merino, A., Nebot, E., and Costa, P. R.: Photo-driven processes for the removal of biotoxins derived from Harmful Microalgal Blooms, EGU General Assembly 2023, Vienna, Austria, 23–28 Apr 2023, EGU23-12693, https://doi.org/10.5194/egusphere-egu23-12693, 2023.

EGU23-15429 | ECS | PICO | HS7.3

Effect of distance of crop canopy temperature observations on Crop Water Stress Index 

Aditi Yadav, Hitesh Upreti, and Gopal Singhal

The need for water management in the agriculture sector, which is a 70% consumer of global water resources, is imperative. For the same, a plant-based index called crop water stress index (CWSI) is widely being adopted for irrigation scheduling. An empirically derived CWSI is dependent on three parameters of canopy temperature (Tc), air temperature (Ta), and relative humidity (RH).This study was conducted by performing controlled crop experiments in the arid region of Uttar Pradesh state of India, which aims to evaluate the significance of height of Tc observations, taken from March to April 2022, on CWSI calculations for the wheat crop.This has been done by observing theTc by aiming the wheat crop from the top of the crown at two distances of 10 cm and 100 cm, respectively. Handheld remote sensingdevice known as infrared thermometeris used for the observation of canopy temperature. Variation in the height from 10 cm to 100 cm leads to a variation in the field of view from 51.28 sq. cm to 5128 sq. cm. The effect of enhanced area and the involvement of extra soiland vegetation pixels can be understood by this work. Five different irrigation regimes have been provided to study the effect of change in height for Tc observations. The regimes consist of five plots 1,2,3,4, and 5 with soil moisture depletion by the following percentage respectively: 50% in drip irrigation, 25% in drip irrigation, unregulated flood irrigation, 50% in flood irrigation, and no irrigation plot.Plot 2 has been used to formulatea lower baselinefor CWSI calculations. A lower baseline represents a non-water-stressed condition of the crop where the crop is provided with sufficient irrigation treatment leading towards negligible stress conditions. The lower baseline equations used for CWSI assessment for 10 cm and 100 cm height are -1.287(VPD) -2.19 and -1.214(VPD)-1.738, respectively. VPD represents vapor pressure deficit which is a function of Ta and RH. Upon increasing the height from 10 cm to 100 cm, Tc increased by 2.1%, 2.7%, 0.6%, 0.9%, and 1.3% for plots 1,2,3,4, and 5, respectively. This change in temperature led to a decrease in CWSI by 21.8%,36.4 %,9.2%, and 12.2% in plots 1, 2, 3, and 4 respectively. An increase in CWSI by 5.8% for a rise of 1.3% in Tc for plot 5 was also noted. Further coefficient of determination R2 was observed between CWSI at 10 cm height and CWSI at 100 cm height for all plots. It was observed to be 0.65, 0.50, 0.93, 0.93, and 0.87 for plots 1, 2, 3, 4, and 5, respectively. This study shows the effect of observation distance of crop canopy temperature on CWSI that can lead to the development of sampling procedures meant for CWSI studies.

How to cite: Yadav, A., Upreti, H., and Singhal, G.: Effect of distance of crop canopy temperature observations on Crop Water Stress Index, EGU General Assembly 2023, Vienna, Austria, 23–28 Apr 2023, EGU23-15429, https://doi.org/10.5194/egusphere-egu23-15429, 2023.

Agricultural water use comprises the major part of the total water consumption in many countries, and Taiwan is no exception. However, urbanization and industrialization have triggered the competition for water among different sectors. Water is transferred to satisfy the daily need and industrial need, especially the need of high-tech industries, from the agricultural sector. Groundwater hence becomes an alternative water resource for agriculture, but the over-exploitation of groundwater resources also leads to some problems such as environmental degradation and land subsidence, and climate change has worsened the situation in the recent years.

In Taiwan, groundwater is one of the vital water resources for irrigation, especially when the first crop rice begins being cultivated in the late dry season in central Taiwan. Yunlin County located in central Taiwan is chosen as the study area, which is now facing severe issues about groundwater over-exploitation and suffering from land subsidence threatening the safety of Taiwan High Speed Rail. Because of the high water consumption, groundwater extraction from agriculture is deemed to be the major cause of the land subsidence and should be well monitored and reduced. However, farmers’ pumping behaviors are highly related to the national water allocation policy, food policy and the socioeconomic factors in the rural area. The top-down agricultural water management might not be sufficient and sustainable. Hence, in this study, we propose a participatory framework for agricultural water management using a Bayesian network. The framework tries to incorporate the main factors that affect decision making among different stakeholders, including the Water Resources Agency, Irrigation Agency, Agriculture and Food Agency, farmers, etc., and represent the causal relationship among factors through Bayes’ theorem, or the conditional probability tables (CPTs). The CPTs are constructed based on data, literature reviews and interviews with stakeholders. The key issues concerning different stakeholders are considered in the framework as well, such as surface water shortage for agriculture, land subsidence, and sustainability of agriculture in Yunlin. The network can be used to hold discussions with stakeholders and show the interactions of their decisions among others. The aim of this framework is to facilitate the discussions and formulate the strategies for sustainable agricultural water management with the aid of the intuitive and transparent structure of the Bayesian network.

How to cite: Lee, S.-Y. and Yu, H.-L.: Using Bayesian network to build a participatory framework for sustainable agriculture water management in Yunlin, Taiwan, EGU General Assembly 2023, Vienna, Austria, 23–28 Apr 2023, EGU23-15459, https://doi.org/10.5194/egusphere-egu23-15459, 2023.

Irrigation plays a crucial role in alleviating the negative effects of drought on crop production. However, increasing competition for water by other sectors, such as industry and domestic use, increases the pressure on available water supplies. Under these circumstances, agricultural producers must be able to manage their available supplies efficiently to optimize irrigation water use. The objective of this research is to develop a decision support system (DSS) for optimizing irrigation scheduling for cotton production using Deep Reinforcement learning (DRL). Our approach uses multiple DRL algorithms that enable an intelligent agent to learn cotton irrigation needs in an interactive environment by trial and error using feedback from its past actions and experiences. Aquacrop is used as an environment (cotton field) simulator and is coupled with a DRL model to simulate crop yield for different actions taken by the agent. Our proposed software estimates the daily irrigation needs of a 7-acre crop field irrigated by a center pivot system located at Clemson University's Edisto Research and Education Center (REC), near Blackville, South Carolina. This new system enables a closed-loop control scheme to adapt the DSS to local perturbations such as soil moisture and rainfall variabilities.

How to cite: Umutoni, L.: An Intelligent Irrigation Decision Support System for Optimizing Cotton Water Use, EGU General Assembly 2023, Vienna, Austria, 23–28 Apr 2023, EGU23-16787, https://doi.org/10.5194/egusphere-egu23-16787, 2023.

EGU23-355 | ECS | PICO | HS7.4 | Highlight

Future changes of extreme precipitation and meteorological drought in Northern Italy 

Rui Guo and Alberto Montanari

Simulation of daily rainfall for the region of Bologna produced by 13 up-to-date climate models for the period 1850–2100 are considered. In particular, model simulations are compared with the historical series of daily rainfall observed in Bologna in terms of annual, seasonal, extreme precipitation and meteorological drought for the period 1850–2014. Future changes of both precipitation and meteorological drought are analysed to assess future scenarios up to 2100 to derive information on the future development of critical events for water resources availability and flood risk. The results prove that rainfall statistics, including seasonal patterns and extremes, are fairly well simulated by models. For future projections, extreme rainfall shows a more significant change compared to the mean annual rainfall. In terms of meteorological droughts, we conclude that historical data analysis under the assumption of stationarity may depict a more critical future with respect to climate model simulations, therefore outlining important technical indications.

How to cite: Guo, R. and Montanari, A.: Future changes of extreme precipitation and meteorological drought in Northern Italy, EGU General Assembly 2023, Vienna, Austria, 23–28 Apr 2023, EGU23-355, https://doi.org/10.5194/egusphere-egu23-355, 2023.

EGU23-1314 | PICO | HS7.4

Modelling rainfall interarrival times and rainfall depths at daily scale 

Stefano Ferraris, Carmelo Agnese, Tommaso Martini, Elvira Di Nardo, and Giorgio Baiamonte

Analysis of daily rainfall data, and subsequent modelling of some derived variables concerning rainfall, is fundamental in different areas such as agricultural, ecological, and engineering disciplines. A way of studying the alternance of consecutive rainy days (wet spells) and no-rainy days (dry spells) is through the interarrival time (IT), which is the time elapsed between two consecutives rainy days. If we suppose that IT observations are independent and identically distributed (i.i.d.), ITs are usually modelled through a renewal processes. The simplest renewal process is the Bernoulli process with ITs geometrically distributed. The need to suppose a non-constant probability of rain brings to more sophisticated models. Previous works [Agnese et al. (2014), Baiamonte et al. (2019)] have successfully proposed the three-parameter family of the Hurwitz-Lerch-Zeta distribution (HLZD), which represents a forward step with respect to other commonly used IT distributions. In [Agnese et al. (2022)], a second successfully reached goal was to show that the HLZD is also suitable to model the rainfall depth, h. In literature, rainfall depths are more frequently treated as continuous, despite sometimes these models fail to account for the time discreteness of the sampled process. Indeed, daily rainfall depth measurements are usually carried out by automatic-counting how many times a small bucket corresponding to 0.2 mm is filled. Due to the abundance of ties in the data, the variable depth h is well suited to be considered discrete. We present results involving data never considered in literature and consisting of measures sampled along 60-70 years at 7 different stations. These stations represent different climates from the rainfall characteristics point of view and let us to infer about the great handiness of the HLZD within rainfall modelling. Current research is addressed to modelling further rainfall variables related to IT and h, such as wet and dry spells, and the cumulative rainfall depth in a wet spell. Furthermore, given the remarkable performance of the HLZD family of distributions in the univariate modelling, we aim at modelling the dependence structure between IT and h, exploiting possibly new methodological advances in the subject, such as discrete copulas.


References

  • Agnese, G. Baiamonte, E. Di Nardo, S. Ferraris, and T. Martini (2022). Modelling the frequency of interarrival times and rainfall depths with the Poisson Hurwitz-Lerch zeta distribution. Fractal and Fractional, 6(9).
  • Agnese, G. Baiamonte, and C. Cammalleri (2014). Modelling the occurrence of rainy days
    under a typical Mediterranean climate. Advances in Water Resources, 64:62–76.
  • G. Baiamonte, L. Mercalli, D. C. Berro, C. Agnese, and S. Ferraris (2019). Modelling the frequency distribution of inter-arrival times from daily precipitation time-series in north-west Italy. Hydrology Research, 50(1):339–357.

How to cite: Ferraris, S., Agnese, C., Martini, T., Di Nardo, E., and Baiamonte, G.: Modelling rainfall interarrival times and rainfall depths at daily scale, EGU General Assembly 2023, Vienna, Austria, 23–28 Apr 2023, EGU23-1314, https://doi.org/10.5194/egusphere-egu23-1314, 2023.

EGU23-7675 | ECS | PICO | HS7.4

Risk assessment of Marathon reservoir spillway based on water level 

Nikolaos Bessas, Kalliopi Partida, Theano Illiopoulou, Panayiotis Dimitriadis, and Demetris Koutsoyiannis

The Marathon Dam is the oldest one in modern Greece located close to Athens and serving its water supply. Its reservoir has a capacity of 41 hm3. Several residential areas exist downstream of the dam, the nearest of which is just one kilometer away. Therefore, in the event of high reservoir spill (let alone dam failure), downstream local communities and properties are at considerable risk. In this work, we aim to assess the risk due to spill employing stochastic simulation of the reservoir water balance based on existing data. In addition, we attempt to derive operational rules to mitigate the risk of its downstream failures due to spill.

How to cite: Bessas, N., Partida, K., Illiopoulou, T., Dimitriadis, P., and Koutsoyiannis, D.: Risk assessment of Marathon reservoir spillway based on water level, EGU General Assembly 2023, Vienna, Austria, 23–28 Apr 2023, EGU23-7675, https://doi.org/10.5194/egusphere-egu23-7675, 2023.

EGU23-8740 | ECS | PICO | HS7.4

Regionalized design rainfall curves for Greece 

Theano Iliopoulou, Demetris Koutsoyiannis, Antonis Koukouvinos, Nikolaos Malamos, Nikolaos Tepetidis, David Markantonis, Panayiotis Dimitriadis, and Nikos Mamassis

We perform a large-scale assessment of the probabilistic behaviour of rainfall extremes over the Greek territory aiming to construct a national model for design rainfall. To this aim, we employ multiple sources of rainfall data: from long-term daily records to samples of multi-scale annual maxima, reanalysis rainfall products and satellite information. We identify suitable probability distributions for the multi-scale rainfall extremes useful for design rainfall estimation and regionalize their parameters over Greece using two-dimensional multivariate smoothing techniques. Unique insights are derived regarding the spatio-temporal variability of extreme rainfall over the Greek area, notable for its highly variable topography and climate.

How to cite: Iliopoulou, T., Koutsoyiannis, D., Koukouvinos, A., Malamos, N., Tepetidis, N., Markantonis, D., Dimitriadis, P., and Mamassis, N.: Regionalized design rainfall curves for Greece, EGU General Assembly 2023, Vienna, Austria, 23–28 Apr 2023, EGU23-8740, https://doi.org/10.5194/egusphere-egu23-8740, 2023.

EGU23-10272 | ECS | PICO | HS7.4 | Highlight

Linking exploratory scenarios to process-informed insights in climate vulnerability assessments 

John Kucharski, Scott Steinschneider, Jennifer Olszewski, Jonathan Herman, Saiful Rahat, Patrick Ray, Wyatt Arnold, and Romain Maendly

The threat that climate change poses to water resource systems has led to a significant and growing number of impact studies. These studies tend to follow two general methodological approaches: (1) top-down, process-based studies driven by projections of future climate change supplied by downscaled general circulation models (GCMs), and (2) bottom-up, vulnerability-based studies driven by exploratory scenarios. Top-down studies generate realistic climate scenarios, but computational burdens limit the ensemble size. As a result, critical vulnerabilities may be left unexplored. Bottom-up approaches make it possible to assess a wide range of scenarios, but usually without connection to physically plausible climate processes, limiting their utility in adaptive planning. This study develops process-informed exploratory scenarios that bridge the gap between top-down and bottom-up methods. This hybrid approach yields several advantages. First, emerging vulnerabilities associated with non-linear hydrologic changes are linked to thermodynamic and dynamic climate drivers modeled in the GCMs with differential likelihoods and plausible ranges of change. This provides a transparent link between stakeholder defined vulnerabilities and climate processes that is often missing in bottom-up assessments. Second, non-linear shifts in vulnerability are directly linked to specific climate drivers, through the systematic perturbation of process informed climate variables. Making this connection in top-down assessments is difficult since the climate response to an emissions scenario is modeled as part of an endogenous process. The hybrid approach developed by this study is presented with a case study in the Tuolumne River watershed; through which thermodynamic and dyanamically guided climate scenarios were created by a process-informed stochastic weather generator to evaluate flood and drought related performance vulnerabilities at the New Don Pedro Dam near the watershed’s outlet. This case study finds that flood and drought performance at the dam is more sensitive to process-informed climate drivers than less theoretically grounded delta shifts precipitation, and non-linear system responses to climate drivers are revealed through the systematic perturbation process-informed climate variables.

How to cite: Kucharski, J., Steinschneider, S., Olszewski, J., Herman, J., Rahat, S., Ray, P., Arnold, W., and Maendly, R.: Linking exploratory scenarios to process-informed insights in climate vulnerability assessments, EGU General Assembly 2023, Vienna, Austria, 23–28 Apr 2023, EGU23-10272, https://doi.org/10.5194/egusphere-egu23-10272, 2023.

EGU23-13318 | ECS | PICO | HS7.4

Violent land terrain alterations and their impacts on water management; Case study: North Euboea 

Panayiotis Dimitriadis, Matina Kougia, G.-Fivos Sargentis, Theano Iliopoulou, Nikos Mamasis, and Demetris Koutsoyiannis

North Euboea is a place with high topographic relief, covered mostly by wild forests, with a lot of small rivers receiving high amounts of rainfall. After 2017 a severe disease started to eliminate plane trees (Platanus orientalis), which were growing on the riverbanks stabilizing the flow of water. One more dramatic event which severely impacted North Euboea was the wildfire that occurred in August 2021 and burnt 52,900 ha. Both events drastically changed the land terrain, causing various impacts on the area’s watersheds. In this vein, we try to investigate the changes in the water flow and inspect the combined effects of these landscape alterations on water management. 

How to cite: Dimitriadis, P., Kougia, M., Sargentis, G.-F., Iliopoulou, T., Mamasis, N., and Koutsoyiannis, D.: Violent land terrain alterations and their impacts on water management; Case study: North Euboea, EGU General Assembly 2023, Vienna, Austria, 23–28 Apr 2023, EGU23-13318, https://doi.org/10.5194/egusphere-egu23-13318, 2023.

EGU23-14416 | ECS | PICO | HS7.4

Estimating the risk of large investments using Hurst-Kolmogorov dynamics in interest rates 

David Markantonis, Panayotis Dimitriadis, G.-Fivos Sargentis, Theano Iliopoulou, Nikos Mamassis, and Demetris Koutsoyiannis

Economies of scale, which minimize the cost of the unit, are vital for the prosperity of the society and the progress of civilizations. In order to achieve economies of scale, large investments have to be made. However, investments contain always a risk.  An important evaluation of the investment’s risk could be done by interest rates. In this study, we update our recently presented methodology from utilizing Markov assumptions and instead for the timeseries generation algorithm, we employ a stochastic model following the Hurst-Kolmogorov dynamics . The updated methodology is applied for interest rates in various historical periods and compared with the Markov-based one.

How to cite: Markantonis, D., Dimitriadis, P., Sargentis, G.-F., Iliopoulou, T., Mamassis, N., and Koutsoyiannis, D.: Estimating the risk of large investments using Hurst-Kolmogorov dynamics in interest rates, EGU General Assembly 2023, Vienna, Austria, 23–28 Apr 2023, EGU23-14416, https://doi.org/10.5194/egusphere-egu23-14416, 2023.

EGU23-16120 | ECS | PICO | HS7.4

Application of Rain-on-Grid for flash flood modeling: A case study in the Selška Sora watershed in Slovenia 

Marcos Julien Alexopoulos, Theano Iliopoulou, Panayiotis Dimitriadis, Nejc Bezak, Mira Kobold, and Dimitris Koutsoyiannis

Rain-on-Grid (RoG) modelling offers an attractive alternative to more traditional routing methods. Currently, few publications are addressing the suitability of this approach to modelling a storm event, and fewer benchmark findings present its possible limitations. In the present study, it is verified whether RoG is able to replicate the 2007 flash flood event that occurred in the Selška Sora watershed, located in western Slovenia. The results are validated against a high-resolution benchmark run, and the flood footprint extracted from the field by the Slovenian Environment Agency. Results display a satisfactory description of the flood event using uniform station rainfall data as an input. The flood extent slightly exceeds the confines of the runup measured in the field. RoG offers a more realistic description of the downstream hydrograph, with a sharper initial peak, when antecedent soil moisture is lower.


Keywords: Rain-on-Grid, Flash flood, Slovenia

How to cite: Alexopoulos, M. J., Iliopoulou, T., Dimitriadis, P., Bezak, N., Kobold, M., and Koutsoyiannis, D.: Application of Rain-on-Grid for flash flood modeling: A case study in the Selška Sora watershed in Slovenia, EGU General Assembly 2023, Vienna, Austria, 23–28 Apr 2023, EGU23-16120, https://doi.org/10.5194/egusphere-egu23-16120, 2023.

EGU23-16168 | ECS | PICO | HS7.4 | Highlight

An advanced methodology for field visits towards efficient flood management on building block level 

Stavroula Sigourou, Alexia Tsouni, Vasiliki Pagana, G-Fivos Sargentis, Panayiotis Dimitriadis, Romanos Ioannidis, Efthymios Chardavellas, Dimitra Dimitrakopoulou, Nikos Mamasis, Demetris Koutsoyiannis, and Charalampos (Haris) Kontoes

Flood risk assessment for vulnerable areas serves the needs of the stakeholders for flood management. Therefore, it’s essential for the applied methodology to be detailed and use advanced techniques depending on the characteristics of each study area. In the Programming Agreement with the Prefecture of Attica, the Operational Unit “BEYOND Centre of EO Research & Satellite Remote Sensing” of the Institute of Astronomy, Astrophysics, Space Applications & Remote Sensing (IAASARS) of the National Observatory of Athens (NOA), in cooperation with the Research Group ITIA of the Department of Water Resources and Environmental Engineering of the School of Civil Engineering of the National Technical University of Athens (NTUA) study five flood-stricken river basins in the region of Attica, which affect 23 Municipalities. It’s the first time that such a holistic approach for flood risk assessment is implemented on building block level in Greece. Hence, taking into consideration the regional scale and the high spatial resolution in hydrologic and hydraulic models and flood hazards maps, detailed field visits are conducted following a specific methodology. Specifically, cross section measurements of pipes, culvers, bridges are gathered from the field and used for the terrain modification of Digital Elevation Model. Additionally, many high-risk points are identified in residential areas, road network and other critical infrastructures, which are classified based on their risk level and accompanied by a detailed technical report. The importance of field visits lies on the need of updated and high resolution input data, the understanding and the functionality of a constantly changing river basin including the anthropogenic and environmental stressors. As a result, enhanced models are created using both earth observation and field data and the reduction of the uncertainty is achieved comparing with past studies.

How to cite: Sigourou, S., Tsouni, A., Pagana, V., Sargentis, G.-F., Dimitriadis, P., Ioannidis, R., Chardavellas, E., Dimitrakopoulou, D., Mamasis, N., Koutsoyiannis, D., and Kontoes, C. (.: An advanced methodology for field visits towards efficient flood management on building block level, EGU General Assembly 2023, Vienna, Austria, 23–28 Apr 2023, EGU23-16168, https://doi.org/10.5194/egusphere-egu23-16168, 2023.

EGU23-16222 | ECS | PICO | HS7.4

Comparison of Stochastic versus Deep Learning methods for simulation and prediction of hydroclimatic time series 

Nikolaos Tepetidis, Theano Iliopoulou, Panayiotis Dimitriadis, and Demetris Koutsoyiannis

Deep-learning methods are receiving great scientific attention and increasingly gaining popularity in a variety of water-resources tasks as well. Yet till now they are less employed for the simulation of hydroclimatic timeseries, the stochastic properties of which are usually challenging and dealt by the application of stochastic methods. The latter are well-established for the analysis and simulation of hydroclimatic processes and are particularly successful in capturing their long-term dependence behavior, so-called Hurst-Kolmogorov (HK) dynamics. In this work, we aim to assess the suitability of a state-of-the-art deep learning algorithm, called Transformer Neural Network (TNN) for hydroclimatic processes, as it is claimed to have a good performance in time series data. The Transformer Neural Networks is a novel architecture that aims to track relationships in sequential data while it is suggested that it can handle long-range dependence. We apply the TNN for the simulation and prediction of timeseries from various hydroclimatic processes (such as rainfall, runoff,  temperature) and evaluate its performance in relation to the application of the HK algorithms.

How to cite: Tepetidis, N., Iliopoulou, T., Dimitriadis, P., and Koutsoyiannis, D.: Comparison of Stochastic versus Deep Learning methods for simulation and prediction of hydroclimatic time series, EGU General Assembly 2023, Vienna, Austria, 23–28 Apr 2023, EGU23-16222, https://doi.org/10.5194/egusphere-egu23-16222, 2023.

EGU23-16278 | PICO | HS7.4 | Highlight

Contribution of Anthropogenic and Climatic drivers to the Surface Water Extent Change in the Contiguous United States 

Alberto Montanari, Irene Palazzoli, and Serena Ceola

Demographic expansion along with shifts in precipitation trends and temperature rise considerably impact the availability of surface water resources, causing serious consequences for human and the environment. The identification of the human and climatic dynamics contributing to the expansion and reduction of the extent of surface water bodies is key to guarantee the preservation of freshwater ecosystems and water scarcity.

In this work, we evaluated the variation of surface water extent and five potential drivers that occurred between 1984 and 2020 within the river basins of the contiguous United States (CONUS). We selected built-up area, population, and irrigated land as anthropogenic drivers, while precipitation and temperature represent the hydroclimatic drivers. The analysis of the interaction between changes in surface water extent and its drivers revealed that there has been an expansion of surface water extent over the majority of the CONUS, which was mainly induced by an increase in the mean annual precipitation, mostly in river basins with a continental and temperate climate. The reduction of the extent of surface water observed in the river basins in the arid southwestern region of the CONUS resulted to be influenced by all the anthropogenic and hydroclimatic factors, especially by temperature rise and population growth. We also noticed that river basins sharing the same climatic condition present similar trends of change in surface water extent and its drivers. In particular, arid river basins show distinct pattern of variations with respect to other climatic regions of the CONUS. This result highlights the need to further analyze these vulnerable areas where water availability is greatly affected on anthropogenic activities and climate change.

How to cite: Montanari, A., Palazzoli, I., and Ceola, S.: Contribution of Anthropogenic and Climatic drivers to the Surface Water Extent Change in the Contiguous United States, EGU General Assembly 2023, Vienna, Austria, 23–28 Apr 2023, EGU23-16278, https://doi.org/10.5194/egusphere-egu23-16278, 2023.

EGU23-16478 | ECS | PICO | HS7.4

Public involvement in the design and implementation of infrastructure projects. 

Dimitra Dimitrakopoulou, Romanos Ioannidis, Panayiotis Dimitriadis, Theano Iliopoulou, George-Fivos Sargentis, Efthymios Chardavellas, Nikos Mamassis, and Demetris Koutsoyiannis

Infrastructure projects, although associated with public health and well-being, are often faced with opposition movements during their design and implementation. In this work, public involvement is investigated as means for comprehending the reasons behind any public opposition during the implementation of civil infrastructure works. More specifically, three courses of actions are proposed in order to initiate public engagement in the design process of infrastructure projects, i.e., (i) the collaboration with municipalities, institutes and universities for collection of data and previous studies in the area, (ii) the indirect communication with the public through online questionnaires, and (iii) the direct communication with the public during field works and by loose-format interviews regarding their experiences. After statistically evaluating the information acquired by the input data, it is concluded that the combination of the above actions can enhance the engineers’ knowledge at the area of interest, and thus, may result in a more efficient design of civil works, but also, in the public engagement during and after their implementation.

How to cite: Dimitrakopoulou, D., Ioannidis, R., Dimitriadis, P., Iliopoulou, T., Sargentis, G.-F., Chardavellas, E., Mamassis, N., and Koutsoyiannis, D.: Public involvement in the design and implementation of infrastructure projects., EGU General Assembly 2023, Vienna, Austria, 23–28 Apr 2023, EGU23-16478, https://doi.org/10.5194/egusphere-egu23-16478, 2023.

Since the settlement of the São Miguel Island (Azores-Portugal), in the middle of the fifteenth century, there is a record of occurrence of landslides, some with high socio-economic impact. In this work, we carried out a spatial, temporal and impact analysis of landslide events that were registered in the NATHA (Natural Hazards in Azores) database for the period 1900-2020, based on newspapers descriptions. A total of 236 landslide events (a day with one or more landslides identified) that caused human losses, damage to houses or obstruction of roads on São Miguel Island were catalogued. Based on the recorded events, it is verified that there is not a regular increment and/or pattern in the distribution of the events over time, although two main periods can be distinguished: 1900–1994 (1.0 events per year) and 1995–2020 (5.3 events per year). The events were responsible for 82 fatalities, 41 injuries, 66 houses partially or totally destroyed and 305 homeless people. The municipality of Povoação registered 76 landslide events, followed by the municipalities of Ribeira Grande (71 events), Ponta Delgada (69 events), Vila Franca do Campo (47 events), Nordeste (26 events) and Lagoa (21 events). Although there is a relative homogeneity on the distribution of landslide events in the municipalities of Povoação, Ribeira Grande and Ponta Delgada, the same does not apply to the impact caused. In the municipality of Povoação were counted 48 fatalities, 20 injuries, 17 houses destroyed and 109 homeless people, in Ponta Delgada 14 fatalities, 14 injuries, 24 houses destroyed and 173 homeless people and in Ribeira Grande 8 fatalities, 5 injuries, 16 houses destroyed and 21 homeless people. In the municipality of Vila Franca do Campo were counted 7 fatalities and 2 houses destroyed, in Nordeste 3 fatalities and 2 injuries, and in Lagoa 2 fatalities, 7 houses destroyed and 2 were homeless people. Rainfall was the triggering factor responsible for 70% of the catalogued landslide events, followed by sea erosion (8%), anthropogenic actions (4%) and earthquakes (2%). The triggering factor was not possible to identify in 16% of the landslide events. Landslides occurred mostly during the rainiest season (from November to March), which comprise about 78% of the catalogued landslide events.

How to cite: Silva, R. F., Marques, R., and Zêzere, J. L.: Landslides on São Miguel Island (Azores-Portugal) in the period 1900-2020: Analysis of the spatio-temporal distribution, triggering factors and impact based on newspapers press articles, EGU General Assembly 2023, Vienna, Austria, 23–28 Apr 2023, EGU23-445, https://doi.org/10.5194/egusphere-egu23-445, 2023.

EGU23-1542 | ECS | Orals | HS7.5

Triggering rainfall conditions of post-fire debris flows in Campania, Southern Italy 

Stefano Luigi Gariano, Giuseppe Esposito, Rocco Masi, Stefano Alfano, and Gaetano Giannatiempo

The Campania region, in Southern Italy, is affected by hundreds of wildfires every year, mainly during the summer season. Starting from the month of September, mountain watersheds including those hit by wildfires are impacted by even more frequent intense rainstorms. In such conditions, the high sediment availability, lack of recovered vegetation and a likely stronger soil water repellency increase the likelihood of surface runoff and soil erosion, leading to potential post-fire debris flows downstream.

This work provides information on more than 100 post-fire debris flows (PFDFs) that occurred in Campania between 2001 and 2021, with a particular focus on the triggering rainfall conditions. Rainfall measurements at a high temporal resolution (10 min) were gathered from a dense rain gauge network, with an average distance between sensors and PFDFs initiation areas of 2.6 km. Information on the occurrence of PFDFs was obtained from web news, social networks, and reports produced by the Fire Brigades. The collection of accurate information related to the debris flow timing and location allowed retrieving and analyzing properties of the triggering rainfall inputs, by identifying the minimum triggering conditions with rainfall thresholds. Moreover, to evaluate the temporal structure and type of the storms associated with the PFDFs (e.g., convective or frontal systems), the standardized rainfall profiles of the triggering events were defined. The return times of the peak cumulative rainfall of the bursts in 10, 20, and 30 minutes were also calculated.

Results show that the triggering rainfall events are very short (37 minutes on average), with high average intensity (73.2 mm/h and 49 mm/h in 10 and 30 minutes, respectively), and mostly associated with severe convective systems (i.e., thunderstorms). The estimated return times are quite low, with 75° percentiles of the related distribution ranging from 2.7 to 3.2 years, indicating that these rainfall events are neither rare nor extreme, as also observed by other authors worldwide. Differences are observed in return times and the spatial distribution of the events that occurred in July-September (higher rainfall magnitudes and longer return times) rather than in October-December. The time window in which PFDFs are more likely to occur in the study area has an extension of four months, from September to December. According to the defined triggering rainfall threshold, a rainfall of 11.4 mm in 30 minutes (corresponding to an average intensity of 22.8 mm/h) is likely sufficient to trigger a PFDF in the study area.

These research outcomes provide reliable and effective support to inform decision-makers engaged in hazard assessment and risk management, in order to implement suitable countermeasures in terms of monitoring and early warning systems. It is worth noting that PFDFs often occur in small-scale watersheds characterized by very short concentration times, in response to intense bursts of less than 60 minutes. This means insufficient lead time to fully develop an effective emergency response. This and other criticalities represent serious challenges requiring additional work.

How to cite: Gariano, S. L., Esposito, G., Masi, R., Alfano, S., and Giannatiempo, G.: Triggering rainfall conditions of post-fire debris flows in Campania, Southern Italy, EGU General Assembly 2023, Vienna, Austria, 23–28 Apr 2023, EGU23-1542, https://doi.org/10.5194/egusphere-egu23-1542, 2023.

EGU23-2000 | ECS | Orals | HS7.5

Foreseeing the propensity of rivers to extreme floods 

Stefano Basso, Ralf Merz, Larisa Tarasova, and Arianna Miniussi

Notwithstanding hundreds of years of efforts, flooding is still the most common natural disaster. A reliable assessment of the impending flood hazard is indeed an outstanding challenge with severe consequences. Mistaken estimates of the odds and magnitude of extreme floods especially result in huge economic losses due to widespread destruction of infrastructure and properties.

We show here that we can infer the propensity of rivers to generate extreme floods by means of two hydroclimatic and geomorphic descriptors of watersheds, which embody the spatial organization of the stream network and the characteristic streamflow dynamics of the river basin. These features are main determinants of a sharp increase of the magnitude of the rarer floods and of the flood value for which this marked growth of magnitude occurs, which we term flood divide as it separates ordinary from extreme floods. Their relevance is suggested by a novel ecohydrological approach to flood hazard assessment and confirmed by observations from hundreds of watersheds in the USA and Germany.

We first ascertained the capability of the method to distinguish between basins which do not and exhibit a flood divide, and its ability to dependably estimate its magnitude. We then applied a dimensional reduction tool to pinpoint key physioclimatic controls of the occurrence of flood divides, verifying our results against data. Finally, we utilized descriptors of these controls (namely the hydrograph recession exponent and streamflow variability) within binary logistic regression to predict the possible occurrence of flood divides and extreme floods in river basins. Repeated analyses for independent realizations of subsets of data indicate good prediction accuracy.

The identified controls of the propensity of rivers to generate extreme floods are readily estimated from primary hydroclimatic variables. The tool thus allows for inferring cases where extreme events shall be expected from short records of ordinary events, providing valuable information to raise awareness of the peril of floods in river basins.

This study summarizes results of the DFG-funded project "Propensity of rivers to extreme floods: climate-landscape controls and early detection - PREDICTED" (Deutsche Forschungsgemeinschaft - German Research Foundation, Project Number 421396820).

How to cite: Basso, S., Merz, R., Tarasova, L., and Miniussi, A.: Foreseeing the propensity of rivers to extreme floods, EGU General Assembly 2023, Vienna, Austria, 23–28 Apr 2023, EGU23-2000, https://doi.org/10.5194/egusphere-egu23-2000, 2023.

EGU23-2240 | ECS | Posters on site | HS7.5

Large-scale dynamical drivers associated with sub-daily extreme rainfall in Europe 

Anna Whitford, Hayley Fowler, Stephen Blenkinsop, and Rachel White

Short-duration (3hr) extreme rainfall events can cause significant socioeconomic and structural damage, alongside loss of life, due to their ability to generate dangerous flash floods, particularly in urban areas and small catchments. With the projected future increase in the frequency and intensity of these events due to global warming, it is imperative to improve our ability to provide warning to communities that may be impacted by these floods. Large-scale atmospheric dynamics play a role in generating the conditions conducive to the development of local-scale sub-daily extremes, but our current understanding of these processes is limited. Additionally, large-scale circulations are inherently more forecastable than small-scale features such as convection, therefore, this project focuses on finding connections between the large-scale dynamics and sub-daily extremes.

This study uses the quality-controlled Global Sub-Daily Rainfall dataset to identify past extreme events in western Europe. The atmospheric circulation pattern present on the day of each event is extracted from the UK Met Office’s set of 30 weather patterns (WPs) based on mean sea level pressure. This information is then used to examine the intensity and frequency of extreme events under each WP, leading to analysis of the spatial connections between the WPs and sub-daily extremes.

Results indicate just 5 of the 30 WPs account for 53% of recorded 3hr events above the 99.9th percentile in Europe in summer. The important WPs are a mixture of those showing a cyclonic system (cut-off low) close to or over western Europe and those representing a transitional environment. There are also distinct spatial patterns to the relationships in some cases, for example WP11 (isolated low pressure centred over the south-west UK), is associated with very high frequency of extremes over the UK and Portugal but much lower frequencies elsewhere in Europe. The identification of a select group of WPs as important for the generation of sub-daily extremes has implications for forecasting these events at longer lead times, as the large-scale WPs can be predicted further ahead than local conditions.

The WP-based analysis is supplemented by investigation of the links between the sub-daily rainfall extremes and synoptic scale Rossby wave patterns. The Local Finite Amplitude Wave Activity (LWA) metric is used to identify regions of anomalous cyclonic or anticyclonic wave activity both prior to and during the extreme events. This analysis indicates anomalous cyclonic wave activity at certain locations, including over Alaska, to the west of the British Isles and over northern Siberia, is significantly correlated with extreme rainfall over Europe. It is also possible to trace the LWA in days leading up to the extreme events, enabling identification of wave patterns that evolve into conditions associated with the extremes.

These results offer new evidence on the role of large-scale dynamics associated with sub-daily extreme rainfall, whilst also providing powerful information that could be used in the forecasting of these events.

How to cite: Whitford, A., Fowler, H., Blenkinsop, S., and White, R.: Large-scale dynamical drivers associated with sub-daily extreme rainfall in Europe, EGU General Assembly 2023, Vienna, Austria, 23–28 Apr 2023, EGU23-2240, https://doi.org/10.5194/egusphere-egu23-2240, 2023.

EGU23-2462 | ECS | Orals | HS7.5

Towards a method of rapid flood scenario mapping using hybrid approaches of hydraulic modelling and machine learning 

Andrea Pozo, Matthew Wilson, Emily Lane, Fernando Méndez, and Marwan Katurji

Floods are the most common hazard in New Zealand, the second most costly and they will change rapidly in frequency and intensity, become more extreme as the impacts of climate change become realized. At the same time, we are undergoing an intense urban development and growing population lives in floodplains, increasing the risk for people’s households and wellbeing. Additionally, computers have limited power and capacity, so there is a limitation in the number of flood scenarios that can be assessed and in the complexity of the hydrodynamic modelling process. This research project, which is part of the 5-year multi-stakeholder research programme “Reducing flood inundation hazard and risk across Aotearoa/New Zealand”, supported by the New Zealand Government and led by the National Institute of Water and Atmospheric Research (NIWA); investigates the feasibility of using a hybrid hydrodynamic/machine learning model to reduce the numerical modelling load and enable probabilistic modelling. The study site is the Wairewa catchment (Little River, Canterbury, New Zealand), working closely with the Wairewa Rūnanga based there. A sample of flooding scenarios is constructed based on the characteristics of the main inundation driver (spatial and temporal characteristics of rainfall extreme events) and other inundation drivers (lake level and antecedent conditions in the catchment). Selected scenarios from this sample will be modelled through a previously calibrated hydrodynamic model and the resultant inundation maps (maximum water depth map for each event) will be used to train a machine learning algorithm to produce the maps for the remaining events. The hybrid model would provide for any flooding scenario (defined by a specific number of variables) the corresponding inundation map in a fast and accurate way, avoiding the hydrodynamic modeling process (very time and computationally expensive). Results from this research will be used to develop a Mātauranga Māori approach to flood resilience and flood related policies by the local and central governments.

How to cite: Pozo, A., Wilson, M., Lane, E., Méndez, F., and Katurji, M.: Towards a method of rapid flood scenario mapping using hybrid approaches of hydraulic modelling and machine learning, EGU General Assembly 2023, Vienna, Austria, 23–28 Apr 2023, EGU23-2462, https://doi.org/10.5194/egusphere-egu23-2462, 2023.

EGU23-3005 | ECS | Posters virtual | HS7.5

Variations in floods associated with Tropical Cyclones over Mexico under ENSO conditions 

Christian Dominguez and Alejandro Jaramillo

Tropical cyclones (TCs) are among the most hazardous hydrometeorological phenomena. Mexico is affected by TCs from the North Atlantic and Eastern Pacific oceans, and they originate 86.5% of domestic disasters. The natural hazards associated with TCs are extreme precipitation events, floods, storm surges, and landslides. In the present preliminary study, we focus on exploring how El Niño-Southern Oscillation (ENSO) modulates the frequency and magnitude of extreme precipitation events and floods caused by TCs. We use the CHIRPS dataset for determining the extreme precipitation events (defined by the 95th percentile of daily precipitation) and Mexican rain gauge stations from May to November during the 1981-2013 period. We find that TCs are responsible for ~60% of floods in coastal regions, but this percentage decreases inland. Under El Niño conditions, most floods occur over southwestern Mexico. During neutral conditions, the western coast of Mexico is mainly affected. Under La Niña conditions, most floods occur over the eastern coast of Mexico. Additionally, trends in floods are explored. We conclude that local decision-makers need this information to decrease the hydrometeorological risk before the tropical cyclone season begins. Implementing this information on Early Warning Systems for TCs is also discussed.

How to cite: Dominguez, C. and Jaramillo, A.: Variations in floods associated with Tropical Cyclones over Mexico under ENSO conditions, EGU General Assembly 2023, Vienna, Austria, 23–28 Apr 2023, EGU23-3005, https://doi.org/10.5194/egusphere-egu23-3005, 2023.

EGU23-3073 | Posters on site | HS7.5

Flooding Hazard of Union Station and Impact of Ridership due to Climate Change-an Example of Banqiao Main Station 

Yong-Jun Lin, Hsiang-Kuan Chang, Kai-Yuan Ke, Jihn-Sung Lai, and Yih-Chi Tan

This study adopts the rainfall scenario generated by TCCIP (The Taiwan Climate Change Projection Information and Adaptation Knowledge Platform) based on IPCC AR5, which provides the 95th percentile of Taipei’s maximum 24-hour cumulative rainfall due to climate change. The baseline of this scenario is 404 mm for 1979-2008, and the projected rainfall is 517 mm for the future mid-century (2039-2065).

The flooding potentials of the Taipei Mass Rapid Transit (MRT) stations are obtained by applying the scenarios of rainfalls and the corresponding rainfall patterns of each rainfall station to a two-dimensional flood model. The flooding simulations of baseline and future scenarios show that Jingan Station and Fu-Jen University Station have the highest flooding potential, with a maximum flooding depth of 2 meters. The flooding hazard factors include flooding depth, flow velocity, and rising rate of water surface level. We adopted those factors to analyze the flooding hazard at Banqiao Main Station, which unites Banqiao Railway Station, a high-speed rail station, and Banqiao MRT station. It has a severe flooding potential and a large traffic volume. Because the mid-century rainfall is 1.43 times that of the baseline, the corresponding flooded area of the future scenario is also increased. As a result, the flooding hazards around the exits of Banqiao Main Station are high within the 300 m buffer for the baseline. In contrast, the very high flood hazard was found in a 200m-300m buffer for the future scenario.  

MRT Banqiao Station has 5 entrances/exits, while Banqiao Railway Station has 6 entrances/exits, a total of 11. The average daily ridership at this union station before Covid-19 is 159,239 people/day. The impact ratio of the ridership is set by the degree of flood hazard for each entrance/exit. In the future scenario, the number of affected people is roughly estimated to be 11,611 people/day, which is about 7% of daily ridership before Covid-19.

How to cite: Lin, Y.-J., Chang, H.-K., Ke, K.-Y., Lai, J.-S., and Tan, Y.-C.: Flooding Hazard of Union Station and Impact of Ridership due to Climate Change-an Example of Banqiao Main Station, EGU General Assembly 2023, Vienna, Austria, 23–28 Apr 2023, EGU23-3073, https://doi.org/10.5194/egusphere-egu23-3073, 2023.

EGU23-3734 | ECS | Orals | HS7.5

Modeling risk to infrastructure due to episodic debris fan aggradation 

Yuan-Hung Chiu, Colin P. Stark, and Hervé Capart

In many mountain valleys, communities and infrastructure are exposed to high risks of damage due to debris fan aggradation. To assess such risks, two questions must be addressed: (1) What will be the extent and thickness of deposition over the fan for a given volume of debris delivered from the upstream catchment? (2) How large could debris flow volumes be for a single event or a sequence of events? In this contribution, we propose a methodology to address both questions. Its first component is a simplified model of debris fan morphology, based on assuming a fan-slope-distance relationship along paths affected by topographic obstacles like steep valley sides. Using a computationally efficient algorithm, this model can be used to reconstruct past fan volumes from terrace remnants resolved on high resolution DEM topography, and to simulate large numbers of possible future events. Its second component is a stochastic model for the evolution of fan volume framed as a form of random walk. To take into account the episodicity of debris delivery, we model this random walk as a gamma-subordinated Wiener process aka a variance-gamma process. To calibrate the model parameters, we exploit both short-term and long-term data: for the slope-distance relationship, topographic data from recent and Holocene debris-fan remnants; for the stochastic process parameters, reconstructed fan-volume changes associated with recent flood events and with older radiocarbon-dated fan surfaces. We illustrate the approach with an application to the Laonong River in southern Taiwan. In this valley, an important roadway link has been repeatedly damaged by debris-flow aggradation. To guide road and bridge reconstruction, it is essential to assess fan aggradation risk for different design alternatives on a decadal time scale or more. The model provides a basis for optimizing the layout and height of such infrastructure.

How to cite: Chiu, Y.-H., Stark, C. P., and Capart, H.: Modeling risk to infrastructure due to episodic debris fan aggradation, EGU General Assembly 2023, Vienna, Austria, 23–28 Apr 2023, EGU23-3734, https://doi.org/10.5194/egusphere-egu23-3734, 2023.

EGU23-4243 | ECS | Posters on site | HS7.5

Do CMIP6 climate models capture rapid shifts between dry and wet extremes? 

Rong Gan and Yuting Yang

Do CMIP6 climate models capture rapid shifts between dry and wet extremes?

Authors: Rong Gan1, Yuting Yang1,*

Affiliations: 1State Key Laboratory of Hydroscience and Engineering, Department of Hydraulic Engineering, Tsinghua University, Beijing, China

*Correspondence to: Yuting Yang (yuting_yang@tsinghua.edu.cn)

Keywords: CMIP6, climate extremes, compound events

Abstract:

Rapid shifts between dry and wet extremes may impose higher socioeconomic and environmental pressure than single extremes. Whether the sixth phase of the Coupled Model Intercomparison Project (CMIP6) models are capable of capturing the abrupt alternations between dry and wet periods remain elusive. Here we examine such compound events simulated by CMIP6 models based on the state-of-the art reanalysis datasets, namely ERA5, NCEP-NCAR and MERRA-2. The 1-month Standard Precipitation-Evapotranspiration Index (SPEI) were first calculated to identify dry spells (SPEI≤1) followed by wet spells (SPEI≥1), and vice versa. Event characters including frequency, duration and intensity were then evaluated across all CMIP6 models and reanalysis datasets spanning 1980-2014. We find the following:

  • CMIP6 multimodel-ensemble median and reanalysis ensemble give close estimates of event characters on global average, with frequency being about 4.1 and 3.67 (No. events/20-year), duration of 2.50 and 2.55 (months), and intensity around 3 (SPEI mean) for dry-wet events, respectively. Similar values were found for wet-dry events.
  • During 1980-2014, CMIP6 and reanalysis indicate roughly 10% increase in event frequency comparing the first and last 20-year periods, and less than 1% increase in duration and intensity for both dry-wet and wet-dry events.
  • Spatial distribution for event frequency tends to overlap for dry-wet and wet-dry events, as shown by both CMIP6 models and reanalysis. Hot spots were found in North-eastern America, Europe, Eastern Asia, South-western America, and Middle Africa. Higher latitude regions were shown to experience more events. Despite general spatial agreement between CMIP6 and reanalysis, discrepancies can be seen on finer scales within each region.
  • Common spatial patterns for duration were also found between the two types of events based on CMIP6 models, where the events tend to last longer in middle and southern Eurasia, Eastern Africa, northwest of South America and west of Northern and Central America. However, reanalysis indicates longer events also happened in Middle Africa and eastern Australia. Both CMIP6 models and reanalysis indicate longer event duration roughly around the equator.
  • CMIP6 models give much higher dry-wet intensity compared to wet-dry, especially in Australia and Southern and Western Asia. Reanalysis agrees well on this pattern, yet greater magnitude differences were found in eastern South America.

Overall, CMIP6 models are capturing the variations of abrupt dry and wet alternations well when compared to reanalysis. The models are more skilful in simulating event frequency than duration and intensity in general. Caution should be paid assessing such compound events especially on smaller spatial scales and sensitive regions such as Africa for frequency and Australia for duration and intensity. Our results can be further employed to support climate risk adaptation and mitigation.

How to cite: Gan, R. and Yang, Y.: Do CMIP6 climate models capture rapid shifts between dry and wet extremes?, EGU General Assembly 2023, Vienna, Austria, 23–28 Apr 2023, EGU23-4243, https://doi.org/10.5194/egusphere-egu23-4243, 2023.

EGU23-4417 | ECS | Posters on site | HS7.5

Hazard index applied to natural rivers – Preliminary result from a case study of mountain trails in southern Brazil 

Marina Refatti Fagundes, Fernando Mainardi Fan, Gean Paulo Michel, Karla Campagnolo, Masato Kobiyama, Ronald Pöppl, and Bruno Henrique Abatti

Trails are one of the main places for ecotourism practitioners’ activities. Many of them are located close to watercourses, and it is often necessary for practitioners to cross them. This often leads to dangerous situations, since critical conditions of water stages and flow velocity can make people lose their walking stability. One way to quantify these hazards is the hazard index (HI) which, in general, is defined as the product of the flow velocity by its depth (Stephenson, 2002). Although many studies have been carried out to determine the HI values as safety limits for people exposed to water flows, none of them analyzed the natural river conditions like those encountered during an ecotourism trail. In these environments, locomotion is hampered due to the surface which is usually highly irregular and often contains slippery rocks and sediments. Thus, that there is a gap related to the HI analysis in natural rivers, and more research becomes necessary, since more people have sought to carry out activities related to ecotourism. The main objective of this research is to apply HI approach in natural rivers so that its results can be utilized in the management of trails containing watercourses crossing. Initially, a bibliographic review was carried out, where some important concerns related to people's loss of stability were analyzed. The results of the bibliographic review were organized within a summary table which permits verifying variables with stronger influence on people's stability, during these walks. After this first stage, three mountain trails located in the Aparados da Serra National Park, in southern Brazil, were selected for field measurements. In all of these trails, measurements of flow depth and velocity were carried out using a small current meter and the granulometry of the river sediments was measured through an adaptation of the Pebble Count method. The measurements were taken at all points where tourists cross the riverbed during the trails, i.e., 23 measurement sites in total. The analysis of these data resulted in preliminar information: (i) an easy-to-interpret diagram that indicates the thresholds values of HI in natural rivers, named Hazard Index Diagram of Natural River (HIDNR); and (ii) list of the main variables responsible for people's loss of stability, in order to contribute to the safety of ecotourism practitioners. One of the next steps of the work is to analyze how the sediment transport and connectivity behaviour could give us insights about hazard levels.

REFERENCES

STEPHENSON, D. (2002). Integrated flood plain management strategy for the Vaal. Urban Water, v. 4, n. 4, p. 423-428.

How to cite: Refatti Fagundes, M., Mainardi Fan, F., Michel, G. P., Campagnolo, K., Kobiyama, M., Pöppl, R., and Abatti, B. H.: Hazard index applied to natural rivers – Preliminary result from a case study of mountain trails in southern Brazil, EGU General Assembly 2023, Vienna, Austria, 23–28 Apr 2023, EGU23-4417, https://doi.org/10.5194/egusphere-egu23-4417, 2023.

EGU23-4537 | ECS | Orals | HS7.5

What controls physical vulnerability to geo-hydrological hazards? A contribution to quantitative assessment of landslide and flood risk in western Uganda 

John Sekajugo, Grace Kagoro-Rugunda, Rodgers Mutyebere, Clovis Kabaseke, David Mubiru, Esther Namara, Violet Kanyiginya, Bosco Bwambale, Liesbet Jacobs Jacobs, Olivier Dewitte, and Matthieu Kervyn

Geo-hydrological hazards (landslides and floods) are often associated with significant damages on physical infrastructure like buildings and roads. Understanding the factors controlling the extent of damage is a prerequisite for quantitatively estimating risk and its spatial distribution, and advising on measures to reduce vulnerability. In this study we document the impact of 64 landslide and six flood events in four selected districts in western Uganda for the period May 2019 - March 2021 through extensive fieldwork. We quantify in economic value the physical damage of landslide and flood hazards on exposed buildings, roads and bridges. We then analyse the physical vulnerability based on damage ratios and determine the factors  (building material, hazard characteristics and age of the building) that control the degree of damage using fractional logistic regression. Out of the 91 buildings affected by landslides, 54% were totally destroyed, and only 10% not or minorly damaged, for an average damage cost of 3,179 USD/building. For the 212 documented buildings affected by floods, 35% were totally destroyed, 28% had severe to moderate damage and the rest were minorly or not affected, with an average damage costs of 1,755 USD/building. The physical vulnerability of buildings to landslides depends on the size of the landslide, age of the building, type of building wall material and the steepness of the slope cut to establish an artificial foundation platform. On the other hand, the physical vulnerability of buildings to flood hazards is largely controlled by the flood depth, the distance from the river channel, slope, size of flooded area and type of floor material. The physical vulnerability functions developed in this study are being used as a new inputs into a regional quantitative model of geo-hydrological risks. Combining the hazard estimates with the most accurate information on exposure of physical infrastructure, will facilitate the identification of the types of events and the locations that require most attention for risk reduction.

How to cite: Sekajugo, J., Kagoro-Rugunda, G., Mutyebere, R., Kabaseke, C., Mubiru, D., Namara, E., Kanyiginya, V., Bwambale, B., Jacobs, L. J., Dewitte, O., and Kervyn, M.: What controls physical vulnerability to geo-hydrological hazards? A contribution to quantitative assessment of landslide and flood risk in western Uganda, EGU General Assembly 2023, Vienna, Austria, 23–28 Apr 2023, EGU23-4537, https://doi.org/10.5194/egusphere-egu23-4537, 2023.

EGU23-5513 | ECS | Posters on site | HS7.5

Global IDF curves created from local observations using machine learning 

Jannis Hoch, Izzy Probyn, Joe Bates, Oliver Wing, and Christopher Sampson

Intensity–duration–frequency (IDF) curves are representations of the probability that a given rainfall intensity will occur within a given period. At the global scale, however, only for a few locations sub-daily rain gauge data is available from which global IDF curves could be derived. This poses a major challenge for simulations of global pluvial flood hazard and risk which require information of intensity, duration, and probability as boundary conditions. Therefore, efficient yet accurate means for scaling the locally available data to the global extent need to be found.

Consequently, we use available quality-controlled sub-daily precipitation data from the GSDR data set to derive growth curve parameters at around 10,000 locations world-wide. After combining these scale and shape parameters with globally available data of main precipitation drivers, a regionalized machine learning model is first trained and tested and then applied to produce global IDF maps.

Finally, we evaluated these maps against an ensemble of openly available local IDF curves found in literature. By selecting locations spread across the globe, we try to ensure to include as much variability as possible in the evaluation. Additionally, the global IDF curves were benchmarked against available more bespoke IDF data in the USA and UK.

While such data-driven approaches clearly depend on the quality and quantity of available sub-daily rainfall observations, the method still shows to capabilities of current data-driven modelling approaches to scale local data to global data applicable in both flood risk research and practice.

How to cite: Hoch, J., Probyn, I., Bates, J., Wing, O., and Sampson, C.: Global IDF curves created from local observations using machine learning, EGU General Assembly 2023, Vienna, Austria, 23–28 Apr 2023, EGU23-5513, https://doi.org/10.5194/egusphere-egu23-5513, 2023.

EGU23-6689 | ECS | Orals | HS7.5 | Highlight

Global analysis of emergency service provision to vulnerable populations during floods of various magnitude under climate change 

Sarah Johnson, Robert Wilby, Dapeng Yu, and Tom Matthews

In a world of increasing global flood hazards, vulnerable populations (very young and elderly) are disproportionately affected by flooding due to their low self-reliance, weak political voice and insufficient inclusion in climate adaptation and emergency response plans. These individuals account for most flood casualties and often rely on emergency services due to flood-induced injuries, exacerbated medical conditions, and requiring evacuative assistance. However, emergency service demand often exceeds the potential capacity whilst flooded roads and short emergency response timeframes decrease accessibility, service area, and population coverage; but how does this compare across the globe and what will the future hold?

To answer this question, a global analytical framework has been created to determine the spatial, temporal, and demographic variability of emergency service provision during floods. This is based on global fluvial and coastal flooding (at 10-year and 100-year return periods), and present and future flood conditions (present-day and 2050, under RCP 4.5 and RCP 8.5 climate scenarios). The framework includes an accessibility analysis to identify emergency service accessibility to vulnerable populations based on restrictions of flood barriers and response-time frameworks, a vulnerability analysis to compare the difference in emergency service provision between key demographic groups, and a hotspot analysis to identify the extent and distribution of flood hazards and at-risk vulnerable populations.

Research findings include the identification that (based on the scenario of 2050 riverine flooding at a 100-yr return period under RCP8.5 and a 30-minute response time):

  • Globally, 64% of schools are always accessible to the ambulance service and 56% of schools are always accessible to the fire service
  • Globally, 29% of schools are never accessible to the ambulance service and 38% of schools are never accessible to the fire service.
  • Globally, approximately 20% fewer people are accessible to emergency services than under non-flood conditions.
  • Africa and Asia experience the greatest accessible population reductions (14-27% and 24-25%) whilst Europe experiences the least accessible population reductions (8-9%).
  • Priority hotspot countries are primarily located in central North America (e.g., Belize), northern South America (e.g., Guyana) and west-central Africa (e.g., Liberia).

The highlighted geographical and temporal differences in emergency service provision globally and between regions, in addition to the framework itself, can be used by national and international organisations to inform strategic planning of emergency response operations and major investments of infrastructure, services, and facilities to maximise the benefit to the disproportionately affected vulnerable populations. This includes the production of more detailed flood hazard and evacuation maps that highlight vulnerability hotspots, the prioritisation of vulnerable population groups in emergency response plans to minimise geographic and population disparities of flood injuries and fatalities, and the allocation of emergency service hubs in regions of high vulnerability but low emergency response provision.

How to cite: Johnson, S., Wilby, R., Yu, D., and Matthews, T.: Global analysis of emergency service provision to vulnerable populations during floods of various magnitude under climate change, EGU General Assembly 2023, Vienna, Austria, 23–28 Apr 2023, EGU23-6689, https://doi.org/10.5194/egusphere-egu23-6689, 2023.

EGU23-7000 | Orals | HS7.5

Areal reduction factor assessment for extreme rainfalls through a new empirical fixed-area formulation 

Alessia Flammini, Jacopo Dari, Carla Saltalippi, and Renato Morbidelli

In the hydraulic structures design against extreme events a proper estimate of the areal reduction factor (ARF) is required. Specifically, rainfall-runoff models widely used need to be fed with information on areal-average rainfall over a watershed surface, while rainfall data is typically available at a point scale. The ARF allows to convert rainfall data from point to areal scale.

In this work, a new fixed-area and deterministic approach for estimating the ARF is proposed; it involves ratios between observed annual maxima with specific duration of average rainfall occurring in a specific area and those referring to all the available point rainfalls in the same area. The approach was applied to the Umbria region in Central Italy where, using high-quality and validated rainfall data (with a temporal resolution of 1 minute), a parametric relation expressing ARFs as function of duration and area was found. The outcomes were then compared with those of the most widespread empirical approaches available in literature, often applied when rainfall data are lacking, obtaining substantial over- or underestimation of empirical ARFs. This confirms that the transposition of ARF relations from a geographic area to another could have not-negligible impacts on the design of hydraulic structures. In addition, indications aimed at selecting the most suitable method to be applied for ARF estimation are provided. Specifically, the proposed approach is suitable when a limited number of years of rainfall observations is available. In this regard, the robustness of the methodology was tested by varying the length of the rainfall observation period; a minimum number of about 6 years was found to make the derived empirical formulation sufficiently accurate in a specific area.

How to cite: Flammini, A., Dari, J., Saltalippi, C., and Morbidelli, R.: Areal reduction factor assessment for extreme rainfalls through a new empirical fixed-area formulation, EGU General Assembly 2023, Vienna, Austria, 23–28 Apr 2023, EGU23-7000, https://doi.org/10.5194/egusphere-egu23-7000, 2023.

EGU23-7194 | ECS | Posters on site | HS7.5

Urban Flood Risk in Dhaka, Bangladesh 

Farzana Mohuya, Claire Walsh, and Hayley Fowler

Dhaka, the capital city of Bangladesh, is one of the most densely populated cities in South Asia. Urban flooding from extreme rainfall is a recurring phenomenon, with historic floods in 1988, 1998, and 2004 amongst the most catastrophic events in Dhaka. Prolonged urban flooding or water logging is a major concern for both Dhaka North City Corporation (DNCC) and Dhaka South City Corporation (DSCC) areas. This research investigates how “Citizen Science (CS)” could help individuals, communities, and stakeholders understand and manage the risk of current and future urban flooding, integrating formal flood risk management along with the affected area’s respondents’ self-perceived perception, concerns, experience, awareness, and opinions about flood risk management, and ability to cope with the flood risk. Fieldwork data were collected through the administration of a purposely designed questionnaire to 500 respondents in the water logging affected wards of the two city corporations’ areas in Dhaka. Preliminary findings from the fieldwork revealed that every year approximately 45.6% and 29.4% respondents in the study area experienced 1-3 days of urban flooding/water logging, mostly during the monsoon season (June – September), with a work time loss of 3-4 hours respectively. Respondents in the study area are aware and concerned about flooding and its associated risk, and approximately 36.9% respondents think that the frequency of urban flooding will increase in Dhaka in the next 10 years. In terms of the vulnerability, approximately 51.5% respondents mentioned that they are vulnerable to urban flooding and small business holders (Entrepreneurs) are most affected (61.5% respondents) by flooding. Although almost 61.2% respondents were not familiar with the “Citizen Science” concept, but approximately 42.8% of respondents expressed an eagerness to involve themselves in any Citizen Science based project to promote awareness and mitigation of urban flood risk/water logging issues in their community or in Dhaka City. In addition, preliminary findings from Key Informant Interviews (KII) and Focus Group Discussion (FGD) Meetings suggested that unplanned urbanisation, poor and inadequate drainage system management, and recent extreme rainfall events were the major drivers behind the urban flooding/water logging situation in Dhaka.

The study also explored annual and seasonal trends of rainfall in Dhaka (using observed datasets from the Bangladesh Meteorological Department) over the period from 1953-2019 using extreme precipitation indices [Climate Change Detection and Indices (ETCCDI)]. It is revealed that over these 67 years, Annual Maximum Daily Rainfall has increased during winter (0.021 mm/year) but statistically significantly decreased during the monsoon (-0.636 mm/year). The overall annual rainfall has significantly decreased (-0.718 mm/year). Trends in Consecutive Dry Days, heavy, and very heavy precipitation days indicate an annual increasing rate of 0.158 days/year for CDD, 0.077 days/year with >= 10 mm rainfall and 0.019 days/year with >= 20 mm rainfall, respectively. Results from the rainfall datasets are now being integrated with the fieldwork findings and other secondary datasets to set up a Hydrodynamic Model (CityCAT) to investigate current and future flood risk in Dhaka in more detail.

How to cite: Mohuya, F., Walsh, C., and Fowler, H.: Urban Flood Risk in Dhaka, Bangladesh, EGU General Assembly 2023, Vienna, Austria, 23–28 Apr 2023, EGU23-7194, https://doi.org/10.5194/egusphere-egu23-7194, 2023.

EGU23-7772 | ECS | Orals | HS7.5 | Highlight

Societal Flood Risk in Italy 

Mina Yazdani, Paola Salvati, Mauro Rossi, Cinzia Bianchi, and Fausto Guzzetti

Flood events are among the most damaging natural disasters, with billions of people being directly exposed to the risk of intense flooding worldwide. The economic and societal consequences of these events are expected to increase in the coming years. Flood societal risk can be determined by analyzing the relationship between the frequency of fatal flood events and the magnitude of the resulting consequences to the population (evaluated by the number of fatalities due to the event). Here, we test an approach previously proposed for landslides to estimate the flood societal risk in Italy, using historical sparse data on flood fatalities, available through national catalogues. Such an approach is based on the use of the Zipf distribution, which has previously been widely adopted for the modeling of societal risk for different natural hazards. The model allowed the evaluation of the spatial and temporal distribution of societal flood risk over the Italian territory over a regularly spaced grid. Different risk scenarios are presented and discussed.  

How to cite: Yazdani, M., Salvati, P., Rossi, M., Bianchi, C., and Guzzetti, F.: Societal Flood Risk in Italy, EGU General Assembly 2023, Vienna, Austria, 23–28 Apr 2023, EGU23-7772, https://doi.org/10.5194/egusphere-egu23-7772, 2023.

EGU23-10096 * | ECS | Orals | HS7.5 | Highlight

Could the 2019-20 Australia bushfires or 2020-22 floods be predicted using CMIP decadal prediction? 

Ze Jiang, Dipayan Choudhury, and Ashish Sharma

Over the past six years, Australia has experienced significant fluctuations in rainfall, including prolonged dry conditions and extensive bushfires, followed by two consecutive years of heavy rainfall in the east. Could such anomalies be predicted many years in advance is the question this study hopes to answer. A prediction framework that combines empirical and physically-based approaches using CMIP decadal prediction, and a novel spectral transformation approach is presented. When tested in a hindcast experiment, this framework shows significant prediction skill for rainfall up to five years in the future across all regions and climate zones in Australia. This framework was used to project from 2018 to 2022, covering the years of bushfires and extreme floods in Australia, as an added blindfolded validation of the prediction approach used. Following this, a blind projection of the precipitation anomalies over the continent for the coming five years is presented, to assess whether the anomalies for the past five years were, indeed, anomalies, or part of a pattern of what can be expected into the future. It is shown that this decadal framework has great potential for predicting whether the next few years will be wetter or drier, extending the predictive accuracy beyond a few months into the future. This can be valuable for managing water resources, prioritizing demands, protecting vulnerable systems, and reducing uncertainty in hydrological decision-making.

How to cite: Jiang, Z., Choudhury, D., and Sharma, A.: Could the 2019-20 Australia bushfires or 2020-22 floods be predicted using CMIP decadal prediction?, EGU General Assembly 2023, Vienna, Austria, 23–28 Apr 2023, EGU23-10096, https://doi.org/10.5194/egusphere-egu23-10096, 2023.

EGU23-10255 | Orals | HS7.5

Cascading flood hazards: the role of large wood transport 

Virginia Ruiz-Villanueva

Floods are one of the most relevant natural hazards, causing significant socio-economic damage every year globally. They will likely continue to increase for various reasons: the climate and global changes, two relevant ones. More importantly, our still limited capability to predict river response to flooding and anticipate the consequences by designing proper and sustainable risk mitigation measures. A recent example was Europe's floods in July 2021, the highest recorded. They led to many casualties and economic losses (i.e., 180 fatalities and billions of Euros). Extreme long, high-intensity rainfall resulted in extreme flows, particularly in small tributaries, but this could not solely explain the devastating impacts. Geomorphological changes, bank erosion and channel widening, sediment erosion and transport, and uprooted and transported trees and instream large wood accumulated at bridges played a significant role. However, these cascade processes are rarely quantified or considered in flood hazard and risk analysis. This is the focus of this talk. Case studies showing a combination of modelling approaches will illustrate how quantifying the supply and transport of instream large wood is essential in river reaches crossing infrastructures like bridges to assess flood-related hazards and risks.

How to cite: Ruiz-Villanueva, V.: Cascading flood hazards: the role of large wood transport, EGU General Assembly 2023, Vienna, Austria, 23–28 Apr 2023, EGU23-10255, https://doi.org/10.5194/egusphere-egu23-10255, 2023.

Characterizing the upper tail of flood peak distributions remains a challenge due to the elusive nature of extreme floods, particularly the key elements of flood-producing storms that are responsible for them. Here I examine the upper tail of flood peaks over China based on a comprehensive flood dataset that integrates systematic observations from 1759 stream gaging stations and 14,779 historical flood surveys. I show that flood peak distributions over China are associated with a mixture of rainfall-generation processes. The storms responsible for the upper-tail floods (with the recurrence intervals beyond 50 years) are characterized with anomalous moisture transport and/or synoptic configurations, with respect to those responsible for annual flood peaks. Anomalous moisture transport (in terms of intensity, pathways, and durations) dictates the space-time rainfall dynamics (relative to the drainage networks) that subsequently lead to anomalous basin-scale flood response. I provide physical insights into extreme flood processes based on downscaling simulations using the Weather Research and Forecasting model driven by the 20th Century Reanalysis fields. Modeling analyses for a collective of extreme flood events highlight the role of interactions between complex terrain and large-scale environment in determining the spatial and temporal variability of extreme rainfall. My analyses contribute to improved understanding of the unprecedented flood hazards over China by establishing the nexus between atmospheric processes and basin-scale flood response. These knowledge gains can be potentially used to the upper tail of flood peak distributions.

How to cite: Yang, L.: Hydrometeorological processes and controls of the upper-tail floods over China, EGU General Assembly 2023, Vienna, Austria, 23–28 Apr 2023, EGU23-10453, https://doi.org/10.5194/egusphere-egu23-10453, 2023.

EGU23-10474 | ECS | Posters on site | HS7.5

A hydrological and socioeconomic risk assessment of tropical cyclone disasters by leveraging space-based Earth observations 

Gigi Pavur, Venkataraman Lakshmi, and James H Lambert

On September 28, 2022, Hurricane Ian made landfall in Florida as the 5th strongest tropical cyclone on record for the United States of America. Preliminary damage assessments conducted by the National Oceanic and Atmospheric Administration (NOAA) estimated over $50 billion USD in insured and uninsured losses from the event. The extensive environmental and socioeconomic consequences of recent hydrometeorological extremes in Florida indicate an urgent need to improve understanding of hydrological and socioeconomic vulnerability in the region to inform future investments to increase resilience to events like Hurricane Ian. This study conducts an interdisciplinary risk analysis of both hydrological and socioeconomic variables before and after Hurricane Ian to improve understanding of the region’s hydrological and socioeconomic vulnerability to hydrometeorological extremes. A variety of publicly available satellite-based remote sensing data are leveraged for the hydrological analysis, specifically precipitation data from the Integrated Multi-satellitE Retrievals for Global Precipitation Measurement (IMERG), soil moisture data from Soil Moisture Active Passive (SMAP), synthetic aperture radar data from Sentinel-1, optical imagery from Landsat 8, and Global Navigation Satellite System Reflectometry (GNSS-R) data from the Cyclone Global Navigation Satellite System (CYGNSS) are utilized. Additionally, high-resolution commercial satellite data from Planet, Maxar, and Capella are used to further identify infrastructure damages from Hurricane Ian. To support the socioeconomic risk analysis, publicly available demographic and economic data are used from the U.S. Census Bureau and State of Florida. Results from this work can be used to improve understanding of hydrological and socioeconomic risk in Florida due to hydrometeorological extremes. Additionally, this work can be used to inform priorities and strategy aimed to decrease risk and increase resilience in this region towards major tropical cyclones. 

How to cite: Pavur, G., Lakshmi, V., and Lambert, J. H.: A hydrological and socioeconomic risk assessment of tropical cyclone disasters by leveraging space-based Earth observations, EGU General Assembly 2023, Vienna, Austria, 23–28 Apr 2023, EGU23-10474, https://doi.org/10.5194/egusphere-egu23-10474, 2023.

EGU23-11439 | ECS | Posters on site | HS7.5 | Highlight

Assessing floods impacts on population displacement in Sudan 

Eleonora Panizza, Yared Abayneh Abebe, and Roberto Rudari

The frequency and intensity of floods in the Intergovernmental Authority on Development (IGAD) region in Eastern Africa have increased over the years because of climate variability and change. Sudan is one of the IGAD countries most affected by these extreme events. In August 2022, the country experienced the fourth consecutive year of major flooding, which extensively damaged buildings and impacted people’s livelihoods. Floods also cause the displacement of thousands of people every year in Sudan due to direct damage to houses and impacts on livelihoods, critical services, and infrastructure. The effects of these events on people’s lives are worsened by contextual socio-economic, political, and individual vulnerabilities. In this regard, assessing flood impacts on displacement is crucial to increase people’s resilience and risk reduction capacities.

In this poster, we present the design, execution, and results of a data collection campaign focused on a pilot area in the Khartoum State of Sudan. These data will support the next phase of research, which is an agent-based modeling (ABM) study. The aims of the broader study are to better understand the nexus between flood events and displacement patterns in the area, including flood perception, preparedness, and displacement duration, and to evaluate the impact of different risk reduction policies. The overall goal of the effort is to strengthen local resilience and capacity, and to support policymakers in identifying effective mitigation and management strategies.

Considering that there could not be a one-size-fits-all solution for different contexts, first-hand data were collected at the local level to capture specific information about the area and its population. Questionnaires were administered to a statistically significant sample of residents in the pilot area, focusing on household characteristics, their experience regarding floods and displacement, and their risk perception. Among the results, it was found that 67% of the surveyed population was displaced due to flooding at least once, most of them for a period ranging from 1 to 5 months. The main reason for the decision to move was the damage to the house, followed by flood impacting livelihood. Displacements occurred most often during the event itself, showing a lack of preparedness. Data showed that 81% of the respondents perceived that they lived in a flood-prone area, while 56% of them believed they were at high risk of being displaced due to flood events. To gain a broader understanding of flood risk reduction policies and implementation contexts, representatives of Sudanese institutions and relevant organizations were interviewed. Policy options were explored, including housing policy and Early Warning Systems.  Both questionnaires and interviews are being used to inform the construction of the ABM.

The research is therefore relevant to understand the main elements that affect displacement decisions and to support the design of strategies for mitigating the risk of involuntary mobility in the area, and for increasing people’s resilience and capacity to cope with flood events and displacement risks.

How to cite: Panizza, E., Abebe, Y. A., and Rudari, R.: Assessing floods impacts on population displacement in Sudan, EGU General Assembly 2023, Vienna, Austria, 23–28 Apr 2023, EGU23-11439, https://doi.org/10.5194/egusphere-egu23-11439, 2023.

EGU23-11966 | Orals | HS7.5

Spatially consistent flood risk assessment for Germany 

Bruno Merz, Mostafa Farrag, Xiaoxiang Guan, Björn Guse, Li Han, Heidi Kreibich, Dung Nguyen, Nivedita Sairam, Kai Schröter, and Sergiy Vorogushyn

Flood risk assessments are an important basis for risk management. For larger regions, these assessments are often based on small-scale modelling, which is subsequently compiled into a large-scale picture. However, this approach neglects spatial interactions, such as decreasing risk due to upstream dike breaches, and does not provide realistic risk statements for larger regions. This paper presents the ‘derived flood risk analysis’ as an alternative approach and its implementation for Germany. A model chain consisting of hydrological, hydraulic, and damage models simulates the occurrence of extreme runoff, inundation, and direct economic damages. This model chain is driven by a weather generator that provides spatially consistent fields of climate variables. The generation of very long (several thousand years) time series with daily resolution allows the estimation of extreme runoff and corresponding damages. The consideration of the spatial relations in all model components, from the weather generator to the damage model, is able to provide consistent large-scale risk statements. This avoids the significant overestimates typical of many large-scale flood risk assessments.

How to cite: Merz, B., Farrag, M., Guan, X., Guse, B., Han, L., Kreibich, H., Nguyen, D., Sairam, N., Schröter, K., and Vorogushyn, S.: Spatially consistent flood risk assessment for Germany, EGU General Assembly 2023, Vienna, Austria, 23–28 Apr 2023, EGU23-11966, https://doi.org/10.5194/egusphere-egu23-11966, 2023.

EGU23-12932 | ECS | Orals | HS7.5 | Highlight

Communicating the return period of extremes 

Elisa Ragno and Amir AghaKouchak

The concept of return period (recurrence interval) of extreme events is widely used in engineering practice and in the media. In engineering design and risk assessment, the concept of return period is used to determine the expected magnitude(s) of one or more extreme weather events – i.e., the expected magnitude of an event that, if occurred, might cause the failure of a structure. In the media, the concept of return period is used to communicate to the general public the severity of an event. For example, the 2021 summer flood in Northwestern Europe was reported in the news as a one-in-400-year event – an event expected on average once in 400 years. The strength of return period as a metric (in years) to describe the severity of events resides in the straightforward comparison between the average occurrence in years of an event with the average number of years a person can experience and recollect events.

Generally, the return period of a rare event and its magnitude (known as return level) is inferred from limited observations - often derived by extrapolating from a distribution function fitted to the available observations. The distribution is often greatly influenced by the length of observations. These factors make the concept of return period prone to misinterpretation as extreme events are rarely observed in existing records.

Here we provide a new perspective on the return period of extremes determined not only by its exceedance probability but also in relation to the observations used to describe the underlying distribution. Our method offers a straightforward metric, independent of the type of statistical distribution adopted, to quantify and communicate the likelihood of having observed the event of interest in the available observations, ranging from unlikely to very likely. This metric can provide a measure of confidence in the statistical inference of return periods based on the length of record used for inference. We argue that this additional information on likelihood offers important information for designers, planners, and decision-makers.

How to cite: Ragno, E. and AghaKouchak, A.: Communicating the return period of extremes, EGU General Assembly 2023, Vienna, Austria, 23–28 Apr 2023, EGU23-12932, https://doi.org/10.5194/egusphere-egu23-12932, 2023.

EGU23-14062 | Orals | HS7.5

Suitability of near-real time precipitation products for Flood Risk Forecasting 

Jose Luis Salinas Illarena, Ludovico Nicotina, Shuangcai Li, and Arno Hilberts

Accurate real and near-real time forecasting of extreme flood events has lately become more and more important for the insurance and re-insurance industry (e.g., for claims allocations, Insurance Linked Securities and Catastrophe Bonds…). Examples of such events triggering significant losses in recent years are low-pressure system Bernd (July 2021, eastern Belgium, western Germany, and north-eastern France), hurricane Ida (August-September 2021, Louisiana and Northeastern United States), or hurricane Ian (September 2022, Florida). In order to estimate overall flood risk and flood losses in near-real time, a precipitation product released with a short latency is necessary.

This study analyses the use of the near-real time precipitation products NOAA’s Climate Prediction Center (CPC) and Multi-Radar/Multi-Sensor System (MRMS) for flood forecasting, the latter having a higher spatial and temporal resolution than the former. We investigate and compare their different rainfall characteristics in terms of their ability to capture rainfall extremes, their suitability as input for hydrological/inundation models, and the effect that they have on overall economic losses for a series of selected historical events over the Conterminous United States. Finally, we include in the comparison the more stablished, long-latency dataset North American Land Data Assimilation System (NLDAS), more frequently used for event reconstruction c.a. 1 week after the event.

How to cite: Salinas Illarena, J. L., Nicotina, L., Li, S., and Hilberts, A.: Suitability of near-real time precipitation products for Flood Risk Forecasting, EGU General Assembly 2023, Vienna, Austria, 23–28 Apr 2023, EGU23-14062, https://doi.org/10.5194/egusphere-egu23-14062, 2023.

EGU23-14903 | ECS | Posters on site | HS7.5

Modelling severe hail events over Austria using the metastatistical extreme value distribution 

Marc-André Falkensteiner, Gregor Ehrensperger, Thorsten Simon, and Tobias Hell

Knowledge about extreme values of severe hail plays an important role in engineering and insurance. The estimation of return levels of severe hail events is challenging, as hail is locally rare and documentation about hail events is not available in a unified way. For instance for the state of Austria GeoSphere provides radar based probabilities of hail (POH) and maxima of expected hail size (MEHS) that only span a period from 2010 onward.

Based on this sparse data the application of classical extreme value theory, such as Block-Maxima or Peak over Threshold might be invalid. Instead we use a version of the metastatistical extreme value distribution (MEVD), which was shown to work reasonably well in the context of extreme precipitation events, even with a rather small number of available years used for the estimation in comparison to the recurrence time. More precisely we make an assumption about the underlying probability distribution of the daily maximum POH values. The parameters of the distribution are then modeled as smooth functions of the day of the year and the year of observation, thus employing the framework of generalized additive models for location, scale and shape (GAMLSS). Furthermore we add topographic information (longitude, latitude, altitude) to our model, resulting in a full spatiotemporal model across the whole domain of Austria, from which the return values of the POH, respectively MEHS are calculated.

This framework allows for the incorporation of an arbitrary number of additional covariables, as long as they are available on the same grid as the desired output. To illustrate this we use the information of daily precipitation extremes to enrich the model with additional atmospheric information.

How to cite: Falkensteiner, M.-A., Ehrensperger, G., Simon, T., and Hell, T.: Modelling severe hail events over Austria using the metastatistical extreme value distribution, EGU General Assembly 2023, Vienna, Austria, 23–28 Apr 2023, EGU23-14903, https://doi.org/10.5194/egusphere-egu23-14903, 2023.

In Indian Himalayas, many hydroelectric projects are now under construction due to the availability of a perennial water source and a natural head for hydropower generation. Hydropower plants often require significant investments, design lifetimes, and lengthy repayment. Indian Himalayan states are now developing State Action Plans on Climate Change, with policies for climate change mitigation and adaptation at the subnational level. These plans recognize GLOFs as a significant climate change-related flood to be considered for the safety of River Valley Projects. The snow-fed catchment area of these projects has many glacial lakes, and there is a high likelihood of breaching for lakes located at the glacier's snout. In general, potentially dangerous lakes are located near the end of a glacier in the lower part of the ablation area. A large mother glacier can create potentially hazardous lakes. These moraine dams could likely breach due   to   piping   or   overtopping   due   to   their porous soil content inside dam body. A sudden discharge of significant magnitude could endanger the safety of the downstream HE hydroelectric project. It is suggested, the glacial lake outburst flood (GLOF) and the design flood be simultaneously considered while assessing the spillway capacity of new hydropower projects to ensure that they are hydrologically secure.

Bajoli-Holi Hydroelectric Project, located on river Ravi in the Himachal Pradesh state of India, is studied, to analyze its spillway capacity considering both GLOF and Inflow Design flood. BIS published the guidelines for fixing spillway capacity. As per the codal provisions, the Bajoli-Holi dam qualifies for PMF as its Inflow design flood.

The hydrology of a particular basin or project undergoes certain changes due to factors such as climate change, urbanization, deforestation, soil erosion, a heavy spell of short-duration rainfall, etc. With the aid of the most recent methods, including hydrodynamic modeling and a hydro meteorological approach, the design flood and GLOF for the dam have been evaluated in this study.

There are a total of 83 glacial lakes identified and mapped in this catchment area. It is further critically analysed to find the effect of the most critical glacial lake which is glacial Lake-52 having an area of 14.5 ha at a distance of 26.5km from the project location. River cross sections spaced 400 m apart has been considered. The upper envelope of the PMF is calculated to be 15,303 cumecs, average envelope is 6247cumecs and the lower envelope value is 2551 cumecs. The combined GLOF peak attenuated after hydrodynamic channel routing at the project site and the PMF analysed, will be taken as the inflow flood for analyzing the spillway requirements for the Bajoli-Holi project. The study results can be applied to similar hydro-meteorologically similar basins of the Himalayas in India which are under the influence of glacial lake outbursts and PMF.

How to cite: Issac, I., Goel, D. N. K., and Rai, N.: Approach and methodology for estimating combined glacial lake outburst flood (GLOF) and PMF design flood for Bajoli Holi hydro-electric project in the Indian Himalayas, EGU General Assembly 2023, Vienna, Austria, 23–28 Apr 2023, EGU23-15819, https://doi.org/10.5194/egusphere-egu23-15819, 2023.

Flash droughts are generally considered a subset of seasonal drought events. In the present study, we have characterized the flash drought events based on soil moisture index (SMI) using daily ERA5 reanalysis data having a spatial resolution of 0.250 * 0.250 from 1960 till 2021. Flash drought events were identified when SMI drops below the 20th percentile within less than 3 next pentads, and it terminates when SMI goes above the 20th percentile and stays there for the next 2 pentads. Flash drought time series was prepared and the Mann-Kendall trend test was applied to investigate the evidence of the statistically significant trends. To assess the atmospheric drivers (precipitation, PET) of flash drought, standardized precipitation index (SPI), and standardized precipitation evapotranspiration index (SPEI) were calculated during the occurrence of each flash drought event at each grid pixel. For calculating SPI and SPEI, ERA5 reanalysis data of precipitation and PET (potential evapotranspiration) was used. Seasonal analysis of results showed that the flash drought frequency observed during the pre-monsoon season (March-April-May) shows considerable variation when compared to the monsoon (July-August-September) and post-monsoon (October-November-December) seasons. Results of Mann-Kendall statistics show the increasing trend of flash drought over semi-arid regions like Marathwada and Vidarbha. Both SPI and SPEI shows spatially varying similarity with the flash drought events. When observed on a seasonal scale, it is observed that SPEI shows a higher degree of similarity with flash drought events during pre-monsoon season as compared to SPI as evaporative demand is high during this period.  

How to cite: Remesan, R. and Pachore, A.: Analysis of Spatio-temporal variability and atmospheric drivers of the flash drought over Godavari river basin., EGU General Assembly 2023, Vienna, Austria, 23–28 Apr 2023, EGU23-15836, https://doi.org/10.5194/egusphere-egu23-15836, 2023.

EGU23-16630 | ECS | Orals | HS7.5

Projection of future rainfall erosivity over China under global warming 

Wenting Wang, Shuiqing Yin, Zeng He, Deliang Chen, Hao Wang, and Andreas Klik

Five CMIP6 models were selected to project changes in rainfall erosivity of China for two future periods (the near-term in 2041-2065, the long-term in 2076-2100) under SSP1-RCP2.6 and SSP5-RCP8.5 scenarios. Models’ capacity in estimating two erosivity indices, annual average rainfall erosivity (R-factor) and the storm erosivity at 10-year return level (10-year storm EI) were evaluated by comparing the model derived indices for the historical period with the state-of-the-art reference erosivity maps of China interpolated with hourly observations. Results show that GFDL-ESM4, IPSL-CM6A-LR, and UKESM1-0-LL outperform the other two models with higher NSEs and better spatial correlation, especially in the water erosion regions. R-factor and 10-year storm EI estimated using MMEs (the arithmetic means of the aforementioned three models) for the historical period are generally underestimated, and the median biases are 0.80 and 0.66, respectively. Biases for each grid were determined as the bias-correction factors for future erosivity projection. Generally, most areas in eastern and central China are expected to experience larger rainfall erosivity. Under SSP1-RCP2.6 and SSP5-RCP8.5 scenarios, R-factor over mainland China is projected to increase by 18.9% and 19.8% for the near-term and 26.0% and 46.5% for the long-term, respectively; and 10-year storm EI is projected to increase by 14.2% and 17.4% for the near-term, and 14.9% and 45.0% for the long-term, respectively. The projected increases in rainfall erosivity are mainly due to the increasing probability of extreme precipitation. This implies that soil and water conservation measures in China need to be further strengthened to meet the challenges brought by the increasing number and magnitude of extreme events in the context of global warming.

How to cite: Wang, W., Yin, S., He, Z., Chen, D., Wang, H., and Klik, A.: Projection of future rainfall erosivity over China under global warming, EGU General Assembly 2023, Vienna, Austria, 23–28 Apr 2023, EGU23-16630, https://doi.org/10.5194/egusphere-egu23-16630, 2023.

EGU23-16753 | Orals | HS7.5

Dry and wet climatic change and its driving factors in China 

Jie Tang, Wenting Wang, and Yun Xie

Evaluating the characteristics of long-term dry and wet climate changes under the background of global climate change is important for regional water resources security, ecosystem security and socio-economic development. Based on the daily meteorological data of 1680 meteorological stations in China from 1971 to 2019, the reference evapotranspiration (ET0) was estimated with the FAO-56 Penman–Monteith equation. Based on which, the temporal and spatial variations of humidity index (HI), precipitation (P), reference evapotranspiration (ET0) and the driving factors of which were further analyzed. Results showed that HI significantly increased in the northwest China of arid area, the northeast China of subhumid area and the Huang-Huai region of humid area, while it significantly decreased in the southwest and southeast China of humid areas. The change of HI can be mainly attributed to the change of ET0 while no significant trends has been detected for P for most regions of China. During the past 50 years, the increasing rate of ET0 was 3.76 mm/10a. But the temporal variation of ET0 are different from regions, and the increasing and decreasing area were mainly dominated by climate different factors. For region of Huang-huai and northern Northeast China, ET0 showed significant downward trend. Among factors that relating to ET0, wind speed contributes most to the significant decrease of ET0. For all rest regions of China, ET0 showed significant upward trends, and relative humidity contribute most to the increase.


Key words: Dry and wet climatic change, humidity index, reference evapotranspiration, contribution, climatic factors.

How to cite: Tang, J., Wang, W., and Xie, Y.: Dry and wet climatic change and its driving factors in China, EGU General Assembly 2023, Vienna, Austria, 23–28 Apr 2023, EGU23-16753, https://doi.org/10.5194/egusphere-egu23-16753, 2023.

EGU23-17047 | Orals | HS7.5 | Highlight

A just map: community and fluvial science working together for flood hazard vulnerability mapping in Massachusetts 

Christine Hatch, Seda Salap-Ayca, Christian Guzman, and Eve Vogel

In the Northeastern U.S., the most costly damages from intense storm events were impacts to road-stream crossings.  In steep post-glacial terrain, erosion by floodwater and entrained sediment is the largest destructive force during intense storms, and the most likely driver of major morphological changes to riverbanks and channels.  Steam power analysis is a tool that can successfully quantify floodwater energy that caused damages, however, prediction of which reaches or watersheds may experience future impacts remains uncertain. Downstream, in urban areas, floodwaters increasingly occupy larger geographic extents that spill well beyond traditionally mapped flood and hazard zones. Limiting these maps are critical biases: Often more information is available for coastal and urban areas (missing steeper terrain geomorphic hazard zones), base functional assumptions (that flood risk is dominantly inundation risk from a specific depth of water, ignoring the force of moving water, sediment or erosion), their concentration around the highest-value infrastructure (lower-value and lower-density development or undeveloped areas have little or no map coverage) and how these maps are utilized for regulatory purposes (e.g. mortgage and insurance requirements). Compounding the physical destruction of flooding is the unequal distribution of these impacts on socially vulnerable populations that are least able to recover from them.  We strive to improve the co-generated mapping of social vulnerability and flood risk by (1) utilizing measures of social vulnerability with greater social and geographical insight and nuance, including self-organizing maps (SOM) that cluster overlapping metrics, (2) applying modified flood hazard maps that accurately represent fluvial geomorphic hazards, urban flooding hazards, and climate change considerations, and (3) overlapping these to understand what factors influence current maps and policy practice; what populations and places may be overlooked or under-resourced relative to vulnerability; and use this collective insight to help inform and develop improved map products and policy approaches.  Integration of this information directly with practitioners’ resources allows communities to prioritize and make land-use decisions and flood-response and preparedness decisions that are informed by the specific vulnerabilities of their populations as well as the fluvial geomorphic workings of the larger watershed, and that have powerful local implications.  Outreach and educational programs focused on social vulnerability and fluvial systems for river practitioners and politicians at all levels align communities’ attitudes about flooding and rivers can ultimately result in ecologically sound, socially just, and more flood resilient policies and practices.

How to cite: Hatch, C., Salap-Ayca, S., Guzman, C., and Vogel, E.: A just map: community and fluvial science working together for flood hazard vulnerability mapping in Massachusetts, EGU General Assembly 2023, Vienna, Austria, 23–28 Apr 2023, EGU23-17047, https://doi.org/10.5194/egusphere-egu23-17047, 2023.

The Sikkim Himalaya, similar to other mountain regions, has lost considerable ice cover over the years owing to the changing climatic factors leading to enlargement of glacier-fed lakes, and thus posing a potential threat to downstream communities in the mountain and Tarai (foothills) region in case of breach anytime in the future. The Chhombo Chhu Watershed (CCW) of the Tista Basin in the Sikkim Himalaya, located between the Greater Himalayan Range and the Tethyan Sedimentary Sequence, is the storehouse of number of glacial lakes with large areas and volumes. In this study, we mapped the glacial lakes' changes between 1975–2018 and assessed their dynamics based on manual analysis of optical satellite images using KeyHole-9 Hexagon (∼4 m), Landsat Series (∼15-30 m), and Sentinel 2A-MSI (∼10-20 m) imagery and verified during field surveys. The results show that the number of lakes has increased from 62 to 98, and its total area expanded significantly by 34.6 ± 5.4%, i.e., from 8.5 ± 0.2 km2 in 1975 to 11.4 ± 0.6 km2 by 2018, at an expansion rate of 0.8 ± 0.1% a–1. Lake outburst susceptibility result reveals that a total of twenty-seven potentially dangerous glacial lakes exist in the watershed; 5 have a status of ‘high’ outburst probability, 17 ‘medium’ and 5 ‘low’. The majority of the proglacial lakes in the watershed have significantly enlarged due to the faster melting and calving processes as a result of accelerating increasing long term average annual trend of temperature (+0.283° Ca–1; 95% confidence level) and homogeneous or slightly declining precipitation.

How to cite: De, S. K., Chowdhury, A., and Sharma, M. C.: Inventory, Classification, Evolution, and Potential Outburst Flood Assessment of Glacial Lakes in the Chhombo Chhu Watershed (Sikkim Himalaya, India), EGU General Assembly 2023, Vienna, Austria, 23–28 Apr 2023, EGU23-17459, https://doi.org/10.5194/egusphere-egu23-17459, 2023.

EGU23-1239 | ECS | Posters on site | HS7.6

Impact of urbanization and climate change on spatial patterns of precipitation 

Marika Koukoula, Herminia Torelló-Sentelles, and Nadav Peleg

More than half of the world’s population now resides in cities and the amount of urban population is expected to further increase during the coming decades. Urbanization and the associated changes in land use/land cover can have a notable impact on the climate at local and regional scales. Specifically, several studies recently concluded that urbanization can modify the temporal and spatial properties of precipitation. On top of that, global warming is expected to enhance the magnitude and frequency of short-duration heavy precipitation, with consequential effects on the severity and frequency of urban pluvial flood events. Therefore, improving our understanding of the separate and combined effects of urbanization and climate change on short-duration precipitation is imperative for flood risk assessments and planning of future cities. To this end, we investigate the impact of climate change and urbanization on the space-time properties of precipitation by conducting current and future simulation scenarios over cities with different climates using the Weather Research and Forecasting (WRF) physically-based climate model. The results of this study elucidate the important role of urban land cover on the spatial stucture of precipitation under a changing climate.

How to cite: Koukoula, M., Torelló-Sentelles, H., and Peleg, N.: Impact of urbanization and climate change on spatial patterns of precipitation, EGU General Assembly 2023, Vienna, Austria, 23–28 Apr 2023, EGU23-1239, https://doi.org/10.5194/egusphere-egu23-1239, 2023.

EGU23-1276 | ECS | Orals | HS7.6

Changing spatial patterns of convective rainfall across urban areas 

Herminia Torelló-Sentelles, Francesco Marra, and Nadav Peleg

Observations using remote sensing data reveal that urban areas affect the intensities and spatial structure of rainfall fields on small scales (i.e., at sub-hourly and sub-kilometer resolutions). However, there is currently disagreement regarding the precise pattern of change and the driving dynamic and thermodynamic forces behind it. As the hydrological response in urban areas is fast and highly sensitive to space-time rainfall variability, it is crucial to understand how urban areas change the intensity and spatial structure of rainfall to improve our abilities to nowcast rainfall and urban floods. We used high-resolution weather radar data to analyze the intensity, spatial structure, and motion of convective rainfall events that crossed several urban areas with diverse characteristics (e.g., Milan, Italy; Phoenix, US). We present an automatic methodology  (i.e., does not require an expert’s interpretation of rainfall fields) that can be applied to different urban areas worldwide. We first tracked convective rainfall events using a storm-tracking algorithm (from a Lagrangian perspective) and investigated changes to the properties of the rainfall fields (e.g., mean intensity, area, and intensity distribution profile) at varying upwind and downwind distances relative to each urban center. We also investigated changes to storms’ trajectories and to the frequency of storm initiations, terminations, splitting and merging events. We validated our results by repeating the analyses in control regions, that were adjacent to each study region and did not contain large urban areas within them. Our results show a general intensification of rainfall over cities, conserved spatial structures (instead of an expected weakening), as well as, increased storm initiations downwind of urban areas. Our findings also suggest that urban areas might be acting as barriers, by increasing storm terminations upwind of urban areas and deflecting incoming storms leftwards; possibly as a result of roughness-induced frictional turning.

How to cite: Torelló-Sentelles, H., Marra, F., and Peleg, N.: Changing spatial patterns of convective rainfall across urban areas, EGU General Assembly 2023, Vienna, Austria, 23–28 Apr 2023, EGU23-1276, https://doi.org/10.5194/egusphere-egu23-1276, 2023.

EGU23-1354 | Posters on site | HS7.6

Enhanced intensification of hourly rainfall extremes due to urban warming in Phoenix, Arizona 

Jamie Huang, Simone Fatichi, Giuseppe Mascaro, Gabriele Manoli, and Nadav Peleg

The main cause of flash and pluvial floods in cities is short-duration extreme rainfall events. The built environment can either intensify or weaken extreme rainfall intensity depending on the urban fabric that controls the local environmental and climatic conditions. From 2000 through 2018, we examined how the built area affected hourly extreme rainfall intensities in the large metropolitan area of Phoenix, Arizona, characterized by open low-rise buildings, using a large and dense rain-gauge network of 168 ground stations. We found that hourly extreme rainfall intensities increased both in the city and its surroundings but the increase in the built area was significantly greater (3 times greater) - the mean trend in annual hourly rainfall maximum in the urban area was 0.6 mm h-1 y-1 while in the rural surrounding the mean was 0.2 mm h-1 y-1. We calculated a negative trend in aerosol concentration (−0.005 AOD y−1) but a positive trend in near-surface air temperature that was considerably larger in the urban areas (0.15 °C y−1) as compared to the rural counterpart (0.09 °C y−1). Even though built surfaces and low-rise buildings contributed to an increase in air temperature, they did not affect air humidity. Generally, rainfall extremes follow the Clausius–Clapeyron relationship with an increase at a rate of 7% °C−1. Our results demonstrate that the warming effect associated with a low-rise urban area can result in increased rainfall extremes that are significantly greater than in the surrounding areas of the city.

How to cite: Huang, J., Fatichi, S., Mascaro, G., Manoli, G., and Peleg, N.: Enhanced intensification of hourly rainfall extremes due to urban warming in Phoenix, Arizona, EGU General Assembly 2023, Vienna, Austria, 23–28 Apr 2023, EGU23-1354, https://doi.org/10.5194/egusphere-egu23-1354, 2023.

EGU23-2673 | ECS | Posters on site | HS7.6

Impact of Climate Change on Non-stationary IDF Curves for Urban Areas 

Naman Kishan Rastogi, Abhinav Wadhwa, and Pradeep P. Mujumdar

High-intensity rainfall in a short duration has become the primary reason for the flooding of urban areas, and quantifying this may help to reduce the destruction caused by the floods. Continuous human interventions, change in land use land-cover and urbanization have significantly altered the climate patterns in many places of the world. Urban infrastructure, economic activity, and social well-being are greatly affected by the increase in rainfall intensity resulting in more runoff, drainage system overflow, and subsequent flooding disasters. Water infrastructure planners and designers have traditionally used Intensity-Duration-Frequency (IDF) curves as tools for urban flood assessment and management. However, IDF curves created based on the stationarity hypothesis are inaccurate and may underestimate the present or future results due to continuous changes in climatic conditions. This study investigates the non-stationary behavior of IDF curves due to climate change. It is assumed that the likelihood of quantile occurrence changes with time. An optimal solution is determined by comparing Generalized Extreme Value (GEV) parameters with a stationary GEV incorporating time, space, location, and shape as covariates. These covariates are associated with the most significant physical processes, such as urbanization, local temperature changes, and global warming, that make the time series non-stationary. In addition, for downscaling the climate change model data to station-level data, a modified K-Nearest Neighbour (KNN) approach is used, incorporating non-stationarity wherever appropriate. The method is applied to 100 Telemetric Rain Gauge (TRGs) stations that are spatially dispersed throughout the urban catchment of Bangalore city, India. According to the findings, the spatial plots for IDFs can capture the current patterns and translate them into predictions of future rainfall intensities. The return period can be shortened by more than one-tenth of its length in the estimations of future rainfall intensities. These analyses along with a comparison study with the existing and future IDFs will help raise awareness and provide potential warnings to the existing water infrastructure systems.

How to cite: Kishan Rastogi, N., Wadhwa, A., and P. Mujumdar, P.: Impact of Climate Change on Non-stationary IDF Curves for Urban Areas, EGU General Assembly 2023, Vienna, Austria, 23–28 Apr 2023, EGU23-2673, https://doi.org/10.5194/egusphere-egu23-2673, 2023.

EGU23-2704 | ECS | Posters on site | HS7.6

A bivariate rainfall frequency analysis framework in urban areas by coupling copula theory and stochastic storm transposition 

Qi Zhuang, Shuguang Liu, Zhengzheng Zhou, and Daniel Wright

Extreme rainfall is a critical “agent” driving flash floods in urban areas. In rainfall frequency analysis (RFA), however, storms are usually assumed to be uniform in space and fixed in time. Spatially and temporally uniform design storms and area reduction factors are oftentimes used in conjunction with RFA results in engineering practice for infrastructure design and planning. The consequences of such assumptions are poorly understood. This study examines how spatiotemporal rainfall heterogeneity impacts RFA, using a newly-introduced bivariate framework consisting of copula theory and stochastic storm transposition (SST). A large number of regionally-extreme storms with specific features—rainfall depth, duration, intensity, and level of intra-storm spatial organization—were collected. Rainfall intensity-duration-frequency (IDF) estimates exhibiting these bivariate features were then generated by synthesizing long records of rainfall via SST. The results show that dependencies exist among spatiotemporal storm characteristics. Bivariate frequency results exhibit smaller uncertainties but more complex physical meanings that the results from conventional methods. In particular, the highly spatially-organized storms play a leading role in frequency estimates.

How to cite: Zhuang, Q., Liu, S., Zhou, Z., and Wright, D.: A bivariate rainfall frequency analysis framework in urban areas by coupling copula theory and stochastic storm transposition, EGU General Assembly 2023, Vienna, Austria, 23–28 Apr 2023, EGU23-2704, https://doi.org/10.5194/egusphere-egu23-2704, 2023.

Stochastic rainfall modeling has been a useful tool to generate long rainfall time series for hydrological applications. One of the widely-used stochastic rainfall generators in the UK water industry to support drainage system design is the Bartlett-Lewis Rectangular Pulse model (BLRP). In practice, there are two main challenges that need to be addressed in the development of BLRP models: 1) capacity of preserving standard and extreme rainfall properties across a wide range of timescales, e.g. from sub-hourly to monthly; 2) ability to reflect the variations in the underlying climate/weather.

For the first challenge, some breakthroughs have been achieved over the past few years. Onof and Wang (2020) reformulated the original BLRP model to overcome its deficiency in underestimating rainfall extremes at sub-hourly timescales. Kim and Onof (2020) further extended Onof and Wang’s work by introducing an additional parameter to enable reproducing rainfall properties across a wide range of timescales –from sub-hourly to monthly or longer. 

The second challenge is however yet to be addressed. The concept of weather analogs is often adopted in the literature to incorporate the impact of climate dynamics. A set of atmospheric variables, which are assumed to be able to well represent the underlying weather/climate condition, are selected and associated with the co-located local rainfall properties. Cross (2020), e.g., proposed a regression method to associate the monthly temperature with the parameters of the BLRP model. However, the concept of ‘calendar month’ –a man-made period of time–  was still used in this method, which hindered the capacity of resembling the natural variations in seasons between years. To better resemble nature, Dai (2021) proposed a moving-window approach Dynamic Time Warping (DTW) method. Dai’s method sliced the original rainfall time series with a 30-day width and 10-day step moving window to reduce the impact of artificial separation of seasons. In addition, the DTW was employed to provide a more robust metric than the eulerian distance for quantifying the similarity between any two climate conditions. Dai’s work suggests that an unconventional metric may be required to better identify weather/climate analogs. 

Hoffmann and Lessig (2022) proposed a deep-learning method, called AtmoDist, that transforms the original atmospheric variables into a number of high-dimensional features and computes the distance from the extracted features. The result showed that the AtmoDist outperforms the traditional distance in identifying weather analogs. In this research, we extend the moving-window DTW based analog method proposed in Dai (2021) by replacing the DTW with the AtmoDist. Similarly to Dai (2021), selected atmospheric variables from the ERA5 hourly data on pressure levels are used for model training and validation. The local rainfall properties derived from the periods of the identified weather analogs resulting from the AtmoDist and the DTW methods will be first compared to evaluate their ability to identify weather analogs. Then, the derived local rainfall properties will be used as input to the BLRP model. This will enable the quantification of the impact of large-scale atmospheric variations to the local rainfall properties. 

How to cite: Chen, P.-C. and Wang, L.-P.: Modeling rainfall with a Bartlett–Lewis process: incorporating climate co-variate using a deep learning method, EGU General Assembly 2023, Vienna, Austria, 23–28 Apr 2023, EGU23-3733, https://doi.org/10.5194/egusphere-egu23-3733, 2023.

EGU23-5619 | Posters on site | HS7.6

How to consistently adapt soil parameters to express urban growth in physically based precipitation modeling ? 

Etienne Leblois, Silvia-Patricia Salas Aguilar, Sandrine Anquetin, and Enrique Gonzalez Sosa

Atmospheric limited-area models are superb tools built by atmospheric scientists, and can also be used by scientists from other disciplines. As hydrologists interested in urban rainfall hazard, we want to study possible changes in local-scale precipitation intensities and patterns under urban growth scenarios.

Unfortunately, the parameterization of ground properties appears scattered in many datasets. These differ by their spatial resolution, computational type (exclusive categories expressed as integers, categories expressed as percentages in the patchwork/tile approach, continuous parameters as real numbers, month-dependent real numbers), and of course by their semantic (land use/land cover, radiative properties such as LAI according to one or another sensor, orography, soil type according to one or another research institute).

From the above, the basic way to deal with expected land use changes in impact simulation changes would involve reading the scientific literature exhaustively - literally: to the point of exhaustion - to establish which parameter must be changed, and to hope that no inconsistencies will be introduced in the individual values or in their interdependence.

We propose another, easier, and above all safer strategy. The first step is to recognize the "ground properties" are not a list of individual parameters, but a compound object where many parameters are related in a hierarchy of aspects  : parameters related to land use, parameters related to orography, etc. The determination of this hierarchy is quite easy using multivariate statistics, individuals being locations sampled in the domain of interest and data being the parameters values at these locations. This approach helps to establish the list of parameters connected to the intended change.

Armed with this list, a "geographic cut-and-paste" strategy can be safely adopted to express intended land use change: the relevant parameter values of a representative (donor) location will be used at the target (modified) location, while leaving all other local parameters untouched.

We illustrate this approach with the specific case of prescribing variable levels of urban development for the city of Querétaro, Mexico, in the technical context of using WRF's UEMS distribution (89 datasets distributed as 25633 files distributed in 219 directories).

How to cite: Leblois, E., Salas Aguilar, S.-P., Anquetin, S., and Gonzalez Sosa, E.: How to consistently adapt soil parameters to express urban growth in physically based precipitation modeling ?, EGU General Assembly 2023, Vienna, Austria, 23–28 Apr 2023, EGU23-5619, https://doi.org/10.5194/egusphere-egu23-5619, 2023.

Urban flooding is a critical disaster resulting in the malfunction of the city and the loss of properties. Furthermore, urban flood prediction often requires a combined modeling process due to the complicated drainage system. In this study, the water levels and relevant inundation areas were estimated by the radar rainfall estimations and the SWMM model. Regarding the radar rainfall estimation, the joint relationship between reflectivity, phase (i.e, ZH, ZDR, KDP) of dual-polarization radar and ground rainfalls was explored through the copula function. The copula is a function that effectively joins marginal distribution functions to form a multivariate distribution function. Finally, the water level and inundation areas of Gangnam district were estimated using hourly mean areal precipitation (MAP) through radar rainfall estimations and the coupled 1D/2D urban hydrological model. The coupled model consists of a 1D conduit network model based SWMM (i.e., the RUNOFF and EXTRAN modules) and a 2D overland flow model, which links the surcharging flows at the manholes of the 1D sewer network model.


Acknowledgement

This work was supported by Korea Environment Industry & Technology Institute (KEITI) through the Aquatic Ecosystem Conservation Research Program, funded by the Korea Ministry of Environment(MOE). (No. 2021003030001)

How to cite: Kim, H.-J., Jung, M.-K., Cho, H., and Kwon, H.-H.: Estimation of mean areal precipitation based on dual-polarization radar using copula function and Its use for urban drainage modeling, EGU General Assembly 2023, Vienna, Austria, 23–28 Apr 2023, EGU23-6299, https://doi.org/10.5194/egusphere-egu23-6299, 2023.

EGU23-9127 | ECS | Posters on site | HS7.6

Comparitive performance of two quality control algorithms for personal weather station rainfall data in Amsterdam Metropolitan Area 

Lotte de Vos, Abbas El Hachem, Jochen Seidel, and András Bárdossy

The accurate estimation of precipitation is still one of the major challenges in hydrology. One fairly new approach to improve rainfall quantification is the use of so-called opportunistic sensors (OS), i.e. sensors that were not designed to provide high-quality rainfall data at a larger scale, but can be used for that purpose. One type of OS are personal weather stations (PWS) that are owned by private users. They typically comprise one or a set of low-cost devices that record meteorological variables such as air temperature and rainfall. The number of PWS has increased over the past years and the high number of rain gauges offers potential to improve rainfall estimates. 
OS have also raised scientific interest in the recent years. In October 2021, the EU COST Action CA 20136 “Opportunistic Precipitation Sensing Network” (OPENSENSE) was launched with the aim to bring together researchers in the field of OS and to build a global opportunistic sensing community. Furthermore, EUMETNET recently released a dataset containing data of PWS in Europe for 2020 from MetOffice WOW and Netatmo to support the development of PWS quality control tools.
Compared to traditional rain gauge networks, PWS provide data in high temporal and spatial resolution but with low quality, since they are often not installed and maintained according to professional standards. Therefore, these data require a thorough quality control (QC) and filtering before they can be used for applications such as areal precipitation estimates. Two different QC algorithms have been published by de Vos et al. (2019) and Bárdossy et al. (2021). These are available in the OPENSENSE GitHub environment (https://github.com/OpenSenseAction). 
In this study, we apply these two aforementioned QC algorithms on four 24-hour periods, containing convective or homogeneous rain events, from the same PWS dataset for the Amsterdam Metropolitan Area, and validate the outcome using a gauge-adjusted radar product as reference. The characteristics and relative performance of the QC algorithms are presented, thus providing aid for prospective users to decide which of these QC algorithms is best suited for their purpose.

References:
Bárdossy, A., Seidel, J., & El Hachem, A. (2021). The use of personal weather station observations to improve precipitation estimation and interpolation. Hydrology and Earth System Sciences, 25(2), 583-601
de Vos, L. W., Leijnse, H., Overeem, A., & Uijlenhoet, R. (2019). Quality Control for Crowdsourced Personal Weather Stations to Enable Operational Rainfall Monitoring. Geophysical Research Letters, 46(15), 8820-8829.

How to cite: de Vos, L., El Hachem, A., Seidel, J., and Bárdossy, A.: Comparitive performance of two quality control algorithms for personal weather station rainfall data in Amsterdam Metropolitan Area, EGU General Assembly 2023, Vienna, Austria, 23–28 Apr 2023, EGU23-9127, https://doi.org/10.5194/egusphere-egu23-9127, 2023.

EGU23-9498 | ECS | Posters on site | HS7.6

Effects of urban structures on spatial and temporal flood distribution 

Marlin Shlewet, Daniel Caviedes-Voullième, Karl Kästner, and Christoph Hinz

Urban pluvial flooding is a modern, growing global disaster, particularly in developing countries with inadequate infrastructure. It remains a challenge to accurately model the runoff behavior in urban areas with a complex topography and to quantify the impact of spatial urban patterns on changing urban rainfall-runoff response. The question to be addressed is how varying the urban spatial configurations can quantitatively influence the overland flow response in relation to the spatiotemporal hydrodynamic variables such as water depth, velocity, and outflow discharge. We use a 2D shallow water model to indicate the influence of changing spatial urban factors (such as the orientation of streets and buildings, and adding sidewalks) in small idealized (synthetic) urban catchments during a single pluvial flood event. The domain layout extends over a size of 267.5m*267.5m with a 3% longitude slope. We differentiate mainly between two street networks: i) the two-way main street with of 14-m width with sidewalks, and ii) side streets of 10m width (Fig.1). We then define novel spatially integrated indicators over the domain at the steady state to analyze quantitatively runoff variables in correlation with the urban features (Fig.1). Additionally, local hotspot maps were created to assess the flood-risk thresholds, such as human stability and failure of buildings. Hotspots are defined as the places with the highest flow velocity magnitudes and water depths (> 90%). The results of the modeling showed that, with respect to the flow velocities in small-scale urban catchments, the main street layout is the dominant urban factor, followed by the side street widths, which were decisively determined by the geometry of the sidewalks. The comparison with real flood risk thresholds shows that the lower part of the main road is the most sensitive to flood risk in the domain with a high-risk hazard for human stability. However, the riskiest case is not corresponding to the fastest hydrograph response. Varying the spatial urban configurations, especially the rotation of the main roads, changes the flood risk thresholds and delays runoff. On the other hand, spatially integrated indicators of the flow variables in the domain are showing low sensitivity to the spatial urban features. Our findings offer a new important perspective on the development of urban flood risk assessment, especially for rapidly urbanizing cities, and provide a better understanding of the spatiotemporal rainfall-runoff generation in a small urban catchment considering the spatial layout of the urban structures.

Fig.1 Overview of the modelling approach and evaluation of the runoff data

How to cite: Shlewet, M., Caviedes-Voullième, D., Kästner, K., and Hinz, C.: Effects of urban structures on spatial and temporal flood distribution, EGU General Assembly 2023, Vienna, Austria, 23–28 Apr 2023, EGU23-9498, https://doi.org/10.5194/egusphere-egu23-9498, 2023.

EGU23-9567 | Orals | HS7.6

Opportunistic rain sensors and flood modelling to assess the risk of failure of surface drainage in urban areas 

Luca G. Lanza, Arianna Cauteruccio, and Enrico Chinchella

High-resolution space-time measurements of rain fields in urban areas are crucial to support the assessment of the risk of failure of urban drainage systems. In this work, opportunistic rain sensors based on optical principles and mounted on board moving vehicles are tested and used as an input to a hydraulic model to assess the risk of flooding of selected urban areas. Opportunistic sensors can be joined with other innovative measurement techniques (satellite links) and traditional instruments (radars and rain gauges at the ground) to provide the best real-time estimate of the space-time rain field for selected events. Synthetic hyetographs based on the local DDF curves are also used to assess the return period of flooding scenarios.

The focus of this work is on the impact of the inlet number, positioning, and efficiency on the risk of flooding. Detailed information about the inlet characteristics, including the potential degree of clogging, were obtained from the archives of the company in charge of the street and inlet maintenance, corroborated by a dedicated survey in the study area. This allowed obtaining a complete definition of the geometric and hydraulic characteristics of the surface drainage system (inlets), connecting the runoff produced during rain events with the underground storm sewers. It is assumed here that the capacity of the storm sewers is sufficient to drive away the water conveyed through the inlets, therefore no backflow is considered.

Hydraulic modelling is performed by using the HEC-RAS 2D software code (v. 6.3.1) and inlets are simulated as pumping stations with a customised stage-discharge relationship based on the available literature studies. Results are presented in the form of maps of the water depth and velocity over the study areas, and critical regions are identified based on the observed frequency (return period) of the expected flooding.

This study aims at providing suitable information to plan priorities in the maintenance interventions (cleaning and repairing of inlets) and possible expansion of the surface drainage system. The model is applied to a case study of an urban district of the town of Genoa (Italy), to support the activities of the project RUN – “Urban Resilience: Now-casting of the risk of flooding with IoT sensors and Open Data”, funded within the ROP-ERDF (Regional Operational Programme of the European Regional Development Fund).

How to cite: Lanza, L. G., Cauteruccio, A., and Chinchella, E.: Opportunistic rain sensors and flood modelling to assess the risk of failure of surface drainage in urban areas, EGU General Assembly 2023, Vienna, Austria, 23–28 Apr 2023, EGU23-9567, https://doi.org/10.5194/egusphere-egu23-9567, 2023.

EGU23-10806 | Posters on site | HS7.6

Sensitivity Analysis of the Effect of Rainfall on Road Traffic Speed in Bangkok, Thailand 

Tsuyoshi Takano, Shinichiro Nakamura, Hiroyoshi Morita, Napaporn Piamsa-nga, and Varameth Vichiensan

Rainfall affects urban traffic flow. In rapidly urbanizing megacities in Asian countries, heavy rainfall causes roads to flood and traffic congestion to worsen due to weak drainage systems. This study statistically quantified the impact of rainfall on urban traffic speed in Bangkok, using probe vehicle data and rainfall data from 2018 to 2020. Traffic speeds are calculated based on the travel distance and travel time between districts, taking into account the detouring of flooded sections.

Results show that both the rainfall intensity at the time of driving as well as the amount of previous rainfall affect the traffic speed reduction. In particular, the impact of previous rainfall increases at times and areas where traffic is concentrated, such as during the weekday morning and evening peak hours and travel to/from the city center. The results of the analysis based on regional characteristics show that low-lying districts are more affected by the previous rainfall because the flood water tends to stay on the road surface, while districts with high vegetation index (NDVI) are less affected by the previous rainfall. In addition, the impact of previous rainfall increases with population density and the ratio of narrow streets. In Bangkok, urbanization has progressed while leaving behind a city block configuration with many narrow streets, called Soi, connecting to arterial roads. This result means that limited road space is prone to flooding, and once flooding occurs, combined with the concentration of traffic on adjacent roads, traffic congestion becomes more severe.

The results of this study showed the impact of rainfall on urban traffic in different areas and at different times of the day in the target site. Integrated improvements to the transport and drainage systems could have a greater benefit.

How to cite: Takano, T., Nakamura, S., Morita, H., Piamsa-nga, N., and Vichiensan, V.: Sensitivity Analysis of the Effect of Rainfall on Road Traffic Speed in Bangkok, Thailand, EGU General Assembly 2023, Vienna, Austria, 23–28 Apr 2023, EGU23-10806, https://doi.org/10.5194/egusphere-egu23-10806, 2023.

EGU23-11115 | ECS | Posters on site | HS7.6

Developing a SMART flood early warning system for a mountain watershed: experiences from the Lesser Himalayas 

Sudhanshu Dixit, Tahmina Yasmin, Kieran Khamis, Antony Ross, Subir Sen, Debashish Sen, Wouter Buytaert, David M. Hannah, and Sumit Sen

In the current context of climate change, urban areas in the Himalayas frequently experience flash floods. During high-intensity rainfall events in the catchments, due to hilly terrain and steep slopes, headwater streams cause flash floods and destroy life and property downstream. Increased encroachment along riverbanks and unplanned urban settlements expose financially distressed communities to the elevated risk of floods. This requires developing a reliable warning/alert system to ensure better preparedness for flood hazards and improve disaster resilience. Adequate hydrometeorological monitoring is a key element of such a system to generate knowledge on catchment/watershed characteristics as part of a broader disaster mitigation framework to reduce flood risk. 

The Bindal river in Dehradun (the capital city of Uttarakhand state in India) lies in the Doon valley on the foothills of the Himalayas, having a significant elevation difference of 450m with an area of 44.4 km2. The downstream settlements of the Bindal river experience flash floods during the monsoon season. Utilizing a SMART approach (developing shared understanding, monitoring, and awareness of the associated risks for preplanning response actions on time), this study aims to leverage and test a low-cost sensor network to provide information of hydrological variability and runoff response in the Bindal catchment. The SMART sensor network consists of 3 LiDAR river water level sensors and 4 tipping-bucket rain gauges at 15-minute intervals. The observed data showcases a substantial variability at both spatial and temporal scales within the small catchment of the Bindal river. The correlation coefficient (p value<0.05) between the rainfall observations at different stations varied from 0.82 to 0.20, with distance between their locations varying from 2.74 to 8.24km. The difference in total monthly rainfall recorded in two rain gauges 8.24 km apart in September is 187 mm. Additionally, the preliminary data suggests urban settlements in the downstream receive heavy rainfall within a short duration, while upper-catchment regions receive low-intensity rainfall for a longer duration. Future work will focus on developing a correlation between rainfall intensity and streamflow to define Intensity-Duration (ID) thresholds for early warning of flash floods. Similar systems in mountain landscapes with long-term rainfall and discharge data can contribute to establishing effective and low-cost flood warning systems for vulnerable riverine communities, particularly in developing countries.

How to cite: Dixit, S., Yasmin, T., Khamis, K., Ross, A., Sen, S., Sen, D., Buytaert, W., Hannah, D. M., and Sen, S.: Developing a SMART flood early warning system for a mountain watershed: experiences from the Lesser Himalayas, EGU General Assembly 2023, Vienna, Austria, 23–28 Apr 2023, EGU23-11115, https://doi.org/10.5194/egusphere-egu23-11115, 2023.

EGU23-12555 | ECS | Posters on site | HS7.6

The sensitivity of urban surface water flood modelling to the temporal structure of rainfall 

Molly Asher, Mark Trigg, Cathryn Birch, Steven Böing, and Roberto Villalobos-Herrera

The risk posed globally by surface water flooding to people and properties is growing due to rapid urbanisation and the intensification of rainfall due to climate change. Whilst tools to model urban flood risk have also been rapidly developing, there remains a knowledge gap around the sensitivity of urban hydraulic modelling methods to the temporal structure of rainfall. In the UK, the industry standard process considers rainfall events to always be symmetrical, and with a singular peak in intensity. Previous studies of observed UK extreme rainfall events suggests that loading of rainfall towards the start or end of events is in fact more common. In this study, the sensitivity of an urban catchment in the north of England is tested using fifteen realistic rainfall profiles derived from these observed extremes. Additionally, idealized systematic variations are made to the industry standard profile to shift the single peak towards the start or end of the event, and to split the rainfall volume over multiple peaks. We demonstrate that the positioning of the peak, as well as its magnitude, influences the severity, timing and nature of the associated flooding. The profile with the peak nearest the end of the event is associated with an 18% larger flooded area than the early peaking profile which is associated with the smallest flooded area.

How to cite: Asher, M., Trigg, M., Birch, C., Böing, S., and Villalobos-Herrera, R.: The sensitivity of urban surface water flood modelling to the temporal structure of rainfall, EGU General Assembly 2023, Vienna, Austria, 23–28 Apr 2023, EGU23-12555, https://doi.org/10.5194/egusphere-egu23-12555, 2023.

EGU23-12626 | Orals | HS7.6

Real-time Rainfall Estimation Using Binarized Rain Streak Images in Surveillance Cameras 

Jongyun Byun, Jinwook Lee, Hyeon-Joon Kim, and Changhyun Jun

Real-time monitoring and analysis of rainfall are important in reducing potential damage and losses in water-related disasters. Nowadays, IoT sensor data is being widely used in weather observation because of cost-effectiveness with high spatiotemporal resolutions. This study proposes a novel approach to estimate rainfall intensity from binarized rain streak images in surveillance cameras. Here, several background subtract algorithms are considered to extract rain streak images from raw video data recorded by surveillance cameras installed in six different points in Seoul, Korea. Various ranges of binarization threshold values are also used to calculate the number of white pixel values from rain streak images. As results, it indicates that rainfall intensity is properly estimated from binarized rain streak images with a relation equation between the number of white values and observation rainfall intensity data, which shows high dependence on the amount of illumination and recording environment characteristics (e.g. rainfall type, camera parameter, etc.).

Keywords: Rainfall Estimation, Rain Streak, CCTV, Computer Vision, Korea

Acknowledgement

This work was funded by the Korea Meteorological Administration Research and Development Program under Grant KMI2022-01910 and in part supported by the National Research Foundation of Korea(NRF) grant funded by the Korea government(MSIT) (No. NRF-2022R1A4A3032838).

How to cite: Byun, J., Lee, J., Kim, H.-J., and Jun, C.: Real-time Rainfall Estimation Using Binarized Rain Streak Images in Surveillance Cameras, EGU General Assembly 2023, Vienna, Austria, 23–28 Apr 2023, EGU23-12626, https://doi.org/10.5194/egusphere-egu23-12626, 2023.

EGU23-13977 | ECS | Orals | HS7.6

Simulating rainfall and drainage response using CON-SST-RAIN - a stochastic areal rainfall generator 

Christoffer B. Andersen, Søren Thorndahl, and Daniel B. Wright

Stochastic rainfall generators have been commonly used in the field of hydrological and hydrodynamic modeling for a long time. These generators allow for an extensive ensemble of rainfall scenarios and continuous time series that is applicable for risk assessment and response variability studies under current and future climate conditions. Most rainfall generators simulate rainfall at daily scale and at point values. Recently some generators have been developed to produce gridded rainfall products. With advancement in weather radar technology a much more detailed representation of rainfall fields is now possible. This is especially needed in the field of urban hydrology.

We developed the stochastic rainfall generator CON-SST-RAIN that is based on traditional dry/wet sequencing using Markov Chains and rainfall field generation by Stochastic Storm Transposition (SST), a time-in-space resampling method. CON-SST-RAIN was developed utilizing a 17-year long C-band radar dataset, with a spatio-temporal resolution of 500m x 500m and 10 minutes, discontinuous in time (discard of data) and Markov Chains are derived from rain gauges.

CON-SST-RAIN can recreate continuous areal time series that captures the mean annual precipitation while also retaining seasonal and inter-annual variances. Extreme rain rates are likewise preserved and comparable to rain gauge data with +40 years of record.

We test the CON-SST-RAIN on stochastically generated artificial hydrological networks to examine the importance of spatio-temporal dynamic rainfall fields. The networks are generated by a Gibbs sampling approach where the modeler can choose the extent and complexity of the generated network. Runoff from these networks is coupled with a simple detention pond model to estimate return periods for rainfall storage.

How to cite: Andersen, C. B., Thorndahl, S., and Wright, D. B.: Simulating rainfall and drainage response using CON-SST-RAIN - a stochastic areal rainfall generator, EGU General Assembly 2023, Vienna, Austria, 23–28 Apr 2023, EGU23-13977, https://doi.org/10.5194/egusphere-egu23-13977, 2023.

Flood damage is not only caused by river floods. In particular, highly sealed urban areas are repeatedly affected by flooding as a result of convective heavy precipitation, regardless of their proximity to surface waters. Floods are often very localized due to the small spatial extent of the heavy precipitation cells. However, the spatial and temporal prediction of these precipitation cells is subject to great uncertainty due to the multitude of meteorological influences. In many cases, only the affected large areas in which convective heavy precipitation events can occur are known. The spontaneous implementation of safety measures by municipalities and residents is therefore rarely effective, which has already led to high damages in the past.

Hydrodynamic numerical (HN) models for simulating runoff, water levels and water velocity for heavy precipitation events require a high spatial and temporal resolution. Therefore, computational costs for pure HN models are high, so that a novel coupling approach with a hydrological rainfall-runoff (RR) model, which computes comparatively fast, is suggested. To represent the flooding events resulting from convective heavy precipitation events in highly heterogeneous inner-city areas, surface runoff can be simulated using RR models. Overloads of the existing drainage system are also identified. Averaging of, for example, sealing values, as is the case with conventional RR modelling, is dispensed with using high-resolution area information. A particularly detailed analysis of the study area at street level is thus possible as long as the flow directions are unambiguous. Subsequent coupling of the RR-simulated runoff to an HN model represents flooding of the area away from the fixed RR model runoff pathways. Due to the model concept developed for our study, runoff is represented with high temporal and spatial resolution and very short response times in the RR model. In the case of identified flooding of a road section, the flooding is then followed up with a non-uniform and transient HN model for the respective area. The combined approach reduces the model area of the HN model, which simulates dynamic flooding into the area, to the flood critical areas. In addition, this approach increases the accuracy of hindcasts compared to observations and delivers the opportunity to assess weak spots in the drainage system of complex urban areas. Municipalities may use the knowledge to create adapted and adequate risk management approaches for heavy precipitation events and make structural adjustments to reduce the now known risks.

How to cite: Sauer, C., Nagrelli, S., and Fröhle, P.: High-resolution modelling of heavy precipitation runoff behavior in urban areas using a coupled rainfall-runoff and hydrodynamic modelling approach, EGU General Assembly 2023, Vienna, Austria, 23–28 Apr 2023, EGU23-14225, https://doi.org/10.5194/egusphere-egu23-14225, 2023.

EGU23-14790 | Orals | HS7.6

Anthropogenic intensification of life-threatening rainfall extremes: Implications for flash floods in urban areas 

Hayley Fowler, Stephen Blenkinsop, Steven Chan, Abdullah Kahraman, Haider Ali, Elizabeth Kendon, and Geert Lenderink

Short-duration (1 to 3 hour) rainfall extremes can cause serious damage to infrastructure and ecosystems and can result in loss of life through rapidly developing (flash) flooding. Short-duration rainfall extremes are intensifying with warming at a rate consistent with atmospheric moisture increase (~7%/K) that also drives intensification of longer-duration extremes (1day+). Evidence from some regions indicates stronger increases to short-duration extreme rainfall intensities related to convective cloud feedbacks but their relevance to climate change is uncertain. This intensification has likely increased the incidence of flash flooding at local scales, particularly in urban areas, and this can further compound with an increased storm spatial footprint to significantly increase total event rainfall. These findings call for urgent climate-change adaptation measures to manage increasing flood risks, including rethinking the way climate change is incorporated into flood estimation guidance.

How to cite: Fowler, H., Blenkinsop, S., Chan, S., Kahraman, A., Ali, H., Kendon, E., and Lenderink, G.: Anthropogenic intensification of life-threatening rainfall extremes: Implications for flash floods in urban areas, EGU General Assembly 2023, Vienna, Austria, 23–28 Apr 2023, EGU23-14790, https://doi.org/10.5194/egusphere-egu23-14790, 2023.

Rainfall observations with high spatio-temporal resolutions are required for a wide range of urban hydrological applications. The requirements on rainfall data are particularly high when predicting discharges in catchments with short lag times between rainfall and runoff peaks. Commercial microwave links (CMLs) can help in this regard, as they densely cover urban areas and can provide quantitative precipitation estimates (QPEs) at high temporal resolution. This study i) investigates how to reduce systematic errors in CML QPEs using rainfall and runoff observations commonly available in urban areas and ii) evaluates the potential of CML QPEs for modeling discharge and its uncertainty in a small urban catchment.

The catchment is located in a suburb of Prague (CZ), has an area of 1.3 km2 (35 % impervious surfaces) and is drained by a stormwater sewer system. Rainfall data are retrieved from 16 CMLs operated between 25 and 39 GHz, four municipal rain gauges located outside of the catchment, and three temporarily deployed rain gauges located at the border of the catchment. Discharge is measured at the outlet of the catchment. The dataset spans the period between July 2014 and October 2016 during which we observed 46 rainfall events with the average rainfall depth exceeding 2 mm. We randomly selected 23 events and used them for optimizing CML QPEs, whereas the remaining 23 events were used in the subsequent validation stage for evaluating the CML performance. CML QPEs are optimized using rainfall data observed by rain gauges at different distances from the catchment. Furthermore, we investigate how to optimize CML QPEs by comparing simulated and observed discharges. Rainfall data are propagated through the rainfall-runoff model and the simulated discharges are compared to the those observed at the outlet of the catchment. Finally, uncertainties in the simulated discharge are estimated by extending the deterministic hydrodynamic model by a stochastic error model explicitly accounting for model bias (Pastorek et al., 2022).

The results show that discharge simulations with CML QPEs outperform simulations with the rain gauges used alone and are only slightly worse than the benchmark simulations with three rain gauges located in the catchment (1 gauge per 0.5 – 1 km2). The best performance is achieved with CML QPEs optimized by the three closest municipal rain gauges (about three km from the catchment); CML QPEs optimized by the observed discharges achieve only slightly worse performance. The estimated discharge uncertainty reflects well different quality of the input rainfall data, i.e. the width of uncertainty bands increases when more distant RGs are used to optimize CML QPEs. We also show that even a single rain gauge located 8 km from the catchment, which is simply too far to be used alone for rainfall-runoff modeling, can efficiently reduce systematic errors in CML QPEs. Overall, the results show that CMLs can complement existing monitoring networks and significantly improve rainfall-runoff modeling including uncertainty estimation.

References:

Pastorek, J., Fencl, M., Bareš, V., 2022. Uncertainties in discharge predictions based on microwave link rainfall estimates in a small urban catchment. Journal of Hydrology 129051. https://doi.org/10.1016/j.jhydrol.2022.129051

How to cite: Fencl, M., Pastorek, J., and Bareš, V.: Improving discharge predictions and uncertainty estimates in a small urban catchment using commercial microwave links, EGU General Assembly 2023, Vienna, Austria, 23–28 Apr 2023, EGU23-16044, https://doi.org/10.5194/egusphere-egu23-16044, 2023.

Pluvial urban flood events are prone to cause huge damages to infrastructures and can also endanger human lives. A strategy for dealing with natural disasters like urban flood events is to build up detailed models to predict potential implications of an event. These models are commonly physically based hydrodynamic models. Using such models for gaining better understanding of historical and possible future events can be beneficial. For damage mitigation during a storm event, the computational demand of these models is, however, too high. Therefore, substitute models have been developed in recent years, which are fast enough to allow for real time prediction. We present a machine learning model for real-time urban flood prediction with spatial and temporal resolution. The model was tested with promising results for a flat urban catchment. The model is based on a combination of autoencoders and a NARX neural network structure. The spatial resolution is 6 x 6 meters and the temporal resolution is 5 minutes. During the present research we applied the model to a steep urban catchment. Database for training the model was generated with the 1D/2D bidirectional coupled hydrodynamic model Hystem Extran 2D. As input we used design storm events with return periods of up to 100 years.  

How to cite: Berkhahn, S. and Neuweiler, I.: Real-time pluvial urban flood prediction with high spatial and temporal resolution – a case study for a steep catchment., EGU General Assembly 2023, Vienna, Austria, 23–28 Apr 2023, EGU23-16652, https://doi.org/10.5194/egusphere-egu23-16652, 2023.

Rainfall is the driving force of hydrological events. In order to predict Pluvial Flooding in cities modelling approaches make use of rainfall data of various sources: radar-based observations and predictions, high-precision rain gauges (like the OTT Pluvio² types used in the Brussels monitoring network Flowbru.be). The first have the advantage of being area-covering and having predictive power, the latter providing more precise absolute and ground-based rainfall measurements but potentially lacking spatial representativity. In an urban setting , high-density rainfall measurements are important as a little shift in rainfall may lead to a significantly different hydrological response (peak flow at different location in sewer network). The main objective is to explore the potential of low-cost rain sensors as complement for extreme peak rainfall monitoring in Brussels, Belgium. Within the frame of the FloodCitiSense project (www.floodcitisense.eu) rainfall data has been collected during 2 years (2019-2021) using low-cost acoustic rain sensors, installed via citizen observatories. For the data analysis we focus mainly on convective rain storms typically occurring during summer time, which are most often very localized and challenging to measure and/or predict.

The research questions were as following: (1) What is the performance of the low-cost sensors compared to the existing high-precision rain gauges of the FLOWBRU monitoring network in network? (2) Can we improve the quantitative estimation of extreme rainfall distribution using the measurements of the low-cost sensors?

A comparative analysis, focusing on rainfall events with a return period of 10 years (T10), between a local low-cost acoustic rain sensor and a high-precision FLOWBRU rain gauge, installed at the same location (Royal Meteorological Institute) revealed a relative strong correlation between both rainfall timeseries, but a significant under estimation of cumulative rainfall during the events. A regression analysis enabled to develop a dynamic multiplier, varying in function of the rainfall intensity per 5-min timestep, improving the rainfall estimated by the low-cost sensor. Therefore the multiplier has been used to re-calibrate all low-cost measurements. In order to answer the second research question a spatial interpolation (Inverse Distance Weighted) using the cumulative rainfall per T10 event from FLOWBRU stations WITH and WITHOUT the low-cost stations has been applied. As a reference radar QPE images were used (cumulative rainfall per T10 event). Although yielding variable results, the use of the low-cost sensor data shows clearly an added value for (extreme) peak rainfall monitoring in Brussels.

How to cite: Verbeiren, B. and Lemmens, J.: Exploring the added value of low-cost sensors via citizen observatories for peak rainfall monitoring in cities (Case study: Brussels), EGU General Assembly 2023, Vienna, Austria, 23–28 Apr 2023, EGU23-16721, https://doi.org/10.5194/egusphere-egu23-16721, 2023.

EGU23-731 | ECS | Orals | HS7.7

Extreme windstorm hazard in northern Italy using non-asymptotic statistics 

Nasrin Fathollahzadeh attar, Antonio Canale, and Francesco Marra

As recently shown by the storm Vaia that hit Northeastern Italy in the fall of 2018, extreme wind represents a critical weather-related hazard in this region. Over the course of this century, changes in the frequency of extreme windstorms are expected. Obtaining an accurate understanding of wind speed distribution in present and future conditions is thus vital. Robust estimates of the probability of occurrence of extreme winds must be developed and employed to save lives and reduce economic losses. The objective of this study is to develop a novel non-asymptotic statistical method to estimate extreme wind return levels at multiple temporal scales (wind gusts, hourly, daily). Our approach is based on the identification of independent wind storms and estimation of ordinary wind speed events, the latter defined over the Veneto region using multi-year observations from 146 stations. To model the cumulative distribution function of ordinary wind speed events, different parametric distributions are compared, including mixture models specifications. By separately considering storm occurrence and conditional wind speed intensity, the proposed method could improve our understanding of wind speed extremes in the area and provides a tool for projecting future extreme wind speed return levels based on available model simulations.

How to cite: Fathollahzadeh attar, N., Canale, A., and Marra, F.: Extreme windstorm hazard in northern Italy using non-asymptotic statistics, EGU General Assembly 2023, Vienna, Austria, 23–28 Apr 2023, EGU23-731, https://doi.org/10.5194/egusphere-egu23-731, 2023.

EGU23-2313 | ECS | Orals | HS7.7

Modeling Intensity-Duration-Frequency curves for the whole range of precipitation 

Abubakar Haruna, Juliette Blanchet, and Anne-Catherine Favre

Intensity-Duration-Frequency curves are useful in water resources engineering for the planning and design of hydrological structures such as sewer lines, culverts, drains, dams, dykes.  They provide the mathematical link between the rainfall intensity, I, over a given duration, D, that is expected to be exceeded on average, once every T years (frequency). As opposed to the common use of only extreme data to build IDF curves, here, we use all the non-zero rainfall intensities, thereby making efficient use of the available information. As a parametric model, we use the Extended Generalized Pareto Distribution (EGPD) of Naveau et al. (2016)  for the non-zero intensities. We consider three commonly used approaches for building IDF curves. The first approach is based on the scale-invariance property of rainfall, the second relies on the general IDF formulation of Koutsoyiannis et al. (1998) and the last approach is purely data-driven (Overeem et al., 2008), where the linkage of parameter and duration is empirically determined from data. Using these three approaches, and some extensions around them, we build a total of 10 models for the IDF curves. We then compare them based on their in-sample performance, parsimony in parameterization, as well as their robustness and reliability in a split-sampling cross-validation framework. We consider a total of 81 stations at 10 min resolution in Switzerland.  As a result of the marked seasonality of rainfall in the study area, we adopted a seasonal-based analysis.  The results reveal that the model based on the data-driven approach is the best model. It is able to correctly model the observed intensities across duration while being reliable and robust. It is also able to reproduce the space and time variability of extreme rainfall across Switzerland. While our study focused on Switzerland, the results can be generalized everywhere, especially for locations with high-resolution data availability. To our knowledge, our work is the first to consider using the EGPD in IDF curve modeling.


References

Koutsoyiannis, D., Kozonis, D., & Manetas, A. (1998, April). A mathematic cal framework for studying rainfall intensity-duration-frequency relationships. Journal of Hydrology, 206 (1-2), 118–135. Retrieved 2021-09-06, from https://linkinghub.elsevier.com/retrieve/pii/S0022169498000973 doi: 10.1016/S0022-1694(98)00097-3

Naveau, P., Huser, R., Ribereau, P., and Hannart, A.: Modeling jointly low, moderate, and heavy rainfall intensities without a threshold selection, Water Resour. Res., 52, 2753–2769, https://doi.org/10.1002/2015WR018552, 2016.

Overeem, A., Buishand, A., & Holleman, I. (2008, January). Rainfall depth duration-frequency curves and their uncertainties. Journal of Hydrology, 348 (1-2), 124–134. Retrieved 2021-11-30, from https://linkinghubelsevier.com/retrieve/pii/S0022169407005513 doi:10.1016/j.jhydrol.2007.09.044

How to cite: Haruna, A., Blanchet, J., and Favre, A.-C.: Modeling Intensity-Duration-Frequency curves for the whole range of precipitation, EGU General Assembly 2023, Vienna, Austria, 23–28 Apr 2023, EGU23-2313, https://doi.org/10.5194/egusphere-egu23-2313, 2023.

EGU23-3257 | ECS | Posters on site | HS7.7

Large scale influence on extreme precipitation 

Felix S. Fauer and Henning W. Rust

Extreme precipitation is one of the biggest climate-change-related threats in middle Europe with flooding events leading to high death tolls and huge existential and financial losses. Evaluating how the probability of such events changes with respect to climate change can help preventing casualties and reducing impact consequences. Our analysis aims for the creation of Intensity-Duration-Frequency (IDF) curves which describe the major statistical characteristics of extreme precipitation events (return level, return period, time scale). They provide information on the probability of exceedance of certain precipitation intensities for a range of durations and can help to visualize how extreme the event for different durations is. We modeled the underlying distribution of block maxima with the Generalized Extreme Value (GEV) distribution. The scarce availability of data, a core problem when modeling extremes, can be addressed by using the available data more efficiently. Therefore, including maxima from different measurement durations is useful for (1) gathering more information from the data and (2) estimating return periods for different time scales with a consistent modeling approach. Duration-dependence is implemented directly into the parameter estimation (Koutsoyiannis et al., 1998) and enables a consistent model, i.e. without quantile-crossing.

To include large-scale information, each of the GEV parameters was modeled with a linear dependence on the large-scale variables temperature, blocking situation, humidity, year and North Atlantic oscillation (NAO), all spatially and monthly averaged. We show that the probability of extreme events increases with time, temperature and humidity over all seasons (summer, winter, whole year). The effects of blocking situation and NAO depend on the season with positive NAO leading to stronger events only in winter and blocking leading to stronger events only in summer and vice versa. A cross-validated model verification shows improvement over a reference model without large-scale information. This study is conducted on precipitation data from ~200 stations across Germany with temporal measurement resolutions from minutes to days.

How to cite: Fauer, F. S. and Rust, H. W.: Large scale influence on extreme precipitation, EGU General Assembly 2023, Vienna, Austria, 23–28 Apr 2023, EGU23-3257, https://doi.org/10.5194/egusphere-egu23-3257, 2023.

EGU23-4837 | ECS | Posters on site | HS7.7

Towards Temporal Scaling Laws for the Risk Analysis of Rare Flood Events 

Kanneganti Bhargav Kumar and Pradeep P Mujumdar

Extreme flood events are rare but catastrophic and have tremendous adverse impacts on human lives and the economy. The frequency and magnitude of such events have increased globally and are likely to worsen in the future. Traditional flood risk methods estimate the extreme quantiles based on the assumption that historical data recorded at gauge stations contain a spectrum of extreme flood magnitudes. However, the available gauge station record lengths are small for several gauge stations, and these records are less likely to capture the full range of likely flood magnitudes. Hence, it is necessary to develop methods to extrapolate better the dynamics of large and rare events from historical data containing only small but frequent fluctuations. This study aims to use the scaling relation of return intervals, which is invariant for various thresholds in long-term correlated historical records and accurately estimate the risk associated with rare events. The analysis is carried out on 212 daily streamflow series across the major river basins in peninsular India. Persistence in the streamflow series is examined by estimating the Hurst coefficient with a Detrended Fluctuation Analysis. Return level distribution parameters are then estimated using the analytic equations between parameters and the Hurst coefficient. The threshold-invariant scaling of the probability of return intervals and the ratio of return levels to mean return levels allows the formulation of hazard functions, which are, in turn, used to estimate the risk of rare events. This work provides an approach for obtaining flood event sets that may contain  a wider range of magnitudes than present in the historical data. The present study contributes towards improving the at-site frequency analysis of floods using the temporal scaling law of return levels. Simultaneous occurrence of different extremes may alter the return levels of rare events such as, for example, flooding in coastal areas caused by the compound effect of storm surge and streamflow. This work can be extended to understand the effect of long-term memory and the cross-correlation of causal factors on risk estimation of compound extremes.

How to cite: Bhargav Kumar, K. and P Mujumdar, P.: Towards Temporal Scaling Laws for the Risk Analysis of Rare Flood Events, EGU General Assembly 2023, Vienna, Austria, 23–28 Apr 2023, EGU23-4837, https://doi.org/10.5194/egusphere-egu23-4837, 2023.

EGU23-5074 | ECS | Orals | HS7.7

Comparison of data-driven methods for linking extreme precipitation events to large-scale drivers: A case study from Copenhagen, Denmark 

Nafsika Antoniadou, Hjalte Jomo Danielsen Sørup, Jonas Wied Pedersen, Ida Bülow Gregersen, Torben Schmith, and Karsten Arnbjerg-Nielsen

Extreme precipitation events can lead to severe negative consequences on society, the economy, and the environment. To mitigate related risks, it is crucial to understand their natural causes. There is a vast number of methods in the literature analyzing their connection to large-scale drivers. Recently there has been much interest in using machine learning (ML) methods instead of traditional statistical models like regression. ML methods are based on algorithms adapting and learning from data. By contrast, regression models are based on theory and assumptions and benefit from domain knowledge for model specification. Because of its adaptability, ML is claimed to offer superior predictive performance than traditional statistical modeling and better manage a greater number of potential predictors. A few studies in climate research have compared the performance between these two approaches, but their conclusions are inconsistent, and some have limitations. 

We used five predictor variables - Geopotential height at 500hPA, Convective available energy (CAPE), Total column water (TCW), Sea Surface Temperature (SST), and Surface Temperature (SAT) using ERA5, the latest reanalysis dataset from ECMWF, and data produced by the Danish Meteorological Institute. All the predictors were not used directly as inputs but were preprocessed before modeling. We trained models using logistic regression (LR) and three commonly used supervised machine learning algorithms - random forests (RF), neural networks (NNET), and support vector machines (SVM) to predict whether an extreme event occurred over Copenhagen. In the LR framework, the predictor variables were modeled using restricted cubic splines to address potential nonlinearity. The training data are highly unbalanced, so using a traditional performance metric such as accuracy (ACC) could be misleading. In light of this, we use performance metrics specialized for unbalanced datasets: the ROC (receiver operating characteristic) curve as the primary measure and the area under the precision-recall curve, the Brier score, and ACC together with the true positive rate and the false positive rate at the optimal threshold as secondary measures.

During the variable selection process, it was found that SST has the weakest relationship with extreme events, and its inclusion did not increase the model performance. Furthermore, the results showed that the LR performs similarly to more complex ML algorithms. SVM had the worst performance in all cases. While most of the top-ranked impacting predictors were nearly comparable amongst models, especially CAPE and TCW, we found discrepancies; SAT contributed to RF and NNET but not to LR.

How to cite: Antoniadou, N., Sørup, H. J. D., Pedersen, J. W., Bülow Gregersen, I., Schmith, T., and Arnbjerg-Nielsen, K.: Comparison of data-driven methods for linking extreme precipitation events to large-scale drivers: A case study from Copenhagen, Denmark, EGU General Assembly 2023, Vienna, Austria, 23–28 Apr 2023, EGU23-5074, https://doi.org/10.5194/egusphere-egu23-5074, 2023.

EGU23-5278 | Orals | HS7.7

Emergence of extreme precipitation statistics from the properties of convective cells 

Francesco Marra, Eleonora Dallan, Efrat Morin, and Moshe Armon

The statistics of extreme precipitation over a location of interest are crucial for designing hydraulic structures and mitigating extreme events impact. These statistics emerge from (i) the presence of different storm types, (ii) the different intensity of storms of a given type, (iii) the spatial variability of storms during their life-cycle, combined with (iv) the advection of storms across the domain. Explicit separation of these components could help us establish links between atmospheric dynamics (i.e., the occurrence and frequency of different types of storms) and thermodynamics (i.e., the properties of different storm types) on one side, and the emerging statistics of extremes. Here, we make a first step in this direction by focusing on a semi-arid region in the southeastern Mediterranean in which precipitation is almost solely related to convective processes, minimizing the effect of point (i).

We use very-high-resolution (60 m x 60 m, 1 min) weather radar observations to track convective cells during 11 storms that occurred over 2 years (>1200 cells). We mimic rain gauge observation of the tracked cells by sampling the rainfall fields at random locations and we alter advection by applying synthetic velocities to the Lagrangian fields of the cells. This allows us to isolate the impacts of (ii) storm intensity, and (iv) advection. Then, we generate sets of synthetic cells with analogous properties (peak intensity, area, velocity) and different profiles to examine the impact of (iii) spatial variability.

We find that the spatial sampling of convective cells occurred during the 11 storms explains most of the variability of extreme precipitation in the region. The extremes emerging from this sampling are well described by Weibull tails. Return levels estimated from the 11 storms using a non-asymptotic extreme value method are comparable to the ones derived from 25 years of rain gauge observations (error in the 100-year return levels <15%). We discuss the sensitivity of extreme return levels to changes in properties and velocities of the convective cells.

How to cite: Marra, F., Dallan, E., Morin, E., and Armon, M.: Emergence of extreme precipitation statistics from the properties of convective cells, EGU General Assembly 2023, Vienna, Austria, 23–28 Apr 2023, EGU23-5278, https://doi.org/10.5194/egusphere-egu23-5278, 2023.

Extreme precipitation is among the most devastating atmospheric phenomena, causing severe damage worldwide, and is likely to intensify in strength and occurrence in a warming climate. Quantifying the frequency of occurrence of short-duration extreme rainfall exceeding certain amounts is important for hydrologists and urban planners. In Germany, the official design storms are determined from long time series of stations measurements (KOSTRA DWD2010R). Stations, however, only represent a limited region and cannot provide information for ungauged areas. Weather radar networks represent an alternative to overcome these issues, but their time series currently span periods of up to a few decades. Therefore, estimating design precipitation from radar observations with traditional methods is prone to large uncertainties because only few extreme events are included in the statistical analyses. 
Recently, non-asymptotic approaches, such as the simplified metastatistical extreme value, proved promising in estimating design precipitation from short records of sub-daily data, such as the ones from weather radar archives. 
We will present the results obtained applying the simplified metastatistical extreme value approach to the 21-year time series of the German weather radar network, and compare them to traditional estimates from the KOSTRA DWD2010R and to estimates from station observations. Using the simplified metastatistical approach, we find a clear reduction in uncertainty of hourly to daily design precipitation with return periods of 5, 20 and 100 years. Last, we show that the simplified metastatistical approach is less sensitive to particularly extreme events (such as the July 2021 event in Western Germany) than traditional methods.

How to cite: Lengfeld, K. and Marra, F.: Improving estimations of design storms from weather radar observations using a simplified metastatistical extreme value approach, EGU General Assembly 2023, Vienna, Austria, 23–28 Apr 2023, EGU23-7371, https://doi.org/10.5194/egusphere-egu23-7371, 2023.

EGU23-7626 | Posters on site | HS7.7

Accounting for seasonality in trends of extreme precipitation 

Harald Schellander, Marc-André Falkensteiner, Gregor Ehrensperger, and Tobias Hell

For the estimation of daily precipitation extremes, the metastatistical extreme value distribution (MEVD) is known to perform superior to classical approaches like the generalized extreme value distribution, especially for small sample lengths. This is due to the fact that the MEVD incorporates all ordinary rainfall events within a block rather than only the extremes, which then emerge from repeated sampling of ordinary events. For daily rainfall extremes, the MEVD combines the Weibull distribution of ordinary daily rainfall events and the number of wet days per year as additional random variable. The MEVD provides yearly distributional parameters, which makes it already capable of analyzing temporal trends in daily precipitation extremes.

But still, the MEVD in its current formulation does not take into account the seasonal, i.e. sub-yearly character of ordinary precipitation events. This problem becomes apparent when events originating from fundamentally different precipitation regimes show very similar MEVD parameters.

In this contribution we therefore propose to explicitly model both the temporal trend and interannual seasonality of daily rainfall extremes and present an explicitly non-stationary MEVD formulation which is called temporal MEVD or TMEV. The TMEV is then used to derive historical trends of rainfall extremes in Austria. It is shown that the 50-year return level of daily rainfall in Austria has significantly increased over the last 30 years at the majority of Austrian observation sites. Furthermore the temporal change of the extreme value distribution is analyzed with respect to seasonality. 

How to cite: Schellander, H., Falkensteiner, M.-A., Ehrensperger, G., and Hell, T.: Accounting for seasonality in trends of extreme precipitation, EGU General Assembly 2023, Vienna, Austria, 23–28 Apr 2023, EGU23-7626, https://doi.org/10.5194/egusphere-egu23-7626, 2023.

EGU23-8812 | Orals | HS7.7

Modelling the Scales of Hail 

Jürgen Grieser

On average, the largest registered hailstone per year in Europe has a diameter of about 11cm. Individual hail events can cause losses exceeding one billion Euros. Therefore, the insurance industry is interested in modelling local hail risk. In fact, questions can be as specific as ‘What is the probability that this specific solar panel or roof window gets destroyed by hail within the next year?’

Meteorological modelling on the other hand describes the probability of hail on synoptic scales. Moody’s RMS developed a hierarchy of statistical models downscaling the risk from the large synoptical scale down to individual objects at risk.

I will discuss how the models are designed and calibrated to characterize local risk as well as spatial correlation on various time scales. To make the final model applicable for the insurance industry a thorough validation analysis is performed and results of this validation are shown in this presentation.

How to cite: Grieser, J.: Modelling the Scales of Hail, EGU General Assembly 2023, Vienna, Austria, 23–28 Apr 2023, EGU23-8812, https://doi.org/10.5194/egusphere-egu23-8812, 2023.

EGU23-8939 | ECS | Posters on site | HS7.7

Scale-dependent differences of areal reduction factors: from minutes to hours 

Jannick Alpers, Hannes Müller-Thomy, Patrick Nistahl, and Kai Schröter

Design rainfall is required for numerous applications in hydrology. If based on rain gauge time series, an adoption in space without further processing leads to an overestimation of spatial rainfall extreme values. Areal reduction factors (ARF) reduce point extreme values in space to achieve more realistic areal rainfall extreme values. The necessity of reduction increases with higher temporal resolution. However, the low density of most rain gauge networks hinders the estimation of representative ARF. In this study ARF are derived from 5 min rainfall time series of the high-density WegenerNet in Austria with 143 rain gauges distributed over 300 km² (~ 0.5 gauges per km²).

ARF dependency on area (up to 81 km²), rainfall duration (5 min to 6 hours), return period (1 year to 10 years), seasonality (four seasons) and altitude (260 m to 400 m) are studied. The results provide new insights into the research field, especially for the short durations. In addition to providing explicit ARF values, the main conclusions are:

  • ARF decrease with increasing areal extent considered for all durations.
  • ARF decrease with increasing temporal resolution for all return periods.
  • While ARF for hourly values (and coarser) decrease with increasing return period, the opposite is found for shorter durations.
  • ARF vary strongly between seasons, with lowest values found for spring.
  • Altitude-dependency of ARF increases with areal extent considered, whereby ARF values increase with altitude.

The resulting ARF data set is unique with its applicability for high-resolution extreme values as needed for urban hydrology. The results are assumed to be transferable to other regions with similar hydro-climatologic characteristics.

How to cite: Alpers, J., Müller-Thomy, H., Nistahl, P., and Schröter, K.: Scale-dependent differences of areal reduction factors: from minutes to hours, EGU General Assembly 2023, Vienna, Austria, 23–28 Apr 2023, EGU23-8939, https://doi.org/10.5194/egusphere-egu23-8939, 2023.

Design extreme rainfall maps are essential for the construction of many water systems and works, and are typically achieved by regionalizing extreme rainfall statistics from ground-based observations. Different methods are used for such task, where the most popular are kriging and index-based regionalization. In a previous study conducted in Germany, Shehu et al. (2022) revealed that kriging with external drift performed better than index-based regionalization in terms of accuracy (smaller error obtained from cross-validation), however it is still unclear which of the method is superior in terms of precision (wideness of prediction intervals). As the risk may be underestimated due to different sources of uncertainty, a more certain method (in terms of narrower prediction intervals) is preferable (while maintaining a good accuracy). Therefore, the objective of this study is to investigate the propagation of different uncertainty sources for both kriging and index-based regionalization and compare these two in terms of precision and accuracy.

To conduct this study, around 1200 ground-based observations at fine temporal scales (5min) from the German Weather Service (DWD) for whole Germany are employed. For each ground-based observation the annual maximum volumes at different durations (from 5mins up to 7days) are extracted, and local IDF curves are estimated according to Koutsoyiannis et al. (1998). For spatial uncertainty evaluation in the kriging system sequential Gaussian simulation (sGs) together will local sample bootstrapping are employed as shown in Shehu and Haberlandt (2022). On the other hand, the uncertainty in index-based regionalization is evaluated based on a combination of regional sample bootstrapping and spatial simulations of the index. The precision of IDF curves from both methods in terms of 95% confidence interval width is compared on a cross-validation procedure at the locations with more than 40 years of observation.

 The results of this study reveal how the uncertainty of annual rainfall extremes propagates from local estimation to the regionalization of IDF curves based on kriging and index-based regionalization. The comparison of the uncertainty in terms of precision sheds light on which method can produce narrower prediction intervals and hence is more precise in regionalizing IDF curves. Additionally, the accuracy of both methods is advised in order to discuss the advantages and disadvantages of each method for generating spatial IDF curves.

References: 

Koutsoyiannis, D., Kozonis, D. and Manetas, A.: A mathematical framework for studying rainfall intensity-duration-frequency relationships, J. Hydrol., 206(1–2), 118–135, doi:10.1016/S0022-1694(98)00097-3, 1998.

Shehu, B., Willems, W., Stockel, H., Thiele, L., and Haberlandt, U.: Regionalisation of Rainfall Depth-Duration-Frequency curves in Germany, Hydrol. Earth Syst. Sci. Discuss. [preprint], https://doi.org/10.5194/hess-2022-118, in review, 2022.

Shehu, B. and Haberlandt, U.: Uncertainty estimation of regionalised depth–duration–frequency curves in Germany, Hydrol. Earth Syst. Sci. Discuss. [preprint], https://doi.org/10.5194/hess-2022-254, in review, 2022.

How to cite: Shehu, B. and Haberlandt, U.: Comparing uncertainty propagation of different methods for regionalized IDF curves in Germany, EGU General Assembly 2023, Vienna, Austria, 23–28 Apr 2023, EGU23-11147, https://doi.org/10.5194/egusphere-egu23-11147, 2023.

EGU23-11933 | Orals | HS7.7

North Atlantic hurricane activity in a warmer climate: implications for property catastrophe reinsurance 

Francesco Comola, Siti Dawson, Michael Stahel, Hilary Paul, Bernhard Märtl, and Pascal Koller

North Atlantic hurricanes are one of the weather-related perils that most severely impact insured properties along the US East Coast, and thus represent a key exposure for most reinsurance and insurance-linked security (ILS) portfolios. The hurricane models traditionally used to quantify re/insurance risk account for the effect of fundamental climate circulation features, such as the El Niño Southern Oscillation (ENSO) and the Atlantic Multidecadal Oscillation (AMO). However, the longer-term impact of global warming on hurricane-exposed reinsurance portfolios is still largely unknown. Here, we leverage recent scientific insights and historical records to explore the potential link between global warming and hurricane insured losses. Historical records suggest that the annual frequency of North Atlantic hurricanes does have a material impact on industry losses (rank correlation coefficient ~0.4). However, both models and historical trends seem to indicate no change, or even a slight decrease, in North Atlantic hurricane frequencies in a warmer climate. We also find that a potential increase in the proportion of hurricanes that reach major intensities, expected to be of the order of 10-20% according to the 2021 IPCC report, might lead to a 5-10% increase in industry losses. A similar increase in industry losses might also result from the higher hurricane precipitation rates, which are projected to increase by 11- 28% according to the 2021 IPCC report.  This suggests that the impact of global warming on hurricane insured losses may be significant, albeit not as critical as other fundamental loss drivers, such as urban development, demographic growth, as well as economic and social inflation.

How to cite: Comola, F., Dawson, S., Stahel, M., Paul, H., Märtl, B., and Koller, P.: North Atlantic hurricane activity in a warmer climate: implications for property catastrophe reinsurance, EGU General Assembly 2023, Vienna, Austria, 23–28 Apr 2023, EGU23-11933, https://doi.org/10.5194/egusphere-egu23-11933, 2023.

EGU23-12635 | ECS | Posters on site | HS7.7

Extreme value statistics of erosive rainfall events – a comparative assessment for agricultural production zones in Austria 

Nur Banu Ozcelik, Stefan Strohmeier, Cristina Vásquez, Christine Stumpp, Andreas Klik, Peter Strauß, Georg Pistotnik, Shuiqing Yin, Tomas Dostal, and Gregor Laaha

In our ACRP funded project EROS-A we aim at a comprehensive analysis of the erosive energy of rainfall, estimated soil loss, and reported damage using statistical and process-based methods. In this particular study, we evaluate the return periods of erosive rainfall events at 26 meteorological stations in Austria. The main focus is on daily cumulative rainfall and the maximum 30-min rainfall intensity (I30) as these were identified as key parameters for rainfall erosivity assessment. The extreme value series were obtained using both the Annual Maxima Series (AMS) and Peak Over Threshold (POT) approach, in order to assess which of the methods will be most accurate. The assumptions of stationarity and independence of the extreme value series were carefully checked using statistical trend and independence tests and no significant deviations were found.

Generalized extreme value (GEV) and generalized Pareto (GPD) probability distributions were fitted using L-moment and maximum likelihood procedures. The GEV distribution is suited for AMS or block maxima data, whereas the GPD is suited for the POT series. For the obtained GEV and GPD models we examined extreme events with return periods of 2, 5, 10, 25, 50, and 100 years. We found that threshold selection is crucial for the POT, with diagnostic tools (such as mean residual life plots) not being fully decisive. Finally sensitivity analysis was performed where convergence of the fitted GPD to the GEV (AMS approach) helped determining robust thresholds for the GPD. The results show that the POT approach for daily cumulative precipitation is the most accurate in 69% of the cases and the AMS approach in 8% of the cases (different return periods and stations), while they have similar performance in 23% of the cases. Similar results are obtained for I30, were the success rates are 80% for the POT, 8% for the AMS and 12% for similar performance. In the next step, we will extend frequency analysis to a regional context, in order to map extreme rainfall erosivity across main agricultural production zones in Austria.

How to cite: Ozcelik, N. B., Strohmeier, S., Vásquez, C., Stumpp, C., Klik, A., Strauß, P., Pistotnik, G., Yin, S., Dostal, T., and Laaha, G.: Extreme value statistics of erosive rainfall events – a comparative assessment for agricultural production zones in Austria, EGU General Assembly 2023, Vienna, Austria, 23–28 Apr 2023, EGU23-12635, https://doi.org/10.5194/egusphere-egu23-12635, 2023.

EGU23-13498 | Orals | HS7.7

Design Rainfall controls on Pluvial Flood Risk at different spatial and temporal scales – a U.S. case study 

Ludovico Nicotina, Edom Moges, Mohammad Sharifian, Sonja Jankowfsky, Shuangcai Li, and Arno Hilberts

As Catastrophe models tend to focus more on Fluvial Flood Risk, Pluvial Flood Risk can be sometimes underestimated or neglected. However, when high intensity and short duration events such as hurricanes Ida and Ian occur in urban and semi urban areas, failure to account for Pluvial Flood Risk is consequential. To this end, the importance of accurately estimating Pluvial Flood Risk has strengthened.

In this study, we investigate the sensitivity of Pluvial Flood Risk to design rainfall characteristics. In particular, we explored the trade-off between flood extent and flood depths for different design rainfall durations, as well as the resulting economic losses at different spatial scales covering local, catchment and county levels. The study focuses on urban and semi-urban areas, where besides rainfall duration and intensity, drainage characteristics are expected to play a significant role in Pluvial Flood Risk.

How to cite: Nicotina, L., Moges, E., Sharifian, M., Jankowfsky, S., Li, S., and Hilberts, A.: Design Rainfall controls on Pluvial Flood Risk at different spatial and temporal scales – a U.S. case study, EGU General Assembly 2023, Vienna, Austria, 23–28 Apr 2023, EGU23-13498, https://doi.org/10.5194/egusphere-egu23-13498, 2023.

EGU23-15084 | ECS | Posters virtual | HS7.7

Design Flood Estimation based on Synthetic Unit Hydrograph Method for an Indian catchment 

Rajat Lall and Sagar Chavan

Design flood estimation is necessary for the effective planning and management of various hydrologic
structures such as dams. Mostly these structures are located in remote locations where observed
streamflow data is seldom available. There is a need to develop effective strategies to predict reliable
estimates of design flood at ungauged locations. The concept of Synthetic Unit Hydrograph (e.g.,
Snyder’s method, Soil Conservation Service method, Taylor and Schwarz method, Mitchell’s method,
etc.) that considers the use of catchment descriptors related to stream network and topography in
predicting the design flood estimates at ungauged locations is being widely used. The Central Water
Commission (CWC) method was specifically developed for predicting reliable estimates of design
floods at the ungauged locations in India. In the present study, we have estimated the design flood
estimate for Swan river which is a tributary of Satluj River in India located in upper Indo-Ganga
plains. Design flood estimates are obtained corresponding to a rainfall input having return periods of
100 years. In addition, physical upper bound of precipitation i.e. probable maximum precipitation is
also considered for estimating the probable maximum flood (PMF) for the catchment. The design
flood corresponding to 100-year return period rainfall is found to be 2537 cumecs while the PMF is
observed to be about 7863 cumecs. Further, a comparative study between the CWC method-based
design flood estimate and design flood estimates based on Snyder’s method, Soil Conservation
Service method, Taylor and Schwarz method, and Mitchell’s method are performed. These estimates of
design flood can be used to plan river training works on Swan river.

How to cite: Lall, R. and Chavan, S.: Design Flood Estimation based on Synthetic Unit Hydrograph Method for an Indian catchment, EGU General Assembly 2023, Vienna, Austria, 23–28 Apr 2023, EGU23-15084, https://doi.org/10.5194/egusphere-egu23-15084, 2023.

EGU23-15212 | Posters on site | HS7.7

Lake water level modeling using a Long-Short-Term-Memory (LSTM) neural network 

Sonja Jankowfsky, Shuangcai Li, Jose Salinas, Ludovico Nicotina, and Arno Hilberts

High lake water level-induced flooding could cause catastrophic property damage and loss of life. The frequency and severity of lake flooding has been increasing in recent years, likely due to climate change . To quantify the lake flooding risk, accurate modeling of lake water level is critical. However, simulation of lake water level is a challenging problem in the field of hydrology, due to the various hydrological and morphological characteristics of river-lake systems. To solve this challenge, Moody's RMS has developed a coupled physical based – Machine Learning model, using a Long-Short-Term-Memory (LSTM) neural network which incorporates both dynamical variables and static variables . This model is tested and validated with representative lakes in the Southeastern US, and compared with other models including linear, dense, decision tree regression, random forest, and convolution neural network, which demonstrates the reliability and superiority of LSTM in lake water level modeling

How to cite: Jankowfsky, S., Li, S., Salinas, J., Nicotina, L., and Hilberts, A.: Lake water level modeling using a Long-Short-Term-Memory (LSTM) neural network, EGU General Assembly 2023, Vienna, Austria, 23–28 Apr 2023, EGU23-15212, https://doi.org/10.5194/egusphere-egu23-15212, 2023.

EGU23-16031 | Posters on site | HS7.7

Real disaster scenario of Cannes 2015 flash flood event with climate change projection for 2050 

Ravikumar Ganti, Manjusha Nadgouda, and Hani Ali

The French Riviera in the Alpes Cote d’Azur province of France has been experiencing severe flash floods in the last decade. These recurring flash floods are usually a combination of meteorological factors such as cloudbursts and orographic shifts resulting from the proximity to the sea. In addition, studies also indicate that climate change plays an important role in the recurrence of such flash floods.  The current study focuses on the reconstruction of the October 2015 event footprint and on the reprojection of the event in the 2050 future climate scenario. The event has been driven by heavy rainfall which mostly affected the cities of Cannes, Antibes, and Nice. In most of the regions more than 100 mm of rain fell in less than 2 days, with Cannes reaching 200 mm in 24 hours.  According to Merad et al. 2021 the precipitation and discharge return period relative to this event exceeds 100 years.  The SCS Curve method was used to reproduce the hydrological response of the system during the event, with observed GPM precipitation data, CORINE 2018 Land use/Land cover, and observed discharge hydrograph implemented as input forcings, parameters and boundary conditions of the model.  The final inundation for the 2015 scenario was obtained by means of hydraulic modelling in HEC-RAS 2D and the resulting footprint has been successfully validated both in terms of extent and flood depth against JBA footprint and available satellite imageries.  For the reprojection of the event in the 2050 future climate scenario, we referred to the Fifth Assessment Report of the Intergovernmental Panel on Climate Change (IPCC) and implemented an upliftment of 10% to both the precipitation and discharge.  HEC-RAS 2D unsteady state flow was run under the new forcings to generate the reprojected event footprint, which revealed a significant increase in both flood depth and extent.   Given the detailed inundation map relative to the future climate scenario, this study is particularly useful for designing flood mitigation measures in the French Riviera to protect life and property from the risk arising from similar catastrophic flash flood events. In addition, climate change associated risks represent a big concern for many industries including the insurance and re-insurance and this study can be used to estimate the risk and future losses associated to this and similar events. 


How to cite: Ganti, R., Nadgouda, M., and Ali, H.: Real disaster scenario of Cannes 2015 flash flood event with climate change projection for 2050, EGU General Assembly 2023, Vienna, Austria, 23–28 Apr 2023, EGU23-16031, https://doi.org/10.5194/egusphere-egu23-16031, 2023.

EGU23-90 | Posters on site | HS7.8

Embracing Large-sample Data to Characterize Streamflow Extremes at a Global-scale 

Sai Kiran Kuntla and Manabendra Saharia

The recurrent and destructive nature of floods causes enormous economic damage and loss of human lives, leaving people in flood-prone areas fearful and insecure. It is essential to have a thorough knowledge of the factors that contribute to it. However, most catchment characterization studies are limited to case studies or regional domains. A detailed global characterization is currently unavailable due to the limitation in the holistic dataset that it demands. This study aims to fill this gap by utilizing multiple global datasets describing physiographic explanatory variables to characterize streamflow extremes. The role of catchment features such as landcover, geomorphology, climatology, lithology, etc., on spatial patterns and temporal changes of high streamflow extremes, was investigated in detail. Moreover, the multidimensional correlations between streamflow extremes and catchment features were modeled using a Random Forest approach and integrated with an interpretable machine learning framework to find the most dominating elements in different climate classes. The interpretation reveals that climatological variables are the most influential across all climates. However, the variables and their influences fluctuate between climates. Furthermore, distinct geomorphological variables dominate throughout climatic classes (such as basin relief in warm temperate and drainage texture in arid climates). Overall, the insights of this study would play a vital role in estimating the unit peak discharge at ungauged stations based on known watershed features. In addition, these findings can also help assess the nature of extremes in future climate scenarios, consequently implicating risk management methods.

How to cite: Kuntla, S. K. and Saharia, M.: Embracing Large-sample Data to Characterize Streamflow Extremes at a Global-scale, EGU General Assembly 2023, Vienna, Austria, 23–28 Apr 2023, EGU23-90, https://doi.org/10.5194/egusphere-egu23-90, 2023.

EGU23-230 | ECS | Orals | HS7.8

The role of spatial dependence in global-scale coastal flood risk assessment 

Huazhi Li, Toon Haer, Alejandra Enríquez, and Philip Ward

Coastal flooding is among the world’s deadliest and costliest natural hazards. The impacts caused by coastal flooding can be particularly high when an event affects a large spatial area, as witnessed during Hurricane Katrina and Cyclone Xaver. Current large-scale flood risk studies assume that the probabilities of water levels during such events do not vary in space. This failure to capture flood spatial dependence can lead to large misestimates of the hazard and risk at large spatial scales, and therefore potentially misinform the risk management community. In this contribution, we assess the effects of spatial dependence on coastal flood risk estimation at the global scale. To this end, we compare the assessments using two spatial dependence scenarios: i) complete dependence and ii) modelled dependence of water level return periods. For the complete dependence scenario, we use the existing risk information calculated by the GLOFRIS global risk modelling framework. To estimate the spatially-dependent risks, we use an event-based multivariate statistical approach and consider 10,000-year extreme coastal flood events derived from the global synthetic dataset of spatially-dependent extreme sea levels. The associated spatially coherent return periods of each event are then combined with the GLOFRIS spatially-constant inundation layers to create the spatially-dependent inundation map. These hazard maps, overlaid with exposure layers and vulnerability information, are further used to assess the coastal flood impacts. The flood risk is estimated using Weibull’s plotting formula and presented in terms of expected annual population and expected annual damage. This study will improve our understanding of flood spatial dependence and will provide improved risk estimation at the global scale. Such reliable estimates could lead to improved large-scale flood risk management through better wide-area planning decisions, more accurate insurance coverage, and better emergency response. 

How to cite: Li, H., Haer, T., Enríquez, A., and Ward, P.: The role of spatial dependence in global-scale coastal flood risk assessment, EGU General Assembly 2023, Vienna, Austria, 23–28 Apr 2023, EGU23-230, https://doi.org/10.5194/egusphere-egu23-230, 2023.

EGU23-1384 | Orals | HS7.8

Estimating very rare floods at multiple sites in a large river basin with comprehensive hydrometeorological simulations 

Daniel Viviroli, Anna E. Sikorska-Senoner, Guillaume Evin, Maria Staudinger, Martina Kauzlaric, Jérémy Chardon, Anne-Catherine Favre, Benoit Hingray, Gilles Nicolet, Damien Raynaud, Jan Seibert, Rolf Weingartner, and Calvin Whealton

Rare to very rare floods (associated to return periods of 1'000–100'000 years) can cause extensive human and economic damage. Still, their estimation is limited by the comparatively short streamflow records available. Some of the limitations of commonly used estimation methods can be avoided by using continuous simulation (CS), which considers many simulated meteorological configurations and a conceptual representation of hydrological processes. CS also avoids assumptions about antecedent conditions and their spatial patterns.

We present an implementation of CS to estimate rare and very rare floods at multiple sites in a large river basin (19 locations in the Aare River basin, Switzerland; area: 17'700 km²), using exceedingly long simulations from a hydrometeorological model chain (Viviroli et al., 2022). The model chain consisted of three components: First, the multi-site stochastic weather generator GWEX provided 30 meteorological scenarios (precipitation and temperature) spanning 10'000 years each. Second, these weather generator simulations were used as input for the bucket-type hydrological model HBV, run at an hourly time step for 80 catchments covering the entire Aare River basin. Third, runoff simulations from the individual catchments were routed for a representation of the entire Aare River system using the routing system model RS Minerve, including a simplified representation of main river channels, major lakes and relevant floodplains. The final simulation outputs spanned about 300'000 years at hourly resolution and cover the Aare River outlet, critical points further upstream as well as the outlets of the hydrological catchments. The comprehensive evaluation over different temporal and spatial scales showed that the main features of the meteorological and hydrological observations were well represented. This implied that meaningful information on floods with low probability can be inferred. Although uncertainties were still considerable, the explicit consideration of important flood generating processes (snow accumulation, snowmelt, soil moisture storage) and routing (bank overflow, lake regulation, lake and floodplain retention) was a substantial advantage compared to common extrapolation of streamflow records.

The suggested approach allows for comprehensively exploring possible but unobserved spatial and temporal patterns of hydrometeorological behaviour. This is particularly valuable in a large river basin where the complex interaction of flows from individual tributaries and lake regulations are typically not well represented in the streamflow records. The framework is also suitable for estimating more common, i.e., more frequently occurring floods.

Reference

Viviroli D, Sikorska-Senoner AE, Evin G, Staudinger M, Kauzlaric M, Chardon J, Favre AC, Hingray B, Nicolet G, Raynaud D, Seibert J, Weingartner R, Whealton C, 2022. Comprehensive space-time hydrometeorological simulations for estimating very rare floods at multiple sites in a large river basin. Natural Hazards and Earth System Sciences, 22(9), 2891–2920, doi:10.5194/nhess-22-2891-2022

How to cite: Viviroli, D., Sikorska-Senoner, A. E., Evin, G., Staudinger, M., Kauzlaric, M., Chardon, J., Favre, A.-C., Hingray, B., Nicolet, G., Raynaud, D., Seibert, J., Weingartner, R., and Whealton, C.: Estimating very rare floods at multiple sites in a large river basin with comprehensive hydrometeorological simulations, EGU General Assembly 2023, Vienna, Austria, 23–28 Apr 2023, EGU23-1384, https://doi.org/10.5194/egusphere-egu23-1384, 2023.

EGU23-2129 | Posters on site | HS7.8

The Prevalence and Impact of Heavy Tails on Hydrologic Extremes and Other Statistics 

Richard Vogel, Jonathan Lamontagne, and Flannery Dolan

The prevalence of heavy tailed (HT) populations in hydrology is becoming increasingly commonplace due in part to the increasing need and use of high frequency and high-resolution data.   In addition to the impact of HT on extremes, HT populations can have a profound impact on a wide range of other hydrologic statistics and methods associated with planning,  management and design for  extremes.   We review the known impacts of HT populations on the instability and bias in a wide range of commonly used hydrologic statistics. Experiments reveal that HT distributions result in the degradation of many commonly used statistical methods including the bootstrap, probability plots, the central limit theorem, and the law of large numbers.     We document the gross instability of perhaps the best-behaved statistic of all, the sample mean (SM) when computed from HT distributions.  The SM is ubiquitous because it is a component of and related to a myriad of statistical methods, thus its unstable behavior provides a window into future challenges faced by the hydrologic community.  We outline many challenges associated with HT data, for example, upper product moments are often infinite for HT populations, yet upper L-moment always exist, so that the theory of L-moments is uniquely suited to HT distributions and data.  We introduce a magnification factor for evaluating the impact of HT distributions on the behavior of extreme quantiles

How to cite: Vogel, R., Lamontagne, J., and Dolan, F.: The Prevalence and Impact of Heavy Tails on Hydrologic Extremes and Other Statistics, EGU General Assembly 2023, Vienna, Austria, 23–28 Apr 2023, EGU23-2129, https://doi.org/10.5194/egusphere-egu23-2129, 2023.

Extreme wildfires continue to be a significant cause of human death and biodiversity destruction across the globe, with recent worrying trends in their activity (i.e., occurrence and spread) suggesting that wildfires are likely to be highly impacted by climate change. In order to facilitate appropriate risk mitigation for extreme wildfires, it is imperative to identify their main drivers and assess their spatio-temporal trends, with a view to understanding the impacts of global warming on fire activity. To this end, we analyse monthly burnt area due to wildfires using a hybrid statistical deep-learning framework that exploits extreme value theory and quantile regression. Three study regions are considered: the contiguous U.S., Mediterranean Europe and Australia.

How to cite: Richards, J. and Huser, R.: Insights into the drivers and spatio-temporal trends of extreme wildfires with statistical deep-learning, EGU General Assembly 2023, Vienna, Austria, 23–28 Apr 2023, EGU23-2332, https://doi.org/10.5194/egusphere-egu23-2332, 2023.

EGU23-2974 | ECS | Orals | HS7.8

Stochastic Generation of Snow Depth in Canada 

Hebatallah Abdelmoaty and Simon Papalexiou

Snow depth is a significant component in the hydrological cycle and global energy and water balances, contributing to climate change impacts. Weather stations with gauges for snow depth are scarce, especially in complex terrain regions, and require high accuracy for measurements. Advances in observational systems offer unconventional solutions yet are expensive. To bridge these gaps, stochastic generation methods offer a cost-effective solution to reproduce time series of hydrological variables, preserving their stochastic properties. Stochastic generation methods are well-established for total precipitation but lack snow depth generation. Here, we introduce a stochastic method to exclusively generate snow depth time series that preserve their distinct statistical properties on different time scales. We use 450 observed snow depth time series and 470 CMIP6 simulations to detect Canada's observed and physical statistical properties. The results indicate that snow depth has a light tail, and the distribution might change daily. The probability of zero snow depth shows a clear seasonal pattern. The synthetic snow depth time series can be an alternative to climate models’ outputs, offering a computationally effective solution to investigate the snow depth variability. This method advances the generation of stochastic time series of snow depth and can be applied to investigate catastrophes from snowmelt processes and avalanches that lead to severe damage and fatalities.

How to cite: Abdelmoaty, H. and Papalexiou, S.: Stochastic Generation of Snow Depth in Canada, EGU General Assembly 2023, Vienna, Austria, 23–28 Apr 2023, EGU23-2974, https://doi.org/10.5194/egusphere-egu23-2974, 2023.

EGU23-3709 | Posters on site | HS7.8

Spatial and Temporal Evolution of Drought Events Using High-Resolution SPEI and Dynamic Drought Detection Algorithm 

Jiyoung Yoo, Jiyoung Kim, Hyun-Han Kwon, and Tae-Woong Kim

Drought is one of the world's major natural disasters. In order to monitor drought and reduce drought damage through preemptive response, it is important to understand the spatiotemporal evolutionary characteristics of drought. Droughts have a three-dimensional (3-D) space-time structure, typically spanning hundreds of kilometers and lasting months to years. In this study, a high-resolution(5 km) SPEI-HR(Standardized Precipitation Evaporation Index) dataset was used, considering climatic (typical temperate continental climate) and various geographic characteristics (mountainous terrain, lowland basin, desert, grassland, etc.). In addition, all large- and small-scale drought events that evolve spatiotemporally were extracted using the dynamic drought detection technique (DDDT) algorithm. These 3D-drought properties are important information to explain the spatiotemporal evolution of drought and are characterized by drought patches in dynamic drought maps. As a result, most of the trajectories of droughts in Central Asia during the period 1981 to 2018 tended to move laterally to the east and west (ENE, E, ESE, WNW, W, WSW). In addition, droughts in Central Asia are characterized by very strong correlations between indicators of duration, severity, area, and trajectory movement distance. These Central Asian drought characteristics are interpreted as meaning that there is consistency among various drought information in determining the most severe drought event. In addition, the dynamic drought map, which includes all 3D-drought properties, has the advantage of producing high-level drought information (temporal continuity of drought events and dynamic evolution characteristics, etc.) that are not found in general drought maps through various conditional drought monitoring.

Acknowledgements: This work was supported by the National Research Foundation of Korea (No. NRF-2020R1C1C1014636) and Korea Environment Industry & Technology Institute (KEITI) (No.2022003610001) funded by the Korean government (MSIT and MOE).

How to cite: Yoo, J., Kim, J., Kwon, H.-H., and Kim, T.-W.: Spatial and Temporal Evolution of Drought Events Using High-Resolution SPEI and Dynamic Drought Detection Algorithm, EGU General Assembly 2023, Vienna, Austria, 23–28 Apr 2023, EGU23-3709, https://doi.org/10.5194/egusphere-egu23-3709, 2023.

EGU23-3851 | ECS | Posters on site | HS7.8

On the Projected Changes in the Seasonality and Magnitude of Precipitation Extremes 

Dario Treppiedi, Gabriele Villarini, Jens Bender, and Leonardo Noto

Heavy precipitation events are strongly affected by climate change and there is a high confidence that these extremes will become more frequent and more severe in the future. Moreover, potential changes in the seasonality of these events are important in terms of planning and preparation against these events. While efforts have been focused on changes in the magnitude and seasonality of extreme precipitation events, these studies have treated these two quantities separately.

In order to overcome to this limit, a different perspective is here used by modeling the seasonality and magnitude of extreme precipitation events together through circular-linear copulae. We perform analyses at the global scale and develop bivariate models for an historical dataset. The outputs provided from several global climate models from the sixth phase of the Coupled Model Intercomparison Project (CMIP6) and Shared Socioeconomic Pathways (SSPs) from 1-2.6 to 5-8.5 are then used to examine the joint projected changes in the seasonality and magnitude of extreme precipitation at the global scale.

How to cite: Treppiedi, D., Villarini, G., Bender, J., and Noto, L.: On the Projected Changes in the Seasonality and Magnitude of Precipitation Extremes, EGU General Assembly 2023, Vienna, Austria, 23–28 Apr 2023, EGU23-3851, https://doi.org/10.5194/egusphere-egu23-3851, 2023.

Spatially co-occurring floods pose a great threat to the resilience and the recovery potential of the communities. A timely forecasting of such events plays a crucial role for increasing the preparedness of public and private sectors and for limiting the associated losses. In this study we investigated the potential of dilated Convolutional Neural Networks (CNN) conditioned on a set of large-scale climatic indexes and antecedent precipitation for monthly forecast of widespread flooding severity in Germany using 63 years of streamflow observations. The severity of widespread flooding (i.e., spatially co-occurring floods) was estimated as simultaneous (within a given month) exceedance of an at-site two-year return period for streamflow peaks across 172 mesoscale catchments. The model was trained for the whole country and for the three diverse hydroclimatic regions individually to provide insights on spatial heterogeneity of model performance and drivers of flooding. Evaluation of the model skill for floods generated by different processes revealed the largest bias for events generated during dry conditions. The bias for rain-on-snow flood events was the lowest despite their higher severity indicating higher predictability of these events from large scale climatic indexes. Model-based feature attribution and independent wavelet coherence analyses both indicated considerable difference in the major drivers of widespread flooding in different regions. While the flooding in the North-Eastern region is strongly affected by the Baltic Sea (e.g., East Atlantic pattern), the North-Western region is affected more by global patterns associated with the El-Niño activity (e.g., Pacific North American pattern). In the Southern region in addition to the effect of the global patterns we also detect the effect of the Mediterranean Sea (Mediterranean Oscillation Index), while antecedent precipitation seems to play less important role in this region compared to the rest of the country. Our results indicate a considerable potential for forecasting widespread flood severity using dilated CNN especially as the length of the available time series for training increases.

How to cite: Tarasova, L., Ahrens, B., Hoff, A., and Lall, U.: Forecasting the monthly severity of widespread flooding in Germany using dilated convolutional neural networks conditioned by large-scale climatic indexes, EGU General Assembly 2023, Vienna, Austria, 23–28 Apr 2023, EGU23-4419, https://doi.org/10.5194/egusphere-egu23-4419, 2023.

EGU23-5298 | ECS | Posters on site | HS7.8

A spatial covariates model for storm surge extremes in the German Bight 

Gabriel Ditzinger, Henning Rust, Jens Möller, Tim Kruschke, Laura Schaffer, and Claudia Hinrichs

Storm surges and accompanying extreme water levels pose a major threat to coastal structures, urban and industrial areas and human life in general. In order to develop effective risk mitigation strategies, it is crucial to improve the understanding of these extreme events as well as their occurrence probabilities and quantiles, respectively.

The standard procedure to estimate extreme quantiles (return-levels) is to fit a suitable distribution to the observed extreme values on a site-by-site basis. However, this approach exhibits some disadvantages: 1) Estimates of extreme quantiles are only available at gauged locations. 2) The small amount of extreme events in tide gauge records makes these estimates highly uncertain.

We tackle both issues by pooling all available tide gauge records together through a covariates model that allows for smoothly varying distribution parameters in space. Using this approach, the model is not only able to reduce the uncertainty in quantile estimates, but also enables the interpolation of the distribution parameters at arbitrary ungauged locations, e.g. in between tide gauge locations.

Deploying our model for the German North Sea coast, we generate a probabilistic reanalysis of extreme water levels as well as associated probabilities for the period 2000 – 2019.

How to cite: Ditzinger, G., Rust, H., Möller, J., Kruschke, T., Schaffer, L., and Hinrichs, C.: A spatial covariates model for storm surge extremes in the German Bight, EGU General Assembly 2023, Vienna, Austria, 23–28 Apr 2023, EGU23-5298, https://doi.org/10.5194/egusphere-egu23-5298, 2023.

Statistical dependency measures such as Kendall’s Tau or Spearman’s Rho are frequently used to analyse the coherence between time series in environmental data analyses. Autocorrelation of the data can however result in spurious cross correlations if not accounted for. Here, we present the asymptotic distribution of the estimators of Spearman’s Rho and Kendall’s Tau, which can be used for statistical hypothesis testing of cross-correlations between autocorrelated observations. The results are derived using U-statistics under the assumption of absolutely regular (or β-mixing) processes. These comprise many short-range dependent processes, such as ARMA-, GARCH- and some copula-based models relevant in the environmental sciences. We show that while the assumption of absolute regularity is required, the specific type of model does not have to be specified for the hypothesis test. Simulations show the improved performance of the modified hypothesis test for some common stochastic models and small to moderate sample sizes under autocorrelation. The methodology is applied to observed time series of flood discharges and temperatures in Europe and yields results that are consistent with the literature on flood regime changes in Europe. While the standard test results in spurious correlations between floods and temperatures, this is not the case for the proposed test, which is more consistent with the literature on flood regime changes in Europe.

How to cite: Lun, D., Fischer, S., Viglione, A., and Blöschl, G.: Attribution of flood changes with time series in the presence of autocorrelation: Modifications for Spearman‘s Rho and Kendall‘s Tau, EGU General Assembly 2023, Vienna, Austria, 23–28 Apr 2023, EGU23-7352, https://doi.org/10.5194/egusphere-egu23-7352, 2023.

EGU23-7564 | ECS | Posters on site | HS7.8

Areal extremes from a different perspective: rainfall as 2D and 3D connected objects. 

Abbas El Hachem, Jochen Seidel, and András Bárdossy

Using the German weather radar data for the last 20 years with a high spatial and temporal resolution, the occurrence of rainfall extremes was analysed. By extracting and examining connected rainfall areas, several research questions were investigated: (1) How many extremes occur in a given area independent of their location? (2) To what extent is their occurrence in space a random and to what extent a structured process? (3) How are the connected volumes behaving in space and time? (4) How does the areal extent relate to event duration, rainfall volume, and discharge volume? The first two research questions were investigated for all of Germany, the last two by analysing rainfall and run-off data in several small and medium size headwater catchments in southern and western Germany.

The results show that the occurrence of events in space is related to their areal extent; there are regions where the frequency of occurrence of large spatially distributed events is greater than that of smaller ones. Moreover, there are interesting relationships between the spatial extent of an event, the event duration, and the event rainfall volumes. For high discharge values, not only does the rainfall intensity matter but also the event duration and spatial distribution of rainfall within a catchment. Many discharge peaks are not necessarily caused by high-intensity events (hourly or daily maxima) but by the accumulation of rainfall cells in space and time.

How to cite: El Hachem, A., Seidel, J., and Bárdossy, A.: Areal extremes from a different perspective: rainfall as 2D and 3D connected objects., EGU General Assembly 2023, Vienna, Austria, 23–28 Apr 2023, EGU23-7564, https://doi.org/10.5194/egusphere-egu23-7564, 2023.

Alaba Boluwade*

School of Climate Change & Adaptation, University of Prince Edward Island, Charlottetown, Canada; aboluwade@upei.ca; abolu2013@gmail.com

*Correspondence: aboluwade@upei.ca

Abstract

Hydrological risk assessment, such as flood protection, requires estimates of variables (e.g., precipitation) measured from several weather stations. The spatial modeling of average rainfall estimates differs from extreme precipitation analysis. This is because extremes are focused on the tail of the probability distribution and the assumption of Gaussianity may not be suitable. Extreme Value Theory (EVT) application to univariate weather variables measured at weather stations has been well documented; however, extreme precipitation at closer stations tend to show trends and dependencies (similar values). It is, therefore, crucial to quantify the dependency structure and trend surface of weather stations in space. The max-stable process has been well documented to model spatial extremes. The objective of this study is to quantify the spatial dependency and trend of an annual maxima precipitation (annual highest daily precipitation, from 1970-2020) across selected weather stations in the Northern Great Plains (i.e., Nelson Churchill River Basin (NCRB)) of North America. The annual maxima data were extracted from the Global Historical Climatology Network Daily (GHCNd) and Environment and Climate Change Canada (ECCC). NCRB covers four states and four provinces in the United States and Canada. A heterogenous rainfall pattern characterizes NCRB. This is due to enormous quantities of orographic rainfall in the west and the convective precipitation in the Prairies (which is dominated by short-duration, sporadic, extreme rain), causing millions of dollars in damages. This study uses max-stable processes to examine spatial extremes of annual maxima precipitation.

The results show that topography, time, and geographical coordinates were important covariates in reproducing the stochastic extreme precipitation field using the spatial generalized extreme value (SPEV). Takeuchi’s information criterion (TIC) shows that the SPEV model with all the covariates above superseded the one without the covariates.   The inclusion of time as a covariate further confirms the impacts of climate change on extreme precipitation in the NCRB. The fitted Extremal-t max-stable model captured the spatial dependency and equally predicted the 50-year return period levels. Furthermore, ten realizations (equal probable) were simulated from the max-stable model. The study is relevant in quantifying the spatial trend and dependency of extreme precipitation in the Northern Great Plains. The result will help as a decision-support system in climate adaptation strategies in the United States and Canada.


Keywords: extreme events; Max-Stable processes; flood protection; maxima annual rainfall; flash flood protection; Canada, United States

How to cite: Boluwade, A.: Application of Max-Stable Process Model in Estimating the Spatial Trend & Dependency of Extremes in the Northern Great Plains, EGU General Assembly 2023, Vienna, Austria, 23–28 Apr 2023, EGU23-9758, https://doi.org/10.5194/egusphere-egu23-9758, 2023.

EGU23-10538 | ECS | Orals | HS7.8

Improved data assimilation in regional frequency analysis of rainfall extremes across large and morphologically complex geographical areas 

Andrea Magnini, Michele Lombardi, Taha B. M. J. Ouarda, and Attilio Castellarin

In locations where measured timeseries are not available or not sufficiently long, reliable predictions of the rainfall depth associated with a given duration and exceedance probability may be obtained through regional frequency analysis (RFA). The scientific literature reports on a large number of different approaches to RFA of rainfall extremes, each one characterized by specific advantages and disadvantages. One of the most common drawbacks is that regional models specifically refer to a single duration or a single exceedance probability. Second, several approaches require the definition of a homogeneous region where the model is trained; this leads to higher accuracy, but also the applicability of the model is limited to those locations that are hydrologically similar to the homogeneous group used in the training. Moreover, most models require filtering the available gauged stations based on the length of the measured timeseries to perform reliable frequency analysis. These aspects lead to discard a significant amount of data, which could turn out to be detrimental to the accuracy of the regional prediction in some cases.

We set up a few alternative models aiming to investigate and discuss a different and innovative approach for RFA of rainfall extremes. We want to address three main research questions: (1) Can a single model represent the frequency of extreme rainfall events over a large, climatically, and morphologically complex geographical area? (2) Can a single RFA model handle all sub-daily  durations (i.e., from 1 to 24h)? (3) Is it possible to exploit all available annual maximum series, regardless of their length (i.e., very short ones too)? We select a large study area that is located in north-central Italy. We make use of more than 2300 Annual Maximum Series of rainfall depth for different time-aggregation intervals between 1 and 24 hours, that have been collected between 1928 and 2011 in the Italian Rainfall Extreme Dataset (I2-RED). For each gauged station, several morpho-climatic descriptors are retrieved (e.g., minimum distance to the coast, elevation of orographic barriers, aspect, terrain slope, etc.) and used as covariates for the prediction models. Our models are based on ensembles of unsupervised artificial neural networks (ANNs) and are able to predict parameters of a Gumbel distribution for any location and any duration in the 1-24 hours range based on the morphoclimatic descriptors. Through the analysis of results over 100 gauged validation stations, a profitable discussion is enabled on the potential and drawbacks of ensembles of unsupervised ANNs for regional frequency analysis of sub-daily rainfall extremes.

How to cite: Magnini, A., Lombardi, M., Ouarda, T. B. M. J., and Castellarin, A.: Improved data assimilation in regional frequency analysis of rainfall extremes across large and morphologically complex geographical areas, EGU General Assembly 2023, Vienna, Austria, 23–28 Apr 2023, EGU23-10538, https://doi.org/10.5194/egusphere-egu23-10538, 2023.

EGU23-11332 | Posters on site | HS7.8

Interpolation of design rainfall at ungauged locations exploiting the potential of convection-permitting climate models. 

Giuseppe Formetta, Francesco Marra, Eleonora Dallan, and Marco Borga

Quantifying design rainfall events at varying durations is crucial for assessing flood risk and mitigating losses and damages. Yet, in a changing climate, they are fundamental tool for a reliable design of water related infrastructures, such as flood retention reservoirs, spillways, and urban drainage systems. Usually, design rainfall is quantified where rain gauges are located, and regionalization methods are used to provide estimates in ungauged locations. During the last years, convection-permitting climate models (CPM) are receiving increasing attention because, thanks to their high spatial resolution (~3km) and ability of explicitly resolving atmospheric convection, they allow for better estimating precipitation spatial patterns and extreme rainfall at multiple durations compared to coarser models.

In this work, we combine at-site rain gauge measurements with CPM simulations, within a non-asymptotic statistical framework for the analysis of extreme rainfall. We aim at quantifying the added value of the physics-based information provided by CPM simulations for the estimation of high quantiles of rainfall in ungauged locations.     

The performance of the new regionalization approach is compared with traditional interpolation methods (i.e. interpolation of distribution function parameters) using leave- one-out cross-validation as well as considering different rain gauge densities.

Preliminary results show that the proposed methodology based on CPM simulation provides: i) similar performances compared to traditional gauge-based regionalization methods for high station density scenarios and ii) improved performances for low station density scenarios.

How to cite: Formetta, G., Marra, F., Dallan, E., and Borga, M.: Interpolation of design rainfall at ungauged locations exploiting the potential of convection-permitting climate models., EGU General Assembly 2023, Vienna, Austria, 23–28 Apr 2023, EGU23-11332, https://doi.org/10.5194/egusphere-egu23-11332, 2023.

EGU23-11828 | ECS | Posters on site | HS7.8

The Future of Extreme Event Risk Assessment: A Look at Multivariate Return Periods in More than Three Dimensions 

Diego Armando Urrea Méndez, Dina Vanesa Gómez Rave, and Manuel Del Jesus Peñil

The multivariate return period is a measure of the frequency with which simultaneous sets of variables are expected to occur in a given area. So far, most approaches to calculate the multivariate return period of various hydrological variables have used copulas in two and three dimensions. (Salvadori et al., 2011) proposed a methodology for calculating the return period based on Archimedean copulas and the Kendall measure in 2 and 3 dimensions. (Gräler et al., 2013) proposed the calculation of the trivariate return period based on Vine copulas and Kendall distribution functions to describe the characteristics of the design hydrogram, considering the annual maximum peak discharge, its volume and duration. (Tosunoglu et al., 2020) applied three-dimensional Archimedean, Elliptical and Vine copulas to study the characteristics of floods. These studies have shown that the use of copulas can improve the accuracy of the risk measure of extreme events compared to univariate approaches, that only consider one variable at a time.

One of the limitations in describing the occurrence of multivariate extreme involving more than three simultaneous variables is the complex mathematical model to be solved (highest probability density point of a hypersurface) and the high computational cost that this imposes. However, in some areas of hydrology, developing more robust analyses that consider more than three variables can further improve risk assessments. For example, considering multiple rainfall stations in a watershed may help to properly capture the spatial structure of extremes -instead of relying on other spatial distribution procedures-. This improvement can provide a more accurate measure of the return period in the design of critical infrastructure, flood prediction, risk plans, etc.

In this context, we present an application where an extreme characterization of 5 rain gauges is considered simultaneously, using vine copulas based on Kendall distribution functions. More specifically, we analyze which measures are suitable for explaining the spatial and temporal correlation of rain events in different locations within a network of stations; which families and structures of vine copulas can optimally capture the spatial dependence structure within a region; how to solve the complex mathematics that is imposed when expanding the dimensionality; what is a computationally reasonable alternative to improve the computational cost involved.; and how multivariate analysis can improve the precision of the extreme event risk measure compared to univariate approaches.

These questions are answered by applying the proposed methods to a pilot case, which is developed in a basin located in northern Spain. Multivariate modeling is becoming increasingly relevant in the field of hydrology due to its ability to model extreme stochastic events, which are key to mitigating the risk and damages caused by floods.

References

Gräler, B., Berg, M. J. van den, Vandenberghe, S., Petroselli, A., Grimaldi, S., De Baets, B. & Verhoest, N. E. C., 2013. Multivariate return periods in hydrology: a critical and practical review focusing on synthetic design hydrograph estimation. Hydrol. Earth Syst. Sci., 17(4), 1281–1296.

Salvadori, G., De Michele, C. & Durante, F., 2011. On the return period and design in a multivariate framework. Hydrol. Earth Syst. Sci., 15(11), 3293–3305.

How to cite: Urrea Méndez, D. A., Gómez Rave, D. V., and Del Jesus Peñil, M.: The Future of Extreme Event Risk Assessment: A Look at Multivariate Return Periods in More than Three Dimensions, EGU General Assembly 2023, Vienna, Austria, 23–28 Apr 2023, EGU23-11828, https://doi.org/10.5194/egusphere-egu23-11828, 2023.

EGU23-12249 | ECS | Posters on site | HS7.8

Space-time downscaling of extreme rainfall using stochastic simulations, intense runoff susceptibility modeling and remote sensing-based pluvial flood mapping 

Arnaud Cerbelaud, Etienne Leblois, Pascal Breil, Laure Roupioz, Raquel Rodriguez-Suquet, Gwendoline Blanchet, and Xavier Briottet

Accurate rainfall modeling is crucial to understand the way water is intercepted, infiltrates and flows through surfaces and rivers. In particular, it is paramount for the study of the influence of rainfall spatio-temporal distribution on basin hydrologic response and the structure of floods. Current weather radar products allow capturing the variability of rainfall extremes mainly at 1 km spatial resolution. In France, radar measurements are performed at a 5-minute time step, while gauge-based reanalysis are computed at hourly resolutions. During short-duration high-intensity precipitations, pluvial floods (PF, or flash floods) can occur outside the hydrographic network in runoff-prone areas, leading to various types of damages such as soil erosion, mud and debris flows, landslides, vegetation uprooting or sediment load deposits. Contrary to fluvial floods, PF are highly correlated to local rainfall. Depending on generic susceptibility linked to topography, soil texture and land use, specific precipitation patterns can trigger intense overland flow. Hence, after extreme weather events, precise reports on PF locations provide key information for rainfall reanalysis and downscaling at fine spatial resolution.

This work focuses on two extreme Mediterranean events (more than 300 mm of rainfall in 24 hours) that took place in the South of France between 2018 and 2020. Time series of hourly rainfall intensities from Comephore radar reanalysis data at 1 km resolution (Météo-France) are confronted to (i) maps of PF that occurred during the events and (ii) generic susceptibility maps to surface runoff. For (i), runoff-related impact maps of the events are produced using the remote sensing-based FuSVIPR algorithm (Cerbelaud et al., 2023) based on Sentinel-2 temporal change images and Pléiades satellite or airborne post event acquisitions. For (ii), the IRIP© method (Dehotin and Breil, 2011; Cerbelaud et al., 2022) is used to generate PF susceptibility maps. The model is run with the RGE Alti® 5 m DEM, the OSO French land cover dataset, and soil type susceptibility characteristics derived from both climatological information and the ESDAC database.

We primarily show that areas with higher IRIP levels are more likely to be impacted by PFs, and even more so where short-term precipitation was heavier. Additionally, rainfall intensities are negatively correlated with IRIP susceptibility scores in PF impacted areas. This corroborates that somewhat higher rainfall intensities are required for flash floods to occur in less susceptible areas. Similarly, comparatively smaller rainfall amounts can trigger PFs in locations where susceptibility is high. Then, the Comephore products are downscaled at 50 m resolution on both events using the SAMPO stochastic simulator (Leblois and Creutin, 2013). Among multiple scenarios, optimal ones are chosen based on the assumption that the negative correlation with the IRIP susceptibility levels in the affected areas should be equally or even more present in the downscaled rainfall time series. This study hence suggests an original way of selecting disaggregated extreme rainfall scenarios that are consistent with the observed consequences of intense runoff on the land surface using various tools such as a stochastic simulator, a hydrological risk mapping method and earth observation data.

How to cite: Cerbelaud, A., Leblois, E., Breil, P., Roupioz, L., Rodriguez-Suquet, R., Blanchet, G., and Briottet, X.: Space-time downscaling of extreme rainfall using stochastic simulations, intense runoff susceptibility modeling and remote sensing-based pluvial flood mapping, EGU General Assembly 2023, Vienna, Austria, 23–28 Apr 2023, EGU23-12249, https://doi.org/10.5194/egusphere-egu23-12249, 2023.

EGU23-12736 | ECS | Posters on site | HS7.8

Multivariate Probability Analysis of Compound Flooding Dynamics. 

Dina Vanessa Gomez Rave, Diego Armando Urrea Méndez, and Manuel Del Jesus Peñil

Coastal cities are increasingly prone to compound flooding events. Particularly in estuaries, interactions between both freshwater fluxes (rainfall or discharge) and coastal water levels (tide, surge, waves, or combinations thereof) can strongly modulate flood hazard. These separate but physically connected processes can often occur simultaneously (but not necessarily in extreme conditions), resulting in compound events that may eventually have significant economic, environmental and social impacts. Conventional risk assessment mainly considers univariate-flooding drivers and does not include multivariate approaches; nevertheless, ignoring compound analysis may lead to a significant misestimation of flood risk.

In this respect, the complex interactions between coastal flooding drivers imply multidimensionality, nonlinearity and nonstationarity issues, and consequently, more relevant uncertainties. Copula-based frameworks are flexible alternatives to overcome limitations of traditional univariate approaches, and can incorporate the joint boundary conditions in riverine and coastal interactions in a statistically sound way (Harrison et al., 2021; Bevacqua et al., 2019; Couasnon et al., 2018, Moftakhari et al., 2017).  However, incorporations are often limited to the bivariate joint case. Trivariate (or higher dimensional) joint distribution are scarce, due to the convoluted and computationally expensive composition (Latif & Sinonovic, 2022). Notably, a need for robust and efficient approaches that help to characterize the nature of compound hazard remains (Moftakhari et al., 2021).

This study aims to improve copula-based methodologies that can adequately estimate the compound flood probability in estuarine regions, considering more than two variables, including more sources of uncertainty into the stochastic dependence analysis, raising the degree of accuracy to risk inference. This work develops a vine copula framework for the analysis of estuarine compound flooding risk, considering interactions and dependency structures between several oceanographic, hydrological, and meteorological processes and variables (rainfall, river discharge, waves, and storm tides). We show the potential of the framework in Santoña, a strategic estuarine ecosystem in Northern Spain. In order to yield proper design events, we focus here on estimating the multivariate joint and conditional joint return periods statistics, using the best-fitted model in the assessment of the extreme regime, based on Archimedean and Elliptical copula families. We also present the complexities of determining the ensemble of compound events corresponding to a given return period and compare these ensembles to the results of univariate extreme value analysis, to remark the importance of multivariate characterization of extremes.

References

Bevacqua, E., Maraun, D., Vousdoukas, M. I., Voukouvalas, E., Vrac, M., Mentaschi, L., & Widmann, M. (2019). Higher probability of compound flooding from precipitation and storm surge in Europe under anthropogenic climate change. Science advances, 5(9), eaaw5531.

Couasnon, A., Sebastian, A., & Morales-Nápoles, O. (2018). A copula-based Bayesian network for modeling compound flood hazard from riverine and coastal interactions at the catchment scale: An application to the Houston Ship Channel, Texas. Water, 10(9), 1190.

How to cite: Gomez Rave, D. V., Urrea Méndez, D. A., and Del Jesus Peñil, M.: Multivariate Probability Analysis of Compound Flooding Dynamics., EGU General Assembly 2023, Vienna, Austria, 23–28 Apr 2023, EGU23-12736, https://doi.org/10.5194/egusphere-egu23-12736, 2023.

EGU23-13328 | ECS | Posters on site | HS7.8

Assessing daily precipitation tails over India under changing climate 

Neha Gupta and Sagar Chavan

Daily precipitation extremes are crucial in the hydrological design of major water control structures. The extremes are usually present in the upper part of the probability distribution of daily precipitation data, known as the tail. The distributions are bifurcated into heavy or light-tailed distributions depending on the tail. Heavy tails signify a higher frequency of occurrences of extreme precipitation events. Prediction of extreme precipitation depends on reliable modelling of the tail. Tail behaviour can be studied by graphical as well as threshold-based fitting approaches; however, each approach has associated shortcomings. In this work, we utilize a versatile and simple empirical index known as the “Obesity Index” (OB) to assess the tail of probability distributions of daily gridded precipitation data for India. This comprehensive regional analysis has been undertaken to quantify the tail heaviness of 4801 daily precipitation records over India for historical (1970–2019) and future (2020–2100) time periods. Future projections of daily precipitation are downscaled from the latest generation of climate models knowns as Coupled Model Intercomparison Project Phase 6 (CMIP6) under different emission scenarios. Finally, the application of the OB-based approach is extended to characterize daily precipitation in Indian Meteorological Subdivisions. Results indicate the applicability of heavy-tailed distributions in representing daily precipitation over India and establish the utility of the OB-based approach in diagnosing tail behaviour. Also, the spatial patterns of the tail heaviness are found to be matching with the Köppen–Geiger climate classification of India. The findings from this can be an input for the policymakers to develop adaptation strategies in response to the projected climate change impact.

Keywords: Extreme precipitation, Climate Change, India, Obesity index, Tail heaviness


How to cite: Gupta, N. and Chavan, S.: Assessing daily precipitation tails over India under changing climate, EGU General Assembly 2023, Vienna, Austria, 23–28 Apr 2023, EGU23-13328, https://doi.org/10.5194/egusphere-egu23-13328, 2023.

EGU23-13386 | ECS | Posters on site | HS7.8

Use of high temporal resolution data to identify the key drivers and locations where walls of water occur in the UK 

Felipe Fileni, David Archer, Hayley Fowler, Fiona McLay, Elizabeth Lewis, and Longzhi Yang

Walls of water (WoW) are a subset of flash floods characterised by an extremely fast increase in the discharge rate of rivers. In the UK, WoWs, events where an almost instantaneous increase in river flow happens, are responsible for several deaths, even when the maximum peak flow of the said event is not as noticeable. Using a national 15-minute continuous dataset, this study identified WoWs for catchments in the UK. Next, the antecedent atmospheric conditions for these WoWs were extracted from gridded datasets. Furthermore, catchment descriptors such as catchment area, elevation, slope, land use, and permeability of every catchment were downloaded from the National River Flow Archive. Finally, with the use of machine learning algorithms, that is, tree regressions and neural networks, this study identified vulnerable catchments and key conditions for WoWs to occur. Early results indicate that WoWs are not solely driven by rainfall intensity and that larger catchments (>500km) with low permeability are the most vulnerable to these hazards. Further studies using additional atmospheric conditions, i.e., temperature and windspeed will allow a better understanding of the drivers of these events.

How to cite: Fileni, F., Archer, D., Fowler, H., McLay, F., Lewis, E., and Yang, L.: Use of high temporal resolution data to identify the key drivers and locations where walls of water occur in the UK, EGU General Assembly 2023, Vienna, Austria, 23–28 Apr 2023, EGU23-13386, https://doi.org/10.5194/egusphere-egu23-13386, 2023.

EGU23-13732 | ECS | Posters on site | HS7.8

Simulation of extreme precipitation events over south-west France: the role of large-scale atmospheric circulation and atmospheric rivers 

Namendra Kumar Shahi, Olga Zolina, Sergey K. Gulev, Alexander Gavrikov, and Fatima Jomaa

South-western France has witnessed some of the most devastating extreme precipitation events that eventually lead to record-breaking severe flash flooding in the region and cause losses to human lives, urban transportation, agriculture, and infrastructure. In this study, two cases of deadly flash floods that occurred/reported in the Aude watershed in south-western France during 12-13 November 1999 and 14-15 October 2018 are studied using the WRF4.3.1 model simulations, with a particular emphasis on the model ability to capture these heavy precipitation events. We performed two simulations one with parameterized convection and one without the use of convection parameterizations for each case at gray-zone resolution (~9 km horizontal grid spacing) using the ERA5 reanalysis as the lateral boundary condition. In addition, attempts have been made to investigate the role of large-scale atmospheric circulation and atmospheric rivers in the production of these heavy precipitation events. The results from model simulations are compared quantitatively with available observations and reanalysis and found that the simulations at ~9 km gray-zone resolution capture the observed spatio-temporal distribution of precipitation characteristics during both extreme cases. The added value of gray-zone resolution simulations over driving coarse-scale ERA5 reanalysis datasets is observed in the representation of the precipitation characteristics. It has also been observed that the model simulation without the use of convection parameterization yields a reasonable and realistic representation of the precipitation characteristics during both extreme cases, and this suggests that at this “gray-zone” resolution the organized mesoscale convective systems/processes can be resolved explicitly by the model dynamics. The contribution of the large-scale atmospheric circulation and the atmospheric river (i.e., moisture transport) in the production of these flood events has also been observed.

How to cite: Shahi, N. K., Zolina, O., Gulev, S. K., Gavrikov, A., and Jomaa, F.: Simulation of extreme precipitation events over south-west France: the role of large-scale atmospheric circulation and atmospheric rivers, EGU General Assembly 2023, Vienna, Austria, 23–28 Apr 2023, EGU23-13732, https://doi.org/10.5194/egusphere-egu23-13732, 2023.

EGU23-14934 | ECS | Posters on site | HS7.8

Updating annual rainfall maxima statistics in a data-scarce region 

Angelo Avino, Luigi Cimorelli, Domenico Pianese, and Salvatore Manfreda

The growing number of extreme hydrological events observed has raised the level of attention toward the impact of climate change on rainfall process, which is difficult to quantify given its strong spatial and temporal heterogeneity. Therefore, the impact of the climate cannot be determined on the individual hydrological series but must be assessed on a regional and/or district scale. With this objective, the present work aims at identifying the trends and dynamics of extreme sub-daily rainfall in southern Italy in the period 1970-2020. The database of annual maxima was assembled using all available rainfall data (provided by the National Hydrographic and Mareographic Service - SIMN, and the Regional Civil Protection). However, due to the numerous changes (location, type of sensor, managing agencies) experienced by the national monitoring network, the time-series were found to be extremely uneven and fragmented. Since the spatio-temporal discontinuity could invalidate any statistical analysis, gap-filling techniques (deterministic and/or geostatistical [Teegavarapu, 2009]) were applied to reconstruct the missing data. In particular, the “Spatially-Constrained Ordinary Kriging” (SC-OK) method [Avino et al., 2021] was used, namely a mixed procedure that adopts the Ordinary Kriging (OK) approach with the spatial constraints of the Inverse Distance Weighting (IDW) method. The SC-OK method allows to reconstruct only missing data for stations selected by the IDW method (those with a sufficient number of functioning neighbouring rain gauges). Then, the reconstructed dataset has been used to explore trends and regional patterns in annual maxima highlighting, how rainfall are evolving in the most recent years.

REFERENCES

Avino, A., Manfreda, S., Cimorelli, L., and Pianese, D. (2021). Trend of annual maximum rainfall in Campania region (Southern Italy). Hydrological Processes, 35.

Teegavarapu, R.S.V. (2009). Estimation of Missing Precipitation Records Integrating Surface Interpolation Techniques and Spatio-temporal Association Rules. Journal of Hydroinformatics, 11(2).

How to cite: Avino, A., Cimorelli, L., Pianese, D., and Manfreda, S.: Updating annual rainfall maxima statistics in a data-scarce region, EGU General Assembly 2023, Vienna, Austria, 23–28 Apr 2023, EGU23-14934, https://doi.org/10.5194/egusphere-egu23-14934, 2023.

EGU23-15475 | Posters on site | HS7.8

A non-stationary gridded weather generator conditioned on large-scale weather circulation patterns for Central Europe 

Viet Dung Nguyen, Sergiy Vorogushyn, Katrin Nissen, and Bruno Merz

For many flood risk assessments at large spatial scales, long-term meteorological data (e.g. precipitation, temperature) with spatially coherent representation are needed. This is where a regional weather generator comes into play. Meteorological fields for a specific region are strongly dependent on weather circulation patterns (CP) at larger scales. Additionally, there is evidence that these fields covariate with the average regional surface temperature (ART). With future climate change, such changes in both CP and ART should be included in weather generators.

This study presents the development of such a non-stationary gridded weather generator conditioned on large-scale weather circulation patterns for Central Europe. The reanalysis dataset ERA5 (1o x 1o) is used for weather type classification. The E-OBS gridded observational dataset (0.25ox 0.25o) is used to parameterize the meteorological fields, such as precipitation and temperature (minimum, maximum, average). The spatial and temporal dependence is represented by the multivariate auto-regressive model. Daily precipitation amount is modelled by the extended generalized Pareto distribution and daily temperature is modelled by the transformed normal distribution. Both fields are conditioned on CP and allow to covariate with ART. In this way, the regional weather generator is capable of capturing “between-type” and “within-type” climate variability and can be used to generate long synthetic data for flood risk assessment in present and future periods.

How to cite: Nguyen, V. D., Vorogushyn, S., Nissen, K., and Merz, B.: A non-stationary gridded weather generator conditioned on large-scale weather circulation patterns for Central Europe, EGU General Assembly 2023, Vienna, Austria, 23–28 Apr 2023, EGU23-15475, https://doi.org/10.5194/egusphere-egu23-15475, 2023.

EGU23-16623 | ECS | Posters on site | HS7.8

Mapping Hazard to Extreme Temperature Events Over the Indian Subcontinent 

Anokha Shilin, Naveen Sudharsan, Arpita Mondal, Pradip Kalbar, and Subhankar Karmakar

The recent AR6 report of the Intergovernmental Panel on Climate Change (IPCC) explicitly shows that the observed change in hot extremes (including heatwaves) with high confidence in human contribution to the observed changes has highly increased in the South Asian (SAS) domain which comprises the Indian subcontinent. Extreme heat events are more frequent and intense across the globe since the 1950s and have adverse societal and economic impacts. Considering current warming trends and projections, heatwaves are becoming a serious problem in India. Exposure to extreme heat in the population is increasing due to climate change. Also, observed temperatures are increasing globally as well as regionally as an effect of global warming. As heat stress occurs when the human body cannot get rid of the excess heat, it can be considered a good proxy for the heatwave hazard. Heat stress results in heat stroke, exhaustion, cramps, or rashes. Exposure to extreme heat can result in occupational illnesses and injuries. An agrarian country like India will have large economic damage when climate-related heat stress increases the occurrence of droughts and exacerbate water scarcity for irrigation. Hence the impact of the heat stress hazard is spotted and largely discussed both in the academic and political domains. In this study, Universal Thermal Climate Index (UTCI) based hazard map is developed for India with a non-parametric multivariate approach. The prominent heat stress hazard areas are identified and mapped with reference to the UTCI assessment scale which is categorized based on thermal stress. The probability of occurrence is also mapped using the exceedance probability with the UTCI reference. Heat stress hazard map provides the basis for a wide range of applications in public and individual precautionary planning such as heatwave action plans, urban and regional planning, the tourism industry, and climate research. Hence a country-level extreme temperature hazard map is of dire necessity.

Keywords: Exceedance probability, hazard map, heat stress, multivariate approach, non-parametric method

How to cite: Shilin, A., Sudharsan, N., Mondal, A., Kalbar, P., and Karmakar, S.: Mapping Hazard to Extreme Temperature Events Over the Indian Subcontinent, EGU General Assembly 2023, Vienna, Austria, 23–28 Apr 2023, EGU23-16623, https://doi.org/10.5194/egusphere-egu23-16623, 2023.

EGU23-469 | ECS | PICO | HS7.9 | Highlight

Revegetation impacts on moisture recycling over Loess Plateau in China 

Mingzhu Cao, Weiguang Wang, Lan Wang-Erlandsson, and Ingo Fetzer

Moisture recycling of local water sources through evaporation allows a region to maintain precipitation in the same region. Many studies have shown that deforestation can reduce evaporation and downwind rainfall, and it has been suggested that reforestation conversely increase evaporation and downwind rainfall. Precipitation has been observed to increase over China’s Loess Plateau over the past two decades, coinciding with the start of the Grain for Green project - the largest active revegetation programme attempted in the world. However, the contribution of revegetation to the increase in precipitation is yet unknown. Here, we aim to quantitatively analyze the relationship between revegetation, evaporation, and locally recycled moisture. Based on the ERA5 reanalysis data, we used the modified Water Accounting model-2 layers (WAM-2layers) to track the recycling moisture over the Loess Plateau. Preliminary results indicate that local recycling moisture (Er) accounted for almost one-tenth of the annual precipitation, and seems to have a decreasing trend, which was more evident after 2000. Meanwhile, the contribution of local evaporation to local precipitation appears to decrease during both 1982-1999 and 2000-2015, while the decreasing trend has been slightly amplified after the revegetation. Spatially, Er over the Loess Plateau showed a decreasing trend from southeast to northwest. Significant increasing trend of Er can be identified in the northern part of the plateau during 1982-1999. However, after the implement of the Green for Grain Project, most area over the Loess Plateau showed a decreasing trend, which is significant in the east. Thus, contrary to popular wisdom, the revegetation appears to have led to a decrease in evaporation and subsequent recycling, and the increase in precipitation seems to have other causes. These results are subject to high data uncertainty, and further research is needed to better understand the hydroclimatic effects of revegetation projects under climate change.

How to cite: Cao, M., Wang, W., Wang-Erlandsson, L., and Fetzer, I.: Revegetation impacts on moisture recycling over Loess Plateau in China, EGU General Assembly 2023, Vienna, Austria, 23–28 Apr 2023, EGU23-469, https://doi.org/10.5194/egusphere-egu23-469, 2023.

EGU23-965 | ECS | PICO | HS7.9

Ecohydrological dynamics in the Central American and Andean Páramo: Insights from a modelling analysis using a Budyko-type model for non-stationary conditions 

Germain Esquivel-Hernández, Ricardo Sánchez-Murillo, Giovanny M. Mosquera, Patricio Crespo, Rolando Célleri, Juan Pesantez, Braulio Lahuatte, and Enzo Vargas-Salazar

The Páramo is a high‐elevation tropical grassland ecosystem that plays an important role in the regional water cycle of Central America and the northern Andes. However, refined information about the ecohydrological partitioning in these mountainous biomes is scarce. This work aimed to assess sub-annual or monthly variations in the ecohydrological conditions along a N-S transect with three Páramo sites: Chirripó (Costa Rica) and El Carmen and Cajas (north and south Ecuador, respectively). A Budyko-type model for conditions under which evapotranspiration surpasses precipitation using monthly meteorological observations and evapotranspiration products (May 2016-April 2019) was applied to evaluate short-term ecohydrological dynamics based on the aridity index and precipitation partitioning in the Páramo sites. Stronger hydroclimatic variations were found in Chirripó than in the Andean Páramos, related with significant increments in the evaporative index (AET/P) during the dry season. We also found a clear separation between Chirripó and the Ecuadorian Páramos owing to a higher ecohydrological resilience (i.e., similar trajectories in the energy excess or 1- AET/PET and the water excess or Q/P) in Chirripó during dry season and a more effective regulation by the additional water available to evapotranspiration besides direct precipitation (y0, range: 37 – 90 %). Our results reveal the complex ecohydrological functional properties of the Páramo and its sensitivity to future moisture changes (e.g., ENSO cycles) that could alter its water yield synchronicity. 

How to cite: Esquivel-Hernández, G., Sánchez-Murillo, R., Mosquera, G. M., Crespo, P., Célleri, R., Pesantez, J., Lahuatte, B., and Vargas-Salazar, E.: Ecohydrological dynamics in the Central American and Andean Páramo: Insights from a modelling analysis using a Budyko-type model for non-stationary conditions, EGU General Assembly 2023, Vienna, Austria, 23–28 Apr 2023, EGU23-965, https://doi.org/10.5194/egusphere-egu23-965, 2023.

EGU23-1031 | ECS | PICO | HS7.9

Spatial and temporal patterns and influencing factors of carbon and water cycles in different permafrost types on the Qinghai-Tibet Plateau 

Xiang Wang, Guo Chen, Qi Wu, Longxi Cao, Joseph Awange, and Mingquan Wu

Understanding changes in water use efficiency (WUE) and its drivers in terrestrial ecosystems on the Qinghai-Tibet Plateau is important to reveal the response of carbon and water cycle to climate change in the area sensitive to the environment. However, the patterns of carbon and water cycles in different frozen soil zones in this area are not well understood to our knowledge. This study explores the spatial and temporal patterns of WUE, gross primary production (GPP), and evapotranspiration (ET) from 2001 to 2020 at six frozen soil zones (short-time frozen ground; thin seasonally frozen ground; middle-thick seasonally frozen ground; mountain permafrost; predominantly continuous and island permafrost; predominantly continuous permafrost) on the Qinghai-Tibet Plateau with different degrees of freezing based on remote sensing data. The climatic, edaphic, and botanic parameters influencing these patterns were then investigated. The results show that: (1) the WUE, GPP, and ET all generally increased from 2001-2020 for each type of frozen soil ecosystem although the significance and the slope of the trends differed, (2) the WUE and GPP gradually decreased as the degree of freezing increased, while ET first increased and then decreased with the freezing gradient, and (3) enhanced vegetation index was the first important variable influencing WUE for all types of frozen soil regions except for the area of short-time frozen ground. Our results highlight that the freezing degree of soil could influence the evaluation of the water-carbon cycle on the Qinghai-Tibet Plateau.

How to cite: Wang, X., Chen, G., Wu, Q., Cao, L., Awange, J., and Wu, M.: Spatial and temporal patterns and influencing factors of carbon and water cycles in different permafrost types on the Qinghai-Tibet Plateau, EGU General Assembly 2023, Vienna, Austria, 23–28 Apr 2023, EGU23-1031, https://doi.org/10.5194/egusphere-egu23-1031, 2023.

Water is crucial for human health, food and industrial production, ecosystem services, and climate and weather systems. As a major contributor of renewable freshwater over land, humans have been studying the origin of continental precipitation for nearly a century. From the moisture budget perspective, local evapotranspiration in a vast part of the Earth’s surface is effectively smaller than local precipitation. This entails the role of moisture advection in sustaining continental precipitation. However, previous trajectory-based quantification appeared to underestimate the global “continental precipitation recycling (CPR)” ratio –– that is, the fraction of continental precipitation originating from evapotranspiration. To this end, the present study completed a 40-year (1971-2010) tracking of moisture from continental precipitation using a three-dimensional Lagrangian tracking model and optimized water accounting diagnostics. Our Lagrangian tracking confirms that 62% of continental precipitation stems from evapotranspiration, aligning well with the water budget-based estimates in the literature. Across the globe, non-local terrestrial sources dominate 1˚-scale precipitation in nearly 70% of the land areas, together with the greatest continental moisture feedback in the interior of South America, Africa and Eurasia. Seasonally, the CPR ratio anomalies are markedly different between the mid-to-high latitudes and monsoon regions worldwide, from which two kinds of moisture source-regulated hydroclimate are generalized. For transboundary water governance, perennial source hotspots for continental precipitation are identified, including the biome-rich Amazon and Congo rainforests and other major watersheds within 30˚ equatorward. Leveraging the backward “WaterSip” and the forward “WaterDrip” algorithms, we propose two ubiquitous processes of cascading moisture recycling (CMR) that formulate a cascade of regional water cycles. The watershed-scale CMR metrics quantify the hidden interdependence between the regional water cycles through moisture recycling. Overall, by closing the gap in the estimate of the CPR ratio, this work updates the understanding of the moisture recycling, feedback and cascading characteristics of the continental atmospheric water cycle. The outcome sheds light on the potential vulnerability of local precipitation in response to the modification of non-local land surface fluxes by human activities.

How to cite: Cheng, T. F. and Lu, M.: Updated Understanding of Continental Precipitation Recycling Using Global 3-D Lagrangian Tracking, EGU General Assembly 2023, Vienna, Austria, 23–28 Apr 2023, EGU23-1887, https://doi.org/10.5194/egusphere-egu23-1887, 2023.

EGU23-2768 | ECS | PICO | HS7.9

Hydrological response to anthropogenic activities and climate change in the southern Caspian Sea, Iran 

Alireza Sharifi Garmdareh, Ali Torabi Haghighi, and Ritesh Patro

Rivers play a vital role in supplying fresh water for various sectors. During the last decades, increasing anthropogenic activities and climate change have altered river flow regimes around the globe. Rivers flow in the southern Caspian Sea in Iran has altered due to water-intensive socio-economic development and climate change. To assess and quantify the impact of anthropogenic activities and climate change on river flow regimes, the elasticity-based methods and the Budyko hypothesis were applied to 40 rivers on the closest gauges to the Caspian Sea were selected. Furthermore, to evaluate spatial/temporal change in hydrometeorological variables, two non-parametric methods, including the modified Mann-Kendall method (MK3) and Innovative Trend Analysis (ITA), were applied. The results showed an alarming trend of increasing temperature and potential evapotranspiration and decreasing rivers’ flow in the southern Caspian sea. Assessing and quantifying the impact of anthropogenic activities and climate change on river flow alteration indicated that anthropogenic activities (accounting for 83.3%) played a dominant role in river flow alteration that led to inflow to the Caspian Sea decline by about 2,412 MCM annually. In addition, the inflow to the Sea has decreased by about 551 MCM every year due to the impact of climate change. Decreasing the inflow to the Caspian Sea can accelerate the declining trend of the Sea level, which leads to boosts eutrophication conditions in the Sea, and negatively affect the ecosystem and economics of the Caspian Sea. Therefore, an appropriate adoption approach must be taken into account to alleviate the environmental and socio-economic issues in the southern Caspian Sea.

How to cite: Sharifi Garmdareh, A., Torabi Haghighi, A., and Patro, R.: Hydrological response to anthropogenic activities and climate change in the southern Caspian Sea, Iran, EGU General Assembly 2023, Vienna, Austria, 23–28 Apr 2023, EGU23-2768, https://doi.org/10.5194/egusphere-egu23-2768, 2023.

Irrigation practice has impacts on the natural environment by changing the water and energy balance at the land surface and thereby interacting with the atmosphere. To quantify such impacts and estimate irrigation water demand, process-based hydrological models with a representation of irrigation practice are often used. However, the applicability of existing irrigation schemes is limited to arid and semi-arid regions. Likewise, it is still lack of more sophisticated irrigation schemes that can be particularly applicable to humid regions. This study presents the newly developed Crop-classified Dynamic Irrigation (CDI) scheme that has been two-way coupled into the land surface-hydrologic model Noah-HMS. Such development allows to distinguish the different irrigation practices for "rice" and "non-rice" crops and to estimate irrigation water demand. We have applied the newly developed model to an important grain and industrial crop production base in southern China, namely, Poyang Lake Basin (PLB), where the sown area of rice accounts for more than 60% of the sown area of all crops. As compared to the widely used, traditional Dynamic Irrigation (DI) scheme, the CDI-incorporated Noah-HMS improves the simulations of water and energy balance over the PLB from 2007 to 2015, especially irrigation water amount simulation. The relative error for irrigation water amount of CDI (DI) is -18.1% (-56.8%). In terms of surface water balance, the inclusion of irrigation practice has larger impacts on the simulated soil moisture (+1.7%) during dry years than that (+0.9%) during wet years, while has larger impacts on the simulated surface runoff (4.6%) in wet years than that (2.4%) in dry years. In terms of surface energy balance, irrigation practice leads to increased latent heat flux by 0.9 W/m2 (1.4%), decreased sensible heat flux by 0.5 W/m2 (1.3%), decreased ground heat flux by 0.02W/m2 (5.0%), and increased net radiation by 0.09 W/m2 (0.1%). Such impacts on the surface water and energy balance become more pronouncing at local scale especially over the intensively irrigated areas, for example the Nanchang city region. We conclude that our Crop-classified Dynamic Irrigation scheme is especially beneficial for applications in multiple cropping humid regions. Furthermore, our modeling development has the potential to be further extended into the fully coupled atmospheric-hydrologic modeling systems with a more holistic representation of human activities.

How to cite: Yang, Q., Wei, J., Yang, C., and Yu, Z.: Impacts of Farmland Irrigation on Land Surface Water and Energy Balance over a Humid Region: Development and Benefits of a Crop-Classified Dynamic Irrigation Scheme in Noah-HMS, EGU General Assembly 2023, Vienna, Austria, 23–28 Apr 2023, EGU23-4290, https://doi.org/10.5194/egusphere-egu23-4290, 2023.

EGU23-5016 | PICO | HS7.9 | Highlight

Moisture Recycling in the Amazon: a study using WRF with water vapor tracers 

Francina Domínguez and Jorge Eiras-Barca

This work analyzes the sources, sinks and stores of moisture that originates as Amazonian evapotranspiration (ET) from daily to annual timescales. To do this, we use the Weather Research and Forecast (WRF) regional meteorological model with the added capability of water vapor tracers to track the local evapotranspired moisture. The tracers reveal a strong diurnal cycle of Amazonian water vapor which had not been previously reported. This signal is related to the diurnal cycle of ET, convective precipitation and advected moisture. ET's contribution to atmospheric moisture increases from early morning into the afternoon. Some of this moisture is rained out through convective storms in the early evening. Later in the night and following morning, strong winds associated with the South American Low Level Jet advect moisture downwind. The beating pattern becomes apparent when visualizing the Amazonian water vapor as an animation.

How to cite: Domínguez, F. and Eiras-Barca, J.: Moisture Recycling in the Amazon: a study using WRF with water vapor tracers, EGU General Assembly 2023, Vienna, Austria, 23–28 Apr 2023, EGU23-5016, https://doi.org/10.5194/egusphere-egu23-5016, 2023.

EGU23-6508 | PICO | HS7.9 | Highlight

Assessing the impact of large-scale afforestation on the atmospheric water cycle of the Loess Plateau in China 

Lei Tian, Shuoyu Chen, Baoqing Zhang, and Baotian Pan

Afforestation has been regarded as an appropriate way to mitigate climate change and enhance ecosystem services. How afforestation affects the availability of water resources is a hot topic in the science community. Most current studies investigate the impact of afforestation on water resources through offline modeling or observation on a small spatial scale. However, the atmospheric water cycle (AWC) is also an important aspect that can alter the availability of water resources, especially on a large spatial scale. With an investment of about US$54.57 billion, the Chinese government implemented the world’s largest afforestation project, the Grain for Green Program (GFGP), to curb the severe soil erosion over the Loess Plateau (LP) since 1999. Here we focused on this ideal platform, the LP, to explore the impact of large-scale afforestation on the processes related to the atmospheric water cycle. We adopted two different approaches to discern the hydroclimatic effect of the GFGP. This first approach used the reanalysis dataset to compare the hydroclimatic states before (1982–1998) and after (1999–2018) the GFGP. Since the reanalysis dataset cannot separate the impact of climate change and afforestation, this study also applied a regional climate model (the Weather Research & Forecasting Model, WRF) to isolate the net hydroclimatic effect of the GFGP by controlled experiments. In particular, the WRF model was driven by two land surface conditions with/without the implementation of the GFGP. We found both approaches reached similar conclusions. Results show the vegetation coverage fraction over the LP increased by 3.15% decade−1 induced by the GFGP. The climatological precipitation and evapotranspiration (ET) increased by 54.62 and 22.56 mm, respectively, after starting the GFGP in 1999. The large-scale afforestation intensifies the atmospheric water cycle over the LP. In addition, based on the dynamic precipitation recycling model, we also found the precipitation recycling ratio approximately increased by 1%. The GFGP alters the regional circulation by influencing diabatic heating, and moisture convergence, resulting in more moisture being advected from the south boundary, thus more atmospheric moisture was retained in the LP. Additionally, the internal branch of the AWC contributes to about 15% of the increased precipitation, while the contribution of the external branch is about 85%. Moreover, the GFGP remotely affects the water vapor budget in the downwind areas. Our work enriched the current understanding of how afforestation affects the water cycle from a precipitation recycling perspective and can help policy-makers to make science-informed afforestation strategies.

How to cite: Tian, L., Chen, S., Zhang, B., and Pan, B.: Assessing the impact of large-scale afforestation on the atmospheric water cycle of the Loess Plateau in China, EGU General Assembly 2023, Vienna, Austria, 23–28 Apr 2023, EGU23-6508, https://doi.org/10.5194/egusphere-egu23-6508, 2023.

EGU23-6883 | ECS | PICO | HS7.9 | Highlight

Local moisture recycling across the globe 

Jolanda Theeuwen, Arie Staal, Obbe Tuinenburg, Bert Hamelers, and Stefan Dekker

Atmospheric moisture recycling describes how moisture evaporated from land precipitates over land. It explains how shifts in terrestrial evaporation due to land cover changes may affect precipitation and freshwater availability across scales. Recycling at regional and continental scales has been studied using different methods, such as offline and online moisture tracking models and bulk recycling models. Although recycling at regional and continental scales is relatively well understood, it has only recently become possible to study local moisture recycling across the globe. Recent developments in offline moisture tracking resulted in a dataset including a 10-year climatology (2008-2017) of atmospheric moisture connections from evaporation source to precipitation sink at a spatial scale of 0.5° (Tuinenburg et al., 2020). We used this data to calculate the local moisture recycling ratio, which we define as the fraction of evaporated moisture that precipitates within a distance of 0.5° (typically 50 km) from its source. Furthermore, we identify variables that correlate with the local moisture recycling ratio to assess its underlying processes. On average, 1.7% (st. dev. = 1.1%) of terrestrial evaporated moisture returns as local precipitation annually. However, there is large spatial and temporal variability with peak values over mountainous and wet regions and in summer. Wetness (i.e., precipitation and precipitation minus evaporation), orography, latitude, convective available potential energy, wind speed and total cloud cover have moderate to strong correlations with the local moisture recycling ratio. Interestingly, we find peaks in the local moisture recycling ratio at latitudes where air ascends due to the Hadley cell circulation (i.e., at 0° and 60°). These results suggest that wet regions characterized by ascending air and low wind speeds are favourable for high local moisture recycling ratios. This knowledge can be used to strategically recycle water using nature-based solutions or irrigation to minimize the usage of freshwater availability. For example, for the tropics and mountainous regions globally, and for the Mediterranean regions on the Northern Hemisphere, an increase in evaporation through for example, regreening has a relatively large contribution to local precipitation due to the relatively large local moisture recycling ratios here. These results suggest the potential to enhance freshwater availability with land cover changes, e.g., regreening.


References

Tuinenburg, Obbe A., Jolanda J.E. Theeuwen, and Arie Staal. "High-resolution global atmospheric moisture connections from evaporation to precipitation." Earth System Science Data 12.4 (2020): 3177-3188.

How to cite: Theeuwen, J., Staal, A., Tuinenburg, O., Hamelers, B., and Dekker, S.: Local moisture recycling across the globe, EGU General Assembly 2023, Vienna, Austria, 23–28 Apr 2023, EGU23-6883, https://doi.org/10.5194/egusphere-egu23-6883, 2023.

EGU23-7687 | ECS | PICO | HS7.9

Towards using multi-dimensional structures in climate variables to detect anthropogenic changes 

Marius Egli, Sebastian Sippel, Vincent Humphrey, and Reto Knutti

Precipitation (P) and evapotranspiration (ET) play a crucial role in the water cycle and have a significant impact on water resources and the energy balance of the Earth's surface. However, it remains a challenge, in particular on regional scales, to detect changes in hydrological variables and attribute them to anthropogenic or natural influences. Traditional studies that aim to detect or attribute changes in atmospheric variables often consider only a single variable at a time. This makes detecting changes in hydrological variables challenging due to large internal variability, the lack of long-term observational coverage and partly poor mechanistic understanding of land-atmosphere coupling processes in a changing climate.


However, because P and ET are related to various other atmospheric variables, such as temperature, humidity, and sea level pressure, the detection of anthropogenic influences may be conducted in principle within a broader multivariate space. Here, we aim at exploiting multivariate relationships to more robustly detect anthropogenic changes to the hydrological cycle at the regional or up to continental scale. We train statistical models from coupled Earth system models to learn the relationships between relatively well observed variables and more poorly observed ones, like P and ET. We demonstrate that such models can predict and extract patterns of forced change in P and ET, albeit somewhat contingent on the realism of the simulation of the Earth system model. The main advantage is that the method does not rely on sparse observations of P and ET, and instead relies on covariates which are more abundantly and reliably observed.


We demonstrate the effectiveness of this approach in a climate-model-as-truth framework, showing that it can capture a wide range of possible hydrological responses produced by the different climate models. We also apply the statistical model to observations to identify forced changes in P and ET that have already occurred. For example, we see an increase in ET in the northern hemisphere likely induced by a reduction in aerosol emissions. Our results show that this method can infer changes in P and ET that may have taken place, in principle even without the need for direct observations of those variables and can provide constrained projections of future water resources and energy balance.

How to cite: Egli, M., Sippel, S., Humphrey, V., and Knutti, R.: Towards using multi-dimensional structures in climate variables to detect anthropogenic changes, EGU General Assembly 2023, Vienna, Austria, 23–28 Apr 2023, EGU23-7687, https://doi.org/10.5194/egusphere-egu23-7687, 2023.

EGU23-7867 | ECS | PICO | HS7.9 | Highlight

The importance of the plant physiological response to rising CO2 in projections of future water availability 

Jessica Stacey, Richard Betts, Andrew Hartley, and Lina Mercado

Reliable and useful future projections of water scarcity are vital for incorporating into climate policy and national adaptation plans for building climate resilience. However, projections of water scarcity are often based on hydrology models which do not include an important climate feedback affecting the water cycle: the response of plant physiology to rising atmospheric CO2, or “physiological forcing”. With higher atmospheric CO2, plant physiology can affect the water cycle in two contradictory ways. Plant stomata do not open as widely in higher CO2, and therefore transpiration rates are lower, leaving relatively more water in the ground increasing runoff and soil moisture. However, faster rates of photosynthesis with higher CO2 also encourages greater leaf area, and thus higher overall canopy transpiration (even though transpiration of an individual stomata still decreases). The influence of physiological forcing on physical quantities within the water cycle such as transpiration and runoff have been well studied; however, there is a requirement to quantify how this translates to human impacts and more policy-relevant metrics on water resources, such as the water scarcity index. I will present findings from experiments using the Joint UK Land Environmental Simulator (JULES) forced with four earth system models which quantify and highlight the importance of including the plant physiological response in water-related impact studies.

How to cite: Stacey, J., Betts, R., Hartley, A., and Mercado, L.: The importance of the plant physiological response to rising CO2 in projections of future water availability, EGU General Assembly 2023, Vienna, Austria, 23–28 Apr 2023, EGU23-7867, https://doi.org/10.5194/egusphere-egu23-7867, 2023.

EGU23-7976 | ECS | PICO | HS7.9 | Highlight

Modeling the Impacts of Deforestation: local drying of the atmosphere and potential effect on downwind precipitation. 

Clément Devenet, Nathalie de Noblet, Catherine Ottlé, Nicolas Viovy, and Frédérique Chéruy

The Amazon rainforest is a vital component of the hydrological cycle of South America. Its evapotranspiration is an essential supply of atmospheric moisture for precipitation in more southern regions of the continent. The potential impacts of deforestation on precipitation in these distant regions are yet not fully understood.

The present research project aims at quantifying the deficit of evapotranspiration occurring at the location of deforestation, focusing on the southern part of Amazonia, which has experienced intense deforestation since the 80s. We first use the ORCHIDEE land surface model forced with the reanalysis dataset CRU-JRA to simulate the impacts of an imposed land cover change: from observed states of vegetation cover to a massive extension of croplands. The ORCHIDEE model computes all the components of evapotranspiration, giving, in turn, the expected deficit of atmospheric moisture at the location of the land cover change.

Then, thanks to existing datasets connecting any place on Earth with the area that supplies its moisture through the atmosphere, we link this deficit with downwind locations highly dependent on this upwind evapotranspiration for its precipitation. From there, we draw hypotheses about the potential changes in precipitation amounts and seasonality.

In the project’s second phase, these hypotheses are tested against land-atmosphere coupled simulations produced with the IPSL global climate model, nudged to winds from the ERA5 reanalysis. The model grid is zoomed on the South American continent to better describe the atmospheric transport in the region. The land-atmosphere coupled simulations provide information on the atmospheric feedback induced by the land cover change, confirming or invalidating the hypotheses. Since land cover affects not only water fluxes but also energy fluxes, the coupled model experiments give us insights into the atmospheric processes at stake, the changes in cloudiness and local convection, and the potential shifts in precipitation location or timing.

How to cite: Devenet, C., de Noblet, N., Ottlé, C., Viovy, N., and Chéruy, F.: Modeling the Impacts of Deforestation: local drying of the atmosphere and potential effect on downwind precipitation., EGU General Assembly 2023, Vienna, Austria, 23–28 Apr 2023, EGU23-7976, https://doi.org/10.5194/egusphere-egu23-7976, 2023.

EGU23-8061 | ECS | PICO | HS7.9

Exploring the human influence on surface water availability in the contiguous United States 

Sara Alonso Vicario, Maurizio Mazzoleni, and Margaret Garcia

Finding which factors control the spatial variability of surface runoff is fundamental for assessing regional surface water availability. These controlling factors drive the water balance and vary from physio-climatic catchment attributes to anthropogenic activities. A few studies evaluated these factors in the Contiguous United States on catchments with non-human influence (Abatzoglou & Ficklin, 2017). Yet, a comprehensive analysis of the human influence on surface water availability is still missing.

Here, we employed a parametric Budyko-based framework to assess the long-term runoff sensitivity in the last 30 years of 502 catchments in the Contiguous United States. We linked the Budyko-based framework's landscape parameter with an extensive set of 50 climatic, topographic, anthropogenic, and soil factors that were previously found influential on partitioning precipitation into evapotranspiration and runoff. The catchments belong to the GAGES-II database (Falcone, 2010) and have been grouped in reference and human-impacted basins (urban and agricultural) using the most updated land cover data of 2019. A stepwise multiple linear regression model is developed to find the most significant factors in the partitioning depending on the most extensive human activity on the basin and assess their interactions. Also, we analyzed how anthropogenic activities (e.g., irrigated agriculture, urban settlements) alter the effect of climate variables.

Preliminary results suggest that cultivated land is the second most important factor in explaining runoff variability in agricultural basins, and urban settlements increase the runoff in catchments with a high interannual variability of precipitation.


References

Abatzoglou, J. T., & Ficklin, D. L. (2017). Climatic and physiographic controls of spatial variability in surface water balance over the contiguous United States using the Budyko relationship. Water Resources Research, 53(9), 7630–7643. https://doi.org/10.1002/2017WR020843

Falcone, J. A., Carlisle, D. M., Wolock, D. M., & Meador, M. R. (2010). GAGES: A stream gage database for evaluating natural and altered flow conditions in the conterminous United States. Ecology, 91(2), 621–621. https://doi.org/10.1890/09-0889.1

How to cite: Alonso Vicario, S., Mazzoleni, M., and Garcia, M.: Exploring the human influence on surface water availability in the contiguous United States, EGU General Assembly 2023, Vienna, Austria, 23–28 Apr 2023, EGU23-8061, https://doi.org/10.5194/egusphere-egu23-8061, 2023.

EGU23-10635 | PICO | HS7.9

Uncertainties in global future projection of potential evapotranspiration using SSP scenarios 

Young Hoon Song, Eun-Sung Chung, Seung Taek Chae, and Jin Hyuck Kim

Evapotranspiration (ET) is the amount of water lost from the global surface, and it represents water and Earth's energy cycle. The intensity and frequency of climate variables have been changed because of the ongoing climate crisis, leading to increased climate disasters, such as heat waves and droughts. The abrupt climate crisis affects the variation of ET because climate variables highly influence ET. However, the future potential ET (PET) estimates include various uncertainty resulted from the variations in the projection of climate variables. In this context, the uncertainty in the projected future PETs should be quantified for the high reliability. Therefore, this study projected future global PET using Penman-Monteith (PM) for the near (2031-2065) and far (2066-2100) futures and quantified the corresponding uncertainty. The six climate variables of 14 CMIP6 GCMs were used for estimating historical PET which were compared to those from the NCEP/NCAR reanalysis data using the five evaluation metrics. The changes in PETs for four Shared Socio-economic Pathways (SSPs) scenarios were calculated for the near and far futures compared to the historical period (1980-2014). Subsequently, the uncertainties of PETs were quantified using the reliability ensemble average method. As a result, the future PET in high latitudes showed the most significant variability compared to the other latitudes. The future PET in the southern hemisphere was higher than the historical PET. Especially the PET in the mid-latitudes of southern hemisphere was the highest among the other latitudes. In addition, the uncertainty of PET was the highest in the high latitudes of the northern hemisphere while the mid-latitude in the northern was the lowest. This study provides insight into evaluating the global water cycle based on PET and helps establish appropriate policies for climate impact assessment.

How to cite: Song, Y. H., Chung, E.-S., Chae, S. T., and Kim, J. H.: Uncertainties in global future projection of potential evapotranspiration using SSP scenarios, EGU General Assembly 2023, Vienna, Austria, 23–28 Apr 2023, EGU23-10635, https://doi.org/10.5194/egusphere-egu23-10635, 2023.

EGU23-10652 | ECS | PICO | HS7.9

Atmospheric moisture exchanges between the Magdalena River basin and its surroundings. 

Paola Andrea Giraldo Ramirez, Ruben Dario Molina Santamaria, and Juan Fernando Salazar Villegas

Atmospheric moisture transport is a fundamental process in the climate system, critical for the hydrological cycle and water security on land. Moisture exchanges between a basin and its surroundings determine water availability and may change over time due to climate change and other human impacts. Understanding how and why these atmospheric fluxes change under global change is critical for river basins supporting water security in different regions. Here we focused on the Magdalena River basin in northwestern South America, a critical basin for water and energy security in Colombia. We quantified moisture exchanges for the entire watershed and different segments (defined by the boundaries between neighboring basins). We used monthly data between 1979 and 2021 from the ERA5 reanalysis to look for possible changes, including trends. Our results provide new insights into the dynamics of moisture exchanges between the basin and its surroundings. In addition, we found evidence of statistically significant trends likely related to anthropic effects, mainly deforestation and climate change. These results have implications for water security analyses in this region, where there are few studies of this type, and simultaneously generate new insights for decision-making related to water management and transboundary water security in the Magdalena river basin.

How to cite: Giraldo Ramirez, P. A., Molina Santamaria, R. D., and Salazar Villegas, J. F.: Atmospheric moisture exchanges between the Magdalena River basin and its surroundings., EGU General Assembly 2023, Vienna, Austria, 23–28 Apr 2023, EGU23-10652, https://doi.org/10.5194/egusphere-egu23-10652, 2023.

EGU23-12671 | ECS | PICO | HS7.9 | Highlight

WRF with age-weighted water tracers: implementation, application, and new insights into the regionally accelerated atmospheric hydrological cycle under global warming 

Jianhui Wei, Joël Arnault, Thomas Rummler, Benjamin Fersch, Zhenyu Zhang, Patrick Olschewski, Patrick Laux, and Harald Kunstmann

Atmospheric water residence time, here defined as time between the original evaporation and the returning of its respective water masses to the land surface as precipitation, is a measure of the speed of the atmospheric hydrological cycle. Traditional analytical methods are generally limited by crude assumptions in the coupling between the land surface and the atmosphere, and hence are not applicable to regions with complex monsoon systems under a changing climate. To this end, we have implemented the age-weighted water tracers into the Weather Research and Forecasting WRF model, namely, WRF-age, to follow the atmospheric water pathways and to derive atmospheric water residence times accordingly. The newly developed, physics-based WRF-age is used to regionally downscale the reanalysis of ERA-Interim and the MPI-ESM Representative Concentration Pathway 8.5 scenario (RCP8.5) simulation for an East Asian monsoon region, i.e., the Poyang Lake basin, for two 10-year slices of historical (1980-1989) and future (2040-2049) times. In comparison to the historical WRF-age simulation, the future 2-meter air temperature rises by 1.3 °C and precipitation decreases by 38% under RCP8.5 on average. In this context, global warming leads to decreased atmospheric residence times of the column-integrated water vapor (from 22 to 13 hours) and column-integrated condensed moisture (from 26 to 14 hours) in the atmosphere over the basin, but slightly increased atmospheric residence times of surface precipitation (from 12 to 15 hours) in agreement with reduced the precipitation amounts. Our findings demonstrate that global warming increases the complexity of regional atmospheric water cycle, especially the associated changes in the residence times of atmospheric water states of matter.

How to cite: Wei, J., Arnault, J., Rummler, T., Fersch, B., Zhang, Z., Olschewski, P., Laux, P., and Kunstmann, H.: WRF with age-weighted water tracers: implementation, application, and new insights into the regionally accelerated atmospheric hydrological cycle under global warming, EGU General Assembly 2023, Vienna, Austria, 23–28 Apr 2023, EGU23-12671, https://doi.org/10.5194/egusphere-egu23-12671, 2023.

EGU23-12775 | PICO | HS7.9

Introducing project ITHACA: Investigation of the Terrestrial HydrologicAl Cycle Acceleration 

Yannis Markonis, Mijael Rodrigo Vargas Godoy, Johanna Blöcher, Riya Dutta, Shailendra Pratap, Rajani Pradhan, Alexander Kazantsev, Petr Bašta, Akbar Rahmati, Arnau Sanz i Gil, Vishal Thakur, Hossein Abbasizadeh, Oldřich Rakovec, Martin Hanel, Petr Máca, Rohini Kumar, and Simon Papalexiou

ITHACA is a 5-year project that aims to benchmark the terrestrial water cycle intensification. Our goal is to estimate the past range of the hydrological cycle variability, determine the present state of its acceleration, and understand its future impacts on the terrestrial water availability. To achieve this, we combine multi-source data products, stochastic analysis, and process-based hydrological modeling from regional to global scale. Here, we present the preliminary results after the completion of its first year, which come with multiple homogenized datasets of water cycle components, R software packages for data pre-processing and data-driven analyses, and methodological suggestions and insights for the cross-scale quantification of water cycle changes. We also discuss the current challenges and the future steps of the project, highlighting the numerous opportunities for active collaboration.  

How to cite: Markonis, Y., Vargas Godoy, M. R., Blöcher, J., Dutta, R., Pratap, S., Pradhan, R., Kazantsev, A., Bašta, P., Rahmati, A., Sanz i Gil, A., Thakur, V., Abbasizadeh, H., Rakovec, O., Hanel, M., Máca, P., Kumar, R., and Papalexiou, S.: Introducing project ITHACA: Investigation of the Terrestrial HydrologicAl Cycle Acceleration, EGU General Assembly 2023, Vienna, Austria, 23–28 Apr 2023, EGU23-12775, https://doi.org/10.5194/egusphere-egu23-12775, 2023.

EGU23-13142 | PICO | HS7.9

An engineering approach to land-surface controlled convective precipitation 

Sarah Warnau and Bert Hamelers

In the summer of 2022, several records of hot and dry conditions were broken in Europe, resulting in problems of water availability that are projected to increase further, especially in the Mediterranean basin. The reason for this drying trend is twofold: There is a reduction in precipitation, and an increase in evaporative demand due to climate warming. For climate mitigation and adaptation, solutions are needed to counteract this drying trend. A technological innovation that can be considered is enhancing surface evaporation by evaporating sea water using solar energy. The aim of this research is to examine whether this technology can potentially be used to address the reduction in precipitation. Therefore, we study under which conditions enhanced surface evaporation leads to more convective precipitation and how much water is required to achieve this.

For convective precipitation to occur, several conditions must be met. These include the atmospheric boundary layer (ABL) crossing the lifting condensation level (LCL), moist air parcels reaching their level of free convection (LFC), and the convective available potential energy (CAPE) surpassing a certain threshold (e.g. 400 J/kg). These conditions can be affected by turbulent fluxes of heat and moisture from the surface. Here we use a zero-dimensional mixed layer "slab" model which describes the evolution of the convective ABL height up to the LCL-crossing and the potential temperature and specific humidity of the mixed layer. From this model we obtain an implicit analytical relationship between the integrals of surface fluxes of heat and moisture that cause the LCL and ABL to cross. The relationship between these integrated surface fluxes varies depending on the initial and free atmospheric conditions.

As a case study, we examine the Ebro basin in northeastern Spain. We use the analytical expression of the LCL-crossing with the observational data from the LIAISE campaign to estimate:

  • how many days during the 2021 summer months could enhanced surface evaporation theoretically have led to an LCL-crossing,

  • the amount of water required in such cases, and

  • the changes to the LFC and CAPE that this evaporation enhancement could cause.

Preliminary results indicate that the LCL-crossing relationship between the integrated surface fluxes strongly depends on the initial and free atmospheric temperatures. This has implications for the areas where the technology could potentially benefit the water availability. Since convective precipitation is only controlled by the surface under specific atmospheric conditions, climate warming can cause areas to go from surface controlled to being too hot for the technology to be able to trigger convective precipitation.

Our research provides a preliminary assessment of the potential of this technology to counteract the drying trend in the Mediterranean basin. Further research is needed to evaluate the amount of precipitation that can be expected from the technology, as well as the effects of the technology on local evaporative demand, evapotranspiration, and heat stress.

How to cite: Warnau, S. and Hamelers, B.: An engineering approach to land-surface controlled convective precipitation, EGU General Assembly 2023, Vienna, Austria, 23–28 Apr 2023, EGU23-13142, https://doi.org/10.5194/egusphere-egu23-13142, 2023.

EGU23-13426 | ECS | PICO | HS7.9

Upwind land-use change impacts on wetland vulnerability 

Simon Felix Fahrländer, Lan Wang-Erlandsson, Agnes Pranindita, Lauren Seaby Andersen, and Fernando Jaramillo

Research on the protection and preservation of wetlands has traditionally focused on direct human drivers and impacts of climate change occurring in their upstream hydrological basin. However, since precipitation falling in the hydrological basin comprises both oceanic and terrestrial evaporation originating mostly outside of the basin boundaries, upwind land use and hydroclimatic changes affecting this supply of precipitation also need to be assessed. This study assesses the vulnerability of 40 wetlands of international importance to land use and hydroclimatic changes occurring upwind (i.e., in their precipitationsheds). We here use a dataset containing atmospheric moisture flows in combination with evaporation from natural and current vegetation to analyse the impact of extra-basin vegetation changes on the precipitation over the wetland basins. The analysis shows that historical land-use conversion has already caused reduced incoming precipitation into most wetland hydrological basins. The strongest effects are seen in (sub)tropical wetlands in South America, Africa and Asia and especially those located downwind of large agricultural areas. Based on our results and current wetland decline rates, we find that wetland sites in China, India, South America and Sub-Saharan Africa are especially threatened by hydroclimatic and vegetation changes outside of their basins. Additionally, larger basins appear to be more reliant on evaporation from within their basin boundaries than smaller hydrological basins. Using wetland ecosystems as an exemplary case, this study stresses the need to incorporate downwind effects to land-use changes in sustainable ecosystem management approaches. Since the transition from potential natural vegetation to agricultural land is often associated with changes in evaporation, land conversion may affect the resilience of wetland water availability. Following this analysis of the upwind moisture sources of wetland basins, future studies should investigate the potential effect of wetland loss on downwind precipitation patterns.

How to cite: Fahrländer, S. F., Wang-Erlandsson, L., Pranindita, A., Andersen, L. S., and Jaramillo, F.: Upwind land-use change impacts on wetland vulnerability, EGU General Assembly 2023, Vienna, Austria, 23–28 Apr 2023, EGU23-13426, https://doi.org/10.5194/egusphere-egu23-13426, 2023.

EGU23-13859 | PICO | HS7.9

Collaborative moisture tracking with WAM2layers v3 

Peter Kalverla, Imme Benedict, Ruud van der Ent, and Chris Weijenborg

Atmospheric moisture tracking is a valuable technique for understanding the physical processes that drive (extreme) precipitation and drought in our changing climate. By following where precipitated moisture originally evaporated (backtracking) or where evaporated moisture eventually precipitates (forward tracking) we can gain valuable insights into the connection of large-scale weather systems and hydrometeorological events, land-atmosphere interactions, or the impact of land-use changes on water availability.

The WAM2layers model is an Eulerian moisture tracking code that solves the water balance equation for tagged moisture in gridded model output data. With the increasing resolution of weather and climate models, however, data handling and performance have become serious constraints. Over the past year, we have worked on a new version of WAM2layers (github.com/WAM2layers/WAM2layers), in which we tackle these computational challenges and make a substantial upgrade to the user- and developer-friendliness of the model. The most important changes are summarized below.

Usability: the new version of WAM2layers separates configuration from code. This makes it possible to run many different model simulations without modifying the source code. The model can now be run with a single command, supplying a configuration file as an input argument. It is even possible to use the model without copying the code. Simply install the wam2layers Python package from PyPI.

Modularity: we have made a stricter separation between preprocessing steps, the actual tracking code, and utilities for analysing the results. This is important, for example, for working with multiple datasets. So far, we've worked with ERA5 data. Adding support for other datasets requires no modifications to the tracking code, only a separate preprocessing script.

Documentation: the new version of the model comes with documentation on ReadTheDocs. The documentation includes theory, installation instructions, a complete user guide, and contributing guidelines.

Collaborative development: previous versions of the model were already available on GitHub, but further development often happened offline and without coordination. From the start of this project, we have opened up the development process such that everyone can ask questions, raise issues, and open pull requests. The brand-new documentation includes instructions for anyone willing to contribute. We believe this shift represents a modern perspective on collaborative research practice.

How to cite: Kalverla, P., Benedict, I., van der Ent, R., and Weijenborg, C.: Collaborative moisture tracking with WAM2layers v3, EGU General Assembly 2023, Vienna, Austria, 23–28 Apr 2023, EGU23-13859, https://doi.org/10.5194/egusphere-egu23-13859, 2023.

EGU23-453 | ECS | Orals | HS7.10

Comparison of different variants of storm maximization method for Probable Maximum Precipitation estimation in changing climate 

Jaya Bhatt, Vemavarapu Venkata Srinivas, Vemavarapu Venkata Srinivas, and Vemavarapu Venkata Srinivas

Design and risk assessment of large hydraulic structures, whose failure can cause catastrophic damage to the environment, ecology, life and property, are based on Probable Maximum Precipitation (PMP). It is deemed as the theoretical upper bound of the maximum precipitation that is physically possible over a given area for a specified duration. The conventional approaches for estimating PMP are based on stationarity assumption, i.e., the current climatic conditions will remain unchanged even in the future. But the recent increase in extreme precipitation events across the globe and projected increase in the same for future climatic scenarios raises questions on the validity of the stationarity assumption. This issue has gained attention in recent years, and efforts have been directed towards improving existing approaches and devising novel methodologies that would yield reliable PMP estimates in changing climatic conditions. Several researchers have proposed different variations of the widely used storm maximization method to account for non-stationarities arising due to changing climate. The variations imbibe the potential change in PMP resulting either from the trend in precipitable water or from the complex interaction of drivers of PMP. There is a need to compare their relative performance to quantify if the improvement offered by complex variants is significant compared to simple variants in different parts of the globe. In this study, it is investigated through a case study on the frequent flood-prone Mahanadi River Basin in India. For this analysis, future projections of various atmospheric variables (e.g., precipitation, dew point temperature, precipitable water) were obtained from 5 GCMs (General Circulation Models) corresponding to two CMIP6 SSP (Coupled Model Intercomparison Project-6 Shared Socioeconomic Pathways) forcing scenarios namely, SSP1-2.6 and SSP5-8.5. The PMP estimates obtained from improved variants were also compared with their conventional stationary counterpart to assess the effect of dispensing the stationarity assumption.

How to cite: Bhatt, J., Srinivas, V. V., Srinivas, V. V., and Srinivas, V. V.: Comparison of different variants of storm maximization method for Probable Maximum Precipitation estimation in changing climate, EGU General Assembly 2023, Vienna, Austria, 23–28 Apr 2023, EGU23-453, https://doi.org/10.5194/egusphere-egu23-453, 2023.

EGU23-511 | ECS | Orals | HS7.10

Warming rates in a large subtropical shallow Brazilian lagoon 

Matheus Henrique Tavares, Maria Angélica Cardoso, David Motta-Marques, and Carlos Ruberto Fragoso Jr

Climate change impacts on lake surface water temperature (LSWT) have been mostly investigated in deep northern lakes, and are less understood in southern hemisphere shallow lakes. We evaluated the seasonal warming rates of a large (surface area c.a. 10000 km²) shallow choked lagoon in southern Brazil, with a 22 yr time series of MODIS-derived LSWT, and meteorological data. We found high LSWT warming, with a rate of 0.6°C dec-1 in spring and of 0.3°C dec-1 in summer. We also found a high correlation between water and mean air temperature trends, as well as a substantial shortening of the cold season. Spatially, there was some homogeneity in the warming rates but prominent point spatial differences, which may result from the variability of the tributaries’ temperature or discharge or decreased water transparency. The high warming rates found here are comparable to those found in deep northern lakes although the changes and processes of heating differ. The stronger warming in early spring can result in accelerated process rates and an earlier start of the phytoplankton growing season.

How to cite: Tavares, M. H., Cardoso, M. A., Motta-Marques, D., and Fragoso Jr, C. R.: Warming rates in a large subtropical shallow Brazilian lagoon, EGU General Assembly 2023, Vienna, Austria, 23–28 Apr 2023, EGU23-511, https://doi.org/10.5194/egusphere-egu23-511, 2023.

EGU23-634 | ECS | Posters on site | HS7.10

Stationarity assessment of hydroclimatic variables for a tropical river basin 

Achala Singh, Priyank Sharma, and Ramesh Teegavarapu

Understanding the space-time variations and dependency between hydroclimatic variables is vital for predicting future changes towards adaptive water resources management in a changing climate. Globally, it is observed that the mean and extreme hydroclimatic conditions are experiencing a significant shift under a changing climate, which affects the spatio-temporal distribution of floods and droughts. However, climate change studies seldom talk about the time invariance of the characteristics of a hydroclimatic time series. This research assesses the time invariance of the statistical properties of hydroclimatic variables (such as rainfall, temperature, streamflow and their derived indices) for a tropical river basin (i.e., the Tapi River basin) in India. Climate change profoundly impacts tropical river systems. Hence, assessing and detecting stationarity in hydrologic processes for such a river basin is imperative to predicting future changes. In this study, we have analyzed nine hydroclimatic variables representing the mean and extreme rainfall, temperature and streamflow. The hydroclimatic indices have been statistically examined to detect stationarity, homogeneity, and trends. A non-overlapping block stratified random sampling approach has been applied to identify the time invariance of hydroclimatic indices. The stationarity assessment approach investigates the similarities in the median, variance, distribution, and statistical moments of the continuous time series data. Based on the results of this study, weak and strict stationarity can be identified. The findings have significant ramifications for the planning and design of hydraulic structures, stormwater networks, flood mitigation, and disaster management for the Tapi basin.

How to cite: Singh, A., Sharma, P., and Teegavarapu, R.: Stationarity assessment of hydroclimatic variables for a tropical river basin, EGU General Assembly 2023, Vienna, Austria, 23–28 Apr 2023, EGU23-634, https://doi.org/10.5194/egusphere-egu23-634, 2023.

EGU23-2305 | ECS | Orals | HS7.10

Assessment of compound extremes using statistical methods in India 

Tapobeeva Sahoo, Vijaykumar Bejagam, and Ashutosh Sharma

Extreme events are becoming more frequent, intense, and prolonged, with significant impacts on human lives, the environment, and regional development. Rising temperature due to global warming is one the crucial factors causing the rise in the frequency and severity of extreme events. The worst extreme events are caused by a combination of more than one factor/variable, which makes it essential to study the co-occurrences of extremes, also known as compound extremes. In the present study, four compound extremes are assessed over India for the time period of 1971-2020 using two different statistical approaches, empirical approach, and multivariate distribution analysis. The variables used are temperature and precipitation, having a resolution of 0.25° × 0.25°. Firstly, the empirical analysis of four compound extremes, Hot-Dry, Hold-Wet, Cold-Dry, and Cold-Wet, is done by providing threshold percentiles (25th and 75th) to count the exceedance, and Mann Kendall's trend, p-value, and Sen's slope are calculated to assess the changes and significance of the extremes. Next, multivariate distribution analysis using Copula is conducted to study the dependency between temperature and precipitation. The results indicate a significant increase in compound Hot-Dry and Hot-Wet extremes across the country, with a decrease in Cold-Dry and Cold-Wet conditions. The changes in extremes are more pronounced in the later period (1996-2020) than in the earlier period (1971-1995). This study provides insight into the evaluation of compound extremes in India over the past 50 years, which can help us understand the changes and frequency of their occurrence.

How to cite: Sahoo, T., Bejagam, V., and Sharma, A.: Assessment of compound extremes using statistical methods in India, EGU General Assembly 2023, Vienna, Austria, 23–28 Apr 2023, EGU23-2305, https://doi.org/10.5194/egusphere-egu23-2305, 2023.

EGU23-3525 | Posters on site | HS7.10 | Highlight

Do observations show that rare extremes increase relatively more compared to common extremes? 

Ruud van der Ent, Maarten Doekhie, Mees Fokkema, Wenyu Zhou, Nick van de Giesen, and Gaby Gründemann

In a recent analysis of 25 CMIP6 models, Gründemann et al. (2022, https://doi.org/10.1038/s43247-022-00558-8) have shown that by the end of this century, daily land rainfall extremes could increase in magnitude between 10.5% and 28.2% for annual events (1 year return period), and between 13.5% and 38.3% for centennial events (100 year return period). The higher relative increase for larger return period was consistent for all climate models and scenarios. However, this study was solely based on model output and so far, this finding was not validated by observations. Using a large sample of stations with long time series, we analyzed whether the rare extremes have indeed been increasing relatively more because of global warming. Moreover, we analyzed sensitivity to the choice of time period, return period and rainfall duration.

How to cite: van der Ent, R., Doekhie, M., Fokkema, M., Zhou, W., van de Giesen, N., and Gründemann, G.: Do observations show that rare extremes increase relatively more compared to common extremes?, EGU General Assembly 2023, Vienna, Austria, 23–28 Apr 2023, EGU23-3525, https://doi.org/10.5194/egusphere-egu23-3525, 2023.

Identification and precise quantification of rainfall trend are crucial for researchers to understand the variations in rainfall over a longer period of time. On a global scale, climate change is influencing the intensity and frequency of rainfall, leading to extreme rainfall events. The expeditious and systematic consideration of rainfall changes is important in this context. In the given study, EMD-SSA, a hybrid data-adaptive multivariate multiscale method based on empirical mode decomposition (EMD) and singular spectrum analysis (SSA), is proposed to extract the non-linear trend present in the rainfall series. At the initial stage, EMD is applied to decompose the observed rainfall series into several intrinsic mode functions (IMFs) of different frequencies depicting trends and oscillatory patterns. Periodogram analysis of each IMF is performed by Lomb-Scargle spectral analysis to identify the important periodic signals and their period. These periods are considered suitable input (embedding dimension) to the SSA. The rainfall data is collected on a daily scale for the region of Mumbai, India, from NASA’s Prediction of Worldwide Energy Resource (POWER) archive from 1981–2020. The non-linear trend present in the rainfall is estimated by the EMD, SSA, and EMD-SSA methods. From the analysis, an increasing rainfall trend is observed in the Mumbai city, indicating more rainfall events in the future. Finally, the study suggests that a hybrid EMD-SSA is better than standalone EMD and SSA approach. In the future, the proposed EMD-SSA can also be applied to understand the variabilities in rainfall pattern with respect to the climate indices.


How to cite: Shejule, P. and Pekkat, Dr. S.: Non-linear Rainfall Trend Extraction Using Hybrid Empirical Mode Decomposition And Singular Spectrum Analysis, EGU General Assembly 2023, Vienna, Austria, 23–28 Apr 2023, EGU23-5363, https://doi.org/10.5194/egusphere-egu23-5363, 2023.

EGU23-6544 | ECS | Orals | HS7.10

A new prewhitening approach for trend analysis in the autocorrelated time series. 

Rahul Sheoran and Umesh C. Dumka

In combination with Sen's slope, the non-parametric Mann–Kendall (MK) test is one of the most often used statistical techniques for determining a time series' trends. A serially uncorrelated time series is required for the MK test since the autocorrelation in the dataset seriously affects the type 1 and type 2 errors and reduces the performance of the MK test in detecting the statically significant trend. To mitigate this problem, numerous prewhitening techniques (PW, PW-Cor, TFPW-Y, TFPW-WS, VCTFPW; See Collaud Coen et al., 2020) have been developed that effectively reduce lag-1 autocorrelation. In this work, we have proposed a new prewhitening scheme (named as TFPW-Mod) and compared it with previous prewhitening schemes by constructing 5000 linear-trend superimposed (β) AR1 time series with lag-1 autocorrelation (ρ1) using Monte Carlo simulation. We found that the new prewhitening approach keeps a very good balance between maintaining a low number of type 1 and type 2 errors. The results show that the occurrence of both types of errors largely depends on the length of the time series, with longer periods leading to a strong reduction of errors and to lower bias in the trend slope estimation. For weaker trends and/or the low number of samples, TFPW-Mod couldn’t restore the power of test. However, for a strong trend, this method yields the strongest power, almost independent of the lag-1 autocorrelation. The slope estimation of TFPW-Mod is robust for lower/Medium ρ1, but significantly deviates from the original trend for highly correlated time series. In most cases, βTFPW-Mod has lower RMSEs than βVCTFPW, and leads to the unbiased slope estimation with better accuracy.

How to cite: Sheoran, R. and Dumka, U. C.: A new prewhitening approach for trend analysis in the autocorrelated time series., EGU General Assembly 2023, Vienna, Austria, 23–28 Apr 2023, EGU23-6544, https://doi.org/10.5194/egusphere-egu23-6544, 2023.

EGU23-8992 | ECS | Orals | HS7.10

Exploring and investigating the performance of the global and regional climate models in precipitation over The Nile River basin 

Hadir Abdelmoneim, Sameh A. Kantoush, Mohamed Saber, Hossam M. Moghazy, and Tetsuya Sumi

Natural disasters like droughts and flood events have frequently been occurring due to climate change in the global pattern of precipitation in recent decades. Estimating the future spatiotemporal precipitation variability is necessary to mitigate climate change's impact, particularly extreme precipitation events. However, global and regional climate models typically vary on the projected change in precipitation characteristics over particular regions. Therefore, this study comprehensively evaluates historical and future climate models in terms of spatial distribution, annual cycles, and frequency distributions of precipitation over the Blue Nile basin (BNB) based on different statistical indices. Also, the autocorrelated time series data were subjected to the Mann-Kendall (MK) and Sen's slope estimator tests to identify trends. Many regional and global climate models, such as HadCM3, ECHAM5, MPI-ESM-LR, and EC-EARTH, are employed not only better to understand the discrepancy and the uncertainties of climate models but also to estimate the impact of climate change in the extreme precipitation events over the Blue Nile basin (BNB). Overall, our finding would serve as a benchmark for flood risk mitigation research and water resources management applications over the Blue River basin.

How to cite: Abdelmoneim, H., Kantoush, S. A., Saber, M., Moghazy, H. M., and Sumi, T.: Exploring and investigating the performance of the global and regional climate models in precipitation over The Nile River basin, EGU General Assembly 2023, Vienna, Austria, 23–28 Apr 2023, EGU23-8992, https://doi.org/10.5194/egusphere-egu23-8992, 2023.

EGU23-9458 * | ECS | Posters on site | HS7.10 | Highlight

Long term trends in the Bologna daily rainfall time series (1813-2020) 

Nicolò Montanari

The rainfall time series in Bologna is one of the longest daily precipitation records available.

Figure 1 presents the progress along time of cumulative annual rainfall during the observation period. Dating back to 1813 with no missing values, the time series spans over 208 years. As such, it offers a valuable opportunity to evaluate long term trends of rainfall statistics, thus offering information on past and recent precipitation changes.

In detail, we focus on the progress along time of annual and monthly precipitation as well as the annual and monthly maxima of daily precipitation, by applying linear regression. We also present an overview of historical long term droughts and estimate their frequency of occurrence by applying run theory. We also compare drought statistics of historical data with those of future climate scenarios recently presented by the literature.

The results highlight that the drought frequency is decreased in the past 50 years, while there is evidence of decreasing variability of annual rainfall during time, with no evident trend.

How to cite: Montanari, N.: Long term trends in the Bologna daily rainfall time series (1813-2020), EGU General Assembly 2023, Vienna, Austria, 23–28 Apr 2023, EGU23-9458, https://doi.org/10.5194/egusphere-egu23-9458, 2023.

Both climate change and intensified urban development will affect the temporal and spatial distribution of rainfall. There is still a lack of relatively quantitative and comparative studies. Most cities in China entered the rapid urbanization stage around 2000. This study focuses on the megacities Beijing, Shenzhen and Hong Kong. Based on rainfall observation data and land use and other remote sensing image data, this study investigates the impacts of the impervious areas on the temporal and spatial changes of short-duration and long-duration heavy rainfall before and after rapid urbanization. The impact of climate change on rainfall intensity is also analyzed. The results show that there are huge spatial shifts in rainfall after rapid urbanization. For example, it is observed that the center of the heavy rainfall shifts from northeast to southwest, and the hydrological homogenous areas in Beijing have increased from two to three after rapid urbanization. Meanwhile, with the influence of climate change, the intensity of rainfall is increasing, but due to urbanization, the increase varies greatly in each hydrological homogenous area. Shenzhen and Hongkong, the neighbor cities without physical boundaries, have entered into different urbanization stages since 1990. Hong Kong has developed very slowly, while Shenzhen has developed very rapidly. As a result, the short-duration heavy rainfall is mainly concentrated in Shenzhen, and the long-duration heavy rainfall is mainly concentrated in Hongkong. The short-duration heavy rainfall in Shenzhen mostly occurs at noon, while that in Hong Kong mostly occurs in the morning. The urbanizations of Hong Kong and Shenzhen are different, which resulted in different impacts on rainfall in these two cities. This study examines the impact mechanisms of urbanization and climate change on rainfall in cities in different climate zones. It provides scientific basis in supporting the city planning and the development of resilient cities.

How to cite: Huang, J. J.: The study of the changes in precipitation induced by intensified urbanization and climate change by observational records, EGU General Assembly 2023, Vienna, Austria, 23–28 Apr 2023, EGU23-10274, https://doi.org/10.5194/egusphere-egu23-10274, 2023.

EGU23-10305 | ECS | Orals | HS7.10

Observed trends in the snow-to-liquid precipitation ratio over Romania 

Vlad-Alexandru Amihăesei, Dana Magdalena Micu, Alexandru Dumitrescu, Sorin Cheval, Marius-Victor Bîrsan, and Lucian Sfîcă

In the regions with temperate climate, solid precipitation usually prevails during the winter time. However, a warming climate could alter the timing of snow accumulation and resulted amounts with major impact on the hydrological cycle. This study analyses the changes in the monthly snow-to-liquid precipitation ratio (SLPR)  over the October-May interval in Romania, based on daily precipitation, air temperature and snow depth data provided by 114 weather stations from the national meteorological monitoring network, over the 1961-2021 period. The observed trends showed a country-wide and significant decline in SLPR. The most notable decline is observed during the late winter and early spring months (February-March), with decreasing trends at over 70% of the weather stations, although only 20% suggest statistically significant changes (p value < 0.05). The autumn months (October and November) depict no statistically trends. The trends observed in the late spring (April and May), show a strong decline in SLPR for most mountain weather stations (above 1,000 m), at rates that could exceed 5% per decade (e.g., Tarcu weather station, 2,200 m, the Southern Carpathians). Evidence of elevation dependency of SLPR trends has been found in spring. The results show that the SLPR declines with altitude, especially in April (R2 = .30) and May (R2 = .67), when the correlations are statistically significant (p<0.05).

This work was co-funded by the European Social Fund, through Operational Programme Human Capital 2014-2020, project number POCU/993/6/13/153322, project title  “Educational and training support for PhD students and young researchers in preparation for insertion into the labor market”.


How to cite: Amihăesei, V.-A., Micu, D. M., Dumitrescu, A., Cheval, S., Bîrsan, M.-V., and Sfîcă, L.: Observed trends in the snow-to-liquid precipitation ratio over Romania, EGU General Assembly 2023, Vienna, Austria, 23–28 Apr 2023, EGU23-10305, https://doi.org/10.5194/egusphere-egu23-10305, 2023.

EGU23-10952 | ECS | Orals | HS7.10

Trend Analysis and Forecasting of Streamflow in the Upper Narmada Basin using Random Forest (RF) and Long Short-Term Memory (LSTM) Models 

Siddik Barbhuiya, Meenu Ramadas, Suraj Jena, and Shanti Biswal

In order to effectively plan, design, and manage water resources, it is necessary to understand the trends present in hydro-climatic variables such as streamflow and rainfall. In this study we used the Pettitt’s test as well as the standard normal homogeneity test (SNHT) to discover the trends in streamflow in the Upper Narmada Basin during the 1990 to 2018 period. The Upper Narmada basin extends over an area of 45, 580 square kilometers lies between latitudes 21°20’ N and 23°45' N and longitudes 72°32' E and 81°45’ E in India. From the flow records from gauges in this study basin, change points in the flow regime are thus identified.

Additionally, we performed Mann–Kendall (MK) test, modified Mann–Kendall (MMK) test, Sen's slope (SS) analysis to quantify the trends in streamflow time series. While the MK and MMK tests determine whether a trend is monotonically increasing or decreasing over time, SS suggests the rate of temporal change of streamflow variable. Further, we used advanced machine learning algorithms such as random forest (RF) and long short-term memory (LSTM) to develop flow forecasting models for few gauging sites in the study basin. In this way it is possible to address gaps in the flow records and perform long term analysis of gauge data.

Keywords: Trend analysis, Change point detection, Machine Learning Algorithm, LSTM, Upper Narmada Basin


How to cite: Barbhuiya, S., Ramadas, M., Jena, S., and Biswal, S.: Trend Analysis and Forecasting of Streamflow in the Upper Narmada Basin using Random Forest (RF) and Long Short-Term Memory (LSTM) Models, EGU General Assembly 2023, Vienna, Austria, 23–28 Apr 2023, EGU23-10952, https://doi.org/10.5194/egusphere-egu23-10952, 2023.

EGU23-11523 | ECS | Orals | HS7.10

An innovative approach to discern variation in long-term regional monsoonal rainfall trend in North Eastern India. 

Swagatika Chakra, Harsh Oza, Akash Ganguly, Virendra Padhya, Amit Pendey, and Rajendra Dattatray Deshpande

The global hydrological cycle is changing in response to climate change and anthropogenic influence. The rainfall, on an annual or sub-decadal timescale, has exhibited erratic and substantial deviation from the long-term average in different parts of the world. Consequently, there are epochs of higher or lower than average rainfall but these are missed in long-term monotonic trend.

As commonly experienced, the rainfall within different geographical regions also varies significantly in terms of magnitude and timing, and on a smaller spatial scale. Integrating large geographical areas and long timescales for monotonic rainfall trend analyses for the meteorologically homogenous regions provides a general picture which is useful for the purpose of administration, water management and distribution. However, it cannot discern the decadal to multi-decadal rainfall variation in different parts of a meteorologically homogenous region and hence a more advanced and comprehensive approach is required for advancing scientific understanding about the hydrometeorological processes and factors governing multi-decadal rainfall variation.

In this study, an innovative approach is presented which involves: (1) 31 years moving average of percentage departure of seasonal rainfall for 120 years at district level; (2) 15 year sliding slope analyses to identify the year of inflection point based on change in direction of slope; (3) K-Means cluster analyses; (4) normality test of clusters based on Z score; and determination of timeframe during which rainfall trend changed significantly.

This approach was tested in the North East India where the rainfall is derived by one of the most dynamic and complicated meteorological systems. Improving understanding about rainfall variability in Northeast India is also very important from ecological, environmental and strategic point of views. Using the above approach, long-term rainfall data (1901-2020) has been analyzed at a district level in Northeast India. Using K means clustering method time windows of prominent change in rainfall trend have been identified. It is inferred from this study that Northeast India has experienced three major climatological events, during 1929-1941, 1961-1971, and 1984-1992. The first and the third events involving a trend reversal from increasing to decreasing nature around 1929-1941 and 1984-1992 affected respectively 49% and 43% area of Northeast India. The second event involving a trend reversal from decreasing to an increasing trend around 1961-1971 impacted 38% of northeastern India.

The meteorological processes corresponding to these timeframes, which could have caused these major rainfall trend reversals are being examined.

How to cite: Chakra, S., Oza, H., Ganguly, A., Padhya, V., Pendey, A., and Deshpande, R. D.: An innovative approach to discern variation in long-term regional monsoonal rainfall trend in North Eastern India., EGU General Assembly 2023, Vienna, Austria, 23–28 Apr 2023, EGU23-11523, https://doi.org/10.5194/egusphere-egu23-11523, 2023.

EGU23-11599 | ECS | Posters on site | HS7.10 | Highlight

Global trends of vegetation leaf moisture content and extreme weather since the 1980s 

Luisa Schmidt, Wantong Li, and Matthias Forkel

Climate change leads to a change of precipitation frequency and quantity as well as to increased temperature inducing extreme weather events like floods but also more intensive and longer drought periods.

The response of the vegetation to these trends is of high interest because vegetation regulates interception, transpiration and is a water storage which is important for plant productivity, agriculture, carbon cycling and the danger of wild fire occurrence. Reduced precipitation in combination with increased temperature lead to water stressed vegetation which might not only behave different in regards of evapotranspiration but are also prone to wildfires. However, currently we don’t know how the water status changes in the long-term. A long-term time series of the vegetation leaf moisture content can help to understand the consequences of changing environmental conditions on the vegetation layer as part of the water as well as the carbon cycle.

Measurements of vegetation leaf moisture are usually only available for single test-sites (missing spatial coverage), often measured for a short time span and might hold missing data. Estimations of vegetation leaf moisture are able to provide consistent time series but are mostly done on regional scale which are also missing spatial transferability. However, long-term data with a consistent time series and large spatial coverage are necessary to address a reliable time series analyses in the context of climate change.

Our trend analysis will focus on the live-fuel moisture content (LFMC) which is based on the vegetation optical depth (VOD) and Leaf Area Index (LAI). LFMC is defined as the water mass of living vegetation to the dry mass of the vegetation, usually expressed in percentage. LFMC is an important variable in the field of wild fire analyses as it is one of the key predictors for risk and development of a fire. LFMC can be estimated on ecosystem level due to its independence of plant type. Here we use VODCA VOD and GLOBMAP LAI data to create a longer time series of LFMC for the period 1988-2017 on global scale to analyse temporal changes in LFMC. Initial results indicate a heterogeneous pattern of LFMC trends which depend on land cover type, e.g., with a decreasing trend for shrublands but an increasing trend for needle-leaved forests. We compare the trends in LFMC with trends in heat and drought events as well as fire weather indices. Inter-annual changes in LFMC correspond to multi-year drought events.

How to cite: Schmidt, L., Li, W., and Forkel, M.: Global trends of vegetation leaf moisture content and extreme weather since the 1980s, EGU General Assembly 2023, Vienna, Austria, 23–28 Apr 2023, EGU23-11599, https://doi.org/10.5194/egusphere-egu23-11599, 2023.

EGU23-11681 | ECS | Posters virtual | HS7.10 | Highlight

Development of gridded monthly reference evapotranspiration dataset for Germany for long term trend analysis 

Daneti Arun Sourya and Meenu Ramadas

Estimation of reference evapotranspiration (ETo) is necessary for hydrological modeling, water stress adaptation and agricultural water management. While numerous studies have addressed changes in temperature and precipitation patterns at different spatiotemporal scales for assessing hydroclimatic variability, similar analyses on regional evapotranspiration trends are limited. This can be attributed to lack of observed records of ETo at regional scales, and highlights the need for developing better models for estimating this variable. To address this research gap, we developed monthly 0.5° gridded ETo dataset for entire Germany using machine learning techniques and then investigated the temporal trends in ETo over the region. We utilized flux tower data (sensible heat flux, net radiation, soil heat flux, and latent heat flux) from multiple locations in the region to compute observed ETo using the surface energy balance method. Then, fed-forward back-propagation method (BPNN) is used for predicting monthly ETo with easily available input predictors such maximum temperature, minimum temperature, precipitation, soil moisture, short wave radiation, and wind speed. The BPNN is trained with various input combinations in order to estimate ETo with minimal input predictors, and their performance is assessed using metrics: coefficient of determination, mean absolute error, and root mean square error. The results showed that with all the input parameters, the coefficient of determination  for training and testing are 0.89 and 0.93 respectively, while the best parsimonious model (precipitation and downward shortwave radiation as predictors) gives 0.88 and 0.93 respectively. Gridded ETo estimated using the best parsimonious model is then used for assessing spatially varying trends in the variable at monthly and annual time scales over Germany using Mann-Kendall test and Sen’s slope. The long term analysis helps us to identify critical regions in the study area that needs attention for water resources management, drought mitigation and improved adaptation to changing climate.

Keywords: Reference Evapotranspiration, Flux Tower, Surface Energy Balance, Feed Forward Back Propagation (BPNN), Trend Analysis, Mann-Kendall Test

How to cite: Sourya, D. A. and Ramadas, M.: Development of gridded monthly reference evapotranspiration dataset for Germany for long term trend analysis, EGU General Assembly 2023, Vienna, Austria, 23–28 Apr 2023, EGU23-11681, https://doi.org/10.5194/egusphere-egu23-11681, 2023.

EGU23-12596 | ECS | Orals | HS7.10 | Highlight

Estimation of global extreme temperature trends by merging Annual Maxima and Peaks Over Threshold 

Sofia Nerantzaki, Simon Michael Papalexiou, ‪Chandra Rupa Rajulapati, and Martyn Clark

Annual Maxima (AM) and Peaks over Threshold (POT) are the two most common approaches to define extreme time series in hydroclimatic variables. Both methods present limitations. AM frequently fails to include significant extremes that occur during the same year. Conversely, POT may only include clustered values from a few years thus excluding many years from the analysis, especially when the threshold is set high. Additionally, a big challenge in POT is identifying the threshold which can markedly affect the results.

Here, we merge notions from both AM and POT, preserving the strengths of each approach, to extract extreme temperature series and estimate the trends in their frequency and magnitude. We select the values larger than or equal to the minimum of the AM series as high temperatures (HT) (lower than or equal to the maximum of the Annual Minima as the low temperatures – LT). Thus, each year of the HT, LT series has at least one extreme value (H1, L1). We apply the method to 4797 quality-controlled raw station observations from a global dataset of maximum and minimum temperatures over 1970-2019 when warming accelerates. To examine changes in H1-L1 frequency and magnitude, we estimate the ratio of observed to expected H1 (L1) annual occurrences, and the difference between the observed and expected mean H1 (L1) annual temperature values, respectively. We estimate the regression slopes of these ratios at the station level, regionally in 2°×2° grids, and globally. We then compare these trends with the ones obtained from AM and POT series. The proposed method adapts the threshold for each sample, and finds a compromise among all tested methods, thus being a flexible approach that can be applied to any non-intermittent variable.


Acknowledgment

This research was supported by a GWF Ph.D. Excellence Scholarship from the Global Institute for Water Security (GIWS), University of Saskatchewan

How to cite: Nerantzaki, S., Papalexiou, S. M., Rajulapati, ‪. R., and Clark, M.: Estimation of global extreme temperature trends by merging Annual Maxima and Peaks Over Threshold, EGU General Assembly 2023, Vienna, Austria, 23–28 Apr 2023, EGU23-12596, https://doi.org/10.5194/egusphere-egu23-12596, 2023.

EGU23-13123 | Posters on site | HS7.10

Stationarity Assessment of Precipitation and Temperature Extremes in the Continental United States 

Ramesh Teegavarapu, Priyank Sharma, and Diego Li

Stationarity assessments of annual extremes of monthly precipitation and minimum, average, and maximum temperatures at over 1200 sites in the U.S. are carried out using a nonoverlapping block stratified random sampling approach. The approach uses random partitioning of the time series into several blocks to assess different forms (i.e., weak, strong) of stationarity using nonparametric two-sample and multi-sample hypothesis tests. This approach's assessment of stationarity is compared with those derived from nonparametric Spearman’s rank correlation and variants of Mann-Kendall tests considering seasonality and autocorrelation. Monthly data of precipitation and temperature obtained from the United States Historical Climatology Network (USHCN) for the period 1910-2019 are used for this analysis. Tests (e.g.,  Augmented Dickey-Fuller (ADF) and Kwiatkowski-Phillips-Schmidt-Shin (KPSS)) specifically geared for stationarity assessments in econometrics and time series forecasting are also used for comparative assessment. Discrepancies in assessments from the nonparametric tests, ADF and KPSS, and nonoverlapping random sampling approach are noted in the number of sites. The random sampling approach used in the current study provides a robust assessment of stationarity considering the different characteristics of the hydroclimatic time series.

How to cite: Teegavarapu, R., Sharma, P., and Li, D.: Stationarity Assessment of Precipitation and Temperature Extremes in the Continental United States, EGU General Assembly 2023, Vienna, Austria, 23–28 Apr 2023, EGU23-13123, https://doi.org/10.5194/egusphere-egu23-13123, 2023.

EGU23-14073 | ECS | Posters on site | HS7.10

Comparison and Future Projection for Rainfall Quantile based on CMIP6 and CMIP5: Focusing on the Seomjingang River Basin 

Sunghun Kim, Heechul Kim, Ju-Young Shin, and Jun-Haeng Heo

This study attempts to estimate the extreme rainfall quantiles using the Intergovernmental Panel on Climate Change (IPCC)'s latest Coupled Model Intercomparison Project Phase 6 (CMIP6) and Coupled Model Intercomparison Project Phase 5 (CMIP5) models. In general, applied climate change research is carried out using numerical simulation data from various general climate models (GCMs). In this study, the precipitation data were obtained from CMIP5 and CMIP6 webpages of the World Climate Research Programme (WCRP). For the same GCM models, the Representative Concentration Pathways (RCP) scenarios (RCP4.5, RCP8.5) and Shared Socioeconomic Pathways (SSP) scenarios (SSP2-4.5, SSP5-8.5) were compared. The simple quantile mapping (SQM) method was applied for bias correction, and the at-site frequency analysis was performed for rainfall quantile estimation. In addition, the L-moments approach was applied to estimate the parameters, and the generalized extreme value (GEV) distribution was employed as the appropriate probability distribution. As a result, rainfall quantiles were estimated for each same GCM, and the change effects of different scenarios in the study area were quantitatively compared.

How to cite: Kim, S., Kim, H., Shin, J.-Y., and Heo, J.-H.: Comparison and Future Projection for Rainfall Quantile based on CMIP6 and CMIP5: Focusing on the Seomjingang River Basin, EGU General Assembly 2023, Vienna, Austria, 23–28 Apr 2023, EGU23-14073, https://doi.org/10.5194/egusphere-egu23-14073, 2023.

Historical streamflow reconstruction based on the pre-instrumental data for rivers in Tibet can provide long-term perspectives on the impact of the climate change in the Third Pole on Earth.  We use the VIC model to reconstruct the yearly, monthly and daily streamflow of Lhasa River during the past 5 centuries (1473~2017). Compared with the recent 60 years, the past 500 years have 11% more average annual runoff. Signals of long-term variations have been detected including a 60 years cycle and decades of continuous wet/dry years. The streamflow shows almost 50% higher annual and daily maximum runoff and highly variable in the 16th and 17th centuries, and decreased and more stable runoff thereafter till the present. These findings conform to the understanding of climate change in this area: the combined effects of Indian Summer monsoon and mid-latitude Westerlies, and confirms the potential of exploring the historical streamflow features using the VIC model and paleo-climate data. They also reveal the limitation of the recent instrumental records for understanding the long-term hydrological behavior of rivers in Tibet.

How to cite: Zeng, J., Fu, X., and Hu, H.: Streamflow reconstruction and its long-term variation characteristics in Lhasa River Basin over the past 5 centuries (1473~2017), EGU General Assembly 2023, Vienna, Austria, 23–28 Apr 2023, EGU23-15368, https://doi.org/10.5194/egusphere-egu23-15368, 2023.

HS8.1 – Subsurface hydrology – General sessions

EGU23-142 | ECS | Posters on site | HS8.1.1

Aggregation Kinetics and Stability of Biodegradable Nanoplastics: Effects of Weathering and Proteins 

Yingxue Yu, Markus Flury, Anton Astner, Douglas Hayes, Tahsin Zahid, and Indranil Chowdhury

Plastic pollution caused by conventional plastics has promoted the development and application of biodegradable plastics. However, biodegradable plastics do not degrade readily in water, instead, they can generate countless micro- and nanoplastics. Compared to microplastics, nanoplastics are more likely to cause negative impacts to the aquatic environment due to their smaller size. The impacts of biodegradable nanoplastics highly depend on their aggregation behavior and colloidal stability, which still remain unknown. Here, we studied the aggregation kinetics of polybutylene adipate co-terephthalate (PBAT) nanoplastics in both NaCl and CaCl2 solutions before and after artificial weathering. We further studied the effect of proteins on aggregation kinetics with both negatively charged bovine serum albumin (BSA) and positively charged lysozyme (LSZ). We found that divalent cations (Ca2+) destabilized PBAT nanoplastics more aggressively than monovalent cations (Na+); weathering stabilized PBAT nanoplastics profoundly, with no aggregation observed in NaCl nor in CaCl2; both BSA and LSZ promoted the aggregation of pristine PBAT nanoplastics, with LSZ showing more pronounced effect. These results suggest that biodegradable nanoplastics, especially weathered biodegradable nanoplastics, are highly stable in the aquatic environment.

How to cite: Yu, Y., Flury, M., Astner, A., Hayes, D., Zahid, T., and Chowdhury, I.: Aggregation Kinetics and Stability of Biodegradable Nanoplastics: Effects of Weathering and Proteins, EGU General Assembly 2023, Vienna, Austria, 23–28 Apr 2023, EGU23-142, https://doi.org/10.5194/egusphere-egu23-142, 2023.

EGU23-196 | ECS | Posters on site | HS8.1.1

Foam Composition and Surfactant Sources in an Urban Foaming Lake: A Comprehensive Analysis 

Reshmi Das, Chanakya Hoysall, and Lakshminarayana Rao

Foaming of surface water bodies is a common concern of many major metropolitan cities globally. These hideous and persistent foams disturb aquatic ecosystems and also emit an obnoxious stench. These foams also overflow onto the surrounding roads, causing pedestrians discomfort and traffic disruption. Even though foaming of the aquatic system is a widespread phenomenon, it is not entirely scientifically understood yet. The central unexplored question in this domain is - what compounds make up a foam? To answer this question, it is vital to understand the physics of foaming, the properties of a compound that helps in foaming, and its chemical/physical influence on the distribution of other compounds and species in a water body.

 Foam is caused by surface-active compounds called surfactants. In aquatic environments, the surfactants may be either endogenous or anthropogenic in origin. In nutrient-rich waterbodies, decaying plants and microorganisms can be a potential endogenous source of surfactants. Commercially used surfactants in households and industries find their way into the aquatic ecosystem through untreated effluents discharged after anthropogenic activities. These foams, by the mechanism of foam fractionation, also tend to enrich many organic and inorganic compounds into the foam phase. Enrichment might lead to precariously high concentrations of surface-active contaminants in the foam phase, which would otherwise be within acceptable levels in bulk lake water. Thus, foam not only has surfactants but also has other enriched chemical compounds in it.

This work aims to identify those compounds in foam, focusing on sewage-fed Bellandur lake in India, which has been infamous for foaming for the past decade and understand their environmental implications. Bellandur Lake has anionic surfactant concentrations reaching up to 20 mg/l and surface tension as low as 45 mN/m. The Lake is eutrophied, with chlorophycean algae concentration reaching up to 13.8×10⁷ cells/mL of Lake water. The scope of this study is as follows:

  • to assign relative flux to surfactants from various sources and identify the most significant contributor to foaming events;
  • to estimate the relative difference in concentrations of contaminants in bulk liquid and foam phase and predict the possibility of an impending threat, if any.

This study thus provides an opportunity for a better understanding of the foaming pattern, which is essential to prevent the occurrence of such foaming events in future.

How to cite: Das, R., Hoysall, C., and Rao, L.: Foam Composition and Surfactant Sources in an Urban Foaming Lake: A Comprehensive Analysis, EGU General Assembly 2023, Vienna, Austria, 23–28 Apr 2023, EGU23-196, https://doi.org/10.5194/egusphere-egu23-196, 2023.

EGU23-813 | Posters on site | HS8.1.1 | Highlight

Identifying wastewater pollutants from pharmaceutical residues and xenobiotic contaminants in Indian secondary cities 

Shubham Kumar, Indra Mani Tripathi, and Pranab Kumar Mohapatra

Emerging contaminants are becoming more prevalent in the environment. The consequences of emerging contaminants on the urban environment and living being's health are poorly understood by society. Pharmaceutical compound removal is not considered in designing a conventional sewage treatment facility. Instead, they were primarily concerned with organic and bacterial removal. Molecules containing xenobiotics whose physicochemical characteristics, such as small molecular size, water solubility, ionizability and volatility, make it challenging to identify, quantify, and degrade these complex chemicals. In the present study, we will take samples from Surface Water (SW) and Wastewater Treatment Plants (WTP) in the fast-growing Indian secondary cities (Bhopal, Bhuj and Kozhikode). We use analytical methods, including High-Performance Liquid Chromatography (HPLC) and Gas Chromatography (GC) coupled with Mass Spectrometry (MS) to identify these compounds. The mentioned techniques have the potential to characterise complex environmental chemicals at low concentrations. In addition, Wetlands Construction can be an alternative and affordable technology for emerging compound treatment that performs satisfactorily for a variety of sewage types, including domestic sewage and wastewater. Our study identifies the contaminants present in the environment and the most popular analytical techniques for identifying and quantifying these compounds. We also present some potential solutions for the treatment of compounds by fusing several other technologies. This shows that in order to lessen or stop the deposition of these compounds into the environment, sewage treatment technologies need to be investigated and combined.

How to cite: Kumar, S., Tripathi, I. M., and Mohapatra, P. K.: Identifying wastewater pollutants from pharmaceutical residues and xenobiotic contaminants in Indian secondary cities, EGU General Assembly 2023, Vienna, Austria, 23–28 Apr 2023, EGU23-813, https://doi.org/10.5194/egusphere-egu23-813, 2023.

With the increasing research on particles and biocolloids in terrestrial and aquatic systems, the transport and deposition of particles and biocolloids in porous media has become an important research topic. Based on the transport and deposition experiments of heavy metal pollutants and suspended-colloidal particles (SPs) in porous media, a nonlinear attachment-detachment model with adsorption hysteresis is proposed, which uses an adsorption function and scanning desorption isotherms to model the deposition effect of SPs. The reaction rate constant related to hysteretic characteristics essentially reflects the nonequilibrium hydrodynamic process during the transport of SPs. Static deposition tests and column experiments with pulse injection are used to calibrate the transport parameters. Column penetration experiments are performed under variable injection concentrations and seepage velocities. The results show that there is good agreement between simulated and experimental breakthrough curves (BTCs).

This model shows that increasing or decreasing the seepage velocity results in substantial changes in the penetration concentration of SPs, which is closely related to the adsorption hysteresis and the deposition dynamics of SPs. When the injection concentration is increased, the effluent concentration clearly increases, which reflects a nonlinear deposition process. In contrast, with a decrease in the injection concentration, the release effect of the already deposited SPs prolongs the penetration process, which is also related to the hysteresis. Previously proposed linear attachment-detachment models probably result in an overestimation of the adsorption capacity of porous media.

How to cite: Bai, B., Wu, H., and Bai, F.: A nonlinear attachment-detachment model with adsorption hysteresis for suspension-colloidal transport, EGU General Assembly 2023, Vienna, Austria, 23–28 Apr 2023, EGU23-1194, https://doi.org/10.5194/egusphere-egu23-1194, 2023.

The wide application of industrial and consumer product leads to the ubiquitous presence of PFOA (an anionic surfactant) in natural environments. PFOA could interact with microplastics (one emerging pollutants abundant in environments) and the transport of both PFOA and microplastics thus might be altered. The cotransport behaviors of PFOA with micron-sized plastic particles (MPs) with different surface charge (both negative and positive surface charge) in porous media in both 10 and 50 mM NaCl solutions were investigated in present study. Both types of MPs (negatively charged carboxylate-modified MPs (CMPs) and positively charged amine-modified MPs (AMPs)) could adsorb PFOA onto MPs surfaces which decreased PFOA transport with MPs co-present in suspensions under both solution conditions examined. PFOA had diverse impact on the transport behaviors of CMPs and AMPs. Specifically, PFOA decreased the transport of CMPs, while increased the transport of AMPs when PFOA was copresent in suspensions. The mechanisms driving to the changed transport of two types of MPs induced by PFOA were found to be different. The decreased electrostatic repulsion of CMPs due to the adsorption of PFOA onto CMPs surfaces led to the decreased transport of CMPs when PFOA was copresent. The increased electrostatic repulsion due to the adsorption of PFOA onto AMPs surfaces as well as the steric repulsion induced by suspended PFOA caused the enhanced AMPs transport with PFOA in solutions. The results of this study show that when PFOA and microplastics are copresent in natural environments, their interaction with each other will alter their transport behaviors in porous media, and the alteration is highly correlated with the surface charge of MPs.

How to cite: Rong, H. and Tong, M.: Cotransport of PFOA with Different Electrically Charged Plastic Particles in Saturated Porous Media, EGU General Assembly 2023, Vienna, Austria, 23–28 Apr 2023, EGU23-1651, https://doi.org/10.5194/egusphere-egu23-1651, 2023.

The release of microplastics (MPs) especially those with sizes less than 10 μm from effluent of wastewater treatment plants (WWTPs) is one of the major sources of plastics into aquatic environment. To reduce the discharge of MPs into environment, it is essential to further enhance their removal efficiencies in WWTPs. In present study, to boost the removal performance of MPs in sand filtration systems (units that commonly employed in WWTPs to remove colloidal pollutants), six types of biochar fabricated from three raw biomass materials (i.e. lignin, cellulose, and woodchips) at two pyrolysis temperatures (400 °C and 700 °C) was respectively amended into sand columns as thin permeable layer. We found that adding all six types of biochar into sand columns as thin permeable layer could greatly improve the retention of MPs with the diameter of 1 μm under either slow (4 m/d) or fast flow rates (160 m/d) due to the high adsorption capability of biochar. Woodchip-derived biochar exhibited the highest MPs retention performance, which was followed by cellulose-derived biochar and then lignin-derived biochar. Moreover, for biochar derived from three raw biomasses, increasing pyrolysis temperature could improve MPs retention performance. The direct observation of real-time plastics retention processes on different types of biochar via a visible flow chamber showed that woodchip-derived biochar especially that fabricated at 700 °C exhibited more MPs trapping processes relative to lignin and cellulose-derived biochar due to their more complex surface morphology. Thus, the highest MPs retention performance was achieved in sand columns with amendment by 1 wt% woodchip-derived biochar fabricated at 700 °C. More importantly, we found that for these modified sand filtration column systems, complete MPs removal could be achieved in real river water and actual sewage water, in multiple filtration cycles, longtime filtration process (100 pore volumes injection) as well as with interval flow conditions. Moreover, biochar could be regenerated and reused as thin permeable layer to effectively remove MPs. The results of this study clearly showed that biochar especially woodchip-derived biochar fabricated at 700 °C had the potential to immobilize MPs especially those with small sizes in WWTPs.

How to cite: Hsieh, L. and Tong, M.: Addition of biochar as thin preamble layer into sand filtration columns could improve the microplastics removal from water, EGU General Assembly 2023, Vienna, Austria, 23–28 Apr 2023, EGU23-1771, https://doi.org/10.5194/egusphere-egu23-1771, 2023.

EGU23-2118 | Posters on site | HS8.1.1

Transport of thiophanate methyl in porous media in the presence of titanium dioxidenanoparticles 

Constantinos V. Chrysikopoulos, Anthi S. Stefanarou, Vasileios E. Katzourakis, and Anastasios A. Malandrakis

This study investigates the transport of pesticide thiophanate methyl (TM) as well as the co-transport of TM and titanium dioxide (TiO2) nanoparticles in a water saturated column packed with quartz sand under various water conditions. Several ionic strengths (Is) (1, 10, 50 and 100 mM) and pH (3, 5, 7, 10) values were examined. The results from the transport experiments  were fitted and analyzed with the use of the ColloidFit software, while the results from cotransport experiments were fitted with a modified mathematical model of Katzourakis and Chrysikopoulos (2015). The results suggested that the lowest mass recovery rate was for the co-transport experiments with the addition of NaCl. It was shown that TM has a weak affinity for sand but a relatively strong affinity for TiO2 at high Is and acidic pH. Furthermore, salinity was shown to have significant effects on TM removal.

How to cite: Chrysikopoulos, C. V., Stefanarou, A. S., Katzourakis, V. E., and Malandrakis, A. A.: Transport of thiophanate methyl in porous media in the presence of titanium dioxidenanoparticles, EGU General Assembly 2023, Vienna, Austria, 23–28 Apr 2023, EGU23-2118, https://doi.org/10.5194/egusphere-egu23-2118, 2023.

EGU23-2570 | ECS | Orals | HS8.1.1

Zinc nanoparticles combat boscalid-resistance in Alternaria alternata 

Anastasios Malandrakis, Nektarios Kavroulakis, and Constantinos Chrysikopoulos

The potential of ZnO nanoparticles (NPs) to control Alternaria alternata isolates resistant to the succinate dehydrogenase inhibitor (SDHI) boscalid was evaluated both in vitro and in vivo. ZnONPs could effectively inhibit mycelial growth and suppress disease symptoms in both boscalid sensitive (BOSC-S) and resistant (BOSC-R) isolates. A high synergistic effect against BOSC-S and BOSC-R isolates was observed when ZnO-NPs was combined with boscalid both in vitro and when applied in artificially inoculated tomato fruit. The positive correlation between nanoparticles and their ionic counterpart ZnSO4 and the neutralization of the ZnO-NPs fungitoxic action in the presence of EDTA suggested that zinc ion release is the most probable fungitoxic mechanism of ZnO-NPs. The disruption of cellular ion homeostasis mechanisms by zinc NPs could account for the enhanced effectiveness of ZnO-NPs against A. alternata  compared to ZnSO4. ATP-dependent ion efflux and ROS production could contribute to the fungitoxic action of ZnO-NPs as indicated by bioassays with ATP- and antioxidant-inhibitors. Boscalid acting as a “capping” agent for ZnO-NPs, significantly reducing NPs mean size, probably accounted for the synergy observed against BOSC-S and BOSC-R isolates. Concluding, ZnO-NPs are effective against A. alternata both alone or in mixtures with boscalid, and can be used as an effective, eco-compatible anti-resistance tool for reducing the environmental footprint of synthetic fungicides.

How to cite: Malandrakis, A., Kavroulakis, N., and Chrysikopoulos, C.: Zinc nanoparticles combat boscalid-resistance in Alternaria alternata, EGU General Assembly 2023, Vienna, Austria, 23–28 Apr 2023, EGU23-2570, https://doi.org/10.5194/egusphere-egu23-2570, 2023.

EGU23-2785 | ECS | Orals | HS8.1.1

Thermal impact of underground car parks on groundwater 

Maximilian Noethen, Hannes Hemmerle, Susanne Benz, Kathrin Menberg, Jannis Epting, Philipp Blum, and Peter Bayer

In addition to the continuous increase of groundwater temperatures due to global warming, heat losses from infrastructure, (underground) buildings and geothermal use lead to thermal anomalies on regional to local scales. Often, these local heat accumulations (hot spots) of groundwater temperatures are associated with underground car parks (UCP). They represent sizeable infrastructures that are typical for densely built-up areas and are numerous in many cities. Unlike regular basements, they often reach beneath the groundwater table and heat up due to frequent traffic. They therefore act as heat sources for groundwater. By analysing long-time data from 31 sites in Germany, Austria, and Switzerland, we discovered seasonally varying heat flux intensities and even directions. While all UCPs heat the groundwater during the warm period, most UCPs cool the groundwater in the cold period. Only few act as continuous heat source all year round. We also discuss characteristics and their influence on the temperature such as the type of use (public/private) and the depth of the UCP. Furthermore, we present the results of a spatial analysis of heat fluxes and flows from over 5000 UCPs in Berlin, Germany. By discussing the range of heat fluxes and the hydrogeological conditions that lead to regional differences, we demonstrate the role of UCPs for subsurface urban warming. The results show that about 40 % of Berlin’s total heat flow from UCPs occurs in the “Mitte” district, where the density of UCPs is highest and the distance to the groundwater table is typically below 4 m. Finally, the knowledge gained about subsurface heat sources can help improve urban thermal groundwater management and highlights the potential for recovering waste heat from UCPs through geothermal applications.

How to cite: Noethen, M., Hemmerle, H., Benz, S., Menberg, K., Epting, J., Blum, P., and Bayer, P.: Thermal impact of underground car parks on groundwater, EGU General Assembly 2023, Vienna, Austria, 23–28 Apr 2023, EGU23-2785, https://doi.org/10.5194/egusphere-egu23-2785, 2023.

EGU23-3082 | ECS | Posters on site | HS8.1.1

Numerical modeling of flow in a phosphogypsum stack. Case of salt-marshes, Huelva, SW Spain. 

Franco Coscia, Enric Vázquez-Suñè, and Estanislao Pujades

Phosphogypsum is a waste that results when fertilizer is obtained from phosphate through a wet chemical process. Phosphogypsum waste can entail negative consequences for the environment and human health since it is enriched in radionuclides from U-decay series and metal impurities. Phosphogypsum wastes are commonly accumulated in large stockpiles that are exposed to weathering processes. These stockpiles are located near the plants where phosphate is processed, which are usually located in coastal areas. This is the case of a phosphogypsum stack on the western side of the Tinto River estuary (Huelva, SW Spain), where the piles were directly settled on the marshland without using any isolation from 1968 to 2010. Here, in addition to the potential environmental impacts, the effect of the phosphogypsum wastes on human health are a source of concern since the piles are located near the city of Huelva (Spain). In this context, it is of paramount importance to assess the phosphogypsum leachate percolation into underlaid aquifer systems and the release of pollutants to the Tinto River.

This investigation aims at building a complex coupled hydro-chemical numerical model accounting with variable density to quantify how the pollutants are released to the environment. The first step has consisted in developing the flow numerical model that has been calibrated by fitting the piezometric head oscillations as a result of recharge processes and sea tide oscillations. The good fitting obtained during the calibration process (normalized RMS when comparing simulated and observed piezometric heads is less than the 10%) allows affirming that the estimated hydraulic parameters are accurate, and are consistent with the literature reviewed. Furthermore, the numerically calculated mass balance is consistent with the conceptually estimated one, the differences were as expected. Thus, the model allows simulating the flow processes and modelling predictive scenarios. The next steps will consist in implementing variable density and hydro-chemical, and possibly, hydromechanical processes.

This study, which uses numerical modelling, is intended to be useful for future work related to restoration measures and provides new insights into the water balance along with the complex processes occurring at the site.

How to cite: Coscia, F., Vázquez-Suñè, E., and Pujades, E.: Numerical modeling of flow in a phosphogypsum stack. Case of salt-marshes, Huelva, SW Spain., EGU General Assembly 2023, Vienna, Austria, 23–28 Apr 2023, EGU23-3082, https://doi.org/10.5194/egusphere-egu23-3082, 2023.

Groundwater located in peri-urban areas may be impacted by many pollutants from different types of point or diffuse sources. About 40% of Brazil's waste is disposed of inappropriately in open dumps and constitutes a risk of contamination for aquifers. In the metropolitan region of the city of Salvador in northeastern Brazil, approximately 9,800 tons of solid waste are generated daily. This research aimed to delineate areas for the implementation of landfills and protection of peri-urban groundwater in Salvador and other catchments in northeastern Brazil. An integration of Boolean and fuzzy logic was performed using GIS, while the Analytic Hierarchy Process was used in a Multi Criteria Decision Analysis technique to generate the weights of the factors and criteria for the fuzzy model. From this methodology, two preliminary models were generated, one using the Boolean logic and the other the fuzzy logic. The first used restrictive criteria established by Brazilian legislation applied to fifteen factors/themes. In the second model, non-restrictive criteria were applied to eleven factors/themes based on technical knowledge and literature. The integration of the maps and the crossing of the models demonstrates that 6% of the studied areas are classified as highly adequate; 16% as adequate; 8% not suitable; and 70% are areas with total restrictions for locations of landfills and protection of aquifers.

How to cite: Leal, L., Purificação, C., Klammler, H., and Hatfield, K.: GIS‐based multi-criteria decision analysis for suitable locations of landfills and protection of peri-urban groundwater catchments: a case study in northeastern Brazil, EGU General Assembly 2023, Vienna, Austria, 23–28 Apr 2023, EGU23-4754, https://doi.org/10.5194/egusphere-egu23-4754, 2023.

EGU23-5588 | ECS | Posters on site | HS8.1.1 | Highlight

What are the driving factors affecting urban groundwater quality? A multi-tracer approach for the assessment of Vienna’s shallow aquifers 

Eva Kaminsky, Constanze Englisch, Christian Griebler, Cornelia Steiner, Gregor Götzl, Kay Knoeller, Hans Sandén, Gregor Laaha, and Christine Stumpp

Urban shallow groundwater is highly impacted in terms of hydrogeology and water quality by anthropogenic activities and infrastructure, such as heating and cooling, surface sealing, leaking sewage pipes, and underground buildings. For a sustainable management of urban water resources, a better understanding of biogeochemical processes and its dynamics on a spatial and temporal scale in the urban subsurface is needed. So far, data sets including a critical minimum number of key parameters and an appropriate resolution in space and time have often been missing. Here, we introduce a multi-tracer approach applied to assess the shallow aquifers in Vienna. Water samples were collected twice, in autumn 2021 and spring 2022, respectively, from 150 groundwater wells in the city limits of Vienna. A comprehensive set of parameters (e.g. major ions, nutrients, heavy metals, water and nitrate stable isotopes) were analyzed to evaluate the spatial and seasonal variations in water origin and quality. Statistical analysis revealed that driving factors influencing groundwater quality include aquifer properties, interactions between groundwater-surface water, and redox conditions. A combined interpretation of conservative tracers indicated zones influenced by surface water - groundwater interactions that also influenced the water chemistry. Microbial anaerobic processes govern groundwater quality. In particular, contamination of nitrate from septic water and manure is locally reduced by denitrification, as proven by compound-specific isotope analysis, improving water quality. At the same time, other anaerobic processes, such as iron and manganese reduction, sulfate reduction, and methanogenesis deteriorate water quality. Finally, groundwater temperatures, up to 27°C, were observed close to urban underground infrastructure, hinting at subsurface buildings and surface sealing as stressors in shallow groundwater. In conclusion, our high resolution spatial sampling with the large set of parameters will not only allow a better understanding of groundwater quality dynamics, but also allows to evaluate effects to groundwater biodiversity and develop predictive mathematical models.

How to cite: Kaminsky, E., Englisch, C., Griebler, C., Steiner, C., Götzl, G., Knoeller, K., Sandén, H., Laaha, G., and Stumpp, C.: What are the driving factors affecting urban groundwater quality? A multi-tracer approach for the assessment of Vienna’s shallow aquifers, EGU General Assembly 2023, Vienna, Austria, 23–28 Apr 2023, EGU23-5588, https://doi.org/10.5194/egusphere-egu23-5588, 2023.

EGU23-7356 | Orals | HS8.1.1

A holistic view of water sources in Kyiv, Ukraine using tap water, surface water, groundwater, and precipitation hydrogen (𝛿2H) and oxygen (𝛿18O) stable isotope ratios 

Andrea Erhardt, Elizabeth Avery, Olena Samonina, Lidiia Kryshtop, Iryna Vyshenska, and Alan Fryar

The water supply for Kyiv (Ukraine) is a seasonally and spatially variable mixture of both ground and surface water. This water supply is vulnerable to the effects of climate change, pollution, and geopolitical conflict. Climate change has resulted in changing precipitation patterns, potentially altering the balance between ground and surface water utilization. Additionally, the ongoing conflict makes a holistic understanding of water resources and pathways critical for water management. This study uses water stable isotopes as tracers for water sources and the importance of different reservoirs in water management.

For this study tap water, surface water, groundwater, and precipitation were collected over 14 months (2019-2020) in Kyiv and nearby Boryspil, Brovary, and Boyarka and measured for hydrogen (𝛿2H) and oxygen (𝛿18O) stable isotope ratios. Precipitation data was used to capture seasonal variability in storm trajectories and create a meteoric water line. These results were then compared to surface, ground, and tap water to capture water sources and residence times.

The stable isotope values from the tap water for each district show a general seasonal trend in water sources, with more groundwater used in the supply in the winter for most districts. Spatially, groundwater use increases from south to north in the left-bank districts in Kyiv city and groundwater use generally decreases from south to north in the right-bank districts. As precipitation patterns shift and temperatures increase, the reliance on particular water sources may need to shift as well.

 Overall, 𝛿2H and 𝛿18O data provide a baseline expectancy for current water use throughout the year and, from this, deviations can be assessed early. A holistic view of the water system will be critical to assess changes due to infrastructure damage and/or other impact on water management in the Kyiv region.

How to cite: Erhardt, A., Avery, E., Samonina, O., Kryshtop, L., Vyshenska, I., and Fryar, A.: A holistic view of water sources in Kyiv, Ukraine using tap water, surface water, groundwater, and precipitation hydrogen (𝛿2H) and oxygen (𝛿18O) stable isotope ratios, EGU General Assembly 2023, Vienna, Austria, 23–28 Apr 2023, EGU23-7356, https://doi.org/10.5194/egusphere-egu23-7356, 2023.

Abandoned mines can play a new role in renewable energy production and storage in combination with fifth-generation heating and cooling networks. Obviously, the underground potential must be matched with the uses/productions of heat and cold by surface activities. Therefore, this will be considered here only in highly urbanized areas or in economic and industrial areas.

Flooded abandoned mines form highly heterogeneous aquifers that are artificially and locally highly permeable around former underground works (i.e., tunnels, galleries, mined extraction zones, wells, shafts). Thermal energy storage (ATES) systems, using heat pumps and an open loop with a groundwater pumping and re-injection doublet, are thus challenging and uncertain in such a variable underground environment. Hot water is pumped in the deepest parts of the open network, and cold water can be re-injected in the shallower parts (i.e. in shallower galleries or fractured rocks). A seasonal inversion could be planned for cooling the buildings during the summer season. However, the true geometry of the interconnected network made of old open galleries and shafts can be highly complex and partially unknown. Indeed, high-velocity water flow and heat transport are expected in this network inducing potentially a full or partial bypass of the fractured and porous rock massif.

A hydrogeological characterization of the old mined zones for detailed simulations of the groundwater flow and associated heat transport is thus a needed step allowing to assess the actual feasibility of a given project. The simulated short-, mid-, and long-term temperature evolution in pumping and injection zones will consist of key information for designing and dimensioning the whole geothermal project and assessing future efficiency and impact. Depending on the degree of precision required, which is dependent on the level of reduction of uncertainties associated with the geothermal project, the hydrogeological baseline issues can be very significant, challenging scientists in different areas of quantitative hydrogeology:

  • conceptualization in a simple model of the often unknown complexity/heterogeneity of the galleries network conjugated to those of the mined geological formations;
  • simulation of temperature-dependent variable-density groundwater flow and coupled heat transport;
  • combining high-velocity ‘pipe-like’ water flows (in the shafts and galleries) and porous/fractured groundwater flow (in the rock matrix);
  • simulation of different transient scenarios to assess evolutions in the long term.

As an illustration, a simplified but realistic situation is simulated showing the influence of the highly different heat/cold transport in the galleries and shafts, compared to the propagation in the porous/fractured rocks. Indeed, the different temperature evolutions allow anticipating the temperature changes affecting the future (short-, mid-, and long-term) efficiency of a geothermal system as well as possible environmental impacts.

Real cases in relation to future projects should ideally be simulated using the most detailed approaches, with true data. Those baseline hydrogeological data are not easy to obtain but they are the guarantee of reliable predictions and therefore that the financial risk is reasonable.

Dassargues A., 2018. Hydrogeology: groundwater science and engineering, 472p. Taylor & Francis CRC press, Boca Raton.

How to cite: Dassargues, A. and Orban, P.: Hydrogeological baselines for geothermal energy and heat storage in old flooded coal mines in urban areas, EGU General Assembly 2023, Vienna, Austria, 23–28 Apr 2023, EGU23-7715, https://doi.org/10.5194/egusphere-egu23-7715, 2023.

EGU23-7878 | Orals | HS8.1.1 | Highlight

Potential and limitations of silica encapsulated DNA particles for hydro(geo)logy 

Jan Willem Foppen and Thom Bogaard

Artificial DNA as a tracer in environmental applications has received increased attention in environmental science. In the last few years, we have been looking at the transport of silica encapsulated DNA particles (SiDNA), which we injected instantaneously or as a function of time in various saturated groundwater and surface water laboratory set-ups. These included batches, columns, sand tanks, open pipes, trenches, flumes, etc. The overarching aim of all these experiments was to understand SiDNA transport behaviour, to quantify the mass balance and to assess tracer-like capabilities of SiDNA. Our work indicated that in most applications, the shape of the breakthrough curve in terms of time to rise and time to peak were similar to the breakthrough curve of a conservative tracer. Specifically, SiDNA could be used to quantify dispersion in surface water transport, and to determine aquifer parameters, like hydraulic conductivity and porosity in multi-tracer experiments. However, this was accompanied by some uncertainty as in most applications, injected mass recoveries were less than 100% due to losses as a result of settling, river bed interactions, interactions with particulate matter (in surface water applications), straining, kinetic attachment and detachment (in groundwater applications). 
We conclude that SiDNA can be used when mass balance issues are relatively unimportant, for instance in case of complex flow path analyses or source tracking applications, whereby encapsulated artificial DNA with different DNA strands can be injected in several locations or can be added to the source. Currently, we think large scale field applications of SiDNA are still limited, due to required specific knowledge and analytical infrastructure, relatively high costs and limited SiDNA production scale. Once these issues are tackled, a truly unique multi-tracer will enrich the toolbox of hydrologists.

How to cite: Foppen, J. W. and Bogaard, T.: Potential and limitations of silica encapsulated DNA particles for hydro(geo)logy, EGU General Assembly 2023, Vienna, Austria, 23–28 Apr 2023, EGU23-7878, https://doi.org/10.5194/egusphere-egu23-7878, 2023.

EGU23-8241 * | ECS | Orals | HS8.1.1 | Highlight

300 years of organic pollution recorded in an urban speleothem (Paris, France) 

Julia Garagnon, Yves Perrette, Emmanuel Naffrechoux, and Edwige Pons-Branchu

The preservation of water resources and the limitation of pollution are an environmental central issue in the current intense anthropization context. Considered as sensitive recorders of past changes, speleothems offer an under investigated natural archive for the reconstruction of water quality. Urban speleothems have recently been used to show the impact of urbanization over the water quality using inorganic trace elements. Speleothems thus represent a promising archive of water quality on short and long-time scales. However, they have never been used to trace organic pollution. Within the organic and anthropogenic proxies, polycyclic aromatic hydrocarbons (PAHs) are commonly used in water quality analysis. These persistent organic pollutants (POPs) are mainly due to anthropogenic emissions. The use of speleothem to trace the variations in quantity and quality of organic matter, including organic pollutant as PAHs, over the last centuries, is unprecedented.

For this purpose, high resolution (10 µm) solid phase UV fluorescence imaging analyses were crossed with chemical analyses (PAHs, Non Purgeable Organic Carbon (NPOC)) carried out on low weight samples (a few mg to g) from a Parisian aqueduct flowstone. Solid-phase fluorescence imaging, although poorly applied yet to speleothems, is a non-destructive technique. To obtain quantitative information, solid phase spectroscopy is coupled with liquid phase compound analysis and NPOC analysis. Due to their low concentration, the analysis of PAHs required a long development phase. The protocol consists of an extraction and analysis process using high performance liquid chromatography coupled with a fluorescence detector. The first results reveal the presence of PAHs for 300 years in runoff water with an increase, in particular in heavy molecular weight PAHs, over the last two decades. These data will be crossed with modelled imaging of quantitative variations in organic matter. This work opens the way to a better long term understanding of the impact of anthropization on transfer of pollutants in subsurface waters.

How to cite: Garagnon, J., Perrette, Y., Naffrechoux, E., and Pons-Branchu, E.: 300 years of organic pollution recorded in an urban speleothem (Paris, France), EGU General Assembly 2023, Vienna, Austria, 23–28 Apr 2023, EGU23-8241, https://doi.org/10.5194/egusphere-egu23-8241, 2023.

Nanoscience and nanotechnology have revolutionized many sectors of the industry with the development of novel materials and technologies. With the increasing use of nanomaterials in products and applications, the presence of nanoparticles in the environment, such as in soil, sediments, water, air, and biota, is inevitable. Understanding of the physical and chemical processes and environmental conditions that govern the fate and behavior of nanomaterials in the environment is essential to strengthen the environmental and human health security. This study discusses the role of physical and chemical processes and environmental conditions on the fate, transport, behavior, transformation, and toxicity of metal based nanoparticles and their environmental impacts, with a focus on terrestrial and aquatic systems, as well as plants and microorganisms. Research on the interactions of nanomaterials with the environment and biological systems will allow the development of models contributing to advancing knowledge on the behavior and fate of nanoparticles in the environment and assessing their potential risk in the environment.

How to cite: Darnault, C.: Nanomaterial Interactions with the Environment and Biological Systems: Implications for Soil, Water, Plants, and Microorganisms, EGU General Assembly 2023, Vienna, Austria, 23–28 Apr 2023, EGU23-10830, https://doi.org/10.5194/egusphere-egu23-10830, 2023.

EGU23-10883 | Posters on site | HS8.1.1

The influence of microplastics on the dry end of the soil-water retention curve 

Hannes Laermanns, Markus Rolf, Susanne Forche, Elena Castrucci, Alexander Stelzer, and Christina Bogner

Most studies focus on the detection of microplastic particles in different compartments of the environment. While impacts of microplastics on aquatic systems have already a wide acceptance in public, the research on microplastics in terrestrial systems is quite young. Our study aims to decipher the consequences of microplastics on the soil-water retention curve beyond the wilting point. Using a dew point WP4C hygrometer, we measured water retention curves of loess and sand samples with added microplastics, namely amorphous biopolymer, polystyrene in two sizes and three different types of UV-aged particles. All the different microplastics were added in concentrations of 0.1 wt.%, 0.5 wt.%, and 4.5 mg/kg. Reference samples without microplastics were prepared as well. For the analysis, we fitted the Webb model and calculated the water content at the wilting point and the slope of the soil-water retention curve. Our preliminary results did not show any significant differences between the different microplastics and their concentrations, however, the lowest slope and highest water content at pF 4.2 were observed in the samples without microplastics. Furthermore, the results indicated a greater variability with increasing size of microplastic particles.

How to cite: Laermanns, H., Rolf, M., Forche, S., Castrucci, E., Stelzer, A., and Bogner, C.: The influence of microplastics on the dry end of the soil-water retention curve, EGU General Assembly 2023, Vienna, Austria, 23–28 Apr 2023, EGU23-10883, https://doi.org/10.5194/egusphere-egu23-10883, 2023.

EGU23-11717 | ECS | Posters on site | HS8.1.1

Surrogate-based implementation of sewer network structures into numerical heat transport models: First results of the Basel-City case study 

Martin Binder, Felicia Kossek, Christian Engelmann, and Jannis Epting

Adequate management strategies are critically required to increase the resilience and long-term availability of groundwater resources in the light of progressive climate change and accelerating urbanization. Here, robustly parameterized numerical models, designed for simulating water flow as well as solute and heat transport processes in the hydrogeological subsurface, are powerful and widely established tools supporting decision making and planning.

Among other applications related to more general quantity- and quality-related questions, these numerical tools can be also used, e.g., for investigating the current thermal state of the subsurface and occurring changes due to artificial and natural influences. Models designed for this very specific task should include at least all major artificial objects (e.g., underground car parks, tunnels, buildings, sewer networks) which thermally contribute to the overall groundwater heat regime. For instance, the heat exchange between the subsurface and sewer systems may significantly contribute to the subsurface urban heat island effect and should, therefore, be implemented. However, fully three-dimensional implementations of sewer networks (typically with hundreds of kilometers of pipes) are mostly out of question when applying such numerical models, since it would be associated with large computational demands and increasing numerical instabilities.

To overcome this limitation, the focus of our ongoing research is to evaluate the suitability of an adaptive surrogate method to be coupled to existing numerical heat transport models. This method is based on linking expected thermal exchange rates between small subsurface objects (e.g., sewer pipes) and their surrounding area, which depend on site-specific parameters (e.g., surface-groundwater table distance, pipe dimensions, shapes and materials), with the spatial elements of an existing model mesh, e.g., as area-averaged heat sources or sinks. Numerical heat conduction simulations performed on pipe scale while employing seasonally changing ambient and sewer conditions point towards the importance of considering both stationary (such as materials) and transient input datasets (such as temperature fluctuations) in this linking process. The collection and pre-processing of both dataset types is performed in separate workflows employing standardized geographic information system (GIS) software. Based on these input datasets, heat flux calculations can be done either employing the numerical code itself (if the model code allows user-defined calculations) or, again, in a GIS-assisted step (in order to further reduce the computational demand during the runs of the numerical model).

The conceptual workflow, first results as well as expected advances and limitations of this surrogate approach will be critically discussed using the example of the well-documented heat transport case study of ‘Basel-City’. Among others, the aforementioned stationary and transient input datasets, and based on that, processed vertical heat fluxes will be presented for selected areas of the Swiss canton.

How to cite: Binder, M., Kossek, F., Engelmann, C., and Epting, J.: Surrogate-based implementation of sewer network structures into numerical heat transport models: First results of the Basel-City case study, EGU General Assembly 2023, Vienna, Austria, 23–28 Apr 2023, EGU23-11717, https://doi.org/10.5194/egusphere-egu23-11717, 2023.

EGU23-12562 | ECS | Orals | HS8.1.1

Microplastics in sediment deposited along the Seine River after a major flood event (February 2021) 

Nadia Bouzid, Remi Bizeul, Anthony Foucher, Sophie Ayrault, Olivier Evrard, Rachid Dris, Bruno Tassin, and Jonnhy Gasperi

Depending on hydrodynamic conditions, river sediments act as a sinks or a sources of microplastics through deposition and remobilisation processes. During flood events, the increase of river flow leads to an increase in the resuspension of bottom sediments and bank erosion processes and favoring the microplastic transportation. Previous work conduced in the Seine river catchment in 2018 has shown that floods, which occur for only 15% of the annual time, contributed to 40% of the total microplastic flux. Therefore, at the end of a flood period, with the decreasing in water level, some flow regimes allow the deposition of contaminated sediments carried by the river on the banks.

This study presents the characterization and quantification of microplastics in ten samples lag deposits collected along the Seine river after the February 2021 flood event. Microplastics from 10 to 500 µm were analysed in replicate samples using two methods (FTIR microspectroscopy and Pyr-GC/MS). In order to characterize the origin of the sampled sedimentary deposits a fingerprinting approach based on the measurement of radionuclides activity (137Cs, 210Pbex and 7Be) was carried out. A mixing model was applied to discriminate old and recent sediments and their origin from the surface (e.g. soil erosion) or subsurface (e.g. bank erosion). High concentration levels of microplastics, ranging from 8,000 to 50,000 items/kg, were observed mainly characterised by FTIR microspectroscopy as PP, PE, PS and PVC. All the samples analysed show a similar size distribution with a majority of particles below 100 µm. PP is the most abundant polymer found. The quantification by Pyr-GC/MS provided masses consistent with microspectroscopy results ranging from 200 to 14,000 µg PP/kg of dry sediment.  An increase in microplastic contamination between the upstream and the downstream part of the Paris area was observed. In this study, the relationships between sediment characteristics and microplastic contamination could not be demonstrated. Further work is needed to verify whether a more marked relationship can be observed in major events where a clearer variation in sediment sources is observed between the upper and lower parts of the Paris area.

How to cite: Bouzid, N., Bizeul, R., Foucher, A., Ayrault, S., Evrard, O., Dris, R., Tassin, B., and Gasperi, J.: Microplastics in sediment deposited along the Seine River after a major flood event (February 2021), EGU General Assembly 2023, Vienna, Austria, 23–28 Apr 2023, EGU23-12562, https://doi.org/10.5194/egusphere-egu23-12562, 2023.

EGU23-12881 | Posters on site | HS8.1.1

Processes affecting the behaviour of persistent, mobile, and toxic substances in a riverbank filtration system 

Estanislao Pujades, Carmen Sáez, Olha Nikolenko, Laura Scheiber, Arianna Bautista, Marinella Farré, and Anna Jurado

Riverbank filtration (RBF) consists in forcing surface water to infiltrate and flow through an aquifer by means of a pumping well located near a surface water body. RBF aims to take advantage of the filtration capacity of aquifers to improve the water quality by removing a wide range of pollutants, including contaminants of emerging concern, by combining of physical, chemical and biological processes. However, the efficacy of RBF for eliminating substances that are considered persistent, mobile, and toxic (PMT), or very persistent and very mobile (vPvM), is expected to be low due to the high mobility of these substances. PMT and vPvM compounds, which are accumulated in the water cycle, are harmful to humans and the environment. For this reason, the processes affecting PMT and vPvM substances during RBF processes deserve to be deeply investigated.

This study aims at investigating the processes affecting PMT and vPvM substances in a site that behaves similarly to a RBF system. The study site is located in Sant Adriá del Besòs (Barcelona, Spain), where a constant pumping to drain an underground parking lot forces the water from the Besòs river to infiltrate and travel up to 230 m through the aquifer. Groundwater samples were collected from the river, and a set of piezometers aligned along the groundwater flow line between the Besòs river, and the underground parking lot allowed monitoring of the water at different stages after its infiltration. The samples were analysed by liquid chromatography coupled to high resolution mass spectrometry (LC-HRMS) and PMT and vPvM were determined by a suspected screening approach.

This investigation provides new insights into the processes affecting PMT and vPvM substances and will have tremendous implications for determining groundwater quality in managed aquifer recharge contexts.

How to cite: Pujades, E., Sáez, C., Nikolenko, O., Scheiber, L., Bautista, A., Farré, M., and Jurado, A.: Processes affecting the behaviour of persistent, mobile, and toxic substances in a riverbank filtration system, EGU General Assembly 2023, Vienna, Austria, 23–28 Apr 2023, EGU23-12881, https://doi.org/10.5194/egusphere-egu23-12881, 2023.

EGU23-12959 | Posters on site | HS8.1.1

Organic contaminants of emerging concern (OCECs) in urban aquifers affected by geothermal exploitations 

Anna Jurado, María Alejandra Villa, Marc Teixidó, Nicola Montemurro, Sandra Pérez, Jan Willem Foppen, and Estanislao Pujades

Water shortage is expected to exacerbate because of the increase pressure on water resources due to climate change and the growing population. It is deemed necessary to take advantage of all the available freshwater resources to cover the growing demand, especially in urban areas. However, urban aquifers are commonly contaminated by a wide range of organic contaminants of emerging concern (OCECs). OCECs, which comprise natural and synthetic compounds, are potentially hazardous to the environment and human health. Therefore, the processes controlling the behaviour of OCECs must be investigated to determine when and how the urban resources can be used safely and to design remediation strategies against them. The removal rate of OCECs depends on the temperature and redox conditions of groundwater that may be affected by anthropogenic activities like the exploitation of the geothermal potential of aquifers. The behaviour of some OCECs has been investigated in the context of managed aquifer recharge (MAR). However, the water range in MAR is lower than that expected around geothermal exploitations, and the behaviour of OCECs under similar conditions to that found around geothermal facilities should be evaluated. We have investigated the removal of 12 OCECs reported in the aquifers of Barcelona (Spain) by using batch experiments under different redox conditions and temperatures (25°C and 35°C). The results show that the removal rate of OCECs depends on the temperature, suggesting that the impact of geothermal exploitations must be considered when investigating the fate and evolution of OCECs in urban aquifers. Unexpectedly, it was observed that the removal rate could also decrease with the temperature, which may be related to the proliferation of different communities of bacteria depending on the temperature. Overall, this investigation supports the idea that it is possible to design geothermal facilities to promote the removal of OCECs.

How to cite: Jurado, A., Villa, M. A., Teixidó, M., Montemurro, N., Pérez, S., Foppen, J. W., and Pujades, E.: Organic contaminants of emerging concern (OCECs) in urban aquifers affected by geothermal exploitations, EGU General Assembly 2023, Vienna, Austria, 23–28 Apr 2023, EGU23-12959, https://doi.org/10.5194/egusphere-egu23-12959, 2023.

EGU23-14782 | ECS | Posters on site | HS8.1.1

Efficiency of activated sludge process for reduction of antibiotics from municipal wastewater  

Moushumi Hazra, Himanshu Joshi Joshi, and Bhanu P. Vellanki

With time, a lot of change in the nature of impurities, especially a surge in emerging contaminants in urban wastewater has been observed due to changing lifestyle, uncontrolled and mismanaged urban sprawl, increasing pollution and disease burden, and easy access to antibiotics. Conventional sewage treatment plants have thus faced challenges in treating emerging pollutants such as antibiotics, with variable success as reported in few studies.  Antibiotics are persistent in the environment and result into development of antimicrobial resistance. The concentration of antibiotics reportedly varies from µg/L to ng/L in raw/treated sewage which is generally dependent upon differences in environmental/social factors as well as treatment technology. The present study was conducted with the purpose of identifying the role of activated sludge process (ASP) in a standalone mode as well as in a hybrid mode duly integrated with upflow anaerobic sludge blanket reactor (UASB) in removal of antibiotics from the raw sewage. The antibiotics were analysed with a Liquid Chromatography Mass Spectrometer (LCMS), and the removal efficiencies were compared for both the treatment systems. The concentration of selected antibiotics in raw/treated sewage of the hybrid UASB-ASP varied in the range of 0.92-79025.9µg/L and 0.03-3439µg/L respectively. It was observed that the concentration of erythromycin was very less inspite of being used as a wide spectrum antibiotic against gram positive/gram-negative bacteria causing upper and lower respiratory diseases. An apparent reason could be that it is mainly metabolised by human liver and only 5% is excreted in active form. Also, low concentration of sulfamethoxazole and enrofloxacin were detected in the ranges 0.04-0.92µg/L and 0.03-0.94µg/L respectively in the raw/treated sewage. Notably, even these concentrations could also inhibit bacterial growth by altering microbial production of folic acid and induce antimicrobial resistance at sub lethal concentration. The removal efficiency for UASB-ASP for selected antibiotic was between 51.09% to 95.87% indicating an efficient reduction. Low concentration of sulfamethoxazole and enrofloxacin was observed within the range of 0.15 – 0.21 g/L and 0.007 – 0.01 µg/L in the raw/treated sewage of ASP. Negative removal (increased concentration in the treated sewage) was observed for erythromycin and ciprofloxacin, apparently because of resistance to degradation. The reduction of sulfamethoxazole, enrofloxacin, tetracycline was 27%, 52%, 65% where trimethoprim demonstrated maximum removal of 88% in ASP.  The hybrid UASB-ASP performed better than the standalone ASP with respect to reduction of all antibiotics, indicating that ASP can perform more efficiently when integrated with other technologies alongwith addition of a proper dosing of chlorination. Risk associated with the selected antibiotics from sewage treatment plant to the receiving environment (both water/soil) was quantified employing hazard quotient (HQ) using predicted no effect concentration (PNEC) values derived from literature. HQ for sulfamethoxazole was calculated to be above 1, and higher values were observed for trimethoprim (in the range of 589-628), and tetracycline (in the range of 405-722) indicating potential environmental concern for aquatic environment/soil, whichever may be of concern. No risk seemed to appear for indirect human exposure to enrofloxacin as indicated by the calculated values of HQ (0.004-0.02).


How to cite: Hazra, M., Joshi, H. J., and Vellanki, B. P.: Efficiency of activated sludge process for reduction of antibiotics from municipal wastewater , EGU General Assembly 2023, Vienna, Austria, 23–28 Apr 2023, EGU23-14782, https://doi.org/10.5194/egusphere-egu23-14782, 2023.

EGU23-16939 | Orals | HS8.1.1 | Highlight

Transport and Removal of Stormwater Vehicle-Related Contaminants in Laboratory Columns 

María Alejandra Cruz Bolaños, Jiaqui Xu, Jan Willem Foppen, and Marc Teixidó Planes

Stormwater runoff capture can provide means of flood control and augmentation of local water supplies. However, urban stormwater is considered a major transport vector of contaminants, primarily from vehicle-related sources. Unfortunately, conventional green infrastructures fail to consistently remove the contaminant dissolved fraction – in particular persistent, mobile, and toxic (PMT) organic pollutants. We investigated the transport and removal of stormwater vehicle-related trace organic contaminants, such as 1H-benzotriazole, N'N-diphenylguanidine, and hexamethoxymethylmelamine utilizing continuous-flow sand columns amended with granulated activated carbon (GAC) and wheat-straw produced biochar (WSP550). All the pollutants were subjected to nonequilibrium interactions in sand-only (control) and GAC/biochar-amended sand columns, with kinetic effects on transport. The Langmuir sorption kinetics model could well describe the observed breakthrough curves, which assumes the saturation of sorption sites that might occur in infiltration systems with DOM fouling. Furthermore, we found that GAC amendments can attenuate the contaminants significantly better with faster adsorption kinetics and higher sorption capacity than the biochar. Based on the optimized sorption parameters, we concluded that HMMM had the lowest affinity in both carbonaceous adsorbents. These column results corroborated observations from preliminary batch experiments. Based on the case study simulation, the amendments of pyrogenic carbonaceous adsorbents could improve vehicle-related organic contaminant removal and exhibit a service life of more than a decade in a green infrastructure. Overall, our research contributes to improving polar organic pollutant removal technologies in environmental applications.

How to cite: Cruz Bolaños, M. A., Xu, J., Foppen, J. W., and Teixidó Planes, M.: Transport and Removal of Stormwater Vehicle-Related Contaminants in Laboratory Columns, EGU General Assembly 2023, Vienna, Austria, 23–28 Apr 2023, EGU23-16939, https://doi.org/10.5194/egusphere-egu23-16939, 2023.

EGU23-16985 | ECS | Posters virtual | HS8.1.1 | Highlight

Predicting bacterial transport through saturated porous media using an automated machine learning model 

Fengxian Chen, Bin Zhou, Liqiong Yang, Xijuan Chen, and Jie Zhuang

Escherichia coli, as an indicator of fecal contamination, can move from manure-amended soil to groundwater under rainfall or irrigation events. Predicting its vertical transport in the subsurface is essential for the development of engineering solutions to reduce the risk of microbiological contamination. In this study, we collected 302 datasets from 39 published papers addressing E. coli transport through saturated porous media and trained an automated machine learning model (H2O AutoML) to predict bacterial transport. Bacterial concentration, porous medium type, particle size, ionic strength, pore water velocity, and column length were used as input variables while the first-order attachment coefficient and spatial removal rate were set as target variables. The six input variables have low correlations with the target variables, namely, they cannot predict target variables independently. However, with the automated machine learning model, input variables can effectively predict the target variables. Among 20 candidate models, Gradient Boosting Machine showed the best performance. Among the six input variables, pore water velocity, ionic strength, particle size, and column length were more important than bacterial concentration and porous medium type. This method of using historical literature data to train automated machine learning models provides a new avenue for predicting the transport of other contaminants in the environment.

How to cite: Chen, F., Zhou, B., Yang, L., Chen, X., and Zhuang, J.: Predicting bacterial transport through saturated porous media using an automated machine learning model, EGU General Assembly 2023, Vienna, Austria, 23–28 Apr 2023, EGU23-16985, https://doi.org/10.5194/egusphere-egu23-16985, 2023.

EGU23-1373 | Orals | HS8.1.3 | Highlight

Successful treatment of PFAS-contaminated soils on large scale: practical experience with soil washing. 

Dr. Benjamin Faigle, Dr. Hans-Georg Edel, and Bernhard Volz

The method of soil washing is currently the only economically feasible cleaning method for PFAS-contaminated soils on large scale.

A total of about 430,000 t of soil contaminated with PFAS and HCs was washed from August 2018 to October 2021 at the site of a former refinery in Bavaria. The cleaned soil could then be refilled at site-specific costs of about EUR 50 per ton. Since September 2022, Züblin Umwelttechnik GmbH has been operating another soil washing plant in Northern Germany, which was specially designed to treat soils contaminated with PFAS. Several hundred thousand tons of sandy soil with around 10% fines will be washed and refilled on site in the next years.

Data obtained from these two large-scale remediation projects are presented. The technical concept and challenges to treat 1,000 to 3,000 t of material per day are discussed, along with regulatory obstacles and the boundary conditions to process these quantities while limiting the emissions. A special focus lies on the heterogeneous nature of input material, with varying contaminant load, soil quality and soil structure as well as affiliated contaminants. In both attempts, the washing water is circulated in a closed water cycle, therefore elaborate treatment of sludge and polluted water is required.

One of the critical issues in soil washing is to optimise the washing process so that the washing liquid serves as the predominant contaminant sink. In this way, steady washing results are achieved, and all output fractions can be successfully processed while water consumption is kept to a minimum.

The complex nature of the contaminant itself, the multitude of singular PFAS substances and precursors, further complicate operation and controlling. Progress shows that soil washing can even be a viable tool to treat the fine fraction, and various strategies in different treatment steps have been tested on multiple scales, including several washing agents.

Since after treatment, the washed soils can be safely reused on site, large emissions from transportation and properly disposing the PFAS-materials is avoided while increasingly limited landfill space is maintained.

Future research is required for expanding the applicability of the method to highly challenging materials such as high fines and/or high organic content. Further projects for washing of PFAS contaminated soils in Europe are already in the planning stage.

How to cite: Faigle, Dr. B., Edel, Dr. H.-G., and Volz, B.: Successful treatment of PFAS-contaminated soils on large scale: practical experience with soil washing., EGU General Assembly 2023, Vienna, Austria, 23–28 Apr 2023, EGU23-1373, https://doi.org/10.5194/egusphere-egu23-1373, 2023.

EGU23-1816 | Posters on site | HS8.1.3

Occurrence, fate, and risk assessment of N-nitrosamines in groundwater and river water in an agricultural area 

Yingjie Chen, Huanfang Huang, Wenwen Chen, Xuelian Huang, Zhe Qian, and Shihua Qi

N-nitrosamines have been frequently detected in natural waters as a kind of nitroso compound with significant carcinogenic effects on humans. In remote agricultural areas, groundwater is often consumed directly due to inadequate water supply systems, necessitating the investigation of the occurrence, sources, and cancer risk of N-nitrosamines in the groundwater of agricultural areas. This study identified eight N-nitrosamines in groundwater and river water in the Jianghan Plain, a popular agricultural area in central China. The total concentrations of N-nitrosamines in the groundwater and river water were <2.3~61 ng/L and 3.2~10 ng/L, respectively. N-nitrosodimethylamine (NDMA), N-nitrosodiethylamine (NDEA), N-nitrosomorpholine (NMOR), N-nitrosopyrrolidine (NPYR), and N-nitrosodi-n-butylamine (NDBA) were detected in groundwater, with the main compound being NDMA (up to 52 ng/L). These N-nitrosamines were also detected in river water at comparable concentrations. The significant negative correlations between N-nitrosamines and water temperature/DO indicated that aerobic biodegradation had an influence on the N-nitrosamine distribution. Ammonium (NH4+) was proven not to be a N-nitrosamine precursor, and it rarely reacts with the precursors to form N-nitrosamines. NH4+ and NDBA have similar sources in the JHP. Nitrite (NO2-) could consume active hydroxyl radicals, which played a decisive role in forming N-nitrosamines from the ozonation of secondary amines, rather than react with secondary amines when the concentration of NO2- was low. In the case of high NO2- concentrations, NO2- reacts with amines in the environment to form N-nitrosamines. The concentrations of NDMA, NDEA, and NDBA precursors were higher in groundwater than in river water, as suggested by the formation experiment. Redundancy analysis and multiple linear regression analysis results showed the primary source of N-nitrosamines by applying nitrogen fertilizer and specific N-nitrosamines such as NPYR carried by pesticides in groundwater. The average (1.08 × 10⁻⁵) and maximum (8.18 × 10⁻⁵) total cancer risk values of detected N-nitrosamines were higher than the accepted risk level (10-5), suggesting a potential carcinogenic risk of contaminated groundwater. To minimize N-nitrosamine contamination in the groundwater of agricultural areas, further research on selecting pesticides and fertilizers that are heavily used is urgently needed.

How to cite: Chen, Y., Huang, H., Chen, W., Huang, X., Qian, Z., and Qi, S.: Occurrence, fate, and risk assessment of N-nitrosamines in groundwater and river water in an agricultural area, EGU General Assembly 2023, Vienna, Austria, 23–28 Apr 2023, EGU23-1816, https://doi.org/10.5194/egusphere-egu23-1816, 2023.

EGU23-1864 | Posters on site | HS8.1.3

Experimental study of a circular economy system for the oxidation treatment of organochlorine compounds 

Chiara Cappelli, Mònica Rosell, Clara Torrentó, María Usieto, and Albert Soler Gil

The acknowledgment of the serious hazard caused by the massive use of pesticides and other industrial and commercial products containing organochlorine compounds has prompted the search of the best strategy for the remediation of aquatic and terrestrial environments. Organochlorine compounds are persistent contaminants present in soils and water that easily bio-accumulate and bio-magnify becoming a threat for human health1.  The in situ chemical oxidation (ISCO) has proven to be an effective method for the decontamination of chlorinated solvents2. The ISCO implementation needs specific oxidant-activation conditions that are often difficult to maintain. In a previous study, inert urban waste (concrete residue) was used in a pilot system of circular economy to induce alkaline conditions in interception trenches installed in the unsaturated zone of a contaminated bedrock aquifer3. In the present study, a scaled down set-up was used to produce preliminary data on the solid reactivity and solution changes upon the application of an oxidant, persulfate, which requires alkaline activation. Flow-through columns were filled with grinded concrete waste that was allowed to react with water extracted from the trenches and enriched with persulfate. The results set the basis for the correct in situ application of the planned remediation method.  

1. Islam, M. A.; Amin, S. M. N.; Rahman, M. A.; Juraimi, A. S.; Uddin, M. K.; Brown, C. L.; Arshad, A. Environmental Nanotechnology, Monitoring & Management 2022, 18, 100740.

2. Krembs, F. J.; Siegrist, R. L.; Crimi, M. L.; Furrer, R. F.; Petri, B. G. Groundwater Monitoring & Remediation 2010, 30, (4), 42-53.

3. Torrentó, C.; Audí-Miró, C.; Bordeleau, G.; Marchesi, M.; Rosell, M.; Otero, N.; Soler, A. Environmental Science & Technology 2014, 48, (3), 1869-1877.

How to cite: Cappelli, C., Rosell, M., Torrentó, C., Usieto, M., and Soler Gil, A.: Experimental study of a circular economy system for the oxidation treatment of organochlorine compounds, EGU General Assembly 2023, Vienna, Austria, 23–28 Apr 2023, EGU23-1864, https://doi.org/10.5194/egusphere-egu23-1864, 2023.

Artificial sweeteners (ASs) are a class of low-level emerging organic contaminants (EOCs) that recently appeared in aquatic environment around the world due to its increased worldwide consumption. Once ingested by humans, the major amount of these artificial sweeteners excretes unchanged from the body and is transfered to the water environment through sewage systems. Consequently, artificial sweeteners are posing a new threat and a concern is growing over the contamination of a water environment.

Due to its stability and mobility, ASs have long been considered as ideal tracers for a detection of domestic wastewater in natural water bodies, particularly groundwater. However, other previously conducted studies show that ASs are vulnarable to degradation under certain conditions. Therefore, fate, behavior, and ecotoxicological side of artificial sweeteners within waterbodies still remain ambiguous.

Recently, ASs were also detected in the central part of the Czech Republic in the area of Káraný waterworks with a river bank filtration system. Considerable attention has been given to one of the widely used artificial sweetener - Acesulfame-K, which has been detected as a predominant contaminant in numerous pilot site across Europe and other worldwide countries.

In our research we focus to pilot site of Jizera river, Czechia, where Acesulfame-K was detected in ranges 72.0 to 591.0 ng/l. Although the systems of riverbank filtration eliminate the presence of many anthropogenic contaminants in water, Acesulfame-K was still detected in groundwater with concentrations up to 75 ng/l.

Based on available field and literature data, a two-dimensional large-scale hydraulic and transport model was developed using DRUtES software. For Acesulfame-K, the following first-order degradation rate was identified: λ = 0.0358 ± 0.0022 1/d. This result was further confirmed here by a small-scale laboratory experiment, where we mimicked conditions of our pilot site groundwater aquifer.

How to cite: Mursaikova, M., Kuraz, M., and Hrkal, Z.: Degradation behaviour of the Artificial sweetener-Acesulfame-K during riverbank infiltration system. A case study from Karany waterworks, Czech Republic., EGU General Assembly 2023, Vienna, Austria, 23–28 Apr 2023, EGU23-2646, https://doi.org/10.5194/egusphere-egu23-2646, 2023.

Per- and polyfluoroalkyl substances (PFAS) are a diverse group of manmade, fluorinated organic chemicals that gained notoriety for their diverse application, widespread distribution in the environment and toxicity. One of the main sources of PFAS to the environment is through aqueous film forming foam (AFFF), intended for use on fuel fires. AFFF may enter the environment through system testing, training activities, emergency use or accidental release. When AFFF enters the environment PFAS readily adsorb to porous media through hydrophobic and electrostatic interactions. As a result, PFAS impacted porous media may act as a long-term source of contamination to groundwater, potentially influencing water resources and human health. There is a demand for effective treatment of PFAS impacted porous media. Ball milling has emerged as a potential treatment option for PFAS, however, the viability of treating AFFF impacted porous media has been seldom explored. In this work four AFFF formulations were amended onto silica sand and milled without and with the use of potassium hydroxide (KOH) as a co-milling reagent. Six hour milling trials were conducted using a planetary ball mill with stainless steel grinding media. Significant destruction of perfluorosulfonic acids, perfluorocarboxylic acids (PFCAs), fluorotelomer sulfonates, fluorotelomer betaines and fluorotelomer sulfonamido betaines was observed. With the use of KOH as a co-milling reagent the total PFAS destruction percentage in all four AFFFs exceeded 90%. Greater destruction of PFAS was observed in fluorotelomer dominant AFFFs when compared to perfluoroalkyl acid dominant AFFFs. PFCAs and soluble fluoride were identified as destruction byproducts. KOH as a co-milling reagent had the effect of reducing PFCA byproduct formation and increasing fluoride recovery in three of four AFFFs. Fluoride recoveries indicate PFAS molecule defluorination occurs by ball milling. When PFAS in AFFF is compared to PFAS destruction in single analyte trials, less destruction is observed, displaying the necessity of evaluating realistic AFFF contamination events over single or multi analyte mixtures.

How to cite: Turner, L. P., Patch, D. J., Kueper, B. H., and Weber, K. P.: Mechanochemical Destruction of Per-and Polyfluoroalkyl Substances in four Aqueous Film Forming Foam Formulations using amended Silica Sand and Potassium Hydroxide, EGU General Assembly 2023, Vienna, Austria, 23–28 Apr 2023, EGU23-2916, https://doi.org/10.5194/egusphere-egu23-2916, 2023.

EGU23-5202 | ECS | Posters on site | HS8.1.3

Simulation of diPAP Transformation and Related Metabolite Leaching Under Near-Natural Conditions 

Eva Weidemann, René Lämmer, Bernd Göckener, Mark Bücking, and Matthias Gassmann

Per- and polyfluoroalkyl substances (PFAS) are organic contaminants which are ubiquitous in the environment and anthropogenically manufactured. The presence of PFAS in the environment is connected to their production, use and disposal, i.e. the whole life cycle. Contact with organisms can have adverse effects such as toxicity, bioaccumulation and carcinogenicity depending on the specific compound. There are several thousands of different PFAS with different structures and properties, which differ in their environmental behaviour as well. One example is biotransformation, which is not observed for all PFAS, such as the persistent group of perfluoroalkyl acids (PFAAs). Other PFAS, such as polyfluoroalkyl phosphate diesters (diPAP), act as precursors which are transformed into the stable PFAAs. When released to the environment, it is important to have information about the relevant processes such as adsorption, transformation and formation of non-extractable residues (NER).

In this study, leaching simulations were performed using a multi-objective parameter optimization algorithm (caRamel) in R connected to the MACRO 5.2 model. The simulation is based on a lysimeter study with two transformable precursors (6:2 diPAP and 8:2 diPAP) under near-natural conditions and a duration of two years. Objective functions of masses in the percolation water, in the soil and in the grass, planted on the lysimeter, were optimized simultaneously for diPAPs and related persistent PFAA metabolites. The model setup was based on past leaching simulations of soil columns with similar soils, the same substances and the same study duration. A comparison of lysimeter and soil column simulations indicates temperature-affected transformation kinetics, which could be related to the microbial activity. In further studies, the influence of environmental parameters on the transformation of diPAPs should be focussed to evaluate the results of this study.

How to cite: Weidemann, E., Lämmer, R., Göckener, B., Bücking, M., and Gassmann, M.: Simulation of diPAP Transformation and Related Metabolite Leaching Under Near-Natural Conditions, EGU General Assembly 2023, Vienna, Austria, 23–28 Apr 2023, EGU23-5202, https://doi.org/10.5194/egusphere-egu23-5202, 2023.

EGU23-5316 | Posters on site | HS8.1.3

Mobility and Retention of Rare Earth Elements in Coastal Aquifers 

Nitai Amiel, Ishai Dror, and Brian Berkowitz

Rare earth elements (REEs) play a crucial role in manufacturing high-tech products and developing various technologies, including those related to the transition to clean energy. Consequently, there has been a significant increase in REE production, which has the potential to contribute to the contamination of groundwater systems that are highly susceptible to industrial pollution. Groundwater REE contamination, specifically in coastal aquifer systems, could affect large populations that rely on that water for drinking and domestic use. In this study, we conducted column transport experiments using five representative coastal aquifer materials to understand better the mechanisms that control REE mobility and retention in coastal aquifers. These experiments were conducted by adding humic acid (HA) to the REE solution under fresh and brackish water conditions. The REEs were shown to be most mobile in sand samples, followed by two types of low-calcareous sandstone and one type of high-calcareous sandstone, and least mobile in red loamy sand. The mobility of REEs, found in solution primarily as REE-HA complexes, was controlled mainly by the retention of HA, which increases with ionic strength. Furthermore, it was found that the presence of carbonate and clay minerals reduces REE mobility due to enhanced surface interactions. The enrichment of middle-REE (Nd-Gd) was observed in the sand samples, while heavy-REE (Tb-Lu) enrichment was observed in the calcareous sandstones and the red loamy sand. This change in REE pattern likely originates from the release of carbonate ions from the carbonate minerals that stabilize heavy-REEs compared to middle-REEs.

How to cite: Amiel, N., Dror, I., and Berkowitz, B.: Mobility and Retention of Rare Earth Elements in Coastal Aquifers, EGU General Assembly 2023, Vienna, Austria, 23–28 Apr 2023, EGU23-5316, https://doi.org/10.5194/egusphere-egu23-5316, 2023.

EGU23-6762 | Orals | HS8.1.3

Evaluation of the Barcelona urban soil capacity for retention of emerging contaminants 

Linda Luquot, Maria Garcia Rios, Geoffroy Duporte, and Elena Gomez

The fate of emerging contaminants from runoff/storm waters in urban areas has aroused widespread concern as it poses a threat to the water managing. Contaminated water can reach, for instance, the river that passes through the area, contributing to the degradation of the aquatic ecosystem, or the aquifer that supplies drinking water to the community. In this framework, one of the objectives of the URBANWAT project is to evaluate the capacity of the Barcelona urban soil to retain the contaminants of emerging concern from runoff waters in order to propose an improvement of tools and criteria for groundwater management in urban areas.

To this aim, a set of batch and packed soil column experiments were performed. The soil selected for the study is located in the Barcelona urban area at 20 m depth and composed of 48 % quartz, 28 % albite and 24 % microcline. It is constituted by 91 % sand, 7 % silt and clay and 2 % gravel, being the sand particle size dimension the one selected to perform the column experiments. The resident water in contact with the soil was analysed by ICP-MS and has a conductivity of 723 µS/cm and pH of 7.9. A list of representative emerging contaminants has been selected from diverse pharmaceutical families and UV filters based on the concentration values found in the runoff waters of the Barcelona urban area.

The batch experiments were carried out first to verify if the soil already contained the target contaminants and second to know the soil sorption capacity. The target contaminants have different properties (pka, charge) that cause them to be sorbed with variable efficiency by the soil tested (80-100 % sorption for Paroxetine and Venlafaxine, 60-80 % for Cocaine and Caffeine, 40-60 % for Tradadol and Climbazole and low sorption (< 40 %) for a list of more than 15 emerging contaminants). Sorption capacities obtained in the batch experiments were also identified in the percolation tests, obtaining significantly different breakthrough curves for the studied target contaminants. By means of the percolation column experiments, the effect of the flow rate on the soil retention capacity was evaluated and the two main processes involved in the pollutants retention mechanism (sorption and biodegradation) were quantified to verify the specific contribution of each process to the global procedure. 

How to cite: Luquot, L., Garcia Rios, M., Duporte, G., and Gomez, E.: Evaluation of the Barcelona urban soil capacity for retention of emerging contaminants, EGU General Assembly 2023, Vienna, Austria, 23–28 Apr 2023, EGU23-6762, https://doi.org/10.5194/egusphere-egu23-6762, 2023.

EGU23-7942 | Orals | HS8.1.3

PFAS transport through quasi-saturated porous media: Laboratory experiments and mixture effects 

Kevin G. Mumford, Justine E.F. Abraham, David J. Patch, Tohren C.G. Kibbey, and Kela P. Weber

Understanding how per- and poly-fluoroalkyl substances (PFAS) are transported is critical to site characterization, monitoring, risk assessment, and remediation planning.  This includes an understanding of PFAS retention and release at air-water interfaces.  These interfaces exist throughout the vadose zone, but can also exist as trapped air bubbles created by water table fluctuations, recharge, and biogenic gas production.  In addition to being directly applicable to transport through trapped gas zones at PFAS-impacted sites, laboratory experiments using emplaced trapped gas (quasi-saturated conditions) provide a controlled method to investigate PFAS behavior, including the effects of different PFAS, concentrations, and mixtures. 

In this study, a series of laboratory experiments was conducted using one-dimensional sand-packed columns (20 cm × 7 cm dia.).  Trapped air was emplaced by sequential drainage and imbibition to create quasi-saturated conditions.  Each experiment included separate injections of non-reactive tracer (NaCl) and PFAS solutions through both water-saturated and quasi-saturated columns.  A clean, low organic carbon sand was used to eliminate solid-phase sorption (verified through comparison of non-reactive tracer and PFAS breakthrough in the water-saturated columns) and to isolate the effect of air-water interfaces.  Experiments were conducted using single-component solutions of PFOA, PFOS and 6:2 FTS, as well as mixtures of those PFAS, at concentrations of 0.1-1 mg/L.  Experiments were also conducted using diluted aqueous film-forming foam (AFFF) solutions.  Measured retardation factors in triplicate experiments were used to estimate air-water partitioning coefficients.

The results showed that PFAS breakthrough was significantly delayed in the presence of trapped air bubbles.  Breakthrough delay was greater for PFOS than for PFOA or 6:2 FTS, and was greater for lower PFAS concentrations, for the range of concentrations used in these experiments.  For PFAS mixtures, differences in retention were sufficient to completely separate breakthrough (i.e., PFOA and 6:2 FTS achieved complete breakthrough prior to any PFOS arrival) even over short (20 cm) distances.  However, the behavior of each PFAS tested was altered by the presence of other PFAS, with PFOA and 6:2 FTS experiencing earlier breakthrough at higher concentrations (concentration overshoot) in the presence of PFOS.  Mixture effects were also observed for branched and linear PFOS isomers, and for AFFF solutions, which was further complicated by the presence of hydrocarbon surfactants.  The experimental results will be presented along with numerical simulations of PFAS transport subject to air-water partitioning, both to interpret the behavior of PFAS mixtures in experimental systems and to explore the implications of mixture transport in more complex field scenarios.

How to cite: Mumford, K. G., Abraham, J. E. F., Patch, D. J., Kibbey, T. C. G., and Weber, K. P.: PFAS transport through quasi-saturated porous media: Laboratory experiments and mixture effects, EGU General Assembly 2023, Vienna, Austria, 23–28 Apr 2023, EGU23-7942, https://doi.org/10.5194/egusphere-egu23-7942, 2023.

A novel aerobic process has been developed for the passive cometabolic treatment of contaminant mixtures in groundwater.  Our studies have focused on Rhodococcus rhodochrous ATCC 21198 that can concurrently oxidize 1,4-dioxane (1,4-D) and diverse mixtures of chlorinated aliphatic hydrocarbons (CAHs). We found that the short chain alkane monoxygenase (SCAM) responsible for the cometabolism of the contaminants is induced after grown on 1-butanol and 2-butanol, permitting the use of Slow Release Compounds (SRCs) that slowly hydrolyze to produce these alcohols.  Methods were developed to co-encapsulate the SRCs and ATCC 21198 in gellan-gum hydrogel beads. ATCC 21198 grows within the gellan-gum beads and upon diffusion into the beads the contaminants are transformed. In batch reactors containing the gellan-gum beads successive additions of a mixture of  1,1,1-trichloroethane (1,1,1-TCA_, cis-dichloroethene (cis-DCE), and 1,4-D were transformed for over 300 days, with the rates of cometabolism correlated with the rates of alcohol release, oxygen consumption and CO2 production. Continuous flow tests have been performed with columns packed with the gellan-gum beads. The columns mimic passive treatment that might be achieved using an in-situ permeable reactive barrier (PBR) constructed with the gellan-gum beads.  Over 99% removal of a mixture of 1,1,1-TCA, cis-DCE, and 1,4-D, each at influent concentration of 250 µg/L, was achieved with a hydraulic residence time of approximately 12 hours  The columns effectively transformed the contaminant mixture for over 600 pore volumes (300 days). The columns performance was negatively affected when cis-DCE was replaced by 1,1-dichloroethene (1,1-DCE), due to 1,1-DCE transformation product toxicity.  The column containing the SRC that produced 2-butanol was more negatively impacted by 1,1-DCE due to the lower biomass that developed in the gellan-gum beads. Studies are currently being performed in a 3-D physical aquifer model using a funnel-and-gate system with the co-encapsulated gellan-gum beads used to create a cometabolic permeable reactive barrier. 

How to cite: Semprini, L., Azizian, M., Wortkoetter, J., and Rasmussen, M.: Hydrogels that Co-Encapsulate Slow Release Compounds and Rhodococcus rhodochrous ATCC 21198 for the Aerobic Cometabolic Treatment of 1,4-Dioxane and CAHs, EGU General Assembly 2023, Vienna, Austria, 23–28 Apr 2023, EGU23-10942, https://doi.org/10.5194/egusphere-egu23-10942, 2023.

EGU23-10948 | Posters on site | HS8.1.3

Issues of Upscaling from Laboratory Columns to Field-scale Retention and Transport of Poly- and Perfluoroalkyl Substances in the Unsaturated Zone 

Tissa Illangasekare, John Stults, Chris Higgins, and Charles Schaefer

Per- and polyfluorinated alkyl substances (PFASs) are a large class of anthropogenic compounds which are widespread emerging contaminants of concern in the environment. Their environmental recalcitrance, long-term stability, high mobility, and toxicity make these compounds a significant threat to groundwater sources. Many PFASs are surfactants, imparting properties that impact their mobility in the subsurface.  In the last several years, progress has been made in the understanding of how these chemicals are retained and mobilized in the unsaturated zone by focusing on the mechanisms of partitioning from the water to the water-air interfaces within the pores. The fundamental knowledge of the mechanisms contributing to retention has been primarily studied using packed, one-dimensional laboratory columns with sands under highly idealized conditions. Few studies where either field soils are used in columns or pilot-scale field tests are conducted been reported or are in progress. Even without the chemical and physical complexities associated with the behavior of PFASs, modeling water infiltration and chemical transport in the field remains a challenge. Several factors, including spatial variability of the soil characteristics from pore to macro-scale, contribute to this challenge.  The soil in natural field systems where contamination has occurred is a mixture of silt, clay, and sand. The structure of the soil in its natural form changes within the vertical profile due to different levels of compaction and disturbance resulting from vegetation growth, decay, soil fracturing, bioturbation, etc. In addition, the texture variability results in heterogeneity at different spatial scales from pores to soil pockets (lenses) and layering (stratification). The water infiltrating through the soil carries the PFAS from the surface soils, where the chemicals have been introduced and deeper into the soil profile before reaching the water table, contaminating the groundwater. The soil disturbances and heterogeneity result in non-uniform water pathways, thus affecting the retention, mobilization, and transport. Additional challenges to PFASs that behave as surfactants come from spatial variability of the soil-water interfaces resulting from immobile zones that change spatially and dynamically, depending on the infiltration rates.   This paper discusses the conceptual issues that need to be addressed in transferring the knowledge and parameters determined using laboratory column studies where breakthrough data (BTC) are analyzed using many simplifications. Based on our experience of other problems of transport of chemicals in the vadose zone, the feasibility, challenges, and limitations of using multi-scale testing and modeling approach are presented.  


How to cite: Illangasekare, T., Stults, J., Higgins, C., and Schaefer, C.: Issues of Upscaling from Laboratory Columns to Field-scale Retention and Transport of Poly- and Perfluoroalkyl Substances in the Unsaturated Zone, EGU General Assembly 2023, Vienna, Austria, 23–28 Apr 2023, EGU23-10948, https://doi.org/10.5194/egusphere-egu23-10948, 2023.

EGU23-12446 | Orals | HS8.1.3

Assessing the multiple effects of dissolved organic matter on the transport of organic pollutants in subsoil horizons through a modular modeling approach 

Benoit Pierre, Dollinger Jeanne, Lafolie François, Chabauty Florian, and Pot Valérie

The role of dissolved organic matter (DOM) in the transport of trace organic pollutants through the soil profile remains controversial. Several studies reported enhanced transport for nonpolar pesticides and other pollutants such as pharmaceuticals (e.g., Borgman & Chefetz 2013). It is generally hypothesized that DOM modifies the sorption properties of the contaminants through co-sorption and/or cumulative sorption (Totsche et al. 1997). Co-transport with DOM can also enhance the mobility of pollutants (Chabauty et al. 2016). Other authors reported little effect of DOM on both sorption or desorption of herbicides (e.g., Barriuso et al. 2011). To help elucidating the multiple roles of DOM, we developed the PolDOC model implemented in the VSoil modeling platform of INRAE. We took advantage of the modularity of the platform to couple available 1D water flow and solute transport models with novel reactivity modules for organic pollutants and DOM. Indeed, sink/source terms in the transport equation have been used to calculate the interactions between pollutants, DOM and the soil solid phase.

The model was designed to simulate the transport of organic pollutants in intact soil cores sampled in the Bt horizon of a cultivated Albeluvisol to which either a synthetic soil solution without DOM (SYNTH), a soil solution extracted from the top horizon (CONTROL) or a soil solution extracted from the top horizon of a neighbour plot receiving sewage sludge and green waste compost (SGW) were applied (Chabauty et al., 2016). In PolDOC, the organic pollutants can be transported either free or associated with DOM. To describe the multiple roles of DOM in the transport of organic pollutants we first simplified the wide spectrum of organic molecules which constitute DOM and distinguished two types of DOM with different reactivity: DOMBt produced by depolymerization of the organic matter in the Bt soil horizon, and DOMSURF, produced by depolymerization of the organic matter of the surface horizon.

The model was used to simulate the transport of both DOM types and three different organic pollutants: isoproturon (ISO), a mobile herbicide, epoxiconazole (EPX), a moderately mobile fungicide and sulfamethoxazole (SMX), a mobile antibiotic. Since pollutants are applied at the soil surface, we considered that organic pollutants will be more prone to interact with DOMSURF, which is rich in phenolic compounds. Physical non-equilibrium transport conditions were identified and quantified with PolDOC. Model showed that the Bt horizon acted as a sink to partly retain DOMSURF. While differences in ISO and SMX transport could be explained by different sorption reactivity with the soil solid phase, the increased leaching of EPX in presence of DOMSURF required the activation of co-transport with DOMSURF.

References:

Barriuso, E., Andrades, M.-S., Benoit, P., and Houot, S. (2011) Biogeochemistry 106, 117–133.

Borgman, O., and Chefetz, B. (2013) Water Research 47, 3431–3443.

Chabauty F., Pot V., Bourdat-Deschamps M., Bernet N., Labat C., and Benoit P. (2016) Environmental Science and Pollution Research, 23, 7, 6907-6918.

Totsche, K.U., Danzer, J., and Kögel-Knabner, I. (1997). Journal of Environment Quality 26, 1090–1100.

How to cite: Pierre, B., Jeanne, D., François, L., Florian, C., and Valérie, P.: Assessing the multiple effects of dissolved organic matter on the transport of organic pollutants in subsoil horizons through a modular modeling approach, EGU General Assembly 2023, Vienna, Austria, 23–28 Apr 2023, EGU23-12446, https://doi.org/10.5194/egusphere-egu23-12446, 2023.

EGU23-12570 | Posters on site | HS8.1.3

Microbial degradation of PFAS for remediation of contaminated soil and groundwater (bioPFAS) 

Fritjof Fagerlund, Nicola Messinger, Lutz Ahrens, Stefan Bertilsson, Dan Berggren Kleja, Jonny Bergman, Qusay Naji, Gareth Leonard, Sara Sahlin, and Sofia Westling

Per- and polyfluoroalkyl substances (PFAS) are very challenging to remediate and remove from contaminated soil and groundwater. While there is ongoing research on the topic, there is still a lack of cost-efficient techniques for in-situ or on-site PFAS degradation, largely due to the extreme recalcitrance of perfluoroalkyl acids (PFAAs), which are often the end-products of environmental PFAS transformations. Microbial degradation is a key process for the removal of many organic contaminants from the environment. There is also growing evidence from laboratory studies that under the right conditions microbial degradation of PFAS, including PFAAs occurs, indicating that microbial degradation potentially can be developed into a useful PFAS remediation method. At the same time, there is a lack of knowledge about microbial PFAS-degradation processes and the organisms involved. Improved knowledge of PFAS biodegradation is also necessary to better understand PFAS mass transport from contaminated hotspots.

Here, the aims, methods and preliminary results of a newly started research project: “Microbial degradation of PFAS for remediation of contaminated soil and groundwater” (bioPFAS) are presented. The project aims at investigating how conditions for microbial degradation can be stimulated at PFAS-contaminated sites, the degree and rates of degradation that can be achieved, the main environmental factors governing degradation and the organisms involved. Systematic laboratory studies will be performed using a large number of incubations to identify and characterize PFAS-active microbial strains and consortia as well as governing environmental factors. PFAS transformations will be quantified and characterized and the potential for field application will be investigated first in soil columns and subsequently in a small field demonstration test. Geochemical and PFAS-transport models will be used to further investigate the feasibility of microbial PFAS degradation and any associated risks.

How to cite: Fagerlund, F., Messinger, N., Ahrens, L., Bertilsson, S., Berggren Kleja, D., Bergman, J., Naji, Q., Leonard, G., Sahlin, S., and Westling, S.: Microbial degradation of PFAS for remediation of contaminated soil and groundwater (bioPFAS), EGU General Assembly 2023, Vienna, Austria, 23–28 Apr 2023, EGU23-12570, https://doi.org/10.5194/egusphere-egu23-12570, 2023.

EGU23-12632 | Orals | HS8.1.3

The role of biofilm as a bio-accumulator of Ultraviolet Filters in porous media 

Paula Rodriguez-Escales, Sonia Jou, Jesus Carrera, Lurdes Martinez, Silvia Diaz-Cruz, Adria Sunyer, Gerard Quitana, and Cristina Valhondo

Ultraviolet filters (UVFs) are contaminants of emerging concern (CECs) produced and used in large quantities worldwide. They are constituents of a large number of personal care and hygiene products and other consumer goods. Benzophenones, such as benzophenone-3 (BP-3), benzophenone-4 (BP-4) and avobenzone (AVO), are among the most used. These compounds are characterized by being photo-stable and lipophilic. Although it is highly known the lipophilicity of these compounds, their monitoring in porous media is centered in the aqueous phase. Nevertheless, their high logKow make foreseeable the accumulation in more lipophilic phases such as biofilm or sedimentary organic matter. For that, in this work we have highly characterized a Managed Aquifer Recharge system with a very intensive monitoring of benzophenones and transformation products in the three phases: water, biofilm and sedimentary organic matter. Furthermore, we have contrasted our results with a numerical model, which was based on the partition of UVFs under equilibrium conditions. Our results show that biofilm acted as an additional environmental compartment favoring the retention and degradation of UVFs in porous media. Indeed, it played a central role in the fate of these compounds, controlling both sorption and biodegradation. With this we believe that the current understanding of the organic compounds fate should incorporate it as a new compartment capable of bio-accumulate these compounds.

How to cite: Rodriguez-Escales, P., Jou, S., Carrera, J., Martinez, L., Diaz-Cruz, S., Sunyer, A., Quitana, G., and Valhondo, C.: The role of biofilm as a bio-accumulator of Ultraviolet Filters in porous media, EGU General Assembly 2023, Vienna, Austria, 23–28 Apr 2023, EGU23-12632, https://doi.org/10.5194/egusphere-egu23-12632, 2023.

EGU23-12856 | Orals | HS8.1.3

Modeling the environmental fate of the natural toxin ptaquiloside: production, release and leaching to groundwater 

Efstathios Diamantopoulos, Daniel Bernado García-Jorgensen, Maja Holbak, Per Abrahamsen, and Hans Chr. Bruun Hansen

Plants produce a diverse array of toxic compounds which may be released by precipitation, that explains their wide occurrence in surrounding soil and water. This study presents the first mechanistic model for describing the generation and environmental fate of a natural toxin, viz.  ptaquiloside (PTA), a carcinogenic phytotoxin produced by bracken fern (Pteridium aquilinum L. Kuhn). The newly adapted DAISY model was calibrated based on two-year monitoring performed in the period 2018-2019 in a Danish bracken population located in a forest glade. Several functions related to the fate of PTA were calibrated, covering processes from toxin generation in the canopy, wash off by precipitation and degradation in the soil. Model results (2018-2019) show a good description of observed bracken biomass and PTA contents, indicating that toxin production can be explained by biomass and bracken development stage. The wash off is maximum in the middle of summer, coinciding with the moment of maximum biomass, fully developed canopy and highest PTA content. Model results show that only 4.4 % of the PTA produced in bracken is washed off by precipitation, from both canopy and litter. Once in the soil, PTA degrades rapidly, especially during summer due to the high soil temperatures. Leaching takes place in form of pulses directly connected to precipitation events, with maximum simulated concentrations up to 4.39 µg L-1 at 50 cm depth. Macropore transport is responsible for the events with highest PTA concentrations, contributing to 72% of the total mass of PTA leached. Based on the results, we identify areas with high precipitation and soils characterized by fast transport, as the most vulnerable to surface and groundwater pollution by phytotoxins

How to cite: Diamantopoulos, E., García-Jorgensen, D. B., Holbak, M., Abrahamsen, P., and Bruun Hansen, H. Chr.: Modeling the environmental fate of the natural toxin ptaquiloside: production, release and leaching to groundwater, EGU General Assembly 2023, Vienna, Austria, 23–28 Apr 2023, EGU23-12856, https://doi.org/10.5194/egusphere-egu23-12856, 2023.

EGU23-15414 | ECS | Orals | HS8.1.3

Hydrogeological, hydrodynamic and anthropogenic factors affecting the spread of pharmaceuticals and pesticides in water resources of the Granada plain (Southern Spain) 

Marta Inés Llamas, Pablo Jiménez-Gavilán, Juan Antonio Luque-Espinar, José Benavente-Herrera, Lucila Candela, Mónica Sanmiguel-Martí, Javier Rambla-Nebot, José Luis Aranda-Mares, and Iñaki Vadillo-Pérez

The anthropogenic organic contaminants contemplated in the environmental legislation, as well as those of emerging concern, threaten the quality of water resources to a degree that remains largely unknown. Contaminant exposure in the aquatic environment is a crucial element if a full understanding of the risk is pursued. There are still many uncertainties about the occurrence of organic contaminants and their behavior in the hydro(geo)logical media in large scale areas. The case study of the unconfined aquifer of the Granada Plain (approximately 200 km2) is presented here. Two groundwater and surface water monitoring campaigns were conducted (March 2017 and June 2018). Water samples were analysed for (i) 171 organic contaminants (e.g., pesticides, pharmaceuticals, drugs of abuse, PAHs); (ii) major and minor ions (Ca2+, Mg2+, Na+, K+, Cl-, SO42-, HCO3-, NO3-) and (iii) isotopes of the water molecule (δ18O, δ2H) and δ13C from the dissolved inorganic carbon. Additionally, in situ measurements of physico-chemical parameters (pH, temperature, electrical conductivity, redox potential and dissolved oxygen) were carried out. In total, 41 organic pollutants were detected, at least once: 17 pharmaceuticals or drugs of abuse, 21 pesticides or their metabolites and three PAHs. Statistical tests confirmed the significance of seasonal changes for some of these parameters (e.g., EC, Cl-, F-, δ18O, δ13C), revealing the influence from snowmelt water input on streams and the intensification of irrigation. In March 2017, the group of pesticides (largely represented by triazines) predominated, whereas the frequency of detection of pharmaceuticals increased substantially in June 2018. Based on the obtained results, a qualitative evaluation has been made to suggest four main factors affecting the spatial and seasonal variation of organic pollutants in the aquifer: (i) the variation of the unsaturated zone thickness; (ii) the river-groundwater hydraulic connection; (iii) the hydraulic gradient; and (iv) the anthropogenic factor determining the period of contaminant release throughout the year and wastewater management practices. The river-groundwater hydraulic connection can be especially important in the case of those contaminants whose main path of entry into the aquatic environment occurs through wastewater discharge into streams (i.e., pharmaceuticals).

How to cite: Llamas, M. I., Jiménez-Gavilán, P., Luque-Espinar, J. A., Benavente-Herrera, J., Candela, L., Sanmiguel-Martí, M., Rambla-Nebot, J., Aranda-Mares, J. L., and Vadillo-Pérez, I.: Hydrogeological, hydrodynamic and anthropogenic factors affecting the spread of pharmaceuticals and pesticides in water resources of the Granada plain (Southern Spain), EGU General Assembly 2023, Vienna, Austria, 23–28 Apr 2023, EGU23-15414, https://doi.org/10.5194/egusphere-egu23-15414, 2023.

EGU23-15708 | ECS | Posters on site | HS8.1.3

Tridimensional vulnerability assessment of wells supplying drinking water in agricultural areas 

Leonardo Costa and Paolo Salandin

In the Treviso province (Veneto, Italy) most of the drinking water (nearly 60 %) is supplied from wells located in the northern piedmont area, where agricultural activities are developed using chemical plant protection products (chemical PPPs). In this area the aquifer interested by the groundwater extraction is unconfined, making the subsurface water resource intrinsically vulnerable to any PPP or PPP residue (metabolite) leaching from the agricultural soil to the groundwater table, and raising concerns about the consequences of a possible groundwater contamination on the health of the local inhabitants.

To protect the drinking water resource, in 2019 the Veneto Region provided a technical framework for the definition of the wellhead protection areas (WHPAs, Resolution 1621) in accordance with the EU directives 2000/60 and 2006/118, related to the establishment of safeguard zones for the water bodies used for drinking water supply.  In the WHPAs the use of PPPs is only allowed when accounting for the vulnerability of the groundwater and the well extracting water for human consumption. 

To define the vulnerability of wells supplying drinking water, a procedure that considers the tridimensional behavior of a possible contaminant is suggested, taking into account the mobility of the chemical species across the vadose zone, the total amount of PPPs applied on the soil, and combining the probability of contaminant infiltration with the groundwater pathlines reaching the well.

An application has been developed in the piedmont area of the Treviso province where a geospatial analysis of the vine-specific PPPs sales data identified over 30 WHPAs potentially affected by the PPPs use. 

The 3D vulnerability assessment couples the position of the vulnerable WHPAs retrieved from the geospatial analysis with 1) the data related to the infiltration capacity of agricultural and not-agricultural unsaturated soils in the piedmont area of the Treviso province, 2) the mobility of the vine-specific PPPs, and 3) the groundwater pathlines in the superficial phreatic aquifer obtained by physically-based numerical modeling.

This research has been funded by the contribution from the UNI-IMPRESA 2021 joint research project (Centre of Hydrology ‘Dino Tonini’ - University of Padua, Alto Trevigiano Servizi Spa, Piave Servizi Spa): Subsurface Water quality and Agricultural pracTices monitoring 2 (SWAT-2).

How to cite: Costa, L. and Salandin, P.: Tridimensional vulnerability assessment of wells supplying drinking water in agricultural areas, EGU General Assembly 2023, Vienna, Austria, 23–28 Apr 2023, EGU23-15708, https://doi.org/10.5194/egusphere-egu23-15708, 2023.

EGU23-15967 | Posters on site | HS8.1.3

The differentiation of pharmaceutical concentrations at two river bank filtration sites located in Warta River valley (Poland) - preliminary results 

Krzysztof Dragon, Roksana Kruć-Fijałkowska, Dariusz Drożdżyński, and Józef Górski

Emerging contaminants (e.g. pharmaceuticals, personal care products, drugs or pesticides) are increasingly detected in aquatic environments. The most apparent contamination source of river water pollution by pharmaceuticals are sewage treatment plant stations that discharge treated sewage effluent to the rivers. The river bank filtration systems (RBF) can effectively remove these contaminants from polluted river waters. The two RBF sites were examined for pharmaceuticals occurrence that are located in the Warta River valley (Poland): Śrem waterworks located upstream and Gorzów waterworks located downstream from Poznan city. The water samples for pharmaceuticals investigation (114 substances in total) were taken from the river and from four continuously pumped wells in each site. Two wells at a close distance from the river were chosen at each site (40-50 m) and two wells located at a greater distance from the river (70 m in Śrem and 110 m in Gorzów). A visible increase in pharmaceutical concentration was observed in the river water. The sum of pharmaceuticals concentration is 8151 ng/l in the Śrem location, while in the Gorzów location, the sum of pharmaceuticals concentration is 9142 ng/l. Most probably, this increase is caused by the influence of treated sewage effluent from Poznań city and towns and villages located along the river. A considerable differentiation in pharmaceuticals removal rate was observed. In the Śrem site the sum of pharmaceuticals concentration in wells is between 657 ng/l and 3290 ng/l, while in the Gorzów site despite the higher concentrations of pharmaceuticals in the river, the pharmaceuticals were detected only in one well located at a close distance from the river (two substances at a total concentration of 92 ng/l). The research presented proves a very different rate of pharmaceuticals removal even on sites located at similar hydrogeological conditions and demonstrates the necessity of its monitoring, especially in groundwater that is strongly influenced by river water contamination (like RBF sites). This work has received funding from the National Science Centre of Poland (grant no. 2021/41/B/ST10/00094).

How to cite: Dragon, K., Kruć-Fijałkowska, R., Drożdżyński, D., and Górski, J.: The differentiation of pharmaceutical concentrations at two river bank filtration sites located in Warta River valley (Poland) - preliminary results, EGU General Assembly 2023, Vienna, Austria, 23–28 Apr 2023, EGU23-15967, https://doi.org/10.5194/egusphere-egu23-15967, 2023.

EGU23-111 | Orals | HS8.1.5

Impact of Abiotic Attenuation Reactions on Chlorinated Solvent Fate in Diffusion-Limited Clay Lenses 

Charles Werth, Timothy Blount, Kade Kearney, Danielle Tran, and Charles Schaefer

Back diffusion of chlorinated solvents from low permeability media remains a challenge to remediation of contaminated groundwater in heterogeneous subsurface environments. Naturally occurring abiotic dechlorination of trichloroethene (TCE) has shown potential as a viable natural attenuation mechanism, particularly at sites where in-situ remediation technologies have generated reducing conditions favorable for the generation of reduced iron minerals. These abiotic processes may occur under anaerobic conditions or aerobic conditions when oxygen is introduced to reduced sediments. Quantification of aerobic/anaerobic abiotic dechlorination rate constants to date has generally been performed using bench-scale batch experiments with low solids to water ratios and well-mixed conditions, confounding extension of the results to the field where mass transfer limitations dominate.  To address this knowledge gap, bench-scale experiments were conducted to evaluate diffusive transport of TCE and coupled aerobic/anaerobic abiotic dechlorination. The natural clays used in this study were collected from several chlorinated solvent impacted sites and characterized for geochemical parameters including ferrous iron content, electron shuttle mediated oxidation-reduction potential (ORP), and mineralogy via X-ray diffraction (XRD). Clays were packed into gas-tight serum bottles under anaerobic conditions to a saturated bed depth of 4 centimeters, and TCE was injected at the top of the clay beds. For the aerobic experiments, a slug of oxygenated water was introduced at the top of the clay immediately prior to spiking with TCE. Headspace and aqueous samples were periodically collected and monitored for reduced gases and organic acids associated with abiotic transformation of TCE in the presence of ferrous minerals. 14C-radiolabeled TCE was used for select experiments to facilitate detection of dechlorination products at low concentrations indicative of conditions near a dilute solvent plume.   Accumulation of expected TCE dechlorination products under aerobic (organic acids) and anaerobic (primarily acetylene) conditions was observed in the diffusion experiments. Detection of 14C dechlorination products served to clearly distinguish compounds originating from TCE. A one-dimensional coupled reaction and diffusion model was developed to describe diffusive transport of TCE and dechlorination products into and out of the clay bed. First order abiotic dechlorination rate constants were determined by fitting profiles of reduced gas and organic acid generation over time, using literature values for molecular diffusion coefficients and clay tortuosity. Following conclusion of the experiments, depth-discrete ORP measurements of the packed clay beds from the aerobic diffusion experiments will be conducted, providing further insight into the effect of oxidative TCE transformation on local geochemistry near the groundwater table and the relative contribution of aerobic abiotic degradation. The results of this study elucidate the capacity for abiotic natural attenuation to reduce TCE mass flux out of clays in dilute plumes under a variety of geochemical conditions.

How to cite: Werth, C., Blount, T., Kearney, K., Tran, D., and Schaefer, C.: Impact of Abiotic Attenuation Reactions on Chlorinated Solvent Fate in Diffusion-Limited Clay Lenses, EGU General Assembly 2023, Vienna, Austria, 23–28 Apr 2023, EGU23-111, https://doi.org/10.5194/egusphere-egu23-111, 2023.

Accurate prediction of flow and solute migration through the subsurface porous media is essential for the reclamation of the polluted aquifer and future contamination control. This study focuses on the dispersion process under non-Darcian flow conditions in the laboratory using a synthetic single fracture. A sand-packed single fracture of 1000 cm length and 0.3 cm fracture aperture was fabricated in the laboratory for conducting flow and contaminant transport experiments. Non-Darcian flow conditions prevailed in the filled-single fracture and were best simulated by the Forchheimer equation. Sodium Flouride (NaF) was used as a reactive contaminant in the experiments and was injected using Pulse-type boundary conditions. The resulting Breakthrough Curves (BTCs) were found to be non-Fickian with long tailings and early arrival. Solutions of the Convective-Dispersive equation (CDE) and Mobile Immobile (MIM) transport equations (for constant, linear, and exponential distance-dependent dispersion) were obtained through the Implicit finite difference technique. For different flow velocities, the MIM model was better at simulating the long tailings and early arrival of BTCs. Further, it is observed that constant (MIMC) and exponential distance-dependent (MIME) dispersion models are better at simulating observed BTCs compared to the linear-distance dependent (MIML) dispersion model. Through the statistical analysis and goodness of fit, the suitability of MIME and MIMC in describing contaminant transport through fracture was further confirmed.

Keywords:  non-Fickian; Filled-single fracture; non-Darcian; Breakthrough curves; Forchheimer equation; MIM model.

How to cite: Pandey, S. and Sharma, P. K.: Experimental and numerical simulation of the reactive contaminant migration for non-Darcian flow in a filled-single fracture, EGU General Assembly 2023, Vienna, Austria, 23–28 Apr 2023, EGU23-416, https://doi.org/10.5194/egusphere-egu23-416, 2023.

The movement of solute or chemical species into the subsurface has been a concern of groundwater quality variation due to its hazardous and severe health-related effects. To understand and reliably predict the migration and fate of contaminants in the subsurface, modeling is necessary. In this study, the experiment is carried out to investigate the contaminant migration through porous media, particularly the solutes emerging through the pesticides. A soil column experiment is setup to trace the particles and their behavior is analyzed, which is validated using the numerical model. This model uses the advection-dispersion equation (ADE), taking the application of effective dispersivity in order to account for the local heterogeneity. The implicit finite difference technique has been incorporated into the numerical model. The implication of macrodispersivity provides a plentiful assay in delineating the transport process and a perspective for large-scale heterogeneities. Results exhibit the concentration profiles of pesticides in the function of depth and time that can be employed to identify the areas with higher contaminant loading in the groundwater, posing a severe threat to groundwater and human health. This necessitates the experimental and numerical model to predict the contaminant migration process and to lay down changes in policy-making, monitoring of harmful chemicals, adoption of good agricultural practices, and execution of water safety regulations which, in turn, can be incorporated in determining the emerging contaminants, PFASs, etc.,  in the groundwater.

How to cite: Gupta, K. R. and Sharma, P. K.: Unraveling the leaching of pesticide transport through porous media with an experimental and numerical study, EGU General Assembly 2023, Vienna, Austria, 23–28 Apr 2023, EGU23-640, https://doi.org/10.5194/egusphere-egu23-640, 2023.

Advent of pre-exascale and exascale computers opens possibility for much higher resolution simulations of porous media flows. During the launch phase of the LUMI supercomputer, a number of simulations of wormhole growth commenced with an aim to use as much spatial information as possible with up to 1e9 DOFs. The goal was to investigate if properties of growing wormholes could be recovered if sufficient resolution is assured. Samples used in this study underwent experimental studies. They were scanned before and after the experiment, as well as during the dissolution. This 4D tomographic data provided necessary input for high-res simulations as well as validation framework.

Fig: Wormhole groth patter with branching and rapid direction change observed in evperiment

As the LUMI computer, as well as most of the newly built HPC machines, is based on GPUs we decided to use the Lattice Boltzmann code as main flow and transport solver. LBM has significant number-crunching performance thanks to its intrinsic parallelization properties which was paramount for this study. Based on an open-source, highly parallel multi-GPU TCLB solver, we design the model capable of handling Darcy - scale simulations with the initial porosity fields constructed based on X-ray microtomography images. In particular, we analyze the reactive-infiltration instabilities, which lead to the  formation of dissolution fingers (wormholes), in which both the flow and reactant transport become spontaneously localized.


Since dissolution fingers dramatically increase permeability of the rock, wormholing is important both for industrial applications and in hydrogeological studies. The main problem in modeling of wormholing is a multi-scale character of this process, with flow and transport near a wormhole tip strongly coupled to the macroscopic geometry of the emerging structures. The ability to perform large scale parametric and sensitivity studies of wormholing constitutes thus an important addition to experimental studies, hence the need for a high throughput simulator. 

We test our numerical predictions against the data from time-lapse dissolution experiments in an aim of constructing a predictive model capable of recovering time evolution of 3D wormhole shape based on the initial X-ray tomography data. 


How to cite: Dzikowski, M., Szymczak, P., and Sharma, R.: Empowering pre-exascale computers for Darcy-Brinkman simulation of wormhole growth based on X-CT data - can we recover experiments?, EGU General Assembly 2023, Vienna, Austria, 23–28 Apr 2023, EGU23-739, https://doi.org/10.5194/egusphere-egu23-739, 2023.

EGU23-1013 | ECS | Orals | HS8.1.5

The combined vulnerability: a novel hybrid index for the aquifer vulnerability assessment 

Irene Pomarico, Aldo Fiori, Antonio Zarlenga, Vittorio Catani, and Guido Leone

The aim of the present work is to extend the existing overlay and index method for aquifer vulnerability assessment to groundwater transport. This novel procedure falls into the category of “hybrid” methods since it combines the overlay and index methods, that considers only vertical transport through the vadose zone, with the horizontal transport through groundwater. Based on a simple probabilistic analysis, we can use any overlay and index method for the assessment of the probability that the contaminant reaches the groundwater then such probability is propagated within the aquifer using the piezometric surface as proxy of the groundwater flow. For this purpose, geomorphological methods, usually available in Geographic Information Systems (GIS) software, were used. This study leads to the definition of a new index called combined vulnerability index υ which considers the transport of the contaminant from soil surface that takes care of both transport in the vadose zone and the aquifer. The procedure is applied to a groundwater catchment area in the Campania region (Southern Italy) with the use of QGIS software. The method is independent from the index and overlay method used and the hydraulic characteristics of the aquifer. Furthermore, this procedure is simple as it requires a few data and it can be used to analyze large areas, demonstrating its effectiveness in assessing the intrinsic vulnerability of groundwater.

How to cite: Pomarico, I., Fiori, A., Zarlenga, A., Catani, V., and Leone, G.: The combined vulnerability: a novel hybrid index for the aquifer vulnerability assessment, EGU General Assembly 2023, Vienna, Austria, 23–28 Apr 2023, EGU23-1013, https://doi.org/10.5194/egusphere-egu23-1013, 2023.

Geological CO2 sequestration (GCS) is one of the most promising technologies for mitigating greenhouse-gas emission into the atmosphere. In GCS operations, residual trapping is the most favorable form of trapping mechanism because of its storage security and capacity. This novel storage option for CO2 involves injecting supercritical CO2 (scCO2) into porous formations saturated with pore fluid such as brine and initiate CO2 flooding with immiscible displacement. Despite of significant effects on macroscopic migration and distribution of injected CO2, however, only a limited information is available on the effects of immiscible two-phase flow on dynamic phenomena in microscopic scCO2-brine-glass pore systems. In this study, the effects of hydrodynamic characteristics of two immiscible fluids - carbon dioxide in supercritical phase and porewater - and their interfaces on their migration and distribution patterns in heterogeneous pore networks are investigated. For the purpose, a series of injection experiments were performed using 2D transparent micromodels. The immiscible two-phase flow with displacement and residual phenomena during drainage processes in heterogeneous pore networks were visually observed using a high-resolution microscope and a camera, and the temporal and spatial changes in distribution and saturation of the two immiscible fluids were quantitatively estimated at the pore-scale using image processing. To compare with experimental results and to analyze the phenomena quantitatively, a series of numerical simulations are also carried out. A 2D phase field model is established in the COMSOL Multiphysics platform and is applied to simulate the two-phase flow and immiscible displacement phenomena during drainage processes in pore networks with varying major model parameters such as injection mass flow rates, contact angles, viscosity ratios etc. The experimental observations are used to validate the accuracy of the numerical model. The results from experimental observations and numerical simulations are in good agreement in migration and distribution patterns and can provide important fundamental information on hydrodynamic characteristics of immiscible two-phase flow at pore-scale in porous networks for geological CO2 sequestration.

How to cite: Wang, S., Lee, M., and Kim, S.-O.: The effects of fluid characteristics in immiscible two-phase flow on migration and residual phenomena in heterogeneous pore networks, EGU General Assembly 2023, Vienna, Austria, 23–28 Apr 2023, EGU23-1703, https://doi.org/10.5194/egusphere-egu23-1703, 2023.

Simulation of fate and transport mechanisms in the porous systems from contaminant transport models are affected by uncertainty associated with input model parameters. Sensitivity analysis (SA) provides tools to quantify the sources of uncertainty to the variations in the model output metrics. To quantify the uncertainty associated with physical non-equilibrium contaminant transport model, global SA was conducted for the problem mimicking reactive transport in the saturated soil column conditions. Five global SA methods, namely Morris, RSA (Regionalized Sensitivity Analysis), Sobol, FAST (Fourier Amplitude Sensitivity Test), and PAWN, were tested based on the temporal moments of contaminant concentrations for two output metrics: zeroth temporal moment (ZTM) and mean residence time (MRT). The ranking order of ten input model parameters from global SA methods for two output metrics was compared. Morris SA implied that the ZTM at outlet of the soil column is highly sensitive to sorption distribution coefficient in the mobile and immobile regions and less sensitive to dispersion coefficient and degradation rate constant in the immobile region. The mass-transfer coefficient showed highest non-linear interactions with other flow and transport parameters based on the highest value of standard deviation of elementary effects (EEs) for ZTM output metric. The sorption distribution coefficient in the mobile region and mass-transfer coefficient showed highest sensitivity and non-linear effect toward MRT based on the Morris method. The comparison of global SA methods revealed that the top two sensitive parameters affecting ZTM and MRT were the same from all the considered methods. However, large difference in the ranking order of bottom three sensitive parameters was observed. The sorption distribution coefficient of mobile region and mass-transfer coefficient were observed as the most sensitive parameters affecting ZTM and MRT based on the comparison of all five global SA methods. Overall results suggest that the non-linear contaminant transport model should be examined based on multiple sensitivity output metrics via a multi-model approach. The multi-model global SA approach implemented in this study highlighted its significance in quantifying the interplay of non-linear model parameters.

How to cite: Guleria, A. and Chakma, S.: Global sensitivity analysis of physical non-equilibrium contaminant transport model for reactive transport in a saturated porous system, EGU General Assembly 2023, Vienna, Austria, 23–28 Apr 2023, EGU23-1804, https://doi.org/10.5194/egusphere-egu23-1804, 2023.

EGU23-2015 | Posters on site | HS8.1.5

Interpretation of the push and pull tracer test data in heterogeneous aquifers 

Antonio Zarlenga and Maria Rita Maggi

Heterogeneous aquifer characterization is a key step in both quantitative and qualitative groundwater studies. The high cost required in the flow field characterization and the small budget usually available make accurate and effective models for data analysis and information acquisition necessary.

We present here a methodology for the interpretation of the tracer test data widely used in the aquifer characterization; in particular we focus on the push and pull test, the latter is commonly adopted for the investigation of the hydrogeological and chemical parameters of aquifers.

Our stochastic methodology through the direct simulation of transport within a heterogeneous formation, allows to characterize the main geostatistical properties of the flow field and the main transport parameters. The model conceptualization is a stratified formation with isotropic log-hydraulic conductivity normally distributed; the integral scale in the vertical direction is IY,V while the horizontal integral scale is unbounded IY,H=∞ The flow field is assumed to be steady state and driven by the pumping rate. Transport is simulated by a Lagrangian procedure considering advection dispersion and equilibrium adsorption reaction. The results show that adopting different test setup many aquifer parameters can be obtained. The promising methodology was tested with field data from literature, showing encouraging results.

How to cite: Zarlenga, A. and Maggi, M. R.: Interpretation of the push and pull tracer test data in heterogeneous aquifers, EGU General Assembly 2023, Vienna, Austria, 23–28 Apr 2023, EGU23-2015, https://doi.org/10.5194/egusphere-egu23-2015, 2023.

EGU23-2665 | ECS | Posters on site | HS8.1.5

Numerical analysis of scaling formation in geothermal systems: application in bubble columns 

Mohamad Omidi and Thomas Baumann

Scaling summarizes precipitation of solids on the surface of pipes, heat exchangers, and other equipment in various industrial processes, including geothermal systems. Scalings in carbonate systems, which make up one of the most important geothermal reservoirs, are caused by a disruption of the lime-carbonic acid-equilibrium. Increasing temperatures (e.g. at the motor of a pump) lead to oversaturation. Decreasing pressure itself also leads to oversaturation but also to the formation of gas bubbles and stripping of CO2. The latter causes a shift to higher pH-values and massive oversaturation and affects most facilities in the North-Alpine Foreland Basin. The omnipresent scalings reduce the efficiency and may cause significant downtimes. It is therefore important to predict the amount of scalings along the geothermal cycle.

While current hydrogeochemical models are capable to predict the risk and position of scalings, they are falling short with regard to the temporal development. They generally over-predict the amount of scalings which indicates that limiting processes, e.g. diffusion limited crystal growth, partial volume effects, and local equilibria have to be considered. This requires a combination of a fluid dynamics model and a hydrogeochemical model. Since the geothermal fluids are quite heterogeneous in their hydrochemical composition (from fresh water to brine) and both, equilibrium constants and kinetic rate constants, depend on the hydrochemical composition, coupling to an established hydrogeochemical model is favored to shorthand implementations of individual reactions.

Benchmark data for such improved models can be obtained from bubble columns. Here, a gas is injected at the bottom of a usually transparent pipe filled with a fluid of known chemical composition and the effects of stripping (or gas augmentation) can be monitored with high temporal and spatial resolution. The fluid flow is accessible through tracking of particles and gas bubbles. Bubble columns are also used in different industrial processes, providing additional applications for the developed model.

In this contribution we show the coupling of OpenFOAM, a very versatile computational fluid dynamics model, with PhreeqC, a widely used hydrogeochemical model, to simulate the effects of stripping on the formation of carbonate precipitates on the pipe walls and in dispersion. The model is compared to experimental data and a hybrid hydrogeochemical model which used an effective mass transfer rate for the gas-water exchange reaction as fitting parameter to cover the rate limiting processes.

How to cite: Omidi, M. and Baumann, T.: Numerical analysis of scaling formation in geothermal systems: application in bubble columns, EGU General Assembly 2023, Vienna, Austria, 23–28 Apr 2023, EGU23-2665, https://doi.org/10.5194/egusphere-egu23-2665, 2023.

The second member of the Kongdian Formation (Ek2) in the Cangdong Sag has become an important field of shale oil exploration in the Bohai Bay Basin. To investigate the occurrence characteristics and discuss the controlling factors of shale oil mobility in the Ek2, the research presented in this study is based on core and thin section observations, XRD analysis, total organic carbon (TOC), Rock-Eval pyrolysis, multiple isothermal stages (MIS) pyrolysis, low-temperature nitrogen physisorption (LNP), mercury intrusion porosimetry (MIP), and scanning electron microscopy (SEM). The results show that the Ek2 shales can be classified into five types of lithofacies, including laminated felsic shales, laminated mixed shales, massive mixed shales, laminated carbonate shales, and massive carbonate shales. The shales were characterized by high organic matter abundance and moderate thermal evolution with good to excellent hydrocarbon generation potential and contained a high abundance of Type I and II1 kerogens. Laminated felsic shales and laminated mixed shales had obvious advantages in the thermally extractable hydrocarbon content (S1) value, oil saturation index (OSI) value, free oil, and movable oil content with other lithofacies. Analysis of LNP, MIP, and MIS pyrolysis show that the residual shale oil mainly occurred in the pores with diameters smaller than 200 nm, and the occurrence pore diameters of residual oil in some laminated shale samples could reach 50 μm. The lower limits of the occurrence pore diameter of free oil and movable oil were 7 nm and 30 nm, respectively. The mobility of shale oil is controlled by the shale oil component, thermal maturity, TOC content, and pore volume.

How to cite: Dong, Q. and Chen, S.: Occurrence characteristics of lacustrine shale oil in the second member of the Kongdian Formation in the Cangdong Sag, Bohai Bay Basin, China, EGU General Assembly 2023, Vienna, Austria, 23–28 Apr 2023, EGU23-3793, https://doi.org/10.5194/egusphere-egu23-3793, 2023.

EGU23-4072 | Orals | HS8.1.5

Application of machine learning in predicting flow and transport in porous media 

Peyman Mostaghimi, Ying da Wang, Traiwit Chung, and Ryan Armstrong

Micro-CT imaging and pore-scale modelling have developed rapidly over the last decade by bridging the disciplines of geology, reservoir engineering, image processing, and computational fluid dynamics. They have provided new pathways for understating complex transport phenomena in heterogeneous geological formations. However, direct simulation of flow in these complex three-dimensional geometries can be difficult and time-consuming. Machine learning and Convolutional Neural Networks (CNN), as a part of the broader field of Artificial Intelligence (AI), can be integrated into the framework of pore-scale modelling. We propose a neural network architecture that considers features of the rock geometry as well as the conservation of mass and predicts the velocity distribution on the images. The method can be applied to two or three-dimensional rock images. The reliability of the flow prediction is studied by comparing the predicted permeability versus ground truth values as a bulk measure. Then, we study the accuracy of solute transport modelling. The results show that velocity fields obtained by CNN can have a considerable degree of error and are not suitable for accurate transport simulations. Finally, challenges and opportunities for the development of machine-learning approaches in porous media applications will be discussed.

How to cite: Mostaghimi, P., Wang, Y. D., Chung, T., and Armstrong, R.: Application of machine learning in predicting flow and transport in porous media, EGU General Assembly 2023, Vienna, Austria, 23–28 Apr 2023, EGU23-4072, https://doi.org/10.5194/egusphere-egu23-4072, 2023.

EGU23-4264 | ECS | Posters on site | HS8.1.5

The Input of Phosphate & Vanadium into the Lake Laacher See by Dissolution of Volcanic Rocks (East Eifel, Germany) 

Sascha Rudolph, Sven Philipp, Michael Pirrung, Karl-Heinz Köppen, and Thorsten Schäfer

The lake Laacher See (East Eifel, Germany) is affected by eutrophication due to high phosphorous concentration for stagnant waters averaging 34 µg/l (range of 25–40 µg/l P since the year 2000). These elevated concentrations have been monitored since the 1950s and an oligotrophic status could not be achieved despite various measures [2]. A linear correlation was determined between dissolved phosphate (211 – 643 μg/l) and vanadium (6.7 – 28.4 μg/l) in groundwaters of the Ringseitert volcanic complex (West Eifel) with implications for drinking water use [4]. These issues are the motivation to investigate the geogenic input of phosphorous into Laacher See and of vanadium into groundwaters by fluid-rock-interaction.

Laacher See is the water-filled crater area of the Plinian-erupted Laacher-See-volcano, which belongs to the East Eifel Volcanic Field with an active volcanism for 0.46 Ma [6]. The catchment of this lake includes rocks of siliciclastic Lower Devonian basement, scoria cones and lava flows of basanitic and tephritic compositions, and phonolithic to foiditic tephra from the Rieden volcanic complex. The youngest volcanic unit is the phonolithic, strong geochemically zoned tephra from the Laacher-See-volcano, which ejected 6 km³ magma in form of pumice and ash 12.9 ka ago [3,6].

The dissolution of apatite (primary) and vivianite (secondary phosphate phase) is assumed to be the reason of geogenic input of phosphorous and vanadium by groundwater flow. A particularity of the Laacher See area is the occurrence of mofettes that lead to elevated concentrations of CO2, decreased pH and enhanced apatite dissolution [5]. The hydrochemical modelling program PHREEQC is used to investigate the equilibrium state of phosphate and vanadium in groundwaters at specific Eh/pH-conditions, p(CO2)-values and compositions. In addition, residence times calculated by hydraulic conductivities and dissolution rates from batch experiments are used to distinguish between rate-limited or equilibrium process in phosphate dissolution. Data on phosphorous concentrations and pH of soils in the vicinity of the Laacher See and their equilibrium solutions are evaluated to their geological, geochemical and anthropogenic background and provide clues to phosphorous sources [1].

In future studies, bulk rock concentrations will be measured using XRF and total digestion, and detailed dissolution rates will be measured using extended batch experiments to combine these findings into a conceptual hydrogeological model of geogenic phosphate and vanadium input to lake Laacher See.

References:

[1] Armbruster, M. & Wiesler, F. 2012. Ermittlung der P-Gehalte entlang von 10 Transekten am Laacher See. LUFA Speyer, Speyer. P.24 (unpublished)

[2] Block, U. et al. 2015. Übersicht über die Phosphatthematik am Laacher See. Fachhochschule Bingen. P.41

[3] Bogaard, P.v.d. & Schmincke, H.U. 1984. The eruptive center of the late quaternary Laacher see tephra. Geologische Rundschau, 73, 933-980, http://doi.org/10.1007/BF01820883.

[4] Härter, L.M. et al. 2020. Vorkommen von Vanadium im Grundwasser der Vulkaneifel. Grundwasser, 25, 127-136, http://doi.org/10.1007/s00767-020-00447-x.

[5] Pan, H.B. & Darvell, B.W. 2009. Calcium Phosphate Solubility: The Need for Re-Evaluation. Crystal Growth & Design, 9, 639-645, http://doi.org/10.1021/cg801118v.

[6] Schmincke, H.-U. 2007. The Quaternary Volcanic Fields of the East and West Eifel (Germany). In: Ritter, J.R.R. & Christensen, U.R. (eds) Mantle Plumes: A Multidisciplinary Approach. Springer Berlin Heidelberg, Berlin, Heidelberg, 241-322, http://doi.org/10.1007/978-3-540-68046-8_8

How to cite: Rudolph, S., Philipp, S., Pirrung, M., Köppen, K.-H., and Schäfer, T.: The Input of Phosphate & Vanadium into the Lake Laacher See by Dissolution of Volcanic Rocks (East Eifel, Germany), EGU General Assembly 2023, Vienna, Austria, 23–28 Apr 2023, EGU23-4264, https://doi.org/10.5194/egusphere-egu23-4264, 2023.

EGU23-5683 | ECS | Posters on site | HS8.1.5

Chaos, Mixing, and Restart - Fluid-solid reaction enhancement under pore-scale chaotic advection 

Tomas Aquino, Tanguy Le Borgne, and Joris Heyman

Biogeochemical reactions at the interface between fluid and solid phases are of central importance to a broad range of natural and engineered processes in porous media. As dissolved reactants are transported through a porous medium, advection and diffusion act to homogenize their concentrations, in competition with reactive depletion at the solid interface. Transport limitations can limit reactant availability, leading to reduced reaction efficiency when compared to well-mixed conditions. Chaotic advection has been recently established to occur spontaneously in steady, three-dimensional flows through porous media. In this work, we explore and quantify its role in mitigating transport limitations and correspondingly increasing reaction efficiency. We employ the continuous time random walk framework to connect reaction delays due to transport limitations to the statistics of solute excursion times to the interface. Chaotic advection is associated with a rapid loss of memory of initial conditions and efficient exploration of the bulk of the pore space. We model the corresponding effect on excursion times through a stochastic restart process, such that reactant positions are randomly restarted homogeneously across the domain over a characteristic time scale that depends on flow and geometry. Processes that restart under some condition have received much attention in the context of search strategies, where it is known that they can increase the efficiency of the underlying process. Here, we find a corresponding effect on excursion times, and a consequent increase of reaction efficiency with Péclet number. As chaotic advection leads to efficient bulk exploration, low velocities near the interface due to no-slip boundary conditions become the limiting factor on mixing and thus control the restart rate. This has the surprising consequence that, while chaotic advection sets the stage for enhanced reaction efficiency, the increase is insensitive to the "strength" of chaos as quantified by the Lyapunov exponent, and is instead controlled by flow shear at the interface. The theoretical predictions are in excellent agreement with numerical simulations of reactive decay at solid surfaces in a crystalline porous medium, over a broad range of Péclet and Damköhler numbers.

How to cite: Aquino, T., Le Borgne, T., and Heyman, J.: Chaos, Mixing, and Restart - Fluid-solid reaction enhancement under pore-scale chaotic advection, EGU General Assembly 2023, Vienna, Austria, 23–28 Apr 2023, EGU23-5683, https://doi.org/10.5194/egusphere-egu23-5683, 2023.

EGU23-6162 | Orals | HS8.1.5

Precipitation of CaCO3 through induced mixing and its impact on solute breakthrough 

Guido Gonzalez-Subiabre, Daniel Fernàndez-Garcia, Michela Trabucchi, and Daniela Reales-Nuñez

Calcium carbonates precipitation plays an important role in several geological, biogeochemical and engineered processes. It has been extensively studied for its application in remediation of contaminated groundwater, enhancing oil and gas recovery, improving geological carbon storage, reducing leakage in tunnel buildings and also to understand dissolution processes in coastal karst aquifers. Most of these works are based on theoretical formulations,  numerical simulations or batch/column experiments and little experimental evidence under transport conditions are reported in the literature. In this work through mixing-induce precipitation experiments we propose the visualization and characterization of the dynamic of precipitation processes focused on the understanding of its influence in solute breakthrough. We performed the experiments in a transparent horizontal cell flow made of plexiglass with 26 x 20 x 1 cm dimensions. The tank was disposed horizontally and filled with glass beads of 2 millimeter. The flow-cell was initially saturated with double-deionized water. In the experimental investigation, two different chemical solutions containing 0,1 M CaCl2 and 0,1 M NaCO3 were injected in two separate inlet ports. Color tracer tests consisted on fluorescein were injected before and after the precipitation experiment with the objective of visualizing and quantifying the impact of precipitation in solute transport. We evaluated the effectiveness of the standard solute transport equation to represent precipitation processes and developed new mechanistic transport models.

How to cite: Gonzalez-Subiabre, G., Fernàndez-Garcia, D., Trabucchi, M., and Reales-Nuñez, D.: Precipitation of CaCO3 through induced mixing and its impact on solute breakthrough, EGU General Assembly 2023, Vienna, Austria, 23–28 Apr 2023, EGU23-6162, https://doi.org/10.5194/egusphere-egu23-6162, 2023.

EGU23-6329 | ECS | Orals | HS8.1.5

Local effects of the injection of undersaturated waters in geothermal applications 

Annette Dietmaier and Thomas Baumann

The Northern Alpine Foreland Basin (NAFB) in southwest Germany is home to more deep geothermal plants than any other region in the country. The upper Jurassic, its main aquifer, consists of permeable carbonates which bear waters with temperatures of up to 150 °C on the southern border, and total dissolved salts values of up to 2 g/L. Geothermal applications in the NAFB include medical spas, geothermal district heating and power generation.

In the case of heating and power generation, cooled-off waters are reinjected underground where rock-fluid interactions can lead to changes in the rock matrix and flow pathways. These interactions are thus an important factor to consider in the maintenance of geothermal plants. In carbonate systems, a decrease of temperature after heat extraction leads to an undersaturation of the previously equilibrated waters with regard to the host formation. The injected water dissolves the rock matrix along the borehole and the flow paths into the reservoir. This can increase the risk of a thermal breakthrough between injection and production well and possibly affect the borehole integrity. While the overall amount of dissolution has been monitored and modelled previously, the microscopic changes to the flow paths are still under investigation.

We used rock samples coated with a 2-component paint and produced one microfracture in the coating to overcome experimental restrictions due to a limited fluid volume of the autoclave. The experiments were run at typical injection temperatures between 40°C and 75°C. The CO2 partial pressure wasadjusted to the measured values in the injection borehole. Microscopic and Raman images were taken before and after the exposition of the rock to the undersaturated waters and complemented by hydrochemical analyses.

The dissolution of the limestones picked up microstructures and led to a heterogeneous development of the flow path. In an early stage of the injection, an underprediction of the increase of the hydraulic conductivity is thus expected.

These assessments allow insights into the kinetics taking place at the artificial disturbance, which will make it possible to characterize and quantify the 3-dimensional pattern of calcite dissolution at a localized scale which is important for the development of the hydraulic properties, and affects further dissolution.

How to cite: Dietmaier, A. and Baumann, T.: Local effects of the injection of undersaturated waters in geothermal applications, EGU General Assembly 2023, Vienna, Austria, 23–28 Apr 2023, EGU23-6329, https://doi.org/10.5194/egusphere-egu23-6329, 2023.

EGU23-6771 | ECS | Orals | HS8.1.5

Mechanisms of Solute Mixing in Darcy’s scale Heterogeneous Formations 

Aronne Dell Oca and Marco Dentz
Solute mixing in porous media plays a fundamental role in a variety of applications, e.g., environmental risk assessment, geochemical reactive transport. Mixing dynamics are strongly impacted by the medium heterogeneity, which leads to inhomogeneity of solute concentration within the spreading and the mixing volume. Considering Darcy scale heterogeneous formations, we develop a randomly dispersive lamellae approach in which the variability in the dispersion rates of the lamellae that constitute a solute plume is recognized as a fundamental aspect of the mixing dynamics. The framework allows representing the inhomogeneity of the concentration distribution within the mixing volume before the late time well-mixed condition is reached. Furthermore, in light of the hidden (data scarcity) and heterogeneous nature of environmental porous formations, the degree of mixing of a solute plume is uncertain. The proposed randomly dispersive lamellae framework represents a strategy to quantify the latter. We test our approach for mildly to highly heterogeneous formations.

How to cite: Dell Oca, A. and Dentz, M.: Mechanisms of Solute Mixing in Darcy’s scale Heterogeneous Formations, EGU General Assembly 2023, Vienna, Austria, 23–28 Apr 2023, EGU23-6771, https://doi.org/10.5194/egusphere-egu23-6771, 2023.

EGU23-7438 | ECS | Posters on site | HS8.1.5

Rayleigh-Bénard instability in heterogeneous porous media 

Rima Benhammadi, Juan José Hidalgo, and Marco Dentz

Convective mixing is present in a large assortment of natural and industrial processes, such as in carbon capture and sequestration, where it ensures a safer storage of carbon dioxide, seawater intrusion, high-level radioactive waste disposal sites and geothermal energy production. In this work, we study the effect of the heterogeneity on the behavior of convective mixing since most of the works that have been conducted so far did not take heterogeneity into consideration.

To do so, we consider the Horton-Rogers-Lapwood problem where convection is triggered by a Rayleigh-Bénard instability. Heterogeneity is represented by 2-D multi-Gaussian log-Normally distributed anisotropic permeability fields. We perform a parametric study in which we explore the effect of the variation of the Rayleigh number (Ra), the variance and the correlation length of the permeability field on the fingering patterns, mixing and dissolution fluxes. Mixing is characterized by the scalar dissipation rate and the boundary fluxes. The mixing state is evaluated through the probability density function (pdf) of the concentration and the intensity of segregation. We show the difference in behavior between the dissolution fluxes and the mixing state both for the case of homogeneous and heterogeneous porous media. We observe that convective mixing is enhanced in the case of heterogeneous porous media compared to the homogeneous counterparts.
An increase of Ra and of the variance of the permeability field causes a more rapid homogenization of the system and also a decrease in the interface width, the variance of the concentration pdf and the intensity of segregation. For permeability fields with a small correlation length, the effect of the heterogeneity is substantial only for a variance higher than 2. However, for a larger correlation length, this effect is more pronounced and the fingering patterns are no longer smooth but dispersive.

Based on these observations, an upscaling of the model based on the effective longitudinal and transverse permeability and the dispersion coefficient is performed.

Key words: convective mixing, Rayleigh-Bénard instability, heterogeneity, scalar dissipation rate, dissolution fluxes.

How to cite: Benhammadi, R., Hidalgo, J. J., and Dentz, M.: Rayleigh-Bénard instability in heterogeneous porous media, EGU General Assembly 2023, Vienna, Austria, 23–28 Apr 2023, EGU23-7438, https://doi.org/10.5194/egusphere-egu23-7438, 2023.

EGU23-9735 | ECS | Orals | HS8.1.5

Assessing karst formation at the laboratory scale by confronting geoelectrical and hydro-chemical monitoring 

Flore Rembert, Marie Leger, Damien Jougnot, and Linda Luquot

This study attempts to give some answers on how the electrical signal is impacted by conduit formation in limestone due to calcite dissolution, and how the electrical properties can be related to evolving structural parameters. Ensuring sustainable strategies to manage water resources in karst reservoirs requires a better understanding of the mechanisms responsible for dissolution features in the rock mass. The dissolution of carbonate core samples caused by CO2 or acid solution injection has already been well studied in the laboratory to understand the formation of conduits and their intricate coupling with transport properties such as permeability and porosity. However, these experiments generally rely on image analysis, an accurate technique that cannot be used in the field. Additionally, in a subsurface context, chemical analysis of the pore water can be quite intrusive, providing only restricted and spatially limited information. Thus, studying large-scale heterogeneities such as karst environments can benefit from the use of non-invasive tools such as the ones proposed in hydrogeophysics. In particular, geoelectrical methods are good candidates to detect the emergence of karstification related to the heterogeneous dissolution of large volumes since they present a high sensitivity to the physical and chemical properties of both porous matrix and interstitial fluids. We monitored the electrical conductivity, porosity, and permeability of two limestone core samples during controlled dissolution experiments driven by acid injection at atmospheric conditions under different flow rates creating preferential conduits. These two samples were also characterized before and after the acid percolation with laboratory methods and CT scan imaging. First, we confront the electrical conductivity variations to the evolution of permeability with time. We show that monitoring electrical properties allows us to sense the impact of dissolution in the porous medium long before the sample is percolated. This result is a key finding to highlight the great interest that electrical properties can represent in monitoring reactive percolation in karst systems. Then, we interpret the monitored electrical conductivity of the acid percolation with a physics-based model. This model describes the porous medium as a fractal cumulative distribution of tortuous capillaries with a sinusoidal variation of their radius. According to the model description, the sample electrical conductivity is interpreted in terms of effective structural parameters which are tortuosity and constrictivity. Confronting the model with the experimental results shows that the electrical signature of calcite dissolution is more impacted by the evolution of constrictivity than by tortuosity, while most of the literature focuses on the tortuosity and even neglects constrictivity when describing the pore space complexity with electrical conductivity measurements. Finally, based on our experimental results and data sets from the literature, we show that the characteristic Johnson length is a valuable structural witness of calcite dissolution impact linking electrical and hydrological properties. This small-scale approach to heterogeneous dissolution is an analog of the natural processes involved in forming conduits by dissolution leading to karstification. The results of this study are transferable to large-scale applications such as the survey of karst formation, CO2 geological storage, and geothermal energy recovery.

How to cite: Rembert, F., Leger, M., Jougnot, D., and Luquot, L.: Assessing karst formation at the laboratory scale by confronting geoelectrical and hydro-chemical monitoring, EGU General Assembly 2023, Vienna, Austria, 23–28 Apr 2023, EGU23-9735, https://doi.org/10.5194/egusphere-egu23-9735, 2023.

EGU23-10148 | ECS | Orals | HS8.1.5

Time-evolving dispersion (TED) model: towards a more realistic representation of Darcy-scale mixing in porous media 

Satoshi Tajima, Tomochika Tokunaga, Jiaqi Liu, and Marco Dentz

The advection-dispersion equation has been a key tool for modelling Darcy-scale solute transport. In the equation, local-scale mixing is expressed by the local dispersion coefficient, which considers mixing by molecular diffusion and pore-scale variability in flow velocity [1]. Mixing is enhanced by velocity variability on the Darcy scale, represented by spatial heterogeneity in hydraulic conductivity (K) [1].

     Observations show that the dispersion coefficient increases with the spatial scale [e.g., 2]. This effect is expressed by the macrodispersion coefficient increasing proportionally to the correlation length of heterogeneity in K [2]. Conventional upscaled advection-dispersion models assume constant macrodispersion coefficients [2], yet they typically overestimate the dispersive effect and can cause problems such as “back dispersion”, an unrealistic spreading of the solute in the direction opposite to the flow when groundwater flows towards a high concentration zone [3]. Explicitly representing local scale medium heterogeneity mitigates the overestimation of dispersion, however, this downscaled approach (hereinafter called the “local dispersion model”) requires the full representation of heterogeneity in K with a high spatial resolution. This comes at a high computational cost in numerical simulation whereas the detailed representation of the full K variability on the field scale is typically not feasible.

     Dentz et al. [4] showed that the effective dispersion coefficient (D) evolves temporally and asymptotically reaches a macrodispersion coefficient. They derived explicit analytical expressions for an idealized setting with an isotropic velocity spectrum in a steady state and constant local dispersion. From this finding, we hypothesise that accounting for the temporal evolution in D can mitigate the overestimation of dispersive processes in the macrodispersion model. Prospecting further applications to complex settings, this study aims to find an empirical formulation of the time-evolving dispersion (TED) coefficient. In this model, D is set to be identical to the molecular diffusion coefficient at the initial stage, and then it increases exponentially over time and asymptotically reaches a value identical to the macrodispersion coefficient after sufficient time has elapsed. We implemented the TED model by modifying the MODFLOW [5] source code and compared the simulation results with those from the macrodispersion and local dispersion models.

     The results from the TED model showed concentration distributions similar to the local dispersion model and less dispersive than those from the macrodispersion model, especially at early times in the simulations. The temporal evolution of D assumed in the TED model well matched that calculated from the spatial variance of the concentration distributions obtained by the local dispersion model. Therefore, the TED model can be an alternative to the conventional models for modelling Darcy-scale solute transport.


References

[1] Dentz, M., Hidalgo, J. J., & Lester, D. (2022). Transport in Porous Media.

[2] Gelhar, L. W. & Axness, C. L. (1983). Water Resources Research, 19(1), 161–180.

[3] Konikow, L. F. (2011). Ground Water, 49(2), 144-159.

[4] Dentz, M, Kinzelbach, H., Attinger, S., & Kinzelbach, W. (2000). Water Resources Research, 36(12), 3591–3604.

[5] Langevin, C., Hughes, J., Banta, E., Provost, A., Niswonger, R., & Panday, S. (2017). MODFLOW 6.

How to cite: Tajima, S., Tokunaga, T., Liu, J., and Dentz, M.: Time-evolving dispersion (TED) model: towards a more realistic representation of Darcy-scale mixing in porous media, EGU General Assembly 2023, Vienna, Austria, 23–28 Apr 2023, EGU23-10148, https://doi.org/10.5194/egusphere-egu23-10148, 2023.

EGU23-10829 | ECS | Orals | HS8.1.5

The mobility and interaction of colloidal-sized poly(ethylene glycol) in column experiments with carbonate rock 

Nimo Kwarkye, Elisabeth Lehmann, Ivo Nischang, Jürgen Vitz, Ulrich Schubert, Thomas Ritschel, and Kai Totsche

Soil releases a significant proportion of organic colloids such as humic substances, proteins, and polysaccharides that are mobile and reactive within subsurface fluids. The mobility of such colloids is governed by colloidal hydrodynamics and frequently features strong interactions at biogeochemical interfaces in porous media. Yet, the compositional and functional diversity of organic colloids makes it difficult to trace the mobility of specific colloidal fractions and identify the alteration of surfaces following local interactions. Additionally, conventional reactive tracers used to study solute transport in the subsurface usually fail to cover hydrodynamics of small-sized organic colloids. Hence, transport principles governing the mobility of organic colloids in the subsurface are not comprehensively explored. In this study, we applied tailor-made poly(ethylene glycol) (PEG) as a reactive tracer in column and batch experiments with naturally occurring calcium carbonate as the substrate. We demonstrate that PEG transport features strong interactions at carbonate biogeochemical interfaces as known for humic substances, proteins, and polysaccharides. Such interaction can be facilitated by electrostatic interactions between PEG and the surfaces of the carbonate substrate. With the tendency to alter mineral surfaces, scanning electron microscopy (SEM) images of substrates after transport experiments showed a characteristic modification of surface morphology. Besides sharing similar reactivity with organic colloids, PEG breakthrough was reconstructed using a continuum scale model with high accuracy. With PEG being available in similar hydrodynamic sizes as small-sized organic colloids, it can be a promising tracer to follow mobility of other organic colloids in the subsurface.

How to cite: Kwarkye, N., Lehmann, E., Nischang, I., Vitz, J., Schubert, U., Ritschel, T., and Totsche, K.: The mobility and interaction of colloidal-sized poly(ethylene glycol) in column experiments with carbonate rock, EGU General Assembly 2023, Vienna, Austria, 23–28 Apr 2023, EGU23-10829, https://doi.org/10.5194/egusphere-egu23-10829, 2023.

EGU23-11598 | ECS | Orals | HS8.1.5

Chaos in flatland: mixing in unsteady two dimensional porous media flow 

Kevin Pierce, Gaute Linga, and Marcel Moura

Solute mixing is efficient in a steady three dimensional porous media flow, since filaments of solute elongate exponentially fast in time. This "chaotic" elongation enables molecular diffusion to rapidly distribute solute concentrations. In two dimensional steady flows, such as through thin fractures in rock, existing knowledge indicates that filaments of solute elongate much more slowly than exponentially, meaning the mixing is far less efficient. Here, we present experimental evidence that when porous media flows are instead unsteady, two dimensional mixing becomes chaotic.  Using 3D printed model porous media with steady longitudinal and oscillating transverse flow components, we measure Lyapunov exponents of filament elongation and quantify solute stretching and folding statistics as a function of the frequency and amplitude of the transverse flow. We find resonances in mixing frequency which are consistent with numerical simulations of the model geometry. These findings improve our understanding of mixing in geological systems and provide insights which may be useful to design efficient geologically-inspired mixing devices in the future.

How to cite: Pierce, K., Linga, G., and Moura, M.: Chaos in flatland: mixing in unsteady two dimensional porous media flow, EGU General Assembly 2023, Vienna, Austria, 23–28 Apr 2023, EGU23-11598, https://doi.org/10.5194/egusphere-egu23-11598, 2023.

We develop a global collocation based meshfree method for simulation of solute transport in the saturated aquifer formations. We prove that the projected model is free from the limitations of mesh or grid which are used in finite element method (FEM) and finite difference method (FDM). We apply this model on different one and two-dimensional synthetic aquifer problems with advection-dispersion phenomenon. The results of these problems demonstrate that the proposed model is free from the limitations of unstable convergence and has a fixed range (i.e., 2-3) of shape parameter hence it requires less number of simulations to calibrate the model. More importantly, the proposed model is simple to code and shows a higher degree of unanimity with the analytical solution, making it a viable alternative to grid-based traditional methods. 


How to cite: Patel, S. and Gaurav, K.: Groundwater solute transport simulation using global collocation radial basis function based meshfree method, EGU General Assembly 2023, Vienna, Austria, 23–28 Apr 2023, EGU23-12548, https://doi.org/10.5194/egusphere-egu23-12548, 2023.

EGU23-12599 | ECS | Posters virtual | HS8.1.5

Riverine water chemistry and rock weathering processes of Qingyi River basin, a subtropical basin in east China 

Xin Huang, Tianshuo Pan, Mingda Cao, Jie Zhang, and Zhixin Zhang

To investigate the rock weathering processes in silicate-dominated subtropical basin in east China, we analyzed major ion compositions of rivers and precipitation samples in the Qingyi River basin in the lower reaches of the Yangtze River. In this study, the characteristics of weathering processes in the Qingyi River basin were identified, and the rock weathering rates and consumption rates of atmospheric CO2 were estimated based on water chemistry and the forward model. The results showed that the anthropogenic influences on rock weathering was not significant, which means the rock weathering in the study area was mainly induced by carbonic acid while the influence of sulfuric acid and nitric acid could be neglected. The cations of rivers were mainly contributed by weathering of carbonates (59.2%), followed by weathering of silicates (17.9%). Atmospheric precipitation and evaporites contributed 9.6% and 5.6%, respectively. Spatially, the carbonate weathering rates and silicate weathering rates decreased as order of tributary Huishui river in the upstream mountainous areas (32.04 t·km-2·a-1 and 20.97 t·km-2·a-1) > main stream of Qingyi river (24.12 t·km-2·a-1 and 8.91 t·km-2·a-1) > tributary Zhanghe river in the downstream areas (13.68 t·km-2·a-1 and 2.85 t·km-2·a-1). Similarly, the CO2 consumption rates from carbonates weathering and silicate weathering followed the order of tributary Huishui river (5.86×10⁵·mol·km-2 a-1 and 3.29×10⁵·mol·km-2 a-1) > main stream of Qingyi river (2.45×10⁵·mol·km-2 a-1 and 2.43×10⁵·mol·km-2 a-1) > tributary Zhanghe river (0.77×10⁵·mol·km-2 a-1 and1.39×105·mol·km-2 a-1). In conclusion, carbonate weathering induced by carbonic acid was dominant in the Qingyi River basin, with chemical weathering rates slightly lower than similar silicate-dominated subtropical basins in east China. The rock weathering rates in the study area differed spatially. In particular, silicate weathering in upstream mountainous areas accounted for more carbon sink of the whole Qingyi River basin, which is of great importance for the regional carbon cycle.

Key words: subtropical; Qingyi River basin; rock weathering; atmospheric CO2 consumption; carbon sink

How to cite: Huang, X., Pan, T., Cao, M., Zhang, J., and Zhang, Z.: Riverine water chemistry and rock weathering processes of Qingyi River basin, a subtropical basin in east China, EGU General Assembly 2023, Vienna, Austria, 23–28 Apr 2023, EGU23-12599, https://doi.org/10.5194/egusphere-egu23-12599, 2023.

EGU23-12742 | ECS | Posters virtual | HS8.1.5

Colloids movement at the wetting front during infiltration to sand 

Xinying Min, Naaran Brindt, Sunghwan Jung, and Tammo Steenhuis

Both preferential flow and colloid-sized particles facilitate groundwater pollution in the vadose zone. Preferential flow in sandy soils that overlays most aquifers is through unstable finger-like features. Studying colloid movement in these preferential flow paths is a crucial step toward better strategies for dealing with this pollution. In this study, we aimed to examine how the wetting front of fingers affects colloid mobilization and movement in dry sands. We postulate that the discontinuous pressure at the finger front results in the wetting front to move one pore at a time, causing high pore velocities with increased interfacial contact angles according to the Hoffman-Jiang equation. In a series of flow cell infiltration experiments, we used a high-speed camera (500 fps) to capture the colloid movement at the wetting front as water infiltrated acid-washed sands (2 mm in diameter). Four hundred and fifty milligrams of the sand particles were packed in a 0.6 x 0.2 x 2 cm channel and flushed with red-colored deionized water at 10 μl/min. Colloids were introduced by applying to the sand hydrophilic blue carboxylated microspheres (10.3 μm) or water-repellent polystyrene microspheres (10.2 μm) at a concentration of spheres/gram of sand before cell packing. Frame-by-frame image analysis was used to determine the position and velocity of the colloid movements, wetting front, and the advancing front contact angle. The results of the different experiments showed that the water velocity in the pore behind the front, based on the colloid velocity, is often quite different from the wetting front velocity and lacks a direct connection to it. In some cases, the wetting front advancement speed was 20 mm/s, four times faster than colloids. In others, the velocity of colloids could achieve around 10 mm/s while the wetting front’s velocity was 2 to 3 times less. The results also show that the changes in contact angle between the wetting front and particle surface are consistent with the Hoffman theory and are close to the value derived from the Hoffman Jiang equation. It confirmed that the change in contact angle during infiltration should be considered when studying water and colloid transport in sands.


How to cite: Min, X., Brindt, N., Jung, S., and Steenhuis, T.: Colloids movement at the wetting front during infiltration to sand, EGU General Assembly 2023, Vienna, Austria, 23–28 Apr 2023, EGU23-12742, https://doi.org/10.5194/egusphere-egu23-12742, 2023.

EGU23-13254 | ECS | Posters on site | HS8.1.5

On the control of small-scale heterogeneity and (spatially variable) diffusion on mixing-limited reactions in unsaturated soils 

Christopher Vincent Henri and Efstathios Diamantopoulos

Soils are characterized by structural components on multiple spatial scales, originating from soil formation processes, soil-plant interactions, microbial activity and management operations. This leads to local heterogeneities for almost all measurements of physical, chemical and biological state variables. This includes the diffusion process, which is known to be affected by the tortuosity, and therefore the water content. Also, biochemical reactions in soils appear to be highly variable in space and time. Yet, the identification of the main controlling factors of the dynamic of reaction rates in unsaturated porous media remain partial.

Studying biochemical reaction in real-world soil-plant-atmosphere systems is highly challenging since the true underlying structures can never be absolutely known. For this, it is appealing to employ synthetic experiments. In this study, we consider a simple A+B à C reaction and investigate the potential impact of small-scale heterogeneity, infiltration fluxes and diffusion on apparent reaction rates in a series of synthetic soils geostatistically described by the Miller-Miller theory. Reactive transport is solved using the random-walk particle-tracking approach to properly account for dispersion and mixing conditions.

Results indicates a synergetic control of the intensity of soil heterogeneity, the Peclet number and the spatial variability of the (tortuosity-dependent) diffusion coefficient on mixing conditions, which has a great impact on effective reaction rates and on the formation of hot-spots and hot-moments. The initial location of the reactants appears to also condition the mixing state of the system and, therefore, the dynamic of reactions. We illustrate then the high complexity of reactive systems in unsaturated soils, which makes the use of average macroscopic reaction rates (as in most agriculture, environmental and geoengineering models) at least questionable.

How to cite: Vincent Henri, C. and Diamantopoulos, E.: On the control of small-scale heterogeneity and (spatially variable) diffusion on mixing-limited reactions in unsaturated soils, EGU General Assembly 2023, Vienna, Austria, 23–28 Apr 2023, EGU23-13254, https://doi.org/10.5194/egusphere-egu23-13254, 2023.

EGU23-14256 | Orals | HS8.1.5

The DemoUpStorage Project: monitoring mineral carbonation in Icelandic basalts 

Alba Zappone and Stefan Wiemer and the DemoUpStorage Team

Mineral carbonation (MC) has long been suggested as a potential way to permanently store CO2 captured from smaller/medium emitters, as alternative to conventional geological sequestration in depleted oil and gas fields. MC consist in CO2 reacting with calcium-, magnesium- and iron-rich minerals to form carbonates.  MC is a promising option in terms of available resources and security of permanent storage. Nevertheless, this technology, tested in laboratories and small projects, has not yet taken off on a large scale. In situ large scale projects can contribute in reducing the knowledge gaps on MC fundamentals and allowing cost analyses and optimization. Since almost a decade CO2 is injected in Icelandic basalts, providing a field scale laboratory for testing MC. 

The DemoUpStorage, together with its partner project DemoUpCARMA, is a pilot project by ETH Zurich (http://www.demoupcarma.ethz.ch), EAWAG, EPFL and University of Geneva that aims to demonstrate the implementation and scale—up of CO2 geological storage using MC. The project investigates the fate of CO2 transported from an emitter in Switzerland to Helguvik (Iceland), where it is then mixed with oceanic water and injected in basalts at a depth of c.a. 400m.  The monitoring involves a combination of technologies that independently but synchronously observe changes in underground. In particular time-lapse acquisitions of different physical parameters (electrical resistivity, seismic P- and S-wave velocity, attenuation factor Q) will be conducted in parallel with fluid geochemistry monitoring and dissolved gas sampling in boreholes. Repeated cross-hole Vertical Seismic Profiling (VSP) will be performed across an array of three boreholes, of which one is the injection and two are monitoring boreholes. Fiber optic technology will be used in parallel to conventional hydrophones. Additionally, a dense, regular grid of seismic sensors will be deployed at the surface during VSP acquisitions with the goal to provide a high-resolution 3D imaging of the subsurface at the reservoir scale. Downhole Electrical Resistivity Tomography logs in one of the two monitoring wells will be repeatedly performed to constrain the build-up of CO2-related resistivity signatures in conjunction with CO2 saturation levels monitored by regular fluid sampling. A portable mass spectrometer connected to a borehole will provide continuous gas analysis to determine the temporal evolution of the local fluid dynamics, to validate permanent storage and to monitor for potential leakage.  Risk mitigation actions comprise monitor the background seismicity before, during and after the whole injection operations. Laboratory observations on rock samples from the Helguvik area complete the set of observation and offer the possibility to model at small scale porosity changes due to MC.  Predictive numerical simulations at reservoir scale are performed and will be continuously updated with the acquisition of the data. The start of the injection is foreseen in Spring 2023. 

How to cite: Zappone, A. and Wiemer, S. and the DemoUpStorage Team: The DemoUpStorage Project: monitoring mineral carbonation in Icelandic basalts, EGU General Assembly 2023, Vienna, Austria, 23–28 Apr 2023, EGU23-14256, https://doi.org/10.5194/egusphere-egu23-14256, 2023.

EGU23-14696 | ECS | Orals | HS8.1.5

Density-driven convection and chemical infiltration in saturated porous media 

Radoslav Hurtiš, Peter Guba, and Juraj Kyselica

Convection and chemical dissolution in porous media are observed in many hydrogeological processes such as seawater intrusion in coastal aquifers, CO2 sequestration in saline aquifers and heat transport in geothermal reservoirs. When a porous medium is infiltrated by a fluid contaminated with a reactive solute, convection is accompanied by dissolution of the porous matrix through chemical reactions between the solute and minerals contained in the porous solid, generating reaction products. Here we study how density-driven convection and reactive infiltration affect the transport of the solute and products in the porous medium. Convection and dissolution are modelled by coupled equations describing flow, transport of the solute and products, and mineral dissolution in a two-dimensional rectangular domain with a solute source located along half of the upper boundary. We quantify the average solute flux from the source in unsteady flows and analyze its development towards a steady-state value computed in [1]. Numerical experiments on the temporal development of convective flow and concentration fields are reported (see [2] for more details). The full numerical solutions are augmented with asymptotic analysis in a weakly convective and reactive regime performed in the limit of small Rayleigh and Damköhler numbers.

Acknowledgement:

This work was supported by the Slovak Research and Development Agency under the contract no. APVV-18-0308, and the VEGA project no. 1/0339/21 and the GUK project no. UK/355/2023.

References:

[1] van Reeuwijk, M., Mathias, S. A., Simmons, C. T., and Ward, J. D.: Insights from a pseudospectral approach to the Elder problem, Water Resources Research, 45, W04416, https://doi.org/10.1029/2008WR007421, 2009.

[2] Hurtiš, R., Guba, P., and Kyselica, J.: Simulation of reactive groundwater flow and salinization in carbonate-rock aquifers, 2022 International Conference on Electrical, Computer and Energy Technologies (ICECET), Prague, Czech Republic, 20–22 July 2022, pp. 1–4, https://doi.org/10.1109/ICECET55527.2022.9872944, 2022.

How to cite: Hurtiš, R., Guba, P., and Kyselica, J.: Density-driven convection and chemical infiltration in saturated porous media, EGU General Assembly 2023, Vienna, Austria, 23–28 Apr 2023, EGU23-14696, https://doi.org/10.5194/egusphere-egu23-14696, 2023.

EGU23-15561 | ECS | Posters on site | HS8.1.5

Biofilm growth at pore scale in laminar flow 

Araceli Martín Candilejo

Natural soils are home to an enormous variety of microorganisms. Microbial transport is important for a wide range of natural and artificial processes. However, the transport and distribution of bacteria in water flow at porous scale is still to be fully understood.

The Biofilm is a collective structure of microorganisms and it is covered by a protective layer secreted by the microorganisms themselves. The objective of this study is to identify and characterize the Elemental Biofilm Architectures that develop in a porous medium crossed by a laminar flow. This is a process that frequently occurs in nature, when there is water flow through the soil.

In the case of this study, different flow velocities and the percentage of nutrients (% LB Broth diluted in water) were tested, as well as oxygen control. A non-flagellated fluorescent mutant bacterium of P.Putida was used to analyze bacterial and biofilm growth through a homogeneous porous medium. Also, two different methodologies were carried out during the experiments: Methodology A and B. With methodology A the bacteria were initially grown in the porous media, and then and bacterial free flow was injected at a constant flow rate. In methodology B, the porous media was initially free of bacteria, and a bacterial solution was injected at a constant flow rate during the experiment.

In the experiments, the results show different architectural formations such as streamers, chains, ripples and fine lines. With both methodologies, bacteria develop similar biofilm architectures, such as streamers and ripples; but distributed differently throughout the porous media. The biggest difference relies on the deposit profile: in Methodology A most of the biomass accumulates towards the outlet of the porous media, while for Methodology B towards the inlet.

How to cite: Martín Candilejo, A.: Biofilm growth at pore scale in laminar flow, EGU General Assembly 2023, Vienna, Austria, 23–28 Apr 2023, EGU23-15561, https://doi.org/10.5194/egusphere-egu23-15561, 2023.

EGU23-16362 | Orals | HS8.1.5

Impact of groundwater abstraction on subsurface thermal regimes 

Maria Klepikova, Victor Bense, Olivier Bour, Nicolas Guiheneuf, and Tanguy le Borgne

Being the world’s largest freshwater resource, groundwater is at a continuous risk of overabstraction for human water use. Beside substantial drops in groundwater levels that are the consequence of unsustainable groundwater abstraction, which modify the recharge/discharge relationships between large-scale hydrogeological units, this anthropogenic hydraulic forcing is also responsible for changes in thermal regimes within the critical zone. While the impact of global groundwater pumping on the hydrogeological cycle has long been demonstrated, we still have insufficient knowledge on the influence of human activities on groundwater temperatures and, as a consequence, on stream thermal regimes and groundwater quality.

In this contribution we discuss temperature anomalies that develop in the shallow subsurface as a result of localized groundwater extraction. We study different hydrogeological settings, i.e., porous and fractured aquifers, that we explore via numerical modelling and comparison with field observations. In the field, we use repeated temperature-depth borehole profiles separated by decades, the advantage of which is that differencing the temperature logs for individual boreholes yields real temperature change and eliminates steady-state sources of curvature. Thus, it enables us to detect changes in subsurface thermal regimes, resulting from transient conditions, i.e., climate change and changes in groundwater hydrodynamics.

How to cite: Klepikova, M., Bense, V., Bour, O., Guiheneuf, N., and le Borgne, T.: Impact of groundwater abstraction on subsurface thermal regimes, EGU General Assembly 2023, Vienna, Austria, 23–28 Apr 2023, EGU23-16362, https://doi.org/10.5194/egusphere-egu23-16362, 2023.

EGU23-17007 | ECS | Orals | HS8.1.5

A hydrodynamic model for chemical dissolution of poroelastic materials 

Yanni Chen, François Guillard, and Itai Einav

Geomaterials are multi-phase materials composed of solid skeletons and pore fluids. Along the solid-fluid interfaces, chemical dissolutions might occur which tends to weaken the strength of geomaterials and can potentially cause catastrophic failures. As the ionic species in the pore fluid evolve during dissolution, we introduce the mass fractions of all the ionic species as independent state variables into the hydrodynamic procedure and develop a mathematically rigorous and thermodynamically consistent modeling framework to address the impact of solid dissolutions on the constitutive properties of poroelastic geomaterials. The development is foundational in that it focuses only on saturated poroelastic systems without accounting for particle crushing, localized plasticity, and surface tensions. However, the theory can be further expanded to deal with such inelastic features under various saturation regimes. For simplicity, the density-dependent linear elasticity is adopted whereby the stiffness degrades as the solid skeleton dissolves and pore fluid pressure is governed by both osmolarity and compressibility. The developed model can naturally recover fluid-related dynamics of Darcy's law, Fick's law, and the law of chemical kinetics. Finally, experimental observations of debonding tests of calcarenite under both oedometric and unconfined conditions are used to validate the model performance.

How to cite: Chen, Y., Guillard, F., and Einav, I.: A hydrodynamic model for chemical dissolution of poroelastic materials, EGU General Assembly 2023, Vienna, Austria, 23–28 Apr 2023, EGU23-17007, https://doi.org/10.5194/egusphere-egu23-17007, 2023.

A combined analysis was conducted to understand nitrogen loading to a deep (~ 80 m below ground level (bgl)) bedrock aquifer, including hydrochemical, isotopic, microbiological, hydrogeological, and geophysical investigation. The studied site, located in a suburban area, had been used to grow fodder crops for cattle and fertilized with cattle manure. The geology consists of Gyeonggi gneiss complex, fine-grained granite, and alluvium, while the surface is covered by loess deposits. Four boreholes (BH-1~4) were installed in 2018-2019, and geological, hydrogeological and geophysical surveys were conducted. Then hydrochemical, isotopic and microbiological properties were quarterly studied for 4 years at both shallow (~ 30 m bgl) and deep (~ 80m bgl) groundwater in each borehole as well as a pre-existing well. Groundwater levels were automatically monitored using levelogger. The initial depth to groundwater was 20.4 – 24 m bgl. As a result, high concentrations of nitrate were consistently observed in deep groundwater (35.3±16.0 mg/L; n=59) as well as shallow groundwater (50.9±16.8 mg/L; n=60) and a pre-existing well (44.3±6.8 mg/L; n=16). Based on N isotopes of nitrate (8.9-19.0‰; n=27), nitrogen mainly came from manure or sewer. The enrichment of 15N along with decreasing dissolved oxygen and nitrate in deep groundwater indicated denitrification in deep subsurface. Meanwhile ammonium and nitrite were exceptionally high in two deep groundwaters (BH-1d; BH-4d) where fecal coliforms were also occasionally detected. δ15N of ammonium were 9.2 and 14.0‰ in BH-1d and BH-4d, respectively. The hydrochemical, isotopic and microbiological results indicate that the vertical transport of contaminants from surface to deep groundwater is significant in the study area, probably through permeable fractures, given that the integrated interpretation of seismic data and electricity resistivity with geological data suggested fractures in deep weathered soil zones (down to 48 m bgl) and soft rocks. In addition, the borehole logging identified permeable fractures in hard rocks at high dips particularly in BH-1 and BH-4 in the west (up to 72. 9 degree). The natural gamma ray and P-wave velocity were higher in the west, indicating the different geology from the east (BH-2 and BH-3). Besides, the groundwater levels were fluctuated at BH-1d and BH-4d, due to groundwater extraction nearby. This combined examination of hydrochemical, isotopic, microbiological, hydrological, and geophysical characteristics suggests a scenario of contaminant transport from surface to deep subsurface through permeable fractures, which is enhanced by groundwater pumping. The integrated analysis is expected to be useful for subsurface characterization in crystalline bedrocks. <Acknowledgement> This study was supported by the basic research project of Korea Institute of Geoscience and Mineral resources (KIGAM) funded by the Ministry of Science and ICT of Korea (No. 23–3411) and by the Korea Environment Industry & Technology Institute (KEITI) through the Subsurface Environment Management Research Project (No. 2021002440003).

How to cite: Yu, S., Kim, H.-S., Shin, J., and Yun, S.-T.: A combined analysis of hydrochemical, isotopic, microbiological and geophysical characteristics for assessment of nitrogen loading to a deep crystalline bedrock aquifer, EGU General Assembly 2023, Vienna, Austria, 23–28 Apr 2023, EGU23-17347, https://doi.org/10.5194/egusphere-egu23-17347, 2023.

Simulating hydrodynamic reactive transport processes in heterogeneous systems is required
in various research fields and applications including environmental remediation, geological
storage, and energy production. Developing reliable numerical tools for these environmental
issues requires to consider both the structural heterogeneities encountered in the natural
environment, and the complexity of the (bio)geochemical reactions associated with each
application. The former is very often modeled at the expense of the latter, in particular when
studying large-scale heterogeneous systems such as fractured rocks for which most of the
modeling effort focuses on the multi-scale structural heterogeneities. These features are
responsible for anomalous transport behavior that is well reproduced by particle-based (PB)
methods with optimized computational cost. After introducing PB methods that are usually
used for modeling reactive transport in fractured rocks, I will present a new random walk
approach that is designed for complex (bio)geochemical reactions and upscaling purpose.

How to cite: Roubinet, D.: Reactive transport models in heterogeneous systems from pore to reservoir scale, EGU General Assembly 2023, Vienna, Austria, 23–28 Apr 2023, EGU23-17468, https://doi.org/10.5194/egusphere-egu23-17468, 2023.

Accurate modeling of water flow and solute transport in unsaturated soils are of significant importance for precision agriculture and environmental protection. Traditional modeling approaches are considerably challenging since they require well-defined boundaries and initial conditions. Harnessing machine-learning techniques, specifically deep neural networks (DNNs), to detect water flow and solute transport in porous media have recently gained considerable attention. In traditional DNNs, an artificial neural network with several hidden layers is trained solely using data to approximate parameter and state estimation, e.g., the spatiotemporal distribution of water content and pore-water salinity. However, data is extremely limited and sparsely available in subsurface applicationsPhysics-informed neural networks (PINNs) have recently been developed to learn and solve forward and inverse problems constrained to a set of partial differential equations (PDEs). Unlike traditional DNNs, PINNs are confined to physics and do not require" big" data for training. However, hydrological applications of PINNs only considered an in-silico environment with spatial measurements of hydraulic head, water content and/or solute concentrations well distributed in the subsurface. Such measurements are hard to obtain in real-world applications since they require drilling to extract soil samples or installing in-situ measurement devices at depth which also violets the soil's natural structure. As opposed to conventional subsurface characterization and monitoring techniques, non-invasive geoelectrical methods can provide continuous, extensive, and non-invasive information of the subsurface. Nevertheless, the sensitivity of the measured electrical signal to various soil parameters, mainly water content and pore-water salinity, as well as inversion errors, could result in biased hydrological interpretations. This work adopted the PINNs framework to simulate two-dimensional water flow and solute transport during a drip irrigation event and the following redistribution stage, using time-lapse geoelectrical measurements with unknown initial conditions. For that manner, a PINNs system containing two coupled feed-forward DNNs was constructed, describing the spatiotemporal distribution of both water content and pore-water salinity. The system was trained by minimizing the loss function, which incorporates physics-informed penalties, i.e., mismatch with the governing PDEs and boundary conditions, and measurement penalties, i.e., mismatch with the geoelectrical data. Two-dimensional flow and transport numerical simulations were used as benchmarks to examine the suitability of the described approach.  Results have shown that the trained PINNs system was able to reproduce the spatiotemporal distribution of both water content and pore-water salinity during both stages, i.e., irrigation and redistribution, with high accuracy, using five time-lapse geoelectrical measurements conducted with 59 electrodes placed at the surface. The trained PINNs system also reconstructed the initial conditions of both state parameters for both stages. It was also able to separate the "measured" electrical signal into its two components, i.e., water content and pore-water salinity. In addition, the subsurface geoelectrical tomograms were significantly improved compared to those obtained from a classical inversion of the raw geoelectrical data.    

How to cite: Moreno, Z. and Haruzi, P.: Simulating water flow and solute transport at unsaturated soils with unknown initial conditions using physics-informed neural networks trained with time-lapse geoelectrical measurements, EGU General Assembly 2023, Vienna, Austria, 23–28 Apr 2023, EGU23-956, https://doi.org/10.5194/egusphere-egu23-956, 2023.

EGU23-2553 | ECS | Posters on site | HS8.1.8

Data filtering methods for broadband spectral electrical impedance tomography (sEIT) measurements to reduce electromagnetic coupling effects 

Haoran Wang, Johan Alexander Huisman, Egon Zimmermann, and Harry Vereecken

Spectral electrical impedance tomography (sEIT) is a non-invasive geophysical method to image the complex resistivity distribution of subsurface materials in a broad frequency range. Laboratory studies of spectral induced polarization (SIP) have prompted the application of sEIT at the field scale in recent years. However, electromagnetic (EM) coupling effects including both inductive and capacitive coupling can affect the accuracy of sEIT measurements, especially at higher frequencies. With the development of advanced measurement equipment and the use of shielded cables, EM coupling effects can be reduced to a large extent and the remaining EM coupling is mainly due to the use of long cables. The aim of this work is to develop filters to remove sEIT measurements with large inductive and capacitive coupling effects and to conduct inversion without correction of the data. Inductive coupling is independent of soil properties and can be quantified by the mutual inductance determined from known cable positions. It is the most important source of EM coupling in conductive environments. Previous work proposed correction methods for inductive coupling in sEIT measurements. To achieve inversion without correction, we propose an index called inductive coupling strength (ICS) to evaluate the inductive coupling for a given measurement configuration. Capacitive coupling is more complicated to correct and avoid, and it is the dominant source of EM coupling in resistive environments. Previous studies showed promising correction results by integrating the capacitances in the forward modelling. However, the proposed correction method was not sufficiently accurate for high frequencies in resistive environments. To achieve inversion without correction, we propose an index called capacitive coupling strength (CCS) based on sEIT modelling with capacitances and leakage currents to quantify the influence of capacitive coupling on each measurement configuration. To evaluate the use of ICS and CCS for data filtering, we use two field sEIT datasets. The first dataset was acquired in a conductive environment and the second dataset was acquired in a resistive environment. We found that reliable inversion results over a broad frequency range up to kHz can be obtained without correction for EM coupling effects by using a 5% threshold value for ICS and CCS to filter out measurements with significant EM coupling effects. 

How to cite: Wang, H., Huisman, J. A., Zimmermann, E., and Vereecken, H.: Data filtering methods for broadband spectral electrical impedance tomography (sEIT) measurements to reduce electromagnetic coupling effects, EGU General Assembly 2023, Vienna, Austria, 23–28 Apr 2023, EGU23-2553, https://doi.org/10.5194/egusphere-egu23-2553, 2023.

In the unsaturated zone of fractured and karstified media, although the fractures and incipient karst conduits generally account for a minor volume in the bulk geologic formations, they contribute significantly to the flow and transport properties. The reason is due to the significant difference (i.e., several orders of magnitude) of permeability in comparison with the surrounding porous matrix. Thus, the simulation of groundwater flow in such heterogeneous porous media requires knowledge of geometry and hydrodynamical characteristics of the fractures. However, identifying fractures and incipient karst conduits in the unsaturated zone has been a challenge in hydrogeology. Electrical resistivity tomography (ERT) as a non-invasive geophysical method has the potential to deliver vast information rapidly in a relatively economical way related to fractures and incipient karst conduits. However, the sole use of ERT for the interpretation of geological formation and hydrodynamic properties of fractured domains is not possible as it may lead to ambiguity of interpretations. The main goal of this work is to investigate the performance of coupling water flow and electrical current for fracture characterization. Thus, we develop a new numerical model for the simulation of coupled water flow and electrical current. In this model, the fractures or incipient karst conduits are simulated with the discrete fracture matrix approach which is known to be the most accurate approach for addressing flow in fractured domains as it considers fractures without any simplification. This approach is applied for both electrical current and water flow. The hybrid dimensional approach, which assumes 1D fractures in a 2D porous matrix is used to improve the computational efficiency of the developed model. The partial differential equations describing the flow and electrical current are solved using the mixed hybrid finite element method for space discretization and the method of lines for time integration. These numerical techniques have been selected to ensure an accurate solution to the nonlinear problem in a time-efficient and effective way. The newly developed model is validated for simplified test cases against the results obtained by an equi-dimensional approach based on the conforming finite element method (i.e., using COMSOL Multiphysics®). The effect of major fracture orientation and length on the temporal response of bulk resistivity during a percolation scenario has been studied numerically. In addition, the effect of injection of electrical dipole has been simulated and discussed for the same problem. The results show that the proper placement of the electrical dipole can significantly affect the resolution of the fracture signature response and the bulk resistivity measured on the surface of the domain through time.


How to cite: Koohbor, B., Fischer, P., Fahs, M., Younes, A., and Jourde, H.: An advanced hybrid-dimensional discrete fracture-matrix model for coupled simulation of water flow and electrical current in variably saturated fractured porous media, EGU General Assembly 2023, Vienna, Austria, 23–28 Apr 2023, EGU23-5444, https://doi.org/10.5194/egusphere-egu23-5444, 2023.

EGU23-5777 | Orals | HS8.1.8

Monitoring of an aquifer thermal storage system on the field scale using cross-hole seismics 

Susann Birnstengel, Uta Koedel, Marco Pohle, Götz Hornbruch, Johannes Nordbeck, Ulrike Werban, and Peter Dietrich

The use of near-surface geothermal energy implying geothermal infrastructure increases significantly in Germany [1]. Therefore it becomes an essential subject for impact analysis of our groundwater resource. Rock physical properties change through the alteration of the pore fluid properties such as temperature. Those alterations happen under the influence of heat in the subsurface. Variations in geophysical proxies can provide information about the subsurface changes. Laboratory measurements by Jaya et al. [2] show that P-wave velocities decrease with increasing temperature.

Within the BMBF funded follow-on project – TestUM II a “cyclic high temperature aquifer thermal energy storage (ATES) experiment” has been conducted in the north or Germany to verify these findings. With this field experiment at a shallow aquifer environment we are able to avoid difficulties in frequency dependent upscaling procedures [3]. We investigated the coherence between geophysical proxies and the temperature distribution in the near surface with a combined hydrogeological, microbiological and geophysical monitoring system covering an area of approximately 100 m². A cyclic heat injection at a depth between 7 – 14 m was monitored over 15 months with seismic cross-hole measurements in 16 different wells to cover heat propagation and direction-dependent heterogeneities across the field. The purpose was to investigate geophysical proxy responses on the alteration of the pore fluid that is likely to change rock physical properties in the near-surface. To predict the effect of temperature on P-wave velocity we took advantage of the Jaya’s [2] modification of the Gassmann equation which accounts for the related thermophysical characteristics of the pore fluid. Unlike the findings of Jaya et al. [2], that the P-wave velocity decreases, we see the opposite, an increase in P-wave velocity in our non-closed system assuming different thermophysical characteristics of the saturating fluid. We excluded a bubble-formation since we only cover temperatures below 80°C. However, a decrease in the amplitudes due to the P-wave attenuation can be observed. According to Jaya et al. [2] this can be attributed to the decrease in water viscosity.

[1] Blöcher, G., Reinsch, T., Regenspurg, S., Henninges, J., Brehme, M., Saadat, A., Kranz, S., Frick, M., Spalek, A., Huenges, E. (2019): Geothermie in urbanen Räumen: thermische Untergrundspeicherung und Tiefe Geothermie in Deutschland. - System Erde, 9, 1, 6-13.
https://doi.org/10.2312/GFZ.syserde.09.01.1

[2] Jaya, Makky S. / Shapiro, Serge A. / Kristinsdóttir, L\iney H. / Bruhn, David / Milsch, Harald / Spangenberg, Erik
Temperature dependence of seismic properties in geothermal rocks at reservoir conditions, 2010-03, Geothermics , Vol. 39, No. 1, Elsevier BV

[3] Müller, T. M. / Gurevich, Boris / Lebedev, Maxim 
Seismic wave attenuation and dispersion resulting from wave-induced flow in porous rocks - A review, 2010-09, Geophysics , Vol. 75, No. 5 ,Society of Exploration Geophysicists 

How to cite: Birnstengel, S., Koedel, U., Pohle, M., Hornbruch, G., Nordbeck, J., Werban, U., and Dietrich, P.: Monitoring of an aquifer thermal storage system on the field scale using cross-hole seismics, EGU General Assembly 2023, Vienna, Austria, 23–28 Apr 2023, EGU23-5777, https://doi.org/10.5194/egusphere-egu23-5777, 2023.

EGU23-5954 | Orals | HS8.1.8

Supporting subsurface preferential flow in a small forested catchment from geophysical data and hydrological modelling 

Benjamin Mary, Konstantinos Kaffas, Matteo Censini, Francesca Sofia Manca di Villahermosa, Andrea Dani, Matteo Verdone, Federico Preti, Paolo Trucchi, Daniele Penna, and Giorgio Cassiani

Subsurface flow at the hillslope scale is a critical process responsible for water redistribution and transport of nutrients to the stream. Despite its hydrological importance, understanding the mechanisms governing subsurface flow generation is still challenging. 

We investigated the case of a small forested catchment located in the Apennine mountains, Tuscany, central Italy, which experiences shallow lateral downslope water redistribution resulting in substantial differences in vadose zone water supply along the hillslope. We developed an integrated experimental and modelling approach in order to shed some light on the role of the subsurface structure on the generation of hillslope-scale subsurface flow in the study catchment.  

We used a combination of methods sensitive to different soil properties. Ground Penetrating Radar (GPR) surveys show a complex response reflecting the interplay of different factors such as the presence of rocks, banks and counterslope in the near-surface and thus highlighting the very heterogeneous soil that may control water flow patterns. Several Electromagnetic (EM) mappings were conducted and show top-down hillslope variations of soil electrical conductivity revealing that trees located at the footslope and that experience longer vegetative periods might benefit from larger soil moisture content compared to the smaller trees located on the hillslope top. Similar observations are made from the two parallel top-bottom hillslope Electrical Resistivity Tomography (ERT) transects. 

The geophysical results will be integrated into hydrogeological simulations using the CATHY model for different scenarios (e.g., initial soil moisture, preferential flow paths, drainable porosity, soil properties, bedrock topography or stratification of soils) to explore the main drivers for subsurface preferential flow. 

How to cite: Mary, B., Kaffas, K., Censini, M., Manca di Villahermosa, F. S., Dani, A., Verdone, M., Preti, F., Trucchi, P., Penna, D., and Cassiani, G.: Supporting subsurface preferential flow in a small forested catchment from geophysical data and hydrological modelling, EGU General Assembly 2023, Vienna, Austria, 23–28 Apr 2023, EGU23-5954, https://doi.org/10.5194/egusphere-egu23-5954, 2023.

EGU23-6805 | ECS | Posters on site | HS8.1.8

Conversion of IP data and its uncertainty from time-domain to frequency-domain using Debye decomposition 

Joost Hase, Grigory Gurin, Konstantin Titov, and Andreas Kemna

The time-domain (TD) induced polarization (IP) method is used as an extension to classical DC resistivity measurements to capture information on the ability of the subsurface to develop electrical polarization, which is closely coupled to petrophysical parameters of relevance in hydrogeophysical characterization. In a TD IP measurement, the transient voltage decay between two electrodes is measured after the termination of an injected current between two other electrodes. TD IP measurements are typically analyzed in terms of chargeabilities, while in the frequency domain (FD) polarization responses are measured as complex-valued impedances. The latter can be inverted into a subsurface model of complex electrical resistivity by means of existing tomographic inversion algorithms. In order to apply these FD inversion algorithms to TD IP measurements, the necessity of TD to FD data conversion arises. A suitable conversion approach must transform the measured decay curve into a FD impedance and, preferably, also propagate the corresponding measurement uncertainty from TD into FD. Here we present such an approach based on a Debye decomposition (DD) of the decay curve into a relaxation-time distribution (RTD). Since equivalent formulations of the DD exist in TD and FD, it is possible to compute the FD response from the RTD inverted from the TD response. The corresponding FD data error can be obtained by applying error propagation through all these steps, assuming that the errors on the underlying parameters are normally distributed. To accomplish the DD we implemented a non-linear Gauss-Newton inversion scheme which automatically tunes the regularization strength to achieve a stable FD estimate and FD uncertainty. We test the performance of the inversion scheme in a synthetic study and demonstrate its application to field data on a tomographic TD IP data set measured on the Maletoyvaemskoie field of altered rocks (Kamchatka, Russia), which features epithermal gold deposits of high sulfidation type. The converted tomographic TD IP data set is inverted into subsurface models of complex electrical resistivity at frequencies of 1 Hz and 20 Hz. The proposed conversion approach yields accurate impedance data for relaxation processes which are resolved by the TD measurements. The error propagation scheme provides a reasonable FD uncertainty estimate, as revealed by a Monte-Carlo analysis of the underlying parameter distributions. Propagated FD errors are in agreement with previously established FD error models. The presented methodology to convert TD to FD IP data allows to invert and analyze field data collected with widely used TD instruments in the frequency domain, where the diagnostic potential of electrical impedance spectroscopy can be fully exploited for an improved interpretation.

How to cite: Hase, J., Gurin, G., Titov, K., and Kemna, A.: Conversion of IP data and its uncertainty from time-domain to frequency-domain using Debye decomposition, EGU General Assembly 2023, Vienna, Austria, 23–28 Apr 2023, EGU23-6805, https://doi.org/10.5194/egusphere-egu23-6805, 2023.

EGU23-8922 | ECS | Posters on site | HS8.1.8

Hydrogeophysical imaging of an aquifer in the Talysh mountain area, Azerbaijan 

Clara Jodry, Kamal Bayramov, Gunel Alizada, and Nigar Karimova

Underground water resources face an increase stress due to human activities and global climate change. To ensure sustainable and effective management of water resources, it is important to identify and characterize hydrogeologic systems and associated processes. In Azerbaijan, the groundwater is unevenly distributed due to a wide variety of climate conditions and the lowland areas depend mainly on water supply from the mountain areas to subsist. Especially since the alluvial plain aquifers undergo over consumption and pollution due to industrial and agricultural activities.

Our study focusses on the Talysh Mountain area in the Lesser Caucasus basin, where aquifers are characterized by alluvial terrain over volcanic-sedimentary tuff. This implies a high flow rate and quick discharge to low land. Yet, this area is also characterized by higher precipitation than evaporation which makes it favorable to host consequent groundwater aquifer. Geophysics has proved many times that it can bring valuable information to hydrogeological issue in subsurface environment such as unconsolidated ground or weathered hard rock aquifers. Thus, this project aims to characterized the underground structure (lithology, weathering profiles, fault and fissures, etc.) of a mountain aquifer in the region with Electrical Resistivity Tomography (ERT). We realized three separate measurements along the Lenkaran river which should enable us to image the 2D heterogeneity at the catchment scale and identify preferential pathways which influence the hydrodynamic circulations.

All three tomographies display two main resistivity layers which seem to be linked to the location along the river. The first layer shows resistivities in between 100 Ω.m with 3 m thickness upstream to 600 Ω.m and 6 m thickness downstream. The second layer is less resistive as a whole and goes from 60 Ω.m upstream to 15 Ω.m downstream. The resistivity limit in-between these two layers is rather abrupt and appear more linear downstream whereas the two profiles up stream display a non-linear limit. We interpret the first layer as dry alluvial sediments over a sedimentary tuff with an irregular top limit. The difference of resistivity from upstream to downstream could be linked to small changes in the lithology as well as variations of water content.

To help interpret further the hydrodynamic circulations in the region, these geophysical images will need to be associated with two essential data: groundwater levels and rainfall. Hydrogeology and hydrogeophysics campaign are rarely applied in Azerbaijan, especially in mountain areas, and existing data are either not available or date back to the 1960’s. This study represents the first step in developing environmental geophysics research in Azerbaijan and help put light on key environmental issues in the country.

How to cite: Jodry, C., Bayramov, K., Alizada, G., and Karimova, N.: Hydrogeophysical imaging of an aquifer in the Talysh mountain area, Azerbaijan, EGU General Assembly 2023, Vienna, Austria, 23–28 Apr 2023, EGU23-8922, https://doi.org/10.5194/egusphere-egu23-8922, 2023.

EGU23-9156 | ECS | Orals | HS8.1.8

Vadose zone water content characterization of a heterogeneous limestone by 3D-SNMR 

Clémence Ryckebusch, Jean-Michel Baltassat, Anatoly Legchenko, Pauline Kessouri, Nadia Amraoui, Mohamad Abbas, and Mohamed Azaroual

In the current climate change context, the quality and availability of water resource are important society issues. Indeed, the consumption of water and fertilizers by farms and their discharge into the soil and aquifers leads to a critical environmental situation. To manage the effect and fate of these contaminations, it is necessary to have a relevant knowledge of the vadose zone dynamics and exchanges especially flow paths from the soil to the deep aquifers. Parts of the vadose zone are well studied such as the first meters with an adapted instrumentation, and the water table properties with piezometric measurements and pumping tests. The geophysics methods allow studying the deep vadose zone properties. The surface nuclear magnetic resonance (SNMR) is a direct geophysical method based on the protons magnetic resonance to measure water content in the subsurface. This method can be used to detect the water table level coupled with hydrogeological measurements (piezometric measurements and pumping tests) or to characterize aquifers properties and boundaries coupled with other geophysical methods (electrical, EM or gravimetric methods).


The current study is carried out in Villamblain (France) at the heart of the Beauce region; one of the most cultivated and highly nitrate-contaminated area in France. The vadose zone is a highly heterogeneous limestone with geochemical alteration, complex network of fractures and karstification. This field site was chosen to develop an observatory of transfers in the Vadose Zone named O-ZNS (https://plateformes-pivots.eu/o-zns/). This observatory consists of an exceptional well (20 m-deep and 4 m-diameter) equipped with multiple sensors and accessible for direct characterization of the heterogeneous vadose zone, surrounded by 8 boreholes used for water sampling, geophysical well-logging, piezometric level monitoring and vadose zone geochemical properties monitoring.   


In this study, the SNMR method is used (1) to characterize the spatial heterogeneities of the 3D aquifer and of the vadose zone limestone, in a 3D-model jointly interpreted with other geophysical measurements (3D-ERT, 3D-IP, gravimetric, GPR profiles) and soundings; (2) to characterize the vadose zone water content, in combination with GPR and NMR logging water content profiles. Both these works are ongoing.


This research aims to know more accurately the vadose zone water content measured by SNMR in the context of a heterogeneous limestone with the goal to monitor the vadose zone flow dynamics with time-lapse measurements coupled with hydrogeological measurements.   

How to cite: Ryckebusch, C., Baltassat, J.-M., Legchenko, A., Kessouri, P., Amraoui, N., Abbas, M., and Azaroual, M.: Vadose zone water content characterization of a heterogeneous limestone by 3D-SNMR, EGU General Assembly 2023, Vienna, Austria, 23–28 Apr 2023, EGU23-9156, https://doi.org/10.5194/egusphere-egu23-9156, 2023.

A novel way of collecting electromagnetic measurements makes use of an All Terrain Vehicle (ATV) that pulls a transmitter and receiver. This so-called towed Transient Electro Magnetics system (tTEM, described in detail by Auken et al, 2019)  provide a fast way to obtain 3-dimensional images of the electrical resistivity of the subsurface. The unprecedented and speedy spatial coverage that can be obtained by the technique is a clear advantage over other land-based EM techniques. The technique acquires data with a speed of 10-15km/h, resulting in large coverages per day in open terrain (meadows, agricultural fields). The depth of investigation varies from 60 – 100m, depending on the characteristics of the subsurface (resistive or conductive). We present results here that are taken from various projects in the Netherlands, ranging from mapping buried glacial valleys, continuity of clay layers for groundwater protection, trying to detect faults and to investigate the lateral extent of Holocene clay deposits for dike reinforcements studies. We find the application of the tTEM technique for characterizing typical Dutch subsurface very useful, providing excellent insight in the 3D distribution of clay layers.

Auken, Esben, Nikolaj Foged, Jakob Juul Larsen, Knud Valdemar Trøllund Lassen, Pradip Kumar Maurya, Søren Møller Dath, and Tore Tolstrup Eiskjær, (2019), "tTEM — A towed transient electromagnetic system for detailed 3D imaging of the top 70 m oaf the subsurface," GEOPHYSICS 84: E13-E22. https://doi.org/10.1190/geo2018-0355.1.

How to cite: Gunnink, J. and Meekes, S.: tTEM: experiences in the Netherlands of this novel Electro Magnetic data acquisition technique, EGU General Assembly 2023, Vienna, Austria, 23–28 Apr 2023, EGU23-9281, https://doi.org/10.5194/egusphere-egu23-9281, 2023.

EGU23-9639 | ECS | Orals | HS8.1.8

Development of geoelectrical monitoring of the critical zone processes on microfluidic chips 

Flore Rembert, Arnaud Stolz, Sophie Roman, and Cyprien Soulaine

We miniaturize the low-frequency (<1kHz) geoelectrical acquisition using advanced micro-fabrication technologies to investigate coupled processes in the critical zone (CZ). With this innovation in the experimental acquisition, we focus on the development of the complex electrical conductivity monitoring with the spectral induced polarization (SIP) method. The interpretation of the SIP signal is based on the development of petrophysical models that relate the complex electrical conductivity to structural, hydrodynamical, and geochemical properties or distributions. State-of-the-art petrophysical models, however, suffer from a limited range of validity and presume too many microscopic mechanisms to define macroscale parameters. Thus, direct observations of the underlying processes coupled with geoelectrical monitoring are keys to deconvolute the signature of the biochemical-physical mechanisms and, then, developing more reliable models. Microfluidic experiments enable direct visualization of flows, reactions, and transport at the pore-scale thanks to transparent micromodels coupled with optical microscopy and high-resolution imaging techniques. Micromodels are a two-dimensional representation of the porous medium, ranging in complexity from single channels to replicas of natural rocks. Cutting-edge micromodels use reactive minerals to investigate the water-mineral interactions involved in the CZ. In this work, we propose a new kind of micromodels equipped with four aligned electrodes within the channel for SIP monitoring of calcite dissolution, a key multiphase process of the CZ involved in karstification. We highlight the strong correlation between SIP response and dissolution through electrical signal examination and image analysis. In particular, degassed CO2 bubbles generated by the dissolution play a major role.  Our technological advancement brings a deeper understanding of the physical interpretation of the complex electrical conductivity and will provide a further understanding of the CZ dynamic processes through SIP observation.

How to cite: Rembert, F., Stolz, A., Roman, S., and Soulaine, C.: Development of geoelectrical monitoring of the critical zone processes on microfluidic chips, EGU General Assembly 2023, Vienna, Austria, 23–28 Apr 2023, EGU23-9639, https://doi.org/10.5194/egusphere-egu23-9639, 2023.

EGU23-9723 | ECS | Orals | HS8.1.8

Uncertainty quantification of aquifer geometry and groundwater level using electrical resistivity models obtained from transient electromagnetic data 

Lukas Aigner, Nathalie Roser, Anna Hettegger, Daniel Höfelmaier, Arno Cimadom, Hadrien Michel, Thomas Hermans, and Adrián Flores Orozco

Reliable information about the aquifer geometry and its spatial variability from geophysical methods plays a critical role for various hydrological research questions. Such information can be obtained with the transient electromagnetic (TEM) method that reaches a larger depth of investigation with a smaller survey layout compared to electrical or seismic methods. However, the quantitative interpretation of the resistivity model obtained from TEM data in terms of groundwater level and aquifer geometry might be biased by the non-uniqueness of the deterministic inversion. To overcome such limitations, we propose here to use Bayesian evidential learning (BEL1D) to evaluate the uncertainty of the groundwater level and aquifer thickness interpreted from TEM results using a classical deterministic inversion approach. Additionally, we investigate the effect of different prior model spaces on the uncertainty obtained from BEL1D and use the distance-based global sensitivity analysis (DGSA) to determine whether model parameters with a large uncertainty are actually non-influential on the model response. To test the uncertainty quantification, TEM data were measured at three sites in Austria representative of different hydrogeological settings and groundwater levels, namely: 1) a shallow (1 m - 10 m) aquifer located in the soda lakes of the Neusiedl-Seewinkel Basin in Burgenland, 2) an aquifer in intermediate (5 m – 15 m) depth located in the hydrological open-air laboratory (HOAL) in lower Austria and 3) a deep (> 35 m) aquifer in a farm land located in Upper Austria. We obtain TEM data with the TEM-FAST 48 instrument with a 6 m, 12.5 m and a 25 m square single-loop configuration to achieve sensitivities corresponding to the three different aquifer depths. Additionally, we use electrical resistivity tomography (ERT) and multi-channel analysis of surface waves (MASW) data to assess the TEM inversion results. The interpretation of the TEM inversion results is evaluated with BEL1D to obtain the uncertainty of the groundwater level from the cumulative uncertainty of all layers above the layer representing the groundwater level as well as the thickness of the aquifer. Additionally, we achieve a quantitative evaluation of the solved TEM model uncertainties with the DGSA method as well as with the ERT and MASW inversion results. Our results show a lower uncertainty for the electrical resistivity than for the layer thickness, while the DGSA reveals a decrease of sensitivity with depth.

How to cite: Aigner, L., Roser, N., Hettegger, A., Höfelmaier, D., Cimadom, A., Michel, H., Hermans, T., and Flores Orozco, A.: Uncertainty quantification of aquifer geometry and groundwater level using electrical resistivity models obtained from transient electromagnetic data, EGU General Assembly 2023, Vienna, Austria, 23–28 Apr 2023, EGU23-9723, https://doi.org/10.5194/egusphere-egu23-9723, 2023.

EGU23-9982 | Posters on site | HS8.1.8

Spatial heterogeneity of regolith properties using time-lapse electrical imaging combining Electrical Resistivity Tomography and Audio-Magneto-Telluric in the Berambadi Critical Zone Observatory (India) 

Titouan Harrouet, Pascal Sailhac, Henri Robain, Christian Camerlynck, Benjamin Baud, Julien Amelin, Laurent Ruiz, Sekhar Muddu, and Jean Riotte

Space and time variability of water content in aquifers are fundamental issues to understand complex interactions taking part in the critical zone, such as land use and irrigated agricultural production. Fundamental parameters on aquifer behavior are commonly monitored through hydrogeological methods, such as piezometric levels and pumping tests in boreholes. Precisions on the water quality and residence time are provided by geochemical analyses of samples collected in surface streams and boreholes. Several studies showed how additional data can be obtained from non-invasive hydrogeophysical methods, that reveal structural heterogeneities of hydrogeological parameters filling the gaps between boreholes.

We carried out a multimethod geophysical survey in the Berambadi experimental catchment (India) which is part of the M-TROPICS CZO (Multiscale TROPIcal CatchmentS Critical Zone Observatory). Two surveys including seismic, electrical, and electromagnetic methods have been repeated for contrasting piezometric levels (high in December 2019, low in May 2022) corresponding to contrasted water contents. We considered time-lapse imaging using electrical resistivity tomography (ERT) and audio-magneto-tellurics (AMT), which sensitivities apply at complementary scales. Changes in the electrical resistivity from ERT shallow cross-sections and deeper jointly inverted ERT-AMT vertical profiles are compared for the two seasons. Results are discussed in terms of water content and porosity of the regolith as well as uncertainties caused by inherent repeatability issues of time-lapse measurements. Final discussion concerns perspectives of combined time-lapse electrical and seismic velocity models to assess the impact of the spatial variability of regolith properties at the catchment scale.

How to cite: Harrouet, T., Sailhac, P., Robain, H., Camerlynck, C., Baud, B., Amelin, J., Ruiz, L., Muddu, S., and Riotte, J.: Spatial heterogeneity of regolith properties using time-lapse electrical imaging combining Electrical Resistivity Tomography and Audio-Magneto-Telluric in the Berambadi Critical Zone Observatory (India), EGU General Assembly 2023, Vienna, Austria, 23–28 Apr 2023, EGU23-9982, https://doi.org/10.5194/egusphere-egu23-9982, 2023.

EGU23-10845 | ECS | Orals | HS8.1.8

Rainwater infiltrating process revealed from the self-potential signatures, insight for landslide monitoring 

Kaiyan Hu, Qinghua Huang, Peng Han, Yihua Zhang, Chunyu Mo, and Damien Jougnot

Understanding the physical process of soil imbibition and water flow in the porous media in depth is significant in assessing the risk of forming landslides. Volumetric soil moisture sensors can be used to measure water content variations in situ. However, it has a spatial gap due to the limited number of installed sensors. On the other hand, geophysics can provide integrated measurements that can be spatially resolved. Among existing geophysical methods, Self-Potential (SP) is a method of choice to monitor water flow. Indeed, pore-water flows can generate the electrical streaming current based on the electrokinetic mechanism. This electrokinetic cross-coupling process is not only sensitive to the water flow but also depends on water content variations. This study relies on a soil-column experiment by artificially imposing rainfall to examine if the electrical SP could indicate the water infiltrating process. Combined with the observed data, our results indicate the water infiltrating stages can be characterized by the extracted SP signatures under a comprehensive numerical model. As a passive hydrogeophysical method, the capacity of SP to capture the characteristics of the spatio-temporal variations of water fluxes and soil-water conditions can offer early warning information of rainfall-induced landslides.

How to cite: Hu, K., Huang, Q., Han, P., Zhang, Y., Mo, C., and Jougnot, D.: Rainwater infiltrating process revealed from the self-potential signatures, insight for landslide monitoring, EGU General Assembly 2023, Vienna, Austria, 23–28 Apr 2023, EGU23-10845, https://doi.org/10.5194/egusphere-egu23-10845, 2023.

EGU23-11013 | Orals | HS8.1.8

New Insights into the Effect of HCO3-, CO32- and SO42- Ions on the Zeta Potential of Intact Carbonate Rock Sample 

Jan Vinogradov, Nacha Atiwurcha, David Vega-Maza, and Jos Derksen

Zeta potential is an important interfacial property that controls electrostatic interactions between mineral, water, and non-aqueous phase fluids. These interactions play an important role in defining the wetting state of reservoir rocks and transport of ionic species through porous media. The zeta potential is shown to be an efficient means for a broad range of applications including monitoring of single- and multi-phase flows in subsurface settings, characterization of fracture networks, efficiency of CO2 sequestration, hydrogen underground storage and enhanced oil recovery. It is widely agreed that the zeta potential in carbonate rocks is controlled by the concentration of potential determining ions (PDI), but the understanding of the underlying mechanisms is still limited as there are little experimental data on quantitative characterization of the dependence of the zeta potential on concentration of negative potential determining ions (PDI) such as SO42-, CO32-, HCO3-, especially when their concentration is high and exceeds that of the positive PDIs.

In this study, the streaming potential method is used to investigate the zeta potential of natural carbonate rock samples in contact with natural aqueous solutions of low-to-high ionic strength and with varying concentration of sulphate (SO42-) and carbon (C4) related (HCO3-, CO32-) ions. In each set of experiments the total ionic strength was kept constant to eliminate the impact of concentration on the zeta potential so that the increasing/decreasing concentration of negative PDI was adjusted by decreasing/increasing concentration of indifferent Cl- ions. The study probed the concentration of negative PDIs that has never been reported before, with their respective lowest concentration consistent with previously reported equilibrium values, and the highest concentration being equal to the maximum achievable through stripping the tested solutions of Cl-.

Our results demonstrate for the first time that magnitude of the negative zeta potential increases linearly with log10 of C4 concentration, however its dependence on the log10 of SO42- concentration is non-linear suggesting varying mechanisms of this PDI’s specific adsorption. Moreover, the results demonstrate that the zeta potential strongly depends on the total ionic strength, interpreted from slopes of the linear regressions for each negative PDI in different background solution. This observation suggests that equilibrium constants of negative PDI specific adsorption may be affected by the total ionic strength. Our findings improve the current understanding of the complex physicochemical processes that take place at calcite-water interface and provide important experimental data for surface complexation modelling of carbonate-brine systems.

How to cite: Vinogradov, J., Atiwurcha, N., Vega-Maza, D., and Derksen, J.: New Insights into the Effect of HCO3-, CO32- and SO42- Ions on the Zeta Potential of Intact Carbonate Rock Sample, EGU General Assembly 2023, Vienna, Austria, 23–28 Apr 2023, EGU23-11013, https://doi.org/10.5194/egusphere-egu23-11013, 2023.

EGU23-13283 | ECS | Posters on site | HS8.1.8

Analyzing the ability of BEL1D for inverting TEM data. 

Arsalan Ahmed, Lukas Aigner, Hadrien Michel, Wouter Deleersnyder, David Dudal, Adrian Flores Orozco, and Thomas Hermans

Understanding the subsurface is of prime importance for many geological and hydrogeological applications. Geophysical methods offer an economical alternative for investigating the subsurface compared to costly boreholes investigation methods, but results are often obtained through an inversion problem whose solution is non-unique. There are two types of inversion approaches: deterministic and stochastic. Deterministic inversion provides a unique solution with no way to efficiently and accurately assess uncertainty  but is relatively fast to compute. Stochastic inversions investigate the full range of solutions which make them computationally very expensive. In this research, we assess the robustness of the recently introduced BEL1D method for the stochastic inversion of the time domain electromagnetic data (TDEM). We analyze the effect of the accuracy of the forward model (through the open-source SimPEG code) on the estimation of the posterior space using a synthetic case and discuss the importance of prior selection. We also apply the algorithm on field data collected in Vietnam to assess saltwater intrusions. We observed that the proper selection of timesteps and space discretization is essential to limit the computation cost while maintaining the accuracy of the posterior estimation. Secondly, the selection of the prior distribution has a direct impact on fitting the observed data and is crucial to a realistic uncertainty quantification. Furthermore, in contrast to previous studies, we suggest rejecting models not fitting the data at an early stage for reducing computational costs. Lastly, the application of BEL1D together with SimPEG for stochastic TDEM inversion is a very efficient approach as it allows us to estimate the uncertainty at a limited cost.

Keyword: Saltwater intrusion, uncertainty, TDEM, BEL1D, SimPEG

How to cite: Ahmed, A., Aigner, L., Michel, H., Deleersnyder, W., Dudal, D., Flores Orozco, A., and Hermans, T.: Analyzing the ability of BEL1D for inverting TEM data., EGU General Assembly 2023, Vienna, Austria, 23–28 Apr 2023, EGU23-13283, https://doi.org/10.5194/egusphere-egu23-13283, 2023.

EGU23-13675 | ECS | Posters on site | HS8.1.8

Latest developments of OhmPi, an open-hardware resistivity meter for small scale monitoring applications 

Arnaud Watlet, Rémi Clément, Guillaume Blanchy, Vivien Dubois, Yannick Fargier, Nicolas Forquet, Helène Guyard, and Olivier Kaufmann

Shallow geophysics is being increasingly applied to solve a broad range of problems in hydrology, ecology, and beyond. In the recent years, geophysical monitoring, and geoelectrical monitoring in particular, has also become more popular to track down physical processes. In this context, the accessibility of geophysical equipment is key to expanding the use of geophysical monitoring, and to developing novel, versatile strategies, especially in the environmental sector. Commercial equipments have participated to the development of applied geophysics and are usually robust and practical. However, their cost can be prohibitive in some contexts, such as for humanitarian, non-profit applications or simply to equip a large number of sites. Being designed for generic use, they can also come with a lack of versatility for dedicated monitoring applications. For these reasons, the OhmPi project (https://gitlab.irstea.fr/reversaal/OhmPi) was initiated to provide an open-source, open-hardware resistivity meter to the community, in a DIY fashion. It is designed to offer enhanced flexibility, especially for monitoring experiments, and can easily incorporate new functionalities. Relying on low-cost components and devices, OhmPi is specifically designed for laboratory or small-scale field experiments. Developed as an open-source project, new collaborations are warmly welcomed.

The OhmPi hardware is based on a Raspberry Pi board which pilots I2C multiplexer boards, and an acquisition board triggering the current injection and voltage readings. The software is written in Python and allows to interact with the OhmPi instrument via a web interface, IoT communication protocols (e.g. MQTT) and/or directly through the Python API. Here, we will introduce the latest and future developments, comprising voltage injection up to 80V, sensor-controlled acquisitions or multi-channel voltage readings. We will also present dedicated applications including a case study detailing the field deployment of a small-scale 3D panel for monitoring water infiltration.

How to cite: Watlet, A., Clément, R., Blanchy, G., Dubois, V., Fargier, Y., Forquet, N., Guyard, H., and Kaufmann, O.: Latest developments of OhmPi, an open-hardware resistivity meter for small scale monitoring applications, EGU General Assembly 2023, Vienna, Austria, 23–28 Apr 2023, EGU23-13675, https://doi.org/10.5194/egusphere-egu23-13675, 2023.

EGU23-13763 | Posters on site | HS8.1.8

About the use of near-surface seismic data to better constrain hydrogeological models 

Ludovic Bodet, Marine Dangeard, Ramon Sanchez Gonzalez, Alexandrine Gesret, and Agnès Rivière

Over the past decade, we have done our best to develop alternative methods to image the heterogeneities of the critical zone, describe the dynamics of its hydrosystems, and add seismic techniques to the hydrogeophysics toolbox. With the growth of long-term observation infrastructures in this field, the geophysical tools recently developed by the community tend to be viewed as state-of-the-art geophysical characterization methods mainly deployed to augment observatory and network databases. A major problem is that geophysical results are mostly just sets of parameters, in other words "models", deduced from sparse data sets and poorly posed problems. They certainly cannot be considered as data by observatories. In order to better transport information from the data into models that could be safely exploited by non-geophysicists, we need to: increase the extent and throughput of our surveys; optimize our acquisition configurations with respect to the target of interest; greatly increase our spatial and temporal sampling capabilities; automate our tedious processing workflows; and improve, if not completely revise, our inversion tools. We illustrate this last point with examples from the field. They show how a thorough interpretation of geophysical models can provide valuable prior information on the distribution of hydrofacies and calibrate the hydrogeological modeling domain. In addition, we raise the question of the propagation of uncertainty from the geophysical data to the hydrogeological model and suggest the use of alternative petrophysics to better interpret the data collected in the partially saturated zone.

How to cite: Bodet, L., Dangeard, M., Sanchez Gonzalez, R., Gesret, A., and Rivière, A.: About the use of near-surface seismic data to better constrain hydrogeological models, EGU General Assembly 2023, Vienna, Austria, 23–28 Apr 2023, EGU23-13763, https://doi.org/10.5194/egusphere-egu23-13763, 2023.

Analysis of the sensitivity of measurable physical variables (i.e., pressure and flow) to material properties is very useful to reduce uncertainty in estimation of the properties. The subsurface fluid flow through a porous rock is characterized by two hydraulic properties, hydraulic permeability k and specific storage Ss. The pore pressure diffusion is controlled by the hydraulic diffusivity implicating the ratio of the transmitting ability to the storage capacity. Both values of k and Ss can be determined only from a transient pore pressure curve. However, the hydraulic properties (k and Ss) are defined in the relation between pressure (gradient) and flow (rate). The permeability is a proportional parameter between volumetric flux of fluid and pressure gradient. The specific storage denotes the proportionality constant between the increment of fluid content and the pore pressure. Thus, the flow (rate) measurement is also beneficial to obtain the hydraulic properties. This paper presents the sensitivity analysis of pressure and flow data to the properties. One-dimensional pressure diffusion test was conducted on a cylindrical sample of shale subjected to a triaxial confining stress. No flow was allowed at the downstream for the boundary condition. A sudden increase in the upstream pressure followed by a constant pressure leads to the downstream pressure rising transiently until it reached an equilibration to the constant upstream pressure. During the transient period, the upstream fluid flows into the sample because of the time-dependent pressure gradient. Both the downstream pressure and the upstream flow were measured to estimate the hydraulic parameters using curve fittings. The downstream pressure curve fitting yields 4.1×10⁻²⁰ m2 for the permeability and 1.2×10⁻¹¹ Pa-1 for the specific storage. However, these values for the best fit of the pressure data yield a completely different flow curve from the flow measurements. The permeability and the specific storage obtained from the best fit of the flow curve are 2.6×10⁻¹⁹ m2 and 2.1×10⁻¹⁰ Pa-1, respectively. The theoretical pressure curve using these values fits well (not the best) the measured data. Conclusively, the flow data is more sensitive to the hydraulic properties than the pressure data. The flow analysis yields less uncertainty in the optimization of hydraulic properties than the pressure analysis.

How to cite: Song, I.: Sensitivity analysis for the optimization of hydraulic properties using transient pressure and flow data, EGU General Assembly 2023, Vienna, Austria, 23–28 Apr 2023, EGU23-17158, https://doi.org/10.5194/egusphere-egu23-17158, 2023.

EGU23-299 | ECS | Orals | HS8.1.9

Deep Direct Current Resistivity Inversion 

Cláudia Escada and Leonardo Azevedo

Climate change threats groundwater resources, requiring sustainable management of this critical asset. Widely applied in hydrogeology, direct current resistivity (DCR) methods have been a preferable tool for imaging groundwater resources due to its potential to efficiently image a relatively large area in a relatively short period. DCR methods use electrodes to inject electrical currents into the subsurface ad measure the resulting potential difference (i.e., voltage).

The quantitative interpretation of these data (i.e., the spatial prediction of the geological subsurface properties) requires solving a challenging geophysical inversion problem. Deterministic DCR inversion methods are common approaches to reach this objective but might be computationally expensive, requiring a large degree of expertise and predicting a single model unable to capture the small-scale details of subsurface geology. The main goal of this work is to overcome these limitations through the development and implementation of a deep DCR inversion workflow.

The proposed methodology follows three main steps: data acquisition, deep neural network (DNN) training and DCR data inversion. For the second step, it is generated a training dataset of electrical resistivity models by geostatistical simulation to represent a variety of possible subsurface scenarios. These models will be the input to train a variational autoencoder (VAE; Kingma & Welling, 2013; Lopez-Alvis et al., 2020). After training, the VAE outputs electrical resistivity simulated models given measured DCR data. The predicted models are then forward modelled (Cockett et al., 2015) to calculate predicted data, which are compared with the recorded data. The misfit between the observed and simulated data is used to iteratively update the DNN weights and parameters.

The proposed method is illustrated with its application to a set of DCR data acquired in the southern region of Portugal comprising an area highly affected by droughts and industrial pressure.

Cockett, R., Kang, S., Heagy, L. J., Pidlisecky, A., & Oldenburg, D. W. (2015). SimPEG: An open-source framework for simulation and gradient-based parameter estimation in geophysical applications. Computers and Geosciences, 85, 142–154. https://doi.org/10.1016/j.cageo.2015.09.015

Kingma, D. P., & Welling, M. (2013). Auto-Encoding Variational Bayes. https://doi.org/10.48550/arXiv.1312.6114

Lopez-Alvis, J., Laloy, E., Nguyen, F., & Hermans, T. (2020). Deep generative models in inversion: a review and development of a new approach based on a variational autoencoder. https://doi.org/10.1016/j.cageo.2021.104762

How to cite: Escada, C. and Azevedo, L.: Deep Direct Current Resistivity Inversion, EGU General Assembly 2023, Vienna, Austria, 23–28 Apr 2023, EGU23-299, https://doi.org/10.5194/egusphere-egu23-299, 2023.

Springs are a critical water source for the people of the Indian Himalayas, sustaining their domestic and agricultural requirements. However, spring discharges are declining and flow regimes have transitioned into ephemeral or intermittent systems, primarily due to rainfall variability, landuse transformations and anthropogenic actions. Consequently, water scarcity has become a major challenge. To ensure water and livelihood security, quantifying spring water responses and understanding aquifer recharge is paramount for maintaining spring ecosystem services. Experiments were conducted to enable site-evidence-based intervention designs for spring rejuvenation through a robust management framework. In this study, we operationalize pilot observatories in the Uttarakhand Himalayas, India and integrate the application of hydrological time-series analysis, stable isotopes and water chemistry to understand spring watershed behaviour. We instrumented springs (A1, P1, P2, P3) for high-resolution hydrological monitoring. Spring hydrodynamics was assessed by employing Hydrograph and flow recession analysis. Autocorrelation and cross-correlation functions were used to estimate the system memory and reveal rainfall and spring interdependence. Isotopes and water quality were sampled bi-monthly at selected springs/streams (S1-S17, St1-St5) since December 2021. Through isotope analysis and reflecting on the geochemical evolution of springwater along flow paths, attempts were made to understand the origin (recharge) of water types.  

Inferences show that spring A1 indicates intricate flow networks and slow flow velocities, while P1, P2, and P3 springs are characteristics of transmissive fractures. A low value of recession coefficient ‘α’ for A1 depicts diffused fracture system compared to P1, P2, and P3, which indicates rapid aquifer emptying and a well-interconnected flow network. Correllograms for A1 decline (rxx(k) value) steadily show a high memory of 120 days, while P1, P2, P3 exhibit shorter system memory and poor drainage flow network. A better storage capacity and homogeneity of underlying geology for A1 are revealed compared to P1, P2, and P3. Isotope values range from -8.1‰ (S12) indicating anthropogenic forcing at recharge zones to -9.7‰ (S6), representative of natural recharge conditions. The characteristic δ18O-δD regression line has shallower slopes than Global Meteoric Water Line, indicative of multiple moisture source mixing. S6 is monitored for intervention planning and shows isotopic values distinctive of high elevations and far transport of water-bearing clouds. Two hydrochemical facies HCO3-Ca and mixed HCO3-Ca-Mg, were determined from the Piper ternary diagram which indicates carbonate rock geology and flow evolution through pathways.

The research aims to improve the understanding of mountain hydrological processes and drivers of groundwater fluxes. Such an integrated-approach permits detailed process understanding and limits erroneous interpretations. Policymakers can extend the results across the Indian Himalayas to inform management decisions and frameworks. 

Keywords: Springshed hydrodynamics, systems memory, long-term observatory, spring aquifer, Himalayas

How to cite: Dass, B. and Sen, S.: Understanding spring aquifer dynamics through observational data patterns, stable isotopes, and hydrochemistry – An account of experimental pilots in the Indian Himalayas., EGU General Assembly 2023, Vienna, Austria, 23–28 Apr 2023, EGU23-702, https://doi.org/10.5194/egusphere-egu23-702, 2023.

EGU23-749 | ECS | Posters on site | HS8.1.9

Artificial groundwater recharge for adapting to drought risk in large agricultural areas 

Ilaria Delfini, Andrea Chahoud, Alberto Montanari, and Daniel Zamrsky

Artificial groundwater recharge is a promising adaptation measure to face the increasing drought risk on freshwater availability. Its efficiency strongly depends on the climatic and hydrogeological conditions of the area of interest. In particular the structure of the underlying aquifer plays a key role. In fact, many open questions remain about the effectiveness of recharge for multi-layer aquifers, due to the complexity of their hydrogeological behaviour.

In this study we perform a series of simulations aimed at assessing the effectiveness of winter/spring artificial groundwater recharge on a portion of alluvial fans in the Emilia-Romagna region (Italy). This area is a large agricultural plain which heavily relies on groundwater for irrigation. Here, aquifers are located mainly in fluvial sediment deposits of several hundred meters thickness, and in underlying marine sediment deposits.

A numerical groundwater flow model has been developed in MODFLOW 6. This model is based on a previous application of MODFLOW to the whole Emilia-Romagna area by the Regional Agency for Environmental Protection (ARPAE), and extends over a wide area east of the River Secchia. Input data cover a multi-year simulation period, therefore representing seasonal variations of hydrometeorology.

Calibration has been implemented by comparing observed and simulated water table levels during the period 2002-2018.

Simulations are generated for various boundary conditions, mainly for different hypotheses of groundwater recharge. In particular, we assume that winter/spring recharge is increased by an assigned multiplier that is homogeneous in space over the recharge area, in order to simulate a spatially distributed artificial recharge which may be provided by winter irrigation.

The results show that the effectiveness of recharge depends on the initial conditions of the aquifer and the precipitation regime during the winter season. During drought conditions artificial recharge seems to be an interesting option for risk mitigation.

How to cite: Delfini, I., Chahoud, A., Montanari, A., and Zamrsky, D.: Artificial groundwater recharge for adapting to drought risk in large agricultural areas, EGU General Assembly 2023, Vienna, Austria, 23–28 Apr 2023, EGU23-749, https://doi.org/10.5194/egusphere-egu23-749, 2023.

EGU23-1410 | ECS | Posters on site | HS8.1.9

Evaluation of three Gap-Filling techniques for daily rainfall data sets: a case study in Portugal 

Camilla Fagandini, Valeria Todaro, Maria Giovanna Tanda, Joao Lino Pereira, Leonardo Azevedo, and Andrea Zanini

In hydro meteorological temporal datasets, the lack of data is a common problem that can be caused by a variety of factors, including sensor malfunction, errors in measurement, and faults in data acquisition from the operators. Because complete time series are necessary for conducting trustworthy analysis, finding efficient solutions to this issue is crucial. In this work, a gap-filling approach using Kriging-based methods (Ordinary Kriging and Simple Cokriging) is presented and compared to a linear regression approach proposed by the Food and Agriculture Organization (FAO method). The proposed procedure consists of fitting semi-variogram models for each month using the available daily rainfall collected at all stations and averaged for the specific month in the reference period. The advantages are that only 12 monthly semi-variograms have to be built rather than one for each missing day of the dataset and that a greater amount of data at a time can be processed. Then, the Ordinary Kriging and Cokriging are used to estimate the daily precipitation where it is missed using the semi-variograms of the month of interest. The Cokriging method is applied considering the elevation data as the second variable. The FAO approach fills the gaps in rainfall time series by means of a linear relationship between the station that presents missing data and the best correlated station that has data gathered at the gap time. The approaches were compared using daily rainfall data from 60 rain gauges from the Portuguese case study of the InTheMED project for a 30-year reference period (1976-2005). To evaluate the effectiveness of the proposed approaches, one year of data (1985) was removed from some stations; missing precipitation data were estimated using data from the remaining precipitation stations by applying the three procedures. A cross-validation process and an analysis of the error statistics have been considered to determine the accuracy of the estimation for the three gap-filling methods. The outcomes pointed out that the geostatistical approaches outperformed the FAO method in daily estimation. The presented approach performed well in the study area, especially for the Ordinary Kriging, which well-estimated the daily missing data with a low computational effort. However, Cokriging did not significantly improve the estimates.

The work presented herein is supported by the PRIMA programme under grant agreement No. 1923, project Innovative and Sustainable Groundwater Management in the Mediterranean (InTheMED). The PRIMA programme is supported by the European Union.

How to cite: Fagandini, C., Todaro, V., Tanda, M. G., Pereira, J. L., Azevedo, L., and Zanini, A.: Evaluation of three Gap-Filling techniques for daily rainfall data sets: a case study in Portugal, EGU General Assembly 2023, Vienna, Austria, 23–28 Apr 2023, EGU23-1410, https://doi.org/10.5194/egusphere-egu23-1410, 2023.

EGU23-1432 | ECS | Posters on site | HS8.1.9

Land use changes- the Remaining Available Aquifer Storage (RAAS) response in arid-semiarid regions: the Baicheng case study 

Zhe Wang, Longcang Shu, Xiaoran Yin, Yuan Chen, Shuyao Niu, and Pengcheng Xu

Managed Aquifer Recharge (MAR) is an important approach to the sustainable development and utilization of groundwater resources in arid-semiarid regions. However, research on MAR has not been well developed with regard to the remaining available aquifer storage (RAAS), and in particular the impact of land use changes on the RAAS has not been fully explored. This study takes the Baicheng area as an example, calculates the RAAS on the basis of determining the remaining available aquifer, extracts the precipitation- and groundwater extraction-affected RAASs through independent component analysis, establishes regression equations for the areas of land use types and the precipitation- and groundwater extraction-affected RAASs using stepwise regression and all-subsets regression. The response of the precipitation- and groundwater extraction-affected RAASs under three future land use change scenarios is explored. The results show that the RAAS responds significantly to land use changes. The land use changes were active from 2000 to 2018, and the RAAS showed a fluctuating upward trend, reaching a maximum value of 22.39×10⁸m3 in 2010. In the 2036 economic development scenario, the precipitation-affected RAAS is the largest and the groundwater extraction-affected RAAS is the smallest of the three scenarios, contrary to the results in the baseline scenario. The woodland conservation scenario shows that reasonable woodland conservation measures is conducive to groundwater development and utilization, maintaining the groundwater level at a stable level and ensuring the stability of the RAAS, which is conducive to the design and implementation of artificial recharge schemes based on this. The results quantify the relationship between the precipitation- and groundwater extraction-affected RAASs in response to land use changes, and provide a reference for groundwater development and sustainable water resource management in arid-semiarid regions.

How to cite: Wang, Z., Shu, L., Yin, X., Chen, Y., Niu, S., and Xu, P.: Land use changes- the Remaining Available Aquifer Storage (RAAS) response in arid-semiarid regions: the Baicheng case study, EGU General Assembly 2023, Vienna, Austria, 23–28 Apr 2023, EGU23-1432, https://doi.org/10.5194/egusphere-egu23-1432, 2023.

EGU23-1980 | ECS | Posters on site | HS8.1.9

Groundwater recharge restauration in urban area using Low Impact Development/Best Practices 

Amos Agossou, Jae-Boem Lee, and Jeong-Seok Yang

            In recent decades, urban population growth in Africa, Asia and Latin America is changing on an important rate and scale. The urban development is causing changing in surface runoff and groundwater recharge by modifying the existing mechanic. Urbanization increases the impervious area, which tends to lower the evaporation and direct infiltration of rainfall but increases surface runoff. This does not only influence the direct rainfall infiltration rate but also some urbanization practices cause water quality degradation such as increase of nitrogen, salinity, TDS and faecal contamination.

Most of countries in arid and semi-arid regions have their water supply system relying on groundwater resource, this make the resource more important and its protection and conservation require particular attention. In areas where groundwater resource is threatened by urban development combined with climate change, Low Impact Development/best practices (LID/BP) are required for storm water treatment and infiltration, to increased direct deep infiltration of rainfall, better management of surface water which in turn can affect groundwater discharge or recharge.

            LID has emerged recently in the last 30 years, it is promoted as suitable management practice for stormwater in urban area. Its purpose is to restore water balance in the postdevelopment site to the predevelopment conditions. LID stormwater management practice use in urbanized catchment could help to restore or increase groundwater recharge and help mitigate water scarcity issues. Many researches have investigated the effect of LID practices on surface water resource for better management but few of them has investigated the effect of LID stormwater management feature on groundwater recharge.  

            The southern coastal sedimentary basin of Benin is recently under a demographic pressure, impervious area is increasing due to constructions and the water use is increasing proportionally to the population growth. In the region, more than 87% of the population is supplied with groundwater resource. The present study has coupled SWMM with groundwater flow model MODFLOW to investigate the influence of LID practices on groundwater recharge in the study region which is under a residential development. The hydrologic model SWMM was used to estimate groundwater recharge, the infiltration was then used to evaluate the potential effect of the development on groundwater availability. The main goal of this study is to produce a numerical model that can be used to evaluate the deficit groundwater recharge caused by a site development in the southern region of Benin and design LID structure to restore groundwater recharge as in predevelopment conditions. The study has also attempted to develop an excel sheet which will be used for groundwater recharge estimation in specific regions of Benin and the developed database can be used to estimate groundwater recharge deficit caused by a site development.

How to cite: Agossou, A., Lee, J.-B., and Yang, J.-S.: Groundwater recharge restauration in urban area using Low Impact Development/Best Practices, EGU General Assembly 2023, Vienna, Austria, 23–28 Apr 2023, EGU23-1980, https://doi.org/10.5194/egusphere-egu23-1980, 2023.

EGU23-3417 | ECS | Orals | HS8.1.9 | Highlight

Partial validation of a socio-economic system dynamics model against a process based hydro-geological model 

İzel Uygur, Onur Cem Yoloğlu, Nadim Kamel Copty, İrem Daloğlu Çetinkaya, and Ali Kerem Saysel

We develop a high order, multi-loop nonlinear (system dynamics) model for socio-economic sustainability assessment of groundwater resources. Structure and behavior validation of dynamic system models as such pose several challenges. While some of these challenges stem from the ambiguities in theoretical representations of multi-sectorial systems, others stem from the lack of sufficient time varying data sets to calibrate the model reference behavior. In this paper, we focus on partial validation of the groundwater component of this multi-sectorial model. For this purpose, we test the behavioral response of the system dynamics model against a process-based surface/subsurface hydrogeological model. For testing purposes, the hydrogeological model is regarded as the best representation of the reality (a synthetic reality), concerning groundwater flows and accumulations. The system dynamics model is built on Stella Architect and runs on annual time steps for a time horizon of 20 years. The embedded groundwater is a non-spatial, one compartment representation -a box model- of the saturated zone, changing with lateral flows, vertical recharge and anthropogenic extractions. The hydrogeological model is built on the UFZ1-MODFLOW computer program. It simulates evapotranspiration and one-dimensional vertical flow through the vadose zone, and horizontal flow through the underlying aquifer system. The model was developed based on available borehole and pumping tests data and calibrated using observed transient groundwater level data. While the box model and the hydrogeological model are different structural entities, the spatially aggregated behavioral response of the latter under specific experimental conditions help structural validation and calibration of the box model. For this purpose, we apply multiple tests on the lateral and vertical recharge of the hydrogeological model under constant boundary hydraulic head, precipitation, irrigation and evapotranspiration conditions to observe the response in spatially aggregated hydraulic head. We repeat the same experiments on the box model, first to confirm the equations used to simulate the aggregated hydraulic flows, and to estimate the two parameters, “aquifer bottom” and “fractional evaporation” for calibration of the spatially aggregated hydraulic head. The testing process is very useful to arrive at a reliable water budget and hydraulic head response in the system dynamics model, which is going to serve for socio-economic sustainability analysis under stakeholder participation.

This work was developed under the scope of the InTheMED project. InTheMED is part of the PRIMA program supported by the European Union’s HORIZON 2020 research and innovation program under grant agreement No 1923.

How to cite: Uygur, İ., Yoloğlu, O. C., Copty, N. K., Daloğlu Çetinkaya, İ., and Saysel, A. K.: Partial validation of a socio-economic system dynamics model against a process based hydro-geological model, EGU General Assembly 2023, Vienna, Austria, 23–28 Apr 2023, EGU23-3417, https://doi.org/10.5194/egusphere-egu23-3417, 2023.

The Nuapada region, which lies in the western margin of Odisha, India, has been suffering from severe drought conditions and critical aquifer-system stress for decades due to the continuous lowering of the water table, erratic rainfall patterns, and the existence of consolidated hard rock terrains of quartzite, gneisses over the region. Unsustainable groundwater management and continuous withdrawal of sub-surface water resources for domestic, agricultural, and industrial purposes bring depletion of the groundwater table a serious threat and drive interest in choosing the study area for the investigation purposes. 

This work has focused on locating the potential recharge zones in one of the drought-prone hilly tracts of western Odisha part, India, i.e., the northern blocks of Nuapada district, using GIS tools. Secondary datasets such as local administrative data, topomap, satellite data, forest cover and mineral data, population density, soil, precipitation and field information such as surface lithology, lineaments, structural trends, geomorphological features, drainage patterns as primary datasets were integrated into GIS platform to generate thematic maps such as geology, topography, contour, geomorphology, drainage, Lineaments, NDVI and Land Use Land Cover. Groundwater prospective zones over the study region were formed by integrating the thematic layers in the GIS platform. It’s been categorized into five zones such as excellent, good, moderate, moderate to poor, and poor. From the observations, it has been found that excellent and good zones account for around 8.428 and 374.906 Km² respectively of the total study area, whereas moderate, moderate to poor and poor zones account for approximately 734.77, 250.272, and 718.548 Km² respectively of the entire study area. The excellent, good, and moderate zones lie mainly in the northern and eastern parts of the study region. These areas are more suitable for attributing groundwater recharge structures such as check dams, percolation tanks, storage tanks, subsurface dyke, nalabund, contour bunding, and rooftop rainwater harvesting structures etc. The poor zones lie in the western half of the study region. Around half of Komna block and few patches of Nuapada block come under the poor zone category. These areas are unsuitable for building recharge structures. The poor zones are composed of hard rocky quartzite. The rest of the study region is covered with granite, granite gneiss, few patches of khondalites, and little alluvium. Accumulated residual, structural hills, steep sloped rugged topography, distribution of drainage pattern, land use pattern and confined to the semi-confined types of aquifers also play critical roles in the categorization of groundwater potential recharge zones. Inconsistent precipitation and climatic factors such as temperature, humidity and evapotranspiration lead to lowering of water table and acute drought conditions in the study region. The declining trend of the water table has been shown here to assess the amount of water resources in the subsurface region.

How to cite: Ojha, M.: Demarcation of lowered water table zones in a drought-affected area of western Odisha, India, EGU General Assembly 2023, Vienna, Austria, 23–28 Apr 2023, EGU23-3742, https://doi.org/10.5194/egusphere-egu23-3742, 2023.

EGU23-3966 | Orals | HS8.1.9

Assessment of sustainable textile Wastewater Treatment for providing of non-conventional Water- resource related to other activities 

Hanene Akrout, Thuraya Mellah, Lobna Mansouri, Hatem Baccouche, and Ahmed Ghrabi

Human activities place additional pressure on the limited water resources in arid and semi-arid areas, and the overexploitation of groundwater threatens its quality and sustainability. Non-conventional water represents an alternative and extra resource in this situation. Reuse and recycling the treated wastewater reduce the pollution and protect the groundwater resources against pollution and reinforce their sustainability. Textile industry produce and release wastewater near rivers in the Grombalia case study site (Tunisia), which is characterized by high levels of organic, inorganic materials and dyes residues. Innovative scenarios based on the anodic oxidation of textile effluents are developed in the current study. The findings of treated wastewater quality, treatment costs, and related environmental impacts are contrasted with those of in situ treatment (a reference scenario). The effectiveness of electrochemical technology is related to the simultaneous oxidation and reduction on bipolar BDD electrodes. Three optimized treatment scenarios are proposed to improve the real-world applicability of the sustainable treatment. The best solution is the anodic oxidation post-treatment which was selected based on pollution removal and economic costs. Eco-efficiency results confirmed this choice in terms of environmental benefits which are quantified by COD removal enhancement and water reuse potential.

Keywords: groundwater pollution, textile industry, anodic oxidation, eco efficiency, Reuse.

Acknowledgment

“This paper is supported by the PRIMA program under grant agreement No1923, project InTheMED.. The PRIMA program is supported by the European Union”.

How to cite: Akrout, H., Mellah, T., Mansouri, L., Baccouche, H., and Ghrabi, A.: Assessment of sustainable textile Wastewater Treatment for providing of non-conventional Water- resource related to other activities, EGU General Assembly 2023, Vienna, Austria, 23–28 Apr 2023, EGU23-3966, https://doi.org/10.5194/egusphere-egu23-3966, 2023.

Groundwater storage potential is defined as the total amount of permanent storage that exists in the aquifers. The significance of groundwater storage potential is effectively concerned with climate-related impacts on groundwater resources. The current demand for groundwater for societal needs will hasten the depletion rate of the regional groundwater potential. The present research employs a groundwater modelling tool called MODFLOW to estimate the regional groundwater sensitivity, potential and conceptual simulations of groundwater flow in the study region. The groundwater levels of the Solapur region from 2010 to 2021 were used to investigate the region's groundwater potential, along with other parameters, viz., aquifer type and hydraulic conductivity in both vertical and horizontal directions. The groundwater level shows a sensitive response to the rainfall intensity, but the unconsolidated materials have greater water depths regardless of the season. Consolidated material formations show lower available water depths, irrespective of the season. The simulated results of the study show that the regional groundwater depths are sensitive to hydraulic conductivity in both horizontal and vertical directions. The zone budget's findings shows that the regional inflow and outflow are nearly equal. The study replicates that the Solapur area is semi-arid. As a consequence, this research is relevant to all semi-arid places where groundwater is becoming the dominant source of social requirements. Such a study would be useful for appropriate planning and management of groundwater for future requirements.

Keywords:

Groundwater level, Rainfall, Geology, Modflow, Zone budget.


How to cite: Patil, Y. and Landage, A.: Evaluation of the Semi-Arid Region Groundwater Storage Potential for Solapur Region, Maharashtra, India, EGU General Assembly 2023, Vienna, Austria, 23–28 Apr 2023, EGU23-4199, https://doi.org/10.5194/egusphere-egu23-4199, 2023.

EGU23-4229 | Orals | HS8.1.9

Simplified integrated modeling and potential groundwater management benefits of the unsaturated zone in the Urucuia aquifer system, Brazil 

Harald Klammler, Caio Araújo da Silva Leão, Luiz Rogério Bastos Leal, and Kirk Hatfield

An integrated perspective of the terrestrial part of the hydrological cycle from precipitation over soil and aquifer storage to river discharge is fundamental for a sound hydro(geo)logical understanding and, hence, a sustainable groundwater management. Simplified (or reduced-order) approaches can be an efficient tool to focus on the most relevant drivers, processes and responses of a system based on a parsimonious set of parameters and a relatively simple computational implementation. The Urucuia sandstone aquifer system in north-eastern Brazil is a high-plain region with mostly deep unconfined water tables and intensive groundwater pumping for agricultural irrigation causing social and political conflict. Here we develop a coupled reduced-order model of the high-plain and valley aquifer portions in the southern part (approximately 10000 km2) of the Urucuia aquifer, considering the soil zone (partitioning rainfall into evapotranspiration and deep percolation), thick vadose zones (up to approximately 100 m deep with unsaturated vertical moisture transport), and the saturated zone (generally over 100 m thick) providing river discharge. Data for model input (precipitation and potential evapotranspiration) and validation (river discharge) are obtained from the CAMELS-BR database as time series over approximately 40 years. Additional but shorter time series of groundwater levels in high-plain and valley regions are obtained from the RIMAS well database. We show that the much lower seasonality in water table fluctuations observed in the high-plain regions can be explained by the deeper unsaturated zone. While seasonality in river discharge may be attributed to the base flow from the valley aquifer portion, discharge recessions during the dry (practically zero rainfall) months of the year are sustained by the much larger aquifer portions underlying the high-plains. Groundwater pumping is considered as abstraction from storage in the saturated zone and its impact on groundwater levels and river discharges are evaluated with respect to climatic oscillations and long-term trends. The fact that the unsaturated moisture transport through the thick vadose zones under the extensive high-plains may take several years offers an interesting opportunity (in term of lead time) for groundwater management, if deep percolation leaving the soil zone is adequately estimated or measured over time.

How to cite: Klammler, H., Araújo da Silva Leão, C., Bastos Leal, L. R., and Hatfield, K.: Simplified integrated modeling and potential groundwater management benefits of the unsaturated zone in the Urucuia aquifer system, Brazil, EGU General Assembly 2023, Vienna, Austria, 23–28 Apr 2023, EGU23-4229, https://doi.org/10.5194/egusphere-egu23-4229, 2023.

EGU23-4402 | Posters on site | HS8.1.9

Evaluation of the impact of climate change on the shallow aquifer of  Grombalia  (Tunisia) 

Maria Giovanna Tanda, Hanene Akrout, Daniele Secci, Valeria Todaro, Andrea Zanini, Marco D'oria, Hatem Baccouche, Iobna Mansouri, Thouraya Mellah, and Ahmed Ghrabi

Climate change presents a serious problem for water resources (WR) and the shallow aquifers are strongly affected. This type of WR presents fundamental importance in certain regions, due to their accessibility and sometimes, for their quality, it is preferred to surface water sources, often polluted. It is also, affected by overexploitation problems, which contribute to the destruction of the sustainability of the aquifer system. This study considers the Grombalia aquifer in Tunisia which has suffered from climate change’s impact in recent years due to water resources scarcity. Aim of the present research is to evaluate the impact of climate change on this aquifer that is one of the pilot sites in the European project InTheMed. First, a collection of historical temperature, precipitation and groundwater level data in the period 1976-2020 was carried out. Then, starting from the few available geological cross sections, a two-dimensional numerical model of the aquifer was developed in MODFLOW. The groundwater numerical model reproduces the whole basin, from the recharge area to the outlet in the Mediterranean Sea. The area is characterized by agricultural intensive activities and high-water demand. For this reason, the model required a calibration of hydraulic parameters, recharge and pumping rate. After the calibration, the numerical model was able to estimate the groundwater flow across the entire watershed of Grombalia aquifer. To evaluate the impact of climate change on the future groundwater availability, the model was driven using future precipitation and temperature projections. The water abstractions were assumed to remain unchanged in the future and equal to the condition of existing wells at 2020. To describe the future climate, 17 combinations of Regional Climate Models (RCM) and General Circulation Models (GCMs), developed within the EURO-CORDEX initiative, were used. The simulations were performed for the period 2006-2100, and according to the RCP4.5 and RCP8.5 scenarios. Before their use, the climate projections were downscaled and bias corrected with reference to the historical temperature and precipitation data. The results are evaluated in terms of local variations of the groundwater level and their uncertainty is expressed with reference to the variability of the 17 RCM-GCM combinations.

Acknowledgments 
This work was developed under the scope of the InTheMED project. InTheMED is part of the PRIMA program supported by the European Union’s Horizon 2020 research and innovation program under grant agreement No 1923. 

How to cite: Tanda, M. G., Akrout, H., Secci, D., Todaro, V., Zanini, A., D'oria, M., Baccouche, H., Mansouri, I., Mellah, T., and Ghrabi, A.: Evaluation of the impact of climate change on the shallow aquifer of  Grombalia  (Tunisia), EGU General Assembly 2023, Vienna, Austria, 23–28 Apr 2023, EGU23-4402, https://doi.org/10.5194/egusphere-egu23-4402, 2023.

EGU23-5217 | Posters on site | HS8.1.9

Standardized piezometric indicator to improve the evaluation of the aquifer state. Doñana case study (SW Spain) 

Carolina Guardiola-Albert, Lucia De Stefano, and Juan Camilo Barracaldo Orrego

The Doñana aquifer system (SW Spain) is a coastal alluvial detrital formation composed of sands and gravels of fluvial, deltaic and marine origin. This aquifer is the basis for the sustainability of the water resources of the Doñana Natural Space, which includes the Doñana National Park.

From 1991 the water administration initiated a monitoring program of piezometric levels of the Doñana area assuming its direct control, which culminated in 1995 with the establishment of the official control network. In 2021 groundwater monitoring was operational in 261 points distributed throughout the territory of Doñana.

To assess the state of the aquifers around Doñana, the water administration uses a quantitative groundwater status index that is calculated from monthly piezometric level readings and requires that the length of the series be long enough to include wet and dry periods. This index has values bounded between 1 and 0. It is based on the comparison of data from the same month of the year. The driest month is used as the reference month.

The use of this index to estimate the quantitative status of the Doñana area, however, is criticized by scientists and environmental associations for its lack of statistical basis. There are other definitions of a standardized piezometric indicator based on statistical criteria, like those used for the calculation of the standardized drought index. This standardized piezometric indicator is already used in other countries such as France. The present work proposes to use the standardized piezometric indicator to assess the state of Doñana aquifers and compare the results with the index currently used by the water administration.

How to cite: Guardiola-Albert, C., De Stefano, L., and Barracaldo Orrego, J. C.: Standardized piezometric indicator to improve the evaluation of the aquifer state. Doñana case study (SW Spain), EGU General Assembly 2023, Vienna, Austria, 23–28 Apr 2023, EGU23-5217, https://doi.org/10.5194/egusphere-egu23-5217, 2023.

EGU23-5801 | ECS | Orals | HS8.1.9

An artificial neural network as a quick tool to assess the effects of climate change and agricultural policies on groundwater resources 

Daniele Secci, Valeria Todaro, Onur Cem Yologlu, Nadim K Copty, Irem Daloglu Çetinkaya, Marco D'Oria, Ali Kerem Saysel, Maria Giovanna Tanda, and Andrea Zanini

Groundwater is a strategic reserve that is often used to meet water demands in dry seasons and during drought periods. However, the over-exploitation of this vital resources can jeopardize its sustainability. Projected climate change is expected to further exacerbate the situation in many regions of the world. Therefore, it is essential for decision makers to have simple tools to model groundwater flow and to assist in aquifer management. These tools can reduce the computational cost of complex physics-based models, without undermining the reliability of the results. The aim of this work is to develop a surrogate model capable of simulating groundwater flow in the Konya closed basin, a major agricultural region located in central Turkey. The model is used to analyze different future water demand scenarios and evaluate the possible effects of climate change and agricultural policies on groundwater. This aquifer is one of the pilot sites investigated within the “Innovative and Sustainable Groundwater Management In the Mediterranean (InTheMed)” project, which is part of the PRIMA programme. An Artificial Neural Network (ANN) was trained to provide groundwater levels at 30 monitoring points for the period 2020-2039 accounting for different climate and agricultural scenarios. The surrogate model replaces a full numerical surface-subsurface flow model implemented in MODFLOW and calibrated using field data recorded in the period 2000-2019. To define the dataset that feeds the ANN, two multiplicative coefficients were considered: one applied to the historical precipitation and the other to crop water demand. The two coefficients and the current month were considered as input features of the ANN, while the piezometric heads at the 30 monitoring points were the outputs. A dataset of 100 combinations of precipitation and crop coefficients was generated using the Latin Hypercube Sampling method, assuming an increase/decrease range in terms of precipitation equal to +/- 40% and water demand equal to +/- 25%. For each combination of the coefficients, the full numerical model was run starting from January 2020 to obtain piezometric heads at the 30 monitoring points with a monthly time discretization. The final dataset was used to train (70%), validate (15%) and test (15%) the network, highlighting a very good performance of the ANN for all three phases. The fully trained network was used to predict groundwater levels considering three different precipitation scenarios for the period 2020-2039: - 20% of the observed precipitation, no reduction of the observed precipitation and + 20% of the observed precipitation. For each precipitation scenario, the water demand was considered in the range -/+ 20%.

This work was developed under the scope of the InTheMED project. InTheMED is part of the PRIMA programme supported by the European Union’s HORIZON 2020 research and innovation programme under grant agreement No 1923.

How to cite: Secci, D., Todaro, V., Yologlu, O. C., Copty, N. K., Daloglu Çetinkaya, I., D'Oria, M., Saysel, A. K., Tanda, M. G., and Zanini, A.: An artificial neural network as a quick tool to assess the effects of climate change and agricultural policies on groundwater resources, EGU General Assembly 2023, Vienna, Austria, 23–28 Apr 2023, EGU23-5801, https://doi.org/10.5194/egusphere-egu23-5801, 2023.

EGU23-5924 | ECS | Posters on site | HS8.1.9 | Highlight

Pumping strategies towards sustainable use in a stressed aquifer: A case study at the Eastern Mancha Aquifer (Spain) 

Vanessa A. Godoy and Jaime Gómez-Hernández

The aquifers that support irrigated agriculture are being depleted in many parts of the world. In Spain, the situation is not different, and 27% of its aquifers are in bad quantitative condition, mainly due to overexploitation related to agricultural activities. Although the most obvious solution to that problem is to reduce pumping, the quantitative impact of reduced pumping towards sustainable use of groundwater is anything but obvious. We have analyzed the response of the Eastern Mancha aquifer in Spain to pumping reduction scenarios to find ways to stabilize and, ideally, increase aquifer levels. We apply a water balance approach conceived by geologists at the Kansas Geological Survey, in which storage variation is obtained by subtracting pumping from net input, and a linear relationship is established between annual pumping and average water decline. This relationship can then be used to assess the reliability of the data, the sustainability of pumping, the targets of the ongoing management strategies, and the pumping reductions required to stabilize water levels. This method is applied to data coming from 36 wells measured annually from 2011 to 2020. Precipitation data from three stations are used to assess the consistency of groundwater abstraction data. Although we know that conceptually the relationship between the average water level change and the total pumping may not be necessarily linear, the results are coherent with the historical water use behavior for the area and show that the method is appropriate to evaluate the data. Negative values of water level change indicate that the aquifer was not in sustainable conditions most of the time. The results also show that groundwater pumping would need to be significantly reduced to achieve higher water levels. This work shows that measured data on water level changes and water use can provide rapid and valuable information on the condition of the Eastern Mancha aquifer, as well as its response to pumping reduction scenarios.

This work was developed under the scope of the InTheMED project. InTheMED is part of the PRIMA programme supported by the European Union’s HORIZON 2020 research and innovation programme under grant agreement No 1923.

How to cite: A. Godoy, V. and Gómez-Hernández, J.: Pumping strategies towards sustainable use in a stressed aquifer: A case study at the Eastern Mancha Aquifer (Spain), EGU General Assembly 2023, Vienna, Austria, 23–28 Apr 2023, EGU23-5924, https://doi.org/10.5194/egusphere-egu23-5924, 2023.

EGU23-5943 | ECS | Orals | HS8.1.9

Sustainable groundwater management using a combined simulation–optimization approach 

Ioanna V. Anyfanti, Antonis Lyronis, Paraskevas Diakoparaskevas, Emmanouil Varouchakis, and George P. Karatzas

The Mediterranean region has been facing human and climate–change threats in the last decades. The current work, within the InTheMED PRIMA project, implements a groundwater simulation model in combination with optimization techniques and aims to elaborate informed alternatives in the decision–making process for the Tympaki study area.  Tympaki is located in the south of Crete and represents one of the most productive areas in the agricultural sector of the island. The economic activities combined with its location make it a very demanding region in terms of water needs. Most of this demand is met from the coastal aquifer and, more recently, from a reservoir. Climate change, the increase in temperatures and decrease in precipitation, cannot guarantee water resources of sufficient quantity and/or quality. To address these issues, an optimization analysis was conducted. The optimization problem was to maximize the pumping rates subject to a water table that improves or maintains the situation in the aquifer. In the case of Tympaki, this also helps solve the problem of saltwater intrusion. FEFLOW was used to simulate groundwater flow in the porous media and MATLAB application was used for optimization. Since groundwater flow is not a linear process, iterative simulation–optimization runs were performed in the framework of piecewise linear optimization. To avoid time–consuming procedures, customized GUIs were developed for better data processing in MATLAB. The simulation–optimization model was applied to recorded measurements and different time periods, as well as to regional climate model data. In addition, different water management scenarios were evaluated including alternative water sources, such as water from the reservoir or treated wastewater. The results are presented in online maps so that they can be disseminated among stakeholders and help inform all interested parties and enable more transparent decision–making.

This work was developed under the scope of the InTheMED and Sustain-COAST projects.

InTheMED is part of the PRIMA programme supported by the European Union’s Horizon 2020 research and innovation programme under grant agreement No 1923. Sustain-COAST is funded by the General Secretariat for Research and Innovation of the Ministry of Development and Investments under the PRIMA Programme. PRIMA is an Art.185 initiative supported and co-funded under Horizon 2020, the European Union’s Programme for Research and Innovation.

How to cite: Anyfanti, I. V., Lyronis, A., Diakoparaskevas, P., Varouchakis, E., and Karatzas, G. P.: Sustainable groundwater management using a combined simulation–optimization approach, EGU General Assembly 2023, Vienna, Austria, 23–28 Apr 2023, EGU23-5943, https://doi.org/10.5194/egusphere-egu23-5943, 2023.

EGU23-6556 | ECS | Posters on site | HS8.1.9

Achieving Sustainable Groundwater Development with Effective Measures in Beijing Plain, China 

Sida Liu, Yangxiao Zhou, Fatima Eiman, Michael McClain, and Xu-Sheng Wang

Intensive groundwater exploitation has depleted groundwater storage and led to a series of geo-environmental problems in Beijing Plain, China. To cope with the groundwater depletion problem and achieve sustainable groundwater development, groundwater abstraction has been reduced and Managed Aquifer Recharge (MAR) and Environmental Flow Release (EFR) projects have been piloted and planned. To evaluate the effectiveness of the proposed measures in restoring groundwater storage depletion in Beijing Plain, a 3D transient groundwater was constructed to simulate the effects of these proposed measures regionally and locally. Results show that with the reduction of groundwater abstraction, the declining trend of groundwater level has been stopped. The implementation of MAR and EFR projects have successfully enhanced the groundwater recharge and restored the connectivity of the surface water and groundwater. Prediction model results also show that with the large-scale MAR implementation and current level of groundwater abstraction, groundwater levels and groundwater storage will slowly increase in the next 30 years. With these combined measures in Beijing Plain, sustainable development of groundwater resources is expected to be achieved in the near future.

How to cite: Liu, S., Zhou, Y., Eiman, F., McClain, M., and Wang, X.-S.: Achieving Sustainable Groundwater Development with Effective Measures in Beijing Plain, China, EGU General Assembly 2023, Vienna, Austria, 23–28 Apr 2023, EGU23-6556, https://doi.org/10.5194/egusphere-egu23-6556, 2023.

EGU23-7678 | Orals | HS8.1.9 | Highlight

Development of a national-scale decision support system for the water sector in Germany 

Marx Andreas, Boeing Friedrich, Schulz Christian, Lange Rebekka, Schnicke Thomas, Bumberger Jan, Teutsch Georg, and Attinger Sabine

The Water Resources Information System for Germany (WIS-D) project aims to significantly improve the decision-making basis for actors in water management. The target group are expert users at water suppliers, authorities or institutions of the federal or state governments as well as the institutions of public enforcement (e.g. in the allocation of water rights). The aim is to support the current water balance management as well as the adaptation to climate change.

WIS-D, startet in 2021, consists of two interacting platforms. The first platform (dialogue platform) ensures the professional exchange between practice partners and research and the co-production of knowledge. Here, in the circle of the stakeholder cooperation group with eight external institutions, the goals and steps defined in the project application were first discussed bi-laterally and, in a second step, in a workshop, and the stakeholder needs were recorded. For this purpose, information on required water balance variables, indicators and time scales was also requested. Stakeholder interest in climate-hydrology simulations was very high, e.g. for the allocation of water rights. The possibility of using the resulting data sets for WIS-D was contractually agreed. Additional stakeholder requirements, such as uncertainty information, were collected in the stakeholder process.

The requirements and functionalities of the second platform (technical platform) were also defined in a co-production process by the stakeholders and scientists. Based on this, the first experimental prototype was developed and made publicly available at https://webapp.ufz.de/wis-d/ in August 2022. As a change to the original schedule, the stakeholders prioritized, for example, the possibility of regional evaluability in the online portal, so that this functionality, planned for the third project year, has already been integrated into the technical platform today. WIS-D is on its way to providing an uniform database on water balance components for past, present and future across Germany. This can be used to assess the trustworthiness of existing data sets. In addition, WIS-D can help to fill water management related data and information gaps.

The contribution describes the stakeholder process, shows the functionalities of the technical platform, and discusses the challenges of WIS-D development.

How to cite: Andreas, M., Friedrich, B., Christian, S., Rebekka, L., Thomas, S., Jan, B., Georg, T., and Sabine, A.: Development of a national-scale decision support system for the water sector in Germany, EGU General Assembly 2023, Vienna, Austria, 23–28 Apr 2023, EGU23-7678, https://doi.org/10.5194/egusphere-egu23-7678, 2023.

EGU23-8037 | Orals | HS8.1.9

Assessment of groundwater quality and piezometric levels using geostatistical methods in Grombalia aquifer, Tunisia. 

Constantinos F. Panagiotou, Hanene Akrout, Hatem Baccouche, Thuraya Mellah, Lobna Mansouri, and Ahmed Ghrabi

Groundwater sources in arid and semi-arid regions are expected to be gradually more stressed due to multiple causes, such as the depletion of surface water resources, water quality degradation, increasing demand of agriculture and economic and demographic growth.   As a result, there is a need to secure the availability and quality of groundwater reserves in those areas.

Large and high-dimensional datasets are required to fully characterize the physico-chemical properties of the complex groundwater processes. Subsequently, statistical tools are used to provide estimations of these properties beyond the sampling locations, which are required in order to provide reliable assessments of the associated risks. Geostatistical tools are widely used in groundwater applications to estimate the spatial variability of quality parameters by combining different types of datasets to build local models of spatial uncertainty. Special attention is given to the kriging method, which provides an estimate of the unknown quality variable value along with a measure of uncertainty regarding that estimate.

In the current study, groundwater samples are collected from an unconfined aquifer, located at north-eastern Grombalia (Tunisia). Ordinary kriging is used to estimate the spatial variability of piezometric levels and quality parameters. Sampling data are subjected to suitable transformations prior geostatistical computations so that the Gaussian assumption is satisfied, whereas the results are back-transformed to the original space. Different numbers of neighboring data points are considered to decide the spatial extent of the search neighborhood by comparing cross-validation errors. In addition, indicator kriging is used to construct probability maps of the quality parameters, and identify regions that possess high probability to exceed irrigation water quality standards.


Acknowledgement

This work is conducted under ‘EXCELSIOR’ project (www.excelsior2020.eu), which has received funding from the European Union’s Horizon 2020 research and innovation programme under Grant Agreement No 857510, from the Government of the Republic of Cyprus through the Directorate General for the European Programmes, Coordination and Development and the Cyprus University of Technology. This work is also supported by the PRIMA program under grant agreement No1923, project InTheMED. The PRIMA program is supported by the European Union.

How to cite: Panagiotou, C. F., Akrout, H., Baccouche, H., Mellah, T., Mansouri, L., and Ghrabi, A.: Assessment of groundwater quality and piezometric levels using geostatistical methods in Grombalia aquifer, Tunisia., EGU General Assembly 2023, Vienna, Austria, 23–28 Apr 2023, EGU23-8037, https://doi.org/10.5194/egusphere-egu23-8037, 2023.

EGU23-8761 | ECS | Orals | HS8.1.9

Surrogate-based Bayesian characterization of porous and deformable aquifer systems in water stressed regions 

Yueting Li, Claudia Zoccarato, Lorenzo Tamellini, Chiara Piazzola, Pablo Ezquerro, Guadalupe Bru, Carolina Guardiola‐Albert, Roberta Bonì, and Pietro Teatini

Land subsidence is one of most severe geohazards caused by excessive groundwater pumping which has gained increasingly interest over the last decades. Various numerical models have been developed to address this mechanism and support the groundwater policy-makers. In addition, the performance of these models has highlighted the importance of uncertainty quantification related to the unknown hydro-mechanical parameters. Bayesian inversion provides a powerful tool to statistically infer these uncertain parameters by incorporating the numerical model and the available observations. However, Bayesian scheme relies on the sampling algorithm to explore the parameter space. Such exploration requires enormous computational cost in which one realization of numerical model is already costly. Hence, parallel research focuses on surrogate models which aim to fast and accurately approximate the numerical solution with limited training realizations. In this study, Bayesian inversion is facilitated by substituting a coupled groundwater flow-geomechanical model with a surrogate model based on the sparse grid approach. More specifically, a 3D coupled variably-saturated groundwater flow-geomechanical model is first performed to describe the pressure head variation and deformation to the groundwater extraction from 1960 to 2012 in Alto Guadalentín Valley aquifer, Spain. Then, sparse grid method is used to construct the surrogate models which approximate the input/output mapping of the numerical simulator. Lastly, Monte Carlo Markov Chain yields the uncertainties of hydraulic conductivity and compressibility by assimilating the piezometric head records and displacement measurements obtained from Interferometric Synthetic Aperture Radar (InSAR) technique. Our preliminary results demonstrate that the surrogate model has high and fast performance on approximating the state variables in which misfits is negligible with respect to the measurement noise. Bayesian inversion can improve the characterization of parameters of interest whose posterior distributions are significantly constrained comparing to the prior distributions. Moreover, the numerical outcomes with calibrated parameters show a good fit with the available observations. In summary, the illustrated framework takes advantage of novel techniques from various aspects, including monitoring, numerical modeling, statistical analyses and provides a reliable and efficient way to infer properties of aquifer systems with ongoing water pressure depletion.

How to cite: Li, Y., Zoccarato, C., Tamellini, L., Piazzola, C., Ezquerro, P., Bru, G., Guardiola‐Albert, C., Bonì, R., and Teatini, P.: Surrogate-based Bayesian characterization of porous and deformable aquifer systems in water stressed regions, EGU General Assembly 2023, Vienna, Austria, 23–28 Apr 2023, EGU23-8761, https://doi.org/10.5194/egusphere-egu23-8761, 2023.

EGU23-8796 | ECS | Orals | HS8.1.9

Evaluation of Different Water Management Practices for the Sustainable Use of Groundwater Resources in the Konya Closed Basin 

Onur Cem Yoloğlu, İzel Uygur, Nadim K. Copty, İrem Daloğlu Çetinkaya, and Ali Kerem Saysel

The Konya Closed Basin (KCB) in central Turkey is a vast fertile plain that is one of the major agricultural regions of the country and critical to its food supply and security. KCB is characterized by a semi-arid climate, with mean annual precipitation of 379 mm. Since most of the rain occurs in the winter months outside the agricultural season, groundwater is used extensively for irrigation. In recent years, groundwater levels have experienced sharp declines due to the expansion of irrigated lands and the switch to more water-demanding crops. This problem is exacerbated by a large number of unregulated groundwater extraction wells. A regional numerical surface-subsurface water flow model based on the UZF1-MODFLOW computer program was developed for the science-based management of this vital resource. The model simulates transient vertical flow through the vadose zone and groundwater flow through the underlying aquifer system. Because of the lack of direct measurements of groundwater abstraction rates, the time-dependent monthly rate of groundwater abstraction was estimated indirectly based on crop water requirements and historical land allocation for the different crops. The hydrogeology of the site was characterized from borehole data and conducted pumping tests. Historical groundwater level observations between the years 2000-2020 were used to calibrate the model. The key calibration parameter was irrigation efficiency. The challenges of developing and calibrating a regional water flow model are discussed. The calibrated model was then used to simulate the impact of different groundwater conservation scenarios: a slow and a fast transition to less water-demanding crops and the adoption of an optimized cropping pattern. The scenarios are evaluated against the business-as-usual scenario that assumes historical water demand trends remain unchanged. The results underline the urgent need to consider a holistic approach to address the water deficit of the basin. Overall, the model can help policy and decision-makers explore more efficient and sustainable groundwater management practices.


This work was developed under the scope of the InTheMED project. InTheMED is part of the PRIMA program supported by the European Union’s HORIZON 2020 research and innovation program under grant agreement No 1923.

How to cite: Yoloğlu, O. C., Uygur, İ., Copty, N. K., Daloğlu Çetinkaya, İ., and Saysel, A. K.: Evaluation of Different Water Management Practices for the Sustainable Use of Groundwater Resources in the Konya Closed Basin, EGU General Assembly 2023, Vienna, Austria, 23–28 Apr 2023, EGU23-8796, https://doi.org/10.5194/egusphere-egu23-8796, 2023.

EGU23-9087 | Posters on site | HS8.1.9

Effects over infrastructures induced by abnormally high water levels due to the change of irrigation techniques: the case of the Lliria-Casinos aquifer (Spain) 

Javier Rodrigo-Ilarri, María-Elena Rodrigo-Clavero, and Claudia-Patricia Romero-Hernández

During June and July 2022, the urban area of the city of Bétera suffered the effects of flooding caused by rises in the water table that left certain infrastructures in the center of the municipality out of operation. This work summarizes the results obtained by analyzing all the existing hydrogeological information as well as the data obtained from the recently installed municipal piezometric control network.

The municipality of Bétera is located on the LLiria-Casinos aquifer, in the eastern central area of the Júcar River Basin. The analysis carried out confirms that the infiltration excess from irrigation activities may be an important factor in the general water balance. Besides, the spring upwellings are also important. In the scientific literature consulted, a reduction in the corresponding flow is reported, which should have been justified based on a decrease in the piezometric levels. However, the most recent observations available indicate precisely the opposite effect. Water levels have increased, especially in the vicinity of the center of the city center of Bétera itself.

These results are an example of how changing from traditional flooding irrigation techniques to modern drip irrigation methods can unexpectedly alter hydrogeological conditions, even affecting the foundations of buildings and leaving both public and private parking lots out of service, causing the corresponding social alarm.

How to cite: Rodrigo-Ilarri, J., Rodrigo-Clavero, M.-E., and Romero-Hernández, C.-P.: Effects over infrastructures induced by abnormally high water levels due to the change of irrigation techniques: the case of the Lliria-Casinos aquifer (Spain), EGU General Assembly 2023, Vienna, Austria, 23–28 Apr 2023, EGU23-9087, https://doi.org/10.5194/egusphere-egu23-9087, 2023.

EGU23-9282 | ECS | Posters on site | HS8.1.9

Stormwater management in volcanic islands using dry gallery infiltration systems 

Miguel Ángel Marazuela, Alejandro García-Gil, Carlos Baquedano, Jorge Martínez-León, Noelia Cruz-Pérez, and Juan Carlos Santamarta

Extreme precipitation events are expected to become more frequent in the coming years due to climate change, which together with the continuous development of cities and surface sealing that hinder water infiltration into the subsoil, is accelerating the search for new facilities to manage stormwater. The Canary Islands (Spain) are taking advantage of the knowledge acquired in the construction of water mines to exploit a novel stormwater management facility, which we have defined as a dry gallery. Dry galleries are constituted by a vertical well connected to a horizontal gallery dug into highly permeable volcanic layers of the vadose zone, from where infiltration takes place. However, the lack of scientific knowledge about these facilities prevents them from being properly dimensioned and managed. In this work, we simulate for the first time the infiltration process and the wetting front propagation from dry galleries based on a 3D unsaturated flow model and provide some recommendations for the installation and sizing of these facilities. The results demonstrate that stormwater infiltration from dry galleries is a highly transient process in which a sizing underestimation can be committed if unsaturated conditions or geological configuration are neglected.

How to cite: Marazuela, M. Á., García-Gil, A., Baquedano, C., Martínez-León, J., Cruz-Pérez, N., and Santamarta, J. C.: Stormwater management in volcanic islands using dry gallery infiltration systems, EGU General Assembly 2023, Vienna, Austria, 23–28 Apr 2023, EGU23-9282, https://doi.org/10.5194/egusphere-egu23-9282, 2023.

The High Plains aquifer in the central United States is one of the world’s largest and most important regional aquifers in terms of the agricultural production that its waters support. The portion of the aquifer in the state of Kansas has been heavily stressed for decades, producing large water-level declines that have called into question the continued viability of groundwater-based irrigated agriculture and the rural communities that depend on it. Given the sparsity of surface water in the region, reductions in pumping, which are typically accompanied by modifications of agricultural practices, are often the only option to extend the aquifer lifespan. Such reductions, however, must be implemented over a relatively large area to make a significant impact on regional decline rates. In 2012, the Kansas Legislature approved a new groundwater management option to facilitate pumping reductions, the Local Enhanced Management Area (LEMA) program. This program allows the development of locally generated management plans that are then supported by regulatory oversight. The first LEMA, the Sheridan-6 (SD-6) LEMA, was established in 2013 in a 255 square kilometer area in northwest Kansas with the goal of reducing water use by 20% relative to the prior average use. In the first decade, the pumping reduction was close to 30% after controlling for climatic conditions. More importantly, the water-level decline rate decreased by over 50%, thereby extending the aquifer lifespan by over five years during the first ten years of the LEMA. The ultimate extension of the aquifer lifespan, which will likely be much greater, depends on how net inflow changes with time. Until now, net inflow has remained close to the pre-reduction level. Eventually, however, it will decrease in response to the pumping reductions. Continued monitoring will enable the timing and magnitude of that decrease to be quantified. The success of the SD-6 LEMA has led to the establishment of larger LEMAs in 2018 (12,623 square kilometers) and 2021 (663 square kilometers) with an additional LEMA under consideration. If the success of the irrigators in the SD-6 LEMA can be duplicated in these larger areas, the lifespan of the High Plains aquifer in Kansas will be significantly extended.

How to cite: Butler, J.: Extending aquifer lifespans with pumping reductions: Experiences from the High Plains aquifer, EGU General Assembly 2023, Vienna, Austria, 23–28 Apr 2023, EGU23-9552, https://doi.org/10.5194/egusphere-egu23-9552, 2023.

EGU23-11516 | Posters on site | HS8.1.9

Multicriteria decision-making approach as a strategy to deal with land subsidence in affected areas 

Concepción Pla, Javier Valdes-Abellan, Maria I. Navarro-Hernandez, Carolina Guardiola-Albert, Pablo Ezquerro, Guadalupe Bru, Alper Elçi, Claudia Meisina, and Roberto Tomas

Unsustainable groundwater extraction may cause groundwater levels drawdown leading to compaction of the aquifer systems and causing the lowering of ground surface, i.e., land subsidence. Thus, to prevent from land subsidence caused by the overexploitation of aquifer systems it is essential avoiding the unsustainable decline of groundwater levels. An effective policy to mitigate land-subsidence should include systematic monitoring and modelling of groundwater bodies in exposed areas, evaluation of potential damages, and cost-benefit analyses permitting the implementation of adequate mitigation or adaptation measures. Among others, these measures should consider groundwater regulation and strategic long-term measures, such as the development of alternative water supplies, the introduction of changes and reallocation of water demands in the different sectors, or the implementation of severe legal control related to water uses.

The RESERVOIR project (PRIMA Foundation) aims to provide new products and services for a sustainable groundwater management model. Within this global aim, one specific task of the project focuses on the establishment of good management practices related to groundwater uses in areas affected by land subsidence.

In this study, a multicriteria decision-making approach is suggested to evaluate the potential possibilities and different scenarios for subsidence mitigation in the affected areas. This methodology is based on the analytical hierarchical process (AHP), an easy-to-use procedure which allows individual and group decisions. The procedure, which has been applied to multiple real-life scenarios, requires the evaluation of various criteria and sub-criteria by assigning them relative weightings to finally choice between a set of alternatives.

The methodology is proposed as a tool to evaluate the different possibilities to deal with subsidence in the affected areas and might be particularized by selecting the criterions to be considered (for instance, environmental, economic, social, technical, or legal, among others) in order to group the different sub-criteria to be evaluated and weighted. This tool can be particularly applied to different areas. In addition, based on the final purpose, different agents (technicians, stakeholders, farmers, businessman, general population, etc.) can contribute to obtain the results and final conclusions of the analysis.

This study has been carried out in the framework of the RESERVOIR project (sustainable groundwater RESources managEment by integrating eaRth observation deriVed monitoring and flOw modelIng Results), funded by the Partnership for Research and Innovation in the Mediterranean Area (PRIMA) programme supported by the European Union (G. A. Nº 1924).

How to cite: Pla, C., Valdes-Abellan, J., Navarro-Hernandez, M. I., Guardiola-Albert, C., Ezquerro, P., Bru, G., Elçi, A., Meisina, C., and Tomas, R.: Multicriteria decision-making approach as a strategy to deal with land subsidence in affected areas, EGU General Assembly 2023, Vienna, Austria, 23–28 Apr 2023, EGU23-11516, https://doi.org/10.5194/egusphere-egu23-11516, 2023.

EGU23-11715 | ECS | Orals | HS8.1.9

IMPROVING GROUNDWATER MANAGEMENT IN THE MEDITERRANEAN REGION THROUGH CITIZEN SCIENCE AND TECHNOLOGY: THE eGROUNDWATER PROJECT 

Adria Rubio-Martin, Manuel Pulido-Velazquez, Esther Lopez-Perez, Carlos Sanchis-Ibor, Alberto Garcia-Prats, Juan Manzano-Juarez, Marta Garcia-Molla, Miguel Angel Jimenez-Bello, Elisa Peñalvo-Lopez, Jean-Daniel Rinaudo, Nicolas Faysse, Marta Nieto-Romero, Sofia Bento, Luis Nunes, Vania Serrao de Sousa, Zhour Bouzidi, and Abdelouahab Nejjari

The eGROUNDWATER project aims to improve sustainable, participatory groundwater management in the Mediterranean region by developing and testing Enhanced Information Systems (EIS) that integrate citizen science and information and communication technology (ICT) tools. A key component of the EIS is a mobile app that will allow farmers and other groundwater users to report groundwater levels in their wells and the amount of water used for irrigation and other purposes. At the same time, the app will provide users with information about the state of the aquifer and recommendations for sustainable water use (for example, short-term and seasonal predictions of irrigation water needs).

The eGROUNDWATER app has the potential to be a valuable tool for improving the sustainable use and management of aquifers in the Mediterranean region. By gathering real-time data from a wide range of users, the app will help to create a more complete and accurate picture of groundwater conditions and usage. Policymakers and resource managers can use this information to make informed decisions about the allocation and use of water resources. It can also help to identify potential problems and areas where conservation efforts may be needed.

The development of an app that meets the needs of the users required first to understand their perspectives and experiences related to the groundwater body. eGROUNDWATER has organized interviews and meetings in each case study to characterize the vision of the different agents on the groundwater bodies, and to try to build a collective framing of the current groundwater status and use in the area. On these meetings, the users identified lack of information about the aquifer as a critical issue to solve in order to advance towards a sustainable management of the resource.

In addition to providing valuable data and information, the eGROUNDWATER app has the potential to engage and educate farmers and other users about the importance of sustainable water management. The app can foster a sense of ownership and responsibility for the aquifer's health among users, as it offers personalized feedback and information about the use of water and the aquifer’s health. This, in turn, could lead to more responsible water use practices and help to preserve groundwater resources for the long-term.

The eGROUNDWATER project and its accompanying mobile app offer a promising approach to improving the sustainable use and management of aquifers in the Mediterranean region. The engagement of stakeholders in the development process and the collection and sharing of useful data and information through the app can help promoting education and awareness about water resource management. These efforts can help to foster a greater understanding of the importance of these resources and encourage more sustainable use of aquifers in the region, significantly contributing to the long-term sustainability of Mediterranean aquifers.

Acknowledgements:

This study has received funding from the eGROUNDWATER project (GA n. 1921) a project from the PRIMA programme, supported by Horizon 2020, the European Union's Framework Programme for Research and Innovation.

How to cite: Rubio-Martin, A., Pulido-Velazquez, M., Lopez-Perez, E., Sanchis-Ibor, C., Garcia-Prats, A., Manzano-Juarez, J., Garcia-Molla, M., Jimenez-Bello, M. A., Peñalvo-Lopez, E., Rinaudo, J.-D., Faysse, N., Nieto-Romero, M., Bento, S., Nunes, L., Serrao de Sousa, V., Bouzidi, Z., and Nejjari, A.: IMPROVING GROUNDWATER MANAGEMENT IN THE MEDITERRANEAN REGION THROUGH CITIZEN SCIENCE AND TECHNOLOGY: THE eGROUNDWATER PROJECT, EGU General Assembly 2023, Vienna, Austria, 23–28 Apr 2023, EGU23-11715, https://doi.org/10.5194/egusphere-egu23-11715, 2023.

EGU23-12755 | Orals | HS8.1.9

Preliminary assessment of the relationships between rainfall, flow discharge and biodiversity changes in a karst spring system in central Italy 

Annalina Lombardi, Francesco Cerasoli, Barbara Tomassetti, Paolo Tuccella, Gianluca Redaelli, Mattia Di Cicco, Barbara Fiasca, Antonio Di Sabatino, and Diana Maria Paola Galassi

Groundwater-fed springs are relatively stable freshwater environments which harbor a valuable biodiversity and represent a precious water source for human needs. However, with ongoing global warming and increasing human footprint on natural systems, spring ecosystems are more and more exposed to hydrologic and physico-chemical alterations, which would in turn threaten their biodiversity. Recently, scientists claimed that an integrated “ecohydrogeological” approach, analyzing patterns and drivers of changes in spring environments from various perspectives, would greatly help in assuring the long-term preservation of these precious ecosystems. Following this plea, we studied both the ecological and the hydrological dynamics of the Presciano karst spring system (Abruzzo, Central Italy). The Crustacea Copepoda were chosen as target invertebrate group, since they are main components of the freshwater meiofauna and occur in all the groundwater-dependent ecosystems, groundwater-fed springs included. Specifically, we analyzed temporal changes in both copepod species richness and between-site differences in assemblage composition (i.e., beta diversity). The observed patterns were also contrasted to variations in measured physico-chemical parameters. On the hydrologic side, starting from rain gauge data, we implemented the CETEMPS Hydrological Model (CHyM) to derive a rain field with hourly resolution across the Gran Sasso – Sirente hydrogeological basin, which hosts the recharge areas feeding the Presciano spring. The modelled monthly cumulative rain, averaged across the Gran Sasso – Sirente basin, was then compared to the maximum and minimum monthly flow discharge values extracted from a hydrometric station located downstream the Presciano spring outlet. Finally, future rainfall simulations for the 2081-2091 decade were performed on the same area by forcing the CHyM software under the RCP8.5 emission trajectory, based on three different Regional Climate Models. Both species richness and beta diversity of the Presciano spring noticeably varied over time but variability of hydrochemistry could not comprehensively explain such changes, except for species turnover which was tightly related to between-site variability in water oxygenation. Seasonal discharge variations may thus have a more prominent role than local water conditions in determining the overall structure of spring meiofauna assemblages. Moreover, a not-negligible signal emerged from the comparison of precipitation and discharge temporal dynamics, indicating that accurately modelling rainfall in recharge areas would permit to better estimate and possibly forecast temporal variation in spring discharge. The future projections highlighted an overall predicted drop in precipitation across the Gran Sasso − Sirente basin, warning about possible groundwater lowering in karst springs in the next future.

How to cite: Lombardi, A., Cerasoli, F., Tomassetti, B., Tuccella, P., Redaelli, G., Di Cicco, M., Fiasca, B., Di Sabatino, A., and Galassi, D. M. P.: Preliminary assessment of the relationships between rainfall, flow discharge and biodiversity changes in a karst spring system in central Italy, EGU General Assembly 2023, Vienna, Austria, 23–28 Apr 2023, EGU23-12755, https://doi.org/10.5194/egusphere-egu23-12755, 2023.

EGU23-12862 | ECS | Posters virtual | HS8.1.9

Geophysical survey of near-surface aquifers for the goals of Managed Aquifer Recharge in a settlement of the Danube-Tisza Interfluve, Hungary 

Soma Oláh, Márk Szijártó, Ferenc Visnovitz, and Judit Mádl-Szőnyi

For recent decades, the groundwater level has been decreasing in the area of the Danube-Tisza Interfluve, Hungary, mainly due to climate change. The average depth of water table is between 5-7 m in the elevated Interfluve area. The shallow eolian and fluvial aquifers of the region can be used to store water between the surface and water table for later extraction or for ecological benefit. Therefore, Managed Aquifer Recharge (MAR) systems could play an essential role in improving the stored water and the water balance in the Danube-Tisza Interfluve.

The aim of the research was to carry out a geophysical survey and a complex data processing in order to analyse the characteristics of near-surface sediments of Kerekegyháza town (Danube-Tisza Interfluve, Hungary) for MAR implementation. For a detailed understanding of the shallow geological environment in Kerekegyháza, we used three main data systems and previous interpretations. Stratigraphic information was collected and examined from (1) hydrogeological reports. In addition, (2) archived vertical electric sounding (VES) measurements were reprocessed. Furthermore, (3) two-dimensional electric resistivity tomography (ERT) was performed. Summarizing the lithological and electric resistivity data, 4 geological sections and a complex 3D data system were compiled.

Interpreting the preliminary information, a simplified three-layered (uncovered aquifer – aquitard – covered aquifer) geological model was set up in the pilot area. Based on the stratigraphic information and the electric resistivity values, the geological setting is more heterogeneous than the simplified model. Hence the determined layers are not horizontally continuous, except for the uncovered dry sand or quicksand aquifer with 0-3 m thickness. Below that, presumably clay lenses cause rapid lateral variations in the grain size and the resistivity. However, the correspondence between the electrical and lithological divisions is not evident due to the different resolutions of the applied methods. The ERT results suggest that the pattern of heterogeneity shows spatial variation, which requires further research to explain the exact geological causes. The most significant reservoir in the area of the town is the covered sand formation with ~15 m thickness, detected by all applied methods.

The results can provide background for planning the appropriate technique of Managed Aquifer Recharge in the town of Kerekegyháza, mitigating further groundwater subsidence. In addition, its application for further cities in the elevated region of the Danube-Tisza Interfluve can contribute to more sustainable management with available water resources.

The research was funded by the National Multidisciplinary Laboratory for Climate Change, RRF-2.3.1-21-2022-00014 project.

How to cite: Oláh, S., Szijártó, M., Visnovitz, F., and Mádl-Szőnyi, J.: Geophysical survey of near-surface aquifers for the goals of Managed Aquifer Recharge in a settlement of the Danube-Tisza Interfluve, Hungary, EGU General Assembly 2023, Vienna, Austria, 23–28 Apr 2023, EGU23-12862, https://doi.org/10.5194/egusphere-egu23-12862, 2023.

EGU23-12968 | Orals | HS8.1.9 | Highlight

Impact of climate change on groundwater levels in the Iberian Peninsula 

Amir Rouhani, Marco D'Oria, J. Jaime Gómez-Hernández, Michael Rode, and Seifeddine Jomaa

Groundwater represents a strategic freshwater resource for multiple sectors, including drinking water, agriculture production, and ecosystem services. The Mediterranean Basin is a well-known water-scarce region that is increasingly relying on groundwater use, especially during drought periods. Many areas in the Mediterranean region are already facing water stress due to increasing demand and limited resources. Climate change is likely to exacerbate these issues, as it is expected to lead to more frequent and severe drought conditions in some areas as well as irregular rainfall in others. Due to the growing availability of data and computational processing capabilities nowadays, deep learning models are seeing an increase in popularity. In this study, we attempted to create 92 location-specific Convolutional Neural Network (CNN) models in wells spatially distributed over the Iberian Peninsula to estimate groundwater levels until the end of the century. Our models use monthly precipitation and temperature data as input variables. Specifically, we considered cumulative precipitation for 3, 6, 12, 18, 24, and 36 months to account for the recharge time lag between precipitation and groundwater changes. Once trained using historical precipitation and temperature records, the CNNs were applied to assess the influence of climate change on groundwater levels. For future climate projections, an ensemble of six combinations of distinct General Circulation Models (GCMs) and Regional Climate Models (RCMs) was considered under two Representative Concentration Pathways (RCPs): the RCP4.5 and RCP8.5. Our preliminary results revealed a more consistent decline in groundwater levels in the southwest region of the Iberian Peninsula under the RCP8.5 scenario, while a general more constant groundwater level under the RCP4.5 scenario has been detected towards the end of the century. Detailed results of this study will be shared and discussed during the event.

How to cite: Rouhani, A., D'Oria, M., Gómez-Hernández, J. J., Rode, M., and Jomaa, S.: Impact of climate change on groundwater levels in the Iberian Peninsula, EGU General Assembly 2023, Vienna, Austria, 23–28 Apr 2023, EGU23-12968, https://doi.org/10.5194/egusphere-egu23-12968, 2023.

EGU23-13121 | ECS | Orals | HS8.1.9

A Groundwater Flow Modeling Application for the Impact Assessment of Treated Wastewater Reuse by Managed Aquifer Recharge 

Cigdem Eryilmaz Saylan, Alper Elci, and Melis Somay Altas

The tendency towards more groundwater use is becoming increasingly prevalent in regions where surface water supplies are limited in quantity and quality. However, the over-abstraction of groundwater can lead to serious issues. Therefore, to maintain the supply-demand balance for groundwater, withdrawals from aquifers should not exceed groundwater recharge. In cases where they do, groundwater reserves should be replenished with external water. Returning treated wastewater to the aquifer via managed aquifer recharge structures is a proven strategy that can effectively increase groundwater recharge rates. The objective of this study is to use groundwater flow modeling to assess the impacts of recharging treated wastewater to the aquifer at the sub-basin scale. The study is realized within the scope of the European Union-supported research project TRUST, which is conducted by six Mediterranean countries to mitigate water scarcity under the influence of climate change.

A MODFLOW-based groundwater flow model is constructed for the Fetrek Creek sub-basin, which is located in an environmentally stressed semi-urban area in Western Turkiye. The input data for the model consists of information obtained from reviewing and synthesizing borehole logs, groundwater recharge rates from an independent hydrological modeling study, groundwater level time series from 17 monitoring wells, and information from previous geological and hydrogeological studies. The PEST parameter optimization method is used to calibrate the model. First, a baseline scenario representing the current state is investigated using the calibrated flow model. The model is then used to determine the impacts of various managed aquifer recharge application scenarios, thereby reflecting wastewater reuse in the sub-basin.


Acknowledgment:

This study is funded by the PRIMA program supported by the European Union under grant agreement No: 2024, project TRUST (management of industrial Treated wastewater ReUse as mitigation measures to water Scarcity in climaTe change context in two Mediterranean regions).

How to cite: Eryilmaz Saylan, C., Elci, A., and Somay Altas, M.: A Groundwater Flow Modeling Application for the Impact Assessment of Treated Wastewater Reuse by Managed Aquifer Recharge, EGU General Assembly 2023, Vienna, Austria, 23–28 Apr 2023, EGU23-13121, https://doi.org/10.5194/egusphere-egu23-13121, 2023.

EGU23-13470 | ECS | Orals | HS8.1.9

Random Forests-Based Surrogate Model as a Tool to Facilitate Groundwater Management 

Janire Uribe-Asarta, Vanessa A. Godoy, and J. Jaime Gómez-Hernández

The recovery of aquifers under severe stress requires tools to understand their behaviour to define the most sustainable measures and the collaboration of all the stakeholders involved, water authorities, legislators, and groundwater users. The most used tools for decision-making are numerical models. However, numerical models are usually computationally expensive and due to their complexity are limited to people with advanced technical knowledge. This work proposes to replace the numerical model with a quick and simple-to-use tool accessible to all aquifer’s users. For that, we develop a surrogate model based on artificial intelligence methods. This groundwater flow surrogate model allows evaluating the impact of possible changes in pumping extractions or rainfall on piezometric heads in the near future. It has been applied to the Requena-Utiel and Cabrillas-Malacara aquifers, in Spain, considered overexploited by the Júcar River Basin Authority. The surrogate modelling methodology requires a numerical model to create the training data set for the machine learning algorithms. The numerical model is implemented and calibrated using MODFLOW 2005 and FloPy using all available information from 1980 to 2016, with a monthly discretization. The training dataset is obtained by generating 100 MODFLOW realizations with different scenarios of recharge and pumping rate and 145 selected monitoring points from 2016 to 2052. Recharge rate is allowed to decrease up to 60% or increase up to 25% of the average of the last ten years, while, pumping rates are allowed to decrease up to 70% and increase up to 30%. Then, the data is shuffled and 90% is used for training and the remaining 10% is used for testing. Three different algorithms were tried to compare the results: Random Forests, AdaBoost and XGBoost, and random forests were selected as the final surrogate model for its best performance. The surrogate models produce very similar and accurate approximations of the piezometric heads with respect to the data they were trained with and the reduction in computational time is remarkable. The predictions of the surrogate model are interpolated over the study area to obtain piezometric head values maps.

This research was developed under the scope of the InTheMED project, which is part of the PRIMA Program supported by the European Union’s Horizon 2020 Research and Innovation Program under Grant Agreement No 1923.

How to cite: Uribe-Asarta, J., A. Godoy, V., and Gómez-Hernández, J. J.: Random Forests-Based Surrogate Model as a Tool to Facilitate Groundwater Management, EGU General Assembly 2023, Vienna, Austria, 23–28 Apr 2023, EGU23-13470, https://doi.org/10.5194/egusphere-egu23-13470, 2023.

EGU23-13827 | Posters on site | HS8.1.9 | Highlight

Power of groundwater data sharing in the Mediterranean region 

Seifeddine Jomaa, Rafael Chavez, Nahed Ben-Salem, Emmanouil Varouchakis, Nadim K. Copty, George P. Karatzas, Michael Rode, and J. Jaime Gómez-Hernández

Groundwater is a strategic water resource in water-stressed regions such as the Mediterranean region. It used to meet the increasing domestic water demand and food production, maintaining ecosystem integrity and buffering climate change impacts. However, groundwater information that relies mainly on in-situ data observations remains fragmented and lacking standardization in the Mediterranean region due to the lack of systematic monitoring and data-sharing policy. PRIMA Foundation, launched in 2018 as a European Commission funding program, has targeted groundwater as a priority topic in its two first calls of 2018 and 2019. Sustain-COAST and InTheMED are two PRIMA-funded projects aiming for sustainable groundwater management in the Mediterranean region, adopting innovative but complementary approaches. Among their specific goals, Sustain-COAST and InTheMED projects have jointly developed a joint effort to collect groundwater-level data from around the Mediterranean. Over 14,000 time series of historical groundwater level data have been collected from different countries and have been harmonized into a common format. The resulting groundwater database has opened new horizons and perspectives for groundwater assessment that were previously invisible. In this contribution, we present and explore five new directions that have resulted from the groundwater database of the Mediterranean region: 1.  Trend analysis and groundwater patterns clustering and their controlling drivers, 2. Regional groundwater level estimates combining different global groundwater models and regional in-situ data, 3. A methodological framework using Gravity Recovery and Climate Experiment (GRACE) satellite data to retrieve groundwater storage changes, 4. Water policy timeline, harmonization and pathways for innovative governance, and 5. Lesson learned from “success stories” of groundwater trend reversal and their transfer capabilities. This contribution will shed light on the power of data-sharing and will call for future systemic groundwater data collection in the Mediterranean region and beyond.

How to cite: Jomaa, S., Chavez, R., Ben-Salem, N., Varouchakis, E., K. Copty, N., P. Karatzas, G., Rode, M., and Gómez-Hernández, J. J.: Power of groundwater data sharing in the Mediterranean region, EGU General Assembly 2023, Vienna, Austria, 23–28 Apr 2023, EGU23-13827, https://doi.org/10.5194/egusphere-egu23-13827, 2023.

EGU23-15634 | ECS | Orals | HS8.1.9

Geochemical side effects of potential Managed Aquifer Recharge during infiltration of monovalent partial desalinated water into different dune sands 

Laura Braeunig, Mareike Schloo, Victoria Burke, Janek Greskowiak, and Gudrun Massmann

Managed Aquifer Recharge (MAR) with desalinated saline water is of increasing importance to mitigate groundwater overexploitation and improving its quality. Besides high energy demand, fully desalinated water needs to be post-treated to increase the total dissolved solids concentration for its further use. As a new approach, the aim of the cooperative project “innovatION” is the development of a monovalent-selective membrane capacitive deionization method to improve the ecological footprint and to deliver a purposeful removal of ions. Nonetheless, the infiltration of a water with different water chemistry than natural pore- or groundwater causes geochemical interactions between water and sediment. 

Here, we present first insights of geochemical water-sediment interactions during infiltration of a monovalent partial desalinated water (mPDW) into three different dune sediments from the barrier island Langeoog, Northern Germany, by conducted column experiments. The island of Langeoog was chosen as one of the demonstration sites of the project. The results of the column experiments show that ongoing processes such as cation exchange and calcite dissolution depend clearly on the sediment characteristics. The more pedogenically developed the infiltrating media is, the more complex the geochemical interactions get. Calcite dissolution takes place during infiltration into beach sediment with a higher carbonate content, whereas infiltration into decalcified brown dune sands shows accumulation/adsorption of Ca2+. Grey dune sands appear to be a suitable location for a potential MAR application on Langeoog due to less distinct geochemical reactions. Numerical investigation of the respective experiments is shown in a companion study by Schloo et al. (submitted to EGU2023). Trace element mobilization was shown to not just depend on shifting redox conditions but also on the chemical composition of the infiltrating water potentially linked to colloidal transport. Especially, As and V mobilization were periodically retained during mPDW infiltration. Nevertheless, all reactions are shown to be time limited during the experiments and unlikely to cause major problems, hence MAR with mPDW on Langeoog might be a suitable approach to secure the freshwater lens volume in future in an energy efficient way.

How to cite: Braeunig, L., Schloo, M., Burke, V., Greskowiak, J., and Massmann, G.: Geochemical side effects of potential Managed Aquifer Recharge during infiltration of monovalent partial desalinated water into different dune sands, EGU General Assembly 2023, Vienna, Austria, 23–28 Apr 2023, EGU23-15634, https://doi.org/10.5194/egusphere-egu23-15634, 2023.

EGU23-15753 | Orals | HS8.1.9

Deep generative inversion of ERT data for electrical resistivity 

Leonardo Azevedo and João L. Pereira

Electrical resistivity tomography (ERT) is a geophysical method used to imaging the subsurface and widely used in hydrogeological studies due to its sensitivity to electrical resistivity, which is directly related to rock type, porosity, ionic strength of the pore fluids, and surface conductivity of geologic materials. The prediction of subsurface properties from the recorded data at the surface requires solving a challenging geophysical inversion problem. For near-surface characterization studies, this is often accomplished with deterministic electrical resistivity inversion methods. Deterministic geophysical inversion approaches linearize the problem around an initial solution, resulting in a single smooth representation of the subsurface. Deterministic models are unable to capture the natural variability of the subsurface. Moreover, a single solution does not yield enough information for accurate uncertainty assessment. Contrary to deterministic approaches, stochastic inversion methods predict multiple model realizations that fit similarly the recorded geophysical data and allow assessing uncertainties. Lately, deep learning algorithms based on deep generative models have been used to re-parametrize model and data spaces into low-dimensional domains and solve geophysical inverse problems in a more efficient way.

We propose an ERT inversion methodology in which a deep convolutional variational autoencoder (VAE) network is trained with a set of electrical resistivity models generated using geostatistical simulation. After training the VAE, the latent space is perturbed and updated iteratively with adaptive stochastic sampling to generate electrical resistivity models by inputting the optimized latent vectors to the decoder part of the VAE. From the set of decoded models, we use a finite volume approximation of Poisson’s equation to compute synthetic apparent resistivity models. The misfit between predicted and observed apparent resistivity data is used to drive the convergence of the iterative procedure and condition the optimization of new models in the subsequent iterations.

The proposed methodology is illustrated by applying it to both a two-dimensional synthetic case and to a two-dimensional profile obtained from an ERT survey carried out in an area located in the Southern region of Portugal. In both application examples, the predicted models generate synthetic geophysical data that match the observed one. We show the ability of the model to assess spatial uncertainty and compare the results obtained in the real data set against commercial deterministic ERT inversion methodology.

The work presented herein is supported by the PRIMA programme under grant agreement No. 1923, project Innovative and Sustainable Groundwater Management in the Mediterranean (InTheMED). The PRIMA programme is supported by the European Union.

How to cite: Azevedo, L. and L. Pereira, J.: Deep generative inversion of ERT data for electrical resistivity, EGU General Assembly 2023, Vienna, Austria, 23–28 Apr 2023, EGU23-15753, https://doi.org/10.5194/egusphere-egu23-15753, 2023.

EGU23-16268 | ECS | Posters on site | HS8.1.9

Identification of groundwater recharge zones using comparative analysis of drainage networks 

Sourav Sundar Das, Arun Kumar Saraf, and Ajanta Goswami

Groundwater, being limited extent in hardrock terrain is undeniably a precious resource for livelihood. In the hardrock terrain of Bundelkhand craton, India where seasonal rainfall is mostly discharged through surface runoff, it is necessary to check and delay the surface runoff to mitigate water table decline caused due to overgrowing demand for groundwater. The objective of this study is to identify suitable places for groundwater recharge where the process of recharge to the groundwater offers better results than the vicinity as per the prevailing hydrogeological conditions. This objective has been achieved employing geospatial  techniques using DEM and toposheet of the Betwa Basin of the Bundelkhand craton. In this present study, a comparative analysis has been carried out by superimposing a drainage network extracted from the toposheet over a simulated drainage network derived from the DEMs such as SRTM, ASTER and ALOS PALSAR to visualise the clustering tendency of the two data sets. The comparative analysis reveals a mismatch of the two datasets at some places which are visible on all the DEMs considered indicating potential groundwater recharge zones. Such mismatch has appeared at places where the degree of infiltration is significant enough to alter the course of the existing drainage network recorded on the toposheet from the simulated one because of the assumption of the surface to be insulated. This study proves to be a quick and reliable method for the identification of groundwater recharge zones for hard rock terrains which are regularly experiencing water scarcity.

Keywords: DEM, toposheet, drainage network, hardrock terrain

How to cite: Das, S. S., Saraf, A. K., and Goswami, A.: Identification of groundwater recharge zones using comparative analysis of drainage networks, EGU General Assembly 2023, Vienna, Austria, 23–28 Apr 2023, EGU23-16268, https://doi.org/10.5194/egusphere-egu23-16268, 2023.

EGU23-16328 | Posters on site | HS8.1.9

Feasibility and application of managed aquifer recharge for a safe and sustainable water supply in Syria 

Thomas Reimann, Marcus Genzel, Abdulnasr Aldarir, Thomas Fichtner, Alireza Kavousi, Andreas Hartmann, Thomas Grischek, and Peter-Wolfgang Gräber

The overall aim of the MEWAC-FEMAR project (Middle East Regional Water Research Cooperation Program – Feasibility of Managed Aquifer Recharge), funded by the German Federal Ministry of Education and Research (BMBF), is to support and enhance a safe and sustainable water supply in the Middle East by Managed Aquifer Recharge (MAR). One target region is Syria, which is facing water insecurity regarding water availability, water supply, and agricultural water needs. In addition, the region is severely affected by war which results in extreme destruction of infrastructure and other resources.

The project's objective is to provide a model-based framework for integrated water resources management (IWRM) to identify suitable sites for MAR and to predict their impact on the regional water balance and the local situation. The proposed framework incorporates different methods and model techniques with applications ranging from global to local scales. The model workflow is completely based on open-source tools to ensure sustainable use of the project efforts.

Modeling on the global scale is mainly done by data-driven methods like GIS Multi-Criteria Decision Analysis (GIS-MCDA) to answer questions like where are suitable and feasible areas for MAR. Regional scale models aim to describe the hydrological cycle by distributed numerical methods (e.g., MODFLOW-OWHM) to predict and manage MAR under consideration of the regional groundwater situation. Local-scale numerical models can provide detailed and site-specific insights into the flow and transport processes of the unsaturated zone and the underlying aquifer. Specific activities in Syria include e.g., evaluation of wastewater reuse for irrigation. Finally, the current process understanding with regard to MAR methods is critically evaluated and expanded.

How to cite: Reimann, T., Genzel, M., Aldarir, A., Fichtner, T., Kavousi, A., Hartmann, A., Grischek, T., and Gräber, P.-W.: Feasibility and application of managed aquifer recharge for a safe and sustainable water supply in Syria, EGU General Assembly 2023, Vienna, Austria, 23–28 Apr 2023, EGU23-16328, https://doi.org/10.5194/egusphere-egu23-16328, 2023.

EGU23-16393 | ECS | Orals | HS8.1.9

Regional-scale groundwater modeling, focusing on boundary inflow and impact assessment of managed aquifer recharge in karst systems 

Marcus Genzel, Thomas Reimann, Alireza Kavousi Heydari, Andreas Hartmann, Joanna Doummar, and Max-Gustav Rudolph

Managed aquifer recharge (MAR) is a powerful approach to counteracting the negative impacts of overexploited groundwater resources and enhancing groundwater availability in water-scarce regions. One common MAR strategy is aquifer storage and recovery (ASR). Theoretically, the ASR techniques can be adopted for karst systems to store and recover water within the system or to increase the subsurface inflow into the alluvial system from the adjacent upland karst system. However, karst systems present a particular challenge for the application and technical implementation of ASR, due to the associated strong anisotropy and heterogeneity, high runoff dynamics, as well as the underlying uncertainties regarding the available data.

This research is oriented to provide a regional scale model of a karst-alluvial system in Lebanon, analyzing the impact of MAR scenarios as well as quantifying boundary inflow to adjacent alluvial systems. For this reason, several model conceptualizations (considering multi-model concepts) and ASR application scenarios are adopted and tested. For transferability, real-world case studies and idealized yet generalizable systems are considered and assessed. The model pre- and postprocessing is entirely script-based and uses open-source tools to ensure sustainable use

An anisotropic fast-marching algorithm is used to create spatially distributed karst channel networks through the Python package pyKasso. In addition, a discrete continuum model is developed (e.g., CfPy), where the stochastic conduit networks are implemented as a large ensemble of the plausible and representative karstic system. The regional karst alluvial model results are also used to make general recommendations for MAR site selection in the karstic study site.

How to cite: Genzel, M., Reimann, T., Kavousi Heydari, A., Hartmann, A., Doummar, J., and Rudolph, M.-G.: Regional-scale groundwater modeling, focusing on boundary inflow and impact assessment of managed aquifer recharge in karst systems, EGU General Assembly 2023, Vienna, Austria, 23–28 Apr 2023, EGU23-16393, https://doi.org/10.5194/egusphere-egu23-16393, 2023.

EGU23-16409 | Orals | HS8.1.9 | Highlight

GTool: A new user-driven tool aiming at achieving a sustainable groundwater governance in Mediterranean aquifers 

Damián Sánchez García, Manuel Argamasilla Ruiz, Adrián Palomino Gómez, Miguel Ángel Díaz Hurtado, Lupicinio García Ortiz, Francisco Núñez Moreno, José Manuel Nieto López, and David Aguilera Romero

Climate change scenarios obtained by models foresee changes in the availability of water resources that make it necessary to improve their management, especially for groundwater, as they are one of the most important, but at the same time most vulnerable, sources of fresh water on the planet. Groundwater governance can be defined as "the process by which groundwater is managed through the application of elements such as accountability, participation, availability of information, transparency, customs and policy." The manner in which this governance is carried out can have direct implications for the status of groundwater, both qualitatively and quantitatively, hence its importance when analysing the status of an aquifer or groundwater body. The objective of this contribution is to present GTool, a brand new digital and user-driven tool developed in the framework of the EU PRIMA project GOTHAM, which aims at establishing a new groundwater governance model based on a bottom-up approach. One of the modules that GTool integrates, called “Groundwater Response Module”, has been designed with the objective of forecasting the most probable groundwater body status according to a selection of variables. The input data used to assess the current and expected status of the aquifer comprises groundwater quality trends, prediction of scarcity and drought indexes, the potential use of non-conventional water resources (reused water), the increase of available resources by the implementation of managed aquifer recharge (MAR) techniques, potential groundwater quality restoration by means of remediation techniques, and current groundwater governance. This methodology has been applied in Campo de Dalías-Sierra de Gádor groundwater body (Southern Spain), which is characterised by large groundwater abstraction (mainly for the irrigation of greenhouses crops), steep and lasting drops of groundwater levels and subsequent groundwater quality degradation by seawater intrusion and salinity increase. Results show that, despite the good groundwater governance and high MAR and non-conventional water resources potential currently existing in the area, Campo de Dalías-Sierra de Gádor groundwater body is expected to have a ‘bad’ status in the medium term, principally due to the forecasted scarcity and drought indexes and, secondarily, upward trends regarding salinity (electrical conductivity, chloride) and nitrate contents.

How to cite: Sánchez García, D., Argamasilla Ruiz, M., Palomino Gómez, A., Díaz Hurtado, M. Á., García Ortiz, L., Núñez Moreno, F., Nieto López, J. M., and Aguilera Romero, D.: GTool: A new user-driven tool aiming at achieving a sustainable groundwater governance in Mediterranean aquifers, EGU General Assembly 2023, Vienna, Austria, 23–28 Apr 2023, EGU23-16409, https://doi.org/10.5194/egusphere-egu23-16409, 2023.

EGU23-17218 | Orals | HS8.1.9 | Highlight

Using Remote Sensing and Integrated Hydrologic Models to Characterize the How Irrigated Agriculture Affects Highly Overdrawn Aquifers in the United States 

David Hyndman, Anthony Kendall, Trevor Partridge, Jake Stid, and Adam Zwickle

Irrigated agriculture consumes vast amounts of water and energy, yet it is key to high crop yields. This is especially important as we are facing increasing population and high variability in precipitation related to climate change. However, groundwater storage continues to be overdrawn due to irrigation withdrawals at unsustainable rates. We have been quantifying the effects of irrigated agriculture, management practices, and climate across the High Plains Aquifer, California’s Central Valley, and Michigan in the United States. Our team uses agricultural and integrated hydrologic models to characterize how management changes affect water resources and crop productivity. We map annual changes in irrigated agriculture and solar panel areas by integrating biophysical data and remote sensing imagery using machine learning. We then use this information as input to model the effects of agricultural management strategies on water use, crop yield, energy use, and water supplies. In a portion of the High Plains Aquifer, we showed the effects of two very different irrigation adaptation strategies on irrigation water use. This analysis showed that a local management solution, where groups of regional farmers collectively agreed to reduce their pumping, was a much more effective solution than a technology-based approach where more efficient irrigation technology was adopted that uses less water per acre. This research shows how the integration of remotely-sensed and ground-based data into fully-distributed integrated hydrologic models can help stakeholders move toward more sustainable agricultural practices. 

How to cite: Hyndman, D., Kendall, A., Partridge, T., Stid, J., and Zwickle, A.: Using Remote Sensing and Integrated Hydrologic Models to Characterize the How Irrigated Agriculture Affects Highly Overdrawn Aquifers in the United States, EGU General Assembly 2023, Vienna, Austria, 23–28 Apr 2023, EGU23-17218, https://doi.org/10.5194/egusphere-egu23-17218, 2023.

HS8.2 – Subsurface hydrology – Groundwater

EGU23-2141 | ECS | Posters on site | HS8.2.1

Estimating hydraulic conductivity using extended leak-off test conducted during drilling large-diameter borehole 

Yeonguk Jo, Yoonho Song, and Sehyeok Park

Extended leak-off test (XLOT) is one of the in-situ tests, routinely conducted to evaluate integrity of the cased and cemented wellbores during deep borehole drilling, as well as in situ hydraulic properties at a casing shoe depth.

We introduce results of the XLOT conducted in a large diameter borehole, which is drilled for installation of deep borehole based geophysical monitoring system to monitor micro-earthquakes and fault behavior of major linearments in the subsurface. The borehole was planned to secure a final diameter of 200 mm (or more) at a depth of ~1 km deep, with 12" diameter wellbore to intermediate depths, and 7-7/8" (~200 mm) to the bottom hole depths.

We drilled first the 12" diameter borehole to approximately 504 m deep and installed API standard 8-5/8" casing, then cemented the annulus between the casing and bedrock. Then we carried out the XLOT, for several purposes such as confirming casing and cementing integrity, as well as estimating in-situ stress and hydraulic conductivity at the casing shoe depth. To that end, we drilled 4 m length interval to directly inject water and pressurize into the rock mass using the upper API casings. During the XLOT, we recorded flow rates and interval pressures in real time. Based on the logs, we tried to analyze hydraulic conductivity of the test interval, and compare the results with previously reported hydraulic properties measured in other ways.

How to cite: Jo, Y., Song, Y., and Park, S.: Estimating hydraulic conductivity using extended leak-off test conducted during drilling large-diameter borehole, EGU General Assembly 2023, Vienna, Austria, 23–28 Apr 2023, EGU23-2141, https://doi.org/10.5194/egusphere-egu23-2141, 2023.

EGU23-2274 | ECS | Orals | HS8.2.1

Evaluating solute-Trapping Induced Non-Fickian Transport in Partially Saturated Porous Media 

Ilan Ben-Noah, Juan J. Hidalgo, Joaquin Jimenez-Martinez, and Marco Dentz

We study the upscaling of pore-scale solute transport in partially saturated porous media at different saturation degrees. The interaction between structural heterogeneity, phases distribution and small-scale flow dynamics induces complex flow patterns and broad probability distributions of flow. In turn, this spatial distribution of flow velocities, at the pore scale, induces irregular (non-Fickian) transport of dissolved substances (e.g., contaminants), causing an earlier arrival and longer tailing, which may have grave consequences in underestimating risk assessments and prolonged cleanup times of contaminated sites.

Here, we suggest an integrated continuous time random walk (CTRW) modeling framework, which accounts for also the entrapping of particles in zones of low flow velocities, to estimate the resident times of solutes in the media. Furthermore, comparing the results of the CTRW model to a well-established numerical simulation method allows a phenomenological evaluation of the model's physical parameters for different conditions (i.e., volume of entrapped air, mean water flow rate, or solute molecular diffusion coefficient).   

In this study we show that entrapped air promotes preferential solute transport and solute trapping in low flow regions. Moreover, we demonstrate that the trapping frequency and trapping time depend on the interaction between advection and diffusion (i.e., the Péclet number). An integrative CTRW model captures the effects of trapping in stagnant regions and preferential transport on non-Fickian dispersion of solutes.

How to cite: Ben-Noah, I., Hidalgo, J. J., Jimenez-Martinez, J., and Dentz, M.: Evaluating solute-Trapping Induced Non-Fickian Transport in Partially Saturated Porous Media, EGU General Assembly 2023, Vienna, Austria, 23–28 Apr 2023, EGU23-2274, https://doi.org/10.5194/egusphere-egu23-2274, 2023.

EGU23-3033 | ECS | Posters on site | HS8.2.1

Land subsidence induced by groundwater withdrawal: from conceptual model to Hydromechanical model in Chousui River Alluvial Fan, Taiwan 

Gumilar Utamas Nugraha, Chuen-Fa Ni, and Thai Vinh Truong Nguyen

The Choushui River Alluvial Fan (CRAF) is facing serious land subsidence problems. In recent years, the main subsidence areas have gradually moved inland, causing security issues for the Taiwan High-Speed Rail (THSR) in the Yunlin county. Although pumping groundwater along the high-speed railway is forbidden, the problem of sinking land has remained. The causes of land subsidence can be multiple and complex. There are discussions about the causes of land subsidence in the Chousui River Alluvial Fan. This study aimed to develop a hydromechanical land subsidence model in this groundwater basin. The modeling process is divided into two broad parts: the groundwater flow model and the hydromechanical/land subsidence model. The development of the model was focused on the severe area of land subsidence in this basin; for this situation, the so-called “site specific model” was developed. Another reason this study used the site-specific model is that the Taiwan government has installed an integrated land subsidence monitoring system in the severe area, including Multilevel Compacting Well (MLCW), GNSS, and Groundwater observation well. This abundant data can be used when calibrating the groundwater flow and mechanical model. The modeling process starts with the construction of site-specific conceptual modeling derived from the basin scale conceptual modeling. This process revealed that the site consists of four aquifers and four aquitard layers with various thicknesses. The next process was creating a numerical groundwater model that began with creating a grid of the model domain. The model consists of fifty rows and fifty columns with ten by-ten meter grid cells and eight layers representing four aquifers and four aquitards. For perimeter boundary conditions, the model has specified head boundary conditions on the east and west part and no-flow boundary conditions on the north, south, and bottom of the model. the hydraulic and mechanical for the initial input of the model were generated using the previous study in this basin. Groundwater flow calibration processes were done using the PEST package. The model was evaluated using a multi-criteria performance meter: R-squared, root mean squared error (RMSE), mean absolute error (MAE), and Nash Sutcliffe Error (NSE). The calibration process for the groundwater flow model shows an excellent result for both mechanical and groundwater flow. The next step is modeling simulated subsidence using scheduling pumping using a different pumping rate scenario. This simulation aimed to reduce subsidence using calibrated pumping rate value but the difference in time of pumping. The result shows a significant subsidence reduction with scheduling pumping in a certain well. Any stakeholder can consider this result to reduce subsidence in the Chousui River Alluvial Fan.

How to cite: Utamas Nugraha, G., Ni, C.-F., and Vinh Truong Nguyen, T.: Land subsidence induced by groundwater withdrawal: from conceptual model to Hydromechanical model in Chousui River Alluvial Fan, Taiwan, EGU General Assembly 2023, Vienna, Austria, 23–28 Apr 2023, EGU23-3033, https://doi.org/10.5194/egusphere-egu23-3033, 2023.

Experimental observation and measurement are essential to fundamentally understanding the processes that govern fluid flow and mass transport in rough-walled fractures. The micro-PIV (micro-Particle Image Velocimetry) technique has been introduced for flow visualization inside microscale rough-walled fractures. However, the methodology for mass transport visualization has yet to be established, which is crucial for the analysis/quantification of mass transport and dispersion in rough-walled fractures. This study presented the improved micro-PIV technique to visualize mass transport and measure solute concentration in rough-walled rock fractures. Calibration processes for determining the solute concentration from the measured fluorescence intensity were presented, and measured concentrations were applied to the solute transport and dispersion analyses to validate the measurement technique. The microscopic imaging and analysis demonstrated the transition from macrodispersion to Taylor dispersion-dominant transport. As the fluid velocity increased, higher concentration gradients occurred across the fracture aperture, enabling the solute to break through rapidly along the main flow channel in the middle of the fracture aperture. We successfully visualized channelized solute transport associated with eddies that accounts for Taylor dispersion and non-Fickian transport. This technique enables phenomenon-based experimental research on fluid flow and solute transport in microscale rock fractures, which used to remain in the realm of numerical simulations. Our improved visualization technique will contribute to experimentally elucidating mass transport processes in rough-walled rock fractures.

How to cite: Kim, D. and Yeo, I. W.: Microscopic imaging technique for solute transport in rough-walled rock fractures using micro-PIV, EGU General Assembly 2023, Vienna, Austria, 23–28 Apr 2023, EGU23-3285, https://doi.org/10.5194/egusphere-egu23-3285, 2023.

EGU23-4020 | ECS | Orals | HS8.2.1

Thin film flow: fluid transport via thin liquid films in slow porous media flows 

Marcel Moura, Paula Reis, Gerhard Schäfer, Renaud Toussaint, Eirik Grude Flekkøy, Per Arne Rikvold, and Knut Jørgen Måløy

The standard liquid transport processes in porous media happens through a network of interconnected pore bodies and pore throats (here called the primary network). When a non-wetting phase displaces a wetting phase from a porous sample (drainage), thin films of the wetting phase are bound to be left on the surface of the constituting grains (for example when air displaces water from a porous rock, thin films of water are left behind, covering the rock grains). Under certain conditions, isolated liquid films can eventually merge, forming a secondary network of interconnected films and capillary bridges (see red arrows in the figure) that can effectively enhance the overall connectivity of the medium and act as a new pathway for fluid transport. We have performed experiments using transparent networks with the objective of studying transport processes that are enhanced by film flow. Our setup allow us to directly visualize the secondary network in the sample and we have shown how fluid bodies that are not linked via the primary network can actually be connected via the secondary network. This connection has important consequences for processes such as the dispersion of pollutants in soils and the transport of nutrients to plants in arid regions.


References

Moura, E. G. Flekkøy, K. J. Måløy, G. Schäfer and R. Toussaint, “Connectivity enhancement due to film flow in porous media,” Phys. Rev. Fluids 4, 094102 (2019).

Moura, K. J. Måløy, E. G. Flekkøy, and R. Toussaint, “Intermittent dynamics of slow drainage experiments in porous media: Characterization under different boundary conditions,” Front. Phys. 7, 217 (2020).

How to cite: Moura, M., Reis, P., Schäfer, G., Toussaint, R., Flekkøy, E. G., Rikvold, P. A., and Måløy, K. J.: Thin film flow: fluid transport via thin liquid films in slow porous media flows, EGU General Assembly 2023, Vienna, Austria, 23–28 Apr 2023, EGU23-4020, https://doi.org/10.5194/egusphere-egu23-4020, 2023.

EGU23-4701 | Posters on site | HS8.2.1

Evaluating groundwater responses to earthquakes using hydrological and environmental tracer data 

Dugin Kaown, Dong-Chan Koh, Jaemin Lee, Jaeyoun Kim, and Kang-Kun Lee

Environmental tracer data were applied to assess chemical signatures of deep fluid in the fault zones in the southeastern part of South Korea. After MW 5.5 Pohang Earthquake in November 2017, hydrogeochemical and environmental tracer data from groundwater samples around epicenter were monitored from 2017 to 2021. Monitoring wells significantly responded to the earthquakes were selected to evaluate temporal variations of environmental tracer data in the groundwater system. The southeastern part of South Korea shows a distinctive NNE-directed geomorphological feature with several strike-slip fault systems and two wells are closely located to this fault. One monitoring station, KW5, is closely located to the Ulsan Fault, which is a reverse. 3He/4He was slightly increased in most of groundwater samples from monitoring wells after MW 5.5 Pohang Earthquake, while 3He/4He decreased in some groundwater samples from wells around reverse fault (Ulsan fault). Especially, 3He/4He in the wells of KW5 station closely located to the Ulsan Fault considerably decreased after the earthquake. However, the concentrations of Na, Ca, SO4 and HCO3 increased around wells in Ulsan Fault after the earthquake. In this study, the response of aquifer system after earthquakes was compared to assess the differences in chemical changes of fluid around strike-slip and reverse faults using hydrogeochemical and environmental tracer data.

This work was supported by the National Research Foundation of Korea (NRF) grant funded by the Korea government (MSIT) (No. 2022R1A5A1085103).

How to cite: Kaown, D., Koh, D.-C., Lee, J., Kim, J., and Lee, K.-K.: Evaluating groundwater responses to earthquakes using hydrological and environmental tracer data, EGU General Assembly 2023, Vienna, Austria, 23–28 Apr 2023, EGU23-4701, https://doi.org/10.5194/egusphere-egu23-4701, 2023.

The fracture density of rock could create the applying shock waves phase difference at the laboratory scale. For using this technology in determining the stress status along the wave propagating path, removing unnecessary noise is the most crucial task. In this study, a machine learning method with Long short-term memory (LSTM) algorithm to retreat the signals from sophisticated seismograms is proposed. The primary analyzing target is data across the 2022 Taitung, Eastern Taiwan seismic event and another micro-seismic data set associated with a surface crack on a hill of Ping-Tong, southern Taiwan. It is found that there is no phase difference among vertical and horizontal components from the same record, when comparing the difference between two various records then the result is distinct. The detecting sub-surface crack density via phase difference has increased in some seismic data pairs of eastern Taiwan after the rupture of the 2022 Taitung earthquake. The machine learning method with LSTM helps to elevate the data retrieval accuracy which cannot be done by conventional Fast Fourier Transformation (FFT). Records from stations adjacent to the hypocenter offer better agreement in phase difference measurement, the higher signal possibly causes it to noise ratio (SNR) in the such neighborhood.


Keywords: phase difference, machine learning, LSTM, crack density, stress field

How to cite: Yu, T.-T. and Peng, W. F.: Inverting the Subsurface Fracture Density by Detecting the Phase Difference of Various Seismic wave with Machine Learning, EGU General Assembly 2023, Vienna, Austria, 23–28 Apr 2023, EGU23-4868, https://doi.org/10.5194/egusphere-egu23-4868, 2023.

EGU23-6531 | Posters on site | HS8.2.1

About the possibility of monitoring groundwater fluxes variations through active-DTS measurements 

Olivier Bour, Nataline Simon, Nicolas Lavenant, Gilles Porel, Benoît Nauleau, and Maria Klepikova

The monitoring of temporal variabilities of groundwater flows is a critical point in many hydrogeological contexts, especially for the characterization of coastal aquifers, sub-surface heterogeneities or else groundwater/stream interactions. Considering the lack of available methods, we investigate the possibility of monitoring and quantifying groundwater fluxes variations over time through active-Distributed Temperature Sensing (DTS) measurements. Active-DTS, consisting in heating a fiber optic cable, performs very well for investigating the spatial distribution of groundwater fluxes but the method has never been tested to continuously monitor groundwater fluxes changes. In this context, both numerical simulations and sandbox experiments were performed in order to assess the sensitivity of temperature elevation to variable flow conditions. Results first demonstrate that when a flow change is followed by a long-enough steady-state flow stage the temperature elevation stabilizes independently of previous fluxes conditions. Thus, the stabilization temperature can easily be interpreted to estimate groundwater fluxes using the analytical model commonly used under steady flow conditions to interpret active-DTS measurements. Under certain flow conditions, depending on the nature of flow variations, the approach also allows the continuous monitoring of fluxes variations over time. If instantaneous flow changes occur, the superposition principle can even be used to reproduce the temperature signal over time. In summary, we demonstrated through these preliminary results the possibility of for monitoring and/or quantifying the temporal dynamic of groundwater fluxes at different temporal scales including diurnal and periodic fluxes variations, which open very interesting perspectives for the quantification of subsurface processes.

How to cite: Bour, O., Simon, N., Lavenant, N., Porel, G., Nauleau, B., and Klepikova, M.: About the possibility of monitoring groundwater fluxes variations through active-DTS measurements, EGU General Assembly 2023, Vienna, Austria, 23–28 Apr 2023, EGU23-6531, https://doi.org/10.5194/egusphere-egu23-6531, 2023.

EGU23-6663 | ECS | Posters on site | HS8.2.1

3D characterisation of the Yorkshire Wolds chalk aquifer, UK 

Laura Burrel, Rowan Vernon, Jon Ford, Richard Haslam, Tom Randles, Helen Burke, Mark Woods, Jonathan Lee, and Katie Whitbread

The Yorkshire Wolds Chalk aquifer, provides the main source of water supply in East Yorkshire and the city of Hull, which have a population over 900.000. Its structural configuration, including the effects of faulting, influence groundwater flow across the region. However, stratigraphic and structural characterisation is challenging due to limited bedrock being exposed at surface, with most of its extension covered by Quaternary glacial deposits and arable fields and pastures. While the coastal sections have been well characterised through the years, inland areas of the Yorkshire Wolds Chalk aquifer have not been systematically mapped since the late 19th century. The available maps do not reflect present-day stratigraphic divisions or current tectonic understanding, leading to an underestimation of the structural complexity of the aquifer.

A multi-faceted approach to geological mapping is being undertaken in the region by the British Geological Survey, in collaboration with the Environment Agency and Yorkshire Water, integrating remote sensing, targeted field mapping, palaeontological analysis, 2D onshore seismic interpretation and borehole records. The objective of the project is to deliver an up-to-date geological map and structural model of the Chalk bedrock and Quaternary deposits which will impact on the groundwater resources management.

The recent mapping campaigns have led to identifying and characterising numerous new faults in different structural trends, which were not present on previous maps. It has also led to a significant shifting of stratigraphic contacts and formation thicknesses, which have more lateral variability than previously thought. We present some of the most recent updates on the Yorkshire Wolds Chalk aquifer map, which highlight the importance of revising old cartography using modern tectonic and stratigraphic concepts and a multidisciplinary approach to field data collection and compilation. We are also interested in discussing with the hydrogeologist community how to better capture and represent structural complexity around fault zones, so it has an impact on hydrogeological modelling.

How to cite: Burrel, L., Vernon, R., Ford, J., Haslam, R., Randles, T., Burke, H., Woods, M., Lee, J., and Whitbread, K.: 3D characterisation of the Yorkshire Wolds chalk aquifer, UK, EGU General Assembly 2023, Vienna, Austria, 23–28 Apr 2023, EGU23-6663, https://doi.org/10.5194/egusphere-egu23-6663, 2023.

EGU23-6813 | Posters on site | HS8.2.1

An interactive map platform for groundwater data visualization and real-time numerical modeling 

Chuen-Fa Ni, I-Hsien Lee, Gumilar Utamas Nugraha, and Thai Vinh Truong Nguyen

Accurate assessment of groundwater resources relies on sufficient measurements and efficient analysis tools. The integrated technologies and multidisciplinary knowledge of groundwater have enhanced the understanding of dynamics in groundwater systems. Taking advantage of wide developments in computer sciences and web services, the web platform provides an excellent open environment for groundwater investigations. Most groundwater-relevant web platforms are mainly focusing on data visualization. The data, such as points, polylines, polygons, and pre-analysis results (i.e., the figures) overlap a street map to indicate the locations of interest and quantify the influenced regions of groundwater hazards. Such a one-way interaction framework has significantly limited the implementations of measurement data and groundwater-relevant applications. The study aims to develop an online web-based platform for groundwater data visualization, temporal and spatial data analysis, mesh generation and flow modeling. The study integrates multiple program languages to bridge the data flow and online visualization. The interactive real-time web environment enables users to screen temporal and spatial measurements on the web map, conduct online data analyses, and develop numerical groundwater models. With a well-designed database and numerous modules for data analyses and modeling, the platform allows users to share data and develop collaborative activities. The built-in analysis tools can also improve the efficiency of groundwater management and decision-making processes.

How to cite: Ni, C.-F., Lee, I.-H., Nugraha, G. U., and Nguyen, T. V. T.: An interactive map platform for groundwater data visualization and real-time numerical modeling, EGU General Assembly 2023, Vienna, Austria, 23–28 Apr 2023, EGU23-6813, https://doi.org/10.5194/egusphere-egu23-6813, 2023.

EGU23-6983 | Orals | HS8.2.1

Surface and subsurface mapping of the Flamborough Head Fault Zone to inform groundwater management in the Yorkshire Wolds, UK. 

Rowan Vernon, Laura Burrel, Jon Ford, Richard Haslam, Tom Randles, Dave McCarthy, Mark Woods, and Helen Burke

The Flamborough Head Fault Zone (FHFZ) is a regionally-significant structural zone in northeast England which dissects the Upper Cretaceous Chalk Group, a 500 m thick limestone succession which is a principle aquifer and main source of water supply in the region. The geometry and physical characteristics of the Chalk succession, including the effects of faulting, influence groundwater flow across the region. Consequently, understanding the architecture of the FHFZ is vital to sustainably managing water resources in this area.

The FHFZ marks the southern extent of the Cleveland Basin and the northern margin of the Market Weighton Block and has a complex history of Mesozoic-Cenozoic extension and compression. It is predominantly comprised of east-west trending faults which form a graben that is dissected by north-south trending faults, including the southern extension to the Peak Trough, the Hunmanby Fault. To the west, FHFZ links with the Howardian Fault System and offshore, in the east, it is truncated by the north-south trending Dowsing Fault. The FHFZ is well exposed and described in coastal cliff sections at Flamborough Head but the inland architecture of the faults has hitherto been poorly explored predominantly due to limited inland-exposure.

To address this a multi-faceted approach to geological mapping has been undertaken in the region by the British Geological Survey, in collaboration with the Environment Agency and Yorkshire Water Limited. Remote sensing, targeted field mapping, palaeontological analysis, passive seismic and 2D onshore seismic interpretation have been integrated to understand the inland architecture of the FHFZ in unprecedented detail. Combining these techniques has enabled us to bridge the gap between the surface geology and deeper subsurface structure, increase our understanding of the geology of the region and produce an improved conceptual model at a range of depths which will be used to better manage water resources.

How to cite: Vernon, R., Burrel, L., Ford, J., Haslam, R., Randles, T., McCarthy, D., Woods, M., and Burke, H.: Surface and subsurface mapping of the Flamborough Head Fault Zone to inform groundwater management in the Yorkshire Wolds, UK., EGU General Assembly 2023, Vienna, Austria, 23–28 Apr 2023, EGU23-6983, https://doi.org/10.5194/egusphere-egu23-6983, 2023.

EGU23-7325 | Orals | HS8.2.1

Groundwater flow changes in response to extensional earthquakes: a case study from the 2016-17 seismic sequence in Central Italy 

Costanza Cambi, Francesco Mirabella, Marco Petitta, Francesca Banzato, Giulio Beddini, Carlo Cardellini, Davide Fronzi, Lucia Mastrorillo, Alberto Tazioli, and Daniela Valigi

Changes in groundwater flow in response to strong earthquakes are widely described in many tectonic environments. For example, a post-seismic discharge variation is often attributed to an increase of bulk permeability due to co-seismic fracturing and/or to a change in the role of faults in acting as conduits/barrier to groundwater flow.

We take as an example the fractured aquifer of the Mts. Sibillini carbonate massif, in Central Italy, which were affected by a strong and prolonged extensional seismic sequence in 2016-17. The sequence was characterized by an M=6.5 event (mainshock), an M=6 event, an M=5.9 event, up to 60 M>4 events and several M>5 earthquakes. The strongest events caused rupturing of the topographic surface for a cumulative length in the order of 30 km and an important portion of aftershocks occurred at depths where groundwater is stored.

As a response to the seismic sequence, the main NNW-directed groundwater flow was diverted to the west and a discharge deficit was observed at the foot-wall of the activated fault system with a relevant discharge increase, accompanied by geochemical variations, at the fault system hanging-wall.

By integrating geo-structural reconstructions, seismological and ground deformation data, artificial tracer tests results and a 4-years discharge and geochemical monitoring campaign data, we show that the observed groundwater variations are due to a combination of permeability increase along the activated fault systems and hydraulic conductivity increase of the hanging-wall block due to fracturing, extension and subsidence, which determined a fast aquifers emptying. Seismicity temporarily triggered a change of the pre-existing predominant along-faults-strike NNW-SSE oriented regional flow to a west-directed flow, perpendicular to faults strike. We discuss the position of the aquifer with respect to the activated faults and how this affected the observed phenomena.


REFERENCE

Cambi, C., Mirabella, F., Petitta, M., Banzato, F., Beddini, G., Cardellini, C., ... & Valigi, D. (2022). Reaction of the carbonate Sibillini Mountains Basal aquifer (Central Italy) to the extensional 2016–2017 seismic sequence. Scientific Reports, 12(1), 1-13. DOI: 10.1038/s41598-022-26681-2

How to cite: Cambi, C., Mirabella, F., Petitta, M., Banzato, F., Beddini, G., Cardellini, C., Fronzi, D., Mastrorillo, L., Tazioli, A., and Valigi, D.: Groundwater flow changes in response to extensional earthquakes: a case study from the 2016-17 seismic sequence in Central Italy, EGU General Assembly 2023, Vienna, Austria, 23–28 Apr 2023, EGU23-7325, https://doi.org/10.5194/egusphere-egu23-7325, 2023.

EGU23-7646 | Posters on site | HS8.2.1

Experimental and simulation study of quasistatic capillary rise resulting in pressure-saturation (p-s) hysteresis 

Animesh Nepal, Marco Dentz, Juan J Hidalgo, Jordi Ortin, and Ivan Lunati

During imbibition, fluid-fluid interface at the inlet of a constriction experiences an increase in capillary force that results in rapid fluid invasion known as Haines jump. During drainage, the interface gets pinned at the end of the constriction, which causes p-s trajectories to follow different paths during imbibition and drainage resulting in p-s hysteresis. In this work, we performed quasistatic two-phase flow experiments and simulations of cyclic imbibition and drainage to have a quantitative understanding of pore-scale processes resulting in pressure-saturation (p-s) hysteresis. We considered two different 2D Hele-Shaw cell setups: a capillary tube with a horizontal constriction (ink-bottle) and a heterogeneous porous media randomly populated by cylindrical obstacles. In both setups, drainage and imbibition were driven by quasitatically changing the pressure gradient between the inlet and the outlet of the domain. The experimental results were compared with the results from numerical model in OpenFOAM, which solves the Navier-Stokes equations employing volume of fluid method to calculate the position of the interface and the continuum surface force model to describe surface tension. For the ink-bottle setup, we observed that multiphase flow through a single constriction displayed the signature trait of p-s hysteresis, which depends innately on the cross-section gradient. The steeper the cross-section gradient, the more pronounced the p-s hysteresis, moreover, p-s hysteresis did not occur below a critical gradient. We derived an analytical solution to calculate the critical gradient and compared it with the critical gradient obtained from experiments and simulations. In heterogeneous porous media setup, we observed rapid fluid invasion and retention patterns in small pores during imbibition-drainage cycles, which give rise to hysteretic p-s trajectories. This comparative study will allow us to quantitatively link the pore-scale capillary physics to large-scale p-s hysteresis.

How to cite: Nepal, A., Dentz, M., Hidalgo, J. J., Ortin, J., and Lunati, I.: Experimental and simulation study of quasistatic capillary rise resulting in pressure-saturation (p-s) hysteresis, EGU General Assembly 2023, Vienna, Austria, 23–28 Apr 2023, EGU23-7646, https://doi.org/10.5194/egusphere-egu23-7646, 2023.

Nanoparticles (NPs), especially nanoscale zero-valent iron (nZVI) particles, have been extensively used to directly treat contaminated zones in aquifers because of their desirable properties, i.e., high specific surface area and potential mobility. Understanding the transport of nZVI particles, through water-saturated porous media has important implications for many natural and engineered systems. For the first time, we used spin-echo single point imaging (SE-SPI) of low-field Nuclear Magnetic Resonance (LF-NMR) to monitor nanoparticle transport through a heterogeneous porous medium. The ability of this method to provide information of nano- to micro-scale pore structure and to monitor transient processes is verified by a transport experiment using modified nZVI particles. Experimental observations, including (i) the more rapid migration of the front relative to bulk transport of the injected solution of NPs and (ii) the retention of NPs, with 27% of the iron retained at the conclusion of deionized water flushing, highlight the important controls of complex pore structure on the resulting retardation, attenuation and efflux of NPs. Complementary numerical simulations evaluate sample heterogeneity and its effects on local transport properties. In general, the model considering four regions of distinct porosities shows improved performance, as highlighted by the low overall residual sum of squares (0.041 to 0.138), compared to another model assuming a homogeneous pore structure (0.044 to 0.328). Overall, SE-SPI imaging is shown to be an important tool in refining transport processes of NPs in heterogeneous porous media with application to constrain complex natural systems. 


How to cite: Zhang, Q. and Dong, Y.: High-resolution characterization of nanoparticle transport in heterogeneous porous media via low-field nuclear magnetic resonance, EGU General Assembly 2023, Vienna, Austria, 23–28 Apr 2023, EGU23-7850, https://doi.org/10.5194/egusphere-egu23-7850, 2023.

EGU23-9396 | ECS | Orals | HS8.2.1

Characteristics of saltwater wedge under the chalk cliffs of Sainte-Marguerite-sur-Mer (Normandy, France) using optical and geophysical methods. 

Thomas Junique, Raphael Antoine, Stéphane Costa, Bruno Beaucamp, Vincent Guilbert, Cyril Ledun, Olivier Maquaire, Faycal Rejiba, and Cyrille Fauchard

Saltwater wedge is a natural phenomenon defined as the displacement and retention of saltwater in a freshwater aquifer. This saline intrusion can modify the content of dissolved elements in coastal freshwater aquifers, which can have consequences for water use (drinking or agricultural), on the ecology, the environment, the erosion of coasts, and the stability of coastal structures.

This study focuses on the integration and coupled interpretation of various geophysical and optical data obtained on the ground and by drone to evaluate the intrusion of seawater in a coastal chalk cliff in Sainte-Marguerite-sur-Mer in Normandy, France. The objective is to characterize the freshwater-saltwater interface and describe the internal structure of the formation. To do so, the combination of geophysical (Electrical Resistivity Imaging, ERI), aerial (visible and thermal infrared photogrammetry, IRT), and geotechnical (piezometers) methods was adopted.

The ten ERI profiles (transverse and longitudinal to the cliff) allowed for the mapping of the electrical resistivity distribution. The novel contribution of this study was the highlighting of a marine intrusion under the chalk cliffs visualized using transverse ERI profiles implanted directly on the steep dip of the cliff. The use of a 30m deep piezometer positioned on the plateau of the cliff and intersecting the ERI profiles made it possible to constrain the resistivity values to the measured salinity values. The presence of this saltwater wedge was characterized by low resistivity values. The top of the cliff and the parts close to the outcrop showed significant resistivities, indicating a high level of potential damage (cracks in the outcrop, underground cavities). This allowed for the identification of a zone (about 10m before the main scarp) vulnerable to the risk of collapse.

It has been shown that the difference in groundwater density leads to unstable conditions. We propose that the denser saline water covering the less dense freshwater creates a haline convection of the brackish waters at the base of the cliff and at the level of the rocky shore platform. The IRT was used to identify the wet areas of the cliff and the resurgences of the water table on the platform. Finally, all the data were grouped to propose a conceptual model of saline intrusion under the coastal cliffs.

How to cite: Junique, T., Antoine, R., Costa, S., Beaucamp, B., Guilbert, V., Ledun, C., Maquaire, O., Rejiba, F., and Fauchard, C.: Characteristics of saltwater wedge under the chalk cliffs of Sainte-Marguerite-sur-Mer (Normandy, France) using optical and geophysical methods., EGU General Assembly 2023, Vienna, Austria, 23–28 Apr 2023, EGU23-9396, https://doi.org/10.5194/egusphere-egu23-9396, 2023.

EGU23-9766 | ECS | Orals | HS8.2.1

Investigating sediment transport in karst using hydrograph unmixing, sediment transport modeling and multi-source hysteresis 

Leonie Bettel, James Fox, Admin Husic, Tyler Mahoney, Arlex Marin, Junfeng Zhu, Ben Tobin, and Nabil Al Aamery

Karst characterizes almost 15% of the worlds terrain, however the mechanics of sediment transport and its prediction in karst river and cave systems remains underdeveloped. Hysteresis analysis has recently been used more to investigate the behaviors of sediments during storm events in surface systems and to some extent in karst systems. Historically, clockwise and counter-clockwise hysteresis typically refer to proximal and distal sourcing for streams. For karst systems, clockwise and counter-clockwise hysteresis has been identified to refer to an saturated and unsaturated aquifer prior to the event.

However, most interpretation of hysteresis assumes a single dominant water source, for example runoff, and assumes that baseflow is not contributing to the sediment load. One aspect of sediment hysteresis and its interpretation that has received less attention is the occurrence of several, significant water sources, eroding and delivering sediment to the watershed outlet. It is common for both surface stream systems  and karst subsurface systems to have multiple water sources contributing to the total sediment load. Each of the sources carries their own sediment time distribution, and often lead to complex hysteresis looping behavior after mixing. The primary goals of this work are to (1) study how the complex source water-sediment mixing processes impact hysteresis results and (2) to carry out solutions to the water-sediment mixing processes for karst streams, caves, and springs and show the utility and uncertainty of the method.

Several high-resolution sensors have collected data at a karst spring in central Kentucky, USA, for a 2.5 year period. Water unmixing was performed using electrical conductivity as a tracer to separate the groundwater from the surface water and infer sediment sources. Theoretical analyses have shown that not only timing and magnitude of sedigraphs influence the result of the hysteresis loops, but also timing and magnitude of each of the multiple water sources have a strong effect on the resulting hysteresis loop. The groundwater flow shows to have dominant counter-clockwise hysteresis loop, surface water shows to have clockwise loops dominating. Depending on the timing and magnitude of the water sources, the hysteresis loop at the karst spring varies from strictly counterclockwise, to a figure-8 loop, to a complex pattern.

How to cite: Bettel, L., Fox, J., Husic, A., Mahoney, T., Marin, A., Zhu, J., Tobin, B., and Al Aamery, N.: Investigating sediment transport in karst using hydrograph unmixing, sediment transport modeling and multi-source hysteresis, EGU General Assembly 2023, Vienna, Austria, 23–28 Apr 2023, EGU23-9766, https://doi.org/10.5194/egusphere-egu23-9766, 2023.

EGU23-10078 | Orals | HS8.2.1

Large-scale physics of hydrodynamic transport in random fracture networks 

Marco Dentz and Jeffrey D. Hyman

We study flow and hydrodynamic transport in spatially random fracture networks.
The flow and transport behavior is characterized by first passage
times and displacement statistics, which show heavy tails
and anomalous dispersion with a strong dependence on the injection
condition. The origin of these behaviors is investigated
in terms of Lagrangian velocities sampled equidistantly along particle
trajectories, unlike classical sampling strategies at a constant rate. The
fluctuating velocity series is analyzed by its copula density, the
joint distribution of the velocity unit scores, which reveals a simple correlation
structure that can be described by a Gaussian copula. This insight
leads to the formulation of stochastic particle motion in terms of a
Klein-Kramers equation for the joint density of particle position and
velocity. The upscaled model captures the heavy-tailed first passage
time distribution and anomalous dispersion, and their dependence on the
injection conditions in terms of the velocity point statistics and
average fracture length. The first passage times and displacement
moments are dominated by extremes occurring at the first step.
The developed approach integrates the complex interaction of flow and structure
into a predictive model for large scale transport in random fracture networks.    

How to cite: Dentz, M. and Hyman, J. D.: Large-scale physics of hydrodynamic transport in random fracture networks, EGU General Assembly 2023, Vienna, Austria, 23–28 Apr 2023, EGU23-10078, https://doi.org/10.5194/egusphere-egu23-10078, 2023.

EGU23-10693 | ECS | Orals | HS8.2.1

Data acquisition and processing of multi-frequency oscillatory hydraulic tomography in a granular aquifer 

Aymen Nefzi, Daniel Paradis, René Lefebvre, and Olivier Bour

Transport of solutes in aquifers is controlled by the heterogeneous spatial distribution of hydraulic properties, but the characterization of aquifer heterogeneity is quite challenging with conventional methods. Hydraulic tomography (HT) was developed to define the heterogeneous distribution of hydraulic conductivity (K) and specific storage (Ss). HT involves the emission of a series of hydraulic head perturbations in a stressed well and the recording of this signal at several levels in the stressed and observation wells. All recorded hydraulic head responses are simultaneously analyzed through numerical inversion, which provides the spatial distribution of hydraulic properties at a scale relevant for local site investigations.

This communication reports on a tomographic experiment carried out in a heterogeneous and highly anisotropic granular aquifer at the Saint-Lambert research site near Quebec City, Canada. This site has already been the object of detailed characterizations with multiple hydraulic methods: pumping tests, packer slug tests, flowmeter profiles, vertical interference tests, and slug test tomography. A relatively new approach named oscillatory hydraulic tomography (OHT) was tested, in which multi-frequency oscillatory head perturbations are induced in an interval isolated by packers of the stressed well by a submerged rod that is electronically controlled by a winch system. Hydraulic responses are measured in the stressed intervals and in multiple intervals of an observation well.

This study was primarily aimed at testing, first on an operational level, if the OHT signal could be generated in the stressed well and propagated to the observation well in a highly anisotropic granular aquifer. Second, the study developed a rigorous workflow for the treatment of the measured hydraulic heads. Third, in terms of characterization efficacy, the study aimed to determine if multiple controlled frequencies would allow the assessment of K spatial distribution.

Results show that the field experiment provided clear measured hydraulic responses that could be used to obtain the 2D distribution of hydraulic properties from the inversion of OHT measurements. Comparison was made of inversion results using a single oscillatory frequency and multiple frequencies. Under conditions of realistic field measurement noise and uncertainty, it will be valuable in future work to compare the imaging capabilities of oscillatory hydraulic tomography against other tomographic methods. Further investigation is also needed to examine the information content of oscillatory hydraulic tomographic data for characterizing K and Ss heterogeneities through a sensitivity and resolution analysis. This study demonstrates the practical potential for the implementation of OHT experiments in relatively low permeability and highly anisotropic granular aquifers.

How to cite: Nefzi, A., Paradis, D., Lefebvre, R., and Bour, O.: Data acquisition and processing of multi-frequency oscillatory hydraulic tomography in a granular aquifer, EGU General Assembly 2023, Vienna, Austria, 23–28 Apr 2023, EGU23-10693, https://doi.org/10.5194/egusphere-egu23-10693, 2023.

EGU23-11028 | ECS | Posters on site | HS8.2.1

Impact of structural heterogeneity on solute transport and mixing in unsaturated porous media: An experimental study 

Oshri Borgman, Francesco Gomez, Tanguy Le Borgne, and Yves Méheust

Solute transport in unsaturated porous media plays a crucial role in soil nutrient dynamics, pesticide leaching, and contaminant migration to aquifers through the vadose zone. Natural porous media are characterized by a strong structural heterogeneity, which impacts solute spreading and mixing and the resulting chemical reaction rates. In addition, incomplete pore-scale solute mixing requires high-resolution experimental measurements to understand the system’s mixing dynamics. Our goals are to 1) study the impact of structural heterogeneity on the spatial distribution of fluid phases and 2) establish how fluid phase arrangement impacts solute spreading and mixing during unsaturated flow. We use two-dimensional porous media consisting of circular posts in a Hele-Shaw-type flow cell. The positioning of the posts is random, but we control the medium’s heterogeneity by varying the disorder in the posts’ diameters and their spatial distribution’s correlation length; increasing this length introduces more structure in the porous medium.

In our experiments, we first establish an unsaturated flow pattern with a connected liquid phase and then introduce a fluorescent solute pulse transported by the moving liquid phase. We track the solute concentration and gradients’ evolution by taking periodic images of the flow cell and analyzing the fluorescence intensity field. Our results suggest that, as previously shown, decreasing the saturation degree enhances and sustains mixing rates in a disordered porous media due to the emergence of several preferential flow pathways during unsaturated flow. Moreover, increasing the solid posts’ spatial correlation reduces the number of air clusters and their interface roughness, and increases their mean size. This leads to fewer preferential flow paths during unsaturated flow for the higher correlated, more structured, porous media, compared to the less structured ones. This reduction in preferential flow paths’ number suppresses mixing rate enhancement in the more structured porous media, compared with the less structured porous media, during unsaturated flow. Our experiments show the non-trivial effect of structural heterogeneity and saturation degree on solute mixing in porous media flows. The effects demonstrated by these results are likely to affect reactive solute transport processes such as dissolution and precipitation and adsorption-controlled solute migration.

How to cite: Borgman, O., Gomez, F., Le Borgne, T., and Méheust, Y.: Impact of structural heterogeneity on solute transport and mixing in unsaturated porous media: An experimental study, EGU General Assembly 2023, Vienna, Austria, 23–28 Apr 2023, EGU23-11028, https://doi.org/10.5194/egusphere-egu23-11028, 2023.

EGU23-12405 | ECS | Orals | HS8.2.1

Quantifying aquifer interaction using numerical groundwater flow model evaluated by environmental water tracers data: Application in Bandung groundwater basin, Indonesia 

Steven Reinaldo Rusli, Albrecht Weerts, Syed Mustafa, Dasapta Erwin Irawan, and Victor Bense

Anthropogenic impact on groundwater storage depletion has been detected in many places from catchment to global scales, including in our study area, the Bandung groundwater basin, Indonesia. Groundwater abstraction of various magnitudes, pumped out from numerous depths of aquifers, stimulates different changes in hydraulic heads among vertical subsurface stratifications. Such circumstances generate groundwater movement, where it flows from the upper layer storage to underlying aquifers, referred to as aquifer interaction in this study. Meanwhile, remote-sensing products such as GRACE measure the integrated water storage changes over depth and space, making it difficult to capture and derive the storage internal vertical groundwater fluxes from such signals. As an alternative, environmental water tracers (EWT) have been used to investigate subsurface water movement and to gain a conceptual understanding of groundwater flow dynamics. However, quantitative measurement of the rates of fluxes is not often possible, despite being essential to ensure sustainable groundwater resources management.

In this study, we utilize (a) groundwater flow modeling in conjunction with (b) EWT data to quantify the aquifer interaction driven by multi-layer groundwater abstraction in the Bandung groundwater basin, Indonesia. The available environmental water tracers data include major ion elements (Na+/K+, Ca2+, Mg2+, Cl-, So24-, HCO3-), stable isotope data (d2H and d18O), and groundwater age estimates (radiocarbon/14C content). These measurements are used to qualitatively evaluate the numerical groundwater flow model. The model, forced by recharge calculated using the hydrological model of wflow_sbm, is calibrated by minimizing the difference between the dynamic steady-state simulated and the observed groundwater levels.

We evaluate the groundwater flow model and the EWT-driven analysis from multiple perspectives. The results suggest that the groundwater recharge is uniformly distributed spatially, the groundwater is flowing regionally from the basin periphery inward to the basin’s center following the topographical distribution, and vertical groundwater fluxes are identified. All three deductions, in a qualitative sense, are agreed upon by both the EWT observations and the groundwater flow model. From the groundwater flow model, we quantify that the aquifer interaction is equivalent to, on average, 0.110 m/year, which is highly significant compared to the other groundwater budgets. We also determine the unconfined aquifer storage volume decrease, calculated from the change in the groundwater table, that results in an average declining rate of 51 Mm3/year. This number shows that the upper aquifer storage is dwindling at a rate that is disproportionate to its groundwater abstraction, hugely influenced by the aquifer interaction. The storage lost from only this partition contributes up to 60.3% of the total groundwater storage lost, despite contributing to only 32.3% of the groundwater abstraction. Additionally, we also investigate and examine the correlation between the groundwater level changes and the groundwater abstraction zones. The results of our study confirm that quantification of the aquifer interaction and groundwater level change dynamics driven by multi-layer groundwater abstraction in multi-layer hydrogeological settings is possible by our proposed methods. Applying such methods will assist in deriving basin-scale groundwater policies and management strategies under the changing anthropogenic and climatic factors, thereby ensuring sustainable groundwater management.

How to cite: Rusli, S. R., Weerts, A., Mustafa, S., Irawan, D. E., and Bense, V.: Quantifying aquifer interaction using numerical groundwater flow model evaluated by environmental water tracers data: Application in Bandung groundwater basin, Indonesia, EGU General Assembly 2023, Vienna, Austria, 23–28 Apr 2023, EGU23-12405, https://doi.org/10.5194/egusphere-egu23-12405, 2023.

EGU23-12447 | Orals | HS8.2.1

Estimating Fracture Network Damage After a Subsurface Detonation Using Geogenic Noble Gases. 

W. Payton Gardner and Stephen J. Bauer

Noble gas release can be used to investigate the timing, location and magnitude of fracture creation.  Here, a numerical model of gas release and transport, resulting from fracturing events, is used to estimate first-order fracture network characteristics after subsurface detonation.  Released radiogenic noble gases after detonation of three different subsurface explosions of varying source characteristics were interpreted.  A broad suite of gases was sampled from 62 discrete sampling intervals in a 3-D array surrounding the explosion location using an automated field sampling system and a capillary inlet quadrupole mass spectrometer.  Gases analyzed include: 4He, 36,40Ar, 20Ne, N2, O2, NO and CO2/N2O.  Geogenic gas arrivals were observed in a subset of sampling locations.  All geogenic gas arrivals were observed in ports with explosive-derived gas arrivals.  Helium amount and arrival time were used to estimate fracture network damage using a numerical model which allows dynamic changes in fracture aperture, matrix porosity and permeability.  The amount of fracture damage was significantly different between the three different explosions and consistent with other observations of damage.  These results illustrate how geogenic noble gases can be used to understand damage, transport, and fracture creation in fracture networks, with implications for a variety of subsurface topics including hydraulic fracking, mine failure, earthquake and volcanic monitoring.

How to cite: Gardner, W. P. and Bauer, S. J.: Estimating Fracture Network Damage After a Subsurface Detonation Using Geogenic Noble Gases., EGU General Assembly 2023, Vienna, Austria, 23–28 Apr 2023, EGU23-12447, https://doi.org/10.5194/egusphere-egu23-12447, 2023.

EGU23-13617 | Orals | HS8.2.1

Stochastic modeling of bacterial transport and retention during aquifer artificial recharge 

Juan J. Hidalgo, Benjamín Piña, Cristina Valhondo, Claudia Sanz, and Marta Casado

Managed aquifer recharge (MAR) sytems based on water filtration allow to improve recharged water quality and quantity by retaining suspended particles and microorganisms. However, the periodic detection in groundwater of pathogens and other microorganisms that represent a significant risk for human health makes it necessary to study the mechanisms affecting the propagation and fate of microbial populations during the process.

In this work a series of column experiments were performed to characterize bacteria transport in porous media. Two type of columns were built. One using only sand and another using a combination of sand, compost and wood chips. In each column a punctual injection of tracers (rhodamine and amino-G acid) and bacteria consortium collected from the effluent of a wastewater treatment plant were injected. Samples of column outflows were collected to obtain breakthrough curves of the tracers and the different amplicon sequence variants (ASVs) of bacteria to determine the material influence on the retention of bacteria. Bacteria displayed a strong anomalous behavior with late arrival peaks and longer tails than those obtained with the tracers.

A continuous time random walk (CTRW) transport model was developed to interpret the experimental results. The model characterizes transport in terms of mobile-immobile domains. Bacteria are transported with the mean flow and experience transitions from and to low mobility zones with a certain frequency. Transport is described in terms of four parameters, namely, the mean flow velocity, the dispersion coefficient, the trapping rate, and the mean residence time in the immobile zones. The model was able to reproduce satisfactorily the observed breakthrough curves of over 470 measured ASVs. The analysis of the breakthrough curved determined that bacteria form two clusters. The breakthrough curve of one cluster has heavy tails and it is formed by small, motile, gram-negative bacteria. The other cluster displays strong peaks and a relatively weaker tailing. CTRW parameters are able to predict the cluster in which a certain bacteria belongs.

How to cite: Hidalgo, J. J., Piña, B., Valhondo, C., Sanz, C., and Casado, M.: Stochastic modeling of bacterial transport and retention during aquifer artificial recharge, EGU General Assembly 2023, Vienna, Austria, 23–28 Apr 2023, EGU23-13617, https://doi.org/10.5194/egusphere-egu23-13617, 2023.

Knowledge of the saturated hydraulic conductivities of aquitards in provisional groundwater abstraction sites is essential to assess the sustainability of future water production. The subsurface of the site in the southwest of The Netherlands has a simple layer cake stratigraphy. Temperature-depth profiles in 12 boreholes were measured and analysed to infer vertical fluxes across an aquitard at a depth (~100 m) below where the impact of recent surface warming could be detected. Hence, the analytical mathematical solution for coupled groundwater-heat flow described by Bredehoeft & Papadopulos in 1965 could be be employed for this purpose. The selection of the depth interval for the aquitard for which the solution is applied, is guided by scanning through the TDP to find depth-intervals for which both a low RMSE between observed temperature and solution is obtained as well as a high Peclet number indicative of significant vertical groundwater flow. Through comparison of the depth intervals with lithological data, temperature-depth profiling is shown to have the capacity to detect aquitards, provided that the approximate depth of the aquitard is known, as well as the flux direction and magnitude across the aquitard. In combination with observed hydraulic gradients, the spatial variability of hydraulic conductivity of the aquitard could be evaluated. These values range from 10 to 100 mm/d, where earlier estimated values using more traditional methods suggested a range of  5 to 10 mm/d.

How to cite: Bense, V., Nie, L., and Oosterwijk, J.: Thermal profiling to quantify the spatial variability of ambient groundwater flow at a provisional groundwater abstraction site, EGU General Assembly 2023, Vienna, Austria, 23–28 Apr 2023, EGU23-13937, https://doi.org/10.5194/egusphere-egu23-13937, 2023.

EGU23-14697 | Orals | HS8.2.1

Quantitative three-dimensional imaging of macropore flow in undisturbed soil under different irrigation intensities 

John Koestel, Anna Schwenk, Nick Jarvis, and Mats Larsbo

Macropores have important beneficial impacts on the hydrological cycle, since they reduce risks of waterlogging, surface runoff, soil erosion and flooding. On the other hand, macropore flow is also associated with significant ecosystem disservices, since it can dramatically accelerate the leaching of contaminants to surface water and groundwater. Several approaches to model preferential macropore flow have been developed. One approach is to use the kinematic wave equation, in which the kinematic exponent should depend on the exponent in a power law relationship between wetted macropore surface area and macropore saturation. Most model applications have relied on calibration of model parameters against measured data on water flow. This makes critical testing of the underlying model concepts difficult and raises the question of whether the model is matching the data for the right reasons or not. In this study, we used X-ray tomography to quantify water and air distributions in macropores at varying steady-state flow rates in two topsoil and two subsoil columns (diameter 9 cm) sampled from a clay soil. We collected sufficient data to derive the kinematic wave exponent from the image data for the two topsoil samples. We found that the wetted macropore surface area and macropore saturation were indeed related by a power law for the first three irrigation intensities, corresponding to kinematic exponents of 1.22 and 1.26, respectively. These promising results need to be verified in future experiments that should be conducted on soil samples with smaller diameters to achieve better image resolutions and signal-to-noise ratios.

How to cite: Koestel, J., Schwenk, A., Jarvis, N., and Larsbo, M.: Quantitative three-dimensional imaging of macropore flow in undisturbed soil under different irrigation intensities, EGU General Assembly 2023, Vienna, Austria, 23–28 Apr 2023, EGU23-14697, https://doi.org/10.5194/egusphere-egu23-14697, 2023.

EGU23-15371 | ECS | Posters on site | HS8.2.1

Connecting the dots: Fracture mapping for landfill sites in fractured bedrock” 

Bilal Tariq, Helen Kristine French, Stéphane Polteau, Helgard Anschütz, and Sean Salazar

A landfill constructed in fractured bedrock can pose a potential risk of contaminant leachate to the surroundings through fractures and/or fracture networks. Therefore, adequate understanding of factures and fracture networks is a key element for constructing environmentally safe, sustainable and long-term landfills in fractured bedrocks. Mapping of geological features especially fracture networks provides essential data to establish a fundamental understanding of the local geology and hydrogeology of such landfill sites.

The objective of this study to develop  a 3D model of fractures and fracture networks, surrounding a quarry in southwestern Norway, Rekefjord. The test site, selected as a potential landfill site, consists of  moderately fractured crystalline monzonorite near the shoreline. Eight previously drilled and logged observation boreholes (NGI) on the crest surrounding the open pit were analysed. Results of subsurface fracture mapping from well logs show that orientations of natural fractures are scattered and mostly appear to be open. The Terzaghi correction shows there could be more steeply dipping fractures, these are not well captured through vertical borehole logging. Additional field work consisted of drone scanning of the interior of the whole quarry and specific locations to generate a virtual 3D model. This 3D model is used to conduct fracture measurements using the LIME software. The fracture data extracted from the 3D model will be used to assess the correlation and consistency in fracture orientation between the internal rock face and borehole measurements. The geometry of fracture networks and individual fractures can have significant impact on flow through fractured rock. 

Results will also be used to constrain a numerical groundwater flow model to improve understanding of potential pathways of contaminants from the landfill to the surroundings. The results of this research will improve assessment methodology and criteria for new landfill sites in fractured bedrock.

How to cite: Tariq, B., French, H. K., Polteau, S., Anschütz, H., and Salazar, S.: Connecting the dots: Fracture mapping for landfill sites in fractured bedrock”, EGU General Assembly 2023, Vienna, Austria, 23–28 Apr 2023, EGU23-15371, https://doi.org/10.5194/egusphere-egu23-15371, 2023.

EGU23-15397 | Orals | HS8.2.1

Forchheimer gravity currents in porous media 

Vittorio Di Federico, Alessandro Lenci, and Sepideh Majdabadi Farahani

The displacement of one fluid by another in porous media is of interest in reservoir engineering, groundwater remediation, and subsurface heat recovery. In several instances, i.e. in coarse or macro porous media, or in heavily fractured rocks, the threshold Reynolds number is exceeded and inertial effects cannot be neglected. Consequently, the Forchheimer extension of Darcy’s law describes the motion, and a novel quantity, the Forchheimer or inertial coefficient, enters the picture, entailing implications on several coupled phenomena. We study plane gravity currents propagating in a homogeneous porous medium of given permeability saturated with a lighter fluid, but results are also valid for the displacement of a heavier ambient fluid (brine) by a lighter one advancing below the roof of a porous layer such as in CO2 injection. The injected fluid volume is given by a global conservation of mass and varies as a power-law function of time. Under the lubrication approximation, the pressure gradient is hydrostatic and the one-dimensional transient problem governing the current depth, when expressed in dimensionless form, depends uniquely by a pure number equal to the combination of a Reynolds number multiplied by a Forchheimer number and divided by the square of a densimetric Froude number. We explore the two limit cases of dominating inertial effects or prevailing viscous effects and demonstrate that in both cases the governing equations are amenable to a semi-analytic similarity solution governed by the aforementioned pure number. For a current with constant volume, the solution takes a closed form. 

How to cite: Di Federico, V., Lenci, A., and Majdabadi Farahani, S.: Forchheimer gravity currents in porous media, EGU General Assembly 2023, Vienna, Austria, 23–28 Apr 2023, EGU23-15397, https://doi.org/10.5194/egusphere-egu23-15397, 2023.

EGU23-15772 | Orals | HS8.2.1

Theory of drying of polymer solutions in porous media 

Andrea Carminati, Pascal Benard, and Peter Lehmann

Plant roots and bacteria release in soils polymeric blends of substances which alter the physics of soil water flow and support life in soils. They adsorb water, decrease the surface tension of the soil solution and increase its viscosity, and, more generally, they change the soil solution into a non-Newtonian liquid with viscoelastic properties. A theory of drying of polymer solutions in porous media is missing and it is needed to understand the feedback between physics of porous media and life in soils. It was observed that during drying polymer solutions are deposited as thin surfaces spanning multiple pores and that these depositions are associated with a decrease in evaporation rate. Here, we provide a physical explanation of surface formation. The modeling framework includes Darcian flow across the polymeric network driven by a gradient in water potential. As the polymer dries and air invades the pore space the polymer network is stretched. The stretching causes a stress in the polymer network that alters the relation between water potential and polymer concentration: the more stretched is the polymer network the smaller is the spacing between the polymers at a given water potential, and the lower is the permeability of the network. The model predicts that at a critical point during evaporation there is an asymptotic increase in polymer concentration at the gas-gel interface corresponding to the deposition of solid-brittle interfaces. The onset of this glass transition depends on flow rate and pore size, with earlier deposition for fast high evaporative fluxes and small pores. The model explains why evaporation is suppressed much earlier and more significantly when the polymer solution dries into a porous medium, in comparison to the case when the polymer solution is free to dry outside a porous medium.

How to cite: Carminati, A., Benard, P., and Lehmann, P.: Theory of drying of polymer solutions in porous media, EGU General Assembly 2023, Vienna, Austria, 23–28 Apr 2023, EGU23-15772, https://doi.org/10.5194/egusphere-egu23-15772, 2023.

Fate and transport of colloids and bio colloids in structurally heterogeneous porous media are known to exhibit anomalous behaviours such as non-Gaussian breakthrough curves. Classical approaches, like Colloid Filtration Theory, relies on spatial averaged quantities, neglecting flow topology heterogeneity brought about by both local pore scale surface irregularities and broad pores size distribution: two potential triggers for super diffusive effects and broad trapping time distributions. Recent theoretical work has tried to address these deficiencies by modeling deposition and flow variations as stochastic processes (Miele et al., Phys. Rev. Fluids 2019; Bordoloi et al., Nat. Commun. 2022). However, experimental evidence to demonstrate its validity for 3D geologic structures is still lacking. We thus design a novel experimental set-up to assess colloid fate transport under realistic structural heterogeneity with controlled laboratory conditions. Heterogeneous pore structures are first obtained from X-ray tomography of field samples and are subsequently 3D-printed at high resolution. Column transport experiments with gold (Au) nanoparticles are then conducted at different flow regimes, from which effluent concentration (at the macro scale) and colloid deposition (at the pore scale) are collected. These empirical data are complemented with pore network analysis that parametrizes the co-presence of preferential channels and stagnant cavities and, further, validates the stochastic model of interest. The findings shed light on the main drivers and structural hotspot for colloid filtration in realistic porous media.

How to cite: Miele, F., Patino, J., and Morales, V.: Surface Induced Anomalous Transport of Nanoparticle in 3D Printed Structurally Heterogeneous Soils: coupling experiments and stochastic models, EGU General Assembly 2023, Vienna, Austria, 23–28 Apr 2023, EGU23-16451, https://doi.org/10.5194/egusphere-egu23-16451, 2023.

EGU23-16609 | ECS | Posters on site | HS8.2.1

Effect of spatially correlated disorder on solute dispersion and mixing in partially saturated porous media 

Ali Saeibehrouzi, Petr Denissenko, Soroush Abolfathi, and Ran Holtzman

The transport of solute particles is common in many natural and engineering processes, such as nutrition/contamination transport in subsurface systems or underground carbon dioxide sequestration.  While most of the available investigations concentrate on single-phase scenarios, more often, multiple fluids coexist, denoted frequently as unsaturated conditions. Here, and by means of direct numerical simulation, the effect of spatially correlated disorder in pore size is examined for two-phase displacement in viscous fingering regime. Following the stabilisation of fluids interface (steady-state condition), the solute solution is introduced into the invading phase with lower viscosity. Simulation results indicate that the spatial disorder impacts solute migration through the invading phase saturation and tortuosity of velocity streamlines. A bimodal variation can be seen from the histogram of probability of pore-scale Peclet number with zones being mostly dominated by either advection or diffusion. In addition, there exists a transition region with an interplay between both advective and diffusive mechanisms. The creation of trapped regions focuses the flow into preferential pathways, resulting in a higher dispersion coefficient. This, on the other side, forms a concentration gradient transverse to the direction of flow, directing solute solution through diffusivity from preferential pathways to low-velocity zones.

How to cite: Saeibehrouzi, A., Denissenko, P., Abolfathi, S., and Holtzman, R.: Effect of spatially correlated disorder on solute dispersion and mixing in partially saturated porous media, EGU General Assembly 2023, Vienna, Austria, 23–28 Apr 2023, EGU23-16609, https://doi.org/10.5194/egusphere-egu23-16609, 2023.

The Pharmaceuticals and Personal Care Products, PPCPs, a category of Emerging Contaminants are omnipresent in the environment. These PPCPs have allured significant importance globally over two decades. Because of the lack of efficient treatment systems concerning to their varying Spatio-temporal effects, they impose chronic toxicity on the environment. Therefore, understanding the fate and transport behavior of PPCPs is of prime importance for the successful accomplishment of remediation operations.  In the study, three different PPCPs viz. Metformin, Triclosan and Erythromycin were modeled using numerical techniques in the silty saturated porous media using the software- COMSOL Multiphysics. A fate and transport model considering advection, dispersion, degradation, and adsorption is conceptualized as imitating the real soil column scenario. The column was fed with continuous injection of the contaminants in consideration. Further, sensitivity analysis is carried out by varying flow and transport parameters (longitudinal dispersivity, Darcy’s velocity, adsorption coefficient (Kd), and degradation coefficient) by three orders of magnitude. The degradation and adsorption delayed the process of transport of the three ECs, thereby taking more time to travel through the column. Erythromycin having comparatively less Kd is detected in the column outlet before metformin and triclosan. The results depicted a denoting effect of adsorption, Darcy’s velocity, and degradation co-efficient, thereby highlighting the importance of adsorption, advection and degradation being important factors in the transportation of PPCPs via saturated silty soil. Moreover, the longitudinal dispersivity tends to have a negligible effect on the concentration modeled, thus proving to be a less significant parameter influencing the transport of PPCPs in the environment. The results of the simulation may serve as a foreboding tool for prior identification of the ever-increasing ECs in the environment. Furthermore, the results may prove to be useful in policymaking and risk assessment due to the PPCPs. 

How to cite: Ashraf, M., Chakma, S., and Ahammad, Z.: Apprehending the complex transport and fate behavior of Pharmaceuticals and Personal Care Products in Silty Saturated Porous media - A Numerical Study, EGU General Assembly 2023, Vienna, Austria, 23–28 Apr 2023, EGU23-16896, https://doi.org/10.5194/egusphere-egu23-16896, 2023.

EGU23-17037 | Orals | HS8.2.1

Early Time Effective Reactivity of Reactive Transport in Cylindrically-Advected Reaction Fronts is enhanced by Hydrodynamic Dispersion 

Pratyaksh Karan, Uddipta Ghosh, Yves Méheust, and Tanguy Le Borgne

Reaction fronts are widespread in nature and are encountered frequently in the geological context. Examples include contaminant spread, neutralization-based reservoir decontamination, biogeochemical phenomena, and many more. The complex porous structures of subsurface formations renders the flow geometry incredibly complex, which in turn can, and often does, lead to interesting and peculiar reactive transport. For instance, the stretching and folding of the reaction front due to flow shear can enhance the effective reactivity, and flow stagnation spots can serve as sites for accummulation of reactants.

At the Darcy scale, the spreading of the front is controlled by hydrodynamic dispersion, which is a continuum scale manifestation of the pore scale interaction between heterogeneous advection and molecular diffusion. When the flow field is uniform, the consequence of dispersion is only a quantitative enhancement of diffusion. However, if the flow field varies in space, as may occur for example during aquifer remediation by injection of a neutralizing agent, the effect of hydrodynamic dispersion will lead to qualitative modifications in reactive transport dynamics as compared to hypothetic scenarios where the only diffusive mechanism is molecular diffusion. Yet, despite the ubiquity of dispersion, its impact on reactive fronts in porous media has not been addressed for flows with an axisymmetrical geometry, which are typical of well injection scenarios.

Therefore, we study the impact of hydrodynamic dispersion on reactive transport in cylindrically-advected bimolecular reaction fronts. We show that, in the reaction-limited regime at early times, mechanical dispersion is the dominant transport process and augments the reaction front’s advancement (which scales as t1/3, t being the time), the reaction rate (which scales as t2/3) and the product mass (which scales as t5/3), in comparison to a dispersion-free scenario (for which, the reaction front advancement, the reaction rate and the product mass scale as t1/2, t1 and t2 respectively). On the other hand, depending on the strength of hydrodynamic dispersion, we may encounter a dispersion-dominated, mixing-limited, regime of the reactive front at large times, which exhibits a declining reaction rate. This bevahior is significantly different from the dispersion-free scenario where a declining reaction rate is never encountered. Lastly, at sufficiently long times (longer for stronger dispersion), the reaction front transitions to a behavior akin to that seen in the dispersion-free scenario, wherein the differences between the dispersive and the dispersion-free scenarios become negligible.

How to cite: Karan, P., Ghosh, U., Méheust, Y., and Le Borgne, T.: Early Time Effective Reactivity of Reactive Transport in Cylindrically-Advected Reaction Fronts is enhanced by Hydrodynamic Dispersion, EGU General Assembly 2023, Vienna, Austria, 23–28 Apr 2023, EGU23-17037, https://doi.org/10.5194/egusphere-egu23-17037, 2023.

EGU23-17055 | ECS | Orals | HS8.2.1

Convective dissolution of carbon dioxide in 2D water-saturated porous media: an experimental study in two-dimensional micromodels 

Niloy De, Naval Singh, Remy Fulcrand, Yves Méheust, Patrice Meunier, and François Nadal

Convective dissolution is a perennial trapping mechanism of carbon dioxide in geological formations saturated with an aqueous phase. This process, which couples dissolution of supercritical CO2, convection of the liquid containing the dissolvedCO2, and mixing of the latter within the liquid, has so far not been studied in two-dimensional porous media. In order to do so, two-dimensional (2D) porous micromodels (patterned Hele-Shaw cells) have been fabricated from UV-curable NOA63 glue. NOA63 is used instead of PDMS, which is permeable to CO2 and does not allow for a controlled no flux boundary condition at the walls. The novel fabrication protocol proposed here, based on the bonding of a patterned photo-lithographed NOA63 layer on a flat NOA63 base, shows good reproducibility regardless of the pattern’s typical size, and allows for easy filling of the cell despite the small value of the gap. A pressure chamber allows pressurizing the CO2 and outside of the flow cell up to 10 bars. Experiments were performed in 11 different porous media geometries. As expected, a gravitational fingering instability is observed upon injection of gaseous carbon dioxide in the cell, resulting in the downwards migration of dissolved CO2 plumes through the 2D porous structure. The initial wavelength of the fingers is larger in the presence of a hexagonal lattice of pillars. This effect can be correctly predicted from the theory for the gravitational instability in a Hele-Shaw cell devoid of pillars, provided that the permeability of the hexagonal porous medium is considered in the theory instead of that of the Hele-Shaw cell. Fluctuations around the theoretical prediction observed in the data are mostly attributed to a hitherto unknown weak locking of the wavelength on the distance between closest pillars.

How to cite: De, N., Singh, N., Fulcrand, R., Méheust, Y., Meunier, P., and Nadal, F.: Convective dissolution of carbon dioxide in 2D water-saturated porous media: an experimental study in two-dimensional micromodels, EGU General Assembly 2023, Vienna, Austria, 23–28 Apr 2023, EGU23-17055, https://doi.org/10.5194/egusphere-egu23-17055, 2023.

EGU23-17293 | Orals | HS8.2.1

Controlling colloid transport through porous media via local gradients of solute concentration 

Mamta Jotkar, Ilan Ben-Noah, Juan J. Hidalgo, Marco Dentz, and Luis Cueto-Felgueroso

Diffusiophoresis referring to the colloidal particle migration triggered by gradients of local salt concentration, has been established in the recent years as an efficient particle manipulation tool in relatively simple microfluidic setups such as plane channels, dead-end pores, Y-shaped channels, vertical diverging pores, etc. Owing to the fact that the particle velocities depend logarithmically on the solute concentration gradients, small variations in the concentration fields can result in significantly large diffusiophoretic particle motion. However, despite the recent investigations hardly anything is known about its effects in the field of flow and transport in porous media. Spatial heterogeneities and complex fluid-phase distributions are quite ubiquitously found across spatial scales ranging from pore-scale to field-scale. These have a strong impact on the flow and transport of dissolved solutes through porous media giving rise to rich heterogeneous solute landscapes that provide local gradients of solute concentration, a prerequisite for diffusiophoretic motion. Following this motivation, we perform pore-scale simulations to understand the effects of diffusiophoresis at pore-scale in partially saturated media for varying degrees of fluid saturation and quantify their impact on the macroscopic particle transport. We envision that by exploiting the heterogeneous solute landscapes, particle motion can be controlled in an efficient manner. Depending on the sign of the diffusiophoretic mobility, determined by the size and surface charge of the colloidal particle, localized particle entrapment or removal can be achieved systematically. Our results that are pioneer in the field of diffusiophoretic transport through porous media, will pave the way to attaining controlled particle manipulation through porous media. 

How to cite: Jotkar, M., Ben-Noah, I., Hidalgo, J. J., Dentz, M., and Cueto-Felgueroso, L.: Controlling colloid transport through porous media via local gradients of solute concentration, EGU General Assembly 2023, Vienna, Austria, 23–28 Apr 2023, EGU23-17293, https://doi.org/10.5194/egusphere-egu23-17293, 2023.

EGU23-17488 | Posters on site | HS8.2.1

Optical thermometry to characterize heat transport in permeable porous media 

Arwa Rashed, Maria Klepikova, Gauthier Rousseau, Francesco Gomez, Joris Heyman, Benoît Fond, and Yves Méheust

The study of heat transport in porous media has recently attracted a lot of attention due to the wide range of industrial and geological applications, yet the impact of the structural heterogeneity of naturally occurring aquifers on their hydraulic and thermal properties is often disregarded. In that regard, a novel application of phosphor thermometry to porous media is proposed with the aim of examining under which conditions the validity of existing thermal transfer models in complex natural saturated porous media can be questioned. This experimental technique relies on monitoring the temperature-dependent luminescence properties of solid phosphor particles seeded into the fluid as tracers, using light sources and cameras. It offers the possibility of characterizing quantitatively the interaction between flow and heat transport processes at the pore scale in transparent analog porous media, with minimal interference and from spatially-resolved measurements, hereby overcoming the technical limitations of current experimental techniques, which are constrained to point temperature measurements.

Here, as proof of concept, we present a demonstration experiment performed on a slow-moving flow in a synthetic porous medium with a heterogenous size distribution, and using YAG:Cr3+, a thermographic phosphor with a temperature sensitivity exceeding 0.3%/K [1]. The measurements are performed using a modulated light source and are recorded at a sampling rate of 1 kHz during continuous injection of an aqueous solution which is initially at a constant temperature, different from that of the resident solution. The results show the dynamics of the spatial temperature distribution in the porous medium with a precision of ±0.3°C.

[1] J. L. Bonilla and B. Fond, "Phosphor thermometry using the phase-shift method: optimization and comparison with decay time method," 2022.

How to cite: Rashed, A., Klepikova, M., Rousseau, G., Gomez, F., Heyman, J., Fond, B., and Méheust, Y.: Optical thermometry to characterize heat transport in permeable porous media, EGU General Assembly 2023, Vienna, Austria, 23–28 Apr 2023, EGU23-17488, https://doi.org/10.5194/egusphere-egu23-17488, 2023.

EGU23-17523 | ECS | Orals | HS8.2.1

Experimental characterization of Rayleigh-Taylor convection in granular media for CO2 sequestration by dissolution trapping 

Shabina Ashraf, Jayabrata Dhar, François Nadal, Patrice Meunier, and Yves Méheust

A large fraction of greenhouse gases (about 60%) released into the atmosphere are due to CO2 emissions from industrial processes and the burning of fossil fuels [1]. One of the strategies employed to reduce the emissions is rapping them securely in the subsurface [2-4]. Dissolution trapping, in particular, involves injection of CO2 into the subsurface where the supercritical CO2 (sCO2) dissolves in the aquifer brine and forms a CO2 enriched layer within solution. The interface between the high density CO2 rich brine on the top and the ambient low density aquifer water below results in destabilization of the aforementioned layer [2-4]. This leads to a gravitational instability which then causes a natural convection of CO2 rich brine to lower layers, thereby accelerating further dissolution of the sCO2 into the fresh brine.

The study of Brouzet et al. shows that traditional continuume scale, Darcy law-governed, models underestimate the timescales of the convective dissolution’s dynamics, owing to local heterogeneity in the pore-scale flow, and that it may thus be necessary to take pore-scale fluctuations into account [5]. We present here a 2D experimental study using miscible analog fluids with a contrast in densities to understand the convective transport of the dissolved sCO2. The fluids and the granular media are refractive index matched, which renders the medium transparent and helps in accurate quantification of experimental findings at various Rayleigh (Ra) and Darcy numbers (Da). Darcy scale simulations are used to complement the two-dimensional experimental measurements and it was found that Darcy scale simulations underpredict the experimental findings by several orders of magnitude, which is consistent with the findings by Brouzet et al. We investigate convective dynamics for various values of the number by changing the density of fluids, the properties of the granular medium (permeability, size of the granular medium) which determines the size of the instability with respect to pore size. When that number is much smaller than 1, obvious causes for the failure of the continuum scale description can be excluded, yet discrepancies remain between the experimental results and the simulations.

References:

[1] Contribution of Working Group III to the Fifth Assessment Report of the Intergovernmental Panel on Climate Change, IPCC 2014.

[2] Emami-Meybodi, H., Hassanzadeh, H., Green, C. P., & Ennis-King, J. (2015). Convective dissolution of CO2 in saline aquifers: Progress in modeling and experiments. International Journal of Greenhouse Gas Control, 40, 238-266.

[3] Pau, G. S., Bell, J. B., Pruess, K., Almgren, A. S., Lijewski, M. J., & Zhang, K. (2010). High-resolution simulation and characterization of density-driven flow in CO2 storage in saline aquifers. Advances in Water Resources, 33(4), 443-455.

[4] Meunier, P., & Nadal, F. (2018). From a steady plume to periodic puffs during confined carbon dioxide dissolution. Journal of Fluid Mechanics, 855, 1-27.

[5] Brouzet, C., Méheust, Y., & Meunier, P. (2022). CO2 convective dissolution in a three-dimensional granular porous medium: An experimental study. Physical Review Fluids, 7(3), 033802.

How to cite: Ashraf, S., Dhar, J., Nadal, F., Meunier, P., and Méheust, Y.: Experimental characterization of Rayleigh-Taylor convection in granular media for CO2 sequestration by dissolution trapping, EGU General Assembly 2023, Vienna, Austria, 23–28 Apr 2023, EGU23-17523, https://doi.org/10.5194/egusphere-egu23-17523, 2023.

EGU23-1280 | ECS | Posters on site | HS8.2.3

A multidisciplinary study to evaluate the sustainability of a volcanic hydrosystem: Chaîne des Puys’s watersheds use by Clermont Auvergne Métropole for drinking water supply 

Cyril Aumar, Pierre Nevers, Hélène Celle, Gilles Mailhot, Frédéric Huneau, Virginie Vergnaud, Barbara Yvard, and Marie-Laure Clauzet

Clermont Auvergne Métropole is an agglomeration of 300,000 inhabitants. Two types of aquifers are exploited for the drinking water supply of this population: the alluvial aquifer of Allier River (70%) and three volcanic water basins located in the Chaîne des Puys (30%). Recent studies have shown that the quantity of water in the Allier alluvial aquifer decreases drastically during drought periods and that this decrease will amplified in the future due to climate changes (2022 for example). Water managers of Clermont Auvergne Metropole are thus interested in identifying the potential of their volcanic resources to secure the water supply of the population. In this purpose, a multidisciplinary study, using existing data and providing new ones has been projected. This study includes: 1) the use of the geological model previously established by Aumar (2022) at the Chaîne des Puys scale, that allows to constrain the geometry of aquifers; 2) the acquisition of hydrochemical data that help to better define the functioning of the volcanic watersheds; 3) the measurement of hydrodynamic and meteorological data to better define the terms of the hydrological balance. Natural tracers such as stable water isotopes (18O and 2H) or major and trace elements give information on the origin of those groundwaters (local or remote) and in particular their infiltration zone (average altitudes), their flow paths or the impact of various external processes (environmental or anthropic). Groundwater dating methods (CFC, Tritium) brings a constraint on the residence time of water within the aquifer. Yet, groundwater ages are still unknown in all watersheds of the Chaîne des Puys, but it remains essential to understand groundwater flow and storage. The coupling between hydrodynamic monitoring, a large panel of hydrochemical tracers and groundwater residence time data associated with a well constrained geological model allows to provide relevant management tools to stakeholders both in terms of quantification and protection of their resources.  

How to cite: Aumar, C., Nevers, P., Celle, H., Mailhot, G., Huneau, F., Vergnaud, V., Yvard, B., and Clauzet, M.-L.: A multidisciplinary study to evaluate the sustainability of a volcanic hydrosystem: Chaîne des Puys’s watersheds use by Clermont Auvergne Métropole for drinking water supply, EGU General Assembly 2023, Vienna, Austria, 23–28 Apr 2023, EGU23-1280, https://doi.org/10.5194/egusphere-egu23-1280, 2023.

EGU23-1517 | ECS | Orals | HS8.2.3 | Highlight

Hydrological consequences of controlled drainage with subirrigation 

J.A. (Janine) de Wit, M.H.J. (Marjolein) van Huijgevoort, J.C. (Jos) van Dam, G.A.P.H. (Gé) van den Eertwegh, D. (Dion) van Deijl, and R.P. (Ruud) Bartholomeus

Sufficient freshwater is needed for several water dependent sectors. However, e.g. climate change, weather extremes, economic growth, urbanization and increased food production make it more complex to guarantee sufficient freshwater for all sectors, even in temperate climates like the Netherlands. The range of weather extremes from extremely dry to extremely wet is expected to increase and to occur more frequently. However, the current Dutch water management system is not designed to anticipate both weather extremes.

Controlled drainage with subirrigation could be a viable measure to i) discharge water only when needed, ii) retain water and iii) recharge water using an external source. This system thus has the potential to 1) improve growing conditions for crops at field scale, 2) reduce peak discharges at regional scale, and 3) increase groundwater recharge on regional scale. Consequently, this system could anticipate both dry and wet extremes. However, the implementation of controlled drainage with subirrigation could significantly alter different water balance components.

We show data and model output of five experimental sites where controlled drainage with subirrigation is applied. Field data were collected over the years 2017-2022, like external water supply, groundwater table and soil moisture content. Other water balance components, crop yield and configuration of the management of the system were modelled with SWAP (Soil-Water-Atmosphere-Plant model), using observations for calibration purposes.

Results show that by subirrigation, water can be applied to the soil and will lead to increased water storage and higher groundwater tables. Groundwater tables were up to 0.7 m higher during the growing season, leading to both increased crop yields and larger groundwater recharge. Drought vulnerability decreased at the test sites. However, the water supply for subirrigation can be high (500 mm per year, on average). Additionally, effects of subirrigation on the water balance components are strongly site-dependent. For example, a resistant layer below the drainage/infiltration pipes is needed to ensure enough resistance to limit downward seepage and to raise the phreatic groundwater level. Furthermore, ditch levels surrounding agricultural fields need to be adjusted to the raised groundwater levels, as too deep ditch water levels result in (unfavorable) drainage and loss of water. Field experiments also show that proper management is important to prevent clogging of the drainage systems.

Construction, topographical location, external water source and proper management are important for subirrigation to be successful. Responsible implementation of subirrigation in terms of the water balance at the regional scale is needed; freshwater availability to apply subirrigation is an issue. When these boundary conditions are met, controlled drainage with subirrigation could raise the groundwater level and improve the soil moisture availability for crops, while still having the option to discharge water when needed.

How to cite: de Wit, J. A. (., van Huijgevoort, M. H. J. (., van Dam, J. C. (., van den Eertwegh, G. A. P. H. (., van Deijl, D. (., and Bartholomeus, R. P. (.: Hydrological consequences of controlled drainage with subirrigation, EGU General Assembly 2023, Vienna, Austria, 23–28 Apr 2023, EGU23-1517, https://doi.org/10.5194/egusphere-egu23-1517, 2023.

EGU23-2088 | ECS | Orals | HS8.2.3

Chemical and isotopic composition of precipitation in the Piedmont Po Plain (NW Italy): preliminary evaluation of impacts on the groundwater quality 

Daniele Cocca, Manuela Lasagna, Chiara Marchina, Luis Miguel Santillan Quiroga, and Domenico Antonio De Luca

The precipitation constitutes one of the main sources of the groundwater resources. The chemical composition of precipitation is influenced both by natural and anthropic sources. For this reason, it is essential to monitor rainfall potentially able to influence groundwater quality. The Po Plain sector (NW Italy) is one of the most urbanized, industrialized and air polluted area in Europe but few studies have been conducted in this area, particularly in the Piedmont Region.

The main purpose of this study was: I) to provide a preliminary assessment of quality and isotopic composition of rainwater in the western Po Plain, II) to show the spatial and temporal differences of rain chemical composition between the monitoring points, and III) to define the influence of rain to groundwater chemistry.

A long-term trends on the groundwater concentration of NO3 and SO42– in the shallow aquifer on 227 monitoring points of the Regional Monitoring network database were conducted (2000-2020 period).

In the last decades, in Europe a large effort was carried out to reduce sulphur and nitrogen emission in the atmosphere. This resulted in a sharp decrease in the deposition of SO42– and nitrogen compounds.

The rain analysis of long-term trends in near regions, revealed a large proportion of significant decreasing trends in the concentration of both sulphate and nitrogen compounds.

Actually also the analysis of groundwater long-term trends revealed a significant decreasing trends in the concentration of NO3 and SO42– in the shallow aquifer.

A sampling campaigns was carried out during one year (September 2021 – September 2022) in 4 monitoring points located in the western Po Plain. Rainfall collection occurred every 2 months, for a total of 20 samples. Physical-chemical analyzes of the main ions and isotopic analyzes (δ18O, δ2H) were conducted for all samples.

The period  September 2021 – September 2022 was characterized by a rainfall deficit in the winter period in the NW Italy, recording a 62% reduction in rainfall (compared to the climatic average of the thirty year period 1981-2010).

The processing of rainfall chemical data has shown different concentrations between the monitoring points and a temporal variability. High NO3 and SO42– concentrations were observed.

Rainfalls sampled after the winter dry period (March-April samples) show higher ions concentrations (NO3 13 mg/L, SO42– 4 mg/L) respect to other periods. Differences in rainfall samples depend on the location of the monitoring point (urban or rural areas).

Isotopic data has shown different spatial and temporal isotopic signals, linked to the location and elevation of the monitoring points. In the δ18O/δ2H diagram all isotopic signals are not placed on the Local Meteoric World Line, potentially linked to climate change.

The isotopic signals are within the ranges of previous studies (δ18O: -12,6/-6,2; δ2H: -82,15/-35,1 ‰ (min/max)).

In conclusion, the rain ions concentrations are influenced by anthropic pollution, they are affected by dry periods and they appears to influence the concentration in groundwater.

How to cite: Cocca, D., Lasagna, M., Marchina, C., Santillan Quiroga, L. M., and De Luca, D. A.: Chemical and isotopic composition of precipitation in the Piedmont Po Plain (NW Italy): preliminary evaluation of impacts on the groundwater quality, EGU General Assembly 2023, Vienna, Austria, 23–28 Apr 2023, EGU23-2088, https://doi.org/10.5194/egusphere-egu23-2088, 2023.

EGU23-3840 | ECS | Posters on site | HS8.2.3

Numerical investigation of the groundwater age and heat transport processes in asymmetric hydrogeological situations 

Márk Szijártó, Zsuzsanna Vatai, and Attila Galsa

Numerical simulations focusing on groundwater age have not yet been carried out in the Buda Thermal Karst system (BTK) (Hungary), although isotopic and chemical data from thermal springs [e.g. Fórizs et al., 2019] are available to compare calculated and measured results. The main objective of this study was to improve understanding of regional-scale heat transport processes and groundwater flow associated with ageing in complex hydrogeological system, such as the BTK including deep carbonate sequences and adjoining sedimentary basins (“DC&SB”).

A comprehensive sensitivity analysis was completed to validate the numerical method [Zimmermann, 2006] implemented with ‘age mass’ concept [Good, 1996], and to reveal the influence of crucial hydrogeological parameters on the groundwater age distribution in 2D and 3D synthetic models. It was established that the average (τav) and the maximum (τmax) groundwater mean age correlate with the permeability anisotropy, heterogeneity (exponential permeability decrease with depth), the model depth, while the values anti-correlate with the amplitude of water table and the permeability.

For general investigation of the “DC&SB” type groundwater flow systems, two “half-basins” [Wang et al., 2017] were combined into a single asymmetric basin. The “DC&SB” model was characterised by (i) a water table configuration with higher amplitude and a homogeneous (unconfined) aquifer on the left-hand side; (ii) a lower water table amplitude and a three-layered (unconfined aquifer – aquitard – confined aquifer) domain on the right-hand side. As a result of the forced convection, decreased temperatures and reduced groundwater mean ages are noted in unconfined parts of the model, while heat accumulation and increased ages were calculated in the aquitard and the confined aquifer. Using experiences from synthetic tests, the groundwater age calculation was integrated into the preliminary 3D hydrogeological model of the BTK system. The results showed that the measured and the calculated mean groundwater age values sampled the different parts of the hierarchically nested flow system are of the same order of magnitude.

The results are very important to uncover the groundwater flow in complex hydrogeological systems which is unavoidable both in regional-scale (e.g. drinking water management, geothermal exploration and geothermal energy utilisation) and local-scale explorations (e.g. managed aquifer recharge, environmental remediation). The research was supported by the National Research, Development and Innovation Office in the framework of project No. PD 142660; and by the National Multidisciplinary Laboratory for Climate Change, RRF-2.3.1-21-2022-00014 project.

References

Fórizs, I., Szabó, V.R., Deák, J., Halas, S., Pelc, A., Trembaczowski, A., Lorberer, Á. (2019). The Origin of Dissolved Sulphate in the Thermal Waters of Budapest Inferred from Stable S and O Isotopes. Geosciences 9(10), 433, p. 13.

Good, D.J. (1996). Direct simulation of groundwater age. Water Resources Research 32, pp. 289-296.

Wang, J.Z., Jiang, X,W., Zhang, Z.Y., Wan, L., Wang, X.S., Li., H. (2017). An analytical study on three-dimensional versus two-dimensional water table-induced flow patterns in a Tóthian basin. Hydrological Processes 31, pp. 4006-4018.

Zimmermann, W.B.J. (2006). Multiphysics modeling with finite element methods. Singapore: World Scientific Publishing Company, p. 422.

How to cite: Szijártó, M., Vatai, Z., and Galsa, A.: Numerical investigation of the groundwater age and heat transport processes in asymmetric hydrogeological situations, EGU General Assembly 2023, Vienna, Austria, 23–28 Apr 2023, EGU23-3840, https://doi.org/10.5194/egusphere-egu23-3840, 2023.

To evaluate the effects of drought on groundwater system in rural areas, the standardized groundwater level index (SGI) was applied to groundwater monitoring wells over S. Korea. Moreover, accumulation period (AP), representing the month with the highest correlation coefficient between SGI and the standardized precipitation index (SPI), was calculated for monitoring wells. In this case, correlation analysis was performed to investigate differences in the response of precipitation and groundwater level to drought using SPI. Groundwater level data from 68 monitoring wells were used for the analysis. The response time of groundwater level to precipitation appeared to be very short, but the groundwater level did not go with SPI during the long-term drought. Results of correlation analysis between reservoir level and SPI show high correlation on the relatively long AP. The results of analysis between SGI and SPI appeared that the AP values ranged from 1 to 3 months for most of the wells indicating that the total amount of groundwater will not decrease significantly in long-term drought periods unlikely it of reservoirs with the high AP values. The nationwide maximum AP values between SGI and SPI were around 4 in the central part of S. Korea, while the minimum AP values were around 2 in the eastern and western part of S. Korea. Consequently, it could be concluded that the wells with low AP value tend to respond to short-term drought, but it has little effect on groundwater system when the long drought occurs. 

Acknowledgement: This research was supported by the Institute of Planning and Evaluation for Technology in Food, Agriculture, and Forestry (IPET) [Grant number 320046053HD020].

How to cite: Song, S.-H., Lee, B., and Lee, J.: Assessment of agricultural drought effects on groundwater system using the standardized groundwater level index (SGI) in S. Korea, EGU General Assembly 2023, Vienna, Austria, 23–28 Apr 2023, EGU23-4742, https://doi.org/10.5194/egusphere-egu23-4742, 2023.

EGU23-6268 | ECS | Orals | HS8.2.3

Groundwater vulnerability assessment in areas with diverse Quaternary deposits 

Magdaleena Männik, Enn Karro, Andres Marandi, and Alar Rosentau

Groundwater is the most crucial drinking water resource in many areas of the world. In spite of its overall abundance, the resource remains vulnerable to pollution, as groundwater quality may be severely affected by urbanization and growth in industrial activities and agriculture. The most sustainable approach to managing groundwater quality is to ensure its protection, thus avoiding contamination. Therefore, accurate groundwater vulnerability assessment methods are necessary tools for groundwater management and protection.

The DRASTIC method is one of the most widely used groundwater vulnerability assessment methods. However, in areas where the main useful aquifers are covered with an extra layer of diverse Quaternary sediments, the original DRASTIC method overestimates the vulnerability of groundwater in overflow areas and in regions where groundwater is occasionally confined. Therefore, the DRASTIC method needs to be modified to increase the accuracy of vulnerability maps in areas with a highly variable Quaternary layer, which remarkably influences the nature of the infiltration conditions.

For this, in this study, the depth to water, soil properties, and impact of the vadose zone parameters of the DRASTIC methodology were modified to be suitable in areas with glacial sediments. Originally, the depth to water parameter (D) allows assessing the distance from the ground surface to the aquifer: the deeper the water table, the lower the contamination risk. In the modified DRASTIC method, the water table is as an alternative compared to the bedrock surface beneath the Quaternary sediments layer. When the piezometric head is above the bedrock surface, the aquifer acts as confined, and the movement of the pollutant to the aquifer is hindered. Therefore, the groundwater vulnerability considering the D-parameter is lower in areas where the piezometric head is above the bedrock surface and higher in areas where it is below the bedrock surface.

Both the original and the modified DRASTIC methodology were applied in an area with glacial sediments located in Central Estonia. The modified DRASTIC method showed significantly better results than the original DRASTIC method. Furthermore, comparing the maps generated using the modified DRASTIC with a former local groundwater vulnerability assessment method showed considerably more similarities than this by the original DRASTIC method. Thus, the modified DRASTIC method is successfully applicable in areas with an extra layer of diverse Quaternary sediments.

The study has been funded by Iceland, Liechtenstein and Norway through the EEA and Norway Grants Fund for Regional Cooperation project No.2018-1-0137 “EU-WATERRES: EU-integrated management system of cross-border groundwater resources and anthropogenic hazards

How to cite: Männik, M., Karro, E., Marandi, A., and Rosentau, A.: Groundwater vulnerability assessment in areas with diverse Quaternary deposits, EGU General Assembly 2023, Vienna, Austria, 23–28 Apr 2023, EGU23-6268, https://doi.org/10.5194/egusphere-egu23-6268, 2023.

EGU23-6876 | ECS | Orals | HS8.2.3

Present and future flow simulation in a tailings pile at a former mine in France 

Pierre L'hermite, Valérie Plagnes, Anne Jost, Benoît Reile, Isabelle Blanc-Potard, Damien Regnier, and Michael Descostes

Water flow is an essential component of the long-term environmental management of former mine sites. Flow through tailings storage facilities (TSF) often generates chemical reactions and releases acidic water. In the case of static leaching, this acidification can last for multiple decades depending on the acid remaining in the tailings. This mining water is then collected and treated in treatment plants before it is released in the environment in compliance with environmental standards. The understanding of the current hydrogeological functioning of the TSF is essential to properly adapt water management today. Given the potential impact of climate change, simulation of future hydrogeological behaviour is also required to ensure sustainable water management over this century.

We developed a daily time step model with HYDRUS 2D to represent the unsaturated hydrogeological functioning of a tailings pile of the former mine of Le Cellier (France). A granulometric analysis over the pile height provided reliable hydraulic properties and showed that the pile heterogeneity can be distributed into three layers. The historical monthly monitoring and the new daily hydrogeological monitoring implemented in 2021 measured the rainfall and discharges from the various drains that collect the water from the pile. As cross-correlations confirmed the fast reaction of drains discharges to rainfall (1 day), we simulated the water flow with the dual porosity package of HYDRUS. We also implemented the vegetation transpiration due to the presence of bushes and coniferous trees over the pile.

The model performance was evaluated by comparing the observed (monthly and daily) discharges and the simulated one. The calibrated model reproduces correctly the annual discharges for the period 2014-2022 as well as the pile fast reaction to rainfall. To evaluate the climate change impacts on the hydrogeological functioning of the pile, we used as input of our calibrated model the daily precipitations and temperatures of the Coupled Model Intercomparison Project (CMIP5) for three climatic scenarios (RCP2.6, RCP4.5 and RCP8.5). The calculation of the Mann-Kendall trend test on the predicted water balance components leads to the conclusion that the effective rainfall should remain stable over the next 100 years. At the end of the century, the frequency of extreme events could increase by 50% and their intensity could rise by 9%. With the calibrated model, we simulated the discharges at the pile outlet and studied their annual changes as well as the pile response to extreme events under climate change. These simulations are essential to ensure an accurate water management for this century.

How to cite: L'hermite, P., Plagnes, V., Jost, A., Reile, B., Blanc-Potard, I., Regnier, D., and Descostes, M.: Present and future flow simulation in a tailings pile at a former mine in France, EGU General Assembly 2023, Vienna, Austria, 23–28 Apr 2023, EGU23-6876, https://doi.org/10.5194/egusphere-egu23-6876, 2023.

EGU23-6980 | ECS | Orals | HS8.2.3

How Climate Change influence groundwater temperature? A case study in the Piedmont Po Plain (NW Italy) 

Elena Egidio, Susanna Mancini, Domenico Antonio De Luca, and Manuela Lasagna

This study represents the first regional-scale investigation in the Piedmont Po plain about the relationship between groundwater temperature in the shallow aquifer (GWT) and climate variability.
The aim of this investigation is to study and compare time trends in air temperature (AT) and GWT over a 10-year time period (between 2010 and 2019), and to evaluate possible relationships between the two parameters. For doing so we had used daily measures taken from 41 monitoring wells located in the shallow aquifer and 20 weather stations throughout the Piedmont Po plain area.

Both AT and GWT showed an increase over the observed period with a more pronounced growth of the AT. With regard to AT all the weather stations had shown an increasing trend with a variation in the annual mean 1.7 and 2.2 C/10 years; moreover, GWT annual mean generally shows a variation between −0.3 and 2.1 C/10 years. This result allows to state that GWT is more resilient to climate change than AT. However, some monitoring wells in the study area showed a behaviour that partially deviated from the standard trend observed for the majority of the region: these wells were influenced by particular anthropic factors (for example the paddy fields) or natural elements (as the monitoring wells located downstream of melting glaciers, or the wells located close to Rivers). Further investigations will be conducted in future in Piedmont plain areas with different behaviour, in order to better understand their dynamics and the factors that may influence GWT and how they are affected by climate change.

Moreover, this study wanted to stress the importance of the knowledge of the localization in wells of the instruments for the GWT measurement, to have the most accurate and comparable data. As already state in literature the GWT fluctuation in the bottom part of the aquifer was milder than the fluctuation observed in the most superficial part. Therefore, it has been possible to observe that in the study area when the depth of the instrument increased, the maximum and minimum peaks of the GWT shifted in time respect to the maximum and minimum peaks of the AT.

Lastly, we are conducting a groundwater and heat flow simulation of the shallow aquifer of the Turin Plain area using a numerical model with Smoker Heatflow code. The calibration performed with the available hydrogeological setting information of the area and the GWT and AT data will allow us to model the future spatial distribution of GWT in the study area, according to the IPCC forecast scenarios.

How to cite: Egidio, E., Mancini, S., De Luca, D. A., and Lasagna, M.: How Climate Change influence groundwater temperature? A case study in the Piedmont Po Plain (NW Italy), EGU General Assembly 2023, Vienna, Austria, 23–28 Apr 2023, EGU23-6980, https://doi.org/10.5194/egusphere-egu23-6980, 2023.

EGU23-7742 | ECS | Orals | HS8.2.3

Sustainable Management of Coastal Aquifers subject to Seawater Intrusion using Reduced-Order Groundwater Flow Models 

Mohammadali Geranmehr, Domenico Baù, Alex S. Mayer, Lauren Mancewicz, and Weijiang Yu

The simulation of seawater intrusion (SWI) in coastal aquifers under complex hydrogeological conditions typically requires using "variable-density" models, which simulate the groundwater flow and the transport of salt dissolved in water. When combined with optimization algorithms, variable-density models constitute powerful tools to support the management of groundwater resources in coastal systems vulnerable to SWI, sea-level rise and unstainable groundwater abstraction. However, the application of simulation-optimization (SO) to SWI problems has so far been limited by the prohibitive computational effort required by full-scale variable-density models that simulate the aquifer response to proposed groundwater abstraction strategies. A viable solution is thus to develop “surrogate” models that emulate full-scale model responses at a fraction of their computational cost. In this study, a surrogate model of SEAWAT, a popular variable-density groundwater flow model, will be presented. This surrogate is based on the proper orthogonal decomposition (POD) method, which is a projection-based approach where the coefficient matrices and the right-hand side vectors derived through finite-difference discretization of the coupled flow and transport equations, are mapped onto a space of size significantly smaller than the model grid. Preliminary results show that the POD-based surrogate model is remarkably faster than the full-scale model, and provides results of comparable, and thus acceptable, accuracy. These features make the surrogate ideally suited for substituting the full-scale variable-density model within the SO framework adopted to support the management of coastal aquifers.

How to cite: Geranmehr, M., Baù, D., Mayer, A. S., Mancewicz, L., and Yu, W.: Sustainable Management of Coastal Aquifers subject to Seawater Intrusion using Reduced-Order Groundwater Flow Models, EGU General Assembly 2023, Vienna, Austria, 23–28 Apr 2023, EGU23-7742, https://doi.org/10.5194/egusphere-egu23-7742, 2023.

Karst aquifers are characterized by different types of groundwater flow, related to different types of permeability due to the simultaneous presence of matrix, fractures and conduits. The presence of a well-developed karst conduit system leads to a fast circulation of groundwater, within the aquifer and an impulsive response of the spring flow to the rainfall inputs, with a potential fast transport of contaminants from the hydrogeological basin surface to the output.

In this study, the internal structure of the karst system is not investigated and considered as a black-box model, which modifies the input signal (rainfall) into an output signal (spring discharge). With the help of hydro chemical analyses on spring water samples and single discharge measurements, it is possible to set specific mass balance models correlating ion content to spring flowrates. In particular, Mg2+ revealed a reliable application for spring baseflow separation in karst settings. Once the local model has been set, its conservative behaviour, in mostly limestone dominant aquifers, allows using it as a natural tracer of groundwater flow, distinguishing conduit flow and diffuse flow occurrence in the spring outlet, without additional discharge measurements. In karst settings, the difficulty in setting a fixed cross-section for continuously monitoring of spring discharge values makes this application interesting for exploitation management.

This study shows the results obtained for two springs located in Central Italy, confirming that monitoring groundwater quality in karst environments is often the key to successfully characterize springs and assess the total yield when direct measurements are not frequent.

How to cite: De Filippi, F. M. and Sappa, G.: Magnesium content and groundwater flow in limestone aquifers: a relationship with potential developments for exploitation management of karst springs., EGU General Assembly 2023, Vienna, Austria, 23–28 Apr 2023, EGU23-8022, https://doi.org/10.5194/egusphere-egu23-8022, 2023.

EGU23-10167 | ECS | Posters on site | HS8.2.3

Topographic controls on seepage distribution in 3D mountain systems 

Etienne Marti, Sarah Leray, and Clément Roques

Seepage areas, i.e., areas where the water table intersects the land surface, are strong indicators of groundwater-surface water interaction and have a critical role on ecosystems and on water quality. Numerous studies have been carried out aiming at characterizing seepage areas and the factors controlling their occurrence. Still, most of literature focused on theoretical or synthetic systems. Then seepage areas in complex environments, such as mountain systems, are to be further studied. In this context, we propose to test the pertinence of well-known and widely used frameworks, either analytical or numerical, against 3D complex systems aiming at proposing corrections to better represent the complexity inherent to mountain systems.

The methodology follows the development of 3D homogeneous and uniformly recharge numerical models at steady state using MODFLOW. The system complexity specifically lies in its 90m-resolution topography based on a real mountain catchment, the Quebrada de Tarapacá (North Chile). Regional scale catchment area (~900km2) allows incorporating various sub-catchments, hence studying a panel of geomorphological settings differing in slope variation and characteristic length. We perform a sensitivity study of the seepage area to recharge rate which is varied over 6 orders of magnitude as a proxy for variable climatic conditions. Results are analyzed in relation to the ratio between hydraulic conductivity and recharge (K/R).

Consistently with previous studies, the K/R ratio highly influences seepage distribution showing the contraction of the river network and groundwater flow redistribution. At high recharge rates (low K/R), seepage area tends to 100% of the catchment area, a fully saturated catchment. On the other hand, at low recharge rates (high K/R), seepage tends to be null, without totally disconnecting the water table from the surface. At intermediate recharge rates (10-1 < K/R < 10), the seepage area linearly decreases while K/R increases. Numerical results differ from estimation of theoretical solutions or 1D numerical models as those tend to overestimate seepage area except when fully saturated. Even though K/R exerts the principal control on seepage distribution, the geomorphological characteristics illustrated by the characteristic length influences seepage organization. Defining the characteristic length can be challenging in mountain context due to the high variability of geomorphologic features. Various definitions of the characteristic length were then tested: (i) from drainage density; (ii) from the relation between slope and drainage area and (iii) from the equivalent hillslope method. The first two methods tend to underestimate the characteristic length, and hence, catchments appear to be only recharge-controlled following Haitjema and Mitchell-Bruker criterion (2005), counter-intuitively even at high recharge rates. Contrarily, the equivalent hillslope method shows promising results, as the balance between topographic and recharge control catchment is respected, following the same criteria.

Therefore, we show a significant overestimation of seepage area from theoretical models in comparison to 3D fully distributed models due to their inability to incorporate details of the topography such as very high hilltops. Consequently, 3D model development in mountain system is crucial as other analytical or 1D numerical models cannot illustrate the geomorphological details influencing seepage areas distribution.

How to cite: Marti, E., Leray, S., and Roques, C.: Topographic controls on seepage distribution in 3D mountain systems, EGU General Assembly 2023, Vienna, Austria, 23–28 Apr 2023, EGU23-10167, https://doi.org/10.5194/egusphere-egu23-10167, 2023.

EGU23-10202 | ECS | Posters on site | HS8.2.3

Geophysical techniques for monitoring the climate change effects on groundwater availability and quality 

Marco Sabattini, Francesco Ronchetti, Diego Arosio, Gianpiero Brozzo, and Andrea Panzani

The objective of the research is applying geophysical techniques (including seismic noise interferometry) to investigate the effects of climate change on groundwater resource availability and quality.

The research area is the lower Val Magra alluvial plain, in the Ligurian region (Italy), between the Municipality of S. Stefano Magra and the Tirrenian seacoast. It is an intensely urbanised area, with widespread industries that are potential sources of contaminants.

The main aquifer of the Val Magra is qualitatively and quantitatively vulnerable to the effects of climate change. It is an unconfined aquifer in coarse alluvial deposits, characterized by high permeability. The water table is generally very close to ground level (3-7 m in depth). The aquifer is closely connected to the Magra river and continuously exchanges between the surface water and groundwater exist. Furthermore, near the seacoast, the aquifer is influenced by interaction with seawater. In this area, periods of drought favor marine intrusion phenomenon, which occurs through the rising upstream of salt-water along the Magra river. Seawater intrusion is the main responsible of the deterioration of the groundwater quality in this lower part of the Val Magra.

An integrated approach of hydrogeological survey methods and geophysical techniques will be used to achieve the objective of the research. This allows a redundancy of data from a multidisciplinary approach and new monitoring surveys with less invasive and more efficient methods.

The traditional hydrogeological used methods are: continuous piezometric level measurements of groundwater (wells), electrical conductivity measurements of groundwater (wells) and surface water (river Magra) and isotopic analyses (Oxygen and Deuterium).

The geophysical techniques used are: 2-D geoelectrical surveys (SEV), active and passive geoseismic surveys (1-D and 2-D) and seismic noise interferometry (SNI).

Groundwater storage is estimated by monitoring the piezometric surface changes over time. The groundwater surface is interpolated from direct groundwater head measurements (wells and river) and indirect measurements from geoseismic and geoelectric surveys and the SNI technique. Isotopic measurements of water samples are used as tracers to evaluate the groundwater-surface water exchanges. The data confirm that the main source of recharge of the aquifer is the River Magra.

In the area, groundwater quality, that could be compromise mainly by marine intrusion phenomenon, is evaluated by the monitoring of the physics and chemical parameters. Geoelectrical surveys and water electrical conductivity measurements allow to investigate underground the presence of the salt water and to define the extent of the marine intrusion phenomenon. Preliminary water electrical conductivity result highlights that, during the strong drought period in the last summer, the marine intrusion reached the Romito groundwater well field by rising upstream for 7 km along the Magra river from the coastline. 

How to cite: Sabattini, M., Ronchetti, F., Arosio, D., Brozzo, G., and Panzani, A.: Geophysical techniques for monitoring the climate change effects on groundwater availability and quality, EGU General Assembly 2023, Vienna, Austria, 23–28 Apr 2023, EGU23-10202, https://doi.org/10.5194/egusphere-egu23-10202, 2023.

EGU23-10611 | ECS | Posters on site | HS8.2.3

Using GAN for Imputation of Missing Recorded Data to Improve Groundwater Level Prediction Based on Deep Learning Methods 

Hsin Yu Chen, Wei-Cheng Lo, and Chih-Tsung Huang

  The development of civilization and the preservation of environmental ecosystems are strongly dependent on water resources. Typically, the insufficient supply of surface water resources for domestic, industrial, and agriculture needs is often supplemented by the ground water resources. However, the groundwater is a natural resource that must be accumulated over many years and cannot be recovered after a short period of recharge. Therefore, the long-term management of groundwater resources is an important issue for the sustainable development. The accurate prediction of groundwater levels is the first step to evaluate the total water resources and its allocation.

  However, in the process of data collection, data may be missing due to various factors. Thus, retracting the missing data is a main problem which any research field must deal with. It has been well known that to maintain the data integrity, one of the effective approaches is to choose missing value imputation (MVI) for tackling the problem. In addition, it has been demonstrated that the method of the machine learning may be a better tool. Therefore, the main purpose of this study is to utilize a generative adversarial network (GAN) that consists of a generative model and a discriminative model for imputation. Our result shows that GAN can improve the accuracy of water resource evaluations.

  In the current study, two interdisciplinary deep learning methods, Univariate and Seq2val, are used for groundwater level estimation. In addition to addressing the significance of the parameter conditions, the advantages and disadvantages of these two models in hydrological simulations are also discussed and compared. Finally, Seq2seq is employed to examine the limit of the models in long-term water level simulations. Our result suggests that the interdisciplinary deep learning approach may be beneficial for providing a better evaluation of water resources.

Keywords: GAN,CNN,LSTM,Imputation,Groundwater prediction

How to cite: Chen, H. Y., Lo, W.-C., and Huang, C.-T.: Using GAN for Imputation of Missing Recorded Data to Improve Groundwater Level Prediction Based on Deep Learning Methods, EGU General Assembly 2023, Vienna, Austria, 23–28 Apr 2023, EGU23-10611, https://doi.org/10.5194/egusphere-egu23-10611, 2023.

EGU23-11700 | ECS | Orals | HS8.2.3

Water-rock interaction processes in springs and wells of the Mexico City groundwater flow system 

Selene Olea Olea, Eugenio Gómez Reyes, Oscar Escolero, and Felipe de Jesús Armas Vargas

The Mexico City region is a densely populated region in the world and has problems in guaranteeing the supply of drinking water to its inhabitants. Its groundwater flow system is subject to intensive exploitation. The water in the city is coming from a lot of sources as wells located in the city and springs in the ranges. The geology in the basin is mainly in lacustrine sediments; volcanic rocks shallow and deep and carbonate rocks in the depths.

We collected water table values, major ions, and trace elements compositions from other research: wells (1999) and springs (2015) to investigate hydrogeochemical processes as well as to understand the hydrodynamics of groundwater and their chemical differences between ranges and plains. The groundwater chemical composition is related to the water-rock interaction processes.

We applied two inverse model sections (PHREEQC code) in springs and wells. The inverse model section in the springs showed the dissolution of gypsum, biotite, SiO2 (aqueous), volcanic glass, labradorite, chloride, and precipitation of amphibole, kaolinite, and H2O (gaseous). Whereas the inverse section model in wells presents the dissolution of CO2 (gaseous), gypsum, biotite, volcanic glass, halite, plagioclase, olivine, and precipitation of kaolinite and pyroxene.

Understanding the hydrochemical mechanisms of water-rock interactions eventually leads to the development of appropriate strategies for sustainable groundwater management.

How to cite: Olea Olea, S., Gómez Reyes, E., Escolero, O., and Armas Vargas, F. D. J.: Water-rock interaction processes in springs and wells of the Mexico City groundwater flow system, EGU General Assembly 2023, Vienna, Austria, 23–28 Apr 2023, EGU23-11700, https://doi.org/10.5194/egusphere-egu23-11700, 2023.

EGU23-12238 | Orals | HS8.2.3

Natural radioactivity in drinking water in the surroundings of a metamorphic outcrop in Hungary: interpretation of practical problems in groundwater flow system context 

Anita Erőss, Petra Baják, Bence Molnár, Katalin Hegedűs-Csondor, Mia Tiljander, Bálint Izsák, Márta Vargha, Ákos Horváth, Viktor Jobbágy, Mikael Hult, Krzysztof Pelczar, Péter Völgyesi, Csaba Tóbi, Mihály Óvári, Emese Csipa, and Viktória Kohuth-Ötvös

Our study aimed to understand the origin of elevated (>100 mBqL–1) gross alpha activity measured in groundwater-derived drinking water in the vicinity of the Sopron Mountains and Lake Fertő (Neusiedl). Water samples from 10 springs and 7 water wells were analyzed for major ions and trace elements. Total U and 226Ra activity concentrations were determined by alpha spectrometry using Nucfilm discs, and 222Rn activity was measured by liquid scintillation counting. 234U/238U ratio was determined by ICP-MS and alpha spectrometry. Additionally, δ2H and δ18O measurements were performed. To get an insight into the dynamics of the groundwater flow system and to better understand the radionuclide mobilization and transport processes, the geochemical results were evaluated in the groundwater flow system context.

Uranium activity was measured up to 540 mBqL–1, thus it can be concluded that dissolved uranium causes the previously measured elevated gross alpha values, though no health risk arises from drinking water consumption. The occurrence of dissolved uranium can be explained by oxidizing conditions that are prevalent along local flow systems and in recharge areas. The relatively short residence time of water, thus the presence of local flow systems is indicated by δ18O (-11.96 to -7.17‰) and δ2H values (-83.4 to -52.6‰). Spring samples have lower uranium activity (up to 93 mBqL–1) than groundwater samples (up to 540 mBqL–1) which can be explained by the longer residence time of water. Uranium is transported along flow paths under oxidizing conditions and the longer the flow route the higher the uranium concentration.

This topic is part of a project that has received funding from the European Union’s Horizon 2020 Research and Innovation Programme under grant agreement No. 810980. Besides, the research was funded by the National Multidisciplinary Laboratory for Climate Change, RRF-2.3.1-21-2022-00014 project project. Some radioactivity measurements were supported by the European Commission’s Joint Research Centre (JRC) – Research Infrastructure Access Agreement No. 36227-1/2021-1-RD-EUFRAT-RADMET.

How to cite: Erőss, A., Baják, P., Molnár, B., Hegedűs-Csondor, K., Tiljander, M., Izsák, B., Vargha, M., Horváth, Á., Jobbágy, V., Hult, M., Pelczar, K., Völgyesi, P., Tóbi, C., Óvári, M., Csipa, E., and Kohuth-Ötvös, V.: Natural radioactivity in drinking water in the surroundings of a metamorphic outcrop in Hungary: interpretation of practical problems in groundwater flow system context, EGU General Assembly 2023, Vienna, Austria, 23–28 Apr 2023, EGU23-12238, https://doi.org/10.5194/egusphere-egu23-12238, 2023.

EGU23-12255 | ECS | Orals | HS8.2.3

Analysis of the recharge process of Alpine Spring through an integrated approach: the case of Perrot spring (Aosta Valley, Italy) 

Luis Miguel Santillan Quiroga, Daniele Cocca, Chiara Marchina, Manuela Lasagna, Enrico Destefanis, Giacomo Vescovo, Davide Bolognini, and Domenico Antonio De Luca

The Perrot spring (1305 m a.s.l.), located on the right side of the Chalamy Stream, inside the Monte Avic Natural Park (Aosta Valley, NW Italy), is an important source of drinking water for Champdepraz municipality.

The spring is placed on a large slope characterized by the presence of debris covers of various origin (glacial, fluvial and landslide) above the bedrock (serpentinised peridotites and metabasites of the Zermatt-Saas Zone, Penninic Domain) which crops out only in the upper part of the basin.

The water source is fed by rainwater infiltrating and flowing into the shallow deposits, with a permeability by porosity, and into the most fractured portion of the substrate. The water emerges at the contact between the topographic surface and impermeable or semi-permeable basal lithologies (unfractured crystalline rocks and glacio-lacustrine deposits).

The aim of this study is to delineate the recharge processes of the spring and the definition of the recharge area extension that is very important for its conservation.

In this view, an analysis of groundwater spring parameters (e.g. daily discharge, temperature and electrical conductivity) were conducted for the years 2018-2020.

The flow rate ranges between 22 and 47 L/s with two maxima, one in spring and one in autumn; the electrolytic conductivity varies between 60 and 75 S/cm. The variation of groundwater temperature is very low, between 4.9°C and 5.5°C.  The low discharge and temperature variations suggest a relatively high average share of the supply area and a sufficiently deep flow circuit.

The analysis of these data shows the presence of two contributions to the spring supply: a spring contribution from snowmelt, characterized by a low INCREASE in flow rate, and an autumn contribution from rainwater infiltration.

Moreover, sampling campaigns were also carried out in the entire Chalamy stream basin in August 2021 and January, July, September 2022. In particular, water from lakes, rivers, spring and rainwater was sampled.

During the field campaigns, pH, electrical conductivity and temperature were measured in situ. Chemical analysis of major ions and stable isotopes (δ2H and δ18O) were then conducted on water samples.

The chemical analyses show a groundwater chemistry coherent with the regional geology: the hydrochemical facies is bicarbonate-sodium, the main cations are Ca2+ and Mg2+ and the anions HCO3-.  Finally, isotopic analyses of precipitation and spring water suggest a recharge elevation of around 2,500 m a.s.l.

How to cite: Santillan Quiroga, L. M., Cocca, D., Marchina, C., Lasagna, M., Destefanis, E., Vescovo, G., Bolognini, D., and De Luca, D. A.: Analysis of the recharge process of Alpine Spring through an integrated approach: the case of Perrot spring (Aosta Valley, Italy), EGU General Assembly 2023, Vienna, Austria, 23–28 Apr 2023, EGU23-12255, https://doi.org/10.5194/egusphere-egu23-12255, 2023.

EGU23-12264 | ECS | Posters on site | HS8.2.3

An innovative method to determine springs recharge areas by using water isotopes: intuitions from mountain hydrogeological studies in central Italy 

Davide Fronzi, Stefano Palpacelli, Mirco Marcellini, Christian Massari, and Alberto Tazioli

Over the years the scientific community underlined several problems related to the use of isotopic hydrology techniques in areas characterized by a complex orography, usually occurring in mountain areas, or in those cases where the hydrological setting is complicated by contacts between different aquifers (Nanni et al., 2013).

In this study, an innovative isotopic model, able to identify the most probable recharge area for several springs exploited for drinking purposes, has been developed and applied to the Nera catchment in the Sibillini Mountain National Park (central Italy). The isotopic investigation consists of a preliminary definition of a new δ18O - elevation relationship, considering the morphological and meteorological heterogeneities within the area and their possible influences on the precipitation isotope values (e.g., shaded areas, snow drift effect, etc.). Second, an advanced δ18O distribution model, supported by statistical and GIS-based procedures, has been implemented by clipping the precipitation δ18O values (depicted from the δ18O – elevation relationship) over an upstream area for each analyzed spring. The new isotopic modeling approach can be conveniently applied if the infiltration rate of the meteoric water is fast enough to avoid fractionation processes that may alter the isotopic signal of the precipitation input within the aquifer, and if peculiar meteoric recharge phenomena, altering the springs' isotopic signal, are treated as outliers.

This research highlights if the most used isotopic approach based on the determination of groundwater recharge areas starting from δ18O - elevation gradient (Jeelani et al., 2010; Jasechko, 2019) applied to a selected spring isotopic data agrees with the hydrogeological setting of the spring recharge area which is often complicated by the topography and the contacts between different aquifers both for stratigraphic and tectonic reasons.

The ultimate goal of this study is to quantify the aquifers recharge under the impact of drought to improve the water resources management operations in the area.

How to cite: Fronzi, D., Palpacelli, S., Marcellini, M., Massari, C., and Tazioli, A.: An innovative method to determine springs recharge areas by using water isotopes: intuitions from mountain hydrogeological studies in central Italy, EGU General Assembly 2023, Vienna, Austria, 23–28 Apr 2023, EGU23-12264, https://doi.org/10.5194/egusphere-egu23-12264, 2023.

EGU23-12278 | ECS | Orals | HS8.2.3

Numerical modeling and time series analysis to quantify the neglected groundwater component in Lake Velence’s water budget – a case study from Hungary 

Petra Baják, Katalin Hegedűs-Csondor, András Csepregi, Máté Chappon, Katalin Bene, and Anita Erőss

Lake Velence is a shallow soda lake in Hungary, which has a diverse ecosystem and is a popular tourist destination. Because of that, the lake is the focus of continuous interest and is constantly examined in terms of water quality and quantity. In recent years, it has been observed that the lake's water and nutrient budget is negatively affected by climate change. Since the very existence of the lake is threatened, it has become important to assess the quantity of water flowing into and out of the lake. In our research, the emphasis is on the investigation of the groundwater component, since groundwater can represent a significant buffer in the lake's water balance against climate change, and since in water management practice, neither inflow nor outflow of groundwater is currently considered in the lake’s water budget. Therefore, we wanted to understand the nature of the relationship between the lake and the groundwater and quantify the amount of inflowing and outflowing groundwater.

To achieve our aim, we created a regional-scale transient 3D numerical groundwater flow model for the lake's catchment area using Visual MODFLOW. The time series of weather parameters (i. e. amount of precipitation, evaporation, temperature), the discharge rate of surface water courses, and groundwater extraction data from 1990-2020 have been incorporated into the model. To calibrate the model, we used the time series of monitoring wells of unconfined and confined aquifers. The mentioned time series were also analyzed using statistical methods such as the relationship between rainfall, the groundwater level measured in wells, and the lake level.

Our results complemented the previous studies on the lake's catchment area: there is a not insignificant connection between the lake and groundwater, and the lake is fed by local flow systems with shallow penetration depth and relatively short residence time, which are known to be more sensitive to climate change. Finally, we used the calibrated model to test different scenarios, e. g. we have reduced rainfall or increased water withdrawals to highlight the lake's vulnerability to future changes.

The research was supported by the ÚNKP-22-3 New National Excellence Program of the Ministry for Culture and Innovation from the source of the National Research, Development and Innovation Fund. Part of the research was funded by the National Multidisciplinary Laboratory for Climate Change, RRF-2.3.1-21-2022-00014 project.

How to cite: Baják, P., Hegedűs-Csondor, K., Csepregi, A., Chappon, M., Bene, K., and Erőss, A.: Numerical modeling and time series analysis to quantify the neglected groundwater component in Lake Velence’s water budget – a case study from Hungary, EGU General Assembly 2023, Vienna, Austria, 23–28 Apr 2023, EGU23-12278, https://doi.org/10.5194/egusphere-egu23-12278, 2023.

EGU23-13570 | Orals | HS8.2.3

Monitoring of a small karst island aquifer as a prerequisite for its sustainable management (Vis island, Croatia) 

Staša Borović, Matko Patekar, Marco Pola, Josip Terzić, and Maja Briški

The assessment of groundwater resources quality and quantity in arid or semi-arid climates is crucial for achieving long-term sustainable management due to their limited volume and scarce replenishment. The relevance of this topic is enhanced by their vulnerability to climate change. The Mediterranean region is considered to be a hot spot for climate change with a generally arid climate. Its groundwater resources are under increasing stress due to: growing population, agricultural and industrial development, seawater intrusion, and changing climate. Groundwater resources in islands are particularly stressed since they have small aquifer volumes and a limited extent of the recharge area. The island of Vis (Croatia) in the Adriatic Sea is a representative case study for stressed island groundwater resources. Vis is located 40 km from the mainland and depends exclusively on its local karst aquifer for public water supply. This groundwater resource is affected by a concomitant decrease of recharge, an increase of evapotranspiration, and a progressive anthropic impact due to tourism. Geochemical and hydrogeological monitoring were conducted from September 2019 to December 2022 in deep wells and coastal springs to assess the hydrochemical characteristics and the regime of the Vis groundwater resource. Although the monitoring period was characterised by low rainfall resulting in the decline in groundwater levels, the principal ion composition showed relative stability. The groundwater in wells generally showed predominant Ca-HCO3 hydrochemical facies, while coastal springs or wells nearby the sea showed both Na-Cl and mixed Ca-Mg-Cl-SO4 facies. Time series of in-situ measurements of groundwater temperature, pH value, and electrical conductivity have shown low variability, notwithstanding the low precipitation during the observed period. Groundwater temperature between 16°C and 18°C varied throughout the year following the air temperature variations. The groundwater pH was neutral to mildly alkaline with low annual variability. EC values were variable depending on the interaction between groundwater and seawater. However, all objects displayed relatively stable EC values despite the prolonged drought and the intensive exploitation during the summer period. These results evidenced the resilience of the aquifer, which owes to its favourable geological structure. Due to increasing natural and anthropic pressures on the resource, continuous monitoring and the establishment of an early warning system should be foreseen in the coming years.

Acknowledgments: This research was carried out within the framework of the INTERREG-CE project DEEPWATER-CE, funded by the European Regional Development Fund (ERDF).

How to cite: Borović, S., Patekar, M., Pola, M., Terzić, J., and Briški, M.: Monitoring of a small karst island aquifer as a prerequisite for its sustainable management (Vis island, Croatia), EGU General Assembly 2023, Vienna, Austria, 23–28 Apr 2023, EGU23-13570, https://doi.org/10.5194/egusphere-egu23-13570, 2023.

EGU23-13692 | ECS | Orals | HS8.2.3

Numerically Enhanced Conceptual Modelling (NECoM) applied to the Flumendosa Plain groundwater system (SE Sardinia, Italy) 

Claudio Arras, Francesca Lotti, Maria Chiara Porru, Fabrizio Antonio Piscedda, and Stefania Da pelo

The alluvial aquifer of the Flumendosa delta plain, in south-eastern Sardinia (Italy), is overexploited for drinking and agriculture purposes and it is subjected to ongoing sea water intrusion phenomena. In a context of progressive quali-quantitative deterioration of groundwater resources, development of a sustainable management plan and, eventually, effective remediation actions require a deep understanding of the investigated system. A systematic review of dataset collected from literature, integrated with new field hydrogeological and geochemical data, is performed to improve the knowledge of the aquifer system. Despite the large amount of processed data, many aspects require further investigations. In this frame, a fast-running steady state groundwater flow numerical model is developed as a tool for testing the preliminary assumptions, to address the main uncertainties, and to optimize the acquisition of new field data. The adopted approach follows the methodology proposed by Lotti et al. (2021) for the development of a Numerically Enhanced Conceptual Model (NECoM).

Geometrical discretization of the numerical model is based on results of the 3D hydrogeological reconstruction of the plain area (Arras et al. 2019); simulation of main inflows and outflows, water exchange between surface water bodies and groundwater, irrigation and drinking water withdrawals is performed through the implementation of general head boundaries (GHB), river (RIV), and well (WEL) packages, respectively. Results from the application of the Soil Water Balance code (Porru et al. 2020) are used as input for simulating the average recharge from precipitation. Lateral recharge from the Paleozoic basement is also simulated. More than 4000 heads observations from about 350 wells and piezometers are used as targets in the calibration process; weights are assigned to deal with the high heterogeneity of the dataset quality. RIV and GHB conductance, irrigation well yields, direct and lateral recharge, and hydraulic conductivity are set as parameters in the calibration process. Due to the high sensitivity of some parameters, different calibration cycles are performed; hydraulic conductivities and lateral recharge are then calibrated in the last cycle.

Model results show that the hydrogeological conceptualization used for implementing the numerical model can reproduce the main general features of the piezometric head field. According to field observations, the Flumendosa river shows losing conditions in the western part of the plain and next to the river mouth, while gaining conditions occur in its central part; gaining conditions are also observed along the abandoned branches of the Flumendosa river, also known as foxi. Moreover, mass balance analysis show that the Flumendosa river represents the main recharge input of the whole groundwater system, providing an average inflow of about 4.3 Mm3/year. Nevertheless, several local incongruencies with the observed data were precious to highlight the effects of unknown variables such as agricultural extraction wells, the hydrogeological role of the bedrock or the water exchange between surface and groundwater bodies. The discrepancies, rather than the agreements, provided useful direction for the detection of new data to be collected to capture the salient information needed for a proper water resource management.

How to cite: Arras, C., Lotti, F., Porru, M. C., Piscedda, F. A., and Da pelo, S.: Numerically Enhanced Conceptual Modelling (NECoM) applied to the Flumendosa Plain groundwater system (SE Sardinia, Italy), EGU General Assembly 2023, Vienna, Austria, 23–28 Apr 2023, EGU23-13692, https://doi.org/10.5194/egusphere-egu23-13692, 2023.

EGU23-14029 | Posters on site | HS8.2.3

A conceptual model for a fractured volcanic aquifer to investigate the role of climate variability and water withdrawal on recent changes in water-table and discharge 

Brunella Bonaccorso, Marco Silipigni, Cristina Di Salvo, Iolanda Borzì, and Elisabetta Preziosi

The Alcantara River Basin is located in North-Eastern Sicily (Italy), encompassing the north side of Etna Mountain, the tallest active volcano in Europe. On the right-hand side of the river, the mountain area is characterized by volcanic rocks with a very high infiltration. Here, precipitation and snow melting supply a big aquifer whose groundwater springs at the mid/downstream of the river, mixing with surface water and contributing to feeding the river flow also during the dry season. In the upstream a maximum of 520 l/s are extracted for municipal use through wells and an infiltration gallery supplying the Alcantara Aqueduct. In summer 2020 and 2021, the river suffered a prolonged dry phenomenon in the middle-valley stretch with a serious loss of fish fauna, due to significant spring depletion along the stream most likely determined by a meteorological drought. Since this anomaly is of great concern, the need arises to better understand whether the interaction between the water abstraction to supply the Alcantara aqueduct and the natural recharge of the aquifer is compatible with maintaining the balance of aquatic ecosystems in the middle-downstream valley of the Alcantara River also during dry years; or if the observed changes may also be partly due to other mechanisms, such as illegal or unaccounted water abstractions or hydrogeological modification due to the volcanic activity. To this end, in this study, an attempt was made to analyze changes in the groundwater level and in the interconnection between surface and groundwater by using the widely accepted MODFLOW 6, a finite-difference numerical model that in principle can provide constraints to reduce uncertainty and address field activity in data scarce case studies. The model was calibrated in steady state by comparing simulated and observed water heads as well as the groundwater budget. Then the simulation was run in transient mode for the period 2014–2021. The model outcome showed a depletion rate compatible with the one observed during the recent dry summers, thus suggesting that more sustainable and comprehensive strategies, also including groundwater extraction regulations, should be implemented to preserve this natural resource for in-stream water use and ecosystem services.

How to cite: Bonaccorso, B., Silipigni, M., Di Salvo, C., Borzì, I., and Preziosi, E.: A conceptual model for a fractured volcanic aquifer to investigate the role of climate variability and water withdrawal on recent changes in water-table and discharge, EGU General Assembly 2023, Vienna, Austria, 23–28 Apr 2023, EGU23-14029, https://doi.org/10.5194/egusphere-egu23-14029, 2023.

EGU23-14159 | Posters virtual | HS8.2.3

Evolving concepts and communication: what do we need to evaluate better regional groundwater flow? 

Judit Mádl-Szőnyi, John Molson, Okke Batelaan, Hanneke Verweij, Xiao-Wei Jiang, José Joel Carrillo-Rivera, and Ádám Tóth

The theory of regional groundwater flow is sixty years old in 2023, which has made it possible to evaluate groundwater flow systems and evolution in sedimentary basins. Recently, the approach has been extended to different environments in the Earth's crust. By applying regional groundwater flow theory, we can solve groundwater issues on a larger scale than for single aquifers. Application of the concept contributes to all practical aspects of groundwater topics, including the UN’s Sustainable Development Goals for water.

However, the developed terms related to groundwater flow evaluation need to be more strictly defined and clarified for interpreting complex hydrogeological flow systems. The presentation summarizes the results of discussions among RGFC-IAH board members on this topic and tries to provide some necessary frameworks for the future application of the concept.

At regional scales, groundwater flow evaluation should include the concept of aquifer systems. The term artesian basin has become obsolete because it implies impermeable layers in natural environments; groundwater basin is preferred instead. Sedimentary basin is a broader term which can contain more than one groundwater basin. For the goals of flow system evaluation, the term groundwater basins can be used, which are characterized by siliciclastic basin fill and basement aquifer systems. The full-groundwater basin is required for 2D and 3D interpretations, because half- (or symmetric-) basin assessment can provide misleading results. Hydraulic continuity is a fundamental principle in groundwater flow evaluation, it can be assumed in groundwater basins across multiple aquifers, aquitards and faults, as long as one has no contradicting evidence. Conceptual groundwater flow models need to be tested with specific field data, numerical simulations and groundwater flow-related manifestations.

The presentation aims to initiate a discussion on improving the application of regional groundwater flow theory. The conference presentation is supported by the National Multidisciplinary Laboratory for Climate Change, RRF-2.3.1- 21-2022-00014 project.

How to cite: Mádl-Szőnyi, J., Molson, J., Batelaan, O., Verweij, H., Jiang, X.-W., Carrillo-Rivera, J. J., and Tóth, Á.: Evolving concepts and communication: what do we need to evaluate better regional groundwater flow?, EGU General Assembly 2023, Vienna, Austria, 23–28 Apr 2023, EGU23-14159, https://doi.org/10.5194/egusphere-egu23-14159, 2023.

 In most regions worldwide, the groundwater usage is increasingly common due to the progressive decreasing
of the effective availability of surface water for both quantity regime and quality issues, as a consequence of
global population increasing, global climate change and growing water pollution. Therefore, groundwater is
the most important and safest source for water supply being less affected by pollution and climate changes.
For example, in European Union countries, groundwater provides nearly 70% of the piped water supply and
80% of the drinking water. However, the overexploitation of groundwater may sometimes exceed recharge
over long periods and over extensive areas and the subsequent decline in water table level may affect natural
groundwater discharge and quality, which in turn may have harmful impacts on groundwater dependent
streams, wetlands and ecosystems. For these reasons a correct management of the groundwater resources
is of paramount importance. In this scenario, groundwater modelling, both conceptual and numerical, is
particularly crucial for the sustainable and efficient management of groundwater resources, even more in
the context of expected climate change.
The middle-high Brenta river plain (NW of Veneto, Italy) is characterized by the existence of an important
unconfined to semi-confined foothill aquifer system, that is made of a very thick single-layer of gravellypebbly alluvial deposits, in the northernmost part, whereas in the southern part the aquifer becomes a
multilayer composed of gravelly deposits and levels of silt and clay. The existence of an important aquifer
system is tied to the high annual rainfall amount, about 1200 - 1500 mm/year, however the main
groundwater recharge component of the aquifer is related to the water dispersion from the Brenta river.
Groundwater hosted in the aquifer represents an important resource for drinkable supply, industrial and
agricultural usages. However, over the last decades, the exploitation of groundwater resource and the
meteo-climate regime caused a decrement of the piezometric level alerting the local authorities. Thanks to
the existence of a consistent and continuous monitoring network made up of several meteoric, hydrometric
and piezometric stations, very long time-series of data are available. The availability of a long time-series
allowed to develop Data-Driven models, specifically Multiple Linear Regression Models, of the Brenta river
hydrometric level (using rainfall, snowfall and atmospheric temperature as independent variables) and of the
piezometric level of groundwater in the middle-high plain (using atmospheric temperature, the local rainfall
and the model of Brenta river as independent variables). The regression models were used to make
predictions on the development of the hydrometric level of Brenta river and consequently of the
groundwater level under extreme weather and climate conditions as those of the last years, thus providing
useful information for steering the best water management practices in a zone where strategic groundwater
exploitation systems are located.

How to cite: Franceschi, L., Menichini, M., Raco, B., and Doveri, M.: Data-Driven models for groundwater level forecasting and improvement of waterresource management: example of the Foot-hill aquifer system in the Brenta riverplain (Veneto, Italy) , EGU General Assembly 2023, Vienna, Austria, 23–28 Apr 2023, EGU23-15653, https://doi.org/10.5194/egusphere-egu23-15653, 2023.

EGU23-200 | ECS | Orals | HS8.2.4

A critical review of solute mixing and transport approaches in karstic groundwater modelling and key challenges 

Kübra Özdemir Çallı, Süleyman Selim Çallı, Daniel Bittner, Gabriel Chiogna, and Andreas Hartmann

Modelling solute mixing and transport processes is one of the key steps to effectively managing karstic groundwater resources, particularly under the threat of climate change and risk of contamination. For that reason, a considerable body of literature has been devoted to understanding and describing solute mixing and transport processes in karst aquifers. However, due to the strong multiscale heterogeneity (from microscale to aquifer scale), modelling solute mixing and transport processes in karst aquifers remains a challenging task. This presentation critically reviews the current state of knowledge and fundamental challenges in the modelling of solute mixing and transport processes in karst aquifers, thereby collocating and synthesizing the existing body of knowledge in the literature. To provide a holistic and objective picture of the state-of-the-art of the solute mixing and transport modelling, we performed a bibliometric analysis on the relevant literature for karst groundwater studies (over 2800 scientific papers). Further, with a meta-analysis of scientific papers focusing on the quantitative tracer tests, we evaluated the field-based transport parameters that are typically served for the solute mixing and transport models.

The review unveils the fundamental modelling hinges underlying a successful modelling practice for the solute mixing and transport processes in karst, thereby discussing to what extent and in what ways we are dealing with these challenges. The major modelling challenges are defined as follows: (i) Model conceptualization based on data collection and system understanding (e.g., How well is the problem of interest defined? To what extent is the domain of interest described?), ii) Model selection considering the choice of a dominant physicochemical process (e.g., How well is the process of interest represented by a set of governing equations over the problem domain?), iii) Time-variability of solute mixing and transport processes (e.g., To what extent do the parameters represent the process of interest under the different time-scales?), iv) Model parametrization considering the parameter non-uniqueness and transferability (e.g., How realistic are the model parameters? To which extent are they transferable over the same aquifer?), v) Uncertainty quantification in model results (e.g., How robust are the model results? How much are we (un)certain about our model?). Finally, we address potential research directions and knowledge gaps by encouraging the community for building a protocol for solute transport modelling in karst aquifers, as well as providing more transparent and reproducible results.

How to cite: Özdemir Çallı, K., Çallı, S. S., Bittner, D., Chiogna, G., and Hartmann, A.: A critical review of solute mixing and transport approaches in karstic groundwater modelling and key challenges, EGU General Assembly 2023, Vienna, Austria, 23–28 Apr 2023, EGU23-200, https://doi.org/10.5194/egusphere-egu23-200, 2023.

EGU23-1596 | ECS | Posters on site | HS8.2.4

Study on the relationship between geometrical features and permeabilities of fracture networks based on the spring hydrographs 

Yuan Chen, Longcang Shu, Zhe Wang, Shuyao Niu, and Zihan Ling

Identifying the hydraulic properties of fracture networks is important for groundwater management of karst aquifers which are composed of fractured rocks and cavernous conduits. Although much research has been done on the geometrical characteristics and flow calculation of discrete fracture networks, further exploration on the relativity between them is still needed. This study aims to quantitatively analyze the relationship between different geometrical features and permeabilities of fracture networks based on the spring hydrographs, which can intuitively reflect the flow velocity of karstic medium system.

We simulated rainfall-discharge processes of a karst area with different distributions of random fracture networks using a numerical model developed based on a laboratory experiment. The results of plenty of simulation show that the total length of fracture networks and relative density of fractures are most related to the peak values of spring discharge with the Pearson correlation coefficients of over 0.8, indicating that these two geometrical parameters can reflect the permeability of random fracture networks best, followed by the fractal dimension and number of intersection points. However, the connectivity of fracture networks also depends on whether there is one or more fractures that go through the entire study area, which greatly promote water movement and solute transport in the fractured rocks. Another factor that impacts the permeability of fracture networks is uniformity of distribution of fractures, in that a drastic propagation that occurs in a small area with clusters of fractures could not represent the overall permeability of fracture networks. Additionally, the surrounding rock matrix with ultralow hydraulic conductivity has a positive and significant impact on the water transmission capacity of fracture networks, showing that the strong water blocking effect of matrix pushes the groundwater movement towards fractures with high delivery capacity.  

This study utilized the spring hydrographs to evaluate the permeability of fracture networks for convenience compared to the calculation of equivalent permeability coefficient, while the latter is more accurate and representative. The above findings can enhance the understanding of properties of fracture networks, benefit targeted observations of detailed structures of fractured rocks and then improve the efficiency of groundwater management in karst areas.  

How to cite: Chen, Y., Shu, L., Wang, Z., Niu, S., and Ling, Z.: Study on the relationship between geometrical features and permeabilities of fracture networks based on the spring hydrographs, EGU General Assembly 2023, Vienna, Austria, 23–28 Apr 2023, EGU23-1596, https://doi.org/10.5194/egusphere-egu23-1596, 2023.

EGU23-2979 | Orals | HS8.2.4

Natural production of nitrate by groundwater nitrification in New Zealand karst springs 

Michael Stewart, Chris Hickey, Magali Moreau, Joseph Thomas, and Roger Young

The objective of this work is to understand the sources of nitrate in Te Waikoropupū Springs (‘the springs’) in New Zealand, and thereby contribute to their preservation. Previous work has shed light on the recharge sources of water to the springs (Stewart and Thomas, 2008), and nitrate mass balance based on this recharge model reveals the nitrate values in the recharge waters when they reach the springs. The major recharge source (from pristine forest on karst uplands) delivers much more nitrate to the springs than expected from measurements on water in its recharge area. This excess nitrate is attributed to nitrification (following mineralisation of organic-N) within the oxic karst groundwater system as the water flows to the springs.

Nitrification (bacterial conversion of ammonium to nitrate) is widespread in soils, unsaturated zones and oxic groundwater systems. Evidence showing natural production of nitrate by nitrification in the current system is given by: (1) Total nitrogen measurements: If organic-N is converted to nitrate-N along the flowpath from the Karst Uplands to the springs, there must be input of 5 kg/ha/yr of organic-N from the recharge area of 170 km2. This is within the range found by McGroddy et al. (2008) for first order streams from pristine forests in NZ. (2) 15N and 18O measurements: Nitrification produces nitrate with low values of the isotope ratios as observed for the springs, whereas denitrification would cause high values which are not observed. (3) Scientific literature: Recent papers have reported nitrification as a previously unrecognised source of nitrate in oxic karst systems. For example: Musgrove et al. (2016) showed that groundwater nitrate concentrations in the Edwards Aquifer were higher than those in the surface water recharge. They concluded that nitrification within the aquifer is the source of the extra nitrate in the groundwater.

References

McGroddy, M.E., Baisden, W.T., Hedin, L.O. 2008. Global Biogeochemical Cycles 22, GB1026.

Musgrove, M., Opsahl, S.P., Mahler, B.J., Herrington, C., Sample, L.L., Banta, J.R. 2016.  Science of the Total Environment 568, 457–469.

Stewart, M.K., Thomas, J.T. 2008. Hydrology and Earth System Sciences 12(1), 1-19.

How to cite: Stewart, M., Hickey, C., Moreau, M., Thomas, J., and Young, R.: Natural production of nitrate by groundwater nitrification in New Zealand karst springs, EGU General Assembly 2023, Vienna, Austria, 23–28 Apr 2023, EGU23-2979, https://doi.org/10.5194/egusphere-egu23-2979, 2023.

The Front Ranges of the Canadian Rockies are home to extensive carbonate assemblages that host karst aquifers. New caves and karst springs have recently been discovered in the mountains from Banff, Alberta extending all the way to the United States border, although little research has been conducted on them due to the challenging terrain. In this study, we focus on the Watridge Karst Spring, which is located on a forested hillside in a mountain range that reaches an elevation of 3400 m. This perennial spring can discharge up to 3000 L/s. Karst catchments in these snowmelt-dominated, glacierized areas have sparse vegetation, heavy snowfall, and high hydraulic gradients, leading to efficient groundwater infiltration. As a result, the hydrochemistry of these springs often exhibits strong and rapid fluctuations. The effects of rapid conduit flow are expressed at the Watridge Karst Spring by an increase in discharge followed by a lagged decrease in electrical conductivity (EC), occurring over a diurnal-scale and a longer-scale (e.g., episodic snowmelt or heavy storm). This research aims to use hydrologically relevant metrics to understand the recharge, flow paths, and storage capacity of the aquifer. 
Particularly, we used signal processing of the fluctuations in discharge, EC and air temperature to estimate groundwater response time, defined here as the lag time between a hydrologic event and a resulting change in hydrochemistry. Response time can be used to approximate celerity in the case of discharge, and velocity in the case of EC. Additionally, automatic water sampling allowed for the observation of rapid changes in major ion chemistry.
The results yielded an estimated groundwater conduit velocity on the order of 0.1 m/s that steadily decreases with diminishing flow. It was also found that a distinct shift in the EC signal phase and an associated change in mineral dissolution marks the drainage of an overflow conduit path. This is supported by dye tracer experiments of up to 14 km distance where a maximum velocity of 0.14 m/s has been recorded. Our results show that continuous hydrochemical monitoring of discharge and meteorological conditions at a high-temporal resolution can be used as a first step in characterizing conduit system response. For alpine karst springs with strong hydrochemical fluctuations, this strategy may limit the need to conduct tracer tests involving laborious field work in remote, mountainous locations.

How to cite: Lilley, S. and Hayashi, M.: Strategies for karst groundwater flow characterization in remote, mountainous, snowmelt-dominated catchments, EGU General Assembly 2023, Vienna, Austria, 23–28 Apr 2023, EGU23-4013, https://doi.org/10.5194/egusphere-egu23-4013, 2023.

EGU23-4134 | Posters on site | HS8.2.4 | Highlight

Sinkholes evolution in coastal settings: some examples from Southern Italy 

Mario Parise and Isabella Serena Liso

The southernmost sector of Apulia Region can be described as a karst peninsula surrounded by the Adriatic and the Ionian Seas. The process of seawater intrusion, together with groundwater outflow, mainly coming out at the coastline, produces a water mixing that enhances the solution of soluble carbonate rocks. The effect of these processes can be observed along the coastline, characterized by several areas interested by sinkhole development and evolution. In some cases, they have become famous touristic attraction as at Grotta della Poesia, visited every summer by thousands of tourists; in other cases they represent spectacular sites of high ecological values, since they host peculiar ecosystems, with many fauna and flora species. At several sites along the Apulian coasts, sinkhole evolution form elongated bays, completely protected from sea waves, as in the sector between Fasano and Brindisi. Along this coastal stretch, field surveys revealed different sinkholes stages that can be described as successive phases in the development of bays: from opening of individual collapse sinkholes, typically at distance lower than 20 m from the coastline, to evolution in elongated sinkholes deriving from coalescence of nearby features, eventually leading to the final stage, with formation of protected bays, which main elongation depends upon the main discontinuity systems in the rock mass, and the main direction of sea storms as well. These examples highlight the importance of sinkhole processes in predicting the future evolution of the coast, and may be of help to local authorities for the most proper management of such a fragile environment.

How to cite: Parise, M. and Liso, I. S.: Sinkholes evolution in coastal settings: some examples from Southern Italy, EGU General Assembly 2023, Vienna, Austria, 23–28 Apr 2023, EGU23-4134, https://doi.org/10.5194/egusphere-egu23-4134, 2023.

EGU23-5031 | Posters on site | HS8.2.4

Distribution and characteristics of glaciokarst on the island of Gotland, Baltic Sea - its role on groundwater recharge and sensitive wetland ecosystems 

Mikael Erlström, Peter Dahlqvist, Krister Mild, Daniel Sopher, Magnus Martinsson, Anders Glimskär, Anders Jacobson, Björn Holgersson, Frans Lundberg, and Jakob Léven


Glaciokarst is widespread in the Silurian carbonate bedrock on the Island of Gotland. Grikes and limestone pavements are the most common karst features. Although, less well documented, caves and subsurface channels also contribute to the complex hydrogeology in the bedrock. The karst is interpreted to have been formed, primarily, before the Pleistocene when the landscape was covered with acidic organic soils. Glacial erosion and postglacial karstification have also played significant roles in sculpturing the epikarst morphology we see today. The study presents quantitative and qualitative characterization of karst within several pilot areas on the island of Gotland. High resolution aerial photographs were acquired over the pilot areas using a drone. These images were then analysed in GIS-software to provide a statistical evaluation of length, width, and relative area with karst. As well as providing a statistical understanding of the occurrence and geometry of karst, the results also help to clarify the impact of karst on the sensitive and limited groundwater resources on Gotland. Since a large part of the carbonate bedrock surface is barren or covered by thin quaternary deposits the epikarst provides important pathways for the percolation of meteoric water and recharge to the groundwater. It also locally provides guided pathways for surface runoff. Furthermore, the study demonstrates that the presence of karst often is in conjunction with sensitive ecosystems such as temporary wetlands. Extensive development of grikes and limestone pavements also provide conditions for periodically hanging aquifers, which not only promotes groundwater recharge but also the formation of unique habitats for a variety of often threatened ecosystems. This study, which includes both biologists and earth scientists highlights the importance of the identification of catchment areas and mapping of karst. It also emphasises that investigations into the hydrogeology (including aspects such as groundwater recharge, surface runoff and subsurface transport pathways) is essential for a better understanding of wetland dynamics and their protection. The presence of karst and spreading of contaminations in the ground is also discussed. The work summarizes early results from a collaboration between authorities working with Natura 2000 karst habitats and geological classification and mapping of karst.

How to cite: Erlström, M., Dahlqvist, P., Mild, K., Sopher, D., Martinsson, M., Glimskär, A., Jacobson, A., Holgersson, B., Lundberg, F., and Léven, J.: Distribution and characteristics of glaciokarst on the island of Gotland, Baltic Sea - its role on groundwater recharge and sensitive wetland ecosystems, EGU General Assembly 2023, Vienna, Austria, 23–28 Apr 2023, EGU23-5031, https://doi.org/10.5194/egusphere-egu23-5031, 2023.

EGU23-5147 | ECS | Orals | HS8.2.4

A Bayesian multi-model framework for structure selection and parameter estimation for lumped parameter modeling in karst hydrology. 

Vianney Sivelle, Yohann Cousquer, Hervé Jourde, and Naomi Mazzilli

Lumped parameter modeling in karst hydrology has been widely developped in the last decades. Uncertainty in model conceptualization, which often leads to one unique model structure, is frequently neglected. This issue is particularly important for karst hydrology, where hydrological systems are highly heterogenous and information about the structure is difficult to obtain. In this work, we delopped a Bayseian multi-model framework that allows to calibrate simulteanously a set of model structure and associated parameters. This constitutes a significant step forward compared with classical calibration approaches that allow (i) to provides an ensemble of predictions considering both structural and parametric uncertainties, and (ii) to avoid epistemic error due to model structure selection, wich is generally influenced by the subjective conceptualization of the karst hydrological system by the modeler. The methodology is illustred with a Bayesian inference procedure among a large range of lumped parameter model structure considered for the simulation of discharge at fontaine de Vaucluse karst spring (southern France).

How to cite: Sivelle, V., Cousquer, Y., Jourde, H., and Mazzilli, N.: A Bayesian multi-model framework for structure selection and parameter estimation for lumped parameter modeling in karst hydrology., EGU General Assembly 2023, Vienna, Austria, 23–28 Apr 2023, EGU23-5147, https://doi.org/10.5194/egusphere-egu23-5147, 2023.

EGU23-5640 | Orals | HS8.2.4

Degradation and loss of soil in karst terrains 

Umberto Samuele D'Ettorre, Isabella Serena Liso, Luca Pisano, Veronica Zumpano, and Mario Parise

Fragility of karst derive from a variety of reasons, starting from peculiarity of the geological, hydrogeological, and ecological features, and the facility to transform and negatively impact the environment through many anthropogenic activities. This makes karst terrains among the most endangered areas in the world, as repeatedly demonstrated in many karst areas, also with severe impacts on natural resources. Apulia, the southern-east portion of Italy, is an almost entirely karst region, where expansion of the urbanized areas, development of agricultural practices, and lack of awareness of the importance of karst resources over the last decades have determined an acceleration in the degradation of the karst environment. This is quite in contrast with the long history of the region, where past cultures and civilizations were able to live sustainably with the karst environment, without destroying or polluting its precious natural resources, in primis groundwater.

For instance, the agricultural practices marked a very bad time starting from the 1980s, when intense stone clearing (performed with the goal to obtain new land for cultivation) strongly changed the original karst landscape, which was characterized by bare karst, with slightly incised karst valleys and dolines, and a high number of caves. As a result of such an intense conversion of land cover, karst landforms were highly disturbed, many of them were canceled, and surficial erosion and loss of soil had to be often registered on the occasion of the main rainstorms. Alta Murgia, one of the main karst regions of Apulia (also included within the National Natural Park) was particularly affected, and obliteration of many karst features had to be recorded. Furthermore, the extraction activity carried out in quarries, to extract limestone rocks used for building and ornamental purposes, resulted in destruction of karst caves, against the regional laws which prescribed the need in exploring any cave found during quarrying, aimed at ascertaining any likely interest of the underground karst. Overall, these anthropogenic activities caused an high negative impact on the Alta Murgia karst, which only recently has started to become worth of specific studies from the scientific community. Quantification of the loss of soil, and of the karst landforms is not easy, but in some portions of Alta Murgia has definitely been significant.

Within projects dedicated to creating a greater awareness about local populations of the importance of living in karst, and of respecting such a natural landscape which hosts fundamental natural resources, we present in this contribution some examples of preliminary evaluations of the landscape changes observed, and of their negative impacts on karst.


References

Parise M., 2016, Modern resource use and its impact in karst areas – mining and quarrying. Zeitschrift fur Geomorphologie, vol. 60, suppl. X, p. 199-216.

Parise M. & Pascali V., 2003, Surface and subsurface environmental degradation in the karst of Apulia (southern Italy). Environmental Geology, vol. 44, p. 247-256.

Pisano L., Zumpano V., Pepe M., Liso I.S. & Parise M., 2022, Assessing Karst Landscape Degradation: a case study in Southern Italy. Land, vol. 11, 1842.

How to cite: D'Ettorre, U. S., Liso, I. S., Pisano, L., Zumpano, V., and Parise, M.: Degradation and loss of soil in karst terrains, EGU General Assembly 2023, Vienna, Austria, 23–28 Apr 2023, EGU23-5640, https://doi.org/10.5194/egusphere-egu23-5640, 2023.

EGU23-6405 | Posters on site | HS8.2.4

Investigating the hydrological behaviour of the Upper Pivka Valley (Slovenia) 

Cyril Mayaud, Blaž Kogovšek, Metka Petrič, Nataša Ravbar, Matej Blatnik, and Franci Gabrovšek

The Pivka River is a 20 km long stream located 40 km SW from Ljubljana (Slovenia), which disappears in the world famous Postojna Cave. While the river flows permanently on flysch rocks in the valley lower part, water is only present temporarily in the valley upper part due to the karstic nature of the aquifer located below the river. This aquifer is assumed to be linked to the larger Javorniki karst aquifer that belongs to the catchment of the Unica and Malenščica Springs, which drain water from the whole region. During high water period, the regional groundwater level rises up to 50 m, and 17 temporary lakes might appear on the valley surface. Because the hydrological situation in the Javorniki karst aquifer is assumed to affect flooding in the Pivka Valley, the interaction between both need to be understood. A network of nine automatic stations recording water level, specific electrical conductivity and water temperature at a 30 min interval has been progressively established in the valley since 2020. The three years dataset has been analysed with data collected in the water active caves of the Javorniki karst aquifer and at the Unica and Malenščica Springs. Results allowed elaborating a conceptual hydrological model of the region. They emphasized that the karst aquifer below the Upper Pivka Valley acts as an overflow of the Javorniki karst aquifer during high water periods, while it flows back into the Javorniki karst aquifer and further toward the Unica and Malenščica springs during the recession.

How to cite: Mayaud, C., Kogovšek, B., Petrič, M., Ravbar, N., Blatnik, M., and Gabrovšek, F.: Investigating the hydrological behaviour of the Upper Pivka Valley (Slovenia), EGU General Assembly 2023, Vienna, Austria, 23–28 Apr 2023, EGU23-6405, https://doi.org/10.5194/egusphere-egu23-6405, 2023.

It is long known that dissolved aqueous CO2 is the key driving force of chemical reactions leading to rock corrosion, which is denoted as karstification. Accordingly, it is evident that meteoric water percolating through the biologically active vadose zone leads to replenishment of CO2 concentrations in karst water. We performed long-term measurements in a cave that show quick responses of gaseous CO2 concentrations in cave air after rain events.

More importantly, however, our research aims at highlighting a so far by the literature totally ignored process in karst research, which is density-driven dissolution of CO2 at the karst-water table. Our preliminary results indicate that this process can have high significance for hydraulic conditions where water is stagnant or at small convective base velocities (Class et al., 2021).

In our most recent work (Class et al., 2022, submitted), we monitored the influence of seasonally fluctuating gaseous CO2 concentrations in a deep karst cave on aqueous CO2 concentrations in different depths of a stagnant water column. The data indicate that density-driven enhanced dissolution at the karst-water table is the driving force for a fast increase of aqueous CO2 during periods of high gaseous concentrations in the cave, while during periods of lower gaseous concentrations the decline of aqueous CO2 is limited to shallow water depths in the order of 1m. Numerical simulations with a Navier-Stokes model and water density dependent on CO2 concentration can be used to interpret the data and, perspectively, to extrapolate to geologically relevant time scales. This can also include the dissolution of CaCO3, which is likely further increasing the relevance of density-driven dissolution at the karst-water table.

References:
H. Class, P. Bürkle, T. Sauerborn, O. Trötschler, B. Strauch, M. Zimmer: On the role of density-driven dissolution of CO2 in phreatic karst systems, Water Resources Research 57(12), e2021WR030912, 2021, doi:10.1029/2021WR030912

H. Class, L. Keim, L. Schirmer, B. Strauch, K. Wendel, M. Zimmer: Seasonal dynamics of gaseous CO2 concentrations in a karst cave correspond with aqueous concentrations in a stagnant water column, manuscript submitted, December 2022

How to cite: Class, H., Keim, L., Schirmer, L., Strauch, B., Wendel, K., and Zimmer, M.: Dynamics of seasonal CO2 concentrations above and below the karst-water table are influenced by density-driven transport: monitoring data from a cave in the Swabian Jura and interpretation with numerical simulation models, EGU General Assembly 2023, Vienna, Austria, 23–28 Apr 2023, EGU23-6413, https://doi.org/10.5194/egusphere-egu23-6413, 2023.

EGU23-8112 | ECS | Orals | HS8.2.4

Hydrological control on cave ventilation and its effect on the heat balance of Longeaigue cave 

Claudio Pastore, Marc Luetscher, Frédéric Doumenc, Amir Sedaghatkish, Eric Weber, and Pierre-Yves Jeannin

The network of fractures and conduits crossing a karst massif drains water and air from the atmosphere deep into the massif, exchanging heat at the boundaries between rock, air and water. The thermal characteristic of the rock together with thermal processes including convection, evapo-condensation, radiation and conduction, concur to fix the cave’s temperature. The thermal length, the distance at which the external temperature fluctuations are damped, and the energy balance of the cave system depend on its geometry and the fluxes therein. Comprehensive knowledge of what modifies these thermal characteristics is of interest for e.g. low-enthalpy geothermal exploitation, mineralisation in water supplies and also for paleoclimatic studies on speleothems.

In Longeaigue cave (Val-de-Travers, Jura mountains, CH), we deployed several sensors measuring airflow and temperature along the main conduit network. The cave is mainly dry and has a lower and upper entrance leading to an intense airflow controlled by the chimney effect. The temperature oscillations observed throughout the cave are chiefly related to external temperature and airflow variations. Results from 8 monitoring stations reveal that 90% of the energy brought in by the air during ventilated periods is exchanged within the first tens of meters from the cave entrances. However, temporary interruptions of the airflow occur during periods of flooding related to rainfall and snowmelt. This situation can take place several times per year. Our observations demonstrate that the transient nature of this airflow modifies the temperature signals in the cave, affecting the cave energy balance in a differentiated way according to seasonal hydrological conditions. With the increasing winter temperatures, we anticipate a progressive shift towards a summer ventilation regime enhanced by limited summer rainfall. A positive feedback is observed on the energy balance of the cave. It is therefore of crucial importance to consider the presence of subsurface ventilation for the thermal characterisation of karstic environments, which can modify the biochemical, physical and thermal characteristics of seeping water and, in turn, impact on the interaction with the encasing rock.

How to cite: Pastore, C., Luetscher, M., Doumenc, F., Sedaghatkish, A., Weber, E., and Jeannin, P.-Y.: Hydrological control on cave ventilation and its effect on the heat balance of Longeaigue cave, EGU General Assembly 2023, Vienna, Austria, 23–28 Apr 2023, EGU23-8112, https://doi.org/10.5194/egusphere-egu23-8112, 2023.

EGU23-12285 | Orals | HS8.2.4 | Highlight

Impact of climate change on groundwater level dynamics and karst spring discharge of several karst systems in the Mediterranean area 

Guillaume Cinkus, Vianney Sivelle, Hervé Jourde, Naomi Mazzilli, Yves Tramblay, Bartolomé Andreo, Juan Antonio Barberá, Rachida Bouhlila, Joanna Doummar, Jaime Fernández-Ortega, Emna Gargouri-Ellouze, Valeria Lorenzi, Marco Petitta, Nataša Ravbar, Fairouz Slama, and Nico Goldscheider

Anthropogenic activities and climate change exert significant pressures on the quality and availability of water resources in karst environments, which supply drinking water to about 9.2% of the world's population. Increasing temperatures and changes in precipitation regimes will strongly impact water recharge processes. Understanding the karst hydrodynamic behaviour in the present context of climate change constitutes a major challenge for a sustainable management of karst groundwater. This study focuses on the Mediterranean area, where up to 90% of the drinking water supply depends on carbonate aquifers. The spring discharge and/or water level of six karst systems in the Mediterranean area (France, Italy, Lebanon, Slovenia, Spain and Tunisia) are simulated using precipitation-discharge reservoir modelling tools. The studied karst systems are well known and have different characteristics in terms of climatic conditions, hydrogeological properties and available data. Using different model structures, the hydrological models are first calibrated and validated over a historical period and then used to simulate spring discharge time series under various climate projections (up to 2100). To account for uncertainties in climate projection, 12 coupled GCM/RCM climate models are considered with two emission scenarios (RCP 4.5 and RCP 8.5) proposed in the framework of the CMIP5 initiative. The analysis of the forecasted spring discharge and water level time series focuses on (i) the long-term trends in the hydrological functioning of karst systems, (ii) the effects of climate change on spring discharges (intensity and duration of extreme events), and (iii) the study of uncertainties related to the exceedance of the known functioning ranges of the systems. Further discussion is also dedicated to model uncertainties in relation to model parameters and structure, climate models, and the estimation of potential evapotranspiration in future climate. This research has been conducted within the KARMA (Karst Aquifer Resources availability and quality in the Mediterranean Area) project into the PRIMA (Partnership for Research and Innovation in the Mediterranean Area) EU program.

How to cite: Cinkus, G., Sivelle, V., Jourde, H., Mazzilli, N., Tramblay, Y., Andreo, B., Barberá, J. A., Bouhlila, R., Doummar, J., Fernández-Ortega, J., Gargouri-Ellouze, E., Lorenzi, V., Petitta, M., Ravbar, N., Slama, F., and Goldscheider, N.: Impact of climate change on groundwater level dynamics and karst spring discharge of several karst systems in the Mediterranean area, EGU General Assembly 2023, Vienna, Austria, 23–28 Apr 2023, EGU23-12285, https://doi.org/10.5194/egusphere-egu23-12285, 2023.

EGU23-12506 | ECS | Orals | HS8.2.4

The role of seasonal variation of precipitation/recharge for different climates in karst genesis behaviors 

Chuanyin Jiang, Hervé Jourde, and Xiaoguang Wang

Recharge is an important factor controlling dissolution processes during speleogenesis of karst aquifers. In former studies simplified assumptions were considered, where a maximum recharge rate is assumed while its fluctuation is ignored. Under the latter assumption, the karst genesis is clearly divided into two successive processes characterized by either a hydraulic head limitation (hydraulic control) or a flow rate limitation (catchment control). In this study, we consider a karst system evolving according to a maximum recharge rate linked to the seasonal variation of precipitation, which may lead to speleogenesis processes under hydraulic control or catchment control from the beginning of the karst genesis. We found that, without considering the recharge fluctuation, the enlargement of fractures as well as the dimensions of dissolving area under a long-term evolution tends to be underestimated. Moreover, in the cases of a large catchment area, the time required to reach the final dissolution patterns tends to be underestimated (i.e., earlier breakthrough), while it tends to be overestimated in the cases of a small catchment area. In addition, the flow focusing during the karst genesis may be interrupted during dry seasons when the recharge regime is under catchment control. This may cause a stagnation in the evolution of flow channeling or even a less localized flow field. This study highlights the importance of recharge fluctuation in modeling karst genesis, which may have important engineering implications for the management of karst aquifers or the leakage risk prediction at dam sites.

How to cite: Jiang, C., Jourde, H., and Wang, X.: The role of seasonal variation of precipitation/recharge for different climates in karst genesis behaviors, EGU General Assembly 2023, Vienna, Austria, 23–28 Apr 2023, EGU23-12506, https://doi.org/10.5194/egusphere-egu23-12506, 2023.

EGU23-12574 | ECS | Posters on site | HS8.2.4

Multi-disciplinary approach for assessing the impact of a flood event in a shallow karst cavity (Pindal Cave, Spain) 

Tamara Martin-Pozas, Soledad Cuezva, Fernández-Cortés Ángel, María González-Pumariega, Elsa Duarte, Marco de la Rasilla, Juan Carlos Cañaveras, David Benavente, Cesáreo Sáiz-Jiménez, and Sergio Sánchez-Moral

Pindal Cave (Asturias, Spain) and its Paleolithic art have been part of the UNESCO World Heritage List since 2008. The importance of this Paleolithic art led to a research project that deals with deciphering the relationships between environmental conditions and microbial activity in natural underground ecosystems and its application to the design of conservation strategies.

The Pindal karstic system develops in a calcareous massif (Carboniferous) modeled in the form of an erosional marine terrace (rasa) by coastal morphogenetic processes. This marine terrace level is located at an elevation of 30-68 meters above current sea level and constitutes the preferred catchment area for runoff water from another higher level (140-170 m) developed on quartzite layers with very low permeability (Ordovician). The cave is the main endokarstic feature of the system. On the surface of the 30-68 m rasa there are numerous exokarstic structures of sinkhole and polje type. On one of the sinkholes, located almost vertically to the cave, a cattle farm was installed in 1995.

Between October 19 and 23, 2019, an extreme episode of rainfall occurred in the area with a cumulative total of 209 l/m2. This event caused a strong accumulation of water in the aforementioned sinkhole that finally collapsed, flooding the cave for several days. Immediately after the cave had been drained, environmental measurements and sediment samplings were carried out at various points in order to determine the changes caused in the underground ecosystem. In the most affected area by the flood, changes in humidity and temperature of air and sediments were recorded for several months. Biogeochemical data indicated that the sediments deposited as a result of the flooding presented high values of available organic matter, nitrogen, phosphorus and potassium, much higher than those of the innermost areas did not directly affect by the flooding. The comparative microbiological study of sediment samples revealed that the flood produced very significant changes in the microbial composition of sediments: the appearance of the bacterial phyla Bacillota and Bacteroidota, including groups of opportunistic bacterial pathogens (Corynebacterium, Thauera, Clostridiales) and the almost complete disappearance of Rokubacteriales and Nitrospirota. Bacillota and Bacteroidota are common in the intestinal tract of mammals and are dominant in liquid and solid samples of manure from dairy farms. Overall, the results conclude that the sediments dragged into the cave were accompanied by residues from livestock farming and indicate the high degree of vulnerability of this type of cave. Although livestock activity finally ceased in 2021, we continue analyzing environmental parameters, waters, sediments and microbial populations to evaluate their evolution in the medium-long term.

Research funded by PID2019-110603RB-I00 – SUBSYST project and PID2020-114978GB-I00

How to cite: Martin-Pozas, T., Cuezva, S., Ángel, F.-C., González-Pumariega, M., Duarte, E., de la Rasilla, M., Cañaveras, J. C., Benavente, D., Sáiz-Jiménez, C., and Sánchez-Moral, S.: Multi-disciplinary approach for assessing the impact of a flood event in a shallow karst cavity (Pindal Cave, Spain), EGU General Assembly 2023, Vienna, Austria, 23–28 Apr 2023, EGU23-12574, https://doi.org/10.5194/egusphere-egu23-12574, 2023.

EGU23-12875 | ECS | Posters on site | HS8.2.4

Coupled CFD-DEM Modelling of subsidence and canyon formation in an evaporite karst system 

Djamil Al-Halbouni, Lars Ruepke, Monica Giona Bucci, Torsten Dahm, and Aaron Micallef

Surface stream-channels and subsurface conduits form the connecting interface between on- and offshore groundwater in the coastal transition zone. Rapid canyon formation occurs due to erosion and dissolution of material rapid retrogressive growth, slope failure, and subsidence, thus posing important geohazards in coastal areas.

We here focus on the formation of canyon systems with theatre shaped heads as found along the Dead Sea. Underlying their recent development is a dynamic evaporite karst system fed by channelized groundwater flow with subrosion processes and subsequent discharge into the lake. We use a 3D hydromechanical modelling approach to derive information on the hydromechanics and feedback between changing fluid pathways, deformation and the formation of stream-channel morphologies under varying conditions. We use a hydrogeological setup consisting of (A) a layered alluvial fan system alternating between mechanically weak, salt/rich clay-silt material and mechanically stronger, compound alluvial sandy-gravel sediments, (B) a pronounced lateral border between the former Dead Sea lakebed and the alluvial fans, (C) a Darcy-flow type fresh-water inflow through tubes at different depths and (D) a natural hydraulic gradient of 30 m/km. We hereby couple simple computational fluid dynamics with distinct elements to simulate subrosion processes as observed for the Dead Sea shore.

We found that the shape of the canyon, and particularly the morphology of canyon heads, is (1) intrinsically linked to the geologic material conditions, i.e. the stratigraphy of the subsurface, (2) the nature (3D tube network) of the karst system and (3) the hydraulic gradient conditions. This study hence gives further insight into the role of the hydromechanical conditions that drive the formation of canyons and subsidence in unconsolidated material and shows the applicability of this approach to derive morphometrics in similar coastal environments.

How to cite: Al-Halbouni, D., Ruepke, L., Giona Bucci, M., Dahm, T., and Micallef, A.: Coupled CFD-DEM Modelling of subsidence and canyon formation in an evaporite karst system, EGU General Assembly 2023, Vienna, Austria, 23–28 Apr 2023, EGU23-12875, https://doi.org/10.5194/egusphere-egu23-12875, 2023.

EGU23-12938 | ECS | Orals | HS8.2.4

Solute transport experiments and modelling in terminal conduit of karst hydrosystems, Southern France 

Mohammed Aliouache, Pierre Fischer, Pascal Brunet, Lionel Lapierre, Benoit Ropas, Frank Vasseur, and Hervé Jourde

In the community working on karst hydrosystems, the needs for subsurface solute and contaminant transport characterization is widely acknowledge.  In former studies, several researchers addressed these needs with different approaches such as laboratory experiments, field tests, and groundwater flow and transport simulations. The main objective of such approaches is to improve knowledge of transport processes in karst hydrosystems, and propose solutions to limit the downstream hydrogeological risks (contamination of water resources). In this study, we performed a solute transport experiment in different karst aquifers, in the terminal karst conduit near the spring. We injected a dye in the karst conduit and we monitored the restitution of the tracer at three different zones downstream. In each zone, five probes were placed at different locations (middle, up, down, left and right parts of the cave) along the cross-section of the karst conduit.

Experimental data allowed to reconstruct a transient spatial distribution of concentration for each zone and a general evolution of solute plume. It also provided information about dye mixing along the karst conduit. As a next step, these results are compared to simulated results to investigate the effect of karst conduit geometry, turbulent flow and velocity profiles on concentration profiles, mixing processes and the evolution of solute plume along the conduit. Preliminary results showed that the consideration of the complex karst conduit geometry and morphology has an important effect on transport processes, with a behavior notceably different from the one obtained with numerical simulations on simplified karst conduit geometries.

How to cite: Aliouache, M., Fischer, P., Brunet, P., Lapierre, L., Ropas, B., Vasseur, F., and Jourde, H.: Solute transport experiments and modelling in terminal conduit of karst hydrosystems, Southern France, EGU General Assembly 2023, Vienna, Austria, 23–28 Apr 2023, EGU23-12938, https://doi.org/10.5194/egusphere-egu23-12938, 2023.

EGU23-12973 | ECS | Orals | HS8.2.4

Seasonal pressurization of a coastal karst: the paleolithic decorated Cosquer cave (SE France) 

Pellet Hugo, Henry Pierre, Arfib Bruno, and Touron Stéphanie

The Cosquer cave is a paleolithic decorated cave, in a coastal karst linked to the sea. Stability of climatic parameters in caves is known to be one main condition for conservation of art. Hydroclimate data are measured since several years at a 5 minutes time step: karst air pressure, water level in the karst, atmospheric pressure and sea level. Data shows an unusual behaviour for a karst: the karst air pressure is nearly always higher than the atmospheric pressure. As a result, water level in the karst is below the sea level. Some rock art figures present on walls near water level undergo wash out and fading but limited thanks to the karst pressurization. A stop of this mechanism due to rising sea-level, an increase of the massif permeability or changes in climatic conditions would lead to the loss of arts near water bodies.

The cave air overpressure is related to the rock permeability that should be low. The pressure time series show that three main processes drive the cave pressure. The daily variations of the sea tide provide an assessment of the cave air volume above the pools water level. Although the cave air is confined by the rock and the seawater, there are external air inflows during short pressurization events, that can be deduced from pressure data. Then, the low cave air pressure decrease over the summer season is explained by air outflow through the rock. A bulk permeability is then calculated using Darcy law, assuming a gas permeability in a non-saturated medium. Three theoretical cases are evaluated: an equivalent porous medium, a single fracture, and a single karst conduit. The time series give an observation database to assess future changes in the pressure behaviour of this decorated paleolithic cave, and to detect water level increase and adjust conservation choices.

How to cite: Hugo, P., Pierre, H., Bruno, A., and Stéphanie, T.: Seasonal pressurization of a coastal karst: the paleolithic decorated Cosquer cave (SE France), EGU General Assembly 2023, Vienna, Austria, 23–28 Apr 2023, EGU23-12973, https://doi.org/10.5194/egusphere-egu23-12973, 2023.

EGU23-13275 | Posters on site | HS8.2.4 | Highlight

Model-based assessment of dynamic volume estimates for karst aquifers 

Steffen Birk and Mahmoud Abirifard

Karst springs frequently drain large catchment areas and thus represent important water resources. Adequate management of karst water resources requires quantitative information about the drainable water volume, i.e., the dynamic volume of the karst aquifer supplying the spring. The mathematical integration of a functional relationship fitted to the observed discharge recession curve is one approach commonly employed for this purpose. Yet, this approach implicitly assumes that the observed recession behavior can be extrapolated to longer times and lower discharge values. Here, we explore the adequacy of this approach using the numerical karst groundwater flow model MODFLOW-CFP to simulate the discharge recession of hypothetical karst aquifers. While the model scenarios represent simplified hydrogeological settings, each of them includes complexities that may be encountered in real karst aquifers. By comparing the actual dynamic volume of the modelled aquifer to the volume estimate obtained from recession analysis, we identify factors potentially affecting the accuracy of the dynamic volume estimate (Abirifard et al., J. Hydrol., 2022, https://doi.org/10.1016/j.jhydrol.2022.128286 ). It is found, for example, that a decrease of hydraulic conductivity with depth causes underestimation of the dynamic volume, whereas groundwater abstraction within the spring catchment results in an overestimation. Real-world examples where these factors likely affect the recession behavior and thus the dynamic volume estimate are identified and described.

How to cite: Birk, S. and Abirifard, M.: Model-based assessment of dynamic volume estimates for karst aquifers, EGU General Assembly 2023, Vienna, Austria, 23–28 Apr 2023, EGU23-13275, https://doi.org/10.5194/egusphere-egu23-13275, 2023.

EGU23-13530 | ECS | Posters on site | HS8.2.4

Dynamics of sinkhole and uvala development on the eastern shore of the Dead Sea, 1980-2022 

Hanna Z. Schulten, Robert A. Watson, Djamil Al-Halbouni, Osama Al-Rabayah Al-Rabayah, Fayez Abdulla, and Eoghan P. Holohan

The Dead Sea is a hypersaline terminal lake whose level has been declining due to anthropogenic stresses since the 1960s. At its eastern shore, near Ghor-Al-Haditha in Jordan, over 1200 collapse sinkholes have been mapped roughly parallel to the shoreline from the 1980s until 2017. This mapping also documented five larger karstic depressions (uvalas), that formed in close spatial-temporal association with the sinkholes, and demonstrated that sinkhole and uvala formation during this period has migrated laterally, both in the direction of shoreline retreat (from east to west) and parallel with the shoreline from south to north.

Here, we use new, high-resolution optical satellite imagery from the Pleiades and PNEO satellites, to show that over 500 new sinkholes have formed between 2018-2022. Furthermore, three new uvalas have developed to the north in accordance with the appearance of the sinkholes. Our study indicates quantitatively that the coalescence of sinkholes to form larger compound sinkholes is a subsequent stage of uvala development. New mapping confirms a previously established link between sinkhole size distribution and the mechanical properties of the sedimentary materials in which they form, with holes formed in salt-dominated morphologies being smaller in diameter than those in alluvium and lacustrine mudflats. Initial comparison to local meteorological records has shown that a temporal link between periods of high rainfall and enhanced sinkhole formation is not readily apparent at the resolution of the sinkhole mapping. Moreover, as previous studies had hypothesized, growth of the sinkhole population and the uvalas continues towards the north and is diminished to the south. Our results help to inform hazard monitoring and mitigation strategies at Ghor Al-Haditha: for example, presently growing areas of surface depressions are within 130 meters of a 700-meter-long stretch of the western main highway connecting the north and south of Jordan. Therefore, we suggest that infrastructure such as the highway continue to be monitored in light of the observed subsidence.

How to cite: Schulten, H. Z., Watson, R. A., Al-Halbouni, D., Al-Rabayah, O. A.-R., Abdulla, F., and Holohan, E. P.: Dynamics of sinkhole and uvala development on the eastern shore of the Dead Sea, 1980-2022, EGU General Assembly 2023, Vienna, Austria, 23–28 Apr 2023, EGU23-13530, https://doi.org/10.5194/egusphere-egu23-13530, 2023.

EGU23-13664 | ECS | Posters on site | HS8.2.4

Indicator Kriging approach for the assessment of groundwater nitrate pollution in the Salento aquifer (Southern Italy) 

Gaetano Daniele Fiorese, Maria Rosaria Alfio, and Gabriella Balacco

Groundwater, being the largest distributed freshwater supply, plays a central role in sustaining ecosystems and enabling human adaptation to climate change. The strategic importance of freshwater for global water and food security will intensify as the frequency of extreme weather events such as floods and droughts events. Many aquifers are severely stressed due to unsustainable management of the water resource that compromises its quantity and quality.

Today, nitrate pollution is the most common form of groundwater contamination worldwide. Many Mediterranean regions present worrying concentrations of nitrate in groundwater and are consequently one of the most polluted territories across the world. Nitrate monitoring is fundamental since excessive concentrations in water resources may affect the quality of crops and causes several human health disorders. For this purpose, this study aimed to deal with the evolution in space and time of nitrate concentrations in the coastal karst aquifer of Salento (Puglia, Southern Italy), whose water demand for drinking and irrigation purposes relies on groundwater. The intrinsic vulnerability of this territory is critical due to its complex geomorphological and structural characteristics, the presence of saltwater beneath freshwater, intensive exploitation, and climate change.

Several different chemical surveys from 1995 to 2021 were organized into two-time datasets to focus on the spatio-temporal evolution of nitrate concentrations. The geostatistical Indicator Kriging (IK) method was used for this purpose. This is a spatial interpolation technique aimed at estimating the conditional cumulative distribution function of a variable at an unsampled location. Indicator Kriging analyses were performed for a direct estimation of the local conditional probabilities of nitrate concentrations for the two reference periods using sampled available wells. Probability maps representing the spatial distribution of water quality have been obtained as result. Results highlight a critical situation in terms of nitrate pollution, as most of the territory has experienced an increase over the past 25 years, progressively affecting large areas.

How to cite: Fiorese, G. D., Alfio, M. R., and Balacco, G.: Indicator Kriging approach for the assessment of groundwater nitrate pollution in the Salento aquifer (Southern Italy), EGU General Assembly 2023, Vienna, Austria, 23–28 Apr 2023, EGU23-13664, https://doi.org/10.5194/egusphere-egu23-13664, 2023.

EGU23-14082 | ECS | Posters on site | HS8.2.4

A method to determine the dissolution and erosion rates of marly gypsum samples from Ripon, UK 

Gabriella Williams, Elisabeth Bowman, Domenico Bau, and Vanessa Banks

Ripon is a town affected by frequent collapse sinkholes that occur due to the rapid dissolution of the underlying gypsum. This gypsum is interbedded and mixed with low solubility but easily water weakened calcareous marl. Construction sites underlain by cavities can be remediated, but if even small flow paths remain, new cavities can appear in close proximity. Dissolution rates previously determined for gypsum have either been on high purity specimens or do not consider the insoluble impurities. It is therefore important to understand the role of interbedded calcareous marls in controlling cavity distribution and growth. A method is proposed to evaluate the effect of marl impurity on gypsum dissolution rates in this area.

For the dissolution test, water is circulated through a hole drilled in a gypsum specimen from Ripon. As the gypsum dissolves, the marl could detach and settle, become suspended or also dissolve. If it remains attached, however, it could impede further gypsum dissolution. Conductivity, total dissolved solids (TDS) and pH of the water are monitored and the test continues until the conductivity has stabilised. This indicates that the water is saturated with gypsum and dissolution has ceased. The water is then evaporated to recover suspended solids, which are put through particle size distribution (PSD) sieves. The post-test specimen mass is added to the recovered solid mass and compared to the pre-test mass.

After testing, mass loss is estimated from both conductivity and TDS curves, and these are compared to measured mass loss. Changes in pH are taken to indicate dissolution of calcareous components in the marl. The conductivity curve is used to find the dissolution rate constant of the specimen, and its cross-section is visually inspected to check the dissolution pattern. The PSD is used to study transport and deposition of insoluble material. Results are combined to assess the influence of marl on gypsum dissolution and sinkhole development, which can be applied both in Ripon and elsewhere.

How to cite: Williams, G., Bowman, E., Bau, D., and Banks, V.: A method to determine the dissolution and erosion rates of marly gypsum samples from Ripon, UK, EGU General Assembly 2023, Vienna, Austria, 23–28 Apr 2023, EGU23-14082, https://doi.org/10.5194/egusphere-egu23-14082, 2023.

EGU23-321 | Posters on site | HS8.2.6

Coastal Groundwater Discharge Simulations/Models for Mobile Bay 

John Richins, Kevin Befus, and Kirk Rodgers

Terrestrial groundwater discharges to coastal drainage networks as baseflow and to coastal waters as fresh submarine groundwater discharge. If groundwater discharge comprises a large portion of inflow or has a different composition than the receiving waters, these groundwater fluxes can strongly influence the water quality of coastal waters. However, the spatial distribution of such fluxes makes quantifying the net effect of groundwater discharge difficult with field data. Furthermore, future climate conditions may change how groundwater interacts with surface water through changes in precipitation, evapotranspiration, and sea level. Mobile Bay is at the nexus of anthropogenic-driven sea level rise and water quality issues, making it an ideal study location. Therefore, we are developing and calibrating MODFLOW-based groundwater flow models using scripted workflows within the Python programming language and the FloPy library to investigate three questions: 1) How much groundwater discharge occurs, 2) where does the groundwater discharge occur, and 3) how do environmental variations associated with climate change affect the location and volume of groundwater discharge to Mobile Bay. By answering these three questions, we will provide valuable knowledge regarding variations in the magnitude and location of coastal groundwater discharge due to possible environmental changes.

How to cite: Richins, J., Befus, K., and Rodgers, K.: Coastal Groundwater Discharge Simulations/Models for Mobile Bay, EGU General Assembly 2023, Vienna, Austria, 23–28 Apr 2023, EGU23-321, https://doi.org/10.5194/egusphere-egu23-321, 2023.

EGU23-1372 | ECS | Posters on site | HS8.2.6

Estimating Freshwater Lens Volume based on Island Circularity 

Lena Thissen, Janek Greskowiak, and Gudrun Massmann

Freshwater lenses (FWLs) are an important source of drinking water on many islands in the world. Thus, it is important to study their volumes. Many case studies have already been carried out on real world islands to approximate the FWL volume of the respective islands. Also, generic studies on FWLs exist that consider idealised island shapes such as circular or strip islands. However, to the authors’ knowledge there is no study so far that describes the general relationship between the island’s shape and the freshwater volume of its lens. Here we show that there is a relationship between these two quantities. In our approach, we characterized the shape of the islands using a circularity parameter; the volume was approximated using this shape and a simple numerical steady-state Ghyben-Herzberg approach. While we found a strong relationship between island shape and FWL volume, the relationship between the island shape and the depth of the FWL was less clear. The findings of this study can help to estimate the FWL volume on islands for which there are no case studies available.

How to cite: Thissen, L., Greskowiak, J., and Massmann, G.: Estimating Freshwater Lens Volume based on Island Circularity, EGU General Assembly 2023, Vienna, Austria, 23–28 Apr 2023, EGU23-1372, https://doi.org/10.5194/egusphere-egu23-1372, 2023.

EGU23-1392 | ECS | Posters on site | HS8.2.6

Hydrogeochemical modelling of water-sediment interactions during infiltration of monovalent-partial desalinated water into different dune sediments 

Mareike Schloo, Laura Braeunig, Victoria Burke, Janek Greskowiak, and Gudrun Massmann

The salinization of groundwater due to saltwater intrusion in coastal regions requires efficient mitigation strategies, e.g., the infiltration of desalinated water via Managed Aquifer Recharge, such as ponded infiltration or injection wells, to ensure the supply of drinking water. It has been shown that the infiltration of desalinated water into an aquifer may result in a series of deteriorating chemical reactions. To counteract this problem, the goal of the cooperative project “innovatION” is to develop a new desalination membrane, which aims to reduce mainly monovalent ions only to achieve a more sustainable and efficient desalination technology.

To give an outlook on possible water-sediment interactions during the infiltration of monovalent desalinated water into aquifers, column experiments were realised using different dune sediments from the Island of Langeoog, North-West Germany. The experimental data suggest cation exchange and calcite dissolution as the main processes occurring (compare abstract Braeunig et al.). For a process-based quantitative description and analysis of all relevant processes and their interactions, PHREEQC models were created for the individual experiments. The models support the experimental data and the hypothesized reaction network, and even allowed for the identification of  reactions (e.g. cation exchange and calcite dissolution), as well as their impact on the overall system behaviour.

How to cite: Schloo, M., Braeunig, L., Burke, V., Greskowiak, J., and Massmann, G.: Hydrogeochemical modelling of water-sediment interactions during infiltration of monovalent-partial desalinated water into different dune sediments, EGU General Assembly 2023, Vienna, Austria, 23–28 Apr 2023, EGU23-1392, https://doi.org/10.5194/egusphere-egu23-1392, 2023.

Abstract: Seawater Intrusion (SWI) and Submarine Groundwater Discharge (SGD) are two opposite natural processes which plays significant role in sustainable management of coastal groundwater resources. Thus site specific investigation is necessary to comprehensively evaluate the timing and magnitude of SWI and SGD along water stressed coastal regions. The present study attempts to locate the potential SWI and SGD zones along the central Odisha coast which is experiencing water stress due to overexploitation, groundwater salinization as well as fresh groundwater loss through natural discharge. In this study groundwater level fluctuations along the coastal tract (below or above to mean sea level) and sea surface temperature anomalies (thermal contrast in sea water through LANDSAT -8 TIR imagery) were used as holistic approach to draw inferences about probable SWI and SGD sites before our field investigations. Further during post monsoon 2021 a total number of 93 water samples (34 pore water, 34 sea water and 25 groundwater) were collected along ∼145 km stretch coastline of Odisha state. The in-situ physicochemical parameters of pore water and sea water (pH, EC, TDS, salinity and temperature) were measured at every 1km gap along the coastline except the inaccessible sites using HANNA made portable multi-parameter water quality kit. The physicochemical anomalies observed in water samples were used as evidences for our initial holistic approach to identify SWI and SGD zones. The EC of groundwater sample varied from 99 to 6440 μS/cm with Mean±SD of 1238.6±1668.5, the EC of porewater varied from 8.25 to 44.47 mS/cm with Mean±SD of 39.0±7.4 and the salinity of porewater varied from 4.59 to 28.89 ppt with Mean±SD of 24.97±4.95. Groundwater samples with EC > 3000 μS/cm were considered as potential SWI zones and porewater samples with salinity < 25 ppt and EC < 35 mS/cm were considered as suspected SGD zones. A total number of 3 SWI zones and 6 SGD zones were identified in present work and this preliminary study will act as a baseline for detailed investigation of groundwater-seawater interaction process along the coast.

Keywords: Groundwater level fluctuation, Sea surface temperature, Pore water, Seawater Intrusion, Submarine Groundwater Discharge

How to cite: Nayak, S. K. and Raju, N. J.: A multi approach study of Groundwater level fluctuation, Sea surface temperature anomaly and Physicochemical parameters to assess Seawater Intrusion and Submarine Groundwater Discharge along Odisha coast, India., EGU General Assembly 2023, Vienna, Austria, 23–28 Apr 2023, EGU23-1849, https://doi.org/10.5194/egusphere-egu23-1849, 2023.

EGU23-1962 | Orals | HS8.2.6

Groundwater flow impacts on microbial communities and biogeochemistry in seafloor pockmarks 

Lotta Purkamo, Cátia M. Ehlert von Ahn, Tom Jilbert, Muhammad Muniruzzaman, Annette Kock, Herrman Bange, Anna Jenner, Michael E. Böttcher, and Joonas Virtasalo

Biogeochemical processes and microbial community structure were investigated in sediment cores from three pockmarks in Hanko, Finland, in the northern Baltic Sea, and compared to groundwater and seawater measurements. Three studied pockmarks varied with the rate of submarine groundwater discharge (SGD). Based on e.g., chloride and DIC concentrations from sediment porewaters, pockmark D had the strongest groundwater influence, while in pockmark E SGD had ceased and therefore this pockmark resembled typical Baltic Sea water and sediment. The pockmark B was the intermediate representative of SGD. The inactive pockmark E had orders of magnitude higher methane concentrations compared to the active pockmarks, but interestingly, this did not reflect on the copy numbers of methanogenesis marker gene (mcrA) results, as pockmark B had equal methanogenesis gene pool as the pockmark E. Sulfate reducer numbers measured with dsrB marker gene was highest in pockmark E sample but also many orders of magnitude higher in other pockmark sediments compared to seawater and groundwater, where the sulfate reducer numbers were only negligible. Reactive transport modeling (RTM) established that the porewater systems in pockmarks D and B were dominated by groundwater advection pushing reactants for biogeochemical reaction into a narrow zone at sediment surface. The advection reduced the organic matter accumulation which results in absence of sulfate-methane transition zone in these pockmarks and concentrates the microbial activity to these habitats. Microbial community structure revealed with phylogenetic marker gene amplicon sequencing reflects the groundwater in active pockmarks, as notable populations of ammonia-oxidizing archaea and nitrifying bacteria in pockmarks are mainly originating from groundwater. RTM also estimated low rates of sulfate consumption and low rates of methane, ammonium and DIC in the active pockmarks.

How to cite: Purkamo, L., von Ahn, C. M. E., Jilbert, T., Muniruzzaman, M., Kock, A., Bange, H., Jenner, A., Böttcher, M. E., and Virtasalo, J.: Groundwater flow impacts on microbial communities and biogeochemistry in seafloor pockmarks, EGU General Assembly 2023, Vienna, Austria, 23–28 Apr 2023, EGU23-1962, https://doi.org/10.5194/egusphere-egu23-1962, 2023.

EGU23-2160 | ECS | Posters on site | HS8.2.6

Occurrence of offshore freshened groundwater in the Pearl River Estuary and adjacent continental shelf 

Chong Sheng, Jiu Jimmy Jiao, Xin Luo, Jinchao Zuo, Lei Jia, and Jinhe Cao

The ~100 ka Milankovitch cycles during the Quaternary generated a significant sea level fluctuation with the lowest sea level of 120 m below the present level at the Last Glacial Maximum in the coastal areas. The large-river deltaic estuaries (LDEs), due to the proximity to sea environments, therefore, may archive the periodical transgression and regression information. During delta-front progradation, the sedimentation process is usually dominated by coarse-grained fluvial deposits, and the river networks extend further to the sea, whereas during marine transgressions, fine-grained marine sediments dominated by clay and silt are deposited. From a hydrogeological perspective, this geologic scenario leads to the formation of multi-layered aquifer-aquitard systems in current continental shelves. Therefore, we hypothesize that the offshore freshened groundwater (OFG) may be widely distributed in the LDEs and their adjacent continental shelves.

Pearl River is the second largest river in China in terms of water discharge, and the accompanying subaqueous paleo delta extends to the slope at the northern margin of the South China Sea with an offshore distance of 200 km. To address the key scientific issues raised in OFG of the LDEs and their adjacent shelves, we have studied the offshore hydrogeology, marine seismic profiles, and porewater hydrogeochemistry in the subaqueous paleo-delta and adjacent shelf of the Pearl River. A total of 31 offshore boreholes with high-resolution porewater geochemistry profiles have been obtained in this area. These boreholes have led to an identification of a large and unexpected OFG with a volume of ~523.3×10⁹ m3, with the freshwater (salinity < 1 PSU) extending as far as 55 km offshore. The total OFG volume is twice of the annual discharge of the Pearl River. The distribution of the OFG is closely related to the morphology of the subaqueous paleo-delta of the Pearl River, where the buried paleochannel system is widely distributed. The values of δ2H and δ18O together with the chlorinity of the OFG in the Pearl River Estuary and adjacent shelf clearly reveal its meteoric origins. Besides, the systematic analysis of water quality indices including major ions, nutrients, heavy metals, and trace elements indicates that the OFG can be used as potable water with minor treatment or raw water source for effective desalination. Hotspots of OFG in the LDEs and their adjacent shelves, likely a global phenomenon, have a great potential for useful water resources for highly urbanized coastal areas suffering from water shortage.

How to cite: Sheng, C., Jiao, J. J., Luo, X., Zuo, J., Jia, L., and Cao, J.: Occurrence of offshore freshened groundwater in the Pearl River Estuary and adjacent continental shelf, EGU General Assembly 2023, Vienna, Austria, 23–28 Apr 2023, EGU23-2160, https://doi.org/10.5194/egusphere-egu23-2160, 2023.

EGU23-2163 | Orals | HS8.2.6

Submarine groundwater discharge strengthens acidification in the coastal areas 

Yi Liu, Yurong Song, and Jiu Jimmy Jiao

Coastal ocean acidification is a worldwide marine problem. In this study, a close relationship between submarine groundwater discharge (SGD) and coastal ocean acidification rate in Hong Kong’s coastal waters is discovered. We for the first time evaluated the direct influence of SGD on seawater pH decline. Results show that SGD can contribute to up to 45% of seawater pH decline through direct input of carbonate species. Local air-sea CO2 exchange has negligible influences on the seawater pH, but the uptake of air CO2 can alter open ocean pH and indirectly alter coastal seawater pH by bay-open ocean water exchange. Aerobic respiration is the major contributor to the seawater pH decline in most coastal waters, in which SGD plays a significant role as the major nutrient source. The findings highlight the importance of the investigation and management of groundwater to alleviate the fast coastal ocean acidification.

How to cite: Liu, Y., Song, Y., and Jiao, J. J.: Submarine groundwater discharge strengthens acidification in the coastal areas, EGU General Assembly 2023, Vienna, Austria, 23–28 Apr 2023, EGU23-2163, https://doi.org/10.5194/egusphere-egu23-2163, 2023.

EGU23-2263 | ECS | Orals | HS8.2.6

Towards global quantification of seawater circulation in coastal aquifers 

Yehuda Levy and Yael Kiro

Submarine groundwater discharge (SGD) is significant to coastal water chemistry and ecology. Nonetheless, the majority of SGD flux to the ocean comprises circulated seawater. This study deals with seawater circulation in coastal aquifers on a global scale in order to assess solute fluxes through SGD into the ocean. While the circulated seawater does not affect the water budget, it has a much higher impact on the ocean solutes budget due to water-rock interactions. We present a global assessment of saline SGD mechanisms' role using numerical simulations and analytical calculations. The numerical model simulates three main circulation mechanisms in coastal aquifers: density-driven circulation (long-term), tidal-driven nearshore circulation, and tidal pumping (short-term), while we calculate the wave-driven benthic exchange flux analytically using the same settings of the numerical model. The model tests the typical range of geohydrological parameters such as hydraulic conductivity, hydraulic gradient, tidal amplitude, and more. Our results revealed that: (1) increasing hydraulic conductivity increases the density-driven and decreases the tidal-driven nearshore circulations; (2) increasing the hydraulic gradient (or freshwater recharge) has no significant effect on the density-driven circulation while it slightly decreases the short-term nearshore circulation; (3) tidal pumping fluxes are a relatively large fraction of the overall SGD flux (30%-60%). Together with global hydraulic parameter distributions, the model results enable assessing the global SGD component of seawater circulation. Preliminary results reveal that the total density-driven SGD is about 0.5-1% of the river fluxes to the oceans. Based on the enrichment of calcium in the long-term SGD component, our global assessment of the calcium flux through density-driven flow may reach the same calcium flux through rivers into the ocean. 

How to cite: Levy, Y. and Kiro, Y.: Towards global quantification of seawater circulation in coastal aquifers, EGU General Assembly 2023, Vienna, Austria, 23–28 Apr 2023, EGU23-2263, https://doi.org/10.5194/egusphere-egu23-2263, 2023.

EGU23-2505 | ECS | Posters on site | HS8.2.6

Groundwater Flow Mechanisms and Related Carbon Sink Potential in Coastal Blue Carbon Ecosystems 

Xiaogang Chen and Ling Li

Mangroves and saltmarshes are important coastal blue carbon ecosystems characterized by high soil carbon storage. Groundwater flow and associated carbon export in mangroves and saltmarshes is the frontier and challenging issue in the estimates of coastal blue carbon sinks. Large amounts of groundwater-derived sediment carbon outwelling remains in the ocean and may represent an important carbon sink, which are potentially significant yet poorly understood components of mangrove and saltmarsh carbon budgets. This study aims to how to quantify the groundwater flow and related carbon fluxes, analyze their driving mechanisms, and then reassess the carbon budget and carbon sink potential of mangroves and saltmarshes.

How to cite: Chen, X. and Li, L.: Groundwater Flow Mechanisms and Related Carbon Sink Potential in Coastal Blue Carbon Ecosystems, EGU General Assembly 2023, Vienna, Austria, 23–28 Apr 2023, EGU23-2505, https://doi.org/10.5194/egusphere-egu23-2505, 2023.

EGU23-2506 | Posters on site | HS8.2.6

Comparing dual porosity approach and discrete fracture network for modelling seawater intrusion in fractured porous media 

Husam Baalousha, Behshad Koohbor, Marwan Fahs, and Anis Younes

Coastal aquifers are very important as they provide water supply for more than one billion inhabitants around the world. Due to the increased stresses on the coastal aquifers and the anticipated sea level rise from climate change, the risk of seawater intrusion is high. Most of coastal aquifers around the Mediterranean and in the Middle East are comprised of fractured limestone. While numerous studies have been done to investigate flow in coastal aquifers, these studies consider classical flow in un-fractured aquifers. The seawater intrusion in fractured aquifers remains unexplored.

This study focuses on simulating seawater intrusion in fractured porous media using the dual porosity approach (DP). A new numerical model is developed for sweater intrusion with the DP approach, based on advanced finite element schemes. The newly developed model is applied to the common benchmark of Henry’s problem and verified by comparison against a semi-analytical solution and a standard finite element solution obtained with COMSOL Multiphysics. The newly developed model is used to perform a sensitivity analysis for understanding the effect of parameters on the model predictions. The results show that the salinity in the domain is mainly controlled by the mass exchange rate between fractures and porous matrix. The DP approach is compared to the discrete fracture (DF) approach, via an inverse approach procedure. Synthetic observation data are generated with the DF approach and then used to calibrate the DP model. Agreement between the predictions of the DP and DF approaches depends on the fracture density.

How to cite: Baalousha, H., Koohbor, B., Fahs, M., and Younes, A.: Comparing dual porosity approach and discrete fracture network for modelling seawater intrusion in fractured porous media, EGU General Assembly 2023, Vienna, Austria, 23–28 Apr 2023, EGU23-2506, https://doi.org/10.5194/egusphere-egu23-2506, 2023.

EGU23-2859 | ECS | Orals | HS8.2.6

Assessing the impact of climate change and anthropogenic factors on future salinization of a low-lying coastal groundwater system (Northwestern Germany) 

Stephan L. Seibert, Janek Greskowiak, Leena Karrasch, Bernd Siebenhüner, Gualbert H.P. Oude Essink, Joeri van Engelen, and Gudrun Massmann

Coastal fresh groundwater reservoirs are often threatened by different salinization processes. Anthropogenic drivers for salinization include groundwater abstraction, land cultivation and artificial drainage. Global climate change, which modifies groundwater recharge patterns and results in sea-level rise, presents another important process enhancing groundwater salinization.

A good understanding regarding the physical behaviour of coastal groundwater systems is needed for sustainable management, including the development of effective counter measures to antagonize future groundwater salinization. At present, however, such knowledge is incomplete.

The aim of this study was to clarify the role of important factors expected to affect future groundwater salinization of low-lying coastal groundwater systems, namely sea-level rise, varying groundwater recharge and abstraction rates, changing drainage and river levels as well as land subsidence. A novel numerical 3-D variable-density groundwater flow and salt transport modeling approach was developed for this purpose, using Northwestern Germany as case study. To systematically evaluate the role of the individual salinization factors, separate model variants were employed.

We found that sea-level rise causes strongest salinization, particularly close to the coastline. Lifting of drainage levels results in freshening of the marsh areas, while a decrease of drainage levels amplifies salinization. Variation of groundwater recharge patterns and abstraction rates have least impact on regional groundwater salinization. As the system is not at steady-state, autonomous salinization will continue into the future and contribute a significant portion of salt loads until the end of the 21st century. Findings and implications of this study may be relevant to similar low-lying coastal groundwater systems around the world.

How to cite: Seibert, S. L., Greskowiak, J., Karrasch, L., Siebenhüner, B., Oude Essink, G. H. P., van Engelen, J., and Massmann, G.: Assessing the impact of climate change and anthropogenic factors on future salinization of a low-lying coastal groundwater system (Northwestern Germany), EGU General Assembly 2023, Vienna, Austria, 23–28 Apr 2023, EGU23-2859, https://doi.org/10.5194/egusphere-egu23-2859, 2023.

EGU23-3293 | Posters on site | HS8.2.6

Evaluating subsurface dams for the sustainable use of groundwater in remote small islands 

Ji Won Hwang, In Wook Yeo, and Dae Hyoung Lee

Islands rely on groundwater for their water resources. Groundwater overdraft lowers groundwater levels and causes seawater intrusion, which results in groundwater shortage and deterioration. Many remote small islands in the Yellow Sea of Korea suffer from water shortages. To supply 100 m3/d of groundwater to 197 island residents, a subsurface dam was constructed in Anma island (5.8 km2), Korea, from Sep. 2019 to Oct. 2020. This study assessed the effect of the subsurface dam on the groundwater sustainability of the small island. The Quaternary alluvium (0.48 km2), located in the central part of Anma island, is a main aquifer and extends to a thickness of about 40 m, which rests on the Cretaceous tuff. The water table lies approximately 5 m deep below ground and fluctuates within alluvial aquifers. The subsurface dam was installed through the alluvial layer to the top of the tuff to reduce groundwater discharge to sea and was built across the coastal alluvial aquifers. Aquifer tests found hydraulic conductivity for alluvium and tuff to be 3.910-6 and 2.8410-6 m/sec, respectively. The average water levels measured in Sep. 2019 from the five observation wells in alluvial aquifers increased in Sep. 2021 by 0.28 m (9%) after the dam construction, but the precipitation also increased by 18% in the same period. Therefore, the increase in water level could not account for enhanced groundwater storage due to the dam. Numerical simulations were carried out with annual precipitation of 1,100 mm and a recharge rate of 7.2% to evaluate the change in groundwater storage before and after the subsurface dam. The simulation results showed that the subsurface dam contributes to an increase of only 0.06 m in water level in alluvial aquifers. This represents an increase in groundwater storage of 5,760 m3 in the alluvial aquifer (considering the specific yield of 0.2), which amounts to 15% of the annual groundwater recharge of 38,016 m3 in alluvial aquifers. The additional increase in groundwater storage due to the subsurface dam could complement the scheduled groundwater development of 36,000 m3/y from the alluvial aquifers, particularly when the recharge declines due to drought. The simulation also indicated that regardless of the subsurface dam, seawater intrusion was found to be insignificant due to the small amount of groundwater pumping at 100 m3/d.

How to cite: Hwang, J. W., Yeo, I. W., and Lee, D. H.: Evaluating subsurface dams for the sustainable use of groundwater in remote small islands, EGU General Assembly 2023, Vienna, Austria, 23–28 Apr 2023, EGU23-3293, https://doi.org/10.5194/egusphere-egu23-3293, 2023.

EGU23-3641 | ECS | Posters on site | HS8.2.6

Estimating saltwater intrusion using remote-sensing datasets and analytical approaches 

Kyra H. Adams, Benjamin Hamlington, Cedric David, John Reager, Audrey Sawyer, Brett Buzzanga, and Jacob Fredericks

Coastal regions are home to more than 40% of the world’s population and often depend on fresh groundwater resources to sustain economic, residential, and recreational activities. However, coastal groundwater is under threat from saltwater intrusion (SWI), due in part to rising sea level and climate change. In this work we provide, for the first time, a global assessment of SWI and SWI vulnerability due to regional differences in sea level rise and predicted changes in recharge, leveraging NASA datasets of recharge, seawater density, and IPCC AR6 sea level rise. We show that climate-driven recharge changes drove 45% of watersheds to experience SWI, while SLR drove 92% of watersheds to experience SWI. By synthesizing various global datasets within an analytical framework, the work provides the first step towards evaluating the coastal impacts of saltwater intrusion in a changing climate. 

How to cite: Adams, K. H., Hamlington, B., David, C., Reager, J., Sawyer, A., Buzzanga, B., and Fredericks, J.: Estimating saltwater intrusion using remote-sensing datasets and analytical approaches, EGU General Assembly 2023, Vienna, Austria, 23–28 Apr 2023, EGU23-3641, https://doi.org/10.5194/egusphere-egu23-3641, 2023.

Seawater intrusion is considered the main threat to fresh groundwater resources in coastal regions, especially in arid areas such as Saudi Arabia. For decades, the coastal community in the eastern province of Saudi Arabia has depended on groundwater for domestic and agricultural uses. The current study objective is to assess the degree of seawater intrusion and its impact on the shallow groundwater in the eastern coastal region of Saudi Arabia. We integrated three techniques, including hydrogeology, hydrochemistry, and electrical resistivity. A hydrogeological and electrical resistivity field survey was conducted, coupled with in situ measurement of the shallow groundwater's hydrochemical properties (pH, ORP, DO, EC, temperature, and turbidity). This was followed by collecting 24 water samples for the laboratory analysis of hydrochemical properties (major cation and anion). Geospatial maps of salinity (electrical conductivity (EC)) and chloride were established to trace their concentrations from the sea landward. The hydrochemical spatial maps were correlated with the geoelectrical measurements to delineate the lateral and vertical extent of seawater intrusion in the studied shallow coastal aquifer. The hydrochemical results show that chloride and sodium are the dominant ions, indicating seawater intrusion is the source of elevated salinity. The salinity (EC) and chloride concentrations of the tested GW range from 6452 μS/cm to 44420 μS/cm, and 1041 mg/L to 8523 mg/L, respectively. The study results indicate that the shallow groundwater has been contaminated with seawater up to around 4 km landward, with a maximum depth of 30 m. The main conclusion of the current study is that decades of overexploitation of groundwater aquifers in the studied region have resulted in salinity contamination of shallow groundwater by seawater intrusion to levels of saline and brackish water. The result of this study may help the decision-maker implement a proper management measure to safeguard groundwater resources for coastal communities and develop a plan to remediate the shallow groundwater aquifer through desalination and reinjection for the environment and ecosystem benefits.

How to cite: Benaafi, M., Abba, S., and Aljundi, I.: Impact assessment of seawater intrusion on shallow coastal groundwater in eastern Saudi Arabia using a multidisciplinary approach, EGU General Assembly 2023, Vienna, Austria, 23–28 Apr 2023, EGU23-3786, https://doi.org/10.5194/egusphere-egu23-3786, 2023.

EGU23-4573 | Orals | HS8.2.6

How long can offshore fresh groundwater support onshore abstractions? 

Connor Cleary, David Dempsey, and Leanne Morgan

Where onshore and offshore groundwater systems are connected, onshore abstraction may access offshore fresh groundwater (Knight et al., 2018; Post et al., 2013). This draws seawater into the offshore system and may eventually lead to onshore salinization and changes to submarine groundwater discharge. The rate of salinization with respect to changes in onshore conditions is understudied. We analysed the salinization of a range of idealized coastal groundwater systems using numerical models, aiming to identify salinization regimes, characteristic timescales, and tipping points. Our cross-sectional semiconfined aquifer models were simulated using FloPy and SEAWAT. We simulated transient conditions leading to the emplacement of offshore fresh groundwater and post-development salinization. We systematically varied geometric properties like aquifer and aquitard thicknesses and slope, and hydraulic properties like hydraulic conductivities, dispersivity, and anisotropy. Our results show the influence of these properties on salinization rates, under a range of levels of onshore abstraction, and interactions between properties. This provides insight into offshore groundwater systems most at risk of salinization and guidance for parameter analysis during modelling studies.

Knight, A. C., Werner, A. D., & Morgan, L. K. (2018). The onshore influence of offshore fresh groundwater. Journal of Hydrology, 561, 724–736. https://doi.org/10.1016/j.jhydrol.2018.03.028

Post, V. E. A., Groen, J., Kooi, H., Person, M., Ge, S., & Edmunds, W. M. (2013). Offshore fresh groundwater reserves as a global phenomenon. Nature, 504(7478), 71–78. https://doi.org/10.1038/nature12858

How to cite: Cleary, C., Dempsey, D., and Morgan, L.: How long can offshore fresh groundwater support onshore abstractions?, EGU General Assembly 2023, Vienna, Austria, 23–28 Apr 2023, EGU23-4573, https://doi.org/10.5194/egusphere-egu23-4573, 2023.

EGU23-4624 | ECS | Posters on site | HS8.2.6

Loading effect on wave pumping driven seawater-groundwater circulation in submarine aquifer 

Shengchao Yu, Xiaolang Zhang, Jiu Jimmy Jiao, and Hailong Li

Tide and wave are both significant driven forces of submarine groundwater discharge (SGD). The hydrodynamic process of tidal SGD is well studied while wave induced part is still challenging to quantify. In this paper, an analytical study was performed to investigate wave pumping-driven SGD in subsea sediments. The loading effect of seawater weight overlying the seabed has been considered in the groundwater flow equation. Two dimensional simulations governed by this analytical solution were applied to examine water head fluctuations within permeable sediments. The analytical solution was validated by simulated water head fluctuations, which revealed the influence of poro-elastic property of sediment on the hydrodynamic process within the permeable seabed. The analytical and simulated results may provide guidance for assessing the wave-induced SGD and shed light on modeling the biogeochemistry process in wave dominated porous seabed environment.

How to cite: Yu, S., Zhang, X., Jiao, J. J., and Li, H.: Loading effect on wave pumping driven seawater-groundwater circulation in submarine aquifer, EGU General Assembly 2023, Vienna, Austria, 23–28 Apr 2023, EGU23-4624, https://doi.org/10.5194/egusphere-egu23-4624, 2023.

The radium isotopes (224Ra, t½ = 3.7 d;223Ra, t½ =11.5 d; 228Ra, (t½ = 5.7 y); 226Ra, t½ =1600 y) are well established tracers for the detection and quantification of submarine groundwater discharge (SGD). In the Eckernförde Bay (Western Baltic Sea) SGD associated with pock marks have been observed at many locations on the seabed (~ 20-25m water depths). In order to investigate the spatial and temporal SGD variability we repeatedly measured between 2016 and 2020 the radium (224Ra, 223Ra, 228Ra, 226Ra) distribution in the water column of the Eckernförde Bay and the adjacent Kiel Bay. In general, the water-column radium profiles are characterized by relatively low radium concentrations in the upper water column (~ <15m water depth, salinity ~ 12-18) and significantly higher ones in deep waters (~ 20-25m water depth; salinity ~ 21-25). High radium occurs also in areas far off the coast where pock marks have previously not been reported. Monthly/bi-monthly measurements at the time-series station Boknis Eck (Eckernförde Bay) revealed that this high radium occurs only between spring and autumn, a period, where bottom waters have low or negligible oxygen content. This observation may indicate that processes other than SGD may contribute to seasonal changes in deep water radium. In the presentation possible other radium sources like e.g., diagenetic radium supply from anoxic sediments, sediment bioturbation and resuspension, advection of deep waters from the North Sea, are discussed in order to understand to what extent the radium distribution in the western Baltic Sea can still be interpreted as a tracer of SGD.

How to cite: Scholten, J., Schroeder, J., Hsu, F.-H., and Liebetrau, V.: Widespread occurrence of high radium concentrations in bottom waters of the Eckernförde and Kiel bays (Western Baltic Sea): Are these related to submarine groundwater discharge?, EGU General Assembly 2023, Vienna, Austria, 23–28 Apr 2023, EGU23-5121, https://doi.org/10.5194/egusphere-egu23-5121, 2023.

EGU23-5524 | ECS | Orals | HS8.2.6

The quantitative meaning of resistivity data in a coastal setting: a Belgian case study 

Marieke Paepen, Wouter Deleersnyder, Kristine Walraevens, and Thomas Hermans

In coastal areas, the natural groundwater flow is affected by human activities, such as managed aquifer recharge (MAR) and groundwater extraction. They can induce saltwater intrusion and impact the fresh submarine groundwater discharge (FSGD). Resistivity methods, such as electrical resistivity tomography (ERT) and continuous resistivity profiling (CRP) are easy to use and very effective to assess the distribution of salt and freshwater in coastal environments. The Western Belgian coast, De Panne and Koksijde, was already investigated with ERT and CRP by Paepen et al. (2022; 2020). In this area, the source of FSGD is a sandy dune ridge of around 2.5 km wide. Now, we compare the FSGD footprint in front of De Panne and Koksijde to other Belgian coastal sites (Raversijde, Wenduine, Knokke-Heist, and Zwin), which have a different structure of the phreatic aquifer and a much smaller dune belt.

The quantitative interpretation of ERT and CRP is not straightforward, but image appraisal tools - such as the model resolution matrix (R), cumulative sensitivity matrix (S), and depth of investigation index (DOI) - can aid (Caterina et al., 2013). To be able to quantitatively assess the resistivity inversion models, five synthetic models were created (Paepen et al., 2022). These models reflect the present situation of the Western Belgian coast, where we find freshwater outflow on the lower beach or below the low water line. Based on the inversion models of the synthetic cases, the model resolution matrix, cumulative sensitivity matrix, and DOI (Oldenburg & Li, 1999) were calculated. The image appraisal tools were then compared to the error on the salinity for each cell in the inversion model (we find an error below 0.05 acceptable). This allows to define a threshold of the different image appraisal tools for which the model can be quantitatively assessed and to apply them to the field data. The thresholds reveal that no quantitative interpretation is possible for the zones of FSGD and that the FSGD resistivity is underestimated by the inversion process, so the salinity of the outflow is overestimated. Nevertheless, lateral qualitative changes can be deduced from the inversion models.

References

Caterina, D., Beaujean, J., Tanguy, R., & Nguyen, F. (2013). A comparison study of different image appraisal tools for electrical resistivity tomography. Near Surface Geophysics, 11, 639-657. https://doi.org/10.3997/1873-0604.2013022

Oldenburg, D. W., & Li, Y. (1999). Estimating depth of investigation in dc resistivity and IP surveys. Geophysics, 64(2), 403-416. https://doi.org/10.1190/1.1444545

Paepen, M., Deleersnyder, W., De Latte, S., Walreavens, K., & Hermans, T. (2022). Effect of Groundwater Extraction and Artificial Recharge on the Geophysical Footprints of Fresh Submarine Groundwater Discharge in the Western Belgian Coastal Area. Water, 14(7), 1040. https://doi.org/10.3390/w14071040

Paepen, M., Hanssens, D., De Smedt, P., Walraevens, K., & Hermans, T. (2020). Combining resistivity and frequency domain electromagnetic methods to investigate submarine groundwater discharge (SGD) in the littoral zone. Hydrology and Earth System Sciences, 24, 3539-3555. https://doi.org/10.5194/hess-24-3539-2020

How to cite: Paepen, M., Deleersnyder, W., Walraevens, K., and Hermans, T.: The quantitative meaning of resistivity data in a coastal setting: a Belgian case study, EGU General Assembly 2023, Vienna, Austria, 23–28 Apr 2023, EGU23-5524, https://doi.org/10.5194/egusphere-egu23-5524, 2023.

EGU23-5604 | Posters virtual | HS8.2.6

Natural and anthropogenic factors for activation of marine intrusion on the Bulgarian Black Sea coast 

Olga Nitcheva, Albena Vatralova, and Donka Shopova

Coping  with water deficit in coastal areas is a challenge when groundwater extraction must be relied upon. The problem is exacerbated when favourable conditions appear for activation of marine intrusion. Such could be significant pressure on groundwater bodies from water abstraction, which causes a change in the water level and, accordingly, a change in the direction of the groundwater flow. The present paper presents hydrological and water resource management analysis  of factors for activation of marine intrusion on the Bulgarian Black Sea coast using data from  monitoring observations of water quantity and quality  and hydrological model simulations. Anthropogenic impacts are analyzed using information about the actual structure and dynamics of the water supply.

The results of the research show that in the Bulgarian Black Sea coastal zone the rainfalls in the past decade are below the country average. Hence marine intrusion processes are observed in the central and northern part of the region due to excess water intake from groundwater for domestic water supply. This imposes the necessity of searching alternative water sources from other territories and specific methods for water treatment.

Key words: water deficit, groundwater water abstraction, marine intrusion, Bulgarian Black Sea coast

How to cite: Nitcheva, O., Vatralova, A., and Shopova, D.: Natural and anthropogenic factors for activation of marine intrusion on the Bulgarian Black Sea coast, EGU General Assembly 2023, Vienna, Austria, 23–28 Apr 2023, EGU23-5604, https://doi.org/10.5194/egusphere-egu23-5604, 2023.

EGU23-5781 | Orals | HS8.2.6

The effect of dynamic hydro(geo)logical boundary conditions on redox-zoning in high-energy subterranean estuaries 

Janek Greskowiak, Stephan Seibert, Vincent Post, and Gudrun Massmann

Subterranean estuaries (STE) below beaches are biogeochemical reactors that modify the composition of fresh meteoric groundwater and recirculating seawater before they enter the ocean via submarine groundwater discharge (SGD), which can affect coastal ecosystems. Thereby, prevailing redox conditions have a major impact on the concentrations and mass fluxes of water constituents, e.g., nutrients, metals and organic molecules within the STE. Due to the transient nature of the flow and transport within STEs as well as the variable hydrogeochemical boundary conditions, redox zoning in the STE is likely highly dynamic. Elucidating the factors that affect redox zoning and its dynamics is essential for the interpretation and understanding of hydrogeochemical data and the prediction of coastal solute fluxes. In the present study we investigated the individual and combined effects of storm floods, seasonal changes of temperatures and groundwater recharge rates, as well as beach morphodynamics on the redox behavior, i.e., redox zoning in the STE in a generic modelling approach. A 2D cross-shore density-dependent flow and reactive transport model was set up for this purpose, mimicking a beach aquifer exposed to high-energy conditions due to high tides, waves and storm floods. The results of this study show that redox dynamics can occur well down to a depth of 20 m. Morphodynamics were shown to be the most important factor for redox zoning in the STE. For cases where morphodynamics are less pronounced, e.g., at low-energy sites, storm floods and the seasonal temperature changes may be dominating. Seasonal changes in meteoric groundwater recharge rates seem to be least relevant for the redox dynamics in STEs. The results of the present study increase the understanding of STEs as biogeochemical reactors.

How to cite: Greskowiak, J., Seibert, S., Post, V., and Massmann, G.: The effect of dynamic hydro(geo)logical boundary conditions on redox-zoning in high-energy subterranean estuaries, EGU General Assembly 2023, Vienna, Austria, 23–28 Apr 2023, EGU23-5781, https://doi.org/10.5194/egusphere-egu23-5781, 2023.

Beach aquifers are the contact zone between the terrestrial groundwater and the ocean. Where the fresh groundwater mixes with the recirculating saltwater biogeochemical reactions take place and change the composition of the water. These biogeochemical reactions and resulting element net fluxes are linked to residence times and dispersive mixing processes that depend on dynamic density-driven groundwater flow and transport processes. In the present study we investigate the effect of dynamic hydro- and morphological boundary conditions and aquifer parameters on the groundwater flow- and transport processes in the deep subsurface of a high energy beach along a 2D transect perpendicular to the shore by means of a density-driven flow and transport model (SEAWAT). The ‘classical’ concept of a beach aquifer in the intertidal zone describes the stable establishment of three separated, layered water bodies. The fresh water discharge tube (‘FDT’) separates the wave and tide induced upper saline plume (‘USP’) from the saltwater wedge (‘SW’). Recent research challenges this concept of stable position of water bodies under high energy beach conditions which are characterized by high wave and tidal amplitudes. Our modelling results show that dynamic beach morphology has an important effect on the spatio-temporal flow and transport patterns as well as on the salt distribution and residence times in the deep beach aquifer and results in the formation of several time variable FDTs and USPs. Moreover, our research shows the sensitivities of the freshwater-saltwater interface in the subsurface to hydraulic conductivity, anisotropy, dispersion and boundary conditions like storm surges and fresh water inflow. The result is a complex, temporally and spatially variable picture of the ‘classical’ stable USP with dynamic interfaces. Hence, our results elucidate the physical conditions in the deep subsurface that are relevant for the spatio-temporal distribution of chemical reactions that are linked to the mixing interfaces between the water bodies. As a consequence the biochemical reactions might be enhanced with effects on the element net fluxes to the sea. 

How to cite: Meyer, R., Greskowiak, J., and Massmann, G.: Effects of variable beach morphology, storm surges and aquifer parameters on the salinity distribution in the deep subsurface of a high energy beach – a generic modelling approach, EGU General Assembly 2023, Vienna, Austria, 23–28 Apr 2023, EGU23-6141, https://doi.org/10.5194/egusphere-egu23-6141, 2023.

The impact of submarine groundwater discharge (SGD) on coastal sea biogeochemistry and water quality has been demonstrated in many recent studies. However, the isotopic behavior of terrestrially-derived solutes in the groundwater-seawater mixing zone of coastal aquifers (the subterranean estuary, STE) has been less studied, although solutes such as Li, S and Sr are commonly used as tracers of weathering and biogeochemical processes taking place in aquifers and in coastal sea sediments.

This study investigated the behavior of 87Sr/86Sr, δ7Li and δ34S in the STE and three seafloor pockmarks with different degrees of groundwater influence, as constrained based on δ2H and δ18O, at the Hanko SGD site in Finland, in the northern Baltic Sea. These data were supplemented by groundwater and seawater measurements. 87Sr/86Sr showed non-conservative behavior with values elevated up to 0.0167 units above that expected for the conservative mixing in the STE and in the most groundwater-dominated pockmark (up to 100% groundwater), but the deviation was masked by much stronger seawater contributions in the other pockmarks. δ7Li values were shifted down to −1.75‰ below that expected for conservative mixing in the STE and in groundwater-influenced pockmark porewaters, whereas δ7Li was elevated up to 1.53‰ in the porewater of organic-rich mud in a pockmark where groundwater influence had ceased. δ34S deviated between −16.78‰ and 10.51‰ from the conservative mixing in the STE and porewaters of groundwater-influenced pockmarks, while δ34S was elevated up to 16.85‰ in the porewater of the pockmark with no groundwater influence.

In the Hanko STE, the isotopic fractionation of Sr and Li was explained by chemical weathering of silicate minerals and clay minerals, respectively, whereas δ34S was fractionated by complex interactions of microbial sulfate reduction and sulfide reoxidation. In the pockmark porewater with no groundwater influence, δ7Li and δ34S isotopes were enriched in the heavier isotopes as a consequence of early-diagenetic mineral formation in the organic-rich muds. The measured 87Sr/86Sr and δ7Li were higher than the previously estimated isotopic compositions of their groundwater-derived fluxes to the oceans, and partly higher than the global riverine values. The heterogeneity in the seafloor biogeochemical environment, caused by the focusing of SGD in pockmarks, resulted in strongly variable δ34S of groundwater-derived S flux to the coastal ocean at a spatial scale of a few hundreds of meters.

Original publication: Ikonen, J., Hendriksson, N., Luoma, S., Lahaye, Y. and Virtasalo, J. J.: Behavior of Li, S and Sr isotopes in the subterranean estuary and seafloor pockmarks of the Hanko submarine groundwater discharge site in Finland, northern Baltic Sea, Applied Geochemistry, 147, 105471, https://doi.org/10.1016/j.apgeochem.2022.105471, 2022.

How to cite: Ikonen, J., Hendriksson, N., Luoma, S., Lahaye, Y., and Virtasalo, J.: Behavior of Li, S and Sr isotopes in the subterranean estuary and seafloor pockmarks of the Hanko submarine groundwater discharge site in Finland, northern Baltic Sea, EGU General Assembly 2023, Vienna, Austria, 23–28 Apr 2023, EGU23-6488, https://doi.org/10.5194/egusphere-egu23-6488, 2023.

EGU23-7125 | ECS | Orals | HS8.2.6

Submarine groundwater discharge and methane seepage driven by Fennoscandian Ice Sheet dynamics offshore northern Norway 

Sophie ten Hietbrink, Ji-Hoon Kim, Arunima Sen, Aivo Lepland, Beata Szymczycha, Seyed Reza Saghravani, Jochen Knies, and Wei-Li Hong

Freshwater in sediment pore fluids and methane seepage from the seafloor have often been observed concurrently in Arctic regions where submarine groundwater discharge (SGD) occurs, with advective flows potentially reintroducing ancient carbon into the modern ocean. It is hypothesized that hydraulic loading by ice sheets enhances submarine groundwater discharge, and subsequently methane transport. In the presence of microbial communities, large amounts of methane can be consumed by the anaerobic oxidation of methane (AOM), inducing precipitation of authigenic carbonates that inherit unique carbon isotopic signatures from methane. At an SGD site offshore Lofoten Islands, northern Norway (ca. 800 meters water depth), in the vicinity of the maximum extent of the Fennoscandian Ice Sheet, we observed a downcore decreasing chlorinity profile and a linear relation between δ18O and δ2H of the porewater, known as the local meteoric water line. This demonstrates a meteoric water contribution to the porewater. We also found methane-derived authigenic carbonates (MDACs) with depleted δ13C values (< -30 ‰ VPDB), suggesting that microbial (or thermogenic) methane was incorporated during MDAC precipitation. Moreover, δ18O values (> 2.5 ‰ VPDB) of MDACs indicate precipitation in the presence of 18O-enriched water, possibly a result of past hydrate dissociation. To assess the carbon cycle and timing of the methane seepage at the Lofoten SGD site, we investigated the radiocarbon contents of Total Organic and Inorganic Carbon in sediments (TOC, TIC), as well as Dissolved Inorganic Carbon (DIC) in porewater from multiple sediment horizons. The radiocarbon contents of DIC have the lowest values among the three carbon pools, in the order of 10-30 percent modern carbon. Their radiocarbon ages (~ 17,000 years BP) are in the order of the Last Glacial Maximum. Consequently, the DIC must have been closed off from the atmosphere due to long groundwater retention times. Alternatively, a methane source low in radiocarbon could have contributed to the DIC pool through AOM. The TIC pool showed radiocarbon content half of that of the TOC in the same sediment horizons, which can be explained by carbonate precipitation from the radiocarbon-depleted DIC pool. To further constrain in situ carbon cycling and advection velocities, a reaction-transport model using mass balance calculations of 12C, 13C and 14C has been applied. Radiocarbon content profiles of the DIC indeed imply the advection of old groundwater into the marine sediment porous media.

How to cite: ten Hietbrink, S., Kim, J.-H., Sen, A., Lepland, A., Szymczycha, B., Saghravani, S. R., Knies, J., and Hong, W.-L.: Submarine groundwater discharge and methane seepage driven by Fennoscandian Ice Sheet dynamics offshore northern Norway, EGU General Assembly 2023, Vienna, Austria, 23–28 Apr 2023, EGU23-7125, https://doi.org/10.5194/egusphere-egu23-7125, 2023.

EGU23-7303 | Orals | HS8.2.6

Molecular characterization of dissolved organic matter in groundwater of a coastal aquifer: microbial processing of sediment sourced organics  

Yan Zheng, Peng Zhang, Xuejing Wang, Yinghui Wang, Hailong Li, and Junjian Wang

Interest has grown in the land-ocean continuum as an energy and material exchange hotspot between the fresh water and saline water ecosystems, including its role in global carbon cycle. Despite progress, carbon cycle especially the biogeochemistry of dissolved organic carbon (DOC) in subsurface environment across the land-ocean continuum is inadequately illustrated. Using fluorescence spectroscopy and ultra-high-resolution mass spectroscopy, this study investigated the molecular characteristics of a broad array of dissolved organic matter (DOM) molecules in shallow groundwater from a coastal aquifer of Guangdong Province. A total of 21 groundwater samples were obtained from 5 multilevel monitoring wells (W1-W5) installed to depth 1 m – 13 m along a transect located 0 m to 65 m from the coast. The infiltration rate ranged from 0.79 to 23.51 m/d, possibly reflecting a less permeable layer between ~ 9 m to ~ 12 m depth. Above this layer consisted of clay lenses, salinity (3.93‰ - 32.43‰) decreases with depth, coinciding with a linear drop of ORP value from a high of +101 mV to a low of -131.90 mV at 8 m depth. The progressively more reducing condition with depth is likely fueled by DOM released from the clay, supported by simultaneous increases of DOC (0.46–2.36 mg/L), DIC (24.62–46.71 mg/L) and DIN (0.03–2.37 mg/L) concentrations and the fluorescence index (FI) with depth. Further, except for two samples (W3-13 m and W5-8 m) with low degradation index (IDEG) of 0.47 and 0.32, of the 11190 molecular formulae of DOM identified by ultra-high-resolution mass spectroscopy molecular formulae with high relative abundance (average ~86.0%) were present in the other 19 samples (90%), indicating the existence of a core pool of DOM compounds with similar molecular compositions despite a strong redox gradient and evidence for microbial processing based on fluorescence spectroscopy data. This core pool of DOM compounds displayed high IDEG (0.82±0.06), high %lignin-like DOM (85.9±2.6), and high abundances of carboxylic-rich alicyclic molecules (%CRAM: 69.5±3.4) that are generally considered to be refractory. Therefore, consumption of labile DOM is reasoned to have taken place, resulting in the prevalence of stable DOM in saline groundwaters of coastal aquifers. 

Key words: Coastal aquifers; Groundwater; Dissolved organic matter; 3D-EEMs; FT-ICR MS 

How to cite: Zheng, Y., Zhang, P., Wang, X., Wang, Y., Li, H., and Wang, J.: Molecular characterization of dissolved organic matter in groundwater of a coastal aquifer: microbial processing of sediment sourced organics , EGU General Assembly 2023, Vienna, Austria, 23–28 Apr 2023, EGU23-7303, https://doi.org/10.5194/egusphere-egu23-7303, 2023.

EGU23-7483 | ECS | Posters on site | HS8.2.6

Tidal effects on groundwater levels in Maputo, Mozambique 

Xue Meng, Yangxiao Zhou, Jinguo Wang, Tibor Stigter, Fatima Mussa, Dinis Juizo, and Yun Yang

Groundwater is an important source for water supply in Maputo City, Mozambique. A groundwater monitoring network has been established for systematically monitoring of groundwater level and salinity changes. Automatic data loggers were installed to register groundwater levels and EC values every hour. Three observation wells were installed in the coast to detect seawater intrusion. The measured groundwater levels show clearly tidal effects. In this study, time series analysis methods were used to identify dominant periodic changes in groundwater levels (GWLs), effects of tide, and estimation of aquifer diffusivity using tidal effect parameters. Autocorrelation and cross-correlation analysis were used to estimate the periodic components and lag time between the tide and GWLs, respectively. Spectral analysis was used to ascertain the dominant periodic components in the tide and GWLs by means of estimating amplitude spectrum and power spectrum density. Cross-spectral analysis was used to determine the lag time between the tide and GWLs by means of estimating cross-power spectrum density. Furthermore, wavelet analysis was used to investigate changes of periodic components over the measured period. The estimated amplitudes and lag times were used to estimate aquifer diffusivity. The results identified dominant periodic component with a 12hour period both in the tide and GWLs. However, groundwater level is lag behind the tide with 2-4 hours depending on the distance of the observation wells to the costal line. The wavelet analysis results show no changes of dominant periodic components over the time. Therefore, the estimated amplitude and lag time were used to estimate aquifer diffusivity. The estimated parameter values are 2.72595E-05 h/m2, 6.97843E-05 h/m2, and 6.14906E-05 h/m2 from observation wells. These correspond values of transmissivity as 440 m2/d, 172 m2/d, and 195 m2/d, respectively. The estimated transmissivity values are useful for constructing saltwater intrusion models.

How to cite: Meng, X., Zhou, Y., Wang, J., Stigter, T., Mussa, F., Juizo, D., and Yang, Y.: Tidal effects on groundwater levels in Maputo, Mozambique, EGU General Assembly 2023, Vienna, Austria, 23–28 Apr 2023, EGU23-7483, https://doi.org/10.5194/egusphere-egu23-7483, 2023.

EGU23-7567 | ECS | Orals | HS8.2.6

Turbulent transport and mixing of discharged groundwater on structured surfaces at the coastal benthic seafloor 

Helena Klettke, Leonie Kandler, and Martin Brede

In recent years, the discharge of groundwater has increasingly been regarded as a notable influence on the terrestrial-marine relation in the coastal zone with respect to the flux of nutrients, carbon and metals into coastal waters. Assessing the net amount of discharging groundwater is a challenge in itself, but the transport and mixing within the water column is an important topic that has been unrevealed so far.

To investigate the transport and mixing processes and their dependence on wave scenario and bottom topography, we performed synchronized particle image velocimetry (PIV) and planar laser-induced fluorescence (PLIF) experiments using a passive tracer in a wave channel. At the bottom of the channel, a permeable seabed model with defined roughness features, such as ripples and coarser sediment, is mounted and perfused with a fluorescent tracer fluid that resembles the discharging groundwater. Different oscillating flows with variable wave amplitude and period were investigated over each seabed model. The correlation of the measured concentration and velocity fields gives the turbulent transport quantities of the tracer fluid within the water column. Additionally, Prandtl mixing lengths can be determined from the coupled PIV and PLIF results.

Results show a great influence of both, the bottom topography and the wave scenario, as well as their strong coupling through wave-seabed-interaction. Furthermore, different types of bottom roughness showed a great variation in turbulent transport, indicating that the roughness features should be treated in a more complex fashion than being modelled as scalar quantities.

How to cite: Klettke, H., Kandler, L., and Brede, M.: Turbulent transport and mixing of discharged groundwater on structured surfaces at the coastal benthic seafloor, EGU General Assembly 2023, Vienna, Austria, 23–28 Apr 2023, EGU23-7567, https://doi.org/10.5194/egusphere-egu23-7567, 2023.

EGU23-7607 | ECS | Orals | HS8.2.6

A study on the suitability and quantitative potential of aquifer storage and recovery and brackish water extraction in Dutch coastal areas. 

Ilja America - van den Heuvel, Jude King, Huite Bootsma, Joost Delsman, Gualbert Oude Essink, and Ida de Groot - Wallast

Freshwater demand will increase in the coming years due to climate change and socio-economic developments. One approach to help combat this is through aquifer storage and recovery (ASR), whereby excess fresh water is stored in the subsurface and recovered later as required. Furthermore, brackish groundwater extraction (BWE) can also be used to combat salinization and produce fresh groundwater. COASTAR is a Dutch research consortium that focuses on the use of ASR and BWE to secure sustainable access to freshwater in coastal areas. Previous research within this program produced geohydrological suitability maps at a national level through the assessment of several geohydrological factors using existing data. In this study, we test previous results using numerical validation by ‘blindly’ placing ASR and BWE well systems into the centre of 10 x 10km sub models, using 3D variable-density groundwater flow and coupled salt transport modelling. In total, 12 scenarios were simulated for approximately 170 locations in Dutch coastal areas, resulting in over 2000 model simulations. The scenarios were implemented in two different aquifers (shallow or deep) with extraction rates of 1200, 6.000, and 12.000m3/d. The resulting suitability of BWE and ASR systems at a given location was decided by how the system performs and affects the surrounding environment. A sensitivity analysis provided insights into the main geohydrological parameters and threshold values ​​applicable to ASR and BWE. Overall, results were like the pre-existing geohydrological suitability maps but offered further quantitative insights. On an international level, this knowledge can help to better understand suitability in other areas with similar subsurface characteristics. Additionally, a quick-scan analysis was performed to quantify the total potential extractable volumes for ASR and BWE. The results of this are based on maximum possible extraction/infiltration rates for each model area, by estimating the summed environmental effects of multiple wells. The method used an extrapolation approach based on the numerical model results. For this approach two factors were considered: 1) the effect of multiple extractions on the environment (changes in phreatic groundwater head), and 2) the optimal number of wells given the width of the freshwater ‘bubble’ for ASR scenarios. The quick-scan analysis showed that ASR and BWE systems have the potential to fulfill the increase in freshwater demand in the Netherlands in 2050.

How to cite: America - van den Heuvel, I., King, J., Bootsma, H., Delsman, J., Oude Essink, G., and de Groot - Wallast, I.: A study on the suitability and quantitative potential of aquifer storage and recovery and brackish water extraction in Dutch coastal areas., EGU General Assembly 2023, Vienna, Austria, 23–28 Apr 2023, EGU23-7607, https://doi.org/10.5194/egusphere-egu23-7607, 2023.

The salt water intrusion (SWI) and submarine groundwater discharge (SGD) communities have traditionally approached coastal aquifers in different ways, but both communities agree on the importance of defining the mixing zone between freshwater and saltwater in coastal aquifers. The problem is that this mixing zone extends offshore in many aquifers, where it is very difficult to map. Laboratory and modeling studies of the freshwater-saltwater interface have generated very useful insights into fundamental processes but commonly struggle to incorporate the heterogeneity and temporal variability of real systems. This talk reviews current conceptual models and diverse evidence for offshore mixing zones, with recommendations for possible approaches moving forward.

How to cite: Wilson, A.: Where is the freshwater-saltwater interface in offshore coastal aquifers?, EGU General Assembly 2023, Vienna, Austria, 23–28 Apr 2023, EGU23-8357, https://doi.org/10.5194/egusphere-egu23-8357, 2023.

EGU23-8510 | Orals | HS8.2.6

The Direct Effect of Submarine Groundwater Discharge on the Concentration of Dissolved Oxygen in Estuarine and Coastal Waters 

Willard Moore, Samantha Joye, Ryan Sibert, Alan Shiller, Amy Moody, and Claudia Benitez-Nelson

Submarine groundwater discharge (SGD) is recognized to supply nutrient elements nitrogen and phosphorus to coastal waters. In some cases, these nutrients are essential for biological productivity; in other cases, the nutrients are in excess or change relative proportions such that they impact community structure and/or increase algal blooms. Often overlooked is the role of reducing substances in salty SGD such as H2S, NH4+, CH4, and DOM, which create a direct demand for dissolved oxygen (DO) and lower its concentration in estuarine and coastal waters. We call this SGD-Oxygen Demand or SGD-OD. These reduced substances primarily result from the oxidation of carbon in aquifers and aquicludes by seawater sulfate. Thus, coastal aquifers transitioning from freshwater to seawater due to seawater intrusion are most vulnerable. Saturated seawater DO concentrations are on the order of 200 µM; reducing DO in coastal waters to <150 µM induces biological stress on many organisms; reducing DO to <60 µM (hypoxic conditions) can be deadly. Studies have directly correlated DO depletion with increased SGD off the coast of South Carolina and Mississippi, USA, and in the Yangtze delta, China. These depletions initially affect near-bottom dwelling organisms and may be recognized by sudden fish kills. In this talk we will review a data base of reducing substances in coastal groundwaters and illustrate how the discharge of this water could impact estuaries and coastal waters. We will show additional examples where we hypothesize SGD-OD is occurring in hopes others will have the resources to investigate these areas.  

How to cite: Moore, W., Joye, S., Sibert, R., Shiller, A., Moody, A., and Benitez-Nelson, C.: The Direct Effect of Submarine Groundwater Discharge on the Concentration of Dissolved Oxygen in Estuarine and Coastal Waters, EGU General Assembly 2023, Vienna, Austria, 23–28 Apr 2023, EGU23-8510, https://doi.org/10.5194/egusphere-egu23-8510, 2023.

EGU23-9177 | ECS | Orals | HS8.2.6

Seasonal dynamics of submarine groundwater discharge from a rewetted coastal peatland 

Erwin Don Racasa, Jakob Kienzler, Sate Ahmad, Cheryl Batistel, Simeon Choo, Miaorun Wang, Anna-Kathrina Jenner, Bernd Lennartz, and Manon Janssen

Most research on submarine groundwater discharge (SGD) focuses on sandy beaches. Less studies have investigated environments with low hydraulic conductivity (Ks) such as coastal peatlands, which are abundant along the southern Baltic Sea coast. Coastal peatlands, which have been drained for agricultural purposes, hold high quantities of carbon, nitrogen, and other compounds that could possibly be released to the sea upon rewetting of these sites. In this study, we simulated groundwater flow from a coastal rewetted fen with a peat layer extending out into the sea to understand the short– and long–term dynamics of SGD, quantify SGD water and matter fluxes, and assess the impact of a storm surge on SGD and seawater intrusion. Five-year (2016 – 2021) daily 2D numerical simulations of groundwater flow were based primarily on monitored groundwater and seawater level data and field-gathered soil hydraulic parameters. Hydraulic conductivities of geological layers were optimized against measured water levels. Manual seepage meter measurements were conducted and water samples were collected. The modeled seepage rates fitted the measured ones well. Our results reveal that SGD and seawater intrusion are highly dynamic and vary spatially and temporally. Two dominant submarine discharge areas were observed: 1) near the beach (up to ~30 m from shore) where mean seepage rates based on nodal water velocities reach up to 12.4 cm d-1 with waters originating from the dune dike and recirculated seawater; 2) seeps from the aquifer at about 60 m distance from the coast with discharge rates of 1.1 cm d-1 on average. Mean seepage rates from the discharge areas are comparable to other wetland and sandy environments. The low Ks of the peat layer limits water exchange between the peatland and the Baltic Sea to these regions. The groundwater-seawater interface below the dune moves between the beach and the central dune on an hourly to weekly basis. However, the extent of the interface changes at a seasonal scale. Higher SGD fluxes occur in spring and summer while seawater intrusion increases during fall and winter, as a consequence of the seasonal variations of the peatland’s water level and the resulting hydraulic gradient. During storm surges, higher seawater intrusion fluxes are expected, while low seawater would lead to higher SGD fluxes. The mean daily net flux which represents land-derived SGD from the peatland is 0.15 m2 d-1 (range: -6.12 m2 d-1 to 1.63 m2 d-1), with the highest intrusion occurring during the 2019 storm surge and the highest SGD occurring two days after the surge event. Our mean daily net flux compares well with previous studies but total SGD, which includes recirculated seawater, is likely underestimated. Nearshore carbon and nitrogen SGD concentrations are higher than ambient seawater concentrations demonstrating the potential impact of SGD on local biogeochemistry. Our findings show that SGD is an important coastal process even from low-lying and low Ks coastal peatlands. We emphasize the importance of conducting more interconnection studies between peatland hydrogeology and geochemistry disciplines to better understand SGD processes in these environments.

How to cite: Racasa, E. D., Kienzler, J., Ahmad, S., Batistel, C., Choo, S., Wang, M., Jenner, A.-K., Lennartz, B., and Janssen, M.: Seasonal dynamics of submarine groundwater discharge from a rewetted coastal peatland, EGU General Assembly 2023, Vienna, Austria, 23–28 Apr 2023, EGU23-9177, https://doi.org/10.5194/egusphere-egu23-9177, 2023.

EGU23-9399 | Orals | HS8.2.6

COST action (OFF-SOURCE, CA21112)- Offshore Freshened Groundwater: An unconventional water resource in coastal regions? 

Wei-Li Hong, Aaron Micallef, Claudia Bertoni, Michela Giustiniani, Katrin Schwalenberg, Ariel Thomas, Elizabeth Quiroga-Jordan, and Hiba Wazaz

Freshwater resources in coastal regions are under enormous stress due to population growth, pollution, climate change and political conflicts, and many coastal cities have already suffered extreme water shortages. OFF-SOURCE will address if and how offshore freshened groundwater (OFG) – groundwater stored in the sub-seafloor with a total dissolved solid concentration below that of seawater - can be used as an unconventional source of freshwater in coastal regions. Specifically, the Action will identify where OFG is found in waters of COST Member Countries and in which volumes, delineate the most appropriate approaches to characterise OFG, identify the most cost-effective strategy to utilise this resource, and assess the environmental and legal challenges to sustainable OFG use. These activities will be carried out by a new scientific, gender-balanced and inclusive network of experienced and early-career scientists and stakeholders from diverse and complementary scientific disciplines. Such a network will foster cross­disciplinary and inter-sectoral interaction between currently isolated fields of research to reduce the gap between science, policy making and society. There are five different working groups (WGs) that aim for the critical tasks of this action: Assessment (WG1), Characterization (WG2), and Utilization (WG3) of OFG, the Challenges faced by the community (WG4), as well as Training and Dissemination of up-to-date knowledge about OFG (WG5). This interaction will foster new ideas and concepts that will lead to breakthroughs in OFG characterisation and exploitation, translate into future market applications, and deliver recommendations to support effective resource management. By providing high quality training opportunities for early career investigators, particularly from less research intensive countries, the Action will develop a pool of experts to address future scientific challenges related to OFG.

How to cite: Hong, W.-L., Micallef, A., Bertoni, C., Giustiniani, M., Schwalenberg, K., Thomas, A., Quiroga-Jordan, E., and Wazaz, H.: COST action (OFF-SOURCE, CA21112)- Offshore Freshened Groundwater: An unconventional water resource in coastal regions?, EGU General Assembly 2023, Vienna, Austria, 23–28 Apr 2023, EGU23-9399, https://doi.org/10.5194/egusphere-egu23-9399, 2023.

EGU23-9457 | ECS | Orals | HS8.2.6

Using  a surface water hydrodynamic model to understand how spatial variability in ocean surge affects groundwater salinization in Delaware Inland Bays 

Rachel Housego, Anner Paldor, Ryan Frederiks, Fengyan Shi, and Holly Michael

Coastal communities around the world face an increasing risk from surge-driven inundation because of rising sea levels and intensifying storm conditions. During storm surges, inland propagation of ocean water drives infiltration of saltwater into the fresh groundwater, jeopardizing coastal water resources. The magnitude, shape, and duration of these ocean surges vary both between storm events and spatially during a given storm, resulting from differences in bathymetry, coastline shape, and the path and characteristics of the storm. Our study aims to understand how these temporal and spatial variabilities in ocean surge affect groundwater salinization and recovery in the Delaware (DE) Inland Bays. The DE Inland Bays are composed of two adjoining, shallow bays in Eastern Delaware connected to the Atlantic Ocean via a single inlet. The geometry of the bays results in complex surface water hydrodynamics. To study the effect of spatial variability in surge levels we used  the output from a surface water hydrodynamic model, NearCOM-TVD, simulated for past storm surge events, as boundary conditions for 2D Hydrogeosphere simulations of groundwater flow and salt transport. During Hurricane Sandy (2012), the largest surge event in the past decade, there was a 0.7 m range in the maximum surge height within the bays. Corresponding groundwater simulations showed that for this range, there was 33% more surge-induced aquifer salinization for the highest surge level within the bays relative to the lowest. This elevated salt mass persisted over the ten year recovery period. Results from Hurricane Sandy will be compared with more moderate storm surge events. The resulting salinized volumes and recovery times from all the storm simulations were used to develop a salinization vulnerability metric for the Delaware Inland Bays. The goal of these simulations is to identify the surge conditions that present the greatest salinization risk and the locations in the Inland Bays that have the highest salinization vulnerability, as well as to improve understanding of the feedbacks between ocean and groundwater hydrodynamics.

How to cite: Housego, R., Paldor, A., Frederiks, R., Shi, F., and Michael, H.: Using  a surface water hydrodynamic model to understand how spatial variability in ocean surge affects groundwater salinization in Delaware Inland Bays, EGU General Assembly 2023, Vienna, Austria, 23–28 Apr 2023, EGU23-9457, https://doi.org/10.5194/egusphere-egu23-9457, 2023.

EGU23-9655 | Posters virtual | HS8.2.6

Potential Water Resources in the North-Eastern Adriatic Sea 

Michela Giustiniani, Martina Busetti, Michela Dal Cin, Erika Barison, Aurélie Cimolino, Giuseppe Brancatelli, and Luca Baradello

Increasing demand for freshwater requires the identification of additional and less-conventional water resources. Amongst these, offshore freshened groundwater is considered a new opportunity to face increasing water demand and has been studied in different parts of the world. Here we focus on the north-eastern Adriatic Sea, where offshore aquifers could be present as a continuation of onshore aquifers. Geophysical data, especially offshore seismic data, as well as onshore and offshore well data were integrated and interpreted to characterize the hydrogeological setting via the interpretation of seismo-stratigraphic sequences. Two areas located in the proximity of the Tagliamento and Isonzo deltas were studied. Well and seismic data suggest that Quaternary sediments, extending from onshore to offshore areas, represent the most promising from an offshore freshwater resources point of view. Firstly, onshore well data confirm the presence of freshwater aquifer systems in proximity to the coastline, supporting the hypothesis of their continuation offshore. Secondly, during the glacial periods, a drop in sea level (about -120 m with respect to today during the Last Glacial Maximum ), provided the total emergence of the northern Adriatic Sea, that represented a fluvial plain, allowing the storage of freshwater. Moreover, a lower sea level position could lead to a higher groundwater gradients towards offshore areas. On the contrary, during the interglacial ones, the sea level was some meters higher than the present one (about +8 m during the last transgression in the Middle/Late Pleistocene), with mainly starved conditions. During the deglaciation phases, the fluvial drainage fed by melting glaciers produced the deposition of sediment above the plain. Below these sediments, the several kilometres thick pre-Quaternary carbonate and terrigenous sequences seem to host mainly salty waters.

How to cite: Giustiniani, M., Busetti, M., Dal Cin, M., Barison, E., Cimolino, A., Brancatelli, G., and Baradello, L.: Potential Water Resources in the North-Eastern Adriatic Sea, EGU General Assembly 2023, Vienna, Austria, 23–28 Apr 2023, EGU23-9655, https://doi.org/10.5194/egusphere-egu23-9655, 2023.

Groundwater resources on barrier islands sustain both human lives and ecosystem functioning worldwide. A critical threat to these vital freshwater resources is the projected increase in frequency of storm-surges with climate change. These extreme events have the potential to salinize the aquifer, which increases the mortality of stabilizing vegetation and potentially causes substantial erosion. It is important to understand which types of systems are most vulnerable to better plan mitigation efforts. To that end, we collected data on water level and salinity at three different barrier islands along the east coast of the US. These study sites span a range of barrier island typologies, including differences in topography, vegetation, overwash frequency and connection to the ocean. The relationship between the various processes and the vulnerability to salinization was quantified using transfer function noise models (Pastas) and cross correlation. It was found that changes in groundwater head can be well represented with bay water levels, ocean water levels, recharge (both precipitation and evapotranspiration), and overwash events (periods of time when bay or ocean water levels exceed the land surface elevation of the wells). The data-based models indicate that ocean/bay levels are the primary driver of water level change close to the shore while in the center of the barrier islands precipitation is a more significant driver. Substantial differences were found between the different sites in terms of the dominating factors and the overall vulnerability. A sheltered maritime forest site showed minimal impact from storm surge overwash while a less sheltered marsh and maritime forest site showed a clear relationship between the height and duration of overwash events and the total amount of salinity observed in the wells. Finally, at a barren high energy beach site, storm surge appeared to both salinize the aquifer from the top and raise the freshwater-saltwater interface from below. These findings have important implications for management of barrier island groundwater resources, which is a vital resource that is compromised by future changes in storm surge frequency and intensity.

How to cite: Frederiks, R. S., Paldor, A., Donati, L., and Michael, H. A.: Groundwater resources in barrier islands are vulnerable to storm-surge salinization through various dominating processes, as revealed by data-based modeling, EGU General Assembly 2023, Vienna, Austria, 23–28 Apr 2023, EGU23-9687, https://doi.org/10.5194/egusphere-egu23-9687, 2023.

EGU23-10144 | Posters on site | HS8.2.6

Dynamics of trace elements during seawater intrusion in a sedimentary aquifer of western Mexico 

Abrahan Mora and Jürgen Mahlknecht

This study shows the dynamics of several trace elements in groundwater of a coastal sedimentary aquifer of western Mexico affected by seawater intrusion. The results of the chemical analyses performed in groundwater indicated that the elements Ba, Sr, Li, Fe, Co, V, Se, and Re are mobilized from the aquifer sediments to the aqueous phase during seawater intrusion, whereas Rb is removed from solution during salinization. Overall, the mobilization/removal of these elements may be due to processes such as cation exchange, the increase of the ionic strength due to increasing salinity and the weathering of biogenic carbonates in an oxidizing environment. Other elements such as Mo, Ni, Cr, Ta, and W displayed low or no mobilization during the seawater intrusion. This may indicate that dissolution of biogenic carbonates is not their main sources and that these elements are not affected by the ionic strength caused by groundwater salinization. Finally, other elements such as As, U, Ge, Sb, Cu, and Mn displayed an undefined tendency, showing concentrations above and around the theoretical seawater mixing line. These elements may be likely affected by other processes rather than seawater intrusion, which may explain their undefined tendency during groundwater salinization. In general, geochemical processes such as carbonate/sulfate complexation (in the case of U), organic matter complexation (in the case of Cu), metalloid co-occurrence (As, Ge, and Sb), and redox processes (in the case of As and Mn) may play a key role in determining the concentration levels of these elements in this coastal groundwater system affected by seawater-freshwater mixing.

How to cite: Mora, A. and Mahlknecht, J.: Dynamics of trace elements during seawater intrusion in a sedimentary aquifer of western Mexico, EGU General Assembly 2023, Vienna, Austria, 23–28 Apr 2023, EGU23-10144, https://doi.org/10.5194/egusphere-egu23-10144, 2023.

Water use in island is mostly dependent on groundwater. Saltwater intrusion has occurred in aquifers in island, and available freshwater is decreasing. Sea level rise due to the climate crisis is increasing the range of saltwater intrusion in coastal aquifers. Saltwater intrusion is driven by complex mechanisms in coastal aquifers, including sea level rise, decrease of fresh submarine groundwater discharge (FSGD) and pumping from coastal aquifers, and geologic properties of coastal aquifers. FSGD from coastal aquifers, coupled with sea level rise, has a significant impact on saltwater intrusion and can reduce the amount of available water resources. Previous FSGD studies have focused on local areas where a large amount of discharge is observed. The existence of FSGD was diagnosed or estimated through various approaches such as field observation, isotope tracking, and water balance analysis. In this study, quantitative analysis of FSGD was performed using the freshwater-saltwater interface estimation formula of coastal aquifers. The location of the freshwater-saltwater interface was calculated using the Ghyben-Herzberg (G-H) equation, and the freshwater above the interface was estimated by FSGD. The geographic information system (GIS) was used to estimate FSGD using observation data over a large area. It was used to interpolate the observation data in a large area in grid units, and the Inverse Distance Weight method was used as the interpolation method. The interpolated data was used to input data for estimating FSGD. The study area was Jeju Island, the largest island in Korea. Quantitative estimation of FSGD can be used as a scientific basis for establishing water resource management plans in island.

Acknowledgement

Research for this paper was carried out under the KICT Research Program (project no.20220275-001, Development of coastal groundwater management solution) funded by the Ministry of Science and ICT.


How to cite: Kim, I. H. and Chang, S.: Quantitative estimation of fresh submarine groundwater discharge in Jeju island using geographic information system, EGU General Assembly 2023, Vienna, Austria, 23–28 Apr 2023, EGU23-10384, https://doi.org/10.5194/egusphere-egu23-10384, 2023.

EGU23-10443 | Orals | HS8.2.6

Evolution of the groundwater system in the northern continental shelf of South China Sea since Late Pleistocene 

Jiu Jimmy Jiao, Chong Sheng, ShengChao Yu, and Xin Luo

The South China Sea (SCS) is a marginal sea of the Western Pacific Ocean with a broad continental shelf exposed since the last glacial maximum. Five enormous subaqueous deltas were developed in the then river deltaic estuaries and adjacent continental shelves of the SCS where buried paleochannel systems are widely distributed. Saline groundwater with salinity up to 25 g/L has been observed in the terrestrial aquifer system in the Pearl River Delta but freshened groundwater with salinity <1 g/L observed in the offshore part of the aquifer system in the subaqueous delta. Such a co-existence of both saline groundwater inland and freshened groundwater offshore in the same aquifer system is widely observed in other large-river deltaic estuaries and their adjacent shelves, but the mechanism for such a phenomenon is not much addressed in literature. Using the Pearl River Delta and its adjacent continental shelf in the northern margin of the SCS as an example, a sophisticated paleo-hydrogeologic model considering sea-level change, sedimentation processes, and precipitation variation in the past 50 ka is conducted to simulate the evolution of the groundwater system and is further calibrated with present porewater geochemistry data and stable isotopes. The results indicate that the offshore freshened groundwater was formed during the low-stands since the late Pleistocene, whereas the onshore saline groundwater was generated by paleo-seawater intrusion during the Holocene transgression and that the intrusion disconnected the onshore freshwater and offshore freshened groundwater bodies near coastlines. The response of the groundwater system to the paleoclimatic changes was delayed by about 7-8 ka, thus the paleoclimatic forcings still have a dominant influence on the present-day distribution of the groundwater salinity.

How to cite: Jiao, J. J., Sheng, C., Yu, S., and Luo, X.: Evolution of the groundwater system in the northern continental shelf of South China Sea since Late Pleistocene, EGU General Assembly 2023, Vienna, Austria, 23–28 Apr 2023, EGU23-10443, https://doi.org/10.5194/egusphere-egu23-10443, 2023.

EGU23-10642 | Posters on site | HS8.2.6

Effects of freshwater injection on tidally influenced coastal unconfined aquifers 

Xiayang Yu, Pei Xin, Zhaoyang Luo, and Li Pu

Freshwater injection is a practical and efficient solution to mitigate seawater intrusion in overexploited coastal aquifers. Previous studies predominantly considered isothermal conditions and overlooked temperature contrasts. How thermal effects of freshwater injection regulate flow processes and salinity distributions is poorly understood. This study investigated the dynamic characteristics of salinity distributions and seawater recirculation in coastal aquifers subjected to freshwater injection and tides. The processes were simulated using SUTRA-MS (a model simulating porewater flow coupled with salt and heat transport). The transience of upper saline plume and saltwater wedge responding to injected freshwater will be discussed here in detail. We will also discuss the thermal plume-induced changes in salinity distributions and water effluxes. Finally, the overshoot of total water efflux in response to the thermal impacts of freshwater injection will be discussed.

How to cite: Yu, X., Xin, P., Luo, Z., and Pu, L.: Effects of freshwater injection on tidally influenced coastal unconfined aquifers, EGU General Assembly 2023, Vienna, Austria, 23–28 Apr 2023, EGU23-10642, https://doi.org/10.5194/egusphere-egu23-10642, 2023.

EGU23-11444 | Posters on site | HS8.2.6

3D groundwater salinity mapping of the global coastal zone 

Gualbert Oude Essink, Daniel Zamrsky, Jude King, Joost Delsman, Jarno Verkaik, and Marc Bierkens

Accessible and reliable freshwater sources are essential for human communities and freshwater ecosystems worldwide. In coastal regions, groundwater is the main freshwater sources for drinking water thanks to its high quality, easy accessibility and relatively constant supply. Both anthropogenic (e.g. poor water management and rising population numbers) and natural (e.g. climate change related sea-level rise and storm surges) create additional pressure on coastal freshwater resources. This pressure can lead to declines in fresh groundwater availability caused by salinization and over-exploitation, especially in densely populated areas with intensive agricultural production that already have a high freshwater demand. Groundwater salinization can have severe negative impacts on environmental, economic and human health conditions in these areas. Understanding of current and future threats to fresh groundwater availability by salinization allows coastal communities to better adapt to these risks. Groundwater salinity models are typically applied to study groundwater salinization in local and regional settings and thus provide information for water management bodies to improve their mitigation and adaptation measures. The added value of a global 3D coastal groundwater salinity map would be that it provides important insights into the most threatened regions worldwide, while also identifying coastal regions with similar groundwater salinization risks and similar suitable mitigation and adaptation measures to tackle them. The global 3D groundwater salinity map can also be used as a starting point to evaluate future groundwater salinity developments under multiple climate change and socio-economic scenarios. Hitherto, there were several key obstacles preventing us from building a global 3D groundwater salinity map; the most important ones being the lack of standardized global hydrogeochemical, geological and geophysical datasets and inadequate computational resources and numerical codes. Recent developments in code parallelization (e.g. iMOD-WQ and in due time MODFLOW6) and access to high performance computing allows us to simulate global 3D groundwater salinity by splitting the world into smaller regional scale 3D groundwater salinity models and simulating these in parallel. Moreover, the advancement in available global datasets and creation of a unified global hydrogeological database and schematization allow us to better estimate regional subsurface conditions. Here, we demonstrate the process of building the global 3D groundwater salinity map and show its potential applications. Ultimately, identifying the most threatened regions in near future can lead to better water management strategies to limit the negative impacts of groundwater salinization on fresh groundwater resources, and/or to come up with strategies to explore additional new ones.

How to cite: Oude Essink, G., Zamrsky, D., King, J., Delsman, J., Verkaik, J., and Bierkens, M.: 3D groundwater salinity mapping of the global coastal zone, EGU General Assembly 2023, Vienna, Austria, 23–28 Apr 2023, EGU23-11444, https://doi.org/10.5194/egusphere-egu23-11444, 2023.

The river Neretva coastal aquifer system is the largest agricultural area along Croatia's Adriatic Sea coast. With the construction of an embankment, pumping stations, and melioration channels, a once-marshy area has been transformed into an area with favourable agricultural conditions.  Due to its proximity to the sea, numerous anthropogenic impacts in the region, and climate change, groundwater and surface water in the study area are presently significantly influenced by the salinization process. 
Multiple times per year, groundwater and surface water samples are collected to fully comprehend saltwater processes and the origin of saltwater in the study area. Within each sample, the concentration of major ions (K+, Na+, Ca+, Mg2+, Cl-, HCO3- and SO42-) is determined under laboratory conditions.
The analysis of major ions indicates that seawater intrusion is the primary source of salinization in both unconfined and confined aquifers. In contrast to unconfined aquifer, confined aquifer is minimally affected by precipitation and surface water regimes. In addition, samples of groundwater from unconfined aquifer are categorized into three groups based on their degree of contamination with seawater. The samples from the Diga area that are closest to the Adriatic Sea are most significantly influenced by the seawater. The groundwater quality in the Jasenska area varied significantly between dry and rain periods, whereas groundwater samples from the area of Vidrice revealed the lowest level of seawater contamination.   Neretva river surface water samples reveal the presence of a salt wedge, while river Mala Neretva samples indicate that river Mala Neretva is the primary source of freshwater in the study area during dry season.

How to cite: Lovrinovic, I., Aljinovic, I., and Srzic, V.: Evaluation of surface and groundwater quality and identification of saltwater sources by hydrogeochemical analysis in river Neretva coastal aquifer system, EGU General Assembly 2023, Vienna, Austria, 23–28 Apr 2023, EGU23-11976, https://doi.org/10.5194/egusphere-egu23-11976, 2023.

EGU23-12009 | ECS | Orals | HS8.2.6

Visualizing reaction zones in tidal subterranean estuaries using physical tank experiments 

Nele Grünenbaum, Janek Greskowiak, Rezwana Binte Delwar, and Gudrun Massmann

In coastal aquifers, terrestrial freshwater and seawater mix and form typical compartments in the subsurface (subterranean estuary, STE), a zone of intense biogeochemical reactions. Flow and transport processes are mainly driven by density differences and- if present- tides. Typically, an upper saline plume is encountered overtopping a freshwater discharge tube and a saltwater wedge. Contrary to the general view of the hydraulic conditions in the STE, latest studies proclaim that the subsurface salinity distribution is less stable and more dynamic than previously thought, especially under the influence of strong morphodynamics. Also, the occurrence of the phenomena of fingering flow has been observed in modelling studies. In this study, physical tank experiments were conducted to compare unstable and stable flow conditions in the STE with respect to the formation of iron oxides that may form in the transition zone between the oxygen-free, iron(ii)-containing, terrestrial freshwater and the oxygen-rich seawater. The results illustrate how biogeochemical processes in the STE are linked to the hydrodynamics as salt fingering flow strongly influenced the location and extent of ferric iron oxidation and the precipitation of Fe(III)hydroxides.

How to cite: Grünenbaum, N., Greskowiak, J., Binte Delwar, R., and Massmann, G.: Visualizing reaction zones in tidal subterranean estuaries using physical tank experiments, EGU General Assembly 2023, Vienna, Austria, 23–28 Apr 2023, EGU23-12009, https://doi.org/10.5194/egusphere-egu23-12009, 2023.

EGU23-12120 | Orals | HS8.2.6

A large-scale laboratory experiment of seawater intrusion in heterogeneous aquifers affected by drought periods 

Paolo Salandin, Enrica Belluco, Luigi Bottegal, Matteo Camporese, Elena Crestani, Giovanna Darvini, Pietro Giaretta, and Tommaso Trentin

Most density-dependent flow and transport models assume homogeneity of natural aquifers, a strong simplification with respect to reality, while subsurface formations are known to have spatially variable properties (e.g. Freeze, 1975). Previous studies of saltwater intrusion in heterogeneous aquifers have considered mainly macro-scale geological structures, but the effects of local heterogeneities on density-dependent flow and transport are known to be highly affected by spatially correlated distributions of hydraulic conductivities (e.g., Dagan and Zeitoun, 1998, Prasad and Simmons, 2003, Li et al., 2022). Moreover, investigations have been performed mainly via numerical modeling and, to the best of our knowledge, only in one case numerical results have been compared with physical evidence from laboratory reproduction of a heterogeneous media (Koch and Starke, 2001).

The present work describes the design and the realization activities developed to reproduce a controlled heterogeneous porous media in a laboratory flume, aimed at defining the influence of the hydraulic conductivity spatial variability on the density-dependent transport in coastal phreatic aquifers.

The sandbox measures 500 cm long by 30 cm wide by 60 cm high, with 3 cm thick plexiglass walls. Two tanks are located upstream and downstream of the sandbox, with volumes of approximately 0.5 m3 and 2.0 m3, respectively. The upstream tank is filled with fresh-water and is continuously supplied by a small pump, providing fresh-water recharge. The downstream tank is filled with salt-water, previously prepared by adding salt to fresh-water till a proper density is reached, and it represents the sea. In both tanks the level is maintained constant via two spillways, whose height can be adjusted. The discharge through the downstream spillway can be measured.

The flume has been used in previous works (Bouzaglou et al., 2018, Crestani et al., 2022), but here the homogeneous porous media has been substituted by three different nominal size ranges of glass beads, equal to 0.3-0.4, 0.4-0.8 and 1.0-1.3 mm respectively, organized in 250 cells, each of size 20x30x5 cm3 to reproduce a prescribed statistical anisotropic structure (Figure 1).

Figure 1- Sandbox 3D view from upstream (left side) to downstream (right side)

After a preliminary analysis carried out by constant head permeameter tests on each glass beads nominal size range, the hydraulic characterization of the whole heterogeneous formation has been developed considering the filtration process that affects different thicknesses of the aquifer (10, 20, 30, 40 cm) forced by three upstream-downstream head differences (2, 4 and 6 cm).

During the saltwater intrusion experiment a water level difference upstream - downstream of 2 cm has been maintained for 8 days, introducing two separate drought periods (about 8 and 10 hours) at the end of the second and of the third days respectively.

The findings from the heterogeneous media characterization and the seawater advance-retreat phenomenon are discussed in comparison with the results of a numerical model.

This study has been co-funded by the Interreg Italy–Croatia CBC Programme 2014–2020 (Priority Axes: Safety and Resilience) through the ERDF as a part of the projects MoST (AID: 10047742) and SeCure (AID: 10419304).

How to cite: Salandin, P., Belluco, E., Bottegal, L., Camporese, M., Crestani, E., Darvini, G., Giaretta, P., and Trentin, T.: A large-scale laboratory experiment of seawater intrusion in heterogeneous aquifers affected by drought periods, EGU General Assembly 2023, Vienna, Austria, 23–28 Apr 2023, EGU23-12120, https://doi.org/10.5194/egusphere-egu23-12120, 2023.

EGU23-12125 | ECS | Posters on site | HS8.2.6

Approaches and methodologies to monitor and mitigate saltwater intrusion in the Adriatic coastal plains 

Marta Cosma, Ester Zancanaro, Iva Aljinović, Francesco Morari, Veljko Srzić, Pietro Teatini, Luigi Tosi, Alessandro Bergamasco, Anna Botto, Matteo Camporese, Chiara Cavallina, Cristina Da Lio, Sandra Donnici, Ivan Lovrinović, Ivan Racetin, Luca Zaggia, Claudia Zoccarato, and Paolo Salandin

Saltwater intrusion in coastal aquifers is a global problem recently worsened by anthropogenic activities (e.g., aquifer overexploitation, hydraulic reclamation and drainage of low-lying areas) and climate change effects (e.g., severe droughts, sea level rise) that contribute to reduce groundwater natural recharge, water quality, and agricultural production. Many low-lying coastal plains facing the Adriatic Sea are strongly affected by saltwater intrusion with serious consequences on agricultural activities and tourism that may become dramatic in a relatively short time due to climate change. In this framework, this work aims to identify monitoring strategies to characterize the process of saltwater intrusion under the effects of climate change and recommend appropriate countermeasures in two Adriatic low-lying coastal plain: south of the Venice Lagoon (north-eastern Italy), and at the Neretva River mouth (south-eastern Croatia).

Geomorphologic, stratigraphic, hydrogeologic, and agricultural data were collected to characterize the aquifer system at both sites and assess the effects of seawater intrusion on agricultural productivity. Saltwater intrusion was monitored and analysed through monitoring systems that provide qualitative and quantitative information on the processes influencing groundwater and surface water dynamics within the two coastal systems. Moreover, laboratory physical models were developed to serve as benchmarks for the numerical models used to simulate the field results. Numerical modelling reliably implements boundary and initial conditions defined in-situ on both sites, simulates existing states, specifies different scenarios, and predicts salinization dynamic changes caused by climate changes.

The results of the research activities include the development of specific tools for the management of agriculture-related activities and freshwater resources in coastal areas including vulnerability assessment, mitigation plans, and countermeasures against salt contamination. These results were obtained by integrating the findings gained on both sites, considering differences and peculiarities of the specific areas that are representative of many low-lying plains located on both sides of the Adriatic coast.

This study has been funded by the contribution from the EU cofinancing and the Interreg Italy–Croatia Cross Border Collaboration (CBC) Programme 2014–2020 (Priority Axes: Safety and Resilience) through the European Regional Development Fund as a part of the projects MoST  (AID: 10047742) and SeCure (AID: 10419304).

How to cite: Cosma, M., Zancanaro, E., Aljinović, I., Morari, F., Srzić, V., Teatini, P., Tosi, L., Bergamasco, A., Botto, A., Camporese, M., Cavallina, C., Da Lio, C., Donnici, S., Lovrinović, I., Racetin, I., Zaggia, L., Zoccarato, C., and Salandin, P.: Approaches and methodologies to monitor and mitigate saltwater intrusion in the Adriatic coastal plains, EGU General Assembly 2023, Vienna, Austria, 23–28 Apr 2023, EGU23-12125, https://doi.org/10.5194/egusphere-egu23-12125, 2023.

EGU23-12823 | ECS | Orals | HS8.2.6

Assessing different methods to quantify Submarine Groundwater Discharge 

Júlia Rodriguez-Puig, Valentí Rodellas, Marc Diego-Feliu, Aaron Alorda-Kleinglass, Irene Alorda-Montiel, Marisol Manzano, Andrés Alcolea, Joaquín Jiménez-Martínez, and Javier Gilabert

Submarine Groundwater Discharge (SGD) is recognized as a major source of water and solutes to the coastal ocean, and it is particularly relevant in arid or semi-arid zones. SGD is generally defined as the flow of groundwater from continental margins to the coastal ocean, including thus both fresh groundwater from aquifer recharge and seawater recirculation through the coastal aquifer. Due to its high heterogeneity both in space and time, SGD is difficult to detect and quantify. As a consequence, numerous methods to study SGD have been developed over the last decades. These approaches mainly include hydrogeological approaches, geophysical techniques, direct seepage measurements, and the use of geochemical tracers. Each method presents its challenges, limitations, and advantages and each one works on different spatial and temporal scales, thus targeting different components of SGD. Therefore, comparing SGD studies with estimates derived from different methods is often complex and misleading if the characteristics and assumptions of each quantification technique are not taken into account. This highlights the need to conduct studies comparing SGD derived from different methods, not only to obtain more accurate SGD estimates but also to obtain instrumental information on the characteristics of the estimated fluxes. To this aim, a combined use of different approaches to estimate SGD was applied in a Mediterranean coastal lagoon (Mar Menor, Spain), including direct measurements with seepage meters, radium isotopes, and radon mass balance, 224Ra/228Th disequilibrium in coastal sediments, radon vertical profiles in porewater sediments, and hydrologic modeling. Mar Menor is Europe's biggest saline coastal lagoon, and it is connected to a highly anthropized quaternary aquifer. In this coastal system, SGD is likely playing a major role in the eutrophication of the lagoon. However, despite the economic and biological importance of this lagoon, data about this system is still incomplete, and mostly only hydrological modeling has been performed.


Keywords: Submarine Groundwater Discharge, radioactive tracers, seepage meters, porewater exchange, hydrological modeling.

How to cite: Rodriguez-Puig, J., Rodellas, V., Diego-Feliu, M., Alorda-Kleinglass, A., Alorda-Montiel, I., Manzano, M., Alcolea, A., Jiménez-Martínez, J., and Gilabert, J.: Assessing different methods to quantify Submarine Groundwater Discharge, EGU General Assembly 2023, Vienna, Austria, 23–28 Apr 2023, EGU23-12823, https://doi.org/10.5194/egusphere-egu23-12823, 2023.

EGU23-13371 | Orals | HS8.2.6

Ecosystem services derived from SGD: a perspective from traditional and academic knowledge in Mediterranean societies 

Aaron Alorda-Kleinglass, Isabel Ruiz-Mallen, Valentí Rodellas, Sergio Rossi, Genuario Belmonte, Marc Diego-Feliu, and Jordi Garcia-Orellana

Submarine Groundwater Discharge (SGD) is recognized as a fundamental hydrological process that supports many coastal biogeochemical cycles and social-ecological systems. However, very little has been investigated about how SGD affects society and human well-being. Coastal services provided by ecosystems dependent on SGD can be analyzed and clustered into the four main categories of Ecosystem Services (i.e., Provisioning, Supporting, Regulating and Cultural), which are divided into subcategories defined as outcomes. This enables identifying and discussing both benefits and threats to coastal societies resulting from SGD outcomes. Due to the lack of academic literature on this matter, here we explore the academic and local knowledge of the social perception toward SGD and its ecosystem services (ES). This research is conducted through two case studies, the island of Mallorca and the Region of Salento, to unravel the similarities and particularities of each Mediterranean society regarding the SGD-ES identified and their historical evolution. Such evolution transitions from the management of the fresh groundwaters for human consumption to the exploitation by the tourism industry of cultural ecosystem services related to the same discharge. Our review also shows how compiling different search possibilities (e.g., local languages, including paper-based documents; grey literature; local knowledge; academic literature) has resulted in a significant increase in the reported ES and its understanding. In this direction, combing traditional and academic knowledge are key to accessing society's perception of most cultural ES. Therefore, SGD-ES studies are extremely locally-dependent, and thus regional or global require an in-depth understanding of all areas comprehended in the study. Overall, the research presented in this study contributes to a better understanding of the complexity of the SGD and its social implications. Therefore, this research presents to the academic community new insights from traditional knowledge and an opportunity to integrate multidisciplinarity into a study subject that has usually only been looked from the prism of natural sciences.

How to cite: Alorda-Kleinglass, A., Ruiz-Mallen, I., Rodellas, V., Rossi, S., Belmonte, G., Diego-Feliu, M., and Garcia-Orellana, J.: Ecosystem services derived from SGD: a perspective from traditional and academic knowledge in Mediterranean societies, EGU General Assembly 2023, Vienna, Austria, 23–28 Apr 2023, EGU23-13371, https://doi.org/10.5194/egusphere-egu23-13371, 2023.

EGU23-13500 | ECS | Orals | HS8.2.6

How are radiotracers shaping the research in submarine groundwater discharge? 

Marc Diego-Feliu, Valentí Rodellas, Aaron Alorda-Kleinglass, Júlia Rodriguez-Puig, Irene Alorda-Montiel, and Albert Folch

The use of radiotracer techniques has been a fundamental tool for characterizing fluxes of solutes and water flows into the coastal ocean driven by submarine groundwater discharge (SGD). Indeed, the scientific interest in the use of radionuclides as tracers of SGD started developing in the late 90s when high activities of Ra isotopes and 222Rn in the coastal ocean were associated with groundwater inputs. Since then, the number of articles published about SGD has considerably grown and the technical improvements in radiotracer methods have often been accompanied by concurrent scientific advances in the understanding of the process. Although current research in SGD is conducted through multiple techniques (direct measurements, hydrological, geophysical, and geochemical techniques), the use of tracers such as Ra isotopes and 222Rn continues to be the most used and widespread method. Therefore SGD estimates are likely to be highly dependent on the methodological biases associated with radiotracer techniques. The aim of this study is to evaluate the main biases and assumptions relative to the use of Ra isotopes and 222Rn in SGD studies through a meta-analysis of the published academic literature. The results of this work highlight that a significant number of SGD studies using radionuclides as tracers are based on erroneous assumptions or inaccurate calculations leading to unreliable SGD quantifications, thus preventing its use for comparison with other studies or extrapolating from local to regional-global scale. These results also emphasize that the SGD community should seek comparison, reproducibility, and multiapproach studies that help to understand the complexity of SGD in multiple sites and bridge the gap between different quantification methods.

How to cite: Diego-Feliu, M., Rodellas, V., Alorda-Kleinglass, A., Rodriguez-Puig, J., Alorda-Montiel, I., and Folch, A.: How are radiotracers shaping the research in submarine groundwater discharge?, EGU General Assembly 2023, Vienna, Austria, 23–28 Apr 2023, EGU23-13500, https://doi.org/10.5194/egusphere-egu23-13500, 2023.

Coastal communities in dry and semiarid areas confront a severe scarcity of potable water. To meet the requirements of a growing population by increased inland groundwater pumping, led to saltwater intrusion, which eventually rendered the available water unfit for human use. According to studies, desalination plants using saline groundwater as feed water (subsurface intake) might alleviate the problems with coastal water supply and quality. In this context, it becomes imperative to understand the saltwater transport and the associated flow and mixing process when saline groundwater is pumped from beneath the freshwater-saltwater interface. Hence to ascertain the effect of saline groundwater pumping on the hydrodynamics, a standard test aquifer was simulated using the finite difference model SEAWAT. The hydrodynamics is quantified by the entrained saltwater which will influence width of mixing zone, length of intrusion of toe and discharge of Darcy flux back to sea. Entrained water is the amount of saltwater entrained through freshwater - saltwater transition zone, for a steady and stable (lighter freshwater above heavier saltwater) flow system in an aquifer. Performance analysis were carried out to infer the influence of pumping rates on the velocity of entrainment. The results indicate that the mixing zone changed from having a sloping shape to one that was partly vertical and partially sloping, resulting in the establishment of a mixed water interface adjacent to the saline groundwater well. It is likely that there exist modest density gradients between the two fluids, but they quickly attained equilibrium due to the localized velocity change that was observed. Pumping induced more saltwater into the aquifer, which get pumped out restricting the further inland invasion of wedge. Understanding this interaction is crucial in order to determine the method's mitigation potential prior to adopting subsurface input for desalination. 


How to cite: Narayanan, D. and t i, E.: Numerical investigations of change in hydrodynamics of a coastal aquifer due to saline groundwater pumping , EGU General Assembly 2023, Vienna, Austria, 23–28 Apr 2023, EGU23-13948, https://doi.org/10.5194/egusphere-egu23-13948, 2023.

EGU23-14176 | Orals | HS8.2.6

Seawater Intrusion and Submarine Groundwater Discharge studies at the Argentona site in Spain 

Jesús Carrera, Laura Martínez-Pérez, Linda Luquot, Tybaud Goyetche, María Pool, Andrea Palacios, Laura del Val, Philippe A. Pezard, Marc Diego-Feliu, Valenti Rodellas, Juanjo Ledo, and Albert Folch

We describe an intermediate scale experimental field site located in a coastal alluvial aquifer at the mouth of the Argentona ephemeral stream on the Maresme coastline (Barcelona, Spain). We have been monitoring Seawater Intrusion (SWI) and Submarine Groundwater Discharge (SGD) for several years using geological (lithological description and core samples analyses), geophysical (downhole and cross-hole measurements), hydraulics (pumping and tidal response tests) and hydrochemical (major and minor elements), and geophysical methods (cross-hole electrical resistivity. We have found that apparently minor silt layers control the distribution of salinity, with SWI and freshwater SGD occurring at multiple layers. This multiplicity of salinity levels promotes unstable mixing, which is very active and leads to a surprising bio-geochemical activity in the mixing zone. In parallel, instability makes it hard to sample SGD and makes it clear that the traditional SWI-SGD paradigm needs to be revised.

How to cite: Carrera, J., Martínez-Pérez, L., Luquot, L., Goyetche, T., Pool, M., Palacios, A., del Val, L., Pezard, P. A., Diego-Feliu, M., Rodellas, V., Ledo, J., and Folch, A.: Seawater Intrusion and Submarine Groundwater Discharge studies at the Argentona site in Spain, EGU General Assembly 2023, Vienna, Austria, 23–28 Apr 2023, EGU23-14176, https://doi.org/10.5194/egusphere-egu23-14176, 2023.

EGU23-15067 | Orals | HS8.2.6

Riverine and submarine groundwater discharges into the Mediterranean Cilician Basin and their impact on the marine water and nutrient budget 

Korhan Özkan, Burak Kuyumcu, Serhat Ertuğrul, İdil Ilgaz Kaya, C. Serdar Bayari, S. Fatih Özmen, Kanchan Maiti, Koray Özhan, and Ekin Akoglu

Terrestrial water fluxes and nutrient inputs are the major components of marine nutrient budget. Nutrient fluxes through surface and groundwater pathways are especially important for coastal eutrophication and pelagic productivity. Cilician Basin of the Eastern Mediterranean experiences coastal eutrophication, and the roles of surface and underground discharges have not been assessed. We conducted nutrient and 228Ra monitoring surveys during 2021 and 2022 to elucidate the relative contributions of riverine and submarine groundwater discharges (SGD) to the Cilician basin nutrient/water budget. All major rivers (8 sites) and neighboring groundwater have been monitored for nutrient concentrations and 228Ra activities monthly throughout 2022. Further, coastal groundwater wells at four different depths (0-50 m) and its neighboring river were sampled twice a week during the same time period as an intensive observation site (METU-IMS) to elucidate high-frequency temporal dynamics in the nutrient concentrations. We also conducted two basin-wide marine surveys to determine 228Ra activities in the Cilician basin water masses during dry (summer) and wet (spring) seasons. Finally, we constructed a mass-balance box model using 228Ra activities to estimate the relative flux of SGD in relation to the fluxes from regional rivers. The residence times were calculated to estimate 228Ra offshore exchange rates using a Lagrangian particle tracking model.

Nutrient monitoring around the catchment revealed very high nutrient concentrations in both river water (PO4: 0.02-79 µM, TIN: 2.7-1302 µM, SiO4: 5-542 µM) and groundwater (PO4: 0.02-11 µM, TIN: 1.91-1187 µM, SiO4: 6.6-1082 µM).  Concentrations in the river water indicate potential annual riverine N, P, Si loads of 29.1, 0.5, 19.8 Kt/year, respectively. The mean TIN:PO4 ratio in the groundwater might be as high as c. 400, suggesting that SGD can be one of the main drivers of the Eastern Mediterranean’s phosphate limitation. The high-frequency observations in river and groundwater at METU-IMS site revealed significant variability both in N and P concentrations, which might reflect patterns in extreme weather events as well as agricultural activities. Based on a limited set of samples 228Ra activities ranged between c.40-174 dpm.m-³ in the river water and between c. 43-257 dpm.m-³ in the groundwater during the wet season, indicating lower activities than previous estimations.

The preliminary results of the box model simulations suggested that the total SGD can be comparable or even dramatically larger (max of 60) than the annual riverine flux into the basin. The sensitivity analyses indicated that the variability and potential overestimation of SGD flux were mostly due to the variability in marine water mass residence time estimations, measurements of groundwater 228Ra activities and the lack of saline end-member activities. We currently measure the remaining set of samples for 228Ra activities, diversify end-member samplings, and calibrate basin-wide mass-balance model to decrease the uncertainty in our estimations of the SGD budget for the region. Overall, we documented a large N and P load from Cilician Basin catchments with significant temporal intra-annual variability. Furthermore, the 228Ra activities across the Cilician basin as well as its catchments indicate the predominant role of SGD in the Eastern Mediterranean water and nutrient budget.

How to cite: Özkan, K., Kuyumcu, B., Ertuğrul, S., Kaya, İ. I., Bayari, C. S., Özmen, S. F., Maiti, K., Özhan, K., and Akoglu, E.: Riverine and submarine groundwater discharges into the Mediterranean Cilician Basin and their impact on the marine water and nutrient budget, EGU General Assembly 2023, Vienna, Austria, 23–28 Apr 2023, EGU23-15067, https://doi.org/10.5194/egusphere-egu23-15067, 2023.

EGU23-15232 | Orals | HS8.2.6

New developments in the field of global coastal groundwater salinity modelling and mapping 

Gualbert Oude Essink, Daniel Zamrsky, Jude King, Joost Delsman, Jarno Verkaik, and Marc Bierkens

Freshwater availability at densely populated coastal zones around the world is at risk. The need for freshwater sources will increase the coming decennia as a result of population growth, higher demand of freshwater of good quality, sealing of groundwater systems in urbanized areas, and climate change leading to sea-level rise and increased storm surges (causing saline water overwash). As water quantity and quality requirements for agricultural, industrial and domestic use in many coastal areas around the world are regularly not satisfied by surface waters, coastal fresh groundwater is normally a reliable alternative. But this may change for the worse as salinization processes and overexploitation jeopardizes fresh groundwater resources, negatively affecting health via too salty drinking water and/or food production.

To give better advice to different clients on optimal sustainable freshwater use, we need to increase our understanding and quantification of coastal groundwater salinization, particularly at places where limited data availability and system understanding hinder the proper use of fresh groundwater. This presentation will enlighten some recent developments in the field of global modeling and mapping of coastal groundwater salinity. These developments make it possible to create global-scale groundwater salinity models that can be used to create storylines of, for instance, fresh groundwater availability in the coastal zone, offshore fresh groundwater volumes, submarine groundwater discharge. It supports the achievement of sustainable development goals like SDG6 (clean water and sanitation), and indirectly SDG1 (no poverty), SDG2 (zero hunger) and SDG3 (good health and well-being via drinking water quality and effect groundwater salinization on the risks of heart diseases).

We are currently close to creating a global-scale groundwater salinity model for coastal zones for several reasons. This presentation will elaborate on that. The widely used SEAWAT code for groundwater salinity modelling has been made parallel, which allows for faster and more accurate global projections at high spatial resolutions. Additionally, the number of open source global hydrogeological databases available on web portals is increasing. These databases, along with text and data mining techniques, make it possible to collect hydrogeological data from articles and grey literature. The regional and local data is used to improve the reliability of the model via calibration and validation.

Innovative data collection methods, such as using rapid and cost-effective airborne EM surveys, drones for remote areas, and smartphone apps for citizen-generated data collection, are also being used to map groundwater salinity on a regional scale. Advanced interpolation techniques are available to transform the collected data into 3D groundwater salinity distributions. Initiatives like GROMOPO are working to improve coastal geology (beyond GLHYMPS) and associated flow parameters. Parallel computer power is used to simulate reconstruction of past hydrogeological conditions in data-poor areas to improve understanding of present groundwater salinity.

The model can assess the impact of "compound events" on saltwater intrusion, such as sea level rise and storm surges in subsiding over-exploited coastal areas while freshwater infiltration is reduced by urban development. It can also be used to develop strategies for managing fresh groundwater, such as Managed Aquifer Recharge.

How to cite: Oude Essink, G., Zamrsky, D., King, J., Delsman, J., Verkaik, J., and Bierkens, M.: New developments in the field of global coastal groundwater salinity modelling and mapping, EGU General Assembly 2023, Vienna, Austria, 23–28 Apr 2023, EGU23-15232, https://doi.org/10.5194/egusphere-egu23-15232, 2023.

EGU23-15408 | ECS | Orals | HS8.2.6

Automated vertical Self Potential gradient logging and analysis for the tracking of Saline Intrusion 

Tom Rowan, Raymond Flynn, Adrian Butler, Matthew Jackson, Gerard Hamill, and Shane Donohue

Climate change associated sea level increases and projected growth in global water consumption of about 1% per year (WWAP, 2018) are expected to place further demands on already heavily utilized coastal groundwater supplies. Water stress is anticipated to become more critical over the next decades (Werner and Simmons, 2009). Society’s over-reliance on coastal freshwater abstraction had led to an increased threat of Saline Intrusion (SI). In spite of these challenges, no widely applicable methods of tracking saline fronts in the subsurface exist, even though this capability could prove critical to stopping over abstraction (pumping) before SI occurs; observational boreholes offer a limited warning, and resistivity imaging is often too expensive and logistically infeasible, (MacAllister et al. 2016). An alternative approach to detecting imminent SI is needed. The ongoing goal of this work is to develop a robust and low-cost method of tracking SI in the sub-surfaces. 

Naturally occurring voltages, known as Self Potential (SP), occur when pressure and concentration gradients in the subsurface cause ion separations (Jackson et al., 2012) SP can be used to track SI, so long as the signal source mechanism is understood. There are two key sources of SP widely encountered in hydrology, those induced by pressure, electro-kinetic potentials (VEK), and exclusion-diffusion potentials (VED), due to ion concentration gradients moving through the subsurface.  

SP signals are generated relative to static reference electrodes, offering a signal reading per electrode. However, these signals drift over time making interpretation and comparison challenging. We present findings and insights of an investigation using travelling SP electrodes, moving vertically inside boreholes or wells, to generate SP profiles. Results offer new insights into relationships between SP and SI when logged over time. Profiles taken over the last year at a variety of coastal and inland sites in the UK build upon results from a controlled pumping experiment in Northern Ireland, completed in 2020 and which attempted to interpret these patterns and signals through machine learning. Filtering out background noise sources, (such as electrical interferance, tides, Magneto Telluric effects etc.) has allowed signatures to be more confidently generated and related SI under contrasting hydrogeological regimes. This novel methodology and initial findings are presented and the scope for widely application of the method discussed.


References

Jackson, M. D., et al.   (2012). Measurements of spontaneous potential in chalk with application to aquifer characterisation in the southern UK quarterly. J. Eng. Geol. Hydrogeol.

MacAllister, et al. (2016), Tidal influence on self-potential measurements, Journal Geophysical Research Solid Earth.

Werner, A.D., Simmons, C.T., (2009), Impact of sea‐level rise on seawater intrusion in coastal aquifers. Ground Water.

WWAP, (2018), The United Nations World Water Development Report 2018: Nature-Based Solutions for Water. Paris, UNESCO.


How to cite: Rowan, T., Flynn, R., Butler, A., Jackson, M., Hamill, G., and Donohue, S.: Automated vertical Self Potential gradient logging and analysis for the tracking of Saline Intrusion, EGU General Assembly 2023, Vienna, Austria, 23–28 Apr 2023, EGU23-15408, https://doi.org/10.5194/egusphere-egu23-15408, 2023.

EGU23-15503 | Orals | HS8.2.6

Numerical investigation of offshore freshened groundwater reservoirs in the East China Sea 

Ariel Thomas, Shuangmin Duan, Zhihui Zou, and Aaron Micallef

Offshore freshened groundwater (OFG) has been proven to exist in continental margins around the world and has been identified as a potential unconventional water resource. In China, freshwater resources are very limited in the developed coastal areas and islands. Buried paleo-channels associated with the ancient Changjiang (Yangtze) river are suspected to be viable hosts of a offshore freshened groundwater reservoir system in the East China Sea, North of Chengsi island. In this study, we used an integrated modeling approach to predict OFG potential and optimize the design of a controlled source electromagnetic survey to image the reservoir. We develop a conceptual 2D geological model of the Quarternary sediments in the region. Porosity and permeability values were assigned based on borehole observations to produce a hydrogeological model. We present the results of a numerical modeling study of groundwater transport and variable density flow as a result of sea-level fluctuation over the past 200,000 years. Based on the bathymetry, the present-day shelf was sub-aerially exposed to meteoric recharge for most of that period. We considered a range of recharge scenarios and the simulation results indicate a high likelihood that freshwater reservoirs would be preserved until present day. Two freshwater intervals were observed between 80 m – 100 m, and 200 m – 300 m below the seafloor. A layered resistivity model was designed based on the observation of two primary freshwater reservoir layers in the flow model. Numerical tests were carried out on the feasibility of controlled- source electromagnetic method in the study area to optimize the survey setup. This approach can be adapted for offshore freshened groundwater prospecting in other siliciclastic shelf environments.

How to cite: Thomas, A., Duan, S., Zou, Z., and Micallef, A.: Numerical investigation of offshore freshened groundwater reservoirs in the East China Sea, EGU General Assembly 2023, Vienna, Austria, 23–28 Apr 2023, EGU23-15503, https://doi.org/10.5194/egusphere-egu23-15503, 2023.

EGU23-15557 | ECS | Orals | HS8.2.6

Detailed monitoring and simulation of groundwater salinity in response to extractions in a coastal aquifer system 

Thijs Hendrikx, Gualbert Oude Essink, Marios Karaoulis, and Marc Bierkens

High-resolution three-dimensional variable-density groundwater flow and coupled salt transport models (abbreviated 3D-VD-FT models) are useful instruments to support coastal groundwater management strategies and to forecast impacts of climate change. However, the ability of 3D-VD-FT models to provide accurate groundwater salinity predictions depends on computational capabilities, availability of sufficient and adequate high-resolution data and understanding of coastal groundwater salinity processes in the subsurface. Often, local aquifer heterogeneities are simplified in numerical models. In doing so, flow and transport are simplified, and consequently, local groundwater salinity changes become difficult to predict accurately.


New avenues in data acquisition and computational methods have opened up the possibility to greatly improve the accuracy of predictions. Recent developments in innovative geophysical monitoring methods are able to observe salinity and (indirect) flow velocities in detail. For instance, one can use automated measurements with Electrical Resistivity Tomography (abbreviated ERT) to monitor salinity changes. In addition, new parallelization methods are able to overcome computational challenges that plague 3D-VD-FT models.


In this research, we are examining the ability of 3D-VD-FT models to reproduce observed groundwater salinity changes during multi-level groundwater extractions and the impact of these extractions on upconing and subsequent downconing of brackish and saline groundwater. To achieve this, we are developing a 3D-VD-FT model that is able to simulate groundwater salinity changes at high resolution that occur in response to multi-level groundwater extractions during the brackish groundwater extraction pilot project FRESHMAN in Scheveningen. The FRESHMAN project allows for a unique view in the subsurface during groundwater extractions due to close monitoring by innovative geophysical monitoring methods such as ERT.


Preliminary results show that heterogeneity of the aquitard in the study area can affect the ability of the 3D-VD-FT model to reproduce observed groundwater salinity changes. For instance, accounting for potential high conductivity conduits in the aquitard can improve the fit of the observed upconing to the simulated upconing. To account for heterogeneity of the aquitard, sequential indicator simulation will be applied to generate multiple realizations of the aquitard. For each realization, the 3D-VD-FT model will be run and results subsequently evaluated in terms of fit and the best-fitting realizations selected. In addition, for the selected best fit realizations, hydrogeological model parameters will be further optimized using PEST in combination with chloride measurements.

How to cite: Hendrikx, T., Oude Essink, G., Karaoulis, M., and Bierkens, M.: Detailed monitoring and simulation of groundwater salinity in response to extractions in a coastal aquifer system, EGU General Assembly 2023, Vienna, Austria, 23–28 Apr 2023, EGU23-15557, https://doi.org/10.5194/egusphere-egu23-15557, 2023.

EGU23-15562 | ECS | Orals | HS8.2.6

Fingering Flow in the Subterranean Estuary under Tidal Influence 

Rezwana Binte Delwar, Nele Grünenbaum, Janek Greskowiak, and Gudrun Massmann

In a coastal aquifer under tidal influence, seawater recirculates beneath the intertidal zone along the classical saltwater wedge (SW). The recirculating seawater on top of the saltwater wedge is called upper saline plume (USP). In between the USP and SW, a freshwater discharge tube (FDT) prevails. Both fresh and saline water components leave the aquifer and flow into the sea as submarine groundwater discharge (SGD). Due the density-gradient across the saline/fresh interface, the USP is prone to instability, resulting in the fingering flow. Whether the USP becomes instable or not depends on several factors, for instance, hydrological (tidal amplitudes, storm surges, precipitation, freshwater flux), morphological (beach slope, aquifer depth), and physical-chemical (temperature, pressure, and dissolved solids of the fluid) boundary conditions as well as aquifer physical properties (porosity, permeability). Unstable USP, which tends to sink to the bottom of the aquifer generating salt fingers, has been described in the context of numerical studies and physical experiments. Yet, flow and transport patterns and the effects of the boundary conditions and parameters described above are not well understood. USP alters the travel path and time of terrestrial nutrients, metals, and contaminants from the coastal aquifers to the marine environment, necessitating a thorough investigation to reveal its critical role in the hydrological cycle. 

For the present study, laboratory sand tank experiments have been carried out to evaluate the effect of homogeneous/heterogeneous conditions, beach slope, fresh groundwater influx and tidal amplitude on USP instability. The results have been used to delineate the conditions that either promote or suppress fingering flow in a tide affected aquifer.  The results define beach slope as the foremost parameter, along with tidal frequencies and beach morphology for the instability of USP. The tank experiments also support the general idea that the presence of low permeable layers disrupts USP formation. Regardless of the aquifer medium, the 3D effect of the salt fingers was observed during the experiments. Furthermore, the laboratory results are found to be consistent with results from previously undertaken generic simulations for field scale conditions. It appears that both laboratory and field scale behavior can be predicted in previously developed non-dimensional stability diagram that separates unstable from stable conditions. 


How to cite: Delwar, R. B., Grünenbaum, N., Greskowiak, J., and Massmann, G.: Fingering Flow in the Subterranean Estuary under Tidal Influence, EGU General Assembly 2023, Vienna, Austria, 23–28 Apr 2023, EGU23-15562, https://doi.org/10.5194/egusphere-egu23-15562, 2023.

EGU23-15750 | ECS | Posters on site | HS8.2.6

Detailed characterization of biogeochemical processes in coastal aquifers: variations along the subterranean estuary-mixing zone at the MEDISTRAES experimental site 

Bella Almillategui, Albert Folch Sancho, Valenti Rodellas Vila, Maarten Saaltink, Alejandro Adan, Jose Tur-Piedra, Clara Ruiz-González, Daniel Romano Gude, Marc Diego Feliu, and Jesús Carrera

Coastal aquifers are characterized by their unique land-sea interaction and the main difficulty in studying these systems is the complexity of their biogeochemical cycles. Important processes in the “mixing zone” of coastal systems are associated with the ecosystem’s diversity, and supply and exchange of chemical compounds. This coastal body known as a “subterranean estuary” (STE), is characterized by a free connection to the sea, creating an interface between freshwater and seawater. The distribution and composition of substances flowing from land to sea change because the submarine groundwater discharges (SGD) considerably dilute the seawater that has invaded the aquifer through the free connection to the sea (SWI, Sea Water Intrusion).

These processes were studied in an area 100 m long inland from the coastline and 30 m wide, in the alluvial aquifer of Argentona, Mataró, northeast of Barcelona, Catalonia (Spain). This experimental site was established in 2015 and has been equipped for intensive monitoring of coastal aquifer processes such as SWI and SGD. Currently, it is monitored with 25 piezometers (2 meters screened) consisting of 5 nests with 4 piezometers each (at 10m, 20m, 15m, and 25m intervals) and 4 individual piezometers. In this system described as a “multi-aquifer and reactive system”, we are characterizing the physicochemical and hydrogeochemical conditions associated with biogeochemical processes at different depths and seasonal variations. For this presentation, we will show new results of hydrogeochemistry, nitrogen isotopes, and microbiological parameters associated with different periods of monitoring that characterize the dynamics in the subterranean estuary. 

Acknowledgments: This work was funded by the Spanish Government (grant no. PID2019-110212RB-C21 and PID2019-110212RB-C22), the project TerraMar (grant no. ACA210/18/00007) of the Catalan Water Agency, and the SENACYT – IFARHU – BID Scholarship.

How to cite: Almillategui, B., Folch Sancho, A., Rodellas Vila, V., Saaltink, M., Adan, A., Tur-Piedra, J., Ruiz-González, C., Romano Gude, D., Diego Feliu, M., and Carrera, J.: Detailed characterization of biogeochemical processes in coastal aquifers: variations along the subterranean estuary-mixing zone at the MEDISTRAES experimental site, EGU General Assembly 2023, Vienna, Austria, 23–28 Apr 2023, EGU23-15750, https://doi.org/10.5194/egusphere-egu23-15750, 2023.

EGU23-15792 | ECS | Orals | HS8.2.6

A coupled hydrogeological and multi-isotopic approach to investigate saltwater intrusion in a coastal groundwater system (Sardinia, Italy) 

Maria Chiara Porru, Stefania Da Pelo, Claudio Arras, Francesca Lobina, Rosa Cidu, Francesca Podda, and Riccardo Biddau

Many coastal areas around the world, especially low-lying delta areas, have a high density population and host important economic activities. In such context groundwater abstraction for public water, irrigation and private water supply can lead to over-exploitation and seawater intrusion phenomena. Saltwater intrusion is a critical socio-economic and environmental issue in the coastal plain of Muravera, south-eastern Sardinia (Italy). Since the early fifties the natural hydrodynamic equilibrium between groundwater, surface-water and seawater has been deeply modified by human interventions mainly related to the development of agriculture and tourism activities. The aim of this work is to deepen the knowledge about groundwater recharge areas, salinization mechanisms and water chemistry evolution through a combined hydrogeological and multi-isotopic approach. In this frame, a monthly piezometric and electrical conductivity monitoring survey was carried out for one year, integrated with chemical and isotope analyses of δ18OH2O e δ2HH2O, δ11B, δ18OSO4, δ34SSO4, 87Sr/86Sr. Isotope analyses of δ18OH2O e δ2HH2O from two precipitation samples are also performed to provide a reference for local meteoric composition.

Results from hydrochemistry analysis show the occurrence of seawater-freshwater mixing, extending up to 4 km inland. δ18OH2O & δ2HH2O, δ11B, δ18OSO4 & δ34SSO4 isotopes analysis confirms the mixing processes and indicates the meteoric origin of recharge waters for both shallow and semi-confined aquifers. Moreover, a clear correlation between precipitation and seawater H2O isotopic composition is observed. Strontium isotopes ratio has allowed the identification of four main groundwater flow paths, including lateral recharge from bedrock, surface water infiltration from the Flumendosa river and Rio Flumini Uri, and the occurrence of young mixing processes between fresh and sea waters. Outcomes from the combined investigation approach are crucial in the implementation of an integrated and sustainable management system which aims, on the one hand, at slowing the process of saltwater intrusion, and on the other hand to meet socio-economic needs for local communities’ development.

How to cite: Porru, M. C., Da Pelo, S., Arras, C., Lobina, F., Cidu, R., Podda, F., and Biddau, R.: A coupled hydrogeological and multi-isotopic approach to investigate saltwater intrusion in a coastal groundwater system (Sardinia, Italy), EGU General Assembly 2023, Vienna, Austria, 23–28 Apr 2023, EGU23-15792, https://doi.org/10.5194/egusphere-egu23-15792, 2023.

EGU23-16042 | ECS | Posters on site | HS8.2.6

Combining terrestrial and marine electrical resistivity methods to improve data acquisition in the land-sea transition zone. 

Jose Tur-Piedra, Juanjo Ledo, Pilar Queralt, Alex Marcuello, Marc Diego-Feliu, Aaron Alorda-Kleinglass, Valentí Rodellas, and Albert Folch

In recent decades, there has been a growing interest in accurately characterizing the process of fresh groundwater discharge into the coastal ocean since it represents a significant pathway for solute from land to sea. Although SGD research has focused on quantifying water and solute fluxes, little is known about the physical forces, mechanisms, and distribution of SGD.

Investigating interaction processes between the fresh and saltwater under the sea bottom represents a logistical and technical challenge. Traditionally, electrical geophysical methods have been solely used in the terrestrial part, and during the last decades, the method techniques have been introduced to marine environments. However, these methods are limited by their characteristics in obtaining subsurface resistivity data in the first few meters of the coast. Especially in the land-sea transition zone of microtidal environments, where many of the most critical processes take place, this data is traditionally not available. In this study, we developed a combination of methods to bridge the data gap between the terrestrial and marine realms. This study aims to characterize the FSGD in two aquifers from different geological contexts (alluvial and karstic) on the Mediterranean coast near Barcelona.

To study the transition zone of the aquifer with a good spatial resolution, the amphibious electrical tomography method has been chosen, combining a terrestrial and aquatic line fixed in contact with the marine sediment. Profiles perpendicular to the coastline has been made in a shallow water area to obtain electrical resistivity data of the seabed at a local scale. The configuration used is Dipole-Dipole and Wenner-Schlumberger, with an investigation depth of 10 m. Based on the results, designing a 3D model of electrical resistivity in marine sediments was possible. In parallel to getting electrical resistivity data, manual piezometers were used to bring porewater samples at different points.

We have been able to measure the presence of freshwater or brine, and we have identified differences in the geometry depending on the geological context, where the karst environment is the one that presents a more significant proportion of freshwater saturating the marine sediments. Therefore, amphibious electrical tomography is a non-invasive method that detects resistive zones of marine sediments associated with discharge processes and can be instrumental in characterizing the presence and distribution of SGD.


Acknowledgments

This work was partly funded by the Spanish Government (grant no. PID2019-110212RB-C22) and the project TerraMar (grant no. ACA210/18/00007) of the Catalan Water Agency.

How to cite: Tur-Piedra, J., Ledo, J., Queralt, P., Marcuello, A., Diego-Feliu, M., Alorda-Kleinglass, A., Rodellas, V., and Folch, A.: Combining terrestrial and marine electrical resistivity methods to improve data acquisition in the land-sea transition zone., EGU General Assembly 2023, Vienna, Austria, 23–28 Apr 2023, EGU23-16042, https://doi.org/10.5194/egusphere-egu23-16042, 2023.

EGU23-16742 | ECS | Orals | HS8.2.6

Water table dynamics in coastal aquifer sediments alter nitrogen fate: Observations from soil column experiments 

Christian Roumelis, Fabian Willert, Maria Scaccia, Susan Welch, Rachel Gabor, Jesús Carrera, Albert Folch, Miquel Salgot, Alycia Insalaco, and Audrey Sawyer

Water tables in coastal aquifers respond to a variety of hydrologic forcings, including precipitation, coastal flooding, and tides. The water table response to these forcings has the potential to impact water quality by affecting the fate and transport of nitrogen, particularly in coastal environments where nitrogen can accumulate in soils and water. To investigate the urban and agricultural reactions involving N that occur near the water table, a meter-long column containing reconstructed coastal soil and aquifer layers from a Mediterranean site was made. We continuously monitored in-situ redox potential, soil moisture, and water pressure and collected frequent pore water samples for analysis of dissolved organic carbon (DOC) and dissolved inorganic nitrogen species over 16 days while imposing water table fluctuations by injecting local groundwater rich in nitrate-N (~15 mg/L). In-situ redox potential in shallow soils (40 cm depth) ranged from -600-600 mV, which is indicative of alternating conditions favorable for aerobic and anaerobic respiration. Redox potential increased upon saturation and declined again as soils drained, with more subtle changes occurring during the first wetting and drying cycle and greater changes occurring during repeated cycles. Pore water analysis shows mobilization of DOC and ammonium-N in shallow soils and removal of nitrate-N in sandy aquifer layers. More specifically, DOC, nitrate-N, ammonium-N, and nitrite-N were greatest in the organic soils and decreased down the column into the sandy aquifer layers. Toward the end of the experiment, the column was inundated with seawater collected from the Mediterranean to simulate a flooding event, causing an increase in all N-species concentrations below 10 cm as seawater transported the nitrogen and DOC contaminants to depth. In contrast, when the column was flooded from the bottom, nitrate-N concentrations decreased as the soils became saturated, oxygen was depleted, and denitrification occurred. Overall, we see how water table dynamics impact the fate and transport of nitrogen in groundwater as soils are repeatedly saturated from above and below.

How to cite: Roumelis, C., Willert, F., Scaccia, M., Welch, S., Gabor, R., Carrera, J., Folch, A., Salgot, M., Insalaco, A., and Sawyer, A.: Water table dynamics in coastal aquifer sediments alter nitrogen fate: Observations from soil column experiments, EGU General Assembly 2023, Vienna, Austria, 23–28 Apr 2023, EGU23-16742, https://doi.org/10.5194/egusphere-egu23-16742, 2023.

EGU23-17061 | ECS | Posters on site | HS8.2.6

Temporal variations of groundwater tables and implications forsubmarine groundwater discharge: a case study the Mediterranean Spanish coast 

Guillem Buxó-Escapa, Gustavo Cárdenas Castillero, Alejandro Adán, Michal Kuráž, and Albert Folch

Submarine groundwater discharge (SGD) has received increasing attention as it has been proven to be a fundamental hydrological process that supports many coastal biogeochemical cycles and, even more, social-ecological systems and their implications in saltwater intrusion dynamics. Fresh SGD (FSGD) is very dependent on climatology, whereby, in an analogous form as a river discharge, this event is tightly attached to the aquifer . This research aims to evaluate the impact of climate change on FSGD based on historical precipitation and groundwater level data and future climatic projections (precipitation and temperature).

The daily precipitation and potential evapotranspiration time series from the public source were recorded between January 1, 1996, and October 31, 2022, in Cabrils hydrometeorological station in Northeastern Spain, where the trend shows a brief decrease in the precipitation in the latest years. The Box-Ljung forecasting method with an autoregressive integrated moving average (ARIMA) model was used to predict the changes in precipitation for projected years. The ARIMA models, validated with 26 years of data (1996–2022), were used for predicting precipitation up to 2050. To estimate the effect on FSGD, piezometric data from the Argentona alluvial, close to the Cabrils station, was used. From the water table data, the hydraulic gradient can be defined and  FSGD calculated based on Darcy’s law.

Based on the precipitation series, recharge is calculated compared with groundwater historical levels of the aquifer in the coastal zone, estimating its effect on groundwater discharge. With the rise of extreme events due to global warming, we could face a change in FSGD dynamics in the years to come. With high precipitation events expected to be more frequent, FSGD may be more discontinuous and with higher peaks, with direct implications in saltwater intrusion dynamics and the coastal biogeochemical cycles.

Keywords: Submarine groundwater discharge, Aquifer recharge, Precipitation, Climate change, Extreme climate events.

How to cite: Buxó-Escapa, G., Cárdenas Castillero, G., Adán, A., Kuráž, M., and Folch, A.: Temporal variations of groundwater tables and implications forsubmarine groundwater discharge: a case study the Mediterranean Spanish coast, EGU General Assembly 2023, Vienna, Austria, 23–28 Apr 2023, EGU23-17061, https://doi.org/10.5194/egusphere-egu23-17061, 2023.

EGU23-17249 | ECS | Orals | HS8.2.6

Effects of surface water boundary condition scaling on modelled groundwater salinity and salt fluxes 

Ignacio Farias, Gualbert H.P. Oude Essink, Perry de Louw, and Marc F.P. Bierkens

Calculating groundwater salinity requires the computation of variable density groundwater flow coupled with salt transport in a 3-D gridded space. This type of groundwater modelling requires large amounts of hydrogeological information, computational power, and thorough hydrogeological knowledge of the area being studied. To overcome limitations in knowledge, data availability and computer run times, these models are simplified which may lead to a lack of accuracy in the results. In this setting, enlarging the cell size and/or simplifying surface-groundwater interactions (boundary conditions, BC) are common solutions to achieve feasible runtimes at the expense of precision.

Over the last decades, however, computational power has grown exponentially, which, in combination with recent developments involving parallel computing for groundwater models and ever-increasing resolution and availability of datasets, allow for unexplored model resolutions. This immediately raises the question of what level of detail is required to estimate a sufficiently accurate groundwater salinity distribution for the relevant salinization processes in coastal zones for a given management or policy objective.

This research will explore how groundwater salinity distribution and salt fluxes are affected by varying grid sizes and the parameterization of the surface water boundary conditions. To achieve this, we start from the datasets of the Dutch national hydrological model (LHM fresh-salt). Models of a selected area are created with varying grid resolutions from 10 to 250-meter grid cell size. The surface water features are discretized at these same resolutions resulting in specific datasets with scaled conductance values for each resolution. The models are run in cluster environment using a parallelized version of SEAWAT developed by Deltares called iMOD-WQ. With the model results we aim to quantify the effect of grid size on the groundwater salinity distribution and salt loads to the surface and identify the right balance between required resolution and computational effort. Ultimately, we intend to contribute to the development of objective guidelines for model-enabled fresh groundwater management in coastal aquifers.

How to cite: Farias, I., Oude Essink, G. H. P., de Louw, P., and F.P. Bierkens, M.: Effects of surface water boundary condition scaling on modelled groundwater salinity and salt fluxes, EGU General Assembly 2023, Vienna, Austria, 23–28 Apr 2023, EGU23-17249, https://doi.org/10.5194/egusphere-egu23-17249, 2023.

EGU23-17530 | Posters on site | HS8.2.6

Potentially toxic element input into Mar Menor coastal lagoon (Spain) through submarine groundwater discharge 

Carlos René Green Ruiz, Valentí Rodellas, Júlia Rodriguez-Puig, and Juan Santos-Echeandía

Mar Menor, on the northern Mediterranean coast of Spain, is a coastal lagoon with a surface of 135 km2, surrounded by agriculture fields and several towns, that support an important touristic activity. In addition, mining has been an historical activity on the region. In order to elucidate the input of metals supplied by Submarine Groundwater Discharge (SGD) to the lagoon and the spatial and temporal distribution of potentially toxic elements in this coastal ecosystem, the concentrations of dissolved metals (V, Cr, Mn, Fe, Co, Ni, Cu, Zn, As and Cd) were measured in surficial water courses (“ramblas”), groundwaters (including piezometers and boreholes) and lagoon waters. Samples were collected in two sampling campaigns (July and November, 2021), representing contrasting climatic seasons. These results were combined with the estimation of SGD fluxes to the coastal lagoon, allowing evaluating the fluxes of the studied pollutants.  Occurrence of these pollutants in water from the lagoon has been previously registered, but none of those works has studied at the same time, and under a holistic point of view, all the possible aquatic pathways of dissolved metals, including the role of SGD as a conveyor of these potentially toxic elements.

Keywords: Metal release, Coastal pollution, Land-Sea interaction, Submarine Groundwater Discharge.

How to cite: Green Ruiz, C. R., Rodellas, V., Rodriguez-Puig, J., and Santos-Echeandía, J.: Potentially toxic element input into Mar Menor coastal lagoon (Spain) through submarine groundwater discharge, EGU General Assembly 2023, Vienna, Austria, 23–28 Apr 2023, EGU23-17530, https://doi.org/10.5194/egusphere-egu23-17530, 2023.

Over last few decades the Punjab region of India has been one of the country's leading contributors to agricultural products. The agricultural farms in the region are supplied with water from a well-established canal system and groundwater reserve in the state. The share of irrigated area in the region fed by canals and groundwater wells are 28 and 72%, respectively. The over and unscientific usage of groundwater over the years has resulted in groundwater depletion at an alarming rate. To help policymakers address the situation and develop effective plans, forecasting groundwater recharge for the future is utmost essential. The recharge process primarily governs the growth or depletion of groundwater reserve. Groundwater recharge is one of the most difficult phenomena to be quantified as it cannot be measured directly and is influenced by several processes varying spatially and temporally. Extensive research work for quantifying the groundwater recharge have been performed in the past. These investigations introduced a number of methodologies, including chemical tracers and physical procedures. These methods, however, being experimental in nature, involve significant time and investment. The use of machine learning algorithms to predict the recharge is promoted as a solution to these problems. These algorithms have proven to be efficient enough to deduce the recharge with very high accuracy. Through a variety of models, ranging from the most basic to one of the more intricate, we have attempted to forecast the recharge scenario in the Punjab region, India. Four machine learning algorithms, namely the Multi-linear regression model, Non-linear regression model (Random Forest), Multi-Layer Perceptron (MLP) and Long Short-Term Memory (LSTM) have been employed in this study. The aim was to comprehend the dependence of groundwater recharge on the factors of temperature, precipitation, soil type, LULC, and ground slope. The observed recharge for every subsequent month in a 30-year period is calculated using the observed monthly groundwater level data from observation wells located throughout Punjab. The monthly temperature and precipitation data are used for the study while soil type and ground slope for the location of the observation stations are extracted from digital elevation models (DEMs). At intervals of three years, the LULC maps are created. The models are then used to forecast and compare with the available observation data after the entire data set was split into a training and testing set using the 80/20 method. The models were then assessed for their ability to predict observational data using the Root Mean Squared Error (RMSE) and Coefficient of Determination (R2) in each case. The groundwater recharge prediction is then performed using the model with the highest accuracy.

How to cite: Banerjee, D. and Ganguly, S.: Predicting future groundwater recharge scenario in the Punjab region of India using machine learning techniques, EGU General Assembly 2023, Vienna, Austria, 23–28 Apr 2023, EGU23-361, https://doi.org/10.5194/egusphere-egu23-361, 2023.

Processes controlling surface-groundwater interaction in terms of recharge and baseflow have been a topic of pursuit in the hydrological research community. The groundwater recharge and baseflow in hard-rock aquifers is significantly impacted by rainfall pattern, aquifer characteristics, weathering/soil condition, topography, land use and land cover. Analysis of the recharge and baseflow process in tropical semi-arid hard-rock aquifer regions of southern India is crucial due to heavily tailed monsoon system prevailing in the region, heterogeneity of aquifers in terms of fractures and lineaments and presence of several man-made irrigation tanks along with the drainage network. Process uncertainties in groundwater recharge simulation due to impact of climate change on vegetation and resulting changes in evapotranspiration can significantly impact groundwater projections. Poor representation of diffused and focused recharge pathways and inadequacy in capturing the feedback among climate, land use and groundwater systems are other factors introducing uncertainties. Finally, the gaps in long-term observational data make it challenging to assess the impact of climate change. A taluk scale study conducted in Karnataka State of India indicated a significant correlation between the rainfall intensity distribution and climatology on groundwater recharge in Hard-rock aquifers. The current study targets to add a baseflow component represented by a 2D groundwater model and extend the previous study to a larger scale. The primary objectives of the study are to estimate the long-term groundwater recharge and baseflow trends and evaluate their association with rainfall and climatological variability. As the projected climate scenarios reflect higher frequency of high-intensity rainfall, it becomes essential to evaluate the impacts of varying rainfall patterns on the surface-subsurface processes.

How to cite: Goswami, S. and Sekhar, M.: Understanding impact of Rainfall Intensity Distribution and Climatology on Recharge and Baseflow in tropical Hard-rock Aquifers of South India, EGU General Assembly 2023, Vienna, Austria, 23–28 Apr 2023, EGU23-619, https://doi.org/10.5194/egusphere-egu23-619, 2023.

EGU23-764 | Posters on site | HS8.2.9

Modeling of groundwater level changes in the fast-growing Indian Secondary Cities 

Indra Mani Tripathi and Pranab Kumar Mohapatra

Due to rapid industrial and population growth, groundwater levels frequently shift, with depletion being the most prominent effect. Numerical models have the potential to save time and money by supplying pertinent information in areas where data is lacking. We investigate the fluctuations in groundwater levels in the secondary cities of India using the well-known MODFLOW-2005 model. The study covers all the wards of three Indian secondary cities (Bhopal, Bhuj and Kozhikode), and we run a simulation for the year 2012–2020. We use groundwater table data from 2012 to 2020, topographic maps and geological maps of the selected cities. Along with these, we use hydraulic conductivity and specific yield values of the aquifer of the study area. We calibrate the model for both steady-state and transient scenarios to match the field conditions up to acceptable standards. Moreover, we validate the model for any one year to justify the acceptability of all the calibrated values. In addition, we perform sensitivity analysis to illustrate which model parameter has the greatest influence on the model output. Finally, we run the model for 2025 to predict the groundwater level changes in the immediate future. From this, we can identify the regions facing serious groundwater-lowering problems. Therefore, more comprehensive policies, as well as laws on groundwater extraction, should be created in order to safeguard this natural resource. In this context, the present study will provide an overview of this urgent issue in Indian cities.

How to cite: Tripathi, I. M. and Mohapatra, P. K.: Modeling of groundwater level changes in the fast-growing Indian Secondary Cities, EGU General Assembly 2023, Vienna, Austria, 23–28 Apr 2023, EGU23-764, https://doi.org/10.5194/egusphere-egu23-764, 2023.

EGU23-993 | Orals | HS8.2.9

Spatiotemporal Characteristics and Drivers of Groundwater Change in North China Revealed by GRACE Time-Variable Gravity 

Tengfei Feng, Yunzhong Shen, Qiujie Chen, and Fengwei Wang

Groundwater overdraft in North China (NC) has posed adverse threats to sustainable development due to the reduction of freshwater availability. To comprehensively clarify the groundwater change and formulate reasonable control strategies, groundwater storage anomaly (GWSA) is investigated using the high-resolution time-variable gravity field model Tongji-RegGrace2019 together with the hydrological model. The results show that GWS presents a downward trend of -0.87±0.04 cm/yr from January 2004 to December 2015 and the trend aggravates to -3.71±0.49 cm/yr from January 2014 to December 2015, which is basically consistent with those detected by monitoring well. Moreover, by analyzing the spatiotemporal characteristics of GWSA with the independent component analysis (ICA) approach, the driving factors and corresponding mechanisms of groundwater changes are determined. Among the four independent components (ICs) of GWSA, the first two ICs (IC1 and IC2) cooperatively reflect the long-term and intra-annual groundwater changes caused by water consumption of coal mining and agricultural irrigation in Shanxi province, with the correlation coefficients of -0.91 and -0.85, respectively. IC3 indicates a semi-annual groundwater signal related to agricultural irrigation water consumption in southern Hebei province, with a correlation coefficient of -0.85. Besides, IC4 suggests the effect of monsoon precipitation and evaporation in front of Taihang Mountain. Hence, multiple driving sources, including unevenly distributed precipitation, intense seasonal evaporation, and devastating coal mining, coupled with extensive agricultural irrigation, jointly restrict the GWSA rise and fall at different time nodes.

How to cite: Feng, T., Shen, Y., Chen, Q., and Wang, F.: Spatiotemporal Characteristics and Drivers of Groundwater Change in North China Revealed by GRACE Time-Variable Gravity, EGU General Assembly 2023, Vienna, Austria, 23–28 Apr 2023, EGU23-993, https://doi.org/10.5194/egusphere-egu23-993, 2023.

EGU23-1840 | Posters on site | HS8.2.9

Disentangling aquifer dynamics in coastal groundwater systems using high-resolution time series 

Patrick Haehnel, Gabriel C. Rau, and Todd C. Rasmussen

Freshwater lenses are an important water resource in coastal areas as well as on oceanic islands, and understanding the dynamic forces acting upon this resource is vital for their sustainable management. A key water-management objective is to understand and manage these freshwater lenses, which requires accurate estimates of drawdown and groundwater recharge. Groundwater levels in such systems, however, are dominated by multiple dynamic factors, such as tidally and meteorologically forced ocean level fluctuations, coastal morphology, aquifer properties, recharge, and groundwater extraction. Unfortunately, tidal influences often dominate groundwater levels in these systems, which confounds the quantification of aquifer recharge and extraction.

This work uses regression deconvolution to quantify oceanic influences on groundwater levels by generating an “Ocean Response Function” (ORF) that is used to reveal groundwater recharge and extraction, once influences have been removed. We use groundwater levels from an unconfined and unconsolidated (mostly fine sand) aquifer on the island of Norderney located in the North Sea in Northwest Germany. Confounding tidal influences are removed from observed groundwater levels to reveal underlying processes. Most prominently, seasonal recharge patterns are now clearly visible, along with responses to daily groundwater extraction from a nearby water-supply well. The obtained ORF also constrains the aquifer hydraulic diffusivity, in that higher diffusivities induce faster responses. Overall, this work demonstrates how regression deconvolution leads to improved insight into groundwater processes and properties when applied to coastal and island groundwater observations.

How to cite: Haehnel, P., Rau, G. C., and Rasmussen, T. C.: Disentangling aquifer dynamics in coastal groundwater systems using high-resolution time series, EGU General Assembly 2023, Vienna, Austria, 23–28 Apr 2023, EGU23-1840, https://doi.org/10.5194/egusphere-egu23-1840, 2023.

EGU23-1859 | ECS | Posters on site | HS8.2.9

Water table depth assimilation in integrated terrestrial system models at the larger catchment scale 

Fang Li, Wolfgang Kurtz, Ching Pui Hung, Harry Vereecken, and Harrie-Jan Hendricks Franssen

As a vital supply of water resources for human society, groundwater plays a significant part in the water cycle, and is closely linked to precipitation, surface water and soil moisture (SM). Groundwater modelling often suffers from a variety of uncertainties, including uncertain forcing data, parameters and initial conditions. To reduce the uncertainties of model predictions, data assimilation (DA) can be used to correct model predictions with observations to improve the estimation of unknown states and parameters. To investigate the effects of assimilation of groundwater data into the integrated model Terrestrial System Modelling Platform (TSMP) on groundwater table depth (WTD) simulations, groundwater assimilation experiments were conducted for the Rur catchment in Germany. 128 ensemble members were generated by perturbing atmospheric forcing variables and saturated hydraulic conductivity, and then the measured daily groundwater data from 2018 were assimilated into the model TSMP by the Localized Ensemble Kalman Filter (LEnKF). The measured data were screened rigorously before assimilation. The spatial autocorrelation analysis of the measured groundwater data and the open loop (OL) simulations showed consistency in the spatial variability of groundwater levels between measurements and simulations. Based on the results of a spatial autocorrelation analysis, three different local radii (10 km, 5 km and 2.5 km) were selected for the assimilation experiments. Comparing the results of the OL and DA experiments, the simulated WTD bias (simulated - measured) and root mean square error (RMSE) were reduced for all DA runs compared to OL. The 10km localization radius gives the smallest RMSE at assimilation locations, with 81% RMSE reduction compared to the OL. Validation with WTD data from independent verification sites shows that localized assimilation improves groundwater simulations only when the distance to assimilated sites is smaller than 2.5km. Independent WTD validation showed a reduction in RMSE of 30% and the best results were from the DA run with 10 km radius. Also soil moisture measurements from the Cosmic Ray Neutron Sensor (CRNS) were used for validation. The simulated SM reproduced the observed temporal fluctuations, with a high correlation between measured and simulated SM (from 0.70 to 0.89, except for the Wuestebach site). However, there was no RMSE reduction of SM for the DA runs compared to the OL.

How to cite: Li, F., Kurtz, W., Hung, C. P., Vereecken, H., and Hendricks Franssen, H.-J.: Water table depth assimilation in integrated terrestrial system models at the larger catchment scale, EGU General Assembly 2023, Vienna, Austria, 23–28 Apr 2023, EGU23-1859, https://doi.org/10.5194/egusphere-egu23-1859, 2023.

Groundwater nitrate-N contamination typically involves several natural and anthropogenic factors, such as hydrology, hydrogeology, topography, and land uses. DRASTIC-LU-based aquifer vulnerability can be adopted to explore pollution potentials of groundwater nitrate-N. Furthermore, groundwater nitrate-N pollution frequently has high levels of spatial variability because of various pollution sources and hydrogeological and hydrochemical conditions. Estimates are typically uncertain owing to limited in-situ data. Geostatistics is a commonly used technique of spatial estimates with limited data. To reduce the underestimation and overestimation of ordinary kriging (OK), this study employed regression kriging (RK) with environmental auxiliary information on DRASTIC-LU-based aquifer vulnerability to characterize groundwater nitrate-N pollution in the Pingtung Plain, Taiwan. First, the relationship between groundwater nitrate-N pollution and aquifer vulnerability assessment was determined using stepwise multivariate linear regression (MLR). Then, simple kriging was adopted to estimate residuals acquired from gaps between nitrate-N observations and MLR predictions. The sum of the estimated residuals and MLR predictions was the RK estimates for groundwater nitrate-N. Finally, groundwater nitrate-N distributions were spatially analyzed using RK, OK, and MLR. To reduce groundwater nitrate-N pollution, feasible environmental management strategies were discussed according to the study results. The study results revealed that the orchard land-use types and medium- and coarse-sand fractions of vadose zone were related to groundwater nitrate-N. Moreover, the fertilizer application in orchards was the major source of groundwater nitrate-N pollution. The RK estimates could characterize the characteristics of the pollution source of the orchard land uses, and exhibited higher spatial variability and accuracy via the correction of the residuals than MLR predictions and OK estimates. In addition, feasible management strategies of orchards at the eastern and western regions with high areal ratios of orchard land uses should be implemented to reduce nitrate-N leaching, such as organic fertilizer uses, ground covers, and irrigation with low intensity and high frequency.

How to cite: Jang, C.-S.: Geostatistical estimates of groundwater nitrate-N with spatial auxiliary information on DRASTIC-LU-based aquifer vulnerability, EGU General Assembly 2023, Vienna, Austria, 23–28 Apr 2023, EGU23-2072, https://doi.org/10.5194/egusphere-egu23-2072, 2023.

EGU23-2605 | Posters on site | HS8.2.9

Improved assessment of automated gap imputation in large groundwater level data sets 

Inga Retike, Jānis Bikše, Ezra Haaf, and Andis Kalvāns

Uneven measurement frequencies and continuous gaps in hydrographs are among the major challenges when dealing with regional-scale groundwater level data sets, especially if compiled from different countries. A variety of automated gap imputation methods can be applied to infill a large number of missing values, yet the assessment of modeling performance remains a difficult task often performed by randomly introduced missing values. However, large groundwater level data sets rarely have random gaps and more complex gap patterns can be observed. Here we present a new artificial gap introduction technique (TGP - typical gap patterns) mimicking realistic gap patterns characteristic to regional scale groundwater level data sets thus improving the assessment of gap imputation methods. Imputation performance of machine learning algorithm missForest and imputePCA were compared with routinely used linear interpolation to create gapless groundwater hydrographs for the Baltic states (Estonia, Latvia, Lithuania). Our results showed that infilling performance varies among different gap patterns (TGP). Overall, the missForest algorithm significantly outperformed imputePCA and linear interpolation even when infilling up to 2.5 years long gaps, while linear interpolation produced similarly good results to missForest when infilling relatively short (random-like) gaps. It was observed that imputation performance substantially decreased when infilling previously unseen extremes (such as severe drought episodes in 2018) or groundwater hydrographs likely affected by water abstraction (located near major agglomerations).

The study has been founded by Iceland, Liechtenstein and Norway through the EEA and Norway Grants Fund for Regional Cooperation project No.2018-1-0137 “EU-WATERRES: EU-integrated management system of cross-border groundwater resources and anthropogenic hazards”. The research further contributes to the grant TRV2019/45670 awarded by the Swedish Transport Administration (Trafikverket).

How to cite: Retike, I., Bikše, J., Haaf, E., and Kalvāns, A.: Improved assessment of automated gap imputation in large groundwater level data sets, EGU General Assembly 2023, Vienna, Austria, 23–28 Apr 2023, EGU23-2605, https://doi.org/10.5194/egusphere-egu23-2605, 2023.

EGU23-2696 | ECS | Orals | HS8.2.9

Performance assessment of groundwater level forecasting with deep learning: a case study of Lower Saxony, Germany. 

Mariana Gomez, Maximilian Noelscher, Stefan Broda, and Andreas Hartmann

Groundwater level forecasting with machine learning has been widely studied due to its generally accurate results and little input data requirements. Furthermore, machine learning models for this purpose are set up and trained in a short time when compared to the effort required for process-based, numerical models. Despite the high performance of models obtained at specific locations, applying the same model architecture to multiple sites across a regional area might lead to contrasting accuracies. Likely causalities of this discrepancy in model performance have been barely examined in previous studies. Here, we investigate the link between model performance and the effects of geospatial site characteristics and time series features. Using precipitation and temperature as predictors, we model groundwater levels at approximately 500 observation wells in Lower Saxony, Germany, using a 1-D convolutional neural network with a fixed architecture and hyperparameters tuned for each time series individually. The performances are evaluated against geospatial and time series features using correlation coefficients. Model performance is negatively influenced at sites near waterworks and densely vegetated areas. Besides, the more complex the time series, the higher the metrics, but autocorrelation reduces the model performance. The new insights evidence that further information is required at certain locations to improve model accuracy due to external impacts.  

How to cite: Gomez, M., Noelscher, M., Broda, S., and Hartmann, A.: Performance assessment of groundwater level forecasting with deep learning: a case study of Lower Saxony, Germany., EGU General Assembly 2023, Vienna, Austria, 23–28 Apr 2023, EGU23-2696, https://doi.org/10.5194/egusphere-egu23-2696, 2023.

Since there are many uncertainties in the state of groundwater, after determining the research direction and objectives, a numerical model should be established by means of simulation to analyze the hydraulic characteristics such as transmissivity and storativity in the research area. Sensitivity analysis is carried out effectively, and the optimal pumping test strategy is designed based on it. In many previous studies, the sensitivity map made by the two-dimensional model was used to discuss the sensitivity. However, after a long period of data accumulation, it was found that although there would be a continuous change in the discharge, the pumping well and the vicinity of the observation well's hydraulic gradient did not change significantly. From this we get an inference, that is, we cannot obtain the exact location of the sensitivity source in space by simply using a two-dimensional sensitivity map, at most, only the average parameter value of the active area can be obtained. In addition, most of the current research is based on the assumption of homogeneous steady-state conditions, but groundwater mostly exists in the form of heterogeneous transient state in nature. Therefore, this research hopes to use the method of inverse calculating the heterogeneous field to plan and use the developed software (VSAFT2 and VSAFT3) for effective 2D and 3D space simulation, so as to use the characteristics of the three-dimensional space concept to confirm various information and extend the discussion of the source. This will have a great contribution to the changes of water bodies in the future analysis area, groundwater recharge patterns and diffusion control of underground pollution.

How to cite: Kuo, J.-T., Wen, J.-C., and Lin, H.-R.: Sensitivity analysis and research of hydraulic characteristic parameter and observation wells during the pumping test, EGU General Assembly 2023, Vienna, Austria, 23–28 Apr 2023, EGU23-2998, https://doi.org/10.5194/egusphere-egu23-2998, 2023.

EGU23-3056 | ECS | Posters on site | HS8.2.9

Multi-step-ahead forecasting of groundwater levels using a Long Short-Term Memory based Encoder-Decoder (LSTM-ED) model 

Julian Koch, Jacob Kidmose, Jun Liu, Raphael Schneider, Simon Stisen, and Lars Troldborg

Operational forecasts of groundwater levels provide critical real-time knowledge during extreme events, such as floods and droughts. This study proposes a Long Short-Term Memory based Encoder-Decoder (LSTM-ED) model for multi-step-ahead groundwater level forecasting. The LSTM-ED is a well-suited architecture for sequence-to-sequence modelling tasks but has not yet been applied to forecast groundwater levels. The proposed LSTM-ED model is designed in the context of the Danish online monitoring system grundvandsstanden.dk to serve as operational groundwater level forecasting system. In the encoder LSTM model, sequences of past precipitation, temperature and groundwater levels are processed to initialize the decoder LSTM model which, in addition takes in forecast sequences of precipitation and temperature to output a sequence of groundwater levels. We train LSTM-ED models individually for each well, with all data aggregated to daily timescale. We demonstrate the performance of the LSTM-ED architecture for numerous wells from grundvandsstanden.dk and test varying lead times of up to 30 days. The LSTM-ED model forecasts are contrasted with simple benchmark models as well as with a sequence-to-sequence LSTM model that does not incorporate forecasts of precipitation and temperature for outputting the groundwater sequence. Initial results underpin that integrating forecasts of precipitation and temperature is a crucial component, especially for wells with shallow intakes where surface and sub-surface processes are well connected. The sequence-to-sequence LSTM model yields similar accuracy as the simple benchmark models, whereas accuracy clearly improves for the LSTM-ED model. Overall, this study highlights the potential of LSTM-ED models as an operational tool for multi-step-ahead forecasting of groundwater levels.

How to cite: Koch, J., Kidmose, J., Liu, J., Schneider, R., Stisen, S., and Troldborg, L.: Multi-step-ahead forecasting of groundwater levels using a Long Short-Term Memory based Encoder-Decoder (LSTM-ED) model, EGU General Assembly 2023, Vienna, Austria, 23–28 Apr 2023, EGU23-3056, https://doi.org/10.5194/egusphere-egu23-3056, 2023.

As one of the vulnerable arid regions, Saudi Arabia suffered from an optimal water crisis. Rapid population, industrialization, and urbanization mandated the water stress and agricultural water balance in the region; as such, there is a need for integrated water resources planning and management. To meet sustainable development goal six (SDGs-6), the ground and surface water need to be within the required quality and quantity. Hence there is a need for both the physical, chemical and hydrogeological assessment of groundwater in the Eastern part of Saudi Arabia. This study proposed three scenarios to assess the hydrogeological groundwater quality, namely, experimental laboratory based on fieldwork, geospatial mapping of the parameters (EC, pH, CaCO3, Turbidity, NA, k, Mg, Ca, F, Cl, Br, Li, B, Al, V, Cr, Fe, Mn, Ni, Co, Cu, Zn, As, Se, Sr, Mo, and Ba), and intelligent computational analysis using machine learning (ML). This research is motivated toward intelligent prediction of some heavy metals using neural network (NN), and adaptive neuro-fuzzy inference system (ANFIS). The evaluation criteria of the predictive results were analyzed based on mean absolute percentage error (MAPE), correlation coefficient (CC), and determination coefficient (DC). The outcomes proved the satisfactory ability of the NFIS model over the NN approach, despite its predictive credit. 

How to cite: Yassin, M., Abba, S., Usman, A., and Aljundi, I.: Spatiotemporal and hydrogeological assessment of groundwater supported by soft computing modeling of heavy metal in Al-Hassa, Eastern Province, Saudi Arabia, EGU General Assembly 2023, Vienna, Austria, 23–28 Apr 2023, EGU23-4745, https://doi.org/10.5194/egusphere-egu23-4745, 2023.

EGU23-5322 | ECS | Orals | HS8.2.9

Potentials and limitations of MLPs for predicting groundwater heads under climate change 

Moritz Gosses and Thomas Wöhling

With the increasing threat of climate change, projections of its impact on the availability of natural resources, such as groundwater, are becoming significantly more important. While extrapolation or prediction is a valid application for environmental system models, their assumptions and limitations are often not clearly communicated or investigated. This is especially true for data-driven models, which have been applied more frequently, and often with great success, to groundwater problems in the last decade. But are these techniques applicable to long-term future predictions of the impact of climate scenarios on groundwater resources, and if so, under which conditions and limitations?
Within the context of KlimaKonform (Technische Universität Dresden, 2023), a research project studying the impact of climate change on the Central German Uplands, ensembles of multi-layer perceptron (MLP) models have been derived to estimate groundwater levels for a variety of wells in a region in Saxony-Anhalt in Germany. Once trained to replicate historical time series with climatological input data such as precipitation and temperature, these model ensembles were then tasked to predict the groundwater levels up until the end of the current century under different climate scenarios.
We analyse the plausibility of the model ensemble predictions to shed light on the above-proposed question: what are factors (and metrics) of success, as well as limitations and possible failures, of data-driven methods (MLPs in this case) for long-term prediction? First, we propose that using ensembles of models, rather than “the single-best” trained model, is a necessity for such applications. We identify different methods of pre-processing of input and target data, structural model setup as well as target-oriented post-processing of ensemble simulations as vital factors for the successful application of MLPs to long-term prediction of groundwater levels under climate change scenarios. We further highlight remaining limitations and pose the question of how they could potentially be overcome.


Technische Universität Dresden, 2023. KlimaKonform: Forschungsprojekt KlimaKonform. https://klimakonform.uw.tu-dresden.de/

How to cite: Gosses, M. and Wöhling, T.: Potentials and limitations of MLPs for predicting groundwater heads under climate change, EGU General Assembly 2023, Vienna, Austria, 23–28 Apr 2023, EGU23-5322, https://doi.org/10.5194/egusphere-egu23-5322, 2023.

EGU23-6165 | ECS | Orals | HS8.2.9

South-to-North Water Diversion weaken groundwater depletion in Beijing: insight from downscaling GRACE/GRACE Follow-on data 

Ying Hu, Nengfang Chao, Jiangyuan Wang, Zheng Liu, and Kaihui Zou

Abstract: Groundwater depletion is a serious threat to agriculture and economic development, with an adverse impact on the ecological environment in Beijing. With the successful implementation of the South-to-North Water Diversion Project (SNWDP), groundwater (GW) depletion is expected to be alleviated. Here, we bridged the gap of the monthly terrestrial storage anomaly (TWSA) observations of the Gravity Recovery and Climate Experiment (GRACE) and its successor GRACE Follow-On (GRACE-FO) missions, then downscaled the spatial resolution of GW storage anomaly (GWSA) from 0.5°×0.5° to 0.25°×0.25° in Beijing using deep learning (DL) method, and precisely quantified the characteristics and causes of GWSA before and after the SNWDP, including that 1)  reconstructed 0.5°×0.5° TWSA in Beijing during 2004 to 2021 using three DL architectures (Long Short-Term Memory (LSTM), Gate Recurrent Unit (GRU), Multilayer Perceptron (MLP)); 2) selected the optimal performance of DL for downscaling GWSA from 0.5°×0.5° to 0.25°×0.25°; 3) quantitatively analyzed of GWSA characteristics before and after the SNWDP basing on Random Forest (RF). The results indicated that the trend of downscaled GWSA was consistent with in-situ grounder water level measurements, while the seasonal amplitude differed. Before the SNWDP (2004-2014), the GW in Beijing showed a declining trend with a rate of -20.8 mm/yr, of which human factors contributed 75.7% (21.9% and 21.1% for domestic water and agricultural water, respectively), and climatic factors accounted for 24.1%. After the SNWDP (2015-2021), GW gradually increased by 39.3 mm/yr, and GW was significantly restored, of which the human factors accounted for 59.2% (30.7% and 14.2% for domestic water and water diverted to Beijing by the SNWDP, respectively). Our research could provide a new reliable theoretical support and technical reference for GRACE/GRACE-FO dynamic monitoring of groundwater.

Keywords: Beijing GW storage; spatial resolution downscaling; DL; GRACE/GRACE-FO; SNWDP

How to cite: Hu, Y., Chao, N., Wang, J., Liu, Z., and Zou, K.: South-to-North Water Diversion weaken groundwater depletion in Beijing: insight from downscaling GRACE/GRACE Follow-on data, EGU General Assembly 2023, Vienna, Austria, 23–28 Apr 2023, EGU23-6165, https://doi.org/10.5194/egusphere-egu23-6165, 2023.

EGU23-6907 | ECS | Posters on site | HS8.2.9

Groundwater level prediction from meteorological indices 

Ronja Iffland and Uwe Haberlandt

Due to climate change, an assessment of future changes in hydrological systems is necessary for appropriate planning, particularly for water management. So far, especially flood and low flow events have been studied. But groundwater levels are also influenced by extended dry periods and seasonal shifts in precipitation, as groundwater recharge is directly related to precipitation and evaporation. In the study area of Lower Saxony (Germany), groundwater is an important resource for drinking water and supplies about 86 % of the demand (MU 2021). Therefore, knowledge about possible changes is of highest importance for a possible need for action.

In this study, climate characterising indices are used. Based on the assumed relationship between groundwater levels and meteorological indices, a simplified statistical approach should be used. Therefore, multiple linear regression models were set up for groundwater level estimation. Local models were set up for 734 groundwater monitoring wells in Lower Saxony, Germany. In order to take the persistence of the meteorological indices into account, moving averages and time lags were also included. Using a split validation procedure, which could be carried out for 114 stations with sufficient time series lengths, shows a good performance of the models. In order to make statements about future changes, the models were applied using climate model data based on the RCP8.5 scenario. Analyses for the reference period show that the groundwater levels can be sufficiently estimated. Slight changes were detected for the near future (2021-2050) and for the far future (2071-2100). For the majority of the measuring stations, decreases in mean annual low groundwater levels and slightly decreases in mean annual high groundwater levels are observed for both future periods. The number of low-level months does not change, while the number of high-level months increases slightly. In addition, a delayed timing of the annual extremes can be detected.

How to cite: Iffland, R. and Haberlandt, U.: Groundwater level prediction from meteorological indices, EGU General Assembly 2023, Vienna, Austria, 23–28 Apr 2023, EGU23-6907, https://doi.org/10.5194/egusphere-egu23-6907, 2023.

EGU23-8098 | ECS | Orals | HS8.2.9

Passive characterization of aquifers hydro-mechanical properties using tidal signals 

Augustin Thomas, Jérôme Fortin, Benoît Vittecoq, and Sophie Violette

Following the evolution of the hydrodynamic parameters (hydraulic conductivity and storativity) of an aquifer over time is difficult and does not exist for an aquitard. The primary reason is the small number of observations, which are mainly pumping or slug tests. However, solutions exist to recover these parameters using only groundwater level monitoring data at a sampling rate of 1 hour, data which is extensively available. These solutions take advantage of the boreholes’ response to different tidal phenomena, including oceanic, earth and atmospheric tides.

Martinique Island, in the Lesser Antilles, is a very interesting field to study these techniques, since 16 years of piezometric level data have been recorded on this volcanic island in a monitoring network of 29 boreholes. The variety of aquifer geometry and geology enables to study different types of responses, in addition the island is submitted to seismic activity that may impact aquifers and particularly their hydraulic conductivity.

The method consists in computing amplitude and phase response of aquifers to both atmospheric, earth and ocean tides. Then, the response of semi-confined aquifers to different loading sources at the tidal frequencies (between 1 and 2 cycles per day) is modelled. The model is a general and adaptable one, in order to consider the various geometries (including the presence or not of an aquitard) and aquifer boundary conditions (confined, semi-confined, connected to the atmosphere or not). Finally, a careful inversion is done to obtain the characteristics of the aquifer.

Our results show that the Martinique aquifers present responses to different sources of loading. We show that using the dominant source response alone, we are able to recover aquifer or aquitard hydraulic conductivity and its evolution over the last 16 years, which we compare with pumping tests results. Using a combination of sources, we are also able to recover elastic properties like the evolution of the loading efficiency and shear modulus. Finally, comparing different sites responses, we are able to assess which aquifer is more vulnerable to pollution through vertical leakage within their aquitard.

How to cite: Thomas, A., Fortin, J., Vittecoq, B., and Violette, S.: Passive characterization of aquifers hydro-mechanical properties using tidal signals, EGU General Assembly 2023, Vienna, Austria, 23–28 Apr 2023, EGU23-8098, https://doi.org/10.5194/egusphere-egu23-8098, 2023.

EGU23-8608 | ECS | Orals | HS8.2.9

Use of machine learning for drain flows predictions in tile-drained agricultural areas 

Hafsa Mahmood, Ty P. A. Ferre, Raphael J. M. Schneider, Simon Stisen, Rasmus R. Frederiksen, and Anders V. Christiansen

Temporal drain flow dynamics and their underlying controlling factors are important for understanding the needs for water resource management in tile drained agricultural areas. The use of physics-based water flow models to understand tile drained systems is quite common. These physics-based models are complex and have high computational demand due to the high spatial and temporal dimensionality of the problem. We examine whether machine learning (ML) models can offer a simpler tool for water management.


The main aim of our study is to assess the potential of ML tools for predicting drain flow with varying climate parameters and hydrogeological properties in different catchments in Denmark. We rely on unique data containing time series of daily drain flow in 26 field-scale tile drained catchments in Denmark: climate data (precipitation, potential evapotranspiration, temperature); geological properties (clay fraction, first sand layer thickness, first clay layer thickness); and topographical indexes (curvature, topographical wetness indexes, topographical position index, elevation etc.). The ML algorithm XGBoost is used to predict drain flow in the 26 drain catchments based on both static and dynamic variables. This algorithm also provides an independent measure of the value of information contained in variables related to climate, geology and topography for the prediction of tile drain flows.


The ML approach examined could provide a more transferable, faster, and less computationally expensive tool to predict drain flow dynamics. Simultaneously, the results of the study offer insight into the underlying factors that control drain flow, allowing for improved data collection and physics-based model development.

How to cite: Mahmood, H., P. A. Ferre, T., J. M. Schneider, R., Stisen, S., R. Frederiksen, R., and V. Christiansen, A.: Use of machine learning for drain flows predictions in tile-drained agricultural areas, EGU General Assembly 2023, Vienna, Austria, 23–28 Apr 2023, EGU23-8608, https://doi.org/10.5194/egusphere-egu23-8608, 2023.

EGU23-9341 | ECS | Posters on site | HS8.2.9

Results from the 2022 Groundwater Time Series Modeling Challenge 

Raoul Collenteur, Ezra Haaf, Tanja Liesch, Andreas Wunsch, and Mark Bakker

At the general assembly of the European Geophysical Union in 2022, the “Groundwater Time Series Modeling Challenge” was launched (Haaf et al., 2022). We challenged our colleagues in the field to model five time series of hydraulic heads measured in groundwater observations wells around Europe and North America. Part of the head data was not made available to the participants and held back as independent evaluation data. In this presentation, we will share and summarize the results from the challenge. The challenge attracted submissions from 17 teams using a variety of modeling techniques (https://github.com/gwmodeling/challenge). The models used in the submissions ranged from machine and deep learning models to empirical and bucket-type models. Many of the participants devoted notable attention to the uncertainty quantification, providing not only the results of the best-fit model but also uncertainty intervals for their models. The time to set up each model ranged from a couple of minutes to a couple of hours, indicating that models are generally set up in a limited amount of time. For most models, the majority of the time was used for the training and/or uncertainty quantification. The time spent on training showed larger differences between the models, ranging from a few minutes to more than a day for a single model. The data used to model the time series varied per model, with empirical models using less information than the machine learning models. A preliminary analysis of the modeling results showed that most of the models performed well (as measured by goodness-of-fit metrics such as NSE, MAE, KGE) in both the training and evaluation period. For one of the time series, none of the models showed a good fit with the data in the evaluation period and we suspect that a systematic change in the groundwater system may have occurred. The best-performing model differed between observation wells; none of the models outperformed all other models for all time series.  In the coming months up to the EGU 2023 General Assembly we will further analyze and synthesize the results.

Haaf, E., Collenteur, R., Liesch, T., & Bakker, M. (2022). Presenting the Groundwater Time Series Modeling Challenge(No. EGU22-12580). Copernicus Meetings.

How to cite: Collenteur, R., Haaf, E., Liesch, T., Wunsch, A., and Bakker, M.: Results from the 2022 Groundwater Time Series Modeling Challenge, EGU General Assembly 2023, Vienna, Austria, 23–28 Apr 2023, EGU23-9341, https://doi.org/10.5194/egusphere-egu23-9341, 2023.

EGU23-10596 | ECS | Orals | HS8.2.9

The Development of a ML-based Estimator to Reconstruct Water Table Depth over the Contiguous US 

Yueling Ma, Elena Leonarduzzi, Amy Defnet, Peter Melchior, Laura Condon, and Reed Maxwell

Groundwater is one of the most valuable resources in the US. The United States Geological Survey (USGS) reported that about 26% of the water used in 2015 came from groundwater. Due to the scarcity of groundwater observations, it is still challenging to monitor groundwater resources at the watershed scale (where local decision making occurs). In addition, for long-term high-resolution simulations, physically-based models become very computational demanding and data hungry. With much less computational time and physical knowledge, machine learning (ML) techniques are able to capture complex nonlinear connections between groundwater dynamics and atmospheric and land surface processes from historical data. Recent studies have shown their success in groundwater modeling.

In this study, we develop a ML-based estimator to produce water table depth (WTD) estimates over the Contiguous US (CONUS) at a spatial resolution of 1 km using USGS WTD observations and other hydrometeorological data. The WTD estimator consists of two components. One component captures spatial variations in WTD using random forests and the other component learns temporal variations in WTD by Long Short-Term Memory networks. We combine the results from the two components to obtain WTD estimates. The estimated WTD are compared to USGS WTD observations to show their reliability. Based on the WTD estimates, we study groundwater changes in the Upper Colorado River Basin (UCRB) in recent drought years, which is one of the principal headwater basins in the US. To better interpret the performance of the WTD estimator, we conduct sensitivity analyses on input variables for both components. Moreover, we assess the uncertainty of the WTD estimator in estimating WTD over the CONUS. Our study demonstrates that the WTD estimator can generate reasonable WTD estimates over CONUS, thereby facilitating understanding of groundwater systems in the US. The WTD estimator can also be transferred to other regions in the world that have a similar hydrologic regime to a region in the US.

How to cite: Ma, Y., Leonarduzzi, E., Defnet, A., Melchior, P., Condon, L., and Maxwell, R.: The Development of a ML-based Estimator to Reconstruct Water Table Depth over the Contiguous US, EGU General Assembly 2023, Vienna, Austria, 23–28 Apr 2023, EGU23-10596, https://doi.org/10.5194/egusphere-egu23-10596, 2023.

EGU23-11427 | ECS | Posters on site | HS8.2.9

Investigating system controls for prediction of groundwater hydrographs at unmonitored sites transferring head duration curves 

Ezra Haaf, Markus Giese, Thomas Reimann, and Roland Barthel

A new method is presented to efficiently estimate daily groundwater level time series at unmonitored sites by linking groundwater dynamics to local hydrogeological system controls. The presented approach is based on the concept of comparative regional analysis, an approach widely used in surface water hydrology, but uncommon in hydrogeology. The method uses regression analysis to estimate cumulative frequency distributions of groundwater levels (groundwater head duration curves (HDC)) at unmonitored locations using physiographic and climatic site descriptors. The HDC is then used to construct a groundwater hydrograph using time series from distance-weighted neighboring monitored (donor) locations. For estimating times series at unmonitored sites, in essence, spatio-temporal interpolation, extreme gradient boosting and nearest neighbors are compared. The methods were applied to ten-year daily groundwater level time series at 157 sites in alluvial unconfined aquifers in Southern Germany. The controlling site descriptors were analyzed using shapley values, revealing that models of HDCs were physically plausible. The analysis further shows that physiographic and climatic controls on groundwater level fluctuations are nonlinear and dynamic, varying in significance from “wet” to “dry” aquifer conditions. Extreme gradient boosting yielded a significantly higher predictive skill than nearest neighbor. However, donor site selection is of key importance. The study presents a novel approach for regionalization and infilling of groundwater level time series that also aids conceptual understanding of controls on groundwater dynamics, both central tasks for water resources managers.

How to cite: Haaf, E., Giese, M., Reimann, T., and Barthel, R.: Investigating system controls for prediction of groundwater hydrographs at unmonitored sites transferring head duration curves, EGU General Assembly 2023, Vienna, Austria, 23–28 Apr 2023, EGU23-11427, https://doi.org/10.5194/egusphere-egu23-11427, 2023.

The groundwater level is a comprehensive response of the external stimuli of the aquifer, such as rainfall and river recharge, and is one of the main factors affecting the formation deformation. The spatiotemporal analysis of stratum elastic deformation identifies different stimulus sources and their influence on groundwater level changes, as well as the influence of groundwater level changes on stratum elastic deformation. In addition to the numerical test to verify the correctness of the analysis process, this study uses the daily water level observation data of each aquifer in Yunlin area of Taiwan to conduct principal component analysis to explore the influence of rainfall and river water level on the variation of groundwater level in each aquifer. Furthermore, based on the magnetic ring layered subsidence observation well data, the iterative principal component analysis was used to explore the influence of the variation of the groundwater level in each layer on the elastic deformation of each layer.

The research results show that the first principal component of the groundwater level in each aquifer in the Yunlin area can fully reflect the impact of rainfall on the groundwater level, and the residual water level affected by rainfall can be deducted to analyze the impact of the river water level. The results show that the shallower water level Compared with the deeper aquifers 2-2 and 3, layers 1 and 2-1 have a more significant effect on the river water level. In the analysis of formation compression deformation, the correlation analysis between the principal component of groundwater level and the principal component of formation deformation shows that there is a high negative correlation between the water level change of each aquifer and the formation deformation, which is in line with the physical mechanism of groundwater level and formation deformation. The above analysis results show that principal component analysis, combined with the analysis process of this study, can indeed identify and isolate the influence of various external stimuli to the groundwater level, and can also obtain the main changes in the elastic deformation of the formation, which can be used as the basis for further water resources planning and analysis. Important reference.

How to cite: Chang, L. C., Chen, Y. C., and Lin, T. C.: An application of iterative principal component analysis on analyzing the regional groundwater level and stratum elastic-deformation, EGU General Assembly 2023, Vienna, Austria, 23–28 Apr 2023, EGU23-11745, https://doi.org/10.5194/egusphere-egu23-11745, 2023.

EGU23-12629 | ECS | Orals | HS8.2.9

Machine learning models to predict groundwater level in a Semi-arid river catchment, Central India 

Vipul Bhadani, Abhilash Singh, Vaibhav Kumar, and Kumar Gaurav

We applied different machine learning algorithms to predict the groundwater water fluctuation in a semi-arid river basin. Precipitation, temperature, evaporation, relative humidity, soil type, and groundwater lag were modeled as input features. Feature importance analysis of the input features indicate that the groundwater lag is the most relevant whereas the soil type is the least relevant input features. We applied the backward elimination approach to eliminate the less relevant features in mapping groundwater. Using the relevant input features we trained different machine-learning models (random forest, decision tree, neural network, linear regression, ridge regression, support vector regression, k-nearest neighbors, recurrent neural network). All these algorithms predicted the groundwater level with a high correlation of coefficient (R) ranging from 0.83 to 0.91 and a Root Mean Square Error (RMSE) ranging from 1.61 to 2.17 m.  We found that the random forest algorithm outperforms the other algorithms with a RMSE of 1.61 and R = 0.91. 

How to cite: Bhadani, V., Singh, A., Kumar, V., and Gaurav, K.: Machine learning models to predict groundwater level in a Semi-arid river catchment, Central India, EGU General Assembly 2023, Vienna, Austria, 23–28 Apr 2023, EGU23-12629, https://doi.org/10.5194/egusphere-egu23-12629, 2023.

EGU23-12633 | ECS | Orals | HS8.2.9

Calibration of coastal hydrogeological models for the analysis of groundwater-induced flooding: from instrumentation to model reliability 

Martin Le Mesnil, Jean-Raynald de Dreuzy, Luc Aquilina, Frédéric Gresselin, and Alexandre Gauvain

We determine the sensitivity of groundwater-induced flooding forecast to different modelling strategies (evolving model structure and quantity/nature of data). We test three calibration strategies on shallow coastal aquifers:

  • we use the river network as a proxy of aquifer seepage and determine uniform hydraulic conductivity and porosity. Despite limiting assumptions of surface/groundwater connections, this strategy could be broadly deployed with rapid advances in temporal and spatial river mapping at regional to national scales.
  • we calibrate uniform conductivity and porosity on hourly piezometric data time-series close to the seashore, which are controlled by both tide and inland aquifer recharge fluctuations. We investigate the limitations of the uniform assumptions and demonstrate the interests of coastal and inland forcing as complementary sources of information.
  • we introduce spatially variable conductivities and porosities and use additional inland piezometers. Hydraulic parameters are mapped to the main geological structures of the studied area.

We analyse the results of these 3 competing strategies on the hydraulic parameters and, in a more prospective way, on the spatial distribution of vulnerabilities to groundwater fluctuations. We perform our analysis within the “Rivages Normands 2100” research project, in several sites of Western Normandy (France). In this area, low-lying coastal areas and neighbouring lands are prone to groundwater table increase, leading to flooding of buried networks and building foundations. The site of Saint-Germain-sur-Ay (66 km2 coastal watershed) is equipped with 6 piezometers from which we collected 1.5 year-long hourly time series of groundwater level. It includes a low-elevation coastal area made up of sands and a continental area made up of schists.  The modelling approaches allowed us to simulate groundwater levels up to 2100, and to analyse the associated evolution of vulnerability. Simulations are performed using Modflow on a daily timestep, with a 75 m spatial resolution.

Results obtained from the 3 models consistently show that vulnerable areas are mostly clustered close to the shoreline. We also show that, in the studied watershed, the first calibration strategy using the river network data leads to long-term simulations close to the second calibration strategy using the piezometric data of the coastal area. Integration of extra piezometric data from the continental area in the third strategy provides more reliable simulations. This analysis is progressively deployed to other sites and extended to cost-benefit analyses including the costs of site instrumentation and the benefits of forecast reliability. Integration of flood zones aerial photography during extreme events is being implemented to the first modelling strategy, as well as wetland mapping.

How to cite: Le Mesnil, M., de Dreuzy, J.-R., Aquilina, L., Gresselin, F., and Gauvain, A.: Calibration of coastal hydrogeological models for the analysis of groundwater-induced flooding: from instrumentation to model reliability, EGU General Assembly 2023, Vienna, Austria, 23–28 Apr 2023, EGU23-12633, https://doi.org/10.5194/egusphere-egu23-12633, 2023.

Modeling spatially continuous variables from point measurements is integral to environmental scientific research in many fields. This is especially the case for groundwater, which is accessible only at boreholes and springs. Often, further management decisions are dependent on spatially continuous values of groundwater level or quality parameters.

For this task, deterministic or geostatistical interpolation methods are traditionally used, involving the spatial structure of the point locations as a set of XY-coordinates. In this case, the spatial model is usually created based solely on the geographic location of the measurement and the spatial autocorrelation of the target values. With few exceptions (e.g. co-kriging), classical interpolation techniques do not support the incorporation of covariates that are spatially correlated to improve spatial prediction accuracy.

Spatial predictions using machine learning (ML) models are an attractive and increasingly prevalent alternative, which use correlated, spatially continuous covariates (e.g. meteorological data, land-use, or geological maps) as predictors for groundwater level or quality parameters. They are trained on the nonlinear relationship between these predictors and the target values with the available point measurement data. However, spatial autocorrelations of the target values are usually not considered, as the points are treated independently of their location. Therefore, the machine learning models cannot exploit and represent the spatial dependence structures in the target data, without any further information about the geographic locations. The incorporation of locational information into ML models is, however, not trivial. From other fields, diverse approaches (e.g. using coordinates directly, distances to certain locations in space, Euclidean distance matrices, transformed coordinates) exist, and also different assessments of their suitability. For example, it is often stated that XY-coordinates are very well suited for the use with decision trees, but not for neural networks.

We systematically investigate the impact of the most commonly applied methods for the integration of spatial information, such as XY-coordinates, transformed coordinate-based input features, Euclidean distance matrix or distances to corners or center, Wendland transformed coordinates, and combinations of the aforementioned, on the interpolation results for selected hydrogeological parameters and different test sites in two ML models (Random Forest and Multi-Layer-Perceptron). We compare the results by cross-validation and with kriging reference models as well as visual assessment for plausibility.

The results show that the incorporation of spatial covariates can significantly improve model performance, especially when the data have high spatial autocorrelation (and the data set is sufficient to capture this). In particular, the Euclidean distance matrix and Euclidean distances to defined locations proved to be efficient approaches to provide the spatial data structure for the model, while the application of XY-coordinates often resulted in significant artifacts in the resulting prediction surfaces.

How to cite: Ohmer, M., Doll, F., and Liesch, T.: Incorporating spatial information for regionalization of hydrogeological parameters in machine learning models, EGU General Assembly 2023, Vienna, Austria, 23–28 Apr 2023, EGU23-12842, https://doi.org/10.5194/egusphere-egu23-12842, 2023.

EGU23-12956 | Orals | HS8.2.9

Global machine-learning model of naturally occurring fluoride in groundwater 

Joel Podgorski and Michael Berg

Chronic consumption of elevated concentrations of fluoride in groundwater can cause detrimental health effects including dental mottling and skeletal fluorosis. However, the concentration of fluoride is not known in many aquifers. To help address this, we have used machine learning to create a global fluoride prediction map based on the WHO drinking-water guideline of 1.5 mg/L. Over 400,000 data points of fluoride in groundwater (10% greater than1.5 mg/L) from 77 countries were used along with 12 predictor variables out of an initial set of 62 spatially continuous variables relating to geology, soil, climate and topography. The model performs very well, (e.g. AUC of 0.90) and was used to produce a global prediction map. This helps gauge the scope of the problem and identify potential hotspots that should receive the focus of more groundwater testing, including parts of central Australia, western North America, eastern Brazil and many areas of Africa and Asia. This fluoride hazard model was also used to estimate the global at-risk human population at about 180 million people, most of whom live in Asia and Africa. Another model was created using additional physicochemical parameters measured in situ. Although this model (AUC of 0.95) could not be used to create a map, it helps to better understand the processes related to the dissolution and accumulation of fluoride. For example, both the spatially continuous and in-situ predictor variables confirm that arid conditions promote the dissolution of fluoride in groundwater.

How to cite: Podgorski, J. and Berg, M.: Global machine-learning model of naturally occurring fluoride in groundwater, EGU General Assembly 2023, Vienna, Austria, 23–28 Apr 2023, EGU23-12956, https://doi.org/10.5194/egusphere-egu23-12956, 2023.

EGU23-13918 | ECS | Posters on site | HS8.2.9

Revealing controls on groundwater level patterns by backward variable elimination in the Baltic states 

Jānis Bikše, Inga Retike, Ezra Haaf, Konrāds Popovs, and Andis Kalvāns

Groundwater level data are often spatially and temporary unevenly distributed, and the heterogeneity of hydrogeological systems limit simple extrapolation to data-scarce locations. Here, similarity of hydrogeological systems can be used to transfer dynamics of groundwater levels from monitored to unmonitored locations. Therefore, the major controls of hydrogeological systems need to be investigated. This study aims to uncover dominant patterns of the groundwater levels and to connect them with possible controls or driving features (such as the catchment and topography characteristics, aquifer properties, climate and land use) of hydrogeological systems in the Baltic states. Part of the spatial features were calculated for three different buffer sizes (300m, 3km and 5km). Gapless daily groundwater hydrographs (prepared by Bikše et al., 2023) were used to create groundwater level patterns by clustering approach. Then, random forest classification was performed using a backward variable elimination approach to find the most significant site-descriptive features for each cluster. The results show that the most significant tend to be geological features in the well cross-section, followed by topographic features within the vicinity of the well. We also found that anthropogenic impacts can play a significant role and should be considered when analyzing groundwater level patterns.

References:

Bikše, J., Retike, I., Haaf, E., Kalvāns, A., 2023. Assessing automated gap imputation of regional scale groundwater level data sets with typical gap patterns. EarthArXiv. https://doi.org/10.31223/x5n94x


"The study has been funded by Iceland, Liechtenstein and Norway through the EEA and Norway Grants Fund for Regional Cooperation project No.2018-1-0137 “EU-WATERRES: EU-integrated management system of cross-border groundwater resources and anthropogenic hazards" and by the Latvian Council of Science, project “Spatial and temporal prediction of groundwater drought with mixed models for multilayer sedimentary basin under climate change”, project No. lzp-2019/1-0165.

How to cite: Bikše, J., Retike, I., Haaf, E., Popovs, K., and Kalvāns, A.: Revealing controls on groundwater level patterns by backward variable elimination in the Baltic states, EGU General Assembly 2023, Vienna, Austria, 23–28 Apr 2023, EGU23-13918, https://doi.org/10.5194/egusphere-egu23-13918, 2023.

In sub-Arctic environment as in Finland, soil moisture and temperature dynamics affect the development of soil frost that controls snowmelt runoff, infiltration and recharge in winter periods. This study was initiated to investigate the performance of integrated hydrology model Amanzi-ATS, in simulating dynamics of soil moisture and temperature at different depths to assess recharge rate in unconfined aquifer in Central Finland. Our objective is to study intra- and inter-annual recharge rates, and the impacts of soil ice on groundwater recharge rate. Hourly soil water content and temperature was measured at ten different depths. The groundwater depth and temperature were measure daily from the borehole located 2 meters from the soil monitoring station and the climate data was obtained around 5 km from the soil station. 1D model with varying soil texture was developed to predict recharge rates. Measured soil water content, soil temperature and groundwater temperature were used to calibrate the 1D numerical model. The implications of this study will be understanding the freezing and thawing of soil on groundwater recharge rate and how recharge rate may change from one year to the next in the sub-Arctic environment.

How to cite: Remes, J. and Okkonen, J.: Numerical simulations of freeze/thaw cycle and its impact on groundwater recharge in sub-Arctic environment, EGU General Assembly 2023, Vienna, Austria, 23–28 Apr 2023, EGU23-14561, https://doi.org/10.5194/egusphere-egu23-14561, 2023.

EGU23-15164 | Posters on site | HS8.2.9

Impact of storm water on groundwater recharge and discharge using machine learning 

Yun-Chi Chung and Li-Chiu Chang

Surface water and groundwater are both important water sources for people’s livelihood, irrigation and industry. Especially, groundwater can supply water stability in times of drought to mitigate drought disaster. Due to the uneven temporal and spatial distribution of rainfall in Taiwan, there is a large difference in rainfall during the wet and dry seasons, and the rapid changes in the terrain slope cause the river flow rapid, which cannot store and utilize water resources. The rapid economic development makes the water demand increase year by year. Therefore, the surface water cannot meet the demand. Groundwater flows slow and replenishment is difficult. Long-term overuse will cause the gradual depletion of underground water sources, resulting in severe damages such as stratum subsidence and seawater intrusion. Therefore, if we can master the situation of groundwater changes and it is helpful to the management and deployment of surface water and groundwater resources.

The purpose of this study is to explore the interaction between surface water and groundwater during typhoon periods using machine learning methods. The research area is the Choshui river basin. According to the long-term monitoring of hydrological and groundwater data, different temporal and spatial distributions of rainfall events are selected to conduct principal component analysis (PCA) for each aquifer. Through the principal component weights, tempo-spatial distribution of rainfall and streamflow to analyze the trend of groundwater observation wells, and then use the recurrent configuration of nonlinear autoregressive with exogenous inputs (R-NARX) to predict the hourly groundwater level. Principal component analysis was used to understand the impact of storm water on the groundwater recharge, and the relationship between principal component scores and flow and rainfall was used to find out the key factors affecting the groundwater level. The results can provide the sensitive areas of groundwater recharge in Choshui river basin for adopting the optimal water resource allocation strategy.

Keywords:Groundwater; Principal component analysis (PCA); Machine learning

How to cite: Chung, Y.-C. and Chang, L.-C.: Impact of storm water on groundwater recharge and discharge using machine learning, EGU General Assembly 2023, Vienna, Austria, 23–28 Apr 2023, EGU23-15164, https://doi.org/10.5194/egusphere-egu23-15164, 2023.

EGU23-15276 | ECS | Posters on site | HS8.2.9

Developing an operational model to support groundwater management decision-making in the UK 

Doris Wendt, Gemma Coxon, and Francesca Pianosi

Decision-making in groundwater management could benefit from a robust modelling approach that considers the complexity and uncertainty in water availability, dynamic impact of management and modelling setups available. Modelling groundwater is a complex matter on its own given the heterogeneous aquifers, delayed climate signal in groundwater recharge and dynamic influence of water abstractions. Due to this complexity, decision-making models are often simplified to address only the main impacts on the hydrological cycle. Whilst this simplification is necessary, it is important to examine model process controls and uncertainty in parameters of a simplified model setup. 

In this study, we have converted a lumped conceptual socio-hydrological model to an operational tool for supporting decision-making by (1) evaluating and (2) calibrating the model. First, we applied global sensitivity to examine the “consistency” and “leverage” of the model. A model is considered consistent when modelled process controls match our system understanding. Leverage is observed when modelled strategies have adequate influence on modelling output regardless of parameter uncertainty. Results show that even with large uncertainty in parameter values, consistency is achieved for all hydrological variables. Input parameters defining management strategies are found to have significant leverage, as varying them induce noticeable changes in simulation outputs regardless of the physical conditions or uncertainty in parameters. When looking at hydrological extremes, this impact was amplified. 

Second, the model was calibrated for a range of catchments in the UK. The eleven model parameters were constrained using statistical criteria to identify an optimum parameter range. Model outputs were compared to observations (discharge and groundwater level time series using both similarity and signature-based evaluation criteria. Additionally, we sourced open access UK datasets to validate our data-based parameter ranges with local information. In general, calibrated model outputs represent surface water and groundwater features well and in particular, baseflow generation is well-represented. This encourages model applications for examining regional/national policies aiming to protect groundwater-fed streams. Exploratory model runs can also be used to facilitate discussions on new/altered management strategies and may spark further detailed modelling once a suitable strategy is identified. 

How to cite: Wendt, D., Coxon, G., and Pianosi, F.: Developing an operational model to support groundwater management decision-making in the UK, EGU General Assembly 2023, Vienna, Austria, 23–28 Apr 2023, EGU23-15276, https://doi.org/10.5194/egusphere-egu23-15276, 2023.

EGU23-15725 | ECS | Posters on site | HS8.2.9

Global sensitivity analysis of water level response to harmonic aquifer disturbances considering wellbore effects 

Yixuan Xing, Quan Liu, Rui Hu, and Thomas Ptak

Abstract: Oscillatory water level is often observed in groundwater monitoring wells when the aquifer is disturbed by some periodic pressure sources, such as oscillatory hydraulic test, ocean tide, and far-field seismic wave. The amplitude attenuation (A) and phase shift (P) between the source and water level response are utilized to estimate aquifer properties in many related studies. Water level response, in essence, is not only affected by aquifer parameters but also the characteristics of disturbance source and wellbore effects, which are determined by multiple parameters and the highly nonlinear well-aquifer system. To clarify the impacts of A and P on all relevant parameters, a global sensitivity analysis of water level response to harmonic aquifer disturbance is conducted in this study. A general numerical model of water level response that integrates different types of sources and considers wellbore effects is first introduced. Based on the quasi-Monte Carlo method, nine relevant parameters regarding wellbore geometry, aquifer property, and characteristics of the source, are sampled within their normal ranges. A data-driven model of the water level response to the selected parameters is trained and cross-validated using the random forest regression method. The global sensitivity analysis of the A and P is then implemented by using the variance-based method.  The first-order Sobol index shows that for both A and P, the oscillatory period of the disturbance source is the most sensitive factor among others. The second-order Sobol index indicates that the interaction between the period of disturbance source and water column height in the wellbore is the most important to A and P. preliminary results show that wellbore effects have significant impacts on water level responses, especially under a high-frequency disturbance.

How to cite: Xing, Y., Liu, Q., Hu, R., and Ptak, T.: Global sensitivity analysis of water level response to harmonic aquifer disturbances considering wellbore effects, EGU General Assembly 2023, Vienna, Austria, 23–28 Apr 2023, EGU23-15725, https://doi.org/10.5194/egusphere-egu23-15725, 2023.

EGU23-16375 | ECS | Orals | HS8.2.9

Machine Learning Models for Spatial Prediction of Groundwater Potentiality in a Large Semi-Arid Mountainous Region: Application to the Rherhaya Watershed, High Atlas, Morocco 

Mourad Jadoud, Abderrahim El Achheb, Noureddine Laftouhi, Mustapha Namous, Abdellah Khouz, Jorge Trindade, Fatima El Bchari, Blaid Bougadir, Hasna Eloudi, and Said Rachidi

Estimating the potential of underground water sources has become a top priority for authorities in semi-arid mountain regions, particularly in the context of recent climate change that has made surface water less accessible and available. However, exploratory methods are typically quite expensive, such as geophysical and topographic methods, which take into account the vastness of the terrain and the extremely limited accessibility in the mountains such as the High Atlas. To achieve this, it has become necessary to use indirect methods first to define potential groundwater zone boundaries before turning to direct measures. This study proposes an indirect, straightforward, quick, and minimally costly method for identifying potential areas for groundwater in the Rherhaya watershed, High Atlas-Morocco, using machine learning, geographical information systems, and remote sensing.

Machine learning algorithms have been increasingly applied to define potential groundwater areas mapping. It’s performance to predict the spatial distribution of potential groundwater zones was tested with an inventory-based spring’s geodatabase. 254 spring’s obtained inventory was split into two independent datasets, including 70% of the springs for the training set and the remaining 30% of springs for validation purposes in the test set. 19 layers of landslide-conditioning factors were prepared and checked for collinearity issues, to produce the potential groundwater zones map. The conditioning factors were selected, prepared and classified, in order to determine the contribution of each class of factors to potential groundwater areas, including: Elevation, Aspect, Slope angle, Curvature plan, Curvature profile, Stream Power Index (SPI), Topographic Wetness Index (TWI), Normalized Difference Vegetation Index (NDVI), Distance to rivers, Lithology, Rainfall, Land Use and Land Cover (LULC), Drainage density, Valley Depth, Topographic Position Index (TPI), Terrain Ruggedness Index (TRI), Slope Length (LS), Geomorphons, Distance to faults, Distance to spring and Distance to roads. Both the inventory and the conditioning factors are obtained from the observation and interpretation of different data sources, namely high-resolution satellite images, aerial photographs, topographic maps, and extensive field surveys.

Using RStudio software, three machine-learning algorithms were used in this study: Random Forest (RF), Logistic Regression (LR), and Support Vector Machine (SVM). The model’s evaluation and validation was assessed using a hybrid approach based on k-cross validation, ROC Curve - AUC, and confusion matrix for the estimation of the predictive performance. The three models provided very encouraging results in terms of identifying the areas that are very likely to produce subsurface water in the Rherhaya basin.  The main contributing factors to the potentiality of underground waters, according to the three methods, are the valley depth, TPI, distance to rivers, and curvature plane.  With an AUC of 84.4% in the test data, it was clear that the SVM model outperforms the other models for the 70/30 percent subdivision. These findings may contribute to the development of a significant database that will help in the management of water resources in vulnerable areas by decision-makers.

How to cite: Jadoud, M., El Achheb, A., Laftouhi, N., Namous, M., Khouz, A., Trindade, J., El Bchari, F., Bougadir, B., Eloudi, H., and Rachidi, S.: Machine Learning Models for Spatial Prediction of Groundwater Potentiality in a Large Semi-Arid Mountainous Region: Application to the Rherhaya Watershed, High Atlas, Morocco, EGU General Assembly 2023, Vienna, Austria, 23–28 Apr 2023, EGU23-16375, https://doi.org/10.5194/egusphere-egu23-16375, 2023.

EGU23-16384 | ECS | Orals | HS8.2.9

Difficulties arising when PS-InSAR displacement measurements are compared to results from geomechanical and groundwater flow computations. 

Aline Moreau, Atefe Choopani, Pierre-Yves Declercq, Philippe Orban, Xavier Devleeschouwer, and Alain Dassargues

Interferometric Synthetic Aperture Radar (InSAR) technology has been used to detect the location and magnitude of ground deformation for the past 30 years, providing cost-effective measurements with a fine resolution and precision within centimeters under ideal conditions1. Persistent Scatterer InSAR Interferometry (PS-InSAR) is an InSAR algorithm that has been developed to overcome decorrelation due to changes in the physical characteristics of the surface over time that limit the InSAR applications 2,3.

PS-InSAR processing has been used to identify multiple localized land subsidence in the Antwerp and Leuven areas in Belgium. In Antwerp, the harbour was gradually developed, leading to dock excavations in a compressible estuary polders environment and PS-InSAR was used to detect, map and study the ground displacements4. In Leuven, significant subsidence was observed through the city and the suburbs, potentially due to delayed consolidation in compressible, low permeability aquitards. One of the possible cause of these subsidence phenomena is related to variation in groundwater levels resulting in consolidation processes. To test this hypothesis, geomechanical calculations coupled to groundwater flow models are carried out to simulate the vertical displacements. The results are compared to PS-InSAR-derived subsidence observations for a better understanding of subsurface consolidation mechanisms.

However, there are several practical and conceptual challenges that must be considered when comparing InSAR measurements to results from hydrogeological and geomechanical models. One issue is the choice of the appropriate modeling scale, as subsidence may occur locally but also regionally as influenced by groundwater pore pressure variations occurring at different scales. Another challenge lies in the selection of the appropriate conceptual assumptions linked to the groundwater flow and geomechanical models. Indeed, in addition, uncertainty in the model parameter values is a typical source of uncertainty in the model results. There may also be errors in the InSAR measurements due to various factors such as atmospheric effects and changes in the surface roughness. All these challenges must be taken into account when comparing InSAR measurements to model results.

In conclusion, comparing InSAR measurements with hydrogeological and geomechanical modeling results can provide valuable insights into the actual mechanisms of subsidence. However, it is important to carefully consider the practical and conceptual challenges and limitations linked to this interesting comparison.


References:

1 Peng, M., Lu, Z., Zhao, C., Motagh, M., Bai, L., Conway, B. D., & Chen, H. (2022). Mapping land subsidence and aquifer system properties of the Willcox Basin, Arizona, from InSAR observations and independent component analysis. Remote Sensing of Environment271, 112894.

2 Ferretti, A., Prati, C., & Rocca, F. (2000). Nonlinear subsidence rate estimation using permanent scatterers in differential SAR interferometry. IEEE Transactions on geoscience and remote sensing38(5), 2202-2212.

3 Ferretti, A., Prati, C., & Rocca, F. (2001). Permanent scatterers in SAR interferometry. IEEE Transactions on geoscience and remote sensing39(1), 8-20.

4 Declercq, P. Y., Gérard, P., Pirard, E., Walstra, J., & Devleeschouwer, X. (2021). Long-term subsidence monitoring of the Alluvial plain of the Scheldt river in Antwerp (Belgium) using radar interferometry. Remote Sensing13(6), 1160.

How to cite: Moreau, A., Choopani, A., Declercq, P.-Y., Orban, P., Devleeschouwer, X., and Dassargues, A.: Difficulties arising when PS-InSAR displacement measurements are compared to results from geomechanical and groundwater flow computations., EGU General Assembly 2023, Vienna, Austria, 23–28 Apr 2023, EGU23-16384, https://doi.org/10.5194/egusphere-egu23-16384, 2023.

EGU23-16594 | Posters on site | HS8.2.9

Groundwater modelling based on physics-informed neural networks 

Qidong Fang, Francesca Pianosi, and A S M Mostaquimur Rahman

Groundwater is the world's largest accessible source of fresh water and plays an indispensable role in the global water cycle. Groundwater supports irrigation, supplies drinking water, and sustains baseflows to the surface expression of groundwater (e.g. rivers, ponds, wetlands). Simulations using physical numerical models are computationally expensive due to the heterogeneity of the actual groundwater flow and the complex initial and boundary conditions. Several surrogate models for reducing the computational burden have been proposed, however, they usually do not follow physics law. In this study, we intend to combine machine learning methods to analyse the feasibility of physics-informed neural networks (PINN) in groundwater modelling and propose a PINN groundwater model for the simulation of groundwater flow to improve computational efficiency while restricted to the physics law.

How to cite: Fang, Q., Pianosi, F., and Rahman, A. S. M. M.: Groundwater modelling based on physics-informed neural networks, EGU General Assembly 2023, Vienna, Austria, 23–28 Apr 2023, EGU23-16594, https://doi.org/10.5194/egusphere-egu23-16594, 2023.

HS8.3 – Subsurface hydrology – Vadose zone hydrology

EGU23-82 | ECS | Posters on site | HS8.3.1

Grapevine agronomic responses to different water regimes south of Tunisia 

Leila ElGhoul, Fatma Wassar, Fathia El Mokh, and Kamel Nagaz

Water scarcity is a limiting factor for agricultural development. Accordingly, the improvement of its efficiency is indispensable through the application of adequate irrigation strategies including deficit irrigation. In this context this work was undertaken. A field experiment have been carried out in Beni Khdache, south of Tunisia on grapevines to evaluate the agronomic responses, in terms of crop development, yield, yield quality and water productivity, under different water regimes. The first treatment (T100) consisted in delivering to the crop 100% of the ETc. The other two treatments (T75 and T50) consisted in delivering only 75 and 50% of the total real needs of the crop respectively. The fourth treatment (T0) was irrigated according to the farmer's recommendations. The results show a significant effect of the deficit irrigation on the vegetative growth of the grapevines in terms of berry weight. This difference had later a significant impact on the final yield. The highest yield (14t/ha) was found with full irrigation (T100). The farmer's method led to a significant drop in yield (40%) compared to the full irrigation treatment. Trees under water deficit (T75, T50) responded with an accumulation of sugars (17.3 °Brix and 16.8° Brix respectively) and a slight decrease in fruit acidity (3.9 and 3.8 respectively) compared to the T100 treatment (15°Brix,4) .  The difference in irrigation water productivity of the grapevines obtained with the deficit irrigation treatments (T75, T50) is not significant compared to that of T100.  The low water productivity was observed for the T0 and T75 treatments (1.9kg/m3 and 2.4 kg/ m3 respectively), while the highest values were obtained with the T50 and T100 treatments (2.8 kg/m3 and 2.6 kg/m3). These results indicate that full irrigation (T100) seems to be an adequate irrigation strategy for grapevine production under Tunisian arid conditions. Under water scarcity conditions, deficit irrigation with a 25% reduction in inputs (T75) is recommended for grapevine management. The T75 deficit irrigation treatment allows to save large amounts of irrigation water (25%) and to improve water productivity but accepting a certain yield drop.

Keywords: Full irrigation, deficit irrigation, grapevine, yield, water productivity, arid environment, farmer's practices

How to cite: ElGhoul, L., Wassar, F., El Mokh, F., and Nagaz, K.: Grapevine agronomic responses to different water regimes south of Tunisia, EGU General Assembly 2023, Vienna, Austria, 23–28 Apr 2023, EGU23-82, https://doi.org/10.5194/egusphere-egu23-82, 2023.

Tillage alters soil structure and pore size distribution, consequently affecting the shape of the soil-water retention curve (SWRC) and related hydraulic parameters in the top layer of soil. This work compares the effect of no-tillage (NT) and conventional tillage (CT) practices on SWRCs at 0-15 and 15-30 cm soil depths based on soil samples collected in 2014, 2015, 2016, and 2017. Undisturbed soil cores were extracted using stainless steel cylinders (8 cm in diameter and 5 cm in height) from 0-15 cm and 15-30 cm depths in planted corn rows. Soil core sampling was replicated five times in a randomized block design. Soil cores were saturated prior to measurement by the capillarity method and SWRC were measured using the evaporative method. Measured soil-water retention curve data were modeled for no-tilled and tilled soils using the van Genuchten (vG) equation for each depth. Results indicated that differences existed in SWRC properties and estimated parameters of vG equation between the two tillage practices. Averaged across 4 years and two depths, the SWRC parameters α, n, and θs were significantly greater under CT than under NT, however, θr was not affected by tillage. The higher α, n, and θs values in CT were likely associated with greater soil loosening and disturbance induced by CT operations, thereby forming greater macroporosity and pore volume. Regardless of the tillage method, SWRCs enable growers to select farming and irrigation management practices that improve water use efficiency, sustain crop productivity and maintain environmental quality.

How to cite: Jabro, J. and Stevens, B.: Soil-water characteristic curves and their estimated parameters as affected by tillage intensity, EGU General Assembly 2023, Vienna, Austria, 23–28 Apr 2023, EGU23-1053, https://doi.org/10.5194/egusphere-egu23-1053, 2023.

EGU23-1237 | Posters on site | HS8.3.1

A deep neural network model to estimate water retention of compacted clayey soils 

Vladimir Tyurin, Reza Taherdangkoo, and Christoph Butscher

Soil-water retention is fundamental to understand hydro-mechanical characteristics of unsaturated clayey soils. The soil-water retention curve (SWRC) depends on internal (e.g. mineralogical composition, and chemo-physical properties of soils) and external (e.g. stress states and temperature) factors. The SWRC is usually determined through laboratory testing, which is costly and time consuming. In this study, we compiled an experimental dataset containing water retention data of artificial and natural clayey soils to develop a deep neural network (DNN) model trained with genetic algorithm (GA) to estimate SWRC over a wide suction range. The relevant soil properties including dry density, liquid limit, plastic limit, plasticity index, initial water content, void ratio, and suction are the input variables of the DNN-GA model, while the gravimetric water content is the output variable. The analysis of modeling errors and the comparison of gravimetric water content predicted values with experimental values showed the high efficiency of the model being developed. The DNN-GA model can be used as an accurate alternative to classical soil mechanic correlations.

How to cite: Tyurin, V., Taherdangkoo, R., and Butscher, C.: A deep neural network model to estimate water retention of compacted clayey soils, EGU General Assembly 2023, Vienna, Austria, 23–28 Apr 2023, EGU23-1237, https://doi.org/10.5194/egusphere-egu23-1237, 2023.

EGU23-1485 | ECS | Orals | HS8.3.1

Wappfruit: a project for the optimisation of water use in agriculture 

Davide Gisolo, Mesmer N'sassila, Alessio Gentile, Francesca Pettiti, Mattia Barezzi, Umberto Garlando, Luca Nari, Stefano Ferraris, Danilo Demarchi, and Davide Canone

The WAPPFRUIT project is related to the optimisation of irrigation techniques in the Piemonte Region, Northwest Italy. The main goal is to control irrigation to understand if it is possible to reduce the volume of water used for irrigation and also save energy. The project involves several stakeholders, among which Politecnico and the University of Torino, Piemonte Region, Agrion Foundation for research in agriculture, and three farms (two apple orchards and one Actinidia orchard). The optimisation relies on soil matric potential measurements at several soil depths. The irrigation will be triggered using a particular algorithm which is based on a system of matric potential thresholds at the depths of 20 and 40 cm. These thresholds are based on soil texture, and vegetation species (including root depth). 

Each orchard is divided into two parts: an “experimental area” where the irrigation algorithm will be tested, and an area that will be irrigated as usual by farmers. Each orchard is equipped with four to six measurement nodes, with soil water content and soil matric potential profile having measures at 20, 40, and 60 cm of depth. 

The retention curves, as well as the spatial and temporal variability of soil water content and soil matric potential, can be inferred from measures, which reveal high volumes of water used for irrigation (frequently the soil was near saturation conditions). In addition, all the soils show, in the retention curves, a hysteresis due to wetting/drying cycles. 

The farmers continued to irrigate as usual in the two parts of the fields up to October 2022. Hence, to investigate the matric potential behavior and identify good estimates of thresholds, modeling approaches are important for the simulation of soil without irrigation, to understand when water stress conditions could occur. To this purpose, two models are used to simulate the water fluxes in the atmosphere and the soil (and, particularly, the matric potential). The two models adopted are the hydrological model Hydrus 1D and the land-surface model CLM5. Forcing the models with the precipitation summed to irrigation of the fields, Hydrus, in its 1D formulation did not yield reliable results, although more studies are needed to fully understand the causes for the misrepresentation. The CLM model yields instead more reliable outcomes. The CLM model is then used to simulate the behavior of the soil matric potential under the hypothesis of no irrigation. The results illustrate that the matric potential threshold for triggering irrigation could be around -50 kPa at 20 cm, whereas the threshold at 40 cm for the deactivation of irrigation could be around -40 kPa for the sites with apple orchards. The site with Actinidia could have the aforementioned thresholds equal to -40 kPa at 20 cm and -30 kPa at 40 cm.

How to cite: Gisolo, D., N'sassila, M., Gentile, A., Pettiti, F., Barezzi, M., Garlando, U., Nari, L., Ferraris, S., Demarchi, D., and Canone, D.: Wappfruit: a project for the optimisation of water use in agriculture, EGU General Assembly 2023, Vienna, Austria, 23–28 Apr 2023, EGU23-1485, https://doi.org/10.5194/egusphere-egu23-1485, 2023.

EGU23-2285 | ECS | Posters on site | HS8.3.1

Impact of soil texture and heterogeneity on complex interactions between surface soil salinity and saltwater intrusion in coastal regions 

Vahid Sobhi Gollo, Eva González, Jörg Elbracht, Peter Fröhle, and Nima Shokri

Soil salinization, referring to the excessive accumulation of soluble salts in soil to a degree that adversely influences vegetation and environmental health, is an unfolding challenge threatening soil health, vegetation and consequently food security with serious socio-economics implications (Hassani et al., 2020, 2021). High salinities in the root zone reduce water and nutrient uptake and result in soil infertility, freshwater contamination at the surface and the loss of biodiversity.

Here, we concentrate on soil salinization in coastal areas due to saltwater intrusion and the groundwater salinization, partly influenced by climate change.  In low-lying coastal regions where, saline groundwater levels are shallow, saltwater intrusion poses risks to vegetation and soil health since the soluble salt could be transported toward the surface. This causes soil salinization depending on the competition between upward capillary forces and the limiting downward gravity and viscous forces. Several parameters influence such a competition including soil texture and heterogeneity. We developed a quantitative framework, using software package FEFLOW, to delineate the regional impact of soil textures and arrangements on salt transport toward the surface in low-lying coastal regions. The model includes a wide range of hydrologic, soil and climate related factors such as hydraulic heads, soil properties, and groundwater recharge. We evaluated the performance of the developed model using field data measured in the “Alte Land” located in north Germany near the Elbe estuary - an agriculturally significant low-lying region threatened by increasing soil surface salinity.

The evaluation of the model against field-data was followed by conducting the simulation under several hypothetical scenarios differing in soil textures, layering and arrangements to investigate how these parameters would influence soil surface salinity driven by the saltwater intrusion in coastal areas.  Our results highlight the prominent effects of different soil textures and arrangements on the regional surface soil salinity and the amount of salt deposited close to the surface. This agrees with the conclusions of laboratory experiments which were conducted in other studies at scales much smaller than the one investigated in our analysis (Shokri-Kuehni et al., 2020). Our results suggest that an effective soil remediation strategy for salinity treatment would require high resolution 3D mapping of soil properties which influences soil salinization. Our findings shed new light on the dominant parameters influencing surface soil salinity in coastal areas threatened by the saltwater intrusion as a result of the projected climate changes.


References

Hassani, A., Azapagic, A., Shokri, N. (2020). Predicting Long-term Dynamics of Soil Salinity and Sodicity on a Global Scale, Proc. Nat. Acad. Sci., 117 (52), 33017-33027.

Hassani, A., Azapagic, A., Shokri, N. (2021). Global Predictions of Primary Soil Salinization Under Changing Climate in the 21st Century, Nat. Commun., 12, 6663.

Shokri-Kuehni, S.M.S., Raaijmakers, B., Kurz, T., Or, D., Helmig, R., Shokri, N. (2020). Water Table Depth and Soil Salinization: From Pore-Scale Processes to Field-Scale Responses. Water Resour. Res., 56, e2019WR026707.

How to cite: Sobhi Gollo, V., González, E., Elbracht, J., Fröhle, P., and Shokri, N.: Impact of soil texture and heterogeneity on complex interactions between surface soil salinity and saltwater intrusion in coastal regions, EGU General Assembly 2023, Vienna, Austria, 23–28 Apr 2023, EGU23-2285, https://doi.org/10.5194/egusphere-egu23-2285, 2023.

EGU23-2711 | ECS | Posters on site | HS8.3.1

Modes of interaction and varying feedback between groundwater and climate depending on soil characteristics 

Anastasia Vogelbacher, Kaveh Madani, and Nima Shokri

Climate, climate variability, and climate change could influence groundwater. Shifts in precipitation patterns, recharge, or snowmelt are among the several climate-related variables with important impacts on groundwater. However, the climate-groundwater relationship is not one-way. Groundwater can also impact the climate itself via its influence on different processes and variables such as evaporation, soil moisture, and vegetation. Understanding the interactions and the feedback relationship between groundwater and climate is crucial for sustainable water resource management and resilient adaptation to climate change. Current understanding of how climate influences groundwater and the resulting feedback from groundwater and its impacts on climate is limited. This is of particular importance in the face of projected climatic changes. Here, we aim to develop a simple analytical framework to extend the projection capabilities required to characterize the climate-groundwater interactions depending on the soil characteristics serving as an intermediate domain between the groundwater and climate systems. Our proposed analytical framework can be used to identify potential regions with significant two-way (bidirectional) interactions between climate and groundwater using soil characteristics and soil water retention curves following the theoretical lines discussed in Shokri and Salvucci (2011) and Or and Lehmann (2019). Using this framework, we identify regions of expected hydraulic connections between groundwater and soil surface, depending on the competition between capillary forces and the limiting gravity and viscous forces, and the groundwater depth (GWD) in the city of Hamburg. We argue that in regions with bidirectional interactions, groundwater is potentially more vulnerable to climate change and variability. Moreover, our initial results suggest that regions with finer textured soils are more sensitive to changes in evaporation and air temperature in terms of hydraulic connections between groundwater and the soil surface, which can influence the groundwater-climate interactions. Our analysis provides the basis for further investigation of the feedback impacts of groundwater on several variables, such as soil moisture, ground cooling capacity, and vegetation patterns under different climate change scenarios.


References

Or, D., & Lehmann, P. (2019). Surface evaporative capacitance: How soil typeand rainfall characteristics affect global‐scale surface evaporation. Water Resources Research, 55, 519–539.https://doi.org/10.1029/2018WR024050.

Shokri, N., Salvucci, G. (2011). Evaporation from porous media in the presence of a water table. Vadose Zone J., 10, 1309-1318.

How to cite: Vogelbacher, A., Madani, K., and Shokri, N.: Modes of interaction and varying feedback between groundwater and climate depending on soil characteristics, EGU General Assembly 2023, Vienna, Austria, 23–28 Apr 2023, EGU23-2711, https://doi.org/10.5194/egusphere-egu23-2711, 2023.

Accurate prediction of infiltration into the soil is essential for a variety of applications, including irrigation planning, flood prediction, and pollutants transport. In this study, we applied a two-dimensional model for simulating infiltration in heterogeneous soils, focusing on the effects of topsoil-subsoil interface morphology with the presence of wheel tracks. The model is based on the Richards equation and includes different soil hydraulic properties (SHP) for three soil materials: topsoil, subsoil and wheel track. To examine the effects of the topsoil-subsoil interface and wheel track compaction on infiltration, we conducted field experiments on a 16 m2 plot with simulated rain with constant precipitation intensity. We collected soil moisture and soil water pressure data at different depths and used these data to optimize the SHPs. The topography of the soil surface and the morphology of topsoil-subsoil interface were also recorded using photogrammetric methods. The results of the model simulations show that the topsoil-subsoil interface and wheel track compaction have significant effects on infiltration. The topsoil-subsoil interface acts as an infiltration barrier. The morphology of the interface causes a large heterogeneity in the water flow field and completely diminishes the effect of the slope on the water flow. The wheel track caused an infiltration excess overland flow while the topsoil outside the wheel track exhibited saturation excess overland flow. Subsoil in the wheel track remained unsaturated throughout the rainfall simulation period, affecting water redistribution after the rainfall ended. This study demonstrates that even the small-scale heterogeneity in the shallow part of the soil profile strongly influences the water flow field. The disturbed flow field can affect the distribution of water and nutrients in the root zone and potentially cause the activation of preferential pathways due to the spatial variability of saturation at the topsoil-subsoil interface. The work presented above was supported by an EU TuDi project no. 101000224 and by State Environmental Fund of the Czech Republic project no. 085320/2022.

How to cite: Jeřábek, J. and Zumr, D.: Two-Dimensional Modeling of Infiltration in Heterogeneous Soils: The Effects of Topsoil-Subsoil Interface and Wheel Track Compaction, EGU General Assembly 2023, Vienna, Austria, 23–28 Apr 2023, EGU23-2753, https://doi.org/10.5194/egusphere-egu23-2753, 2023.

EGU23-2861 | ECS | Orals | HS8.3.1

Modeling of Indigenous Marab Water Harvesting Technique in the Jordanian Badia 

Niccolò Renzi, Lorenzo Villani, Hilali Muhi El-Dine, Mira Haddad, Elena Bresci, Stefan Strohmeier, and Giulio Castelli

In drylands, agriculture is mainly rainfed due to the absence of water resources for irrigation. In such contexts, water harvesting interventions have been part of the knowledge and legacy of the local communities for centuries. In the Jordanian Badia, research centres like ICARDA (the International Centre for Agriculture Research in Dry Area) have tried to improve this knowledge and have developed several experiments to increase local communities’ livelihood by introducing up-to-date water management practices.

This study focused on the modeling one of these interventions, the Marab Water Harvesting technology (WHT), a macro-catchment water harvesting system that gets flooded by the run-off of the upstream watershed, increasing the water infiltrated and stored in the soil. This water buffer enhances barley production, hence more fodder is available for the local livestock, allowing the communities to reduce the grazing pressure on their lands.

AquaCrop by FAO was used to simulate the crop cycle. The data needed to run the simulations were collected in fieldwork in the Jordanian Badia during the cropping season 2021/2022. Satellite images were also used to improve the calibration and validation process, together with yield data. Different scenarios were run to assess the performance of the Marab WHT, considering: comparison with the traditional cropping technique, flooding events reduction, different soil textures, and different climatic conditions.

The results of the simulations were: i) barley produced more in the Marab WHT (8.13 t/ha) rather than with the traditional cropping technique (between 0.00 - 1.00 t/ha;  ii) silty soils were the most productive with 9.25 t/ha of biomass production, while the least productive had been the clay soils with 6.60 t/ha; iii) with a changing climate, the Marab WHT started to reduce its production by 4-8 % with a +0.5°C temperature increase. In contrast, the reduction of precipitation didn’t impact significantly the crop, decreasing the yield by only 4 – 10%. In fact, the main cause of the high crop yield reduction was the timing and numbers of the flood events, causing barley failure if both the first and last flood events are removed. Without the first flood, the yield decreases by up to 80%, while removing the last flood event the reduction in biomass is 50%.


How to cite: Renzi, N., Villani, L., Muhi El-Dine, H., Haddad, M., Bresci, E., Strohmeier, S., and Castelli, G.: Modeling of Indigenous Marab Water Harvesting Technique in the Jordanian Badia, EGU General Assembly 2023, Vienna, Austria, 23–28 Apr 2023, EGU23-2861, https://doi.org/10.5194/egusphere-egu23-2861, 2023.

The most important parameterizations of the soil water retention curve do not perform very well in either the wet or the dry end. Rossi and Nimmo (WRR 1994) therefore gave the Brooks-Corey (1966) power-law model of the soil water retention curve a non-asymptotic dry range. Ippisch et al. (Adv. Water Resour., 2006) added an air-entry value to the sigmoidal retention model of van Genuchten (SSSAJ 1980). The models of Rossi and Nimmo and Ippisch et al. were Adapted by de Rooij (HESS 2021) to arrive at a sigmoidal, non-asymptotic soil water retention curve with an air-entry value, dubbed RIA. In RIA, the matric potential at oven-dryness, hd, appeared as a derived parameter.

Bittelli and Flury (SSSAJ 2009) showed that dry-range soil water retention data points often are unreliable. In order to make RIA robust when this is the case, this presentation explains how hd was made a fitting parameter that can be fixed if needed. This modification was complicated by the peculiar behavior of shape parameter α that made adequate parameter fitting impossible. The presentation elucidates this behavior and explains how this problem was solved by a reformulated model (de Rooij, HESS 2022). It then shows how earlier fits (when the problem had not yet been discovered) corroborate the reformulated model.

The work also offers support for a theoretical value for hd proposed by Schneider and Goss (Geoderma 2012), which is very helpful if dry-range data are lacking or of poor quality. The mathematical structure of RIA is such that, for α → ∞, Rossi and Nimmo’s model arises as a special case of RIA, and, by implication, Brooks-Corey as a special case of Ippisch et al.

A public-domain code to fit the parameters using shuffled complex evolution (SCE) is available on Zenodo (de Rooij, 2022). It has features that help the user identify issues with local minima and overparameterization, and provides more information than most codes to offer better insight into the fitting process for those familiar with the SCE algorithm. These features may be useful for other parameter identification problems, so they will be discussed as well.

How to cite: de Rooij, G. H.: A new sigmoidal but non-asymptotic soil water retention curve for the entire soil water content range brings together the van Genuchten and Brooks-Corey models, EGU General Assembly 2023, Vienna, Austria, 23–28 Apr 2023, EGU23-3368, https://doi.org/10.5194/egusphere-egu23-3368, 2023.

EGU23-3760 | ECS | Orals | HS8.3.1

Irrigation water quality management under the impact of climate change 

Ya-Zhen Huang and Chihhao Fan

Agriculture is vital for human survival and irrigation water quality plays an important role in agricultural growing and harvest. Although Taiwan has abundant rainfall, the uneven distribution of rainfall in time and space makes the irrigation water management difficult. In the past two decades, climate change has led to frequent occurrence of extreme weather events and global disasters, and the increase in the frequency and intensity of extreme events enhances the potential disaster risk in Taiwan, impacting the water resource management severely. Meanwhile, industrial wastewater is a significant pollution source, and the surface water quality would be further deteriorated if the industrial wastewater was not treated properly before its release. In Taiwan, the needs of water resources for domestic and industrial uses have the higher allocation priority than that for agricultural use, considering the political concerns and economical contribution. Oftentimes, a supplementary water resource to meet irrigation need is required due to the scarce of available water resources. The situation may become even worse under the influence of climate change.

Given the information above, this study explored the irrigation water quality variation under the influence of climate change on agricultural water resource management. The Taoyuan City (including Taoyuan irrigation Shimen irrigation areas) were selected as the study area. The potential impact of climate change on irrigation water quality, considering factors of pollution discharges and economic development, was assessed. Adaptive strategies including stabilizing irrigation water demand, strengthening irrigation water supply and building an agricultural technology auxiliary system were discussed. The result showed that the increasing frequency of heavy rainfall events in Bade, Xinwu, and Guanyin Districts. The surface pollutant would be washed out easily during heavy rainfall events, impacting neighboring water bodies. On the other hand, drought events appear in Daxi and Fuhsing Districts in extreme climate events. Therefore, a new strategy for sustainable water management is needed.

How to cite: Huang, Y.-Z. and Fan, C.: Irrigation water quality management under the impact of climate change, EGU General Assembly 2023, Vienna, Austria, 23–28 Apr 2023, EGU23-3760, https://doi.org/10.5194/egusphere-egu23-3760, 2023.

EGU23-4336 | ECS | Orals | HS8.3.1

Effects of dynamic changes of desiccation cracks on preferential flow: Experimental investigation and numerical modeling 

Yi Luo, Jiaming Zhang, Zhi Zhou, Juan Pablo Aguilar López, Roberto Greco, and Thom Bogaard

Preferential flow induced by desiccation cracks (PF-DC) has been proven to be an important hydrological effect that could cause various geotechnical engineering and ecological environment problems. Investigation on the PF-DC remains a great challenge due to the soil shrinking-swelling behavior. This work presents an experimental and numerical study of the PF-DC considering the dynamic changes of DC. A soil column test was conducted under wetting-drying cycles to investigate the dynamic changes of DC and their hydrological response. The ratio between the crack area and soil matrix area (crack ratio), crack aperture and depth were measured. The soil water content, matrix suction and water drainage were monitored. A new dynamic dual-permeability preferential flow model (DPMDy) was developed, which includes physically-consistent functions in describing the variation of both porosity and hydraulic conductivity in crack and matrix domains. Its performance was compared to the single-domain model (SDM) and rigid dual-permeability model (DPM) with fixed crack ratio and hydraulic conductivity. The experimental results showed that the maximum crack ratio and aperture decreased when the evaporation intensity was excessively raised. The self-closure phenomenon of cracks and increased surficial water content were observed during low evaporation periods. The simulation results showed that the matrix evaporation modeled by the DPMDy is lower than that of the SDM and DPM, but its crack evaporation is the highest. Compared to the DPM, the DPMDy simulated a faster pressure head building-up process in the crack domain and higher water exchange rates from the crack to the matrix domain during rainfall. Using a fixed crack ratio in the DPM, whether it is the maximum or the average value from the experiment data, will overestimate the infiltration fluxes of PF-DC but underestimate its contribution to the matrix domain. In conclusion, the DPMDy better described the underlying physics involving crack evolution and hydrological response with respect to the SDM and DPM. Further improvement of the DPMDy should focus on the hysteresis effect of the SWRC curve and soil deformation during wetting-drying cycles.

How to cite: Luo, Y., Zhang, J., Zhou, Z., Pablo Aguilar López, J., Greco, R., and Bogaard, T.: Effects of dynamic changes of desiccation cracks on preferential flow: Experimental investigation and numerical modeling, EGU General Assembly 2023, Vienna, Austria, 23–28 Apr 2023, EGU23-4336, https://doi.org/10.5194/egusphere-egu23-4336, 2023.

EGU23-4390 | ECS | Orals | HS8.3.1

Estimating root-zone soil moisture from gamma radiation monitoring data 

Sonia Akter, Johan Alexander Huisman, and Heye Reemt Bogena

Root-zone soil moisture (RZSM) information is valuable in a wide range of applications, including weather forecasting, hydrological and land surface modeling, and agricultural production. However, there is still a lack of sensing information that adequately represents RZSM, especially with regard to longer periods and larger spatial scales. For example, active and passive microwave remote sensing observations for soil moisture are limited to the topsoil and can be influenced by land cover type. One option for RZSM observation is terrestrial gamma radiation as it is inversely related with soil moisture. Hence, the near-real-time data of more than 4600 gamma radiation monitoring stations archived by the EUropean Radiological Data Exchange Platform (EURDEP) may be a potential source to develop a RZSM product for Europe without extra investments in sensors. The aim of this study was to investigate to what extent the EURDEP data can be used for RZSM estimation. For this, two gamma radiation monitoring stations were equipped with in-situ soil water content sensors to measure reference RZSM. The terrestrial component of gamma radiation was extracted after eliminating the contribution of secondary cosmic radiation. For this, it was assumed that the long-term contribution of secondary cosmic radiation is constant and that the variations are caused by changes in atmospheric pressure and incoming neutrons. In addition, precipitation effects creating a sudden increase in gamma radiation due to atmospheric washout of radon progenies to the ground were eliminated by excluding time periods with precipitation. Finally, multi-year terrestrial gamma radiation measurements were used to estimate weekly RZSM and the results were compared with the reference measurements. It was found that the seasonal variation of RZSM can be reasonably well predicted with an RMSE of 7 – 9 vol.% from gamma radiation measurements. However, the radiation-based RZSM estimates fluctuated with a much greater amplitude compared to the reference data, especially during the winter and spring season. This may be related to unknown or neglected additional sources that affect the gamma radiation signal and this needs to be further investigated. Although the accuracy of radiation-based RZSM estimates is not as good as many other in-situ sensors, this technique is still competitive with satellite-based remote sensing technique to estimate RZSM on the continental scale.

How to cite: Akter, S., Huisman, J. A., and Bogena, H. R.: Estimating root-zone soil moisture from gamma radiation monitoring data, EGU General Assembly 2023, Vienna, Austria, 23–28 Apr 2023, EGU23-4390, https://doi.org/10.5194/egusphere-egu23-4390, 2023.

EGU23-4789 | Orals | HS8.3.1

Modelliing evaporation from soil profiles 

Tamir Kamai and Shmuel Assouline

Evaporation is a significant part of the water cycle and the main process for water vapor exchange between Earth's surface and atmosphere. Evaporation from bare soil consists of two main stages: stage 1, with a relatively high and often steady evaporation rate that is controlled mainly by atmospheric conditions, and stage 2, with lower and exponentially decreasing evaporation rates that are limited by the diffusive nature of the vapor flow and the hydraulic properties of the drying medium. In dry or drought conditions that are characterized with long dry spells, stage 1 is short and during stage 2 water is depleted from the top near-surface soil, forming a dry soil layer (DSL), where water flows in vapor phase only. Measuring bare soil evaporation over larger areas is challenging due to the natural heterogeneity. These measurements become even more challenging under dry conditions, due to the equipment needed for capturing low fluxes under extremely high liquid water potentials and equivalent vapor pressures. Therefore, predictive tools are essential for estimation of soil evaporation. To date, modeling of this transient evaporation process is limited, mainly because it either requires sophisticated numerical models that account for its complexities or relies on analytical solutions that are too simplistic to capture its dynamics.
We present an analytical model that accounts for the main mechanisms of the evaporation process, but is relatively simple in its construction. The governing mechanisms during this dynamic process are captured by accounting for the hydraulic properties of the drying medium, the characteristic features of the medium that control water flow, the atmospheric forcing, and the partitioning between the liquid and vapor phases of the water within the drying profile. We validate this simplified approach using data from a numerical model and from evaporation experiments in different soil types, under various ambient conditions. In addition to depicting evaporation rates and the cumulative loss of water over time, we demonstrate the effect of soil hydraulic properties and their heterogeneity on the evaporation process. Additionally, we show how the model predicts the spatiotemporal partitioning between water (liquid and vapor) phases, with specific attention to the DSL that develops during longer periods of evaporation, with the corresponding downward migration of the evaporative front.

How to cite: Kamai, T. and Assouline, S.: Modelliing evaporation from soil profiles, EGU General Assembly 2023, Vienna, Austria, 23–28 Apr 2023, EGU23-4789, https://doi.org/10.5194/egusphere-egu23-4789, 2023.

EGU23-5461 | ECS | Posters on site | HS8.3.1

Automated Low-Cost Soil Moisture Sensors: Trade-Off Between Cost and Accuracy 

Dimaghi Schwamback, Magnus Persson, Ronny Berndtsson, Luis Bertotto, Alex Kobayashi, and Edson Wendland

Automated soil moisture systems are commonly used in precision agriculture and environmental monitoring. Using low-cost sensors, the spatial extension can be maximized, but the accuracy might be reduced. In this paper, we address the trade-off between cost and accuracy comparing low-cost and commercial soil moisture sensors. The analysis is based on the capacitive sensor SKU:SEN0193 under lab and field conditions. The laboratory tests aimed at evaluating the response speed, best supply voltage, temperature dependency, calibration, and applicability for controlled infiltration column tests (one meter high). Laboratory tests indicated that the sensor is temperature and voltage-sensitive. The use of 5.5 V as supply voltage for the sensors drastically reduced the correlation between output and degree of soil saturation, thus we suggest the use of 3.3V. Soil temperature had a negligible impact on the sensor output: 0.27% of soil saturation degree per degree Celsius. For field implementation, a low-cost monitoring station was built using Arduino as a microcontroller and tested during three months. The sensors could represent daily and seasonal oscillation in soil moisture resulting from solar heating and precipitation. In addition to individual calibration, two simplified calibration techniques are proposed: universal calibration, based on all 63 sensors, and a single-point calibration using the sensor's response in dry soil. The monitored wetting front was compared to the one estimated by Hydrus model and had a high correlation. The low-cost sensor performance was later compared to commercial sensors based on five variables: (1) cost, (2) accuracy, (3) qualified labor demand, (4) sample volume, and (5) life expectancy. Commercial sensors promote soil moisture measurements with high accuracy at a high acquisition cost. On the other hand, low-cost sensors, such as the SKU:SEN0193, provide data with medium accuracy at a very low acquisition cost, enabling spatial monitoring through multiple-point measurements. Thus, the use of the SKU:SEN0193 sensor is suggested in projects with budget limitations with short duration where there is a medium requirement accuracy or when the spatial variability of soil water content is considerable. Despite the physical fragility of the hardware used (sensors and monitoring station) and the lower accuracy when compared to other commercial sensors, this work demonstrates through the case study of the SKU:SEN0193 sensor the possibility of using low-cost technologies for monitoring environmental variables.

How to cite: Schwamback, D., Persson, M., Berndtsson, R., Bertotto, L., Kobayashi, A., and Wendland, E.: Automated Low-Cost Soil Moisture Sensors: Trade-Off Between Cost and Accuracy, EGU General Assembly 2023, Vienna, Austria, 23–28 Apr 2023, EGU23-5461, https://doi.org/10.5194/egusphere-egu23-5461, 2023.

EGU23-5628 | ECS | Posters on site | HS8.3.1

Representing the effect of (de)compaction on soil hydraulic properties using segmental constitutive laws 

Filip Kiałka, Omar Flores, Kim Naudts, Sebastiaan Luyssaert, and Bertrand Guenet

Soil (de)compaction is widespread and has a large impact on soil constitutive relationships including hydraulic and gas-exchange properties. Surveys estimate that about a third of EU soils are severely degraded by compaction, and lab experiments show that the effect of compaction on soil hydraulic conductivity can be as large as the differences between textural classes. Nevertheless, the effect of (de)compaction on soil properties remains absent or only provisionally represented in present-day soil-crop, ecosystem, and land-surface models. That is despite the formulation of soil structure evolution models for key land management practices, biotic factors, and wet-dry or freeze-thaw cycles. The slow maturing and uptake of these models results from observational limitations and from difficulties with upscaling and with relating their outputs to soil properties of interest. Here we address the latter by extending established models of soil hydraulic properties to represent a dynamically evolving soil structure parametrized by a discrete pore-size distribution. The extension decomposes a given water retention curve into smooth algebraic segments corresponding to predefined pore size classes. The segments are then individually scaled to represent the changing pore volumes and summed to obtain the new retention and conductivity functions. We validate this approach using lab-based compaction experiments and demonstrate its use at site scale by leveraging the soil hydrology scheme of the ORCHIDEE land surface model. Finally, we discuss new applications that our approach enables, with a focus on representing the interaction between ecosystem engineers, soil structure, and soil water.

How to cite: Kiałka, F., Flores, O., Naudts, K., Luyssaert, S., and Guenet, B.: Representing the effect of (de)compaction on soil hydraulic properties using segmental constitutive laws, EGU General Assembly 2023, Vienna, Austria, 23–28 Apr 2023, EGU23-5628, https://doi.org/10.5194/egusphere-egu23-5628, 2023.

EGU23-6432 | ECS | Posters on site | HS8.3.1

Performance assessment and Benchmarking of a conceptually coupled groundwater - surface-water model 

Veethahavya Kootanoor Sheshadrivasan and Jakub Langhammer

In continuation to the previously presented methodological approach to estimate vadose zone boundary fluxes titled “A novel conceptualization to estimate unsaturated zone mass-fluxes and integrate pre-existing surface- and ground- water models” at the EGU GA 2022, this study explores the performance of the outlined implementation and benchmarks the model.


To recap, the previous study presented a conceptual numerical scheme that aimed to adequately estimate the in- and out- fluxes of the Unsaturated Zone (UZ) with the primary aim of coupling existing groundwater (GW) and surface-water (SW) models. It was expected that such a numerical scheme would provide a viable alternative to solving the computationally expensive Richard’s model for cases where description of fluxes within the UZ and the spatial description of the soil moisture were not in the interest of the modeller. Examples of such cases would be efforts to model the hydro(geo)logical effects of various climate-scenarios, efforts to estimate GW recharge dynamically, and efforts to design integrated watershed management design structures and systems, among others.


The model numerical scheme has been implemented in Fortran for computational efficiency and a Python wrapper has been developed for the same for ease of use. The model itself is spatially agnostic and is solved for each model element discreetly, in the UZ. The global simulation period is split into local simulation periods between which the three models (GW, SW, and UZ) exchange information via a coupling scheme. At the beginning of each local simulation period, GW and SW states are read from the respective models (here MODFLOW 6 and Delft 3D - Flexible Mesh), the solution for the UZ is determined by the GWSWEX model given the precipitation and evapotranspiration rates, and the calculated discharges are then prescribed to the respective models. The internal time-step size for the local simulation period is dynamically determined based on the precipitation intensity. The coupling scheme harnesses the Basic Model Interface (developed by CSDMS) offered by both MODFLOW 6 and Delft 3D - Flexible Mesh to rapidly exchange information during the model run without having to restart the models. Support for multiple soil-type layers for the UZ is currently under development.


This study aims to assess and establish the capacity to simulate the fluxes of the UZ as desired by benchmarking it for the Tilted-V theoretical catchment setup and comparing its results to the physically based ParFlow model.

In addition to this, the study also aims to assess the reduction in computational resources achieved by employing a conceptual numerical scheme for solving the UZ fluxes.


It is expected that the findings of such a study shall point out any necessary improvements, bias-corrections, or considerations to be made in the model development before it may be applied to real-world applications.

The authors also hope that the study fosters discussions to unify the polarising modelling approaches as outlined in Markus Hrachowitz er al., 2017

How to cite: Kootanoor Sheshadrivasan, V. and Langhammer, J.: Performance assessment and Benchmarking of a conceptually coupled groundwater - surface-water model, EGU General Assembly 2023, Vienna, Austria, 23–28 Apr 2023, EGU23-6432, https://doi.org/10.5194/egusphere-egu23-6432, 2023.

EGU23-6853 | Posters on site | HS8.3.1

Representation of Arctic hydrology in a global land surface model 

Tobias Stacke, Philipp de Vrese, and Victor Brovkin
Earth System Models (ESMs) are the best available tools to project the coupled dynamics of the climate and biogeochemistry under future emission scenarios. However, the future trajectories simulated by individual ESMs vary substantially with most pronounced differences in the high northern latitudes. As recently demonstrated (de Vrese et al., 2022), a significant part of this uncertainty might result from the different approaches and parametrizations of surface and soil hydrology in the permafrost regions. However, this study did not account for sub-grid lateral fluxes.
To make a step forward, we further develop ICON-Land/JSBACH4, the land surface model (LSM) used within the ICON-ESM. Our recent efforts are focused on improving the simulation of Arctic hydrology by accounting for lateral water flows on small spatial scales, i.e. within the grid cells of the LSM. For this, we apply a tiling structure in which we define the spatial relation between parts of the grid cell in terms of water exchange. In this way, the model gets information about the source and sink tiles of surface runoff (based on topography) but also of lateral soil water exchange (based on proximity and soil moisture gradient).
This approach results in a redistribution of surface and soil water within the grid cells with drier upland and wetter lowland regions and the correspondent changes in evapotranspiration. Comparing coupled land-atmosphere simulations with different prescribed fractions of upland and lowland areas, we see strong impacts of the tiling structure. Setups with a larger lowland-to-upland ratios lead to higher cloud cover and by up to 2K lower summer surface temperature over larger parts of the boreal regions. This result emphasizes the importance of representing the complex processes of Arctic hydrology, but also the need for detailed information about Arctic land surface properties.

References:
de Vrese, P., Georgievski, G., Gonzalez Rouco, J. F., Notz, D., Stacke, T., Steinert, N. J., Wilkenskjeld, S., and Brovkin, V.: Representation of soil hydrology in permafrost regions may explain large part of inter-model spread in simulated Arctic and subarctic climate, The Cryosphere Discuss., https://doi.org/10.5194/tc-2022-150, in review, 2022.

How to cite: Stacke, T., de Vrese, P., and Brovkin, V.: Representation of Arctic hydrology in a global land surface model, EGU General Assembly 2023, Vienna, Austria, 23–28 Apr 2023, EGU23-6853, https://doi.org/10.5194/egusphere-egu23-6853, 2023.

The hydrological characterization of the vadose zone remains a major challenge considering the spatiotemporal variability of its properties and the limitations associated with hydrological measurements techniques. Geophysical methods, in particular the DC-resistivity and ground penetrating radar, can provide large scale images of hydrogeological structures and a non-invasive assessment of the subsurface dynamic processes. However, these approaches rely on the accuracy of the petrophysical relationships connecting the geophysical parameters to hydrogeological ones, where the site-specific determination of the associated petrophysical parameters is considered crucial. The first objective of this study was to investigate the relationship between the water content, geological properties, and geophysical attributes at the vadose zone of a vulnerable limestone aquifer. The second objective aimed to obtain the Archie’s and Complex Refractive Index Model (CRIM) petrophysical parameters by using borehole electrical resistivity and cross-hole ground penetrating radar data. For this purpose, we adopted a grid search inversion algorithm where the field geophysical data were integrated with water content profiles simulated by using HYDRUS-1D. The vadose zone profile was divided into three layers, and the inversion was carried out for the petrophysical parameters in each of the model layers. The electrical resistivity and relative dielectric permittivity data showed a very good correspondence with the simulated and experimental water content distributions along the vadose zone profile. The petrophysical parameters estimated by the inversion showed values that fall in the ranges reported in the literature. Similar values have been observed in the different model layers, with slight differences that were attributed to the vertical heterogeneities associated with the alteration and fracturation features of the limestone vadose zone. This study showed a very good correlation between geophysical, hydrogeological and geological data, and highlighted the presence of heterogeneities that can have profound effects on the vadose zone water dynamics.

How to cite: Abbas, M., Deparis, J., Isch, A., and Mallet, C.: Hydrogeophysical characterization of a limestone vadose zone and determination of the Archie and CRIM petrophysical parameters by integrating geophysical and hydrogeological data in a grid search algorithm, EGU General Assembly 2023, Vienna, Austria, 23–28 Apr 2023, EGU23-6975, https://doi.org/10.5194/egusphere-egu23-6975, 2023.

Soil hydraulic parameters such as residual water content, saturated water content, hydraulic conductivity, are key factors to be considered when assessing the soil capabilities to provide ecosystem services. Proper computation of fluxes from vadose zone using the hydrological models strongly depends on correct estimation of input parameters, process scale, boundary, and initial conditions. Estimation of soil parameters for many hydrological models is always an arduous task due to uncertainty bounded with parameters. Over the last few years many researchers have favoured to estimate the parameters using inversion approach due to increasing computing capabilities and easily measurable output variables. The current study deepens the understanding of the soil hydraulic parameter estimation using inversion approach. The inversion was conducted on synthetic data set using the SWAP (Soil water atmosphere and plant) model along with the GLUE (Generalized Likelihood Uncertainty Estimation) algorithm. Several constrain variables, able to be derived from remote sensing or in-situ measurements (Leaf Area index - LAI, Evapotranspiration – ET and Surface soil moisture – SSM), were used in the inversion process alone or in different combinations. The current study uses the two types of soil profile, homogenous soil system and two layered soil system. In this synthetic experiment, we compared the effect of different soil type, different surface conditions, different water conditions, and frequency of observed variables on parameter estimation. Effect of initial predefine range of the parameter space, on SHP estimation, were also investigated. Use of DSM data to define the initial range of parameter space were also investigated. We also simulated the state variables with uncertainty using the estimated parameters. Main outcomes could be reported when retrieving the SHPs, retrieval was significantly correlated with soil type and water stress condition, although overall retrieving performances were quite poor specially in layered soil system. We could identify some promising combinations of constrain variables for better estimation of parameter in different soil types. Our approach may further provide spatial sampling of DSM data components to improve the SHPs estimation, to be used as surrogate input for defining the initial range.

How to cite: Gupta, V. and Muddu, S.: Uncertainty in estimation of Soil Hydraulic properties and root zone state variables in inverse method, EGU General Assembly 2023, Vienna, Austria, 23–28 Apr 2023, EGU23-7389, https://doi.org/10.5194/egusphere-egu23-7389, 2023.

EGU23-9183 | ECS | Posters on site | HS8.3.1

Technical Performance Assessment of the Subak Heritage Irrigation System in Bali, Indonesia 

Andre Dani Mawardhi and Seth Nathaniel Linga

Subak is a socio-agrarian-religious system of integrated terrace irrigation management on Bali island that involves indigenous peoples and religious aspects in distributing water sources evenly to rice fields. Regardless of its heritage value, Subak irrigation's performance in distributing water for rice is necessary in terms of water scarcity and food production issues. However, there is a limited number of works evaluating the Subak irrigation system's functioning, although it has been present for centuries. This study was conducted to assess the performance of Subak Ulumayu and Subak Sembung in 2018/2019. Several spatial datasets were processed using pySEBAL to generate biomass, evapotranspiration, and transpiration data. Results showed that rice consumed 968-1014 mm of water, which resulting 4.87-4.93 tons rice/ha in this season. Most subfields showed relatively good performance, i.e. Relatively Water Deficit <0.2, adequacy >80%, and equity CV<10%, although the Relatively Yield Deficit was high and efficiency was slightly low. According to those results, both Subak irrigation systems were working satisfactorily to supply water for rice fields among water users. However, there is a remained challenge to optimize rice productivity to contribute to national food security.

How to cite: Mawardhi, A. D. and Linga, S. N.: Technical Performance Assessment of the Subak Heritage Irrigation System in Bali, Indonesia, EGU General Assembly 2023, Vienna, Austria, 23–28 Apr 2023, EGU23-9183, https://doi.org/10.5194/egusphere-egu23-9183, 2023.

EGU23-9384 | Orals | HS8.3.1

Hydrosignalling : How air gaps in soils alter the distribution of root water and hormones fluxes, thereby blocking root lateral branching 

Valentin Couvreur, Poonam Mehra, Bipin K. Pandey, Xavier Draye, and Malcolm J. Bennett and the co-authors

Plant roots exhibit plasticity in their branching patterns to forage efficiently for heterogeneously distributed resources, such as soil water. The xerobranching response represses lateral root formation when roots lose contact with water (e.g. in “air gaps”), and provides an experimental model to study root adaptive responses to transient water stress.

To discover the mechanistic basis of xerobranching, soil- and agar-based xerobranching bioassays were developed. As levels of the abiotic stress signal abscisic acid (ABA) increase in root tips during transient water stress, we observed that tomato, maize and Arabidopsis mutants deficient in ABA are disrupted in xerobranching response. Using novel ABA biosensors and mutants, we showed that when reaching an air gap, it takes about half a day for ABA originating from phloem tissues to radially travel through the unloading zone and accumulate in epidermal tissues.

When root tips lose contact with water, could the direction of water flow across root tissues change, and trigger the outwards accumulation of ABA, acting as a “hydrosignal” ? Our 3-dimensional root micro-hydrological model of solute advection-diffusion “MECHA” supports the following hypotheses :

  • Such a reversal of radial water flow direction may happen in the root elongation zone, as cell elongation may not be fed by water absorbed at the root surface anymore, and therefore water for cell elongation (e.g. in the epidermis) entirely relies on phloem as a water source.
  • If water soluble hormones such as ABA “ride” on water fluxes through plasmodesmata and along cell walls, it would take them about 8 hours to accumulate to levels comparable to concentrations observed in phloem cells. This timing is compatible with our experimental observations.

From there on, our Arabidopsis mutants reveal that ABA uses plasmodesmatal closure to lock up the symplastic radial pathway that is necessary for auxin to initiate lateral root branching.

In conclusion, our study reveals how roots might adapt their branching pattern to heterogeneous soil water conditions by linking changes in hydraulic flux with dynamic hormone redistribution.

This work includes material recently published in Science, under the following link: https://doi.org/10.1126/science.add3771

How to cite: Couvreur, V., Mehra, P., Pandey, B. K., Draye, X., and Bennett, M. J. and the co-authors: Hydrosignalling : How air gaps in soils alter the distribution of root water and hormones fluxes, thereby blocking root lateral branching, EGU General Assembly 2023, Vienna, Austria, 23–28 Apr 2023, EGU23-9384, https://doi.org/10.5194/egusphere-egu23-9384, 2023.

EGU23-9560 | ECS | Orals | HS8.3.1

Subsurface drip fertigation estimation tool (SubFerT) 

Ana Claudia Callau-Beyer, Martin Mburu, Caspar-Friedrich Weßler, and Hartmut Stützel

Irrigation and fertilization are essential to increasing crop yield and affect vegetable production and food security. Conventional irrigation and fertilizer application methods often exceed the crop requirements. Moreover, nitrate pollution of groundwater from agriculture is caused by the asynchrony between nutrient availability and crop demand and is an issue of major concern in many regions. As water and nutrients limitations will be more frequent in the coming decades due to climate change along with regulations aiming at protecting water resources, there is a need for innovations in agricultural production to improve water and nutrient use efficiencies. Subsurface drip fertigation (SDF) is the fertigation (irrigation combined with application of dissolved fertilizer) of crops through buried driplines which include built-in emitters to drip water to the surrounding soil. This allows placing the water and fertilizers directly into a small soil volume in the rooting zone at just the rates needed by the plants. SDF systems have a great potential to minimize the movement of water and nutrients below the root zone when effectively managed. Through the combined application of nutrients and water, drought and nutrient stresses can be diminished and yield potentials optimized. SDF systems can therefore make cropping systems not only more environmentally friendly and sustainable, but also more resilient to climatic fluctuations.

The aim of our research is to contribute to the understanding of crop growth under SDF. The work presented here is the Subsurface Drip Fertigation Estimation Tool (SubFerT) which is available for farmers who want to integrate this fertigation system in their production. The tool is based on daily water and nitrogen balances at the field scale by modeling (a) crop growth and nitrogen uptake; (b) crop water requirements though daily ET0 estimation using the Penman–Monteith equation, separation between evaporation and transpiration (dual Kc approach); (c) dynamics of water (irrigation, precipitation, root uptake, losses) and nitrogen (mineralization, denitrification, leaching) in the soil root zone. SubFerT-tool provides information on when and how much water and fertilizer to apply to crops grown under SDF system. This tool allows farmers to manage the fertigation of the crops under SDF in an efficient way. Additionally, the tool delivers daily time series of different variables involved in the balance: soil moisture, root uptake, deep percolation, total met transpiration, etc.

How to cite: Callau-Beyer, A. C., Mburu, M., Weßler, C.-F., and Stützel, H.: Subsurface drip fertigation estimation tool (SubFerT), EGU General Assembly 2023, Vienna, Austria, 23–28 Apr 2023, EGU23-9560, https://doi.org/10.5194/egusphere-egu23-9560, 2023.

EGU23-9786 | Orals | HS8.3.1

Towards an Open Digital Twin of Soil-Plant System Following Open Science 

Yijian Zeng, Fakhereh Alidoost, Bart Schilperoort, Yang Liu, Meiert Willem Grootes, Yunfei Wang, Zengjing Song, Danyang Yu, Enting Tang, Qianqian Han, Christiaan van der Tol, Raúl Zurita-Milla, Michael Ying Yang, Serkan Girgin, Yifat Dzigan, and Zhongbo Su

Climate projections strongly suggest that the 2022 sweltering summer may be a harbinger of the future European climate. Climate extremes (e.g., droughts and heatwaves) jeopardize terrestrial ecosystem carbon sequestration. The construction of an open digital twin of the soil-plant system helps to monitor and predict the impact of extreme events on ecosystem functioning and could be used to recommend measures and policies to increase the resilience of ecosystems to climate-related challenges. A digital twin refers to a highly interconnected workflow, with a data assimilation framework at its core to combine observations and process-based models, meanwhile accompanied by an interactive and configurable platform that allows users to create and evaluate user-specific scenarios for scientific investigation and decision support. Creating an open digital twin means creating a digital twin following Open Science and FAIR principles, both for data and research software. In this contribution, the STEMMUS-SCOPE model was used as an example to develop an open digital twin of the soil-plant system. We suggest our recently developed open digital twin infrastructure could serve as the backbone for an interoperable framework to facilitate the digitalization of other Earth subsystems (e.g., by simply replacing the soil-plant model). In addition, we show how software not designed initially as open can be adopted to create an open digital twin using containers - standardized computational environments that can be shared, reused and that foster reproducibility.

How to cite: Zeng, Y., Alidoost, F., Schilperoort, B., Liu, Y., Willem Grootes, M., Wang, Y., Song, Z., Yu, D., Tang, E., Han, Q., van der Tol, C., Zurita-Milla, R., Yang, M. Y., Girgin, S., Dzigan, Y., and Su, Z.: Towards an Open Digital Twin of Soil-Plant System Following Open Science, EGU General Assembly 2023, Vienna, Austria, 23–28 Apr 2023, EGU23-9786, https://doi.org/10.5194/egusphere-egu23-9786, 2023.

EGU23-9804 | Posters on site | HS8.3.1

Soil and crop monitoring in a processing tomato fertigation experiment in a reclaimed saline marsh soil in SW Spain using proximal and remote sensing. 

José Luis Gómez Flores, Mario Ramos Rodríguez, Mohammad Farzamian, Benito Salvatierra Bellido, Manuel López Rodríguez, and Karl Vanderlinden

Reclaimed saline marsh areas in SW Spain are characterized by a fragile balance in the rootzone between salt accumulation and leaching. Increasing climate variability and the introduction of new crops and irrigation methods can disrupt this balance, with undesirable environmental and economic consequences. In addition, the decreasing availability of irrigation water and the need to limit fertilizer use in areas vulnerable to nitrate contamination requires the implementation of more sustainable fertigation practices. A field experiment was set up in a commercial processing tomato field in the B-XII irrigation district (Lebrija, Seville) where four fertigation treatments (conventional and sustainable irrigation and fertilization) were compared in a random design with three replicates. Each elemental plot consisted of three tomato rows, each 250 m long and 1.5 m wide. Apparent electric conductivity (ECa) of each treatment was measured weekly using an electromagnetic induction sensor and multiespectral images were obtained on two dates using an UAV. ECa could be linked to the irrigation treatments and showed a strong within-treatment variability in accordance with the local soil characteristics and the depth of the underlying saline water table. The largest NDVI was observed for the sustainable irrigation and fertilization treatment, while the smallest NDVI corresponded to the sustainable fertilization and conventional irrigation treatment. Plants in the latter treatment presented chlorosis due to excessive accumulation of chloride and sodium in the leaves, as a result of root-zone salinization during the irrigation season, resulting in a strong decline in tomato yield (~60%) for this treatment. Overall, tomato yield showed a strong correlation with NDVI (R≈0.90). Our results suggest that more sustainable fertigation practices can be implemented in salinization-prone agricultural areas without increasing the risk of topsoil salinization or loss of crop productivity.

Acknowledgement

This work is funded by the Spanish State Agency for Research through grant PID2019-104136RR-C21/AEI/10.13039/501100011033, and by IFAPA/FEDER through grant AVA2019.018. Additionally, this work is also funded through PhD grant PRE2020-095133 by the Spanish State Agency for Research, and co-funded by the European Social Fund. 

How to cite: Gómez Flores, J. L., Ramos Rodríguez, M., Farzamian, M., Salvatierra Bellido, B., López Rodríguez, M., and Vanderlinden, K.: Soil and crop monitoring in a processing tomato fertigation experiment in a reclaimed saline marsh soil in SW Spain using proximal and remote sensing., EGU General Assembly 2023, Vienna, Austria, 23–28 Apr 2023, EGU23-9804, https://doi.org/10.5194/egusphere-egu23-9804, 2023.

Low-water content soil moisture relations are increasingly important given current trends of climate change, desertification, and growing interest in extreme environments like those of Antarctica and Mars. Whereas most parametric models of soil water retention were developed for the intermediate and wet ranges of moisture, some alternatives published in the last three decades address water retention down to oven dryness. Such models can be strengthened and made more versatile with a deeper understanding of the physical meaning of parameters used in them.

For the shape of the dry-range retention curve, a logarithmic relation has repeatedly been shown to work well, and is consistent with accepted theories of adsorption. Fitted values of the log function’s coefficient relate closely to the specific surface area of the medium.

The lower limits of water content and matric potential require more explication. Various observers have noted problems that arise with the use of a nonzero residual water content as the lower limit. In practice, this quantity is not measured but obtained as a fitting parameter, whose value depends not on a physical property but on how far the available measurements extend into the dry range. In parametric models it can be useful for applications in which the water content never goes below the intermediate range dominated by capillary processes.

The actual lower limit of water content depends on how its zero is defined. The most common definition is based on equilibration in an oven at a particular temperature, commonly 105° C. Ambiguity arises from the dependence of the soil water on the generally uncontrolled relative humidity within the oven. Application of the Kelvin equation with reasonable assumptions about the outside air and its exchange with the inside air can indicate an equivalent matric potential of the oven-dry state, typically about -1 GPa. Logarithmic extrapolations of dry-range retention measurements intersect the water content=0 axis at values comparable to this, with variations likely related to particular conditions in the lab and oven. A way of resolving this ambiguity is to define zero water content not in terms of oven temperature but rather a specified matric potential of equilibration. An attractive possibility, convenient in SI units, is to make it exactly -1 GPa.

Neither the traditional nor this proposed definition of zero water content identifies a state where no water molecules remain in the soil. Measurements at temperatures of hundreds of degrees C show that soil water contents can be lower than these defined zero levels by as much as 2% or more. Our standard scale of water content, therefore, is a relative scale, analogous to the Celsius scale for temperature. Consequently negative values of soil water content have a valid physical meaning. To acknowledge this fact and resolve ambiguities, more rigorous definitions as proposed here are thus necessary for applications dealing with the extremely dry conditions that are becoming increasingly important.

How to cite: Nimmo, J. R.: Soil water retention parameters in the dry range—what is the physics?, EGU General Assembly 2023, Vienna, Austria, 23–28 Apr 2023, EGU23-9991, https://doi.org/10.5194/egusphere-egu23-9991, 2023.

EGU23-10495 | Orals | HS8.3.1

Modeling infiltration into water repellent soil 

Markus Berli and Rose Shillito

Infiltration is an important hydrological process impacting ecology, forestry, agronomy, civil- and environmental engineering. Most infiltration models assume soils to be “wettable”, i.e., water in the soil forming an effective contact angle with the soil matrix that is close to zero. For a range of applications, e.g., infiltration into organic-rich soils or soils that turned water repellent due to fire, the “wettability assumption” no longer holds. Hence, the need for an infiltration model that can take soil water repellency into account. This study proposes a process-based approach for modeling infiltration into water repellent soil using the concepts of effective contact angle and sorptivity. The approach was developed using the Green-Ampt infiltration model but can be easily adapted for other process-based infiltration models such as Philip or Smith-Parlange. The infiltration model demonstrates the considerable impact of soil water repellency on infiltration, also for subcritically-water repellent soils, i.e., soils with effective contact angles <90°. It illustrates the non-linear relationship between infiltration rate and effective contact angle with effective contact angles >70° having a much larger impact on infiltration rate than effective contact angles <70°. The model also indicates that due to gravity, infiltration could occur into super-critically water repellent soil (i.e., soil with effective contact angles ≥90°), even with zero hydraulic head at the soil surface. Infiltration at zero hydraulic head, however, likely ceases at effective contact angles between 91° and 101°, depending on the amount of cumulative infiltration. All infiltration simulations showed decreasing infiltration rates with increasing soil water repellency expressed as effective contact angle or sorptivity at any level of cumulative infiltration. Finally, the water repellency effects on infiltration rates for short-duration, high intensity storms—a critical situation commonly associated with wildfire and flooding—were illustrated.

How to cite: Berli, M. and Shillito, R.: Modeling infiltration into water repellent soil, EGU General Assembly 2023, Vienna, Austria, 23–28 Apr 2023, EGU23-10495, https://doi.org/10.5194/egusphere-egu23-10495, 2023.

EGU23-10919 | ECS | Posters on site | HS8.3.1

Visible to the eye, now in the model: Parameterizing dual porosity water retention functions in structured soils 

Julio Pachon, Daniel Hirmas, Hoori Ajami, Pamela Sullivan, Sharon Billings, Matthew Sena, Xi Zhang, Li Li, Karla Jarecke, Kamini Singha, Jesse Nippert, Alejandro Flores, and Xiaoyang Cao

Soil water retention is important for the establishment and productivity of ecosystems through its role in governing the flux, depth distribution, and availability of soil moisture. With increasing application of global and regional hydrologic and climate models, there is a concomitant need to accurately predict and map soil hydraulic properties to parameterize these models and simulate soil water dynamics across spatiotemporal scales. Soil water retention functions created to fulfill this need typically assume a unimodal pore-size distribution, despite the common observation that soil pore-size distributions are multimodal due to soil structure and interpedal macropores. Existing dual porosity functions divide pores into two categories: larger pores, controlled by structure, and smaller pores, controlled by texture. Obtaining the parameters for the structural domain is difficult due to the poor characterization of large pores. Large pores cannot be characterized from water retention curves because measurement of water retention near saturation, and CT scans of soils rely on small soil sample volumes which limits the pore characterization to tens of millimeters in range, while pores may be much larger. In this study, we developed multiple PTFs to predict the van Genuchten parameters (ɑ and n) of the structural domain in dual porosity models, as well as the w coefficient, which reflects the relative abundance of these two types of pores in the dual porosity model. Our PTFs were developed from characterized pores > 180 µm from nine pedons across Kansas, USA, using recent advances of multistripe laser triangulation (MLT) scanning applications. MLT scanning pore characterization allowed us to characterize soil pores > 10 cm and was conducted on 30-cm wide soil monoliths collected from excavation walls of each pedon that were either 20 or 40 cm tall depending on the thickness of the horizon. We used ImageJ to quantify pore-size distributions that were then used to estimate the water retention curve (WRC) and hydraulic conductivity of the structural domain. We fitted van Genuchten functions to characterize the WRCs in the structural domain, and ROSETTA 3.0 was used to characterize the WRCs in the matrix domain. These WRC fits were used to develop new PTFs that predict the parameters of the dual porosity model using mixed linear models with inputs including NRCS soil structure field descriptions along with standard physical and chemical properties (clay, sand, SOM, bulk density, coefficient of linear extensibility, cation exchange capacity, horizon midpoint depth, and quantified morphological descriptions of structural type, grade, solidity, roundness, and circularity). Using the predicted parameters, we estimated water retention for each horizon and achieved high levels of correlation and accuracy when compared with the water retention derived from the MLT scans. The approach for creating PTFs can be used to improve soil hydraulic property parameterization of soils with structure in regional hydrologic and climate models by providing a framework for integrating multiple recent advances such as the characterization of large pores using MLT and use of quantified soil structure from profile descriptions. Future studies will examine performance of these PTFs in numerical hydrologic models.

How to cite: Pachon, J., Hirmas, D., Ajami, H., Sullivan, P., Billings, S., Sena, M., Zhang, X., Li, L., Jarecke, K., Singha, K., Nippert, J., Flores, A., and Cao, X.: Visible to the eye, now in the model: Parameterizing dual porosity water retention functions in structured soils, EGU General Assembly 2023, Vienna, Austria, 23–28 Apr 2023, EGU23-10919, https://doi.org/10.5194/egusphere-egu23-10919, 2023.

EGU23-11699 | Posters on site | HS8.3.1

Calibration and field validation of smart soil moisture monitoring system 

Hammad Ullah Khan Yousafzai, Khan Zaib Jadoon, and Muhammad Zeeshan Ali

Agriculture is one of the crucial sectors of Pakistan’s economy – accounting for about 21% of GDP and engaging approximately 50% of work force and is the major source of livelihood of a substantial segment (67%) of population. Traditionally farmers use the classical methods for irrigation like flood irrigation, border irrigation, and furrow bed irrigation, which are less efficient and cause more water losses due to surface runoff and infiltration of water beyond the root zone of the crop. Furthermore, excessive pumping of water from the wells caused high consumption of energy. Due to lack of proper monitoring system for irrigation water management, farmers use more water than required water to the crop. High rate of water losses in irrigation systems is due to heterogeneity of soil in the agricultural field and water infiltration beyond the root zone of the crop.

This paper presents the calibration and field validation of soil moisture sensors for smart irrigation system using IoT (Internet of Things). Field soil samples were collected to calibrate soil moisture sensors. Different amount of water was added to oven-dried soil samples to create soil moisture variability and the voltage values of the capacitive soil moisture sensor were measured to establish a calibration curve. After the calibration of sensors, an array of soil moisture sensors was installed vertically to monitor soil moisture dynamics within the root zone of the crop. The Wi-Fi/LORA module is used to transfer the data to a cloud server at a frequency of 60sec/cycle. The data from the cloud server can be accessed via the mobile phone application “BLYNK”. Results show that the vertical dynamics of soil moisture were clearly measured by the smart soil moisture monitoring system at different depths. The calibrated sensors can be used for smart irrigation systems and can be easily adapted for different irrigation methods.

How to cite: Yousafzai, H. U. K., Jadoon, K. Z., and Ali, M. Z.: Calibration and field validation of smart soil moisture monitoring system, EGU General Assembly 2023, Vienna, Austria, 23–28 Apr 2023, EGU23-11699, https://doi.org/10.5194/egusphere-egu23-11699, 2023.

EGU23-12011 | ECS | Orals | HS8.3.1

A bimodal extension of the ARYA&PARIS approach for predicting hydraulic properties of structured soils 

Shawkat Basel Mostafa Hassan, Giovanna Dragonetti, Alessandro Comegna, Asma Sengouga, Nicola Lamaddalena, and Antonio Coppola

A new pedotransfer function (PTF) was developed based on the Arya and Paris (AP) approach to obtain Water Retention (WRC) and Hydraulic Conductivity (HCC) curves. The AP approach obtains the unimodal WRC from the Particle-Size Distribution (PSD). The proposed PTF is an extension of AP approach by incorporating the Aggregate-Size Distribution (ASD) to include the inter-aggregate pores (macropores) retention, and thus obtain the bimodal WRC. A bimodal porosity model was developed to specify the ratios of the matrix and the macropores in the overall soil porosity. Kozeny-Carmen equation was utilized to obtain the saturated hydraulic conductivity, K0, from the bimodal WRC behaviour near saturation. Then, Mualem model was applied to obtain the full HCC. To calibrate the proposed PTF, soil physical and hydraulic properties were measured from a 140-ha irrigation sector in “Sinistra Ofanto” irrigation system in Apulia Region, South Italy. Hydraulic properties came from infiltration experiments. Infiltration data were fitted using bimodal and unimodal hydraulic properties by an inverse solution of Richards Equation. The scaling parameter of the proposed PTF, αAP, was calibrated using the measured bimodal hydraulic properties. A similar calibration was carried out for the sake of comparison, in which the αAP of the classical unimodal AP was calibrated using the unimodal hydraulic properties. The proposed bimodal AP (bimAP) PTF significantly improves the predictions of the mean WRC parameters, K0 and the entire HCC, compared to the classical unimodal AP (unimAP) PTF. In addition, compared to unimAP, bimAP allows to reproduce the statistics of the hydraulic parameters (e.g., the variance) similar to those obtained from field measurements. Finally, Multiple Linear Regression (MLR) was applied to study the sensitivity of bimodal αAP to the soil textural and structural properties and the results confirmed the significant predictive effects of soil structure.

How to cite: Hassan, S. B. M., Dragonetti, G., Comegna, A., Sengouga, A., Lamaddalena, N., and Coppola, A.: A bimodal extension of the ARYA&PARIS approach for predicting hydraulic properties of structured soils, EGU General Assembly 2023, Vienna, Austria, 23–28 Apr 2023, EGU23-12011, https://doi.org/10.5194/egusphere-egu23-12011, 2023.

EGU23-12328 | ECS | Orals | HS8.3.1

Modelling the impact of Alternate Wetting and Drying (AWD) rice irrigation on water resources in northern Italy 

Giulio Luca Cristian Gilardi, Alice Mayer, Michele Rienzner, Giovanni Ottaiano, Darya Tkachenko, Marco Romani, Elisa Cadei, and Arianna Facchi

The north-western part of the Padana Plain in Italy is the most important rice district in Europe. Recently, due to an increased frequency of water scarcity periods, the traditional wet seeding and continuous flooding irrigation has been replaced by dry seeding followed by a delayed flooding or by a turned irrigation. Despite the advantages that dry seeding has brought to farmers, this change is leading to unexpected problems, the main of which are: i) the lowering of groundwater levels in the first months of the agricultural season that is reducing groundwater contribution to water discharges in rivers and irrigation networks of the area, limiting the water availability for agricultural areas downstream; ii) a shift to June of the maximum rice irrigation requirement, leading to an exasperated competition between rice and other crops (e.g. maize).

In the contest of the MEDWATERICE (PRIMA Section2-2018) and RISWAGEST project (Regione Lombardia, RDP 2014-20), an experimental platform was set up in the core of the Italian rice area (Mortara, PV) to compare three rice irrigation strategies in the period 2019-2022: i) wet seeding and traditional flooding (WFL), ii) dry seeding and delayed flooding (DFL) and iii) wet seeding and alternated wetting and drying (AWD). Irrigation water use was monitored and all the other soil water balance components were quantified. At the field scale, irrigation use was found to be in the order: WFL > DFL > AWD, without penalizing rice production, while the temporal distribution of irrigation needs and percolation fluxes (i.e. groundwater recharge) changed as a function of the irrigation strategy.

Results achieved in the experimental platform were used to set-up a semi-distributed agro-hydrological model simulating water fluxes and storages of a rice irrigation district (about 1000 ha) close to the experimental platform. The modelling framework consists of three sub-models: i) one for the agricultural area, based on the physically-based SWAP (https://www.swap.alterra.nl/); ii) one for the channel network percolation; iii) one for the groundwater level dynamics. Once calibrated, the modelling system was used to explore the effects on the water resources of ‘what-if scenarios’ based on the adoption of specific irrigation strategies in the whole rice-cropped area of the district (about 90% of the agricultural surface) for the period 2013-2020. Besides the aforementioned WFL, DFL and AWD, the following strategies were additionally explored: i) dry seeding and fixed irrigation turns of 8 days (FTI) and ii) early seeding for the DFL irrigation technique (beginning of April). Three indicators were used to support the analysis: i) Water Application Efficiency - WAE, defined as the potential evapotranspiration divided by the irrigation reaching the fields plus rainfall, ii) Distribution Efficiency of the irrigation network - DE, defined as the irrigation reaching the fields divided by the irrigation discharge entering the district, iii) Relative Water Supply - RWS, defined as the irrigation discharge entering the district plus rainfall divided by the potential evapotranspiration. Water fluxes and indicators are calculated and discussed both for the entire agricultural season (April-September) and for the most critical month (June).

How to cite: Gilardi, G. L. C., Mayer, A., Rienzner, M., Ottaiano, G., Tkachenko, D., Romani, M., Cadei, E., and Facchi, A.: Modelling the impact of Alternate Wetting and Drying (AWD) rice irrigation on water resources in northern Italy, EGU General Assembly 2023, Vienna, Austria, 23–28 Apr 2023, EGU23-12328, https://doi.org/10.5194/egusphere-egu23-12328, 2023.

EGU23-12430 | ECS | Orals | HS8.3.1

Updating vegetation information in a land surface model 

Melissa Ruiz-Vásquez, Sungmin Oh, Alexander Brenning, Gianpaolo Balsamo, Souhail Boussetta, Gabriele Arduini, Markus Reichstein, and René Orth

Vegetation plays a fundamental role in modulating the exchange of water, energy, and carbon fluxes between the land and the atmosphere. These exchanges are modelled with Land Surface Models (LSMs) which are part of numerical weather prediction systems to support the performance of weather forecasts. However, most current LSMs only utilise observed vegetation information in the form of mean seasonal cycles. The potential benefits of additionally including information about shorter-term vegetation anomalies and inter-annual variability are understudied.

In this study, we update vegetation information in the HTESSEL (Hydrology Tiled ECMWF Scheme for Surface Exchanges over Land) model and investigate the resulting effects on the performance of simulated shallow and deep soil moisture as well as latent heat flux. The updated information includes an interactive observation-based leaf area index from Sentinel-3 and THEA GEOV2, and a land use/land cover map from ESA-CCI. The resulting simulations of soil moisture and latent heat flux are validated against global gridded observation-based datasets.

Results show that the updated land surface information deteriorates the overall model performance for both latent heat flux and soil moisture in most regions across the globe. In a second step, we re-calibrate soil and vegetation-related parameters at each grid cell in order to adjust them to the new vegetation information. This leads to improved model performance and illustrates the benefits of updated vegetation information. Morover, we attribute the spatial variations of parameter perturbations resulting from the re-calibration to multiple land surface and climate characteristics. This highlights potential venues in model development to take static ecological and hydroclimatological information into greater consideration.

Furthermore we compare the performances of local model calibration - performed for each grid cell individually - and global model calibration considering a single parameter set for all grid cells globally. We analyse the agreement of parameter calibrations obtained for shallow and deep soil moisture as well as latent heat flux.

In summary, our results highlight that Earth-observation products of vegetation dynamics and land cover changes can improve land surface model performances, which in turn can contribute to more accurate weather forecasts.

How to cite: Ruiz-Vásquez, M., Oh, S., Brenning, A., Balsamo, G., Boussetta, S., Arduini, G., Reichstein, M., and Orth, R.: Updating vegetation information in a land surface model, EGU General Assembly 2023, Vienna, Austria, 23–28 Apr 2023, EGU23-12430, https://doi.org/10.5194/egusphere-egu23-12430, 2023.

EGU23-12613 | ECS | Orals | HS8.3.1

Soil Hydraulic Conductivity Controls Soil Moisture Limitation of Transpiration Globally 

Fabian Wankmüller, Louis Delval, Andrea Cecere, Peter Lehmann, Mathieu Javaux, and Andrea Carminati

At a critical soil water content (θcrit), terrestrial ecosystem fluxes at the soil-vegetation-atmosphere interface transition from energy into water limitation. Understanding and predicting soil, plant and atmospheric mechanisms that control θcrit are central to interpreting and predicting impacts of drought on ecosystems, including the associated feedbacks to carbon and hydrological cycle. Thanks to the existing monitoring networks, θcrit can now be estimated globally across soils, biomes and climates. However, the mechanisms and key parameters that explain θcrit as a result of soil-, plant-, and climate-interaction remain elusive. Here, we show that the soil hydraulic conductivity function determines mean and variability of θcrit. The underlying concept to calculate θcrit assumes that soil moisture limitation of transpiration is triggered by a loss in soil hydraulic conductivity around the roots. Taking soil-specific hydraulic properties into account, our soil-plant hydraulic model predicts the observed mean and variance of θcrit as a function of soil textural classes. In coarse textured soils, θcrit is small due to the lower absolute soil hydraulic conductivity and its steeper decline with soil drying compared to fine textured soils. The increasing variability of θcrit in fine-textured soils is explained by (i) the wide range of hydraulic conductivity values for similar soil textures as a result of soil structure formation and (ii) by the higher sensitivity to plant traits and climate for soils with less steep hydraulic conductivity curves (i.e., loamy soils). The corresponding critical soil matric potential (hcrit) is also soil texture specific, and it covers a broad range of values, from values close to field capacity in sandy soils (hcrit ca. -100 hPa) to values close to the wilting point in clay soils (hcrit ca. – 1 MPa). The model implies that climate change has a smaller effect on θcrit in sandy soils, suggesting that soil texture modulates climate effects on water use and photosynthesis globally. Overall, our results prove the prominent role of soil hydraulic conductivity for water limitation of ecosystem fluxes and for plants’ potential to adjust to water limitations subject to alterations due to climate change.

How to cite: Wankmüller, F., Delval, L., Cecere, A., Lehmann, P., Javaux, M., and Carminati, A.: Soil Hydraulic Conductivity Controls Soil Moisture Limitation of Transpiration Globally, EGU General Assembly 2023, Vienna, Austria, 23–28 Apr 2023, EGU23-12613, https://doi.org/10.5194/egusphere-egu23-12613, 2023.

EGU23-12860 | Orals | HS8.3.1

Water storage variations in a forest during a sequence of dry years: integrative monitoring with a superconducting gravimeter 

Andreas Güntner, Marvin Reich, Daniel Rasche, Theresa Blume, Stephan Schröder, Erik Brachmann, André Gebauer, and Hartmut Wziontek

Terrestrial gravimetry allows for integrative measurements of mass changes associated with water storage variations in all storage compartments above and below the Earth surface. Superconducting gravimeters (SGs) currently are the most precise instruments for continuous monitoring of gravity change. Their footprint typically covers a radius of about 1 km around the instrument, with most of the signal originating from within the first 100 meters. We installed a SG (iGrav033) in a mixed pine-beech-oak forest in the TERENO observatory in the lowlands of north-eastern Germany. It is housed in a small field enclosure with less than 1 m2 base area, on top of a stable concrete pillar. Complementary hydro-meteorological monitoring data are available at the site, including a weather station, a groundwater monitoring well, clusters of soil moisture sensors along deep soil profiles, interception measurements and near-surface soil moisture from Cosmic Ray Neutron Sensing. For quantification and correction of the long-term instrumental SG drift, repeated measurements with an FG5 absolute gravimeter were carried out. The gravity residual time series (gravity measurements reduced to the local hydrological effect) covers a sequence of years with below average precipitation, from 2018 to 2022. We show the gravity-based water storage variations in the forested landscape throughout this period, indicating that storage depletion during summer in most years is not fully recovered by the subsequent wetter winter periods. The amplitudes of gravity-based water storage variations tend to exceed those observed by soil moisture sensors in the top meters of the soil and of groundwater. This indicates the value of terrestrial gravimetry in revealing dynamics of the deeper unsaturated zone water storage.

How to cite: Güntner, A., Reich, M., Rasche, D., Blume, T., Schröder, S., Brachmann, E., Gebauer, A., and Wziontek, H.: Water storage variations in a forest during a sequence of dry years: integrative monitoring with a superconducting gravimeter, EGU General Assembly 2023, Vienna, Austria, 23–28 Apr 2023, EGU23-12860, https://doi.org/10.5194/egusphere-egu23-12860, 2023.

EGU23-12915 | Posters on site | HS8.3.1

How Darcy-scale daemons lead theory developments for soil-water dynamics astray 

Conrad Jackisch and Tobias Hohenbrink

Theory in soil physics is tightly bound to integral lab observations of dynamics of soil water content and matric potential. In addition, the perceptual model of (linear) filter flow water movement is deeply embedded in measurement procedures and projections of soil water dynamics. Such Darcy-scale principles have been found to mismatch with observations and application requirements at the landscape-scale including the effect of boundary conditions. While this discrepancy is often attributed to soil heterogeneity and the requirement for effective parameterisation, we seek to discuss that assumptions about scalability of lab-measured soil hydraulic properties taken out of the capillary context of soils potentially render our "physics" ill-posed.

In this PICO we will present a series of analyses of soil water state dynamics from lab, plot and hillslope scales. We will show how scaling coincides with a change in boundary conditions and hydraulic gradients, which can fundamentally alter the inferred properties in similar soils at different locations. However, these effects are largely ignored when generalising soil-water constitutive theory and pedotransfer functions.

We propose a scale- and information aware evaluation concept for pedotransfer function derivation and application. Given the many theoretical obstacles in scaling non-linear three-phase characteristics in porous media, we argue that reducing the scale-gap between the level of derivation and application of soil physical characteristics is more promising. A smart, standardised and repeatable field experiment at the pedon scale could be a first step towards a more physically consistent reference of macroscale soil functioning.


How to cite: Jackisch, C. and Hohenbrink, T.: How Darcy-scale daemons lead theory developments for soil-water dynamics astray, EGU General Assembly 2023, Vienna, Austria, 23–28 Apr 2023, EGU23-12915, https://doi.org/10.5194/egusphere-egu23-12915, 2023.

EGU23-14197 | ECS | Posters on site | HS8.3.1

Climate-driven local assessment of future irrigation requirements and available water resources in North-West Italy 

Matteo Rolle, Stefania Tamea, Pierluigi Claps, and Davide Poggi

The impact of climate change on agriculture is a major challenge for the food and water security of next decades. In the future, the Mediterranean area will be particularly exposed to water scarcity, which may lead to significant losses in agricultural yield. Climate projections show that many densely cultivated areas of Southern Europe will suffer decreases of precipitation intensity and frequency, with severe consequences in terms of irrigation requirements, i.e.  the amount of water needed to meet the evapotranspirative demand of crops during dry periods. Therefore, the modelling of climate-driven crop water requirements and available water resources is essential to understand future criticalities for agriculture and to adopt proper adaptation strategies.

In this study, the agricultural irrigation requirement was estimated by modeling the daily water balance in the soil, on the basis of evapotranspirative demand and precipitation, over the densely irrigated basin of Demonte, in South Piedmont (Italy). The volumes of irrigation required by local agriculture were calculated for 30 main crops, taking into account the local information of yearly distribution of crops. The available surface water in the basin was compared to the present irrigation requirements, using flow discharge data from the river that feeds the local network of irrigation channels. In order to analyze future scenarios, precipitation and temperature data from five EURO-CORDEX regional climate models were used to estimate the irrigation requirements and the available surface water for the 2035-2055 period, considering multiple RCP scenarios.

Results show that the current available water resources are little enough to meet the irrigation requirements over the Demonte basin for the months of July and August, when most of the cereals reach the maximum growing phase. The climate-driven assessment for the future decades shows that the water required for irrigation will gradually exceed the threshold of available resources, with different degrees of severity depending on the RCP scenario. Moreover, future scenarios highlight a progressive increase in the temporal lag between the period of maximum irrigation requirements (July-August) and the high-flow regime period in the hydrographic network (April-June). As a consequence, most of the surface freshwater in the Demonte basin will not be available for agriculture during summer, when most of the irrigation will be required. Modeling the future scenarios of agricultural water needs and available resources is an important step to understand the future implications of climate change on food production. Moreover, this is a valuable instrument to support proper adaptation strategies, both in terms of agricultural and water management planning policies.

How to cite: Rolle, M., Tamea, S., Claps, P., and Poggi, D.: Climate-driven local assessment of future irrigation requirements and available water resources in North-West Italy, EGU General Assembly 2023, Vienna, Austria, 23–28 Apr 2023, EGU23-14197, https://doi.org/10.5194/egusphere-egu23-14197, 2023.

High spatial heterogeneity, difficulty in monitoring and lack of soil hydrological processes have resulted in poor understanding of the key hydrological processes in topographically complex, high elevation mountainous areas, impeding the advancement and applications of mountainous hydrology and hydrological models. This research aims to understand the mechanism of key hydrological processes at multiple spatial scales (soil profile, hillslope, watershed, and region) in the Qilian Mountain ranges, Northwest China. To this end, an in-situ observation network has been set up to monitor the hydrological processes, including precipitation, infiltration, soil moisture, subsurface flow, evapotranspiration and runoff at the multiple spatial scales. The in-situ observations has been applied to: 1) quantify the soil moisture dynamics about infiltration, 2) gain a better understanding of the underlying hydrological mechanisms of preferential flow; and 3) understand the relationship between rainfall, soil moisture dynamics and evapotranspiration.

How to cite: Tian, J.: The multiple-scale hydrological processes observations at mountainous areas and its preliminary results, EGU General Assembly 2023, Vienna, Austria, 23–28 Apr 2023, EGU23-14297, https://doi.org/10.5194/egusphere-egu23-14297, 2023.

EGU23-15294 | Orals | HS8.3.1

Modeling the partitioning of evapotranspiration using invasion percolation theory 

Peter Lehmann and Andrea Carminati

The partitioning between soil evaporation and transpiration from plants is an important process of water and carbon cycles and surface energy balance. Its quantification is prone to errors because of the complexity of flow geometry, which is affected by the variation of root length density over depth and time and the dynamics of soil hydraulic properties in the rhizosphere. Root water uptake and concurrent evaporation depend on the forces (capillarity, gravity, and viscous losses) controlling water flow and propagation of the drying front. We simulate the water flow from the soil to the atmosphere using invasion percolation models, draining elements as a function of the retaining forces depending on the lengths of the potential flow paths. The partitioning between evaporation and transpiration is simulated for different pore size distributions, root length densities, and vegetation covers controlling the transpiring area. Starting with a three dimensional percolation model (to reproduce the connectivity of the liquid phase) at the column scale consisting of elements in the submillimeter range, we deduce one-dimensional partitioning rules for wet and dry soils. As an outlook, we discuss how these rules can be (i) implemented in large scale models and (ii) tested by measuring vapor fluxes above and below canopy.

How to cite: Lehmann, P. and Carminati, A.: Modeling the partitioning of evapotranspiration using invasion percolation theory, EGU General Assembly 2023, Vienna, Austria, 23–28 Apr 2023, EGU23-15294, https://doi.org/10.5194/egusphere-egu23-15294, 2023.

EGU23-15490 | ECS | Posters on site | HS8.3.1

GIS—based application of Benfratello's method to estimate the irrigation deficit and its uncertainty under different climate change scenarios 

Marco Peli, Stefano Barontini, Emanuele Romano, and Roberto Ranzi

Benfratello's Contribution to the study of the water balance of an agricultural soil (Contributo allo studio del bilancio idrologico del terreno agrario) was firstly published in 1961. The paper provides a practical conceptual and lumped method to determine the irrigation deficit in agricultural districts, and it generalizes previous Thornthwaite (1948) and Thornthwaite and Mather (1955) water balances thanks to the application of the dimensionless approach introduced by De Varennes e Mendonça (1958). Since then, it has been used in many areas in Southern Italy. It is our opinion that, due to its simplicity and to the small number of required parameters, Benfratello's method could be regarded to as an effective tool to assess the effects of climatic, landuse and anthropogenic changes on the soil water balance and on the irrigation deficit.

In previous contributions we presented (i) a GIS—based application of Benfratello's method to the case study of the semiarid Capitanata plane (4550 km2), one of the most important agricultural districts in Italy, and (ii) a theoretical development of the method that allows to simply estimate in closed form the uncertainity of the calculated irrigation deficit, once known the interannual variability of the required climatic variables (air temperature and precipitation). In this contribution we present the results obtained by applying the GIS—based Benfratello framework to estimate the irrigation deficit and its uncertainty of the Capitanata plane case study under different climate change scenarios.

The scenarios were generated with the following procedure: (i) combination of different GCMs (CNRM-CM5, CMCC-CM and IPSL-CM5A-MR) with the IPCC RCP4.5 and RCP8.5 scenarios as well as with historical data, (ii) statistical downscaling of the obtained models to estimate future time series of air temperature and precipitation for the meteorological stations of interest in the considered case study and (iii) spatial interpolation with ordinary kriging. The obtained maps were then used as input data for the already developed GIS—based application of Benfratello's method.

How to cite: Peli, M., Barontini, S., Romano, E., and Ranzi, R.: GIS—based application of Benfratello's method to estimate the irrigation deficit and its uncertainty under different climate change scenarios, EGU General Assembly 2023, Vienna, Austria, 23–28 Apr 2023, EGU23-15490, https://doi.org/10.5194/egusphere-egu23-15490, 2023.

A distinct greening trend is evident in Asia, especially on the Chinese Loess Plateau (CLP), which is driven by climate change and human-induced revegetation projects, such as the Grain for Green (GFG) project launched in 1999. However, revegetation may cause below-ground soil drought via excessive consumption of deep soil moisture (SM). To ascertain the contributions of revegetation projects to the greening trend on the entire CLP, and then evaluate the spatial-temporal variations of soil drought, as indicated by the dried soil layer (DSL), we collected multisource satellite datasets from 1982 to 2019 on the CLP and measured SM to a depth of 500 cm on 20 occasions at 73 locations from 2013 to 2016 at a typical watershed. We found that the revegetation project failed initially to make a positive contribution in the first few years because of the drought conditions in 1999-2005; after 2005, the increasing trend of vegetation change on the CLP indicated that the revegetation project, as a type of external disturbance, began to improve vegetation growth, meanwhile the increased precipitation played a critical role. The contribution of the revegetation projects increased quickly until 2013, after which it remained stable and reached average values of 58.8%±19.34% in the representative areas that conducted the GFG project. The DSLs occurred at > 90% of the sampling sites within the watershed, and the spatially and temporally averaged DSL thickness (DSLT) and soil water content within the DSL (DSL-SWC) were 257 cm and 10.4%, respectively, which suggests that 51.4% of the 500-cm-profile is drying out below 125 cm. The DSLT and DSL-SWC demonstrated a moderate degree of variability (20% < CV < 84%) in space, and showed a moderate and weak temporal variability, in time, respectively. The temporal series of the mean spatial DSLT significantly correlated with climatic variables. The spatial variation of the mean temporal DSL-SWC differed significantly among the land uses and between shaded and sunlit aspects. Our results highlighted that the meteorological processes, land use, and topography played an essential role in shaping DSL variation and distribution pattern. Understanding this information is helpful for vegetation construction, soil and water conservation, and soil drought meditation via the best management practices in the CLP and other water-limited regions with deep soils.


How to cite: Wang, Y. and Liu, S.: Dynamics of deep soil drought triggered by revegetation across a semiarid watershed, EGU General Assembly 2023, Vienna, Austria, 23–28 Apr 2023, EGU23-15914, https://doi.org/10.5194/egusphere-egu23-15914, 2023.

EGU23-16029 | Posters on site | HS8.3.1

Qualitative and numerical results on the soil--water redistribution 

Stefano Barontini, Martina Siena, and Marco Peli

The soil--water redistribution is an interesting and complex process that takes place after an abundant imbibition of the uppermost soil layers, as after rainfall or irrigation. It is a consequence of the concurrency of other processes, that are downward advection and diffusion, surface evaporation and root water uptake. It is therefore simultaneously characterised by downward and upward water flow and by water extraction, and, as a consequence, it plays a key role at partitioning the water fluxes through the soil, with feedbacks also on the mass fluxes and on the soil layering.

Aiming at contributing to better understanding this process, we present a theoretical (qualitative) and a numerical assessment of some properties of the soil--water redistribution, based on the classical framework of the Richards equation.

The qualitative analysis focuses on the evolution of the soil--water content of an imbibition front, as a consequence of the onest of a continuous surface evapotranspiration. The process is analogically depicted with the traditional description of the flood--wave propagation in free--surface flow. Particularly we show that, considering an instantaneous water--content wave within the uppermost soil, an observer would meet, from the bottom moving upward, the planes where:

  • The (downward) Darcian velocity q is locally maximum in time, ∂q / ∂t = 0, where the water content θ is in imbibition;
  • θ is locally maximum, ∂θ / ∂t = 0, where q is instantaneously maximum in space, ∂q / ∂x = 0, and θ is still in imbibition;
  • θ is instantaneously maximum in space, ∂θ / ∂x = 0, where the downward flux is purely gravitational, i.e. q = K, being K(θ) the hydraulic conductivity;
  • q = 0, i.e. the zero--flux plane, that separates the downward from the upward flux, where θ is instantaneously increasing in space, ∂θ / ∂x > 0;
  • q is instantaneously minimum in time (i.e. the upward flux is maximum), where ∂θ / ∂x > 0.

Morevover an observer who follows the peak of water content would see it reducing in space and time, being its total derivative dθ / dt < 0, until it vanishes.

If the observer stops at fixed depth, these patterns would reflect in a cycle in the (θ,q) phase plane, where, starting from initially hydrostatic condition, one would observe the (local) maximum q, the (local) maximum θ, the onset of an advective flow q = K when the (spatial) peak of θ passes at that depth, the passage of the zero--flux plane, the minimum q and then the hydrostatic condition again.

The evapotranspiration is however ruled by diurnal cycles and the soil--water dynamics vary depending on the development of the root apparati. We provide an insight on these aspects by means of the numerical simulation, performed with Hydrus1d. It shows that diurnal evapotranspiration cycles induce fluctuations in the depth of the zero--flux plane and that the root water uptake, which shares the evapotranspirative demand in the whole domain, reduces the uppermost upward flux, thus allowing the zero--flux plane reaching deeper depths.

How to cite: Barontini, S., Siena, M., and Peli, M.: Qualitative and numerical results on the soil--water redistribution, EGU General Assembly 2023, Vienna, Austria, 23–28 Apr 2023, EGU23-16029, https://doi.org/10.5194/egusphere-egu23-16029, 2023.

The subsurface critical zone (CZ) structure in alpine regions has a profound influence on water storage. The primary focus of this work is to reveal that the organic layer (A), leaching-deposit layer (B), saprolite layer (C) and freeze–thaw processes regulate changes in subsurface liquid water storage (CSWS). Here, we selected six representative ecosystems along an elevation gradient (4221~3205 m) in the Qinghai Lake Basin Critical Zone Observatory (QLBCZO) on the Qinghai-Tibet Plateau. We performed in situ field surveys, ground-penetrating radar (GPR) and electrical resistivity tomography (ERT) measurements to investigate the subsurface CZ structure and liquid water storage (SWS). The results showed that the saprolite layer (thickness of 0.84~41.85 m) was the main subsurface liquid water storage reservoir, with a monthly average value of 595.49 mm. It occupied 82.12% of the total water storage of layers A, B and C. The average seasonal frozen thickness (SFT) ranged from 0.33 m to 1.60 m. SFT contributed most to CSWS, with 27.95% during the thawing period, and precipitation contributed most, with 19.87% during the freezing period. The SWS of the saprolite layers compared to that of layers A and B increased the most, by 39.41 mm and 45.88 mm in the thawing and nonfreezing periods, respectively, and that of layer B decreased maximally by 52.50 mm in the freezing period. This study contributes to advancing the mechanistic understanding of the interactions between the subsurface CZ structure and water storage processes and provides high-quality data with which coupled ecohydrological models can be developed.

How to cite: Zuo, F. and Li, X.: Subsurface Structure Regulates Water Storage in the Alpine Critical Zone on the Qinghai-Tibet Plateau, EGU General Assembly 2023, Vienna, Austria, 23–28 Apr 2023, EGU23-16591, https://doi.org/10.5194/egusphere-egu23-16591, 2023.

Multi-phase multi-component flow and transport models are a key instrument for analyzing and predicting gas transport inside the vadose zone. The soil moisture distribution within the vadose zone varies in time and space. Thus, accurate gas transport prediction relies on the precise knowledge of the saturation-dependency of the transport parameters such as the effective gas diffusion coefficient Deff. Although recent advances from typical small scale experiments (diffusion apparatus with typical soil core size of 100 cm3) show that Deff-saturation(S)-relationships are not only dependent on general soil characteristics such as air-filled porosity and total porosity, but can also be derived from pore network characteristics, such as pore connectivity and geometry, most model frameworks rely on simple empirical formulations such as Millington & Quirk (1961), which find wide acceptance, but have been found to not be universally applicable.

The current state of research lacks extensive performance tests for the application of Deff-S-relationships beyond the small scale and especially for realistic natural conditions, where soil moisture changes with depth and gas transport processes may be more complex than in standard laboratory setups used for the experimental determination of Deff, which leads to unknown errors in the numerical prediction of sub-surface gas transport processes.

We test different Deff-S-functions within a multi-phase-multi-component flow and transport model by reproducing a laboratory gas transport experiment, where a tracer gas is injected into a quasi-2D Darcy-scale sand tank with a soil moisture distribution that covers the full range from wet to dry and comparing simulated and measured gas concentrations at several locations within the tank over time. The systematic evaluation of different functions leads to the conclusion that the saturation-dependency of Deff in the tested sand follows power law-scaling at low gas phase saturation and linear scaling above, in line with the physically based concepts of percolation theory and effective medium theory and with recent experimental results (Ghanbarian et al., 2018). Other approaches such as (Buckingham, 1904; Penman, 1940; Millington & Quirk, 1961; Moldrup et al., 2000) lead to large errors between numerical and experimental results. We demonstrate that the use of an inaccurate Deff-S-function can lead to a misrepresentation of diffusion coefficients by a factor of up to 105, which underlines the need for a correct representation of the saturation-dependency of Deff in numerical modeling of sub-surface gas transport.

How to cite: Bahlmann, L. M., Smits, K. M., and Neuweiler, I.: Evaluation of gas diffusion-saturation functions as inputs to multiphase flow and transport models simulating gas transport in variable saturated sand, EGU General Assembly 2023, Vienna, Austria, 23–28 Apr 2023, EGU23-16625, https://doi.org/10.5194/egusphere-egu23-16625, 2023.

EGU23-17401 | ECS | Orals | HS8.3.1

Ag-IoT application for Vital Monitoring of Plant Ecophysiological Data and Soil Parameters 

Shahla Asgharinia, Micaela Lembo, Vanessa Eramo, Roberto Forniti, Francesco Renzi, Riccardo Valentini, and Rinaldo Botondi

Ag-IoT systems enable a data pipeline for modern agricultural production. Using Ag-IoT technologies, growers can make better management decisions by leveraging the real-time field data while researchers could utilize these data to answer key scientific questions. Here, we designed a flexible microprocessor-based platform, called TreeTalker, to monitor in real-time plant sap flow rate via thermal approaches. TreeTalker has an onboard spectrometer to collect data in near infrared and visible areas using 12 bands from 450 to 860 nm. Moreover, TreeTalker collects microclimate data (air temperature and air relative humidity) as well as soil moisture and temperature measurement. Sap flow and soil moisture measurements are the main tools to understand the plant water demand for precision irrigation and water-energy efficiency. In this study, 9 TreeTalker units are mounted on Soreli Kiwifruit trees in the Lazio region, Italy. The site is divided into three clusters with different irrigation regimes, 100, 80 and 60 %, respectively. The first objective of this study was to apply new algorithms for sap flow measurement considering the heating and cooling phases of the heat flow curve at the same time and secondly, a compare of phenological and ecohydrological trends of trees under full and deficit irrigation systems. Data captured was used to analyze the correlation between fruit quality, productivity, health, and fertility of trees with ecophysiological parameters under different irrigation systems. The result of continuous monitoring for one growing season in 2022 revealed that sap flow function based on cooling phase data has higher accuracy than heating phase due to independency to the zero-flux condition as well as semi-theoretical flow index. Given sap flow results, plants with the full irrigation system have ∼ 1.3 to 3 times greater sap flow rate than plants with deficit irrigation regimes. Kiwi peak water demand occurred in July coinciding with max VPD confirming maximum sap flow rates between each irrigation regime. A variation between the 80% and 60% irrigation regimes, ∼ 4 to 15 %, is linked to slight differences in sap flow rates and is most prominent in the early part of the growing season. Considering fruit quality data, kiwifruit trees with full irrigation showed lower acidity, and higher Vitamin C concentration while sugar concentrations were noticeably lower. Our results suggest that the 80% irrigation schedule achieves the optimum water energy efficiency as well as reaching optimum fruit quality conditions. This finding requires validation via continued monitoring over successive seasons and irrigation regimes. The revolution in the Internet of trees offers a promising new big data solution for assessing optimal conditions for fruit tree agricultural production considering future and potential water scarcity scenarios.

How to cite: Asgharinia, S., Lembo, M., Eramo, V., Forniti, R., Renzi, F., Valentini, R., and Botondi, R.: Ag-IoT application for Vital Monitoring of Plant Ecophysiological Data and Soil Parameters, EGU General Assembly 2023, Vienna, Austria, 23–28 Apr 2023, EGU23-17401, https://doi.org/10.5194/egusphere-egu23-17401, 2023.

EGU23-17595 | Orals | HS8.3.1

Hydro-pedotransfer functions: A roadmap for future development 

Tobias K. D. Weber

Hydro-pedotransfer functions (hyPTF) are important methods to relate available knowledge about soil properties to soil hydraulic properties and model parameters to be applied in process models. At least more than four decades have been invested to derive such relationships. However, while models, methods, data storage capacity, and computational efficiency have advanced, there are fundamental issues related to the scope and adequacy of current hyPTFs, particularly when applied to parameterise models at the field scale and beyond. Much of the hyPTF development process has focussed on refining and advancing the methods, while fundamental questions remain largely unanswered, namely i) how should hyPTFs be built for maximum prediction confidence, ii) which processes/properties need to be predicted to move beyond the van Genuchten-Mualem based parameterisation of the Richards equation, iii) which new datasets and data coverage are needed, iv) how does the measurement process of soil hydraulic properties determine the construction of hyPTFs and at which scale, iv) how can we incorporate diverging scales (scale of derivation vs scale of application), and v) what scaling/modulation/constraining strategies are affective to make hyPTF predictions at field-to-regional scale appropriate and physically meaningful? These questions have been addressed in a joint effort by the members of the International Soil Modelling Consortium (ISMC) Pedotransfer Functions Working Group with the aim to systematise hyPTF research and provide a roadmap guiding scientists, reviewers, and make users aware of the shortcomings.

How to cite: Weber, T. K. D.: Hydro-pedotransfer functions: A roadmap for future development, EGU General Assembly 2023, Vienna, Austria, 23–28 Apr 2023, EGU23-17595, https://doi.org/10.5194/egusphere-egu23-17595, 2023.

EGU23-983 | ECS | Orals | HS8.3.2

SoVegI: a new and efficient model coupling photosynthesis and hydraulic transport within the soil-plant continuum 

Oscar Corvi, Sylvain Weill, Benjamin Belfort, Philippe Ackerer, Damien Bonal, and Matthias Cuntz

Climate change impacts on forests cannot be understood without representing the hydraulic functioning of forests. In this work we present SoVegI (Soil-Vegetation Interaction model), a numerically efficient, process-based model of the soil-plant-atmosphere continuum, developed to represent groundwater-forest interactions under drought conditions for broadleaf and deciduous forests of Europe.

The model includes (1) a single layer sun/shade model of mass and energy fluxes at the canopy scale, (2) a stomatal conductance model depending, among other things, on leaf water potential describing the direct link with soil water availability, (3) a process-based soil-root-xylem hydraulic transport scheme assuming the hydraulic transport to be analogous with water transport in a porous media, and (4) a root water uptake model representing the direct coupling between the soil and the vegetation.

The novelty of the model is to present a fast and efficient numerical implementation of the hydraulic transport process within the whole soil-plant-atmosphere continuum that allows coupling with large spatial models. The porous media analogy results in a set of three coupled nonlinear partial differential equations similar to Richards’ equation for porous media in soil. The system is solved using a finite volume, time-implicit approach and an advanced iterative scheme is used to treat the non-linearity of the system.

This new numerical model was successfully tested at the tree and the forest scales at two sites in northern France after being calibrated against sap flow measurements and eddy covariance data, respectively. At the tree scale, the model was able to reproduce the mid-day partial stomatal closure showing the availability of the model to catch the dynamic feedback between the atmospheric and soil water conditions. The model was also capable of reproducing the water storage pool drainage during day time and the night time replenishment, opening interesting perspectives to investigate forests’ risks to hydraulic failure. At the forest scale, the model was able to reproduce the transpiration response to the 2003 soil drought and heat wave in northern Europe with limited computational efforts. These preliminary steps open interesting research perspectives where SoVegI will be coupled with a physically-based integrated hydrologic model to assess the impact of extreme events on groundwater-forest relations.

How to cite: Corvi, O., Weill, S., Belfort, B., Ackerer, P., Bonal, D., and Cuntz, M.: SoVegI: a new and efficient model coupling photosynthesis and hydraulic transport within the soil-plant continuum, EGU General Assembly 2023, Vienna, Austria, 23–28 Apr 2023, EGU23-983, https://doi.org/10.5194/egusphere-egu23-983, 2023.

EGU23-1150 | ECS | Orals | HS8.3.2

Transpiration response to atmospheric drying vs. to soil drying: underlying physical and physiological mechanisms and related plant traits 

Tina Köhler, Fabian Joscha Pascal Wankmüller, Walid Sadok, and Andrea Carminati

Plant water use during drought depends on atmospheric demand and soil water supply. Typically, transpiration response to drought is evaluated in two types of experiments: either exposure to a stepwise increase in vapor pressure deficit (VPD), or exposure to soil drying over the course of weeks. Surprisingly however, the extent of similarities and differences of the underlying mechanisms remains poorly documented. This hampers progress towards breeding for well-adapted crops targeting environments with high VPD, high risk of soil moisture deficit, or both. We present an extensive review of the two experimental approaches and use a soil-plant hydraulic model to simulate transpiration responses to both environmental drivers. Existing experimental results lead to contradicting results regarding the role of the plant hydraulic conductance for the transpiration response to atmospheric drying vs. to soil drying: a high plant hydraulic conductance triggers an earlier transpiration decline (i.e. in wetter soil conditions) during soil drying; but enables plants to sustain transpiration at high VPD. A hydraulic framework hypothesizing that transpiration responds to a decline in soil-plant conductance helps to explain the contradiction. At high VPD, water potential gradients mainly develop within the plant, and thus it is the plant hydraulic conductance that limits the water flow during atmospheric drying. During soil drying, the gradients develop in the soil, and thus the soil hydraulic conductivity controls the flow. The plant hydraulic conductance is expected to impact the plant’s sensitivity to the development of water potential gradients around the roots that occurs during soil drying. Thus, stomatal closure and hence transpiration response is related to a drop in hydraulic conductivities in both scenarios but the relevant hydraulic traits differ between the two environmental changes in a predictable way. Such a finding could better guide breeding efforts targeting adaptation to specific drought regimes.

How to cite: Köhler, T., Wankmüller, F. J. P., Sadok, W., and Carminati, A.: Transpiration response to atmospheric drying vs. to soil drying: underlying physical and physiological mechanisms and related plant traits, EGU General Assembly 2023, Vienna, Austria, 23–28 Apr 2023, EGU23-1150, https://doi.org/10.5194/egusphere-egu23-1150, 2023.

EGU23-1552 | Posters on site | HS8.3.2

Implementing microscopic water uptake in soil-plant interaction modelling for assessing effects on crop growth 

Martin Mulder, Marius Heinen, and Mirjam Hack-ten Broeke

Crop transpiration is one of the most important processes in simulating soil-water-plant-atmosphere interactions. Roots perform a crucial role by taking up water and thus contributing to transpiration and enabling crop growth. Shortage of water or oxygen in the root zone results in transpiration reduction as well as reduced crop yield.

In the Netherlands we use SWAP (Soil Water Atmosphere Plant) for simulating effects of hydrology on transpiration and agricultural production. Within SWAP we have now implemented several concepts for root water uptake including two published different versions of so-called microscopic root water uptake.

These microscopic concepts consider water fluxes in a soil column around roots towards and through the roots which results in a water flux to the leaves considering hydraulic characteristics of both soil and plants. Water flow in the soil towards the root is determined by a gradient in the matric flux potential, and the flux into the root and towards the leaves is determined by the hydraulic conductivity of the root wall and hydraulic conductance of the path root-stem-leaves and the gradient in pressure heads of the root system and leaves. Transpiration reduction occurs as a function of the leaf water potential.

For all units of the Dutch Soil Physical Units Map simulations were peformed with these microscopic root water uptake concepts and the results were compared with the simulation results using the more traditional macroscopic root water uptake concept of Feddes. We found that the microscopic concepts both produced more reliable results than the traditional concept. In our presentation we will explain the concepts, show the differences in simulated crop yields, discuss the sensitivity of the microscopic models for the choice of their input parameters, and elaborate on which concepts we would propose for future studies to evaluate the effects of the soil-water system on crop production.

How to cite: Mulder, M., Heinen, M., and Hack-ten Broeke, M.: Implementing microscopic water uptake in soil-plant interaction modelling for assessing effects on crop growth, EGU General Assembly 2023, Vienna, Austria, 23–28 Apr 2023, EGU23-1552, https://doi.org/10.5194/egusphere-egu23-1552, 2023.

Rice is often grown as multiple crops in one year, with reduced tillage upland cropping following flooded cropping gaining prominence due to water use, soil degradation and labour demands.  This study explored whether a deep rather than shallow rooting rice cultivar grown in a flooded cropping cycle, benefited deeper root growth of follow-on rice in an upland, reduced tillage cropping cycle. In a greenhouse study, a simulated flooded paddy was planted with deep (Black Gora) and shallow (IR64) root cultivars and a plant-free control.  Artificial plough pans were made in between the topsoil and subsoil to form different treatments with no plough pan (0.35 MPa), soft plough pan (1.03 MPa) and hard plough pan (1.70 MPa). After harvest of this ‘first season’ rice, the soil was drained and undisturbed to simulate zero-tillage upland, with a photoperiod insensitive variety (BRRI Dhan 28) planted. Root length, root surface area, root volume, root diameter, number of root tips and branches were measured.  The number of roots penetrating the plough pan was measured from camera images and X-ray CT. The overall root length density (RLD), root surface area, number of root tips and branching of BRRI Dhan 28 did not vary between plough pan and no plough pan treatments.  Compared to the shallow rooting rice genotype,  the deep rooting rice genotype as a ‘first season’ crop promoted 19 % greater RLD, 34 % greater surface area and 29 % more branching of BRRI Dhan 28 in the subsoil. In the topsoil, however, BRRI Dhan 28 had 28 % greater RLD, 35 % greater surface area and 43 % more branching for the shallow rather deep rooting genotype planted in the ‘first season’.  The results suggest that rice cultivar selection for a paddy cycle affects root growth of a follow-on rice crop grown under no-till, with benefits to subsoil access from deep rooting cultivars and topsoil proliferation for shallow rooting cultivars.

How to cite: Islam, M. D., Price, A. H., and Hallett, P. D.: Contrasting biopore production by deep and shallow rooting rice cultivars in compacted paddy soils and the impacts on subsequent rice growth, EGU General Assembly 2023, Vienna, Austria, 23–28 Apr 2023, EGU23-1875, https://doi.org/10.5194/egusphere-egu23-1875, 2023.

EGU23-2042 | Orals | HS8.3.2

Advanced techniques for the study of plant interactions with Fungi and other microorganisms in early environments 

Christine Strullu-Derrien, Alan R.T. Spencer, Ria Mitchell, and Paul Kenrick

Microorganisms are key to our understanding of early life on land, especially in terms of below-ground processes. In the fossil record, exceptionally preserved silicified systems are the best sources to document the diversity of Fungi and microorganisms and the roles that they played, including their interactions with plants. Continued advances in technology allow us to document these in unprecedent detail at sites like the Rhynie cherts (Scotland, UK), dating to 407 Ma, and the Grand Croix chert (Massif Central, France), dating to ca 307 ̶ 303 Ma. Techniques we used include Confocal Laser Scanning Microscopy (CLSM) and Laser-Induced Breakdown Spectroscopy (LIBS)-based imaging, among others.

In the Rhynie cherts, plant-fungal associations and glomeromycotan spores have been observed as well as other diverse microorganisms colonizing the substrate. In modern vascular plants, endomycorrhizas are typically associated with roots, but most of the vascular plants at Rhynie were rootless, and endomycorrhizas developed in aerial axes. This is probably the plesiomorphic state for land plants. Data from Grand Croix demonstrate that by the end of the Carboniferous, endomycorrhizas had become associated with the root systems of trees. The evolution of the endomycorrhizal symbioses during the Paleozoic, from early plants to trees, is associated with important changes in the nature of the symbiosis, the structure of the soil, and changes in level of carbon dioxide gas in the atmosphere. Using a combination of techniques to decipher the nature of the organisms and their interactions is as an area of developing interest, particularly in the context of recent work on modern relatives.


How to cite: Strullu-Derrien, C., Spencer, A. R. T., Mitchell, R., and Kenrick, P.: Advanced techniques for the study of plant interactions with Fungi and other microorganisms in early environments, EGU General Assembly 2023, Vienna, Austria, 23–28 Apr 2023, EGU23-2042, https://doi.org/10.5194/egusphere-egu23-2042, 2023.

EGU23-2121 | ECS | Posters on site | HS8.3.2

Influence of root systems of different tree species and their exudates in formation of properties of forest soils 

Karolina Staszel-Szlachta, Ewa Błońska, and Jarosław Lasota

The root systems of trees, through the production of biomass and through their exudates, affect the properties of forest soils. There is a lack of basic knowledge about the influence of root systems of basic forest-forming tree species on the properties of forest soils. The purpose of our study was to determine the influence of the roots of six tree species and their root exudates on shaping the physicochemical and biochemical properties of soils. The study included deciduous tree species (ash, hornbeam, oak, beech) and coniferous trees (pine, European larch).  The survey was conducted in 2022 in the Miechow Forest District (southern Poland). Each tree species was represented by 5 study plots. The research included analysis of root systems and analysis of surface properties of soil horizons. Exudates were collected using a culture-based cuvette system. Additionally, we determined the morphology, and production of fine roots.  Basic physicochemical properties and the activity of enzymes involved in the cycling of C, N, and P were determined in the soil samples. The tree species studied have different morphological characteristics of roots and differences in the exudates secreted. In addition, the studied species differ in the rate of growth of root systems.  Significantly higher amounts of secreted carbon from roots were recorded in ash, which had a positive effect on the increase in enzymatic activity.  The amount of C from exudates showed a positive correlation with CB, BG and PH activity. The activity of the enzymes studied also correlated with the morphological characteristics of the roots. Root systems also influenced the formation of basic physicochemical properties such as C and N content.

How to cite: Staszel-Szlachta, K., Błońska, E., and Lasota, J.: Influence of root systems of different tree species and their exudates in formation of properties of forest soils, EGU General Assembly 2023, Vienna, Austria, 23–28 Apr 2023, EGU23-2121, https://doi.org/10.5194/egusphere-egu23-2121, 2023.

EGU23-2825 | ECS | Posters on site | HS8.3.2

Root shrinkage and its mechanisms: why context matter 

Sara Di Bert, Andrea Carminati, Patrick Duddek, Pascal Benard, and Konstantina Papadopoulou

Modeling plant responses to drought over short-to long-term is crucial under rising global warming threats. Roots form the critical gateway between a plant and its water sources in the soil, yet their connection with the soil is still poorly understood. As the soil dries, roots shrink gradually disconnecting from the surrounding soil. This progressive reduction of root-soil contact interrupts the liquid-phase continuity and limits the water movement. The importance of the loss of contact between soil and roots depends on the water potential at which this occurs. If roots lose contact at potential close or beyond the wilting point, when the low soil hydraulic conductivity is already limiting, the loss of contact might not be as important. But if this occurs in still relatively wet conditions, it might trigger an earlier limitation of root water uptake.

Currently, it is known at what water potential roots lose contact with the soil. Furthermore, we expect that this critical water potential is not unique, but it depends on soil properties, soil particle size and porosity, and root properties, such as root hair density and mucilage production.

Here we present an analysis to identify and quantify the forces that bind the soil to the root for different soil textures. We estimate the adhesive forces that hold roots in contact with the soil and that counteract root shrinkage caused by decreasing water potential and cells losing turgor. The ingredients of our analysis are: root hairs, capillary forces and mucilage elastic properties. Thresholds of gap formation at the root-soil interface are identified for varying soil particle size and porosity and for varying root hair density and mucilage elastic properties.

This analysis shows that root-soil contact dynamics do not depend only on the root cell turgor loss point, but also on soil properties, and helps to identify the mechanisms impacting the hydraulic continuity across the root-soil interface.

How to cite: Di Bert, S., Carminati, A., Duddek, P., Benard, P., and Papadopoulou, K.: Root shrinkage and its mechanisms: why context matter, EGU General Assembly 2023, Vienna, Austria, 23–28 Apr 2023, EGU23-2825, https://doi.org/10.5194/egusphere-egu23-2825, 2023.

EGU23-3484 | Orals | HS8.3.2

A mechanistic derivation of 'alpha-omega' root water uptake models. 

Jan Vanderborght, Andrea Schnepf, Daniel Leitner, Valentin Couvreur, and Mathieu Javaux

To describe plant transpiration in drying soil, several models use ‘α-stress functions’, which represent the ratio of the maximal possible water uptake when the plant reaches the wilting point to the transpiration demand or potential transpiration, as a function of the soil water potential. Water potentials vary within the root zone, and the plant ‘senses’ with its root system an average root zone water potential and redistributes the uptake from drier to wetter zones in the root zone. This redistribution or root water uptake compensation is accounted for using an average stress index, ω, which is a weighted average of the local stress indices α at different depths in the root zone, and a critical stress index ωc (Jarvis, 2011; Simunek & Hopmans, 2009). When ω > ωc, root water uptake is equal to the potential root water uptake or the energy limited potential transpiration. The α-ω approach refers to a mechanistic description of water fluxes in the soil-root system but remains semi-empirical missing a direct link with soil and, especially, root hydraulic properties. In this contribution, we derive the α-ω approach starting from a mechanistic description of water flow in a hydraulic root architecture assuming that resistance to flow in the soil towards the soil-root interface can be neglected. In a second step, we include the non-linear soil resistance.

For relatively wet soil conditions and neglecting the soil resistance, root water uptake functions can be cast in a form that is identical to the α-ω approach that was derived by Jarvis (2011), but for opposite conditions, i.e., Jarvis neglected the root resistance compared to soil resistance. Following Jarvis, the α-function should be interpreted as the ratio of the maximal possible uptake by the root system for a certain soil water potential to the maximal possible uptake by the system when the soil is fully saturated, which differs from its common interpretation. This means that the α-function is just a linear function that ranges from zero when the soil water potential is equal to the wilting point to 1 when the soil water potential is zero and that it is independent of the transpiration rate. Another outcome is that the critical stress level ωc is inverse proportional to the hydraulic conductance of the root system and is not a constant but a variable parameter that is proportional to the transpiration rate. For dry soil conditions, when soil resistance is important, we find that α and ω are non-linear functions of the soil water potential. Using α and ω functions that are derived from soil and root hydraulic properties, the uptake distributions can be calculated directly from the soil water potentials without solving a non-linear equation with iterations to derive water potentials in the plant. But, this approach is based on a simplification, which requires further testing.

Jarvis, N. J. (2011). Hydrology and Earth System Sciences, 15(11), 3431-3446. doi:10.5194/hess-15-3431-2011

Simunek, J., & Hopmans, J. W. (2009). Ecological Modelling, 220(4), 505-521. doi:10.1016/j.ecolmodel.2008.11.004

How to cite: Vanderborght, J., Schnepf, A., Leitner, D., Couvreur, V., and Javaux, M.: A mechanistic derivation of 'alpha-omega' root water uptake models., EGU General Assembly 2023, Vienna, Austria, 23–28 Apr 2023, EGU23-3484, https://doi.org/10.5194/egusphere-egu23-3484, 2023.

EGU23-4425 | Orals | HS8.3.2

Benchmarking of Functional-Structural Root Architecture Models 

Andrea Schnepf, Christopher K. Black, Valentin Couvreur, Benjamin M. Delory, Claude Doussan, Adrien Heymans, Mathieu Javaux, Deepanshu Khare, Axelle Koch, Timo Koch, Christian W. Kuppe, Magdalena Landl, Daniel Leitner, Guillaume Lobet, Félicien Meunier, Johannes Postma, Ernst Schäfer, Tobias Selzner, Jan Vanderborght, and Harry Vereecken

Schnepf et al., (2020) defined benchmark scenarios for root growth models, soil water flow models, root water flow models, and for water flow in the coupled soil-root system. All benchmarks and corresponding reference solutions were published in the form of Jupyter Notebooks on the GitHub repository https://github.com/RSAbenchmarks/collaborative-comparison. Several groups of functional-structural model developers have joined this benchmarking activity and provided the results of their individual implementations of the different scenarios.

The focus of this contribution is on water uptake from a drying soil by a static root architecture. The numerical solutions of the different participating simulators as compared to the provided reference solution.

The participating simulators are CPlantBox, DuMux, R-SWMS, OpenSimRoot and SRI. They have in common that they simulate water flow in the 3D soil domain, water flow inside the root system that is represented as a mathematical tree graph, and the coupling between the two domains in form of a volumetric sink term that describes the transfer of water between the two domains. The simulators differ in the numerical schemes used for solving the water flow equations in roots and soil domains, as well as in the way the sink term is formulated, in particular in the way the possibly increased rhizosphere resistance to water flow is accounted for. 

The results to the water flow in soil benchmarks show how the different simulators perform against the analytical solution to a problem of infiltration into an initially dry soil, as well as a problem of evaporation from initially moist soil. All of the simulators could accurately predict the infiltration front in different soil types as well as the actual evaporation curves.

The coupled problem of root water uptake by a static root architecture from an initially already dry soil posed a bigger challenge to the different simulators and revealed some diversity between the different solutions. The Benchmark with an initially rather dry soil defined a potential transpiration that immediately induced water stress of the plant. The simulators had to simulate the consequent rhizosphere drying and associated increase in rhizosphere resistance. All of the soil simulators smoothed the gradients in the rhizosphere at the soil grid size such that root water uptake was significantly overestimated unless the rhizosphere resistance was explicitly accounted for in the root water uptake model. As a result, all simulators came close to the reference solution (that itself is a numerical solution, see Schnepf et al. 2020 for details). 

In this study, we showed that all simulators are generally able to solve the benchmark problems but minor differences occur amongst the simulators when simulating different soil types. Benchmarking led to model improvements and helped interpret model results in a more informed way. The availability of “reference solutions“ made modellers aware of the range of validity of their numerical solution and encouraged them to improve either their numerical solution or to introduce new processes Future efforts may aim to extend the benchmarks from water flow to further processes, such as solute transport or rhizodeposition.


Schnepf et al., 2020, Front. Plant Sci. 11

How to cite: Schnepf, A., Black, C. K., Couvreur, V., Delory, B. M., Doussan, C., Heymans, A., Javaux, M., Khare, D., Koch, A., Koch, T., Kuppe, C. W., Landl, M., Leitner, D., Lobet, G., Meunier, F., Postma, J., Schäfer, E., Selzner, T., Vanderborght, J., and Vereecken, H.: Benchmarking of Functional-Structural Root Architecture Models, EGU General Assembly 2023, Vienna, Austria, 23–28 Apr 2023, EGU23-4425, https://doi.org/10.5194/egusphere-egu23-4425, 2023.

EGU23-4637 | ECS | Orals | HS8.3.2

Relating Soil-Root Hydraulic Resistance Variation to Stomatal Regulation in Soil-Plant Water Transport Modeling 

Guoqing Lei, Wenzhi Zeng, Chang Ao, Liming Dong, Shenzhou Liu, and Zhipeng Ren

Soil-root hydraulic resistance variation and stomatal regulation are two critical hydrophysiological responses of plants to drought stress; however, few studies have been developed to quantify their interactions. To fill this gap, we developed a soil-plant hydraulic model (SR-HRV) that attempts to characterize the effects of stomatal regulation and three universal soil-root hydraulic resistance variations, i.e., root aquaporins promotion (AQU), apoplastic path damage (APD), and root-soil contact loosening (CONTACT). The sensitive parameters of the SR-HRV model were analyzed and optimized based on a field experiment with sunflower plants (Helianthus annuus L.). Several simulation scenarios were designed to clarify the individual and interactive effects of soil-root hydraulic resistance variations for plants with different stomatal sensitivities. Results show that the sensitivity of simulated stomatal conductance and soil water content response to stomatal regulation parameters, especially to abscisic acid-related parameters, are more active than to soil-root hydraulic resistance variation parameters. But as the soil dries, the sensitivities to APD and CONTACT parameters are rapidly increased. The simulation demonstrates that AQP alleviates the leaf water potential drop-down and maintains relatively high root water absorption of the plant when it is in mild drought conditions, while CONTACT and APD respectively restrict the water flux and drought signal responses with continuous soil dehydration. Moreover, the AQP effects are more pronounced but the effects of APD and CONTACT would be restricted for plants with higher stomatal sensitivity to drought signals. These simulation results imply the diverse response strategies of plants to drought, the collaborations between stomatal regulation and soil-root hydraulic resistance variations should be considered in soil-plant water transport modeling.


How to cite: Lei, G., Zeng, W., Ao, C., Dong, L., Liu, S., and Ren, Z.: Relating Soil-Root Hydraulic Resistance Variation to Stomatal Regulation in Soil-Plant Water Transport Modeling, EGU General Assembly 2023, Vienna, Austria, 23–28 Apr 2023, EGU23-4637, https://doi.org/10.5194/egusphere-egu23-4637, 2023.

Various rhizosphere traits have been explored as plant adaptations to modulate the soil-root interface to acquire resources and to enhance plant water status under stress conditions. Mucilage exudation has been suggested to enable water uptake during soil drying. This hypothesis was tested using artificial root analogy due to technical limitations and the lack of suitable plant materials. Here, we tested whether mucilage exudation facilitates water uptake in intact cowpeas (Vigna unguiculata L.) plants growing in loamy soil during drying. We used a root pressure chamber system to measure the gradients in water potential at the root surface as well as the relationship between transpiration rate and leaf xylem water potential in two genotypes with contrasting mucilage production. Higher mucilage exudation attenuated the drop in matric potential at the root surface. In contrast, the gradients in water potential were much steeper in cowpea with less mucilage production. The attenuation of matric potential at the root surface resulted in a linear relationship between transpiration rate and leaf xylem water potential. We conclude that mucilage exudation maintains the hydraulic continuity between roots and soil and decelerates water potential dissipation near the root surface during soil drying. Our findings provide the first in vivo evidence on the role of mucilage on root water uptake.

How to cite: Abdalla, M. and Ahmed, M.: Mucilage enables water uptake in cowpeas (Vigna unguiculata L.) under soil water deficit, EGU General Assembly 2023, Vienna, Austria, 23–28 Apr 2023, EGU23-4892, https://doi.org/10.5194/egusphere-egu23-4892, 2023.

EGU23-5662 | ECS | Posters virtual | HS8.3.2

Impacts of technically modified plant pits on water balance dynamics and tree vitality in urban environments 

Ines A. Nofz, Joscha N. Becker, and Annette Eschenbach

Trees as essential components of green urban structures are of crucial importance for the regulation of the urban climate and human wellbeing. Despite this, the currently rising demand for living space and infrastructure causes an increase in the share of sealed and compacted soils. These trends directly affect soil-plant interactions in urban environments. The synergy of the increasing land use pressure and changing climatic conditions worsen the site and growth conditions and thus the vitality for young and mature trees. A possible adaptation strategy is the transformation of plant pits into water reservoirs combining the discharge of excess water with impermeable sole materials and substrates that optimise the water conductivity and storage capacity. The corresponding aim of this study is the quantification of the effects of the water balance dynamic in the rooting zone on the vitality of young trees at highly sealed sites in the city of Hamburg. The two main questions are 1) Do technically modified plant pits reduce summerly drought stress inside the rooting zone and thus improve the root water uptake and tree vitality?, and 2) Does excess water after high rainfall limit the gas exchange and thus the root growth? To answer these questions, we selected two different sites, one residential area and one pedestrian zone. A total of 13 tree planting pits, including 5 technically modified and 8 generally constructed ones, with two types of substrates and water discharge, are equipped with TDR- and water tension sensors for a continuous monitoring of the soil water balance and O2 and CO2 sensors and tubes for monitoring the gas household. Stomatal resistance, chlorophyll content and fluorescence as well as Δ13C isotope measurements are combined with branch and trunk growth measurements and a tree appraisal to investigate the tree vitality. The comparative data analysis will be used for evaluating the different planting pit variants to give development as well as dimensioning recommendations for prospective planting pit constructions, improving the soil-plant interaction.

How to cite: Nofz, I. A., Becker, J. N., and Eschenbach, A.: Impacts of technically modified plant pits on water balance dynamics and tree vitality in urban environments, EGU General Assembly 2023, Vienna, Austria, 23–28 Apr 2023, EGU23-5662, https://doi.org/10.5194/egusphere-egu23-5662, 2023.

EGU23-6051 | ECS | Posters on site | HS8.3.2

Soil desilication affects the nutrient and silicon status of cassava in South Kivu, DRC. 

Fidèle Barhebwa Balangaliza, Bernard Vanlauwe, Zimin Li, and Bruno Delvaux

Cassava (Manihot esculenta) is widely cropped in many tropical countries. It can be planted and harvested throughout the year making it a major crop for food production and safety. Surplus production can generate income, helping to improve livelihoods. Yet, in DRC, the cassava value chain is poorly developed and its production faces many threats as it lacks support services at almost all levels, although R&D organizations are involved at farm level in production, training, soil improvement and disease control. Though nutrient supply increases productivity, cassava is said to thrive on poor soils. Soil infertility is therefore a major constraint in most cassava growing areas.

Here we highlight the relationship between soil weathering stage and nutrient status of cassava plants in three agroecological zones in South Kivu, DRC. Zones (Z) 1 and 2 encompass ferrallitic soils derived from, respectively, old basalt and gneiss in highlands around Bukavu. Zone 3 includes a variety of soils derived from lacustrine deposits in the Uvira plain. The soils key out as Ferralsol (Z1), Acrisol (Z2), Cambisol and Fluvisol (Z3). Through a survey of 720 households, we identified farms with similar management and selected 120 plots (40/zone) for topsoil-foliar sampling.

In Z1 and Z2, the soils are poor in silt as their texture ranges from sandy clay to fine clay. The soils in Z3 are lighter: loamy sand to sandy clay loam. Our data confirm that the Z1-2 soils have reached an advanced degree of weathering, with weathering indices (TRB, Si/(Al+Fe), CIA, BDI, Parker Index) typical for the ferrallitic domain. In contrast, the soils in Z3 are moderately weathered with mineral reserves 10 times higher. Desilication is strong in Z1-2, but particularly in Z1 where gibbsite occurs with kaolinite. In contrast, Z3 soils contain weatherable minerals (mica, feldspar, plagioclase). The contents of leaf Ca, Mg and K are higher in Z3 than in Z1-2 while Ca depletion correlates with a relative excess of K, suggesting a Ca-K antagonism in cassava. Strong desilication occurs in Z1 soils where bioavailable silicon is extremely low. Yet, we could extract plant phytoliths in all sites, with varying coatings of aluminum, which thus seems to be taken up by cassava.


How to cite: Barhebwa Balangaliza, F., Vanlauwe, B., Li, Z., and Delvaux, B.: Soil desilication affects the nutrient and silicon status of cassava in South Kivu, DRC., EGU General Assembly 2023, Vienna, Austria, 23–28 Apr 2023, EGU23-6051, https://doi.org/10.5194/egusphere-egu23-6051, 2023.

EGU23-6120 | Posters on site | HS8.3.2

Pore-scale simulation of mucilage drainage using phase field method. 

Omid Esmaeelipoor Jahromi, Ravi. A Patel, Johan Alexander Huisman, and Jan Vanderborght

Rhizosphere differs from bulk soil due to the presence of root mucilage, which affects physical, chemical, and microbial processes. It is well known that the rhizosphere responds slowly to water potential changes, which buffers changes in water content and helps keep the rhizosphere wetter than bulk soil during drying. Mucilage can affect solute transport and gas diffusion by affecting the distribution of liquid and gas phases. Despite increased recognition of the importance of mucilage, there still is a lack of models that describe the connectivity between different phases in the pore space of the rhizosphere during wetting and drying. The main challenge for model development is the complex concentration-dependent behaviour of mucilage. At low concentrations, mucilage is more like a liquid, whereas at higher concentrations, dry mucilage becomes a solid. In between, a viscoelastic state is observed where mucilage can be considered as a hydrogel.

In previous work, we have developed a model based on a lattice spring method (LSM). This model was able to simulate the distribution of mucilage in the dry state at the pore scale. However, for wetter states, it is necessary to consider additional physical phenomena like surface tension, contact angle and viscoelasticity. In this study, we therefore aim to develop a Lattice-Boltzmann simulation framework to simulate two phase flow involving mucilage. To capture the interface between the two phases, a phase-field method will be used for interface tracking as this approach has gained considerable attention in recent years. The simulations will proceed as follows. We first assign the properties of a Newtonian fluid to the mixture of water and mucilage and calculate the equilibrium distribution of the liquid phase (mixture of water and mucilage) and gas in a simple pore geometry. Then, the water content will be gradually decreased, which will lead to an increase of mucilage concentration. This will in turn affect the viscosity, surface tension and contact angle, which will result in the emergence of the required viscoelastic behaviour of the mixture. For each of the water contents, the distribution of liquid (or hydrogel) and gas phases will be calculated.

The newly developed model will provide us with new perspectives on hydrodynamic processes within the pore space of the rhizosphere. In addition, the model will help to better understand processes that strongly depend on hydraulic dynamics in the rhizosphere, such as solute transport, root penetration resistance, rhizosheath formation, and microbial activity.

How to cite: Esmaeelipoor Jahromi, O., Patel, R. A., Huisman, J. A., and Vanderborght, J.: Pore-scale simulation of mucilage drainage using phase field method., EGU General Assembly 2023, Vienna, Austria, 23–28 Apr 2023, EGU23-6120, https://doi.org/10.5194/egusphere-egu23-6120, 2023.

EGU23-6447 | ECS | Posters virtual | HS8.3.2

Alteration of soil biophysical properties after decomposition of contrasting root systems 

David Boldrin, Kenneth W. Loades, Jonathan A. Knappett, Anthony K. Leung, and Glyn A. Bengough

Background: Increased water infiltration in the presence of vegetation has been reported in the literature for both woody and herbaceous plants. However, there is a lack of experimental data on macropores development after root decomposition, and consequent alteration of soil biophysical properties.

Methods: To test the effect of contrasting root systems on saturated hydraulic conductivity [Ks], individual plants of Daucus carota [F-DC] (Forb; coarse taproot with few small lateral roots); Deschampsia cespitosa [G-DC] (Grass; fibrous root system), Lotus corniculatus [L-LC] (Legume; thin taproot with several lateral roots) were grown in columns (50 mm diameter; 315 mm height) with sandy loam soil packed at 1.4 Mg/m3. Following 7-month plant-establishment, the columns were split into five sections (60 mm height each). Ks was tested in each section (i.e., down soil depth) using a constant-head permeameter. Fallow soil was also tested as control. Following the Ks tests, column sections (i.e., soil cores) were buried in soil and left for decomposition in a controlled environment. After 7-month decomposition, sections were excavated and re-tested for Ks. To measure the biophysical properties of soil in the root-channels, the same three species were also grown in the top-half of a soil column (300 mm height; 50 mm width; 1.2 Mg/m3) longitudinally divided by a 40-μm nylon-mesh. The columns were maintained at a 15-degree slope to facilitate root growth at the soil-mesh interface. Following plant establishment (5 months), plants were killed by herbicide. The soil columns (rooted and control fallow) were buried in soil and left for decomposition in a controlled environment for 7 months. After the decomposition period, the soil columns were split, and the mesh was removed to expose the developed root-channels. The soil in the exposed root-channels was tested for water sorptivity, water repellency, water retention, soil stability in water, hardness and elasticity.

Results: Ks after plant establishment did not differ notably from that of control soil. In contrast, an abrupt increase in Ks (up to 80-times in F-DC) was measured after decomposition in the vegetated soils (e.g., from 2.04e-6 ± 9.20e-7 to 1.48e-4 ± 3.30e-5 in F-DC at 3 – 63 mm depth). The increase in Ks in G-DC and L-LC was smaller (up to 20-times) compared to F-DC. No Ks change was observed in the control soil. Soil surrounding the root-channels showed greater stability and plant available water. However, we observed smaller sorptivity and greater water repellency in soil surrounding the root-channels of F-DC and G-DC, respectively.

Conclusions: Biophysical alteration of soil after root decomposition depends on plant species. Our findings show that it is possible to engineer soil biophysical properties and bio-pores using contrasting herbaceous species.


How to cite: Boldrin, D., Loades, K. W., Knappett, J. A., Leung, A. K., and Bengough, G. A.: Alteration of soil biophysical properties after decomposition of contrasting root systems, EGU General Assembly 2023, Vienna, Austria, 23–28 Apr 2023, EGU23-6447, https://doi.org/10.5194/egusphere-egu23-6447, 2023.

EGU23-7548 | ECS | Posters on site | HS8.3.2

Effect of plant mucilage on retention and flow of water in soils with different textures 

Bahareh Hosseini, Anders Kaestner, and Mohsen Zarebanadkouki

Previous studies showed that mucilage extracted from chia seed enhanced retention and flow of water in dry conditions due to the intrinsic features of mucilage (increasing viscosity, water-holding capacity, and decreasing surface tension of the liquid phase). To date, there is limited information about the effect of mucilage from plant roots on the hydraulic properties of soils of different textures.

In this contribution, we aimed to evaluate the effect of plant mucilage in different contents (mucilage extracted from maize roots) on the retention and flow of water in soils with contrasting textures (coarse and fine-textured soils). To this end, soils were mixed with mucilage at different contents (0, 2.5, 5, 7.5 mg dry mucilage per gr dry soil) and were packed in aluminum containers (diameters of 1 cm and height of 8 cm) as follows: the control sandy soil (the content of zero) was packed in the first 4 cm of containers followed by a 1 cm layer of treated soils with mucilage. These containers were equipped with porous plates at the bottom allowing us to drain soil from the bottom by applying suction. In the case of fine-textured soils, a 1 cm layer of treated soils with varying mucilage contents was first saturated with water and then placed on top of a 4 cm layer of dry soil inducing a big suction to dry treated soils. During soil drying, we used a time series neutron radiography technique to monitor soil water content redistribution. We used the profiles of water contents during soil drying with a combination of modeling of water flow within soils (the Richard equation) to inversely estimate the hydraulic properties of soils treated with different mucilage contents.

Our data showed that maize mucilage affects the soil’s hydraulic properties. On the one hand, mucilage exuded by maize roots increased the water-holding capacity of both soils. Mucilage also impacted the hydraulic conductivity of both soils. In general, it decreased soil hydraulic conductivity of soils at the near saturation range, but it prevented a big drop in soil hydraulic conductivity as the soil dried compared to a sharper decrease observed in the control soils. Our findings showed that both effects are mucilage content dependent and the magnitude of the effects is soil texture dependent.

How to cite: Hosseini, B., Kaestner, A., and Zarebanadkouki, M.: Effect of plant mucilage on retention and flow of water in soils with different textures, EGU General Assembly 2023, Vienna, Austria, 23–28 Apr 2023, EGU23-7548, https://doi.org/10.5194/egusphere-egu23-7548, 2023.

EGU23-7593 | ECS | Posters on site | HS8.3.2

Root water uptake in grasslands with different management 

Sven Westermann, Jan Bumberger, Martin Schädler, and Anke Hildebrandt

Grasslands are highly dynamic ecosystems which adapt to environmental factors such as climate, soil characteristics and anthropogenic management. Yet, the belowground reaction and adaptation of grassland communities to aboveground drivers are poorly understood. Therefore, we investigated differences in the temporal dynamics of root water uptake, its depth pattern and the evolution of plant available soil water storage between grassland of three distinct management types. Root water uptake in 6 depths up to 90 cm was estimated from diurnal fluctuations of soil water content during rain free periods. Soil moisture measurements were conducted on three replicates of (i) extensively and (ii) intensively managed grassland plots as well as (iii) extensive pasture plots at the Global Change Experimental Facility (GCEF) in Bad Lauchstädt (Central Germany). We found that the grassland vegetation takes up water in depths up to 70 cm during the vegetation period. But while reaching deeper, the total amount of extracted water decreased. The main water source at the beginning of the growing season and after each mowing was in the top 20 cm. However, after mowing, still some uptake in greater depths can be observed. Interestingly, the pastures showed the shallowest uptake profiles although they are not mown and despite their high biodiversity. Our results confirm that water uptake by growing grassland vegetation shifts to deeper soil layers when compensating for the accumulated atmospheric water deficit.

How to cite: Westermann, S., Bumberger, J., Schädler, M., and Hildebrandt, A.: Root water uptake in grasslands with different management, EGU General Assembly 2023, Vienna, Austria, 23–28 Apr 2023, EGU23-7593, https://doi.org/10.5194/egusphere-egu23-7593, 2023.

EGU23-7635 | ECS | Orals | HS8.3.2

The Effects of Soil Texture on Transpiration Losses During Droughts: A Field Study of Three Oak Forests in an Inner Alpine Valley of Switzerland 

Julian Schoch, Lorenz Walthert, Peter Lehmann, Pascal Unverricht, and Andrea Carminati

As safety mechanism during droughts, plants close their stomata to reduce transpiration losses and prevent excessively negative water potentials. Although the coordination between stomatal closure, xylem vulnerability and leaf traits has been extensively investigated, the role of soil hydraulic limitation remains elusive. Here, we test the hypothesis that stomatal closure is triggered by the loss of soil hydraulic conductivity in the root zone. As the soil hydraulic conductivity is a function of soil texture, we further hypothesize that stomatal closure, and more precisely the relation between stomatal conductance and leaf water potential, are soil texture dependent. An alternative hypothesis is that the shoot to root ratio adapts to the specific soil conditions, and it is lower in soils with low hydraulic conductivity. We compared three field sites in an inner alpine valley in Switzerland (yearly rainfall of 600 mm) with the same oak tree species (Quercus pubescens) and varying soil textures. We used the model of Carminati and Javaux (2020), which predicts that the decline in transpiration rate is controlled by the soil hydraulic conductivity, and, consequently, it is more abrupt in 1) coarse textured soils compared to fine textured soils and 2) in plants with high shoot to root ratio.

To test these working hypotheses, stem water status and soil matric potential were measured at various depths of three oak sites. The soil matric potentials were then linked to the hydraulic conductivity and soil water content using a new pedotransfer function (PTF) for forest soils, which overcomes the limits of existing PTFs that were trained for arable soils. A simple water balance model based on changes in water content (deduced from PTF and measured potentials) was used to calculate transpiration rates and was compared with sap flow measurements conducted on two trees per site. Leaf water potentials were estimated from dendrometers after calibration with pressure chamber measurements of leaves. The sap flow measurements correlate well with estimated transpiration rates (R2=0.7).

Comparisons between sites show a similar decrease in stomatal conductance at all three sites during drought, regardless of soil texture. Rather, our data suggest the trees hydraulically adapt to the local soil texture by adjusting their leaf area index and root length density to the local water demand and supply. In coarse-textured soils, oak had a low leaf area index, reducing their water demand, and high fine root length density, increasing their supply. In conclusion, our study suggests a hydraulic adaptation of trees to their local soil texture by adapting their “shoot to root ratio” as quantified here by leaf area index and root density.

How to cite: Schoch, J., Walthert, L., Lehmann, P., Unverricht, P., and Carminati, A.: The Effects of Soil Texture on Transpiration Losses During Droughts: A Field Study of Three Oak Forests in an Inner Alpine Valley of Switzerland, EGU General Assembly 2023, Vienna, Austria, 23–28 Apr 2023, EGU23-7635, https://doi.org/10.5194/egusphere-egu23-7635, 2023.

EGU23-8981 | Posters on site | HS8.3.2

The value of cross-disciplinary approaches for plant water uptake modelling 

Maren Dubbert, Valentin Couvreur, Angelika Kübert, Maire Holz, and Christiane Werner

In recent years, research interest in plant water uptake strategies has significantly grown in many disciplines such as hydrology, plant ecology and ecophysiology. Quantitative modelling approaches to estimate plant water uptake and the spatio-temporal dynamics significantly advanced from different disciplines across scales. Despite this progress, major limitations, i.e. to predict plant water uptake under drought or it´s impact at large-scales remain. These are less attributed to limitations in process understanding, but rather to a lack of implementation of cross-disciplinary insights in plant water uptake model structure.

The main goal of this presentation is to highlight how the 4 dominant model approaches, e.g. Feddes approach, hydrodynamic approach, optimality and statistical approaches, can be and have been used to create interdisciplinary hybrid models enabeling a holistic system understanding that e.g. embeds plant water uptake plasticity into a broader conceptual view of soil-plant feedbacks of water, nutrient and carbon cycling or reflects observed drought responses of plant-soil feedbacks and their dynamics under e.g. drought. Specifically, we provide examples of how integration of Bayesian and hydrodynamic approaches might overcome challenges in interpreting plant water uptake related to e.g. different travel and residence times of different plant water sources or trade-offs between root system optimization to forage for water and nutrients during different seasons and phenological stages.

How to cite: Dubbert, M., Couvreur, V., Kübert, A., Holz, M., and Werner, C.: The value of cross-disciplinary approaches for plant water uptake modelling, EGU General Assembly 2023, Vienna, Austria, 23–28 Apr 2023, EGU23-8981, https://doi.org/10.5194/egusphere-egu23-8981, 2023.

EGU23-9378 | ECS | Posters on site | HS8.3.2

Linking soil hydrologic and tree transpiration dynamics by dendrometer measurements 

Johanna Clara Metzger, Alexander Schütt, Joscha N. Becker, Christoph Reisdorff, and Annette Eschenbach

Trees in forests and urban environments are increasingly under pressure due to extended periods of drought in central Europe. At the same time, their transpiration performance is all the more important to counteract drought and heat. Defining drought itself, as well as trees’ physiological response strategies, can be closely linked to soil hydrological conditions. In a three-year field experiment with young trees of different species planted in different substrates (n = 3 substrates * 9 species * 5 repetitions = 135 trees) in Northern Germany, we found that soil hydraulic properties strongly affected tree vitality, and that the species’ reactions towards unfavorable conditions differed significantly. This might be due to species-specific transpiration regulation strategies under drought stress. In a second step, we now link tree diameter fluctuations, which have been shown to closely correlate with transpiration, to soil water conditions. To this end, subsets of trees were equipped with dendrometers – 15 trees of one species (Quercus cerris) in three different substrates (sand, planting substrate, and loamy silt) in the growing season of 2020, and 21 trees of seven different species (Amelanchier lamarkii, Carpinus betulus ‘Lucas’, Geleditsia traconathos ‘Skyline’, Liquidambar styraciflua, Ostrya carpinifolia, Quercus palustris, Tilia cordata ‘Greenspire’) in sand substrate in the growing season of 2021. The dendrometer measurements were partly combined with soil water tension measurements (2020: n=6, 2021: n=10). By comparing statistical characteristics of the time series, we want to (1) link soil water and transpiration dynamics and (2) differentiate this link for different substrates and species. Such, tree stem diameter fluctuations, coupling soil conditions and physiological properties, might provide insight into the effect of tree strategic responses to soil drought.

How to cite: Metzger, J. C., Schütt, A., Becker, J. N., Reisdorff, C., and Eschenbach, A.: Linking soil hydrologic and tree transpiration dynamics by dendrometer measurements, EGU General Assembly 2023, Vienna, Austria, 23–28 Apr 2023, EGU23-9378, https://doi.org/10.5194/egusphere-egu23-9378, 2023.

EGU23-9846 | ECS | Orals | HS8.3.2

Coupled effects of soil and atmospheric drying on soil-plant hydraulics of sorghum 

Anna M. Sauer, Mohanned Abdalla, Fabian J. P. Wankmüller, and Mutez A. Ahmed

Transpiration response of plants during both soil drying and increasing vapor pressure deficit (VPD) have been thoroughly studied separately. However, the interactive effects of both on soil-plant hydraulics remain largely unknown. In this study, we tested the combined effects of soil and atmospheric drying on soil-plant hydraulics of sorghum.

Sorghum plants were grown in sandy soil under well-watered conditions with a daily VPD increment, increasing in five steps from 0.5 to 3.7 kPa. After 30 days, the soil was dried over five days. We measured transpiration rate (E), soil water content (θ), soil and leaf water potential (ψsoil, ψleaf) both under wet soil and during soil drying. A soil-plant hydraulic model was used to reproduce the data and provide further insight to disentangle soil and atmospheric effects.

Both soil drying and VPD affected the relation between transpiration rate and leaf water potential. In wet soil conditions, the E (ψleaf-x) relation was linear even at high VPD. During soil drying, this relation was linear in relatively low VPD conditions (0.5 – 2.5 kPa) but exhibited a non-linear relation under relatively high VPD (2.5 – 3.7 kPa). This response was also reflected in a breakpoint of soil-plant conductance at around 2.5 kPa VPD, resulting in a decrease in transpiration. 

We conclude that decreasing soil water status has a stronger impact on soil-plant conductance and water uptake than increasing VPD. Furthermore, the modeling revealed the importance of understanding how soil parameters are changed by the presence of plants, especially during soil drying. We suggest that for a holistic understanding of plant response to drought, more emphasis would need to be given to the interactions between VPD and soil drying, as the effects of VPD become increasingly important with soil drying.

How to cite: Sauer, A. M., Abdalla, M., Wankmüller, F. J. P., and Ahmed, M. A.: Coupled effects of soil and atmospheric drying on soil-plant hydraulics of sorghum, EGU General Assembly 2023, Vienna, Austria, 23–28 Apr 2023, EGU23-9846, https://doi.org/10.5194/egusphere-egu23-9846, 2023.

EGU23-10161 | Orals | HS8.3.2

A root hydraulic properties database: the link between experimental data and functional-structural models 

Juan Baca Cabrera, Jan Vanderborght, and Guillaume Lobet

Root water uptake is a central component in the modulation of water transport in the soil-plant-atmosphere continuum. The mechanistic description of this process, based on root hydraulics, is needed for improving predictions of water fluxes at plant, field or regional scales, and for increasing our understanding of the environmental conditions and vegetation properties affecting it. Functional-structural models can be used for this purpose, but they depend on the availability of accurate data on root hydraulic properties for their parametrization. 

Here, we present an open access root hydraulic properties database obtained from an extensive literature review of more than 200 studies published between 1973–2022. This includes measurements of the radial conductivity and the axial conductance of root segments and individual roots, as well as of the resulting conductance of the whole root system for multiple species, plant functional types (PFT’s) and experimental treatments. To our knowledge, this is the most extensive root hydraulic properties database that has been compiled.

The database shows a very large range of variation in reported root hydraulic properties, which cannot be explained by systematic differences among PFT’s or species, alone, but rather by factors such as root system age, experimental treatments or the driving force used for measurement (hydrostatic or osmotic). Based on these observations, we used the functional-structural model CPlantBox to explore the relationship between root system age and whole root system conductance in more detail, using crop species as an example. For this, both the data needed for model parametrization (hydraulic properties of root segments) and validation (root system conductance) were extracted from the database. The results indicate a decrease in the total conductance per unit root surface area at later stages of development, which could be associated with a larger proportion of less conductive old root tissues.

This analysis exemplifies the importance of the root hydraulic database in two fronts: (1) it serves as a link between experimental data and functional-structural models; and (2) it facilitates the mechanistic description of the factors affecting root hydraulic properties across species and under contrasting environmental conditions.

How to cite: Baca Cabrera, J., Vanderborght, J., and Lobet, G.: A root hydraulic properties database: the link between experimental data and functional-structural models, EGU General Assembly 2023, Vienna, Austria, 23–28 Apr 2023, EGU23-10161, https://doi.org/10.5194/egusphere-egu23-10161, 2023.

Climate, hydrology, and plant processes are three factors that are intrinsically linked to one another. Integration of dynamic vegetation and canopy level processes governed by leaf biochemical traits with the subsurface water flow will help us to make more reliable and actionable predictions in the context of climate change. The limitations of hydrological works that consider plants to be statistical components are highlighted by a number of hydrological studies.

This study aims to highlight how crucial it is to include plant and plant physiological processes as a significant and dynamic component when modeling hydrological processes. For this purpose, we demonstrate the impact of stomatal conductance, photosynthesis, and other biophysical traits on the soil water dynamics within the vadose zone under current and projected (in future) climate scenarios using a process-based crop growth model BioCro II which uses climate variables as its input. We compare our results with those obtained using HYDRUS 1-D, which is a state-of-art model that has a wide range of applications in agriculture and irrigation. HYDRUS 1-D is a model capable of simulating one-dimensional water, heat, and solute transport through an unsaturated porous media. We also discuss the merits of coupling these two models to address some of the future challenges. 

How to cite: Surendran, S. and Jaiswal, D.: Role of biophysical canopy traits on evapotranspiration and its impact on soil water dynamics within the vadose zone, EGU General Assembly 2023, Vienna, Austria, 23–28 Apr 2023, EGU23-10703, https://doi.org/10.5194/egusphere-egu23-10703, 2023.

EGU23-11398 | ECS | Posters on site | HS8.3.2

Preliminary results of container and substrate effect on yield characteristics of Scolymus hispanicus L. in soilless cultivation system 

Dimitris Papadimitriou, Ioannis Daliakopoulos, Ioannis Louloudakis, Ioannis Sabathianakis, and Thrassyvoulos Manios

During the last decades, there has been a growing demand for wild edible vegetable consumption which are considered a staple of the Mediterranean diet for their high nutritional value (Petropoulos et al., 2018). Although the Mediterranean landscape hosts more than twenty wild edible vegetable species (such as Crithmum maritimum, Cynara cardunculus and Taraxacum officinale) which could be commercially cultivated, the cultivation process has not been sufficiently studied (Chatzigianni et al., 2019; Corrêa et al., 2020; Papadimitriou et al., 2020). In this context, we examine the feasibility of soilless cultivation of the wild edible species Scolymus hispanicus L. (Asteraceae) in five substrates including perlite (PE), coir (CO), and three mixtures of perlite and coir at 3:1 (3P1C), 1:1 (1P1C) and 1:3 (1P3C) ratio, in two different containers (grow bag and pot container). Three S. hispanicus L. seedlings were transplanted per grow bag (24 L) and one seedling per plastic pot (8 L) resulting in 8 L of substrate for each plant and 12 plants per substrate. The plants were fertigated daily with a standard nutrient solution which was identical in all ten treatments of the experiment. Four months after transplant, yield characteristics of plants, including leaf number, leaf and tuberous root fresh weight [g] and rosette diameter [cm], were examined. Statistical analysis of the results demonstrates a significant increase in rosette diameter [cm], leaf and tuberous root fresh weight [g] in CO, 1P3C and 1P1C compared to those of 3P1C and PE substrates. Additionally, the use of grow bags significantly increased leaf number and leaf fresh weight [g] compared to those achieved with the use of pot containers, contrariwise pot significantly increased root fresh weight [g] compared to the growbag container. Based on these results, we conclude that an optimal hydroponic system should use mixture of Coir and Perlite substrate of 1:1 ratio in a grow bag container.

Reference

Chatzigianni, M., Ntatsi, G., Theodorou, M., Stamatakis, A., Livieratos, I., Rouphael, Y., Savvas, D., 2019. Functional Quality, Mineral Composition and Biomass Production in Hydroponic Spiny Chicory (Cichorium spinosum L.) Are Modulated Interactively by Ecotype, Salinity and Nitrogen Supply. Front. Plant Sci. 10, 1–14. https://doi.org/10.3389/fpls.2019.01040

Corrêa, R.C.G., Di Gioia, F., Ferreira, I.C.F.R., Petropoulos, S.A., 2020. Wild greens used in the Mediterranean diet, Second Edi. ed, The Mediterranean Diet. Elsevier Inc. https://doi.org/10.1016/b978-0-12-818649-7.00020-5

Papadimitriou, D., Kontaxakis, E., Daliakopoulos, I., Manios, T., Savvas, D., 2020. Effect of N:K Ratio and Electrical Conductivity of Nutrient Solution on Growth and Yield of Hydroponically Grown Golden Thistle (Scolymus hispanicus L.). Proceedings 30, 87. https://doi.org/10.3390/proceedings2019030087

Petropoulos, S.A., Karkanis, A., Martins, N., Ferreira, I.C.F.R., 2018. Edible halophytes of the Mediterranean basin: Potential candidates for novel food products. Trends Food Sci. Technol. 74, 69–84. https://doi.org/10.1016/j.tifs.2018.02.006

How to cite: Papadimitriou, D., Daliakopoulos, I., Louloudakis, I., Sabathianakis, I., and Manios, T.: Preliminary results of container and substrate effect on yield characteristics of Scolymus hispanicus L. in soilless cultivation system, EGU General Assembly 2023, Vienna, Austria, 23–28 Apr 2023, EGU23-11398, https://doi.org/10.5194/egusphere-egu23-11398, 2023.

EGU23-11622 | Posters on site | HS8.3.2

Effect of the fertiliser supply for the maize micro nutrient content depending on the part of the plants under long-term field experiment 

Árpád Illés, Csaba Bojtor, Adrienn Kakuszi-Széles, Éva Horváth, and János Nagy

The long-term experiment was carried out at the University of Debrecen, Institutes for Agricultural Research and Educational Farm, Debrecen Edcuational Farm and Landscape Research Institute (DTTI), Látókép Crop Production Experiment Site (47° 83, 030" N, 21° 82, 060" E, 111 m a.s.l.). The experimental area is an excellent site for field crop production, with suitable agrotechnical biological and soil conditions. The trial was established in 1983 by Prof. Dr. János Nagy and has been continued for 39 years with the same parameters, nutrient replenishment system, site, tillage and agrotechnology. The total area of the experiment is more than 1.3 ha, with 1248 plots. The climatic-meteorological conditions of the experimental area are continental and often extreme, with calcareous chernozem soil with a topsoil depth of 80-90 cm and a humus content of 2.71 Hu%. The pH of the soil is 5.76 (slightly acidic). The soil is less susceptible to acidification because the 80-90 cm deep calcareous layer is a good buffer against acidification. In terms of soil acidification, nearly 40 years of high-dosage nitrogen fertilization (300 kg/ha of active ingredient) in the experiment resulted in a pH decrease of only 0.6 units compared to the control.  For this study, nitrogen doses of 0-300 kg/ha were applied at 5 different levels, with a gradual increase in nitrogen and a constant high level of phosphorus and potassium. In a micronutrient uptake effect study of nitrogen fertilisation, it was found that the concentration of zinc, the primary essential micronutrient for maize, was significantly reduced in all crop parts by increasing nitrogen dosage compared to control values. The most significant of these effects was the reduction in stalk zinc concentration in the vegetative parts of the crop, which was at least 39% in all treatments, with the greatest reduction in treatment N4 at 18.61 mg/kg.  In the case of the generative parts of the plant, the zinc content of the grain yield decreased statistically in all treatments, with the greatest negative change in this case also in treatment N4, with a decrease of 39 % (9.14 mg/kg). The iron content responded positively to the increase in nitrogen fertilisation. An increasing trend was measured for all plant parts, which was significant in several cases. Significant increased iron accumulation was observed during the leaf analysis of maize under all fertiliser treatments, with the highest increase of 47 % under the treatment N5. Based on the correlation between copper content and nitrogen supply in plant parts, it was found that increasing nitrogen fertiliser treatments resulted in significant increased concentrations in both maize leaves and cobs, ranging from 5 to 56 % and 8 to 38 %, respectively. The values obtained from stem and grain yield analyses did not show significant changes in effect.

How to cite: Illés, Á., Bojtor, C., Kakuszi-Széles, A., Horváth, É., and Nagy, J.: Effect of the fertiliser supply for the maize micro nutrient content depending on the part of the plants under long-term field experiment, EGU General Assembly 2023, Vienna, Austria, 23–28 Apr 2023, EGU23-11622, https://doi.org/10.5194/egusphere-egu23-11622, 2023.

EGU23-11957 | ECS | Posters on site | HS8.3.2

Does mucilage governs rhizosheaths development under drying and wettingCycles? 

Riffat Rahim, Wulf Amelung, and Nina Siebers

Mucilage helps in rhizosheath formation. Rhizosheath is known as the soil attached to plant roots when excavated from the soil after gentle shaking. However, very little is known about mucilage role in the development of rhizosheath under various alternate drying and wetting cycles. This study is design to test the formation of rhizosheath by inducing alternate drying and wetting cycles in the presence of chia seed mucilage. For this experiments, we have used sterilized and unsterilized soils with different clay contents. Sterilized soils are often used in experiments related to soil microbiology. But for underground process like rhizosheath formation it’s very less common. Therefore, we intended to use sterilized and unsterilized soils with 22% and 32% clay contents to check the rhizosheath formation. Sterilized soils were autoclaved at 121oC /103 kPa for 30 min on three consecutive days. After that soils were incubated at 25oC and drying and rewetting cycles were induced to a water holding capacity at field capacity of 75% at regular four intervals. Soils were treated with 0.3% [mg dry mucilage/ g of water] of chia seed mucilage and artificial roots made of flax cord will be used as modeled plant roots. Rhizosheath formation were examined after four wetting and drying cycles. Our preliminary results indicated significantly higher rhizosheath development in unsterilized soils as compared to sterilized soils. In parallel study, we also planned to check soil aggregation by scanning electron microscope (SEM).The quantitative findings of analysis will be presented and discussed.

How to cite: Rahim, R., Amelung, W., and Siebers, N.: Does mucilage governs rhizosheaths development under drying and wettingCycles?, EGU General Assembly 2023, Vienna, Austria, 23–28 Apr 2023, EGU23-11957, https://doi.org/10.5194/egusphere-egu23-11957, 2023.

EGU23-12018 | Orals | HS8.3.2

Root water uptake in relation to plant transpiration 

Dagmar van Dusschoten, Daniel Pflugfelder, and Johannes Kochs

Typically, root water uptake (RWU or Utot) is said to be driven by transpiration (Tr). It is however more accurate to state that transpiration causes a reduction in leaf water content that reduces the leaf water potential such that a water potential gradient builds up between leafs and soil water, such that water can be extracted from the soil. For herbaceous plants, the amount of water that is hereby lost is typically assumed to be negligible so the plant can be treated as a resistive system. In how far this is true is open to discussion as quantifying shoot water changes is not easily feasible, especially when the soil-root system is drying out. A balance cannot observe water moving between the soil and the shoot and shoots have empty spaces such that 3D cameras provide an incomplete picture. Shoot weight determination requires that the amount of soil water is independently assessed to discriminate between the two pools of water. This can be achieved when a balance is combined with a Soil Water Profiler (SWaP) on the same soil-plant system. The precision of the SWaP is comparable to that of an expensive balance (<10mg for a 6kg system).

Here we performed experiments with the SWaP – balance combination under modulated light with progressive soil dehydration for sunflower and faba bean (N=4). Our data shows that transpiration precedes Utot by about 5 to 10 mins under wet conditions (pF~2) and Utot can exceed Tr by up to 20%. Gradually, with decreasing soil water content we find that Utot becomes smaller than Tr and at the same time the delay between Tr and Utot increases. For pF>3.5 most of the transpired water stems from the shoot, not from root water uptake, indicating that Tr is a poor proxy for RWU for pot experiments where soil is drying at a rate of ~5% per day at well watered conditions. This is very important for calculations of root conductance during drying scenarios. We found significant differences between sunflower sensitivity to soil drying as compared to faba beans that are somewhat more sensitive. We also present data that shows that the delay between Tr and local water uptake is rather dependent on depth and not so much dependent on local pF, which is typically lower for shallow sections of the pot. This may potentially be explained by loss of root water when Tr increases with light, analogous to shoot water losses.

The combination of the SWaP and gravimetric methods opens up a new way of looking at root water uptake as driven by transpiration and shoot water loss dynamics as it provides hitherto inaccessible information about these processes.

How to cite: van Dusschoten, D., Pflugfelder, D., and Kochs, J.: Root water uptake in relation to plant transpiration, EGU General Assembly 2023, Vienna, Austria, 23–28 Apr 2023, EGU23-12018, https://doi.org/10.5194/egusphere-egu23-12018, 2023.

EGU23-12222 | ECS | Orals | HS8.3.2 | Highlight

How to invest carbon under drought, different strategies in early root system development among barley cultivars 

Amandine Germon, Tino Colombi, Dorette Müller-Stöver, Thomas Keller, and Carsten Müller

Plant roots exposed to water scarcity respond by modulating root functional traits, such as deep and prolific root growth, to maximize resource acquisition. Such adjustments, which include the alterations of root morphology and anatomy to optimize water uptake and/or maximize root survival, may also increase the carbon demand for soil exploration. But this altered carbon allocation to foster belowground resource acquisition limits aboveground plant development. In the present study we investigated the relationship between root physiology, root trait plasticity and whole plant growth under drought stress. We quantified shoot and root traits of nine contrasting spring barley cultivars grown in soil-filled rhizoboxes under well-watered (4 weeks, 55% of field capacity) or drought conditions (2 weeks, 55% of field capacity + 2 weeks without water). Time-lapse imaging was applied to quantify root and shoot growth rates, and combined with measurements of root distribution, morphology, anatomy as well as mycorrhizal colonization. Aboveground traits had a strong and uniform response to drought compared to belowground traits. Root traits’ plasticity were variable and differed among cultivars. The differences between cultivars were particularly pronounced for the proportion of root length and root biomass in deep soil layers as well as changes in root morphological and anatomical traits. We suggest that cultivars characterized by an increase in root conduits, a greater hierarchical structure and a reduction of specific root length and area may be good candidates to promote hydraulic lift while lowering carbon cost for root growth. Increased root length and depth, root density and specific root length in drought condition are different cultivars’ strategies that may promote soil exploration and optimize water uptake. This is directly linked to the interplay of above and belowground carbon investment, with some cultivars yielding both a high shoot biomass and enhanced resource acquisition. Based on our findings, testing new agronomic strategies to mobilize the diversity of cultivars could be key to enhance drought resistance and resilience of barley cropping systems.

How to cite: Germon, A., Colombi, T., Müller-Stöver, D., Keller, T., and Müller, C.: How to invest carbon under drought, different strategies in early root system development among barley cultivars, EGU General Assembly 2023, Vienna, Austria, 23–28 Apr 2023, EGU23-12222, https://doi.org/10.5194/egusphere-egu23-12222, 2023.

EGU23-12448 | ECS | Orals | HS8.3.2

Maize roots under mechanical stress induce increased ethylene concentration in the soil gas phase 

Maxime Phalempin, Eva Lippold, Felix Brauweiler, Bernd Apelt, Henrike Würsig, Mika Tarkka, Steffen Schlüter, and Doris Vetterlein

Mechanical stress induced by soil compaction affects drastically root system architecture and the morphology of individual root segments. Typical effects of mechanical stress on the root responses include decreased root elongation, increased radial thickening and sloughing of cap cells. Many studies have established a link between the mechanical stress encountered by roots (generated in triaxial cells or by restricting root growth with a barrier) and the gaseous plant hormone ethylene; the data suggests that ethylene acts as an endogenous root growth regulator. To the best of our knowledge however, none of the studies on the ethylene and mechanical stress feedback mechanisms measured ethylene concentrations under realistic soil conditions, i.e., in the soil gas phase and over a long period of time. In this study, we aimed at filling this knowledge gap and set up an experiment which allowed to measure ethylene concentration directly in the soil gas phase with passive diffusive samplers and for maize plants subjected to different levels of soil compaction over a period of 21 days in repacked soil columns in the laboratory. With the help of X-ray computed tomography, we investigated the spatiotemporal patterns of ethylene concentrations in the vicinity of roots, in order to assess which type of roots act as a major source of ethylene in the soil. In accordance with the literature, soil compaction induced a significant increase in ethylene concentration in the soil gas phase, which impacted root growth by reducing significantly the growth of fine roots and increasing the share of thicker roots. A visual inspection of the X-ray CT images at different time points of gas sampling showed that high concentrations of ethylene (i.e., above the third quartile of the distribution) were not strictly ascribable to the abundance or type of roots in the vicinity of a probe. Yet, the highest concentrations of ethylene were recorded on the occasions where roots were present close to a probe. The sampling depths and time of sampling had no or very little effect on the measured ethylene concentrations. Our results suggest that ethylene was diffusing rather homogeneously in the soil columns and that microbial activity was also responsible for a good fraction of the ethylene production. Future experiments are planned to assess the contribution of microbes to the total ethylene production.

How to cite: Phalempin, M., Lippold, E., Brauweiler, F., Apelt, B., Würsig, H., Tarkka, M., Schlüter, S., and Vetterlein, D.: Maize roots under mechanical stress induce increased ethylene concentration in the soil gas phase, EGU General Assembly 2023, Vienna, Austria, 23–28 Apr 2023, EGU23-12448, https://doi.org/10.5194/egusphere-egu23-12448, 2023.

EGU23-13045 | ECS | Orals | HS8.3.2

Monitoring root water uptake for understanding tree water use dynamics during dry periods 

Stefano Martinetti, Marius Floriancic, Andrea Carminati, and Peter Molnar

Sufficient water supply to the roots is needed to sustain transpiration demand.  However, detailed measurements of water fluxes into the roots and the gradients in water potential driving these fluxes are rare, particularly in the field, mainly due to the difficulty in accessing roots and performing measurements on them. As a result, field monitoring of tree water use often neglects the root system, and the water fluxes from the soil to the shoot of trees remain a frontier in soil plant water relations.  This measurement gap and lack of understanding of water fluxes in roots makes it difficult to properly determine what drives root water uptake and how it might vary depending on rooting depth, soil matric potential and transpiration rate in the field.

During dry summer 2022, we equipped beech and spruce trees with sap flow sensors and dendrometers on the stem and on roots accessing different soil depths. This allowed us to monitor water fluxes and potentials in the different plant parts, from the integrated fluxes in the stem to the water uptake of single roots. We conducted the measurements at the “Waldlabor” ecoydrological monitoring forest in Zurich, where we comprehensively monitor the soil-plant-atmosphere continuum of beech and spruce with dendrometers, sap flow sensors and frequently measured stem & leaf water potential as well as stomatal conductance. To uncover the roots with minimal disturbance we removed the soil with a special air pressurizer and vacuum pump that allowed soil removal without damaging the roots, installed sensors at roots accessing different soil depths and afterwards covered the roots with soil again. Soil matric potential was measured at 10, 20, 40 and 80 cm depth in proximity to selected roots. At the canopy level, we measured stomatal conductance and leaf water potential throughout the summer.

Here, we demonstrate how the collected data help to understand to which extent trees diversify their water uptake depending on water availability at different soil depths. Because of the scarce precipitation and the limiting soil water availability during the summer, pre-dawn leaf water potential, stomatal conductance as well as sap flow decreased, indicating a reduction in transpiration. Beech trees reduced their stomatal conductance more dramatically than spruce trees, thereby using soil water more quickly. The comparison of sap flow in the roots and the integrated signal measured along the stem reveals differences between roots, with roots accessing deeper soil upholding higher sap flow velocities than roots accessing shallow soil in both species.

The results allow to assess the interplay between aboveground tree hydraulics and water status and belowground water uptake for beech and spruce under drying conditions.

How to cite: Martinetti, S., Floriancic, M., Carminati, A., and Molnar, P.: Monitoring root water uptake for understanding tree water use dynamics during dry periods, EGU General Assembly 2023, Vienna, Austria, 23–28 Apr 2023, EGU23-13045, https://doi.org/10.5194/egusphere-egu23-13045, 2023.

EGU23-13308 | Orals | HS8.3.2

Monitoring spatial and temporal carbon dynamics in the plant soil system by co-registration of Magnetic Resonance Imaging and Positron Emission Tomography for image guided sampling 

Robert Koller, Gregor Huber, Daniel Pflugfelder, Dagmar van Dusschoten, Carsten Hinz, Sina Schultes, Antonia Chlubek, Claudia Knief, and Ralf Metzner

Individual plants vary in their ability to respond to environmental changes. The plastic response of a plant enhances its ability to avoid environmental constraints, and hence supports growth, reproduction, and evolutionary and agricultural success.

Major progress in the analysis of above- and belowground processes on individual plants has been made by the application of non-invasive imaging methods including Magnetic Resonance Imaging (MRI) and Positron Emission Tomography (PET).

MRI allows for repetitive measurements of roots growing in soil and facilitates quantification of root system architecture traits in 3D. PET, on the other hand, opens a door to analyze dynamic physiological processes in plants such as long-distance carbon transport in a repeatable manner. Combining MRI with PET enables monitoring of short livedCarbon tracer (11C) allocation along the transport paths (i.e. roots visualized by MRI) into active sink structures.

To analyse the link between root-internal C allocation patterns and C metabolism in the rhizosphere, we are combining 11CO2 with stable 13CO2 labelling of plants. Isotope ratio mass spectrometry (IRMS) analyses of rhizosphere soil is applied to link root-internal C allocation patterns with distribution of 13C in the rhizosphere soil. The metabolically active rhizosphere organisms are subsequently identified based on DNA 13C stable isotope probing.

In our presentation we will highlight our approaches for gathering quantitative data from both image-based technologies in combination with destructive analysis that provides insights into the functioning and dynamics of C transport processes in the plant-soil system.

How to cite: Koller, R., Huber, G., Pflugfelder, D., van Dusschoten, D., Hinz, C., Schultes, S., Chlubek, A., Knief, C., and Metzner, R.: Monitoring spatial and temporal carbon dynamics in the plant soil system by co-registration of Magnetic Resonance Imaging and Positron Emission Tomography for image guided sampling, EGU General Assembly 2023, Vienna, Austria, 23–28 Apr 2023, EGU23-13308, https://doi.org/10.5194/egusphere-egu23-13308, 2023.

EGU23-13619 | ECS | Posters on site | HS8.3.2

Phenotyping faba bean for drought adaptation 

Tomke Wacker and Dorte Dresbøll

Faba bean (Vicia faba) is a promising protein crop for a green transition of our food and food production systems in temperate climates. The crop produces protein rich pulses, with nitrogen derived from the atmosphere, offering the potential to make crop production systems less reliant on fossil energy input. One challenge of increasing faba bean cropping is, however, their drought sensitivity induced yield instability, which may be specifically harmful during the indeterminate flowering period.

A faba bean phenotyping experiment was established at University of Copenhagen, combining field experiments with rhizotube observations. Five commercial cultivars were grown in field plots. To create drought conditions, the plots were partly covered by rain gutters to remove precipitation during the flowering period. In dry seasons, the well-watered control was irrigated. Aboveground growth parameters were assessed, root architectural traits were determined by a shovelomics approach, and stomata imprints were analysed for stomata size and density using a convolution neural network approach.

In order to obtain information on root growth dynamics, plants were grown in 2m tall rhizotubes with a diameter of 15cm and with a transparent surface. Root images were acquired to follow root development over time. Soil water sensors were installed, to observe water content and how it was affected by the drought treatment.


Results from the first two seasons of this three-year project show successful establishment of drought conditions in the field trial using the rain-gutter approach. Yield and yield composition were affected by drought treatment and showed a mean reduction of 0.7-0.8 T ha-1. Cultivars show varying responses to the drought stress, which was reflected on root and shoot parameters. Stomata density and size showed genotypic variation, and cultivar specific plastic adaptation to drought. Stomata density and size correlated strongly with root traits observed from the shovelomics approach, indicating that a deeper, more proliferated root system can support larger transpiration demand. These findings were further supported by the rhiztobue experiments, where maximum rooting depth and stomata cover are correlated.


The preliminary results of this study show interesting interactions between shoot and root phenotyping at different scales, and expands our understanding of the water budget of faba bean.


How to cite: Wacker, T. and Dresbøll, D.: Phenotyping faba bean for drought adaptation, EGU General Assembly 2023, Vienna, Austria, 23–28 Apr 2023, EGU23-13619, https://doi.org/10.5194/egusphere-egu23-13619, 2023.

EGU23-14301 | ECS | Posters on site | HS8.3.2

Influence of Ni-hyperaccumulating trees on nickel biogeochemical cycle in a soil-plant system of New-Caledonia 

Claire Ansart, Eric Paidjan, Christophe Cloquet, Emmanuelle Montargès-Pelletier, Sandrine Isnard, Cécile Quantin, Yann Sivry, and Farid Juillot

Ultramafic (UM) soils are of particular interest due to their high content in metals for example Fe, Mn but also in Ni, Co, or Cr up to the ore grade (Butt and Cluzel, 2013). Those high metal contents combined with low contents of plants essential nutrients (Ca, K and P) imply particularly stressful conditions for the vegetation. To take advantage on these specific edaphic conditions, few plant species growing on UM soils have developed ecophysiological strategies including metal hyperaccumulation (Reeves, et al. 2018). Hyperaccumulation implies efficient metal mobilization at the soil-plant interface, i.e. roots, and the transfer to the different aerial organs of plants, which can lead to significant concentrations of metal in stems, sap, latex, and leaves. As example, for Ni, these concentrations can reach up to the percent level, while most plants contain less than 15 µg/g (dry mass) of Ni in their tissues (Brooks et al., 1977). This behaviour is expected to increase Ni-phytobioavailability by litter degradation and complexation of metal with organic ligands in the upper horizon of UM soils (Boyd and Jaffré, 2001; Zelano et al., 2020). This physiological process is also suspected to modify Ni isotope ratios due to absorption, transport and storage in the plant. However, the extent of Ni isotope fractionation in UM soils due to hyperaccumulators remains unclear and debated. While Zelano et al. (2020) suggested that the Ni sequestration by hyperaccumulators and its redistribution in the aerial organs of the plant could hinder Ni isotope fractionation in old individuals, Ratié et al. (2019) reported a preferential uptake of light isotope by roots in soils and Ni fractionation during translocation to the aerial part of the plants leading to heavier isotopic composition in soils.

The present study focuses on Ni-hyperaccumulation Pycnandra acuminata tree, endemic to New Caledonia. To understand the impact of Ni-hyperaccumulating plants on the Ni biogeochemical cycle, twelve soil profiles have been identified in the rainforest of Grande Terre including six profiles developed in the close vicinity of Ni-hyperaccumulating trees P. acuminata and six other profiles developed in the close vicinity of Pycnandra fastuosa, a non-hyperaccumulating tree also endemic in New Caledonia. Nickel concentrations found in hyperaccumulator-soil systems are higher relative to the non-hyperaccumulator-soil systems revealing the influence of P. acuminata and the associated leaves degradation on Ni redistribution in ultramafic soils. Ni isotope compositions and XAS spectroscopy of soil samples will help us to reveal the biogeochemical processes controlling the Ni isotopic signature in UM soils. Although focalized on New Caledonia, our study can be considered representative of the influence of hyperaccumulating trees on the biogeochemical cycle of Ni in UM soils systems worldwide.


Boyd and Jaffré (2001), South Afr. J. Sci. 97, 535 – 538

Brooks et al. (1977), J. Geochem. Explor. 7, 49 – 57

Butt and Cluzel (2013), Elements 9(2), 123 – 128

Ratié et al. (2019), J. Geochem. Explor. 196, 182 – 191

Reeves et al. (2018), New Phytol. 218(2), 407 – 411

Zelano et al. (2020),  Plant and Soil 454(1 – 2), 225 – 243 

How to cite: Ansart, C., Paidjan, E., Cloquet, C., Montargès-Pelletier, E., Isnard, S., Quantin, C., Sivry, Y., and Juillot, F.: Influence of Ni-hyperaccumulating trees on nickel biogeochemical cycle in a soil-plant system of New-Caledonia, EGU General Assembly 2023, Vienna, Austria, 23–28 Apr 2023, EGU23-14301, https://doi.org/10.5194/egusphere-egu23-14301, 2023.

EGU23-14362 | Orals | HS8.3.2

Effects of Winter Rapeseed - Faba-bean intercrop and litter mulch on soil Nitrogen  

Moza Al Naemi, Patricia Garnier, Alexandra Jullien, and Celine Richard-Molard

Intercropping management strategy involves the use of legumes alongside a commercial crop to achieve various benefits, such as improved soil nutrient circulation, water retention, and pest control. However, research has shown that there is a lack of understanding of the long-term benefits of legumes within cropping systems and their specific interactions with the soil.


In our experimental setup, we conducted four treatments using soil columns that were 24 cm in diameter and 1 m in length. We grew two winter rapeseeds as a monocrop, an intercrop of one rapeseed and one faba-bean, and two faba-beans as a monocrop in each soil column. We killed the faba-bean during the winter frost and left it as green mulch in the rapeseed intercrop. The final treatment was bare soil control columns. We measured soil nitrogen, the biomass, and nitrogen content of living plants and plant litter in September, October, November, and June. Additionally, we studied the decomposition of rapeseed and faba-bean residues in the soil in a laboratory incubation experiment to measure carbon and nitrogen mineralization.


The majority of mineral nitrogen leaching occurred during late autumn at the beginning of the growing season (September to October) in all treatments. The soil mineral nitrogen contents over the growing season for the rapeseed-faba-bean intercrop system were similar to the rapeseed monocrop system, but lower than in the faba-bean monocrop system. The nitrogen balance in the columns for each treatment revealed that bare soil lost the most nitrogen over time due to leaching and lack of plants to uptake mineral nitrogen and immobilize it as biomass. The second one which lost the most nitrogen by leaching is The faba-bean monocrop. In this treatment, the plant did not use soil nitrogen in the lower portions of the soil column and this portion of the nitrogen in the soil may have been lost by leaching. The nitrogen was better conserved in the soil column and in the plants in the treatments with rapeseed intercrop and monocrop. Soil nitrogen was removed by the plant more efficiently leading to less leaching.


The nitrogen content and biomass of one rapeseed plant in the intercrop was nearly double the one rapeseed plant in monocrop. Indeed, the total biomass and nitrogen content of the two rapeseeds in monocrop was equivalent to the single rapeseed in the intercrop. Conversely, rapeseed mulch had less nitrogen in intercrops than in the monocrop system.


Lastly, the incubation of crop residues initially immobilized soil mineral nitrogen. The faba-bean mulch started releasing more mineral nitrogen than the bare soil after day 70. The release of mineral nitrogen of rapeseed and rapeseed-faba-bean mulch mixture exceeded the nitrogen of bare soil after day 90.


Overall, it is clear that intercropping with legumes can have positive effects on soil nitrogen and plant growth, but more research is needed to fully understand the long-term benefits and interactions between legumes, the soil, and commercial crops.

How to cite: Al Naemi, M., Garnier, P., Jullien, A., and Richard-Molard, C.: Effects of Winter Rapeseed - Faba-bean intercrop and litter mulch on soil Nitrogen , EGU General Assembly 2023, Vienna, Austria, 23–28 Apr 2023, EGU23-14362, https://doi.org/10.5194/egusphere-egu23-14362, 2023.

EGU23-14889 | Posters on site | HS8.3.2 | Highlight

Family ties – root-root communications within the Solanaceae 

Aye Nyein ko, Milena Oliveira, Shimon Rachmilevitch, and Omer Falik

Family ties – root-root communications within the Solanaceae
Competition is a key factor affecting plants. The ability to differentiate between the roots of the same individual and other individuals may reduce the allocation of self/non-self-competition and allow greater availability of resources for other functions, including higher reproductive outputs. We aim to explore root communications within the Solanaceae family crops [Tomatoes, and Bell pepper ] under different degrees of relatedness (DOR). A rhizoslide experiment was conducted to investigate responses of (DOR), based on changes in carbon allocation patterns vectored by roots, shoots, rhizodeposits, and respiration. Overall, the study revealed that tomatoes are a 'costly' neighbor to bell pepper, especially under salinity, whereas bell pepper is a 'benefit' neighbor in increasing tomatoes performance, however, it still differs for each tomato. Future studies will include testing our results in pot and field studies and examining the roles of roots vs shoots by using grafted plants. Our findings will contribute to choosing good neighboring plants in dryland agriculture with newly developed neighbors' plants.
Student’s contribution
We carried out the experimental design of the study after discussing it with the supervisor and performed the experiment. I participated in sampling, measuring plant growth and development, and performing statistical analysis.

How to cite: Nyein ko, A., Oliveira, M., Rachmilevitch, S., and Falik, O.: Family ties – root-root communications within the Solanaceae, EGU General Assembly 2023, Vienna, Austria, 23–28 Apr 2023, EGU23-14889, https://doi.org/10.5194/egusphere-egu23-14889, 2023.

EGU23-14946 | ECS | Posters on site | HS8.3.2

Modelling plant-mycorrhizae interactions - a review 

Malin Forsberg, Birgit Wild, and Stefano Manzoni

Symbiotic associations between plants and soil microbes, especially mycorrhizal fungi, are fundamental for plant nutrition and belowground processes associated with carbon (C) transfer from plants to the rhizosphere and mycorrhizae are key components of the global carbon cycle. Plants sacrifice photosynthetically acquired C in exchange for nutrients from their symbiotic partner. This exchange can be advantageous when mycorrhizae can access nutrient pools that plants cannot reach—either because chemically recalcitrant (e.g., nutrients in organic matter), or physically isolated (hyphae explore soils more effectively than roots). Additionally, the mycorrhizal network can extend into great distance and allows plants to share C and nutrients. Therefore, understanding this relationship and the interactions between plants and soil microbes are vital for creating realistic predictions of C and nutrient cycling in forests.

In this contribution, we review current modelling approaches to plant-mycorrhizae processes and pathways, focusing on C and nutrient cycling, to highlight ongoing trends and knowledge gaps. It is evident that further model-development is needed in order to get accurate predictions. Some models include C and nutrient exchanges between plants and mycorrhizae via empirical factors, lacking a process-based description of these exchanges. Other models describe C-nutrient exchanges based on stoichiometric demand and supply of C and nutrients, possibly resulting in excessively constrained exchanges. The approaches that quantify costs and benefits of symbiosis in an eco-evolutionary framework are promising as they capture adaptation mechanisms. In general, models tend to focus more on stoichiometry than on temperature and soil moisture effects on plant-mycorrhizae interactions. Information about how the soil-plant system reacts to changes with climate dependent environmental conditions are also underrepresented. Therefore, while coupled plant-mycorrhiza models have been tremendously improved in recent years, they might still not fully capture the role of mycorrhizae in the C and nutrient cycling in terrestrial ecosystems.

How to cite: Forsberg, M., Wild, B., and Manzoni, S.: Modelling plant-mycorrhizae interactions - a review, EGU General Assembly 2023, Vienna, Austria, 23–28 Apr 2023, EGU23-14946, https://doi.org/10.5194/egusphere-egu23-14946, 2023.

EGU23-15339 | ECS | Orals | HS8.3.2

Spatio-temporal patterns of chemical gradients around roots investigated with µXRF and X-ray CT 

Eva Lippold, Steffen Schlüter, Rüdiger Kilian, Eric Braatz, Robert Mikutta, and Doris Vetterlein

Chemical gradients around roots are formed by water uptake and selective uptake of elements and thereby triggered radial transport processes. Gradients on different root segments are expected to vary in magnitude, e.g. root age determines duration of root-soil-contact and thus the dimension of depletion or accumulation zones. Current knowledge with respect to chemical rhizosphere gradients is primarily based on linearized (compartmentalized) or pseudo-linearized (rhizobox) systems, which do not represent the radial geometry of transport to and from roots. Within the DFG-funded Priority Program 2089 we developed a new targeted sampling on undisturbed samples containing different root segments to overcome these shortcomings.

In order to evaluate the temporal change of root system architecture, we apply X-ray computed tomography (X-ray CT) and advanced tools of image analysis and registration, as the direct observation of roots in a 3D system is hindered by the non-transparency of soil.

This allows a targeted sampling of specific root ages/types by extracting intact subsamples (ø 1.6 cm) from larger pots (ø 7 cm), in which the plants were grown. To investigate the influence of soil texture and root age on the formation of chemical gradients, this new subsampling protocol was first tested in a pot experiment with two Zea mays L. genotypes  (the wild-type (WT) and the corresponding mutant defective in root hair elongation (rth3)) grown for three weeks in two different textures (sand vs. loam). Resin embedded subsamples containing either segments of the primary root or young roots were imaged with micro X-ray fluorescence (μXRF) to evaluate element distributions as a function of distance to the root surfaces. First results show a higher precipitation of calcium and sulfur in the vicinity of the primary root than in the vicinity of young roots indicating an age effect. Magnitude and extend of the gradient differs between sand and loam.


How to cite: Lippold, E., Schlüter, S., Kilian, R., Braatz, E., Mikutta, R., and Vetterlein, D.: Spatio-temporal patterns of chemical gradients around roots investigated with µXRF and X-ray CT, EGU General Assembly 2023, Vienna, Austria, 23–28 Apr 2023, EGU23-15339, https://doi.org/10.5194/egusphere-egu23-15339, 2023.

EGU23-15808 | ECS | Orals | HS8.3.2

Root soil Nitrogen acquisition by mature Oak trees exposed to elevated CO2: Nitrogen preference and uptake rate under a future climate 

Johanna Pihlblad, R. Liz Hamilton, Manon Rumeau, Emma J. Sayer, Iain P. Hartley, and Sami Ullah

In a future CO2 rich world, nitrogen (N) limitation is projected to decrease the CO2 fertilization effect limiting the ability of temperate forests to mitigate climate change. There are limited direct measurements of roots showing if mature trees are able to increase their N uptake in a future climate. Additionally, it is not currently understood if roots of mature trees can change their N form preference under elevated CO2 to maintain or enhance their N uptake. These are all gaps in knowledge identified as adding uncertainty to modelling efforts assessing ecosystem response to climate change. We quantified the rate of N uptake of living mature oak tree roots (Quercus robur) and their preference of N forms. On two occasions (July and November 2022) we carefully excavated live oak roots of three mature trees in each of the six experimental Free Air Carbon Enrichment (FACE) arrays (three ambient and three +150 ppm CO2) at the BIFoR FACE facility located in Staffordshire (United Kingdom). The live roots were cleaned and pre-incubated in acid washed sand and a nutrient solution for 24 hours to establish an acclimatized baseline condition following excavation. The roots were then exposed to a mix of inorganic and organic N forms where only one form was labelled in each treatment (15N-nitrate, 15N-ammonium, a mix of 20 15N labelled amino acids and an unlabelled control) to elucidate N preferences and rate of uptake during a two-hour incubation period. By analysing the root tissue for 15N our findings will investigate the preferences and uptake rates of N by mature trees under elevated CO2. We hope to shed light on these mechanisms mediating N uptake of mature trees to explain how mature forest stands respond to climate change in a temperate climate.    

How to cite: Pihlblad, J., Hamilton, R. L., Rumeau, M., Sayer, E. J., Hartley, I. P., and Ullah, S.: Root soil Nitrogen acquisition by mature Oak trees exposed to elevated CO2: Nitrogen preference and uptake rate under a future climate, EGU General Assembly 2023, Vienna, Austria, 23–28 Apr 2023, EGU23-15808, https://doi.org/10.5194/egusphere-egu23-15808, 2023.

EGU23-15906 | ECS | Orals | HS8.3.2

Explicit 3D modelling of the rhizosphere processes at plant scale demonstrates the impact of soil texture on root water uptake 

Koch Axelle, Gaochao Cai, Félicien Meunier, Mutez Ali Ahmed, and Mathieu Javaux

The relation between plant transpiration rate (E) and leaf water potential (LWP) is a function of both soil and plant hydraulics and can be affected by local rhizosphere processes. Measuring these very localized processes remains a huge challenge, while observing their impact on the E-LWP relationship is easy. Therefore, the underlying mechanisms of how these processes impact root water uptake (RWU) and whether it is soil texture specific remain unknown. In this study we used a 3-D detailed functional-structural root-soil model to investigate how root and rhizosphere hydraulics control the E-LWP relationship for two maize genotypes (with and without root hairs) grown in two soil types (loam and sand) during soil drying. We assumed that the rhizosphere hydraulic resistance can be taken into account via two processes: (1) a drop in soil water potential between the bulk soil and the soil-root interface and (2) a partial soil-root contact. The simulations revealed that the key process controlling the uptake was soil-dependent. In loam, a drop in soil water potential between the bulk soil and the soil-root interface affected the uptake and RWU started to be limited below soil water potential of -610 hPa. In sand, however, the poor soil-root contact was the main constraint, and the rhizosphere conductance limited RWU at much higher soil water potential (around -90 hPa). In contrast to effective models, our explicit three-dimensional simulations provide exact location and the main driver (root or rhizosphere) of the water RWU distribution patterns as well as the quantification of the active root surface ratio for RWU.

How to cite: Axelle, K., Cai, G., Meunier, F., Ahmed, M. A., and Javaux, M.: Explicit 3D modelling of the rhizosphere processes at plant scale demonstrates the impact of soil texture on root water uptake, EGU General Assembly 2023, Vienna, Austria, 23–28 Apr 2023, EGU23-15906, https://doi.org/10.5194/egusphere-egu23-15906, 2023.

EGU23-16294 | ECS | Posters virtual | HS8.3.2

Geochemical composition of agricultural soils and its link to plant Pb contents 

Gevorg Tepanosyan, Davit Pipoyan, Meline Beglaryan, and Lilit Sahakyan

The compositional peculiarities of the soil’s chemical environment must be taken into account to study the possibility of toxic elements (TE) to be accumulated in plants. This research covered 7 provinces (marzes) of Armenia providing around 80.1% of the national total gross agricultural production. From June to October 2019, the sampling procedure was carried out as part of the national residue monitoring program. Pb geochemical associations in agricultural soils were investigated, revealing the link between these associations and Pb contents in plants, as well as determining the source-specific transfer of Pb from soil to plants, using both compositional data analysis (CoDa) and geospatial mapping. CoDa included the combination of the results of k-means clustering and CoDa-biplot and was applied to study the relationship between the TEs and identify their geochemical associations (CoDaPack v.2.02.21 and R statistics). In addition, a hierarchical cluster analysis (HCA) was used to study the links between food Pb contents and soil TE contents in each group of sub-samples identified by k-means clustering.

The obtained results showed that the research area’s unique geology and probable chemical element release sources influenced the soil’s chemical composition. Using HCA, it was discovered that in every sub-sample, the Pb soil and plant contents were in the same cluster. Particularly, CoDa-biplot and k-means clustering enable the distinction of three distinct sub-samples. However, the geochemical associations of the elements in subsamples I and III showed that Pb plant contents were shown in a geochemical association (K, Rb, Pb, and Zn) typical of both fertilizers and potassium feldspar. In contrast, sub-sample II showed that Pb plant contents were in a geochemical association (K, Rb, Pb, and Zn) typical of carbonates. The transfer factor (TF) for the similarly higher values is observed for the sub-sample associated with the geochemical relationship of K, Rb, Pb, and Zn. Moreover, it has been demonstrated that carbonates had a negative impact on the availability of Pb in plants. This can be explained by the capacity of carbonates in sub-samples I and III to fix Pb and reduce its availability in plants. Based on the study’s findings, it is important to emphasize that further research on compositional characteristics of chemical elements via the identification of geochemical associations can enable to reveal of possible connections between the elements in various media.

How to cite: Tepanosyan, G., Pipoyan, D., Beglaryan, M., and Sahakyan, L.: Geochemical composition of agricultural soils and its link to plant Pb contents, EGU General Assembly 2023, Vienna, Austria, 23–28 Apr 2023, EGU23-16294, https://doi.org/10.5194/egusphere-egu23-16294, 2023.

EGU23-17068 | ECS | Orals | HS8.3.2 | Highlight

European forest vulnerability to hydraulic failure: an ecohydrological approach 

Arsene Druel, Nicolas Martins, Herve Cochard, Miquel DeCaceres, Sylvain Delzon, Maurizio Mencuccini, José Torres-Ruiz, and Julien Ruffault

The current acceleration of climate change in Europe makes it essential to assess spatially the impact of drought and heat waves on forest disturbances risk (mortality, wildfire risk, etc…). Recent studies have shown that hydraulic failure is a key driver of forest disturbances. Hydraulic failure can be modelled with state-of-the-art plant hydraulic models that are driven by climate data and different traits including (i) hydraulic traits (such as xylem cavitation resistance and stomatal regulation), (ii) leaf area index and (iii) total soil water capacity. Among these traits soil water capacity is highly sensitive, but is poorly available at large scale.
In this study we used the process based plant hydraulic model SUREAU (Cochard et al., 2021; Ruffault et al 2022) to estimate hydraulic failure risk for forest at the European scale for the last 3 decades. To initialize the model we used spatialized  climate (ERA5), LAI data (from Copernicus remote sensing) and land cover (ESA CCI). Species hydraulic traits for major European species were extracted from global databases. In order to initialize the total soil water capacity at European scale and compensate the lack of soil water data, we developed an algorithm of model inversion based on ecohydrological assumption. The ecohydrological assumption is that forest adjust their total available water capacity through rooting depth, for a given climate, traits combination and Leaf area index to maintain a low embolism rate under normal conditions (excluding extreme drought). Our simulation approach simulations allowed to spatialized forest vulnerability to drought and to map total soil water capacity under forest stands.

How to cite: Druel, A., Martins, N., Cochard, H., DeCaceres, M., Delzon, S., Mencuccini, M., Torres-Ruiz, J., and Ruffault, J.: European forest vulnerability to hydraulic failure: an ecohydrological approach, EGU General Assembly 2023, Vienna, Austria, 23–28 Apr 2023, EGU23-17068, https://doi.org/10.5194/egusphere-egu23-17068, 2023.

EGU23-17074 | ECS | Posters on site | HS8.3.2

Analysis of root distribution and its effect on soil respiration using Hydrus 

Asha Nambiar Puthussseri Valiyaveettil and Gerrit Huibert de Rooij

It is not yet certain if temperate forests are net sources or sinks for atmospheric carbon, making it difficult to assess their potential role in mitigating climate change.  Root distribution and root growth in forests are important for soil respiration in forest soils, which in turn is one of the factors that determine carbon sequestration in and release from these soils. The aim of this study is to examine the effect of rooting depth and root distribution on soil respiration in different types of forest in north-eastern Germany through simulations with the Hydrus-1D model. The model combines a solver for Richards’ equation for soil water flow with routines that determine incorporation of carbon in the soil biomass as well as CO2 production by through respiration and decay. A  simple root distribution function with a single parameter will be used to model the root distribution. The presentation will report the first results of the study. 

How to cite: Puthussseri Valiyaveettil, A. N. and de Rooij, G. H.: Analysis of root distribution and its effect on soil respiration using Hydrus, EGU General Assembly 2023, Vienna, Austria, 23–28 Apr 2023, EGU23-17074, https://doi.org/10.5194/egusphere-egu23-17074, 2023.

EGU23-17337 | ECS | Orals | HS8.3.2

Dynamic root growth in response to depth-varying soil moisture availability: a rhizobox study 

Cynthia Maan, Marie-Claire ten Veldhuis, and Bas van de Wiel

Their flexible root growth provides plants with a strong ability to adapt and develop resilience to droughts and climate change. But this adaptability is badly included in crop- and climate models. Most of them rely on a simplified representation of root growth, independent of soil moisture availability. To model plant development in changing environments, we need to include the survival strategies of plants, but data of subsurface processes and interactions, needed for model set-up and validation, are scarce.

Here we investigated soil moisture driven root growth. To this end we installed subsurface drip lines and small soil moisture sensors (0.2 L measurement volume) inside rhizoboxes (length x width x height, 45 x 7.5 x 45cm). The development of the vertical soil moisture and root growth profiles are tracked with a high spatial and temporal resolution.

The results confirm that root growth is predominantly driven by vertical soil moisture distribution, while influencing soil moisture at the same time. Besides support for the functional relationship between the soil moisture and the root density growth rate, the experiments also suggest that vertical root growth stops when the soil moisture at the root tip drops below a threshold value. We show that even a parsimonious one-dimensional water balance model, driven by the measured water input and output fluxes, can be convincingly improved by implementing root growth driven by soil moisture availability. The model performance suggests that soil moisture is a key parameter determining root growth.

How to cite: Maan, C., ten Veldhuis, M.-C., and van de Wiel, B.: Dynamic root growth in response to depth-varying soil moisture availability: a rhizobox study, EGU General Assembly 2023, Vienna, Austria, 23–28 Apr 2023, EGU23-17337, https://doi.org/10.5194/egusphere-egu23-17337, 2023.

EGU23-489 | ECS | Orals | HS8.3.4

Combining high-resolution in-situ water isotope measurements with 1D soil hydraulic and transport modelling to understand root water uptake dynamics in a mixed forest ecosystem 

Judith Mach, Laura Kinzinger, Stefan Seeger, Simon Haberstroh, Maren Dubbert, Christiane Werner, Markus Weiler, and Natalie Orlowski

Soil-plant interactions and root water uptake are important factors of the soil-plant-atmosphere continuum. Characterizing root water uptake dynamics in different forest stands can help to predict water stress due to climate change. Governing factors that define tree root water uptake are environmental conditions, soil hydraulic properties, species-specific rooting patterns as well as intra- and interspecific competition. As spatial-temporal patterns of root water uptake cannot be measured directly, simplified assumptions are often either based upon homogenous soil conditions or on a static root water uptake profile. This study combines high-resolution in-situ measurements of water stable isotopes of xylem and soil moisture with a set of 1D soil hydrological and transport models of the vadose zone (Hydrus 1D) to investigate dynamics in root water uptake patterns of two competing tree species in three different forest stands. 

We measured in-situ water isotopic signature in different soil depths as well as in spruce and beech xylem continuously for two vegetation periods (2021-2022) including two artificial tracer experiments, a wet period in 2021 and a drought period in 2022. Three stands were compared: i) pure beech, ii) pure spruce and iii) mixed beech and spruce, measuring sap flux, leaf water potential, soil moisture, matric potential, throughfall and stemflow. In order to address different factors of soil heterogeneity, the vadose zone is represented by a set of models covering the range of measured soil conditions. Each model is calibrated against soil water content as well as isotope measurements and subsequently related to sap flux measurements. This allows for separating effects of soil heterogeneity and to analyze the interplay of a) stand specific factors, particularly different rooting distributions, interception, and throughfall patterns, and b) soil specific factors, particularly different hydraulic conductivity and plant available water fractions under changing environmental conditions. Results show that this interplay between soil and stand specific factors is crucial under dry conditions, while soil specific factors are of minor importance under wet conditions. This contribution will present and discuss results from this data-driven modelling study and provide information about how well processes are represented in these kind of models.

How to cite: Mach, J., Kinzinger, L., Seeger, S., Haberstroh, S., Dubbert, M., Werner, C., Weiler, M., and Orlowski, N.: Combining high-resolution in-situ water isotope measurements with 1D soil hydraulic and transport modelling to understand root water uptake dynamics in a mixed forest ecosystem, EGU General Assembly 2023, Vienna, Austria, 23–28 Apr 2023, EGU23-489, https://doi.org/10.5194/egusphere-egu23-489, 2023.

EGU23-3205 | ECS | Posters on site | HS8.3.4

A Lagrangian model framework for the simulation of fluid flow and solute transport in soils 

Alexander Sternagel, Ralf Loritz, and Erwin Zehe

We develop an integrated model framework for the simulation of a multitude of soil hydrological processes, such as (reactive) solute transport together with (preferential) water flow and diffusive mixing on the pore scale. This framework is called the Lagrangian Soil Water and Solute Transport (LAST) Model. It bases on a new theoretical concept and should serve as alternative to the common theories of the Darcy-Richards equation and the advection-dispersion-equation (ADE), which have limitations under more natural conditions.

In the LAST-Model framework, soil water is represented by discrete water particles of constant mass. The model applies a Lagrangian perspective on the trajectories of particles through a partially saturated soil domain. Particle displacements along the trajectories are calculated by a non-linear, space domain random walk that combines physics and stochastic. We gradually extend the scope of the LAST-Model framework by additional routines.

We implement routines for solute transport and preferential flow. Water particles are assigned by a solute mass and in this way, solutes are distributed together with the displacement of water particles. For preferential flow, a structural macropore domain is implemented as a second flow domain. Particles can infiltrate and travel purely by gravity in the macropore domain, independent from capillary-flow conditions in the soil matrix. As a result, they can bypass the bulk water fractions in the soil matrix before re-infiltrating the matrix and accumulating in greater depths.

We modify the solute transport routine to allow for the simulation of the transport of reactive substances. Specific routines for sorption and degradation processes are implemented. Sorption is represented by an explicit solute mass transfer between water particles and the solid phase by means of non-linear Freundlich isotherms, and driven by a concentration gradient. Adsorbed solutes are then assumed to be microbially degraded following first-order decay kinetics.

We introduce the diffusive pore mixing (DIPMI) approach as additional routine for the simulation of pore-size-dependent diffusive mixing of water and solutes over the pore space. This approach should produce more reliable descriptions of frequently observed (imperfect) mixing behaviours, in contrast to the common assumption of averaging concentrations over all pore sizes in a single time step.

Each model extension is tested by simulations of field and laboratory experiments as well as sensitivity analyses. Simulation results are compared against observed data and results of a benchmark model that uses the Darcy-Richards theory and the ADE. The most important findings of the studies can be summarized as:

  • The structural macropore domain is key for a successful representation of preferential water flow and (reactive) solute transport. In heterogeneous soils, LAST simulations match better the observed redistribution and depth-accumulation of solutes compared to simulations with the Darcy-Richards + ADE model.
  • Imperfect, diffusive mixing on the pore scale has a significant influence on macroscopic leaching behaviours and chemical/isotopic compositions of soil water fractions.
  • The particle-based approach of the LAST-Model framework is a promising tool for further soil- and ecohydrological application fields.

How to cite: Sternagel, A., Loritz, R., and Zehe, E.: A Lagrangian model framework for the simulation of fluid flow and solute transport in soils, EGU General Assembly 2023, Vienna, Austria, 23–28 Apr 2023, EGU23-3205, https://doi.org/10.5194/egusphere-egu23-3205, 2023.

EGU23-4060 | ECS | Posters on site | HS8.3.4

Use of Scaling to Describe Temporal Variability of Soil Hydraulic Properties 

Saurabh Kumar and Richa Ojha

Soil hydraulic properties exhibit spatio-temporal variability and are affected by both natural and human factors. Their knowledge is essential for assessing soil water regimes. Scaling methods based on similar media concept have been widely used to model the surface spatial and temporal variation of vadose zone processes while assuming that similarity conditions are preserved. Soil heterogeneity, changes in field conditions due to rainfall or irrigation and other factors lead to changes in boundary conditions which makes analysis based on similitude analyses or functional normalization difficult. However, inspectional analysis method can reduce known physical laws along with corresponding initial or boundary conditions to non-dimensional form while eliminating as many physical constants and variables as possible which is then used to obtain scale factors and similarity requirements. The objective of this study is to obtain scaling factors based on inspectional analysis to describe the temporal variability of soil hydraulic properties.

How to cite: Kumar, S. and Ojha, R.: Use of Scaling to Describe Temporal Variability of Soil Hydraulic Properties, EGU General Assembly 2023, Vienna, Austria, 23–28 Apr 2023, EGU23-4060, https://doi.org/10.5194/egusphere-egu23-4060, 2023.

The bioavailability and delivery of nutrients (solutes) to plant roots and soil microbes is governed by diffusive processes. According to Fick’s first law solute diffusion is driven by the diffusivity of the solute, the concentration gradient and the path length. We first shortly review the main factors potentially affecting these drivers i.e. the diffusivity (solute-soil interactions including ion exchange and other sorption reactions, microbial metabolism), the concentration gradient (source-sink relations via mobilization through biotic and abiotic reactions and solute uptake by organisms) and the path length (soil water filled pore space, pore size distribution, texture). Then, based on data synthesis of available microdialysis studies we provide evidence for the ranking of these factors in soils, depending on soil horizon (organic versus mineral soil), fertilization (agriculture versus forests), nutrient form (ammonium versus nitrate versus free amino acids; nitrate versus phosphate) and soil moisture, including drying-rewetting. Microdialysis represents a relatively recent minimal invasive technique for in situ and lab use to measure rates of diffusive solute (nutrient) transport on a microscale level. Since its first application in soil in 2005, this technique has provided unique, non-isotopic and non-destructive insights into major drivers of solute transport in soils, with ~45 studies published thus far.

How to cite: Wanek, W., Finta, D., and Inselsbacher, E.: Fundamental drivers of nutrient diffusion in soils - a comprehensive data synthesis based on microdialysis studies, EGU General Assembly 2023, Vienna, Austria, 23–28 Apr 2023, EGU23-4330, https://doi.org/10.5194/egusphere-egu23-4330, 2023.

Ignored until now for their hydrogeological potential, in the conditions of current climate changes, the Sarmatian deposits in the Moldavian Platform, Romania attract the attention of researchers aiming at the objectives of Romania's long-term security strategy. Vital resource, underground water, significantly affected by global climate changes, calls for regional management strategies that must be based on detailed hydrogeological research of storage, recharge and protection conditions under the impact of natural and anthropogenic factors.

Integration of contaminant migration is the current, highly effective approach for evaluation of groundwater resources used as the source of tapping groundwater supplies for a large part of urban and rural agglomerations.

The Sarmatian hydrostructures from the Moldavian Platform, with a high level of vulnerability to pollution, are the subject of our integrated hydrogeological modelling, in which the vadose zone is the main complex objective. Using our Integrated Hydrogeological Modelling we achieved the coupling of the contamination migration from the soil, the vadose zone and the phreatic Sarmatian hydrostructure in several areas (Huși, Vaslui, Botoșani).

The quantitative evaluations carried out on the conceptual 3D models of the SARMATIAN hydrostructures were carried out using the classic tools: ROCKWORKS, SESOIL, VS2DT, MODFLOW.

How to cite: Iojă, A. A. and Scrădeanu, D.: An Integrated Hydrogeological Modelling Approach to Evaluate Groundwater Resources of Sarmatian Hydrostructure from the Moldavian Platform, Romania, EGU General Assembly 2023, Vienna, Austria, 23–28 Apr 2023, EGU23-4476, https://doi.org/10.5194/egusphere-egu23-4476, 2023.

EGU23-4977 * | ECS | Posters on site | HS8.3.4 | Highlight

Unsaturated subsurface flow: How it evolves in the first 10 000 years after landscape initialization 

Anne Hartmann, Theresa Blume, and Markus Weiler

Form and function are two major characteristics describing hydrological systems and can also be helpful in the context of understanding and analyzing unsaturated flow. Whereas the term “form” summarizes the structure and properties of the system, the term “function” represents the hydrological response. Form parameters such as structural and hydraulic soil properties, but also vegetation cover, have a major influence on the subsurface hydrological response. The combination of different soil and surface properties affects the formation of subsurface hydrological flow paths and their interaction and feedbacks can lead to the formation of preferential flow paths that are difficult to characterize and predict. Little is known about how these characteristics co-evolve over time and how form impacts function in young hydrological systems.

We systematically investigated how form and function evolved during the first 10 millennia of landscape development. We analyzed two hillslope choronosequences in glacial forelands in the Swiss Alps, one developed from siliceous and one from calcareous parent material.
Variables describing form were studied in terms of soil properties and vegetation characteristics obtained by vegetation mapping, extensive soil sampling and laboratory analyses. Variables describing hydrologic function include soil water response times, soil water storage, dominant flow path types, and the frequency of preferential flow paths which were obtained by Brilliant Blue dye tracer irrigation experiments and sprinkling experiments with deuterium. A principal component analysis and clustering were used to identify how form features relate to specific functions.

Our investigation revealed differences in the evolution of form and function between the two different parent materials. At the calcareous site, a change in flow types with increasing moraine age was observed from a rather homogeneous matrix flow to heterogeneous matrix and finger-like flow. However, the high buffering capacity of the calcareous soil leads to less soil formation and fast, vertical subsurface water transport dominates the water redistribution even after more than 10 000 years of landscape evolution. At the siliceous parent material accumulation of organic material with high water storage capacity and podsolization was observed between 3 000 and 10 000 years of landscape development. Under these conditions water redistribution is dominated by vertical subsurface water transport via matrix flow only at young age classes (< 3 000 years). After 10 000 years of soil development vertical subsurface water transport below the organic top layer mainly takes place via macropore flow, and water storage in the organic surface layer and lateral subsurface water transport become the major components controlling water redistribution.

We found that in general the increase in preferential flow frequency is caused by soil development and is further enhanced by an increase in above ground biomass, organic matter and micro topography. Form parameters driving the evolution of subsurface function differ between the two contrasting geologies which highlights the importance of the parent material for landscape development.

How to cite: Hartmann, A., Blume, T., and Weiler, M.: Unsaturated subsurface flow: How it evolves in the first 10 000 years after landscape initialization, EGU General Assembly 2023, Vienna, Austria, 23–28 Apr 2023, EGU23-4977, https://doi.org/10.5194/egusphere-egu23-4977, 2023.

EGU23-5867 | Posters on site | HS8.3.4

Numerically efficient algorithm for simulating variably saturated flow in heterogeneous layered porous media 

Heejun Suk, Jize Piao, Weon Shik Han, and Seong-Kyun Kim

A new numerical method was developed to accurately and efficiently compute a solution of the nonlinear Richards equation with a layered soil. In the proposed method, the Kirchhoff integral transformation was applied. However, in the Kirchhoff integral transformation approach, the transformed Kirchhoff head has dyadic characteristics at the material interface between different soil types. To avoid the dyadic characteristics at the material interface, a truncated Taylor series expansion was applied to the Kirchhoff head at the material interface and so the Kirchhoff head was replaced with a single pressure head value at the material interface. Accordingly, through the Taylor series expansion, a set of algebraic equations in the one-dimensional control volume finite difference discretized system formed a tridiagonal matrix system. Through a series of numerical experiments, the new method was compared to other numerical methods to determine its superiority. The results clearly demonstrated that the approach was not only more computationally efficient, but also more accurate and robust than other numerical methods. Computational performance was greatly enhanced with the proposed method, and which could be used to simulate complicated heterogeneous flow at a large-scale watershed or regional scale.

Acknowledgments

This work was supported by the basic research project (23-3411) of the Korea Institute of Geoscience and Mineral Resources (KIGAM) funded by the Ministry of Science and ICT.

How to cite: Suk, H., Piao, J., Han, W. S., and Kim, S.-K.: Numerically efficient algorithm for simulating variably saturated flow in heterogeneous layered porous media, EGU General Assembly 2023, Vienna, Austria, 23–28 Apr 2023, EGU23-5867, https://doi.org/10.5194/egusphere-egu23-5867, 2023.

EGU23-5902 | ECS | Posters on site | HS8.3.4

GPU-accelerated numerical solution to the Richards Equation:performance and prospects 

Zhi Li, Daniel Caviedes-Voullième, and Ilhan Özgen-Xian

Catchment-scale hydrological simulations typically require numerical solutions to the Richards equation, which describes variably-saturated water flow in porous media. In recent years, with the widespread use of high-performance computing (HPC), the simulation speed of hydrological models have been significantly enhanced. However, existing numerical schemes for the Richards equation show different performance under different HPC configurations. It remains unclear if the serial Richards solvers scale well in parallel. 

In this work, four popular numerical schemes (the fully explicit scheme, the predictor-corrector scheme, the iterative Picard scheme, and the fully implicit Newton's scheme) are implemented to solve the three-dimensional Richards equation, aiming at investigating the performance of these schemes on both multi-core CPUs and GPUs. The codes are built under the Kokkos framework to achieve performance portability between CPU and GPU. Two infiltration problems with analytical solutions available are chosen to evaluate the model performance in terms of accuracy and efficiency. 

As expected, the simulation results indicate that the optimal solution schemes on CPU and GPU could be different. Moreover, the numerical scheme, the linear system solver, and the soil properties all have influence on scaling. A hybrid scheme is promising for minimizing the computational cost under various simulation conditions. The findings of this work will guide the development of the subsurface flow module of the performance-portable, multi-physics model, SERGHEI.

How to cite: Li, Z., Caviedes-Voullième, D., and Özgen-Xian, I.: GPU-accelerated numerical solution to the Richards Equation:performance and prospects, EGU General Assembly 2023, Vienna, Austria, 23–28 Apr 2023, EGU23-5902, https://doi.org/10.5194/egusphere-egu23-5902, 2023.

EGU23-7560 | Posters on site | HS8.3.4

Soil salinization risks under current climate and irrigation management in orchards of southern Portugal 

Tiago Ramos, Hanaa Darouich, Ana Oliveira, Mohammad Farzamian, and Maria Gonçalves

Secondary salinization has long been reported in the Roxo Irrigation District (RID), in southern Portugal, due to use of saline prone irrigation water and the existence of poor structured soils. This study evaluates the soil water and salt budgets in nine commercial orchards located in the RID using the multiple ion chemistry module available in the HYDRUS-1D model during the 2019 and 2020 growing seasons. The study crops were almond, olive, citrus, and pomegranate. The model successfully simulated soil water contents measured in the different fields along two seasons. There was a clear underestimation of the ECe in some fields while simulations of SAR were found to be acceptable. Modeling errors were mostly associated to missing information on fertigation events rather than difficulties in simulating the effect of irrigation water quality on soil quality. The water and salt balances were also computed for the 1979-2020 period. Considering the probability of distribution of salt accumulation during this period, the risk of salt accumulation was very high, except in the citrus areas. The factors influencing the salinity build-up in the study sites were the irrigation strategy, the seasonal irrigation and rainfall depths, the crop growing period, rainfall distribution in the late and non-growing seasons, soil drainage conditions, and irrigation water quality. On the other hand, for current climate conditions and irrigation water quality, the risk of soil salinity levels affecting crop development and yields were found to be minor. Only in two of the study sites, there was the need to promote salt leaching following strategies that differed between locations. This study further aims to promote sustainable irrigation management practices through the better use of soil and water resources in the Alentejo region of southern Portugal.

How to cite: Ramos, T., Darouich, H., Oliveira, A., Farzamian, M., and Gonçalves, M.: Soil salinization risks under current climate and irrigation management in orchards of southern Portugal, EGU General Assembly 2023, Vienna, Austria, 23–28 Apr 2023, EGU23-7560, https://doi.org/10.5194/egusphere-egu23-7560, 2023.

EGU23-7887 | ECS | Posters on site | HS8.3.4

The connection between soil water content and stream flow in the experimental catchment of Magyaregregy (Hungary) 

Dániel Koch, Fruzsina Kata Majer, Gábor Keve, and Katalin Bene

With the increasingly negative impact of climate change, there is a significant need for more accurate runoff measurements in steep-sloped catchments to understand and predict the impact of extreme weather conditions. The spatial and temporal variability of precipitation, different soil parameters, soil moisture and infiltration characteristics significantly influence the surface runoff and channel flow processes in natural catchments.

During the last 5 years, the Faculty of Water Sciences of the University of Public Service developed a complex meteorological and hydrological monitoring system at Várvölgyi creek which is a 5.95 km2 sub-catchment of Völgységi creek watershed. The small steep-sloped experimental catchment lies on the border of Magyaregregy. This small village located in the eastern Mecsek region in the southern part of Hungary. The research program aims to better understand each runoff process element in the watershed. Five years ago, a meteorological station was installed to improve rainfall measurement accuracy. In addition to meteorological and flow measurements, soil moisture sensors were recently installed at three locations to record soil moisture data at six different depths. In this paper, we investigate the connection between soil water content and streamflow.

The research presented in the article was carried out within the framework of the Széchenyi Plan Plus program with the support of the RRF 2.3.1 21 2022 00008 project.

How to cite: Koch, D., Majer, F. K., Keve, G., and Bene, K.: The connection between soil water content and stream flow in the experimental catchment of Magyaregregy (Hungary), EGU General Assembly 2023, Vienna, Austria, 23–28 Apr 2023, EGU23-7887, https://doi.org/10.5194/egusphere-egu23-7887, 2023.

EGU23-8004 | ECS | Orals | HS8.3.4

Effect of Nanohydroxyapatite in Lowland Rice and Simulation of Phosphorus Transport using Hydrus-1D 

Chwadaka Pohshna and Damodhara Rao Mailapalli

Excessive phosphorus (P) application through conventional fertilizers to maintain crop yield has increased P pollution and created environmental concerns with serious implications on surface and ground waters. To improve the P nutrient uptake and minimized the undesirable impacts of conventional P fertilizer, nanoparticle such as hydroxyapatite nanoparticle (HANP) was synthesized using the phosphoric acid-treated calcinated chicken eggshells in a planetary ball mill. The synthesized HANP was used as a P nutrient source for lowland rice and the effects on rice agronomical parameters (plant height, tiller count, biomass and yield), P transport and leaching in rice soil with the application of HANP as a P source were studied alongside conventional fertilizer (SSP) and control experiments (CNT) for three seasons (Rabi 2018-19, Kharif and Rabi 2019-20) using field columns. Then the water flow and P transport were simulated with the help of the Hydrus-1D model. The nanoparticles size HANP resulted after 10 hours of milling with a milling speed of 500 rpm and they were observed to be mostly oval in shape with an average particle size of 105 nm. The field column studies indicated an improved plant height, tiller count and yield with HANP and SSP treatment as compared to CNT treatment. No significant difference was observed between HANP and SSP treatment. A significant difference in ortho-P concentration between HANP and SSP treatment was observed in both ponding water and leachate water with higher ortho-P concentrations in SSP as compared to HANP treatment. The simulation results indicated that the Hydrus-1D model successfully simulated the bottom flux and the ortho-P concentration in the leachate very well with a good coefficient of determination (R2), Nash–Sutcliffe efficiency (NSE) and root mean square error (RMSE) values. The value of distribution coefficient Kd was found to be higher in the case of HANP as compared to SSP treatment indicating that more adsorption of P to soil particles occurs in HANP treatment. While the longitudinal dispersivity and the diffusion or precipitation rate constant were approximately higher in SSP treatment than in HANP treatments indicating less local variations in the velocity field of ortho-P in the direction of fluid flow, and a lower dissolution rate of HANP treatment as compared to SSP treatment. Thus the potential of HANP for use as P fertilizer can be demonstrated by the ability to sustain the agronomical parameters of rice crops and the reduced leaching rate and slow-releasing property of the material.

Keywords: Hydroxyapatite, phosphorus, rice, nanofertilizer, Hydrus 1D model

How to cite: Pohshna, C. and Mailapalli, D. R.: Effect of Nanohydroxyapatite in Lowland Rice and Simulation of Phosphorus Transport using Hydrus-1D, EGU General Assembly 2023, Vienna, Austria, 23–28 Apr 2023, EGU23-8004, https://doi.org/10.5194/egusphere-egu23-8004, 2023.

EGU23-8262 | ECS | Posters on site | HS8.3.4

Compounding Effects of Salinity and Compaction on Hydraulic Properties of Roadside Stormwater Control Measures 

Lucy Archibald, Ganesh Khatei, Josh Caplan, Scott Van Pelt, Paolo D’Odorico, and Sujith Ravi

Stormwater control measures (SCMs) such as retention basins, bioswales, and bioinfiltration systems are used to reduce peak flows and remove pollutants from stormwater in temperate urban landscapes. However, the application of de-icing salts to roadways can substantially increase the salinity of stormwater basin media (i.e., engineered soil), likely impacting the physical properties of these soils. Further, SCM soils can become moderately compacted, potentially altering the extent and effects of salinization on soil physical properties. Although many studies have documented the high salinity of roadside soils in winter, the effects of salinity on soil hydraulic properties is not well understood, especially in the context of urban stormwater basins. Here, we compared the water retention properties (spanning pressure potentials of -10 to -1,000,000 hPa) of salinity-affected stormwater media (1-100 dS m-1, using Na+ and Mg2+ salts) that was either uncompacted or compacted. The effects of salinity on both matric and osmotic potential included shifts in the plant-available range with the magnitude depending on a combination of salt type and concentration. We attribute these changes to salinity inducing shifts in both surface tension and pore size distributions. Further, compaction increased the severity of salinization under low salinity conditions but not high. Climate change may increase the number and intensity of snow events in many temperate urban regions, which may increase salt loads to stormwater control measures, exacerbating the aforementioned effects.

How to cite: Archibald, L., Khatei, G., Caplan, J., Van Pelt, S., D’Odorico, P., and Ravi, S.: Compounding Effects of Salinity and Compaction on Hydraulic Properties of Roadside Stormwater Control Measures, EGU General Assembly 2023, Vienna, Austria, 23–28 Apr 2023, EGU23-8262, https://doi.org/10.5194/egusphere-egu23-8262, 2023.

EGU23-8316 | Orals | HS8.3.4

Reconstructing spatial variability of forest soil water characteristic by using a combination of electrical resistivity tomography and local soil water content measurements 

Ursula Noell, Erkki Hemmens, Bernd Ahrends, Susanne Stadler, Stefan Fleck, and Klibw-gw working group

Effective management of groundwater resources requires conclusive evidence and understanding of forest management effects (tree species selection, harvest intensities, forest rotation periods) on groundwater recharge. The high spatial variability of forest soil characteristic hampers an area representative measurement of forest soil moisture distribution and flow processes in the unsaturated zone. This results in high uncertainties in the detection of tree species difference of water balance and groundwater recharge in forests. We attempt to delineate this heterogeneity by combining different investigation methods and forest stands of different tree species. From 2019 – 2022 we investigated a Norway spruce stand (Picea abies (L.) KARST.) in the Solling mountains (AMT 7.3°C, AMP 1168 mm). The observation shows higher moisture contents close to the trees, where the root density is highest. We calculated a site-specific function relating electrical resistivity to soil water content and used this to reconstruct moisture changes down to a depth of one meter below the rooting zone. Recharge seems to happen not only in winter but also in summer after intense precipitation events. During a severe spring drought in 2020, the water content dropped markedly in the rooting zone. In 2022 we started the observation of the water balance in a lowland Scots pine stand (Pinus sylvestris) with locally regenerating red oak (Quercus rubra) in the shrub layer. The geophysical monitoring using electrical resistivity tomography discovered again lower resistivity indicating higher moisture content close to the trees where root density is highest. The application of different inversion smoothness constraints revealed differences in resulting electrical resistivity values, showing the non-uniqueness of the inversion results. This presents a challenge, relating single point soil water measurements to ERT 3D inversion results and calls for the need to construct a site-specific Archie function by using simultaneous water content measurements at the site rather than laboratory measurements. The investigations will continue in stands of Douglas fir (Pseudotsuga mentiesii), red oak (Quercus rubra), common oak (Quercus robur) and European beech (Fagus sylvatica).

The project is funded by the Forest Climate Fond under the joint leadership of BMUV and BMEL (Federal Ministry for the Environment, Nature Conservation, Nuclear Safety and Consumer Protection and the Federal Ministry of Food and Agriculture (KLIBW-GW:FKZ: 2220WK39B4 and 2220WK39B4)).

How to cite: Noell, U., Hemmens, E., Ahrends, B., Stadler, S., Fleck, S., and working group, K.: Reconstructing spatial variability of forest soil water characteristic by using a combination of electrical resistivity tomography and local soil water content measurements, EGU General Assembly 2023, Vienna, Austria, 23–28 Apr 2023, EGU23-8316, https://doi.org/10.5194/egusphere-egu23-8316, 2023.

EGU23-8548 | Orals | HS8.3.4

Groundwater recharge estimation and uncertainty analysis for various soils in Austria 

Christine Stumpp, Marleen Schübl, and Giuseppe Brunetti

Groundwater recharge is a key component of the hydrologic cycle, yet its direct measurement is difficult. An alternative is its inverse estimation with a combination of physically based numerical models and soil water observations. However, simulated water fluxes are affected by model predictive uncertainty which are often not considered when simulating and predicting groundwater recharge rates. Therefore, the objective of this study was to use of long-term soil water content measurements at 14 locations from the Austrian soil water monitoring program to quantify and compare local, potential groundwater recharge rates, their temporal variability, and predict future changes in potential groundwater recharge for different climate scenarios. Observations were coupled with a Bayesian probabilistic framework to calibrate the model HYDRUS-1D and assess the effect of model predictive uncertainty on simulated recharge fluxes. Estimated annual potential recharge rates ranged from 44 mm/a to 1319 mm/a with a relative uncertainty (95% interquantile range/median) in the estimation between 1-39%. Recharge rates decreased longitudinally, with high rates and lower seasonality at western sites and low rates with high seasonality and extended periods without recharge at the southeastern and eastern sites of Austria.  Higher recharge rates and lower actual evapotranspiration were related to sandy soils. Future recharge predictions at the median remained close to past rates, except for sites in the East, where they increased. In general, predictions varied drastically between different climate models and emission scenarios, especially for the summer months. Across all projections, an increase in winter recharge at the western sites was predicted, due to higher temperatures with less snow accumulation and/or higher amounts of winter precipitation, followed by decreasing recharge rates in spring. Decreasing tendencies in groundwater recharge were stronger at western sites and at higher altitudes, with longer drought periods lasting until later within the calendar year. Uncertainty in recharge prediction was largely dominated by the difference in climate projections, only at the dry sites in the East and for shorter time periods, soil hydraulic parameter uncertainties played a role.

How to cite: Stumpp, C., Schübl, M., and Brunetti, G.: Groundwater recharge estimation and uncertainty analysis for various soils in Austria, EGU General Assembly 2023, Vienna, Austria, 23–28 Apr 2023, EGU23-8548, https://doi.org/10.5194/egusphere-egu23-8548, 2023.

Transport and retention of fecal indicator bacteria in unsaturated porous media: effect of transient water flow


Rozita Soltani Tehrania*, Luc Hornstrab, Jos van Dama, Gijsbert Cirkelb


a Department of Soil Physics and Land Management, Wageningen University and Research, P.O. Box 47, 6700 AA Wageningen, the Netherlands
b KWR Water research Institute, Nieuwegein, the Netherlands


Email addresses: rozita.soltanitehrani@wur.nl (R. Soltani Tehrani), luc.hornstra@tno.nl (L. Hornstra), jos.vandam@wur.nl (J. van Dam) Gijsbert.Cirkel@kwrwater.nl (G. Cirkel)


Abstract

To produce clean drinking water, the processes governing bacterial remobilization in the unsaturated zone at transient water flow are critical. While managed aquifer recharge is an effective way to dispose of pathogens, there are concerns about recontamination after precipitation infiltration. To better understand how bacteria that were initially retained in porous media can be released to groundwater due to transient water content, transport experiments and modeling for Escherichia coli and Enterococcus moraviensis were conducted at the soil column scale. After inoculating dune sand columns with bacteria suspension for 4 h, three rainfall events were performed at 24 h intervals. The effluent from sand columns was collected to analyze bacteria breakthrough curves (BTCs). After the rainfall experiments, the bacteria distribution in the sand column was determined. The collected BTCs and profile retentions were modeled with HYDRUS-1D, using different model concepts: one-site kinetic attachment/detachment (M1), Langmuirian (M2), Langmuirian, and blocking (M3), and two-site attachment/detachment (M4). After inoculation, almost 99 percent of the bacteria remained in the soil, according to the findings of the experiments. The M1 and M2 bacteria models had a high agreement between observed and modeled concentrations, and attachment and detachment were two significant mechanisms for regulating bacteria movement in a porous medium with fluctuations in water flow. At the end of the experiment, the majority of bacteria were still found at the column entrance. Our experiments show that E. coli is more mobile in sandy soils than E. moraviensis. The results of this study suggest that the unsaturated zone is an important barrier between microbial contamination at the soil surface and groundwater. Bacteria that accumulate in the unsaturated zone, on the other hand, can multiply to such an extent that they can be released into the saturated zone when saturation changes due to major rain events or variations in groundwater level. A Follow-up study is needed to completely understand the variables that regulate bacteria remobilization in the unsaturated zone of dune sands.


How to cite: Soltani Tehrani, R.: Transport and retention of fecal indicator bacteria in unsaturated porous media: effect of transient water flow, EGU General Assembly 2023, Vienna, Austria, 23–28 Apr 2023, EGU23-9076, https://doi.org/10.5194/egusphere-egu23-9076, 2023.

EGU23-10247 | Posters on site | HS8.3.4

Numerical Modeling of Vadose Zone Processes using Version 5 of HYDRUS and its Specialized Modules 

Jiri Simunek, Giuseppe Brunetti, Diederik Jacques, Tiantian Zhou, and Miroslav Šejna

In this presentation, we will review version 5 of HYDRUS, which resulted from merging earlier versions of HYDRUS-1D (4.x) and HYDRUS (2D/3D) (3.x), implementing the new integrated form of coupling PHREEQC with HYDRUS (HPx), and including new modules such as Furrow, PFAS, Particle Tracking, Dynamic Plant Uptake, Cosmic, Stable Isotopes, C-Ride, etc. The new HYDRUS GUI dramatically improves graphical capabilities and extends its compatibility to new Windows-based (e.g., 64) bit) operating systems. The new modules and capabilities include: a) the Particle Tracking module (to calculate soil water’s transit times and their frequency distributions), b) the Cosmic module (to calculate cosmic-ray neutron fluxes and to use them to inversely estimate large-scale soil hydraulic properties), c) the Dynamic Plant Uptake (DPU) module (to calculate the translocation and transformation of chemicals in the soil-plant continuum), d) the PFAS module (to consider sorption on the air-water interface and the effects of concentration on viscosity and surface tension, and correspondingly on conductivities and pressure heads), e) the Isotope module (to consider the fate and transport of soil water isotopes with evaporation fractionation, f) the C-Ride module (to consider colloid and colloid-facilitated solute transport), and many other new options and graphical (e.g., two-dimensional z-t graphs of main variables) capabilities. Several nonstandard HYDRUS modules (e.g., accounting for overland flow, freezing/thawing, and alternative root water uptake models) will also be discussed.  

How to cite: Simunek, J., Brunetti, G., Jacques, D., Zhou, T., and Šejna, M.: Numerical Modeling of Vadose Zone Processes using Version 5 of HYDRUS and its Specialized Modules, EGU General Assembly 2023, Vienna, Austria, 23–28 Apr 2023, EGU23-10247, https://doi.org/10.5194/egusphere-egu23-10247, 2023.

EGU23-11064 | ECS | Orals | HS8.3.4 | Highlight

Improved understanding of unstable finger formation in partially wettable soils 

Naaran Brindt, Jiuzhou Yan, Xinying Min, Jean-Yves Parlange, and Tammo Steenhuis

Understanding how water infiltrates soils is essential in groundwater recharge and surface runoff predictions and agrochemical contamination assessment. Infiltration fronts are often envisioned as flat, uniform wetting fronts in which water content and pressure decrease monotonically. However, water infiltration occurs as unstable gravity-driven flow in homogeneous coarse-textured or water-repellent soils as fingers, bypassing most of the soil. A characteristic of these fingers is that the advancing tips are near saturation, and the moisture content and pressure decrease behind the front. Despite many approaches to modeling this flow, the explanation for the increased pressure at the wetting front of these unstable flow fingers has remained elusive. We postulated a discontinuous matric potential at the wetting front resisting uniform water entry in the dry soil. Instead, water moves one pore at a time across the front, inducing high localized velocities that increase the static contact angle to a dynamic one, which the Hoffman-Jiang equation can describe. It causes the matric potential to increase at the front. These high velocities during pore invasion are akin to what is known as Haines jumps which require high-frequency sensors to detect.

In this study, we aimed to prove the hypothesis experimentally and refine the theory using a high-speed camera and high-frequency pressure measurements of water infiltration into partially wettable sand. A 30X50X1.6 mm glass flowcell was packed with air-dry quartz sand. Water infiltration to the cell was 15 μl/min. Porewater pressure was recorded at 500 Hz through a needle tensiometer at the back of the flow cell wall. A high-resolution, high-speed camera recorded the pore invasion at 500 fps over an area of 32X32 mm surrounding the tensiometer. A second set of experiments was performed at even greater magnification, looking at a single pore (5X5 mm) where the wetting front’s contact angle could be measured visually during infiltration. The results showed that water advanced as a series of invasion events through one or two pores lasting a few milliseconds separated by longer periods where the front was static. The invasion pore flow velocities exceeded the saturated hydraulic conductivity by three orders of magnitude. In addition, the high magnification experiment found that the changes in the contact angle during pore invasion and the observed pore water velocities agreed with the Hofmann Jiang predictions. Our experimental results offer new insights into how water infiltrates the soil, as studies rarely measure infiltration with such small spatial and temporal scales.

How to cite: Brindt, N., Yan, J., Min, X., Parlange, J.-Y., and Steenhuis, T.: Improved understanding of unstable finger formation in partially wettable soils, EGU General Assembly 2023, Vienna, Austria, 23–28 Apr 2023, EGU23-11064, https://doi.org/10.5194/egusphere-egu23-11064, 2023.

EGU23-11132 | Posters on site | HS8.3.4

Validation of coupled water, vapor and heat flow models with evaporation experiments 

Sascha Iden, Johanna Blöcher, Efstathios Diamantopoulos, and Wolfgang Durner

Evaporation from bare soil is an important hydrological process and part of the water and energy balances of land surfaces. Comprehensive modelling of this process must include coupled liquid, vapor and heat fluxes. Model concepts of varying complexity have been proposed to predict water loss from soil through evaporation. The objective of our study was to test a coupled water, vapor and heat flow model with data from laboratory evaporation experiments under different boundary conditions. Laboratory evaporation experiments were conducted with a sand and a silt loam under three atmospheric forcings. Pressure heads, soil temperature and the evaporation rates were monitored and the experiments were simulated with a coupled water, vapour and heat flow model which solves the surface energy balance and predicts the evaporation rates. The evaporation dynamics was well captured, in particular the onset of stage-two evaporation and the evaporation rates during stage-two. A valid description of the observed data required the use of a comprehensive model of the soil hydraulic properties which accounts for water adsorption and film flow. However, a slow continuous decrease in the measured evaporation rate during stage-one could not be described with the model under the assumption of a constant aerodynamic resistance. While the addition of established empirical soil resistance parametrizations significantly degraded model performance, the use of a boundary layer resistance improved the evaporation rate predictions for the sandy soil but not for the silt loam. Care should be taken when using resistance parametrizations in coupled modelling of bare soil evaporation.

How to cite: Iden, S., Blöcher, J., Diamantopoulos, E., and Durner, W.: Validation of coupled water, vapor and heat flow models with evaporation experiments, EGU General Assembly 2023, Vienna, Austria, 23–28 Apr 2023, EGU23-11132, https://doi.org/10.5194/egusphere-egu23-11132, 2023.

EGU23-11736 | Posters on site | HS8.3.4 | Highlight

Dynamic modeling of plant uptake and leaching of pesticides applied at an apple orchard 

Arno Rein, Quanshun An, Yangliu Wu, Dong Li, Xianghong Hao, and Canping Pan

Apple production is a major agricultural activity in many regions around the globe. Over the past decades, a range of different pesticides have been used for preventing fungal and insect infestations. Evaluating the fate of pesticides in plants and soil is important for determining human health risks arising from chemical residues in fruits as well as ecological risks, among others resulting from pesticide fate in soils and eventually leaching to groundwater.

This study aimed at improving the understanding of complex fate and transport processes interacting in the soil-plant system of an apple orchard. Field experiments were done with different insecticides and fungicides that are frequently applied in agricultural practice. Pesticide concentrations in soil and different plant parts were observed at different times under a multiple pesticide applications scenario.  A coupled soil-plant model was set up for numerically simulating pesticide fate and comparison with observed pesticide concentrations. This model considers a tipping buckets approach for soil water and solute transport, linked with a dynamic numerical model for plant uptake and translocation of chemicals within plants, implementing a fruit growth model for explaining the fruit growth dilution. Moreover, risks posed for food safety were estimated.

This model approach was successful for describing observed pesticide residues. Up to 25% of the applied chemicals were deposited on leaves and up to 0.6% on fruits, and up to 61% entered the topsoil directly after application. A decrease in fruit concentration was observed, which could be explained by biodegradation and growth dilution as the main contributions, as well by wash-off. First estimates of dietary risks indicated that the ingestion of the treated apples may not lead to relevant acute or chronic human health risks. The contribution of the different pathways leading to pesticide residues and their dynamics in plant material was highly influenced by precipitation patterns, fruit growth dilution and pesticide characteristics. Our model approach can contribute to an improvement of process understanding concerning the fate of pesticides in apple orchards and pesticide utilization. It has a high potential for supporting decision making with respect to food safety and minimizing risks associated to pesticide use.

How to cite: Rein, A., An, Q., Wu, Y., Li, D., Hao, X., and Pan, C.: Dynamic modeling of plant uptake and leaching of pesticides applied at an apple orchard, EGU General Assembly 2023, Vienna, Austria, 23–28 Apr 2023, EGU23-11736, https://doi.org/10.5194/egusphere-egu23-11736, 2023.

In Germany, electricity from the wind power plants in the north must be transported to the south. This is done via underground cables that act as a heat source. We numerically simulated the coupled heating and drying by the cables in the bedding and the surrounding soil under natural boundary conditions. For this purpose, we used a modified version of the Hydrus-2D/3D software code, which enables the coupled modelling of water, vapour and heat flow. The water transport is described with the Richards equation. For heat transport, the processes of heat conduction, convective heat transport and the transport of latent heat are considered. The simulations were carried out in a 2D depth profile oriented orthogonally to the main direction of the cables. The simulations were carried out under atmospheric boundary conditions for the period 2016-2018, the latter being one of the driest years in Germany in recent history.  

We found that warming leads to thermal vapour fluxes that are directed away from the cable, which can significantly reduce the water content of the material near the cable. The lowering of the soil water content reduces the thermal conductivity of the soil and can therefore lead to overheating of the cable with the risk of technical failure. However, the simulations indicate that even under the conditions of 2018, overheating of the cables is unlikely if the bedding material has sufficient thermal conductivity and the spacing between the individual cables is chosen wisely. Crucial for adequate modelling of the water and heat flow was the correct representation of the water retention curve in the dry soil, as the water head in the soil near the cable reaches values down to -105 J kg-1 and soil thermal conductivity changes rapidly at low water contents.

How to cite: Durner, W., Simunek, J., and Iden, S.: Coupled hydrothermal modelling of subsurface heating in the vicinity of high-power power cables under natural conditions, EGU General Assembly 2023, Vienna, Austria, 23–28 Apr 2023, EGU23-12451, https://doi.org/10.5194/egusphere-egu23-12451, 2023.

EGU23-14720 | Posters on site | HS8.3.4 | Highlight

Spatio-Temporal Water Fluxes in the Slope-Soil-Tree Continuum of a Temperate Beech Forest in central Germany 

Daniel Schwindt, Michael Dietze, Jago Jonathan Birk, Simon Drollinger, Adrian Flores-Orozco, and Daniela Sauer

Climate change affects temperate forests particularly by changes in water availability as a result of rising temperatures and changing precipitation dynamics. While the annual mean will remain roughly constant, it is the intensity pattern that will change: light precipitation events decrease and heavy precipitation events increase. Droughts and heat waves are assumed to become more frequent, longer and more intense, also as a feedback mechanism of reduced soil moisture affecting evapotranspiration. In addition to meteorological droughts, edaphic droughts are anticipated to increase in the future. These developments impact the soil hydrological functions with altered infiltration conditions, increased surface runoff and an increasing proportion of preferential flow affecting a more complex and heterogeneous water distribution in the subsurface. Yet the link between tree mortality and the reduced and more heterogenous soil water distribution is still not fully understood

The majority of approaches analysing soil moisture dynamics are based on point measurements, which do not account for the high spatial variability of soil water. Here, we close this knowledge gap by fusing established point-measurements with geophysical methods to assess the spatio-temporal dynamics of water fluxes in the near-surface subsoil from slope to the root zone scale. The questions we ask focus on how infiltration, subsurface water flow, soil moisture distribution and persistence are affected by (i) the subsurface architecture including textural variations as well as preferential flow paths (macro pores, root tracks) and (ii) hydrological extremes (droughts, rain events).

Our study site is located in a beech forest near Ebergötzen (central Germany). The Triassic sandstones are overlain by periglacial slope deposits with varying amounts of loess. The Ebergötzen test site is equipped with numerous sensors for analysing water and element fluxes. In addition to meteorological parameters, we collect 15 min times series of throughfall, stemflow, soil water content, water tension and sap flow. This set-up is ideally suited to quantify water fluxes on a point-by-point basis with high temporal resolution, and to validate complementary, beyond-point approaches. To account for the small-scale variability of processes, geophysical methods with a focus on high-resolution electrical resistivity tomography (Dipole-Dipole, 48 electrodes, 15 cm spacing) were used. Measurements were carried out as a combination of a long-term approach (fortnightly/monthly) and event-based measurements (thunderstorm, round the clock).

Our data indicate a relatively uniform decrease in soil moisture during prolonged dry periods, with root-water uptake locally causing higher dynamics. In contrast, subsurface moisture penetration after precipitation events is spatially highly variable, confirming the importance of preferential flow for infiltration and distribution of water in the subsurface and thus show the high demand for spatially high-resolution measurements of soil moisture dynamics.

How to cite: Schwindt, D., Dietze, M., Birk, J. J., Drollinger, S., Flores-Orozco, A., and Sauer, D.: Spatio-Temporal Water Fluxes in the Slope-Soil-Tree Continuum of a Temperate Beech Forest in central Germany, EGU General Assembly 2023, Vienna, Austria, 23–28 Apr 2023, EGU23-14720, https://doi.org/10.5194/egusphere-egu23-14720, 2023.

EGU23-16234 | ECS | Posters on site | HS8.3.4

The use of stable pore water isotopes in the study of nitrate leaching 

Francesca Lobina, Stefania Da Pelo, Christine Stumpp, Claudio Arras, Riccardo Biddau, Antonio Coppola, and Andrea Vacca

In recent years, with the development of intensive farming and livestock breeding activities, nitrate contamination of aquifers has occurred. The importance of the unsaturated zone in the study of nitrate percolation is well recognized. The vadose zone represents a fundamental part of the water cycle, capable of storing water, providing water for vegetation, transporting solutes and degrading contaminants before they reach the aquifer.
This research involves two areas with different geological, hydrogeological and pedological properties located in Sardinia. The plain of Arborea has been designated as Nitrate Vulnerable Zone (NVZ) since 2005, but despite the reduction of nitrogen input no significant improvement in water quality has been achieved. In the Southern Campidano plain, an area with an agricultural tradition, significant nitrate concentrations were observed in groundwater.
The main objective of this research is to estimate the groundwater recharge rate using vadose-zone water stable isotope profiles.
Firstly, to understand the dynamics of water percolation through the vadose zone, soil samples were collected at different depths to analyzed for physical properties, including soil-water content, and grain size to estimate soil hydraulic properties. In addition, suction cups were installed at different depths at each site to extract pore water from the soil for chemical analysis.
In hydrological systems, the use of stable isotopes (18O and 2H) of pore water as environmental tracers is considered the most useful tool for establishing water flow and contaminant transport. In this study stable pore water isotope profiles combined with water content profiles were used to obtain insight into the transit time of water percolating through the vadose zone. At each of the two study sites, vertical soil sampling was made along the vadose zone and the soil samples collected were analyzed for stable water isotope ratios (18O and 2H) and volumetric water content. Through the seasonal signatures of stable isotopes in leachate water it is possible to quantify possible groundwater recharge, this approach, called the peak-shift method assumes advection-dominated transport.
Analysis of nitrate concentrations in soil water below the root zone using suction cups combined with groundwater recharge rates will allow an estimate of site-specific nitrate leaching. Through this approach, it is possible to evaluate potential and conservative propagation of nitrogen at specific depths to be compared with the concentrations measured to gain information on nitrate transformation processes in the soil.

How to cite: Lobina, F., Da Pelo, S., Stumpp, C., Arras, C., Biddau, R., Coppola, A., and Vacca, A.: The use of stable pore water isotopes in the study of nitrate leaching, EGU General Assembly 2023, Vienna, Austria, 23–28 Apr 2023, EGU23-16234, https://doi.org/10.5194/egusphere-egu23-16234, 2023.

EGU23-16387 | ECS | Orals | HS8.3.4

A modelling framework to estimate the impact of rewetting projects on agricultural activities in Flanders  

Diana Estrella, Martin Mulder, Tom De Swaef, Ruud Bartholomeus, and Sarah Garré

The Flemish coalition agreement 2019-2024 places a strong emphasis on increasing our resilience to drought, including through the active use of resilient zones with (extra) nature to mitigate the effects of climate change. Neighboring agricultural activities can experience positive effects by buffering water in the landscape. However,  too shallow  groundwater levels can have consequences for the workability of the land and the crop growth itself.  This means that farmers and policy-makers do not only need to adapt to an increased occurrence of droughts, but probably also to the impacts of excessive soil water. Therefore, the project PEILIMPACT developed and applied model instruments, adapted to the Flemish conditions, to determine the impact of rising groundwater levels on the yield of common agricultural crops. The model SWAP-WOFOST, part of Water Vision Agriculture as developed for the Netherlands, was used for this purpose together with open data layers available in Flanders. The evaluation framework was based on an extensive literature review of the main points of attention in agriculture. Possible obstacles and concerns from main stakeholders (e.g. farmers) in different regions were also included in the evaluation framework. Results indicate that the impact of soil moisture conditions on crop yields is highly variable, both spatially and temporally. Areas with very shallow groundwater levels (>1 m) are negatively affected in wet years, but benefit in dry years. The opposite occurs in deeper groundwater levels, where more precipitation could compensate for the low groundwater contribution. The final report as well as the model instruments are freely available and documented so that application to specific locations where rewetting projects are planned is possible for all interested parties.  

How to cite: Estrella, D., Mulder, M., De Swaef, T., Bartholomeus, R., and Garré, S.: A modelling framework to estimate the impact of rewetting projects on agricultural activities in Flanders , EGU General Assembly 2023, Vienna, Austria, 23–28 Apr 2023, EGU23-16387, https://doi.org/10.5194/egusphere-egu23-16387, 2023.

EGU23-17163 | ECS | Posters on site | HS8.3.4

Influence of soil structure on the spatiotemporal variability of subsurface water flows in a volcanic ash-derived soil 

Sebastián Bravo Peña, José Dörner, and Loes van Schaik

Predicting the spatiotemporal variability of soil moisture dynamics at different scales is a major challenge. Moreover, multimodal soil hydraulic properties resulting from complex soil structures, such as the exhibited by volcanic soils, still lack realistic and dynamic parameterisation. This work aimed to shed light on the spatiotemporal heterogeneity of subsurface water flows and soil water distribution during wet and dry conditions in volcanic ash-derived soil. The volumetric moisture content (VMC) at 10, 20, and 60 cm depth was measured with a set of eight TDR sensors from September 2019 to January 2022 with a 10-minute resolution. These VMC time series were separated into wet (WP) and dry (DP) periods based on the mean VMC. Subsequently, the spatiotemporal variability in moisture content within the soil profile was analysed using spectral analyses. The propagation of periodicities from Prate to the three topsoil VMC time series as well as the time scales in the correlation of the VMC between sensors were described. Finally, the time dependency of wetting slopes (St) on Prate was assessed by the cross-correlation function (CCF). The VMC dynamics vary between WP and DP, related to the water-filled pore space and pore size distribution. The CWT showed that Prate periodicities propagate to VMC, except for periodicities of 3 to 6 months scales. The WC showed that increases in VMC result in an exponential decrease in the minimum time scale of correlation between moisture contents measured within the topsoil. The CCF described a moderate temporal correlation between Prate and St. The soil wetting response to precipitation was notably faster during wet periods, while the cross-correlation lag and the response heterogeneity increased during dry conditions. The heterogeneity of subsurface water flows resulting from complex soil structure dynamics were described by the spatiotemporal variability of soil moisture in volcanic ash- derived soil. VMC response to Prate is faster during wetter conditions than in dry periods. Temporal periodicities within the topsoil suggest that hydraulic properties experience a dynamic shift from a heterogeneous to a homogeneous system. Changes in the temporal correlation of the soil moisture measured within the topsoil, along with an accurate description of the time dependency of St on Prate, can be valuable for further understanding the hysteresis of soil moisture variations in a soil profile.

How to cite: Bravo Peña, S., Dörner, J., and van Schaik, L.: Influence of soil structure on the spatiotemporal variability of subsurface water flows in a volcanic ash-derived soil, EGU General Assembly 2023, Vienna, Austria, 23–28 Apr 2023, EGU23-17163, https://doi.org/10.5194/egusphere-egu23-17163, 2023.

HS9 – Erosion, sedimentation & river processes

EGU23-863 | ECS | Posters on site | HS9.1

At the crossroads of different fine sediment fingerprinting methods in the Jiu River Basin (SW Romania) 

Gabriela Adina Morosanu, Liliana Zaharia, Philippe Belleudy, Eugen Traista, and Magdalena Misz-Kennan

Fine sediments in rivers hold the imprint of the lithological and geochemical features of their origin areas and sometimes intermediate storage, as well as of the influence of human activities. This research addresses the issue of the heterogeneous sources and transfer paths of fine sediments in a medium-sized (10,080 sq.km), complex hydrographic basin, by combining several fingerprinting methods. The study basin belongs to the Jiu River (340 km length), which originates from the Meridional Carpathians and drains the pre-Carpathian hills and plains in SW Romania, before flowing into the Danube, to which it contributes with a considerable volume of suspended sediments (up to 20-25% during floods). A part of this fine sediment load is due to the coal industry in the upper and in the western half of the middle sectors, but also to socialist-time coal mining legacies from the alluvial deposits remobilized during floods, hence the particularity of the sediment chemical composition, which we explore in this research.

Given the geological, geomorphological and anthropic complexity of Jiu River Basin and the different spatial and temporal scales involved in the production and transfer of fine sediments, their fingerprinting was attempted investigated through both conventional (heavy metals and lanthanides geochemistry) and alternative (colorimetry, image analysis and organic petrology) laboratory methods. In order to try to corroborate the different fingerprinting methods, alluvial samples were collected from: a) the Jiu riverbed and alluvial deposits on its banks, and b) the riverbeds of the major tributaries of the Jiu River (intermediate alluvial accumulations from both natural and man-disturbed geochemical sources).

Different number of samples (from the total of 88) were used for each of the fingerprinting method. For the geochemical analyses, coal particles were separated by species (lignite and bituminous coal) by their density, while elemental analyses (for both heavy metals and rare earths) were performed by X-ray fluorescence (XRF) spectrometry (SR EN 15309: 2007) on the subsequent >2.8 g/l fraction. Based on their abundance, concentrations of the most relevant elements were retained for descriptive statistics. The main indicators (Zr/Si, Ti/Fe, Cu/Fe, Cu/S, Ca/Mg, Na/K, different Lanthanides/P ratios) were further correlated with the underlying lithology by means of nonparametric statistical tests. The color-based approach was conducted using a Minolta colorimeter and was further corroborated with the image analysis (performed by supervised classification and segmentation algorithms), to better distinguish the river sediments and coal samples in terms of the color shades and, thus, highlight the presence of coal. Finally, yet importantly, the organic petrology complemented the research by indicating the maceral composition of the coal-bearing bulk and alluvial samples and by improving our knowledge of the proportion of the two coal species present in the fine sediments.

The laboratory analyses of the sediment samples combining several fingerprinting methods contributed to a better understanding of the hydro-sedimentary dynamics, providing new insight into fine sediment sources, their composition and transfer paths within Jiu River Basin.

Key words: coal, fine sediments dynamics, fingerprinting, laboratory analysis, Jiu River Basin

How to cite: Morosanu, G. A., Zaharia, L., Belleudy, P., Traista, E., and Misz-Kennan, M.: At the crossroads of different fine sediment fingerprinting methods in the Jiu River Basin (SW Romania), EGU General Assembly 2023, Vienna, Austria, 23–28 Apr 2023, EGU23-863, https://doi.org/10.5194/egusphere-egu23-863, 2023.

EGU23-1016 | ECS | Orals | HS9.1

Luminescence Sensitivity as Proxy for Sediment Source and Transport – A Case Study from the Ganga River 

Sukumar Parida, Rahul Kumar Kaushal, Naveen Chauhan, and Ashok Kumar Singhvi

We report the use of Luminescence sensitivity as a proxy to understand sediment dynamics in the Ganga River and its major tributaries, viz., the Yamuna, the Chambal and the Ramganga rivers in India.  The Ganga River is one of the world’s largest dispersal systems that originates in the Himalaya and travels across central India to meet the Bay of Bengal. The basin size, catchment lithology, climatic conditions and geomorphic processes of these large rivers are diverse. The rivers are classified into reaches based on varied morphometric characteristics. Sampling strategies focussed on point bars and mid-channel bars mostly from the low-gradient reaches of the rivers, and intervals such that the influences of local dimensions such as hillslope processes and smaller tributary confluences get integrated. Luminescence sensitivity (photon counts/unit dose/unit mass) of quartz grains of 90-150 µm size are examined after check on their purity.

The results suggest the following:

  • A gradual change in luminescence sensitivity in the downstream direction.
  • Change is slower at the beginning, then it increases to nearly twice the initial rates after the confluence with R. Ramganga suggestive of change in sediment flux and sediment transportation rates. In the upstream reaches of the river, influences of a landslide zone and the dun (intermontane valley) rivers are discernible.
  • Rates of sensitivity change is nearly four times higher in the case of Yamuna River suggestive of longer transport times.
  • Samples after the confluence of the Ganga and the Yamuna suggest variable contribution from the two rivers through time.
  • Sensitivity of quartz suggests influence of tributary confluences on the change in luminescence sensitivity along the trunk rivers and offer prospect of developing it as an additional parameter to quantify river processes through time.


This project is supported through DST SERB-YoSCP grant.

How to cite: Parida, S., Kaushal, R. K., Chauhan, N., and Singhvi, A. K.: Luminescence Sensitivity as Proxy for Sediment Source and Transport – A Case Study from the Ganga River, EGU General Assembly 2023, Vienna, Austria, 23–28 Apr 2023, EGU23-1016, https://doi.org/10.5194/egusphere-egu23-1016, 2023.

At steady-state, sediment fluxes out of a drainage basin equal its average erosion rate. Quantifying relative sediment fluxes is therefore key in estimating spatial erosional variability among sub-basins and the consequential landscape evolution. Traditional approaches to quantify such fluxes in drainage basins include using the mineral and elemental compositions of sediments as markers for the relative contribution from sub-basins. Such an approach often fails to distinguish among bedrock sources, and have been shown to suffer from transport-related biases.

Here, we aim to test and explore the combination of these traditional approaches together with oxygen, carbon and ‘clumped’ isotope analyses of detrital carbonate as a novel combined proxy for relative sediment fluxes in carbonate-dominated drainage basins. We test this approach at the Hatrurim Syncline in southern Israel, east of the Dead Sea margins. The area comprises of marine carbonate rocks of the Judea Gr., as well as Hatrurim Fm. rocks that have experienced different grades of combustion-metamorphism, and thereby registered a wide range of isotope values together with distinctive carbonate mineral assemblages – allowing for using both ‘traditional’ and isotope-informed approaches. We collected bedrock and sediment samples from the Morag Basin in the Hatrurim Syncline, and analyzed their mineral and isotope compositions in bulk and specific grain-size fractions.

Our results show that: (a) Hatrurim Formation’s bedrock samples have a wide range of mineral and isotope values consistent with two main assemblages – high temperature metamorphic carbonates, and low temperature re-crystallized carbonates; and (b) Mineral and isotope compositions of fine grain sediment fractions (<2mm) show binary mixing between un-metamorphosed Judea Group and Low-T Hatrurim end-member sources. Coarser sediment fraction show deviations from a binary mixing, which we associate with contribution from a High-T Hatrurim third source.

Based on these analyses, we compiled a mixing model for fine grained sediments, aiming to identify the mineral and isotope compositions of end-member sources and to predict the mixing-ratio for each sediment sample. Model-predicted mixing ratios of sediment samples agree with mixing ratios estimated based on the relative exposure areas of the Judea Gr. and the low-T Hatrurim Fm. within the drainage area of each sediment sample. This consistency suggests that the Morag Basin is evolving under spatially uniform erosion conditions, in which sediment is being contributed equally from each area unit in the basin, and the overall landscape morphology is preserved over time.

A long-profile analysis of the Morag Basin channel network revealed several slope-break knickpoints, separating continuous channel sections with variable steepness indices. Accounting for our finding of a spatially uniform erosion rate, we interpret the knickpoints as reflecting transitions between different lithology-dependent rock erodibility rather than transient signals driven by tectonic or climatic perturbations. The Morag Basin thus presents a unique case where the morphology of the fluvial network has adjusted to erode the surface uniformly despite the multitude of rock types exposed in the basin.

How to cite: Hagbi, R., Goren, L., Eiler, J. M., and Ryb, U.: Oxygen, carbon, and clumped isotope compositions of detrital carbonates: A new combined proxy for quantifying relative sediment fluxes in carbonate terrains, EGU General Assembly 2023, Vienna, Austria, 23–28 Apr 2023, EGU23-1084, https://doi.org/10.5194/egusphere-egu23-1084, 2023.

EGU23-2546 | ECS | Posters on site | HS9.1

Quantification of erosion sources in a tropical volcanic insular catchment (Galion river, Martinique, France): application of sediment tracing tools to coastal marine environment 

Rémi Bizeul, Olivier Cerdan, Lai Ting Pak, Jérôme Poulenard, Fabien Arnaud, Pierre Sabatier, and Olivier Evrard

Between 1972 and 1993, in the French West Indies (Martinique and Guadeloupe), farmers applied a toxic organochlorine insecticide, chlordecone, to control the banana weevil. In the late 1990s, the intensification of agricultural practices in the West Indies led to accelerated soil erosion and sediment transfers to river systems and the sea (Sabatier et al., 2021). This increase in soil erosion leading in turn to a release of chlordecone stored in polluted agricultural soils. These accelerated lateral transfers of sediments are strongly controlled by land use and agricultural practices. The identification of soil erosion sources is therefore essential to effectively fight against the consequences of erosion on the resurgence of chlordecone. Using sediment tracing tools applied to coastal marine sediment archives, the objective of the current research was to model the potential changes in sediment sources throughout time in the West Indian catchments. Banana and sugarcane crops, forests, channel banks and landslides were targeted here as potential sources of sediment.

To this end, soil samples were collected across the Galion catchment at locations presenting contrasted soil types and land use contexts. In addition, a marine sediment core was collected in the Galion Bay in April 2017. In order to quantify source contributions, a suite of physico-chemical properties was measured in both soil and sediment samples.

Subsoils provided instead the main source of sediment in the Galion catchment (between 40 and 50% of sediment). In contrast, the contribution of cultivated soils increased during the 1960s (15 to 30% of sediment) and showed a second increase phase in the late 1990s (30 to 40% of sediment). These phases of increases were interrupted by decreases and major sediment contributions from subsoils. These increases of cultivated soils contributions can be explained by changes in agricultural practices (mechanization, irrigation) since the 1960s and the glyphosate introduction in the late 1990s, which increased soil erosion under cropland. Subsoils contribution increases correlate well with period of extreme events like Matthew cyclone in 2016.

Overall, the comparison between the calculated sediment contributions and the reconstructed chlordecone fluxes shows that the decreases in subsoil contributions correlate well with those of chlordecone concentrations in marine sediments. In contrast, the increases of cultivated soil contributions to sediment correspond well to increases of chlordecone concentrations in sediment.

Accordingly, these results showed the chlordecone contamination dilution due to increase of subsoil erosion. In the future, river sediment samples, collected with sediment traps, will also be analyzed using the same procedure to provide more detailed spatially-distributed information regarding erosion source contributions across the catchment.

How to cite: Bizeul, R., Cerdan, O., Pak, L. T., Poulenard, J., Arnaud, F., Sabatier, P., and Evrard, O.: Quantification of erosion sources in a tropical volcanic insular catchment (Galion river, Martinique, France): application of sediment tracing tools to coastal marine environment, EGU General Assembly 2023, Vienna, Austria, 23–28 Apr 2023, EGU23-2546, https://doi.org/10.5194/egusphere-egu23-2546, 2023.

EGU23-4588 | ECS | Orals | HS9.1

Accurate quantification of sediment conveyance following the 2016 Kaikōura earthquake, New Zealand 

Katie Jones, Jamie Howarth, Chris Massey, Pascal Sirguey, Dimitri Lague, and Thomas Bernard

Evaluating the influence of earthquakes on erosion, landscape evolution and sediment-related hazards requires quantifying the volume and velocity of post-seismic sediment cascades. However, accurate estimates of post-earthquake sediment transfers remain rare. Following the 2016 MW7.8 Kaikōura earthquake in New Zealand, the volume of post-seismic erosion was quantified directly by measuring the ground surface change between 4 lidar surveys captured in 2016, 2017, 2019 and 2021 using the multiscale model-to-model cloud comparison (M3C2) algorithm. The lidar surveys covered the 62 km2 Hapuku and 66 km2 Kowhai river catchments within the Seaward Kaikōura Range, representing the two catchments with the highest density of co-seismic landsliding.

The total co-seismic landslide source volume for the Hapuku Catchment was 30 ± 6 M m3,the catchment being dominated by a 17 M m3 rock avalanche which dammed the Hapuku River. In the 5 years after the earthquake a total of 10.60 ± 0.22 M m3 of sediment was post-seismically eroded (equivalent to ~26% of the co-seismic landslide debris volume when considering bulking of the landslide deposit). A total of 9.71 ± 0.23 M m3 of sediment was delivered to the riverbed resulting in considerable riverbed aggradation and 3.58 ± 0.28 M m3 was inferred to have been transported beyond the rangefront of the Seaward Kaikōura Range (equivalent to ~9% of the co-seismic landslide debris). The total co-seismic landslide source volume for the Kowhai Catchment was only 13 +4/-3 M m3. Over the 5 years 2.02 ± 0.10 M m3 of sediment was post-seismically eroded, equal to ~13% of the co-seismic landslide debris volume within the catchment. The volume delivered to the riverbed, 1.29 ± 0.10 M m3 and 0.85 ± 0.13 M m3 is presumed to have been transported beyond the rangefront (equivalent to ~5% of the co-seismic landslide debris).

From these volumes, the rates at which the co-seismic landslide sediment was eroded from hillslopes, delivered off-slope to channels and exported from the range front were calculated. When projected, these rates of sediment conveyance suggest the volume of co-seismically generated sediment is likely to be evacuated from the rangefront within or close to the recurrence interval for ground motions equivalent to the Kaikōura earthquake. The Hapuku and Kowhai river catchments being examples of where co-seismic landsliding counterbalanced uplift.

How to cite: Jones, K., Howarth, J., Massey, C., Sirguey, P., Lague, D., and Bernard, T.: Accurate quantification of sediment conveyance following the 2016 Kaikōura earthquake, New Zealand, EGU General Assembly 2023, Vienna, Austria, 23–28 Apr 2023, EGU23-4588, https://doi.org/10.5194/egusphere-egu23-4588, 2023.

Turbulence is chaotic and full of different spatial and temporal scales of eddies in its energy cascade process (Richardson, 1922). Moreover, it is observed that erratic behavior occurs in turbulent properties, such as flow velocity (Townsend, 1949) might result in the intermittency of turbulent eddy occurrences. As we know, the movement of sediment particles is not only influenced by flow advection but also by turbulent eddies. For turbulence, particle diffusivity is a coefficient used to measure the impact of turbulence on particles. This study attempts to build a linkage between turbulent eddies and particle diffusivity. On the other hand, turbulent eddies are an intermittent process, which will be further considered in this study.


To consider the chaotic property of turbulence on particle motion, Man and Tsai (2007) proposed the stochastic diffusion particle tracking model (SD-PTM) based on the mass conservation and the Langevin equation of particle displacement to simulate the suspended particle in open channel flow. Their model regards suspended particle movements as a stochastic process and uses Brownian motion to describe particle irregular trajectories caused by turbulence. To investigate the impact of the energy cascade process and eddy intermittency on particles, we aim to develop a modified stochastic diffusion particle tracking model (MSD-PTM) that incorporates the effect of the energy cascade process and turbulent intermittency. In the proposed model, an additional stochastic term will be considered to simulate the impact of the turbulence energy cascade process. In addition, a physical parameter will be used to represent the intermittency effect of eddies. The MSD-PTM will be compared with SD-PTM for statistical properties of particle movement such as the ensemble statistics of particle trajectory and concentration profile. The sensitive analysis will be used to evaluate the degree of impact of the turbulent energy cascade and eddy intermittency on suspended sediment particles.


How to cite: Lin, S.-W. and Tasi, C. W.: Impact of Turbulence Energy Cascade Process and Eddy Intermittency on Suspended Sediment Particle in Open Channel Flow, EGU General Assembly 2023, Vienna, Austria, 23–28 Apr 2023, EGU23-4902, https://doi.org/10.5194/egusphere-egu23-4902, 2023.

EGU23-6506 | ECS | Posters on site | HS9.1

A regional flow duration curve-based approach for predicting sediment yield at ungauged sites 

Abhijith Sathya and Venkata Vemavarapu Srinivas

Sediment yield estimates in river basins are essential for studies related to river morphology, water quality modeling, development of erosion control and management plans, and design of water control structures (e.g., dam, barrage). In data-scarce scenarios, calibration and validation of numerical models for estimating sediment yield become challenging. A regional FDC (Flow Duration Curve)-based methodology is proposed for predicting the sediment yield at ungauged locations in river basins. Its effectiveness was investigated through Jackknife cross-validation experiment on the frequent flood-prone Mahanadi basin, considering daily records of 13 sediment and flow monitoring stations for the time period 1980-2019. A set of 34 catchment-related attributes derived based on morphology, climate, landuse, and location were considered. Potential attributes influencing flows in the basin were identified as those having significant correlations with flow quantiles corresponding to 15 chosen exceedance probabilities (P=0.1, 0.5, 1, 5, 10, 20, 30, 40, 50, 60, 70, 80, 90, 95, and 99). The identified attributes include (i) catchment area, (ii) number of streams, (iii) minimum elevation, (iv) basin relief, (v) the percentage of area classifiable as grassland, and (vi) longitude. To arrive at sediment yield at an ungauged location, first FDC corresponding to the location is derived using regression relationships fitted between each of the 15 flow quantiles and the potential attributes of gauged sites in the region. The relationships were developed using the best subset regression analysis. Subsequently, the daily discharge and daily sediment time series at the ungauged location were derived from the FDC. For this purpose, the rating curve parameters for the ungauged site were obtained from its neighboring sites in the attribute space, through a proposed strategy. The performance of the proposed approach in predicting the discharge and sediment time series was found to be effective when assessed in terms of various performance measures, which included Nash-Sutcliffe efficiency, and Kling-Gupta efficiency.

How to cite: Sathya, A. and Srinivas, V. V.: A regional flow duration curve-based approach for predicting sediment yield at ungauged sites, EGU General Assembly 2023, Vienna, Austria, 23–28 Apr 2023, EGU23-6506, https://doi.org/10.5194/egusphere-egu23-6506, 2023.

Storage of sediment on floodplains delays downstream sediment delivery, increasing the timescale of catchment responses to forcing by tectonics, climate changes, and watershed sediment management practices.  Including floodplain storage in catchment sediment routing models, however, is challenging because the long timescales involved exceed the duration of stream gaging station and other observational data sources.  As a result, floodplain storage is typically ignored in catchment sediment modeling.  To quantify timescales of sediment storage for mid-Atlantic U.S. floodplains since the early Holocene, floodplain sediment thickness distributions are defined for three time periods by analyzing stratigraphic data: presettlement (deposited before 1750), legacy (deposited 1750-1950), and modern (deposited after 1950).  These data are used to calibrate a model that predicts the thickness, age, and storage time distributions of floodplain deposits through time.  The model uses empirical equations to estimate changes in flood magnitude and duration caused by changes in forest cover and urban development.  Simple hydraulic models predict the occurrence of overbank flow based on channel geometry (which changes through time as floodplains accrete) and the potential for backwater induced by nearby milldams during the 19th Century. Overbank deposition during overbank flows is predicted based on sediment concentration, sediment settling velocity, and overbank flow duration.  Sediment erosion is predicted based on the age distribution of stored sediment and a power law function that specifies the exposure of sediment to erosion by age category, an approach that is similar to the StorAge Selection Functions often used in catchment hydrologic modeling.   The calibrated model, “tuned” to reproduce observed stratigraphic data, predicts monotonically increasing fluvial sediment concentrations from presettlement to modern time periods, and sediment budget components (input and output fluxes and rates of sedimentation and erosion) that also increase through time.  Predicted sediment residence times (mean age of stored sediment) vary from ~450 years in 1750 to ~300 years in 2017, and the model accurately reproduces the full age distribution (0 to > 5000 yr) of stored sediment documented by contemporary stratigraphic data.  This calibrated model can accurately represent floodplain storage for improved watershed scale sediment routing computations in the mid-Atlantic region, improving our ability to manage Chesapeake Bay restoration and other important watershed sediment management issues.

How to cite: Pizzuto, J.: Stratigraphic Data Calibrates Predictive Modeling of Holocene-Present Floodplain Sediment Storage In the Mid-Atlantic U.S., EGU General Assembly 2023, Vienna, Austria, 23–28 Apr 2023, EGU23-7591, https://doi.org/10.5194/egusphere-egu23-7591, 2023.

EGU23-8843 | Posters on site | HS9.1

Improved simulation of surface runoff and soil erosion in no-till rural catchments to adapt agricultural production systems to the impacts of climate change. 

Jean Minella, Fabio Schneider, Ana Londero, Gustavo Merten, Olivier Evrard, Olivier Cerdan, and Lidiane Buligon

The repercussions of climate change have great potential to cause negative impacts on water resources and agriculture. The IPCC reported that high magnitude and intensity rainfall will increase in southern Brazil, increasing its potential to degrade natural resources. In addition, more severe droughts will lead to frequent crop failures and reduced water availability. Despite the wide adoption of no-till farming in Brazil, its efficiency in managing runoff has not been enough to control soil degradation and its impacts on water resources. The lack of runoff control practices amplifies the negative effects resulting from climate change. This new climate scenario, associated with the simplification of the production system, must be understood by employing a strategy that combines hydrological monitoring and mathematical modeling of small rural catchments. The soil and water degradation in no-tillage systems are still poorly understood and not properly incorporated into hydrologic and erosion models. The objective is to improve the runoff and erosion simulation strategy based on hydrological monitoring at the landscape scale. Therefore, this study evaluated the hydrology and erosion processes of agricultural slopes under no-tillage system under different runoff control conditions by monitoring 63 rainfall events in two 2.4-ha zero-order catchments and 27 rainfall events in four 0.6-ha macroplots. Monitoring was performed in southern Brazil (29°13'39"S, 53°40'38"W) in the Southern Plateau characterized by a wavy relief and deep and highly weathered soils. The catchments are paired and similar in terms of the type of soil and relief, but different regarding the presence of broad-based terraces. The macroplots have different soil and crop management systems. By using monitoring techniques, the hyetographs, hydrographs and sedigraphs revealed the influence of the different land managements on the infiltration, runoff generation and propagation, and sediment yield. The broad-based terraces reduced runoff by 56% and sediment yield by 58.7%. The results in the macroplots showed that high amounts of phytomass and/or chiselling do not control runoff in medium and high magnitude events. Crop management including an increased phytomass input efficiently controlled sediment yield (63%), although it did not reduce runoff volume and peak flow. In contrast, scarification had no impact on runoff and sediment yield. Monitoring results indicate the need for additional measures to control runoff (terraces), even in areas under NT and with high phytomass production. The monitoring data set is also being used to improve the mathematical models to describe the hydrological and erosive processes under no-till farming. From the improvement of simulations, soil and water conservation techniques is recommended to adapt the agricultural production system to intense rainfall with positive repercussions to soils and water resources. The study emphasizes the importance of monitoring at the catchment scale to better understand the hydrological behaviour of agricultural areas and provide the necessary parameters to effectively control runoff.

How to cite: Minella, J., Schneider, F., Londero, A., Merten, G., Evrard, O., Cerdan, O., and Buligon, L.: Improved simulation of surface runoff and soil erosion in no-till rural catchments to adapt agricultural production systems to the impacts of climate change., EGU General Assembly 2023, Vienna, Austria, 23–28 Apr 2023, EGU23-8843, https://doi.org/10.5194/egusphere-egu23-8843, 2023.

Identifying sediments sources is an important branch of catchment erosion modeling that uses multiple tracers in a robust set of statistical analysis techniques commonly known as the “fingerprinting approach”. The techniques employed in the fingerprinting approach follow two distinct stages of multivariate statistical analysis: discrimination and classification. The first one refers to determining the best set of tracers that have the potential to be selected as a tracer. The second stage consists of classifying the eroded sediment samples in the n-dimensional space defined by the tracer properties. In this step, the relative contribution of each source to the composition of the suspended sediment is calculated. One of the challenges for improving the “fingerprinting approach” is estimating the uncertainties of the results. In this sense, defining the number of samples used to characterize sources and eroded sediments is considered an important issue in terms of costs and source of uncertainties. Therefore, the main objective of this work is to present an alternative modeling with a focus on uncertainty analysis and sample number optimization based on the model developed by Clarke and Minella (2016). The advantages of the proposed model include 1) the calculus of the source apportionments, making it possible to evaluate the effects of reducing the sample number on the uncertainties; 2) takes account the collinearity between the tracers adding the variance-covariance matrix applied into the generalized least squares (GLS) method; and 3)  adds the calculus of uncertainty associated with the number of samples (sediment sources and the  sediments. To demonstrate the usefulness of the model, we used a dataset available from the Arvorezinha experimental catchment located in southern Brazil. The implementation of this model was carried out in the Phyton®, so that any user can evaluate the uncertainties in the reduction of the number of samples as well as the importance of collinearity in the set of available tracers. The results confirmed the assumption the increased uncertainty as the number of samples decreases in the sources or eroded sediment samples. Moreover, the addition of the variance-covariance matrix in the solution of the overdetermined system allows to take into account the deleterious effects of collinearity in the fingerprinting approach. With this tool, new perspectives are opened to systematically improve the definition of the number of samples needed based on the uncertainty analysis of the set of samples available, fundamental to the advancement of research in the area of environmental monitoring and modeling, as well as for the management of water resources and soil management in agricultural catchments.

How to cite: Buligon, L., Buriol, T., and Minella, J.: An alternative approach to sediment source identification: uncertainty analysis and sample number optimization, EGU General Assembly 2023, Vienna, Austria, 23–28 Apr 2023, EGU23-8866, https://doi.org/10.5194/egusphere-egu23-8866, 2023.

Sediment source fingerprinting is a technique for determining proportional contributions from different catchment sources to sediments in downstream receiving environments. The technique involves a) selecting tracers that discriminate sources based on their biogeochemical or isotopic properties and b) applying statistical mixing models to quantitatively determine source contributions. Tracer suitability varies depending on the characteristics of the study catchment and the source property or erosion processes being targeted and can include geochemical, fallout radionuclides (FRNs), or compound specific stable isotopes (CSSIs). For instance, the spatial variation in soil geochemical properties is largely determined by underlying geological and pedogenic processes, whereas CSSIs utilise δ13C isotopic properties of fatty acid biomarkers that bind to soils and vary based on plant communities associated with each land cover.

While the environmental basis for sediment fingerprinting is increasingly understood, methodological challenges continue to present limitations that may hinder wider catchment applications. Here, we draw from recent research in New Zealand to highlight some of the challenges to source apportionment accuracy using numerical mixture testing and catchment studies to represent a range of tracers and sources. Tracers include bulk geochemistry, fallout radionuclides (FRNs), and compound specific stable isotopes (CSSIs) and sources are defined by parent material, erosion processes, and land cover. We focus on the influence of source dominance and source discrimination by different tracer types on source apportionment accuracy, as well as uncertainties introduced from post-unmixing transformations associated with CSSIs.  

How to cite: Vale, S. and Smith, H.: Factors influencing source apportionment accuracy using sediment fingerprinting: observations from New Zealand, EGU General Assembly 2023, Vienna, Austria, 23–28 Apr 2023, EGU23-10427, https://doi.org/10.5194/egusphere-egu23-10427, 2023.

Asian rivers are significant contributors to the world’s coastal sediment flux and the Western Pacific Coast (WPC) receives most of them. In recent years, Natural changes and human activities constantly change the suspended sediment concentration (SSC) in waters of the WPC; resulting in significant changes in coastal and marine systems, consequently altering the global biogeochemical cycle. However, monitoring these changes is difficult, confounded by the lack of observational data and unavailability of globally SSC algorithms. Here, based on the platform of Google Earth Engine, we retrieved the SSC in the waters where stretching 10 nautical miles from the WPC using multi-source imagery from Landsat-TM/ETM+/OLI sensors (from 1984-2022) to obtain its long-term dynamics using 3 different SSC algorithms. The results indicate that the 3 retrieve algorithms obtained satisfactory results in temporal-spatial variation trend of SSC. We discovered that some estuaries in the WPC show significant decreasing changes. For example, the spatial distribution of SSC in the Pearl River Estuary (PRE) represented a trend of high along the west coast and low along the east coast. Over the past 39 years, the SSC showed a relatively evident decreasing trend in most PRE regions; In the Yangtze Estuary (YRE), the SSC in the outer estuaries was generally significantly higher than that in the inner and SSC demonstrated an overall declining pattern in time; For the Yellow River Estuary, the highest of SSC is located a peripheral zone in front of the estuary, and also showed an overall decreasing trend in time.

How to cite: Zhou, T., Cao, B., and Yang, X.: Changes in suspended sediment concentration in the coastal waters of the Western Pacific from 1984 to 2022, EGU General Assembly 2023, Vienna, Austria, 23–28 Apr 2023, EGU23-11658, https://doi.org/10.5194/egusphere-egu23-11658, 2023.

EGU23-13637 | ECS | Posters on site | HS9.1

Comparison of fluvial and aeolian sedimentary environments based on morphological analysis of their mineral components 

Fruzsina Gresina, Beáta Farkas, Szabolcs Ákos Fábián, Zoltán Szalai, and György Varga

The relationship between depositional environments and transportation processes associated with the general properties of formed siliciclastic sediments has been of great interest to researchers. The recent spread of high-resolution analytical methods has allowed researchers to quickly examine grain shape properties of a large number of individual mineral grains. We investigated mineral particles of two sediment types from different depositional environments (wind-blown sand, floodplain and channel deposits [n=11]) from the Carpathian Basin (Central Europe) by using automated static image analysis (Malvern Morphologi G3SE-ID). Our aim was to determine the key variables that can help us distinguish fluvial and aeolian environments. During the analysis and data processing (e.g. hierarchical cluster analysis, Wilks’ λ, Kruskal-Wallis, MANOVA, PCA) we examined four variables related to grain shape which were the following circularity (form), convexity (surface texture), solidity (roundness) and elongation (form).

The objective and the quantitative study revealed that the solidity parameter proved to be an effective variable for separating sediments with similar convexity values (mean: 0.95-0.99) like in our case, the aeolian and fluvial sediments. Fluvial sediments had lower solidity (mean: 0.95-0.97) values compared to the aeolian sands (mean: 0.97-0.98). This major difference (p<0.001; α=0.05) resembles that the investigated fluvial sediments are not as much rounded as aeolian sands. Associated with circularity (form) result, it can be deduced that grains from fluvial sediments (low circularity; mean: 0.76-0.84) spent less time in the transport media or transported at lower energy level than aeolian grains (high circularity; mean: 0.82-0.87). Our research supports the previously established theory that aeolian transport is more effective in rounding the grains than an aqueous environment.

Support of the National Research, Development and Innovation Office (Hungary) under contract FK138692, ÚNKP-22-3 and RRF-2.3.1-21-2022-00014 are gratefully acknowledged.

How to cite: Gresina, F., Farkas, B., Fábián, S. Á., Szalai, Z., and Varga, G.: Comparison of fluvial and aeolian sedimentary environments based on morphological analysis of their mineral components, EGU General Assembly 2023, Vienna, Austria, 23–28 Apr 2023, EGU23-13637, https://doi.org/10.5194/egusphere-egu23-13637, 2023.

Hydropeaking in rivers changes the flow regime, increases river clogging, mobilizes fine sediment, and causes major stress to fish, macroinvertebrates, and aquatic plants that suffer from the rapid water level fluctuations. One in four medium- to large-sized rivers in Switzerland is affected by hydropeaking. In this study, we investigated the effect of hydropeaking on fine sediment transport during an experimental flood on the Spöl river, a tributary of the Inn river, in the canton of Graubünden, Switzerland. The study was a proof-of-concept for new smart turbidity sensors, which were developed in our laboratory, calibrated, and tested in mixing tank experiments in 2021 and again in 2022 with a range of different sediment types. These sensors were deployed at two locations on the Spöl during an experimental flood release by the upstream Ova Spinne hydropower dam. The collected data reveal sudden sediment concentration increases and decreases (pulsing) as the discharge increases steadily throughout the day. The highest concentration of sediment is much larger (4-5 g/L) than would be expected and appeared with the onset of the flood and again with the peak discharge. Our findings also reveal clockwise and counter-clockwise hysteresis loops in the stage-concentration relation, which point to a switch in the sediment supply between supply limited and unlimited conditions during the experimental flood. This study shows that high spatial- and temporal-resolution monitoring of suspended sediment is possible with a low-cost sensor network. The applications of such a network are plentiful: from identifying sediment source activation and transport in small streams, glacier networks and deltas, to environmental monitoring of maximum sediment concentration levels for the survival of fry fish, for prevention of river bed clogging, and for pollutant monitoring (binding to sediments).

How to cite: Droujko, J. and Molnar, P.: Sediment pulse propagation and identification using a low-cost sensor network: a hydropeaking study on the Spöl river, Switzerland, EGU General Assembly 2023, Vienna, Austria, 23–28 Apr 2023, EGU23-14351, https://doi.org/10.5194/egusphere-egu23-14351, 2023.

EGU23-15828 | ECS | Orals | HS9.1

Variability of Fallout Radionuclides in River Channels: Implications for Sediment Residence Time Estimations 

Enrique Munoz-Arcos, Geoffrey Millward, Caroline Clason, Claudio Bravo-Linares, and William Blake

Fine sediment plays an important role in the healthy functioning of river ecosystems providing nutrients and contributing to habitat functioning. However, excessive sediment supply into rivers has several detrimental impacts on water quality and it causes sedimentation in river channels, reservoirs and estuaries. In addition, silts and clays are geochemically active and consequently are responsible for the transport of contaminants, including trace metals, phosphorus, pesticides and radionuclides among others which have high sorptive affinity for fine-grained particles. Hence, quantifying the timescales of sediment transfer throughout a river system is critical for understanding river basin sediment dynamics and the fate of their associated pollutants.

Fallout radionuclides (7Be, 210Pbex and 137Cs) have been used to assess sediment travel distances, sediment age and sediment residence times in a variety of landscapes. An advantage of using these radionuclides as sediment chronometers is their half-lives which can be used to model sediment residence time from days to decades in different catchment compartments.

The River Avon (Devon, UK) is a 40 km long gravel-bed river, draining rough moorland and with a catchment area of 110 km2. The mean annual flow is 3.7 m3 s-1 and is moderated by managed discharges from a reservoir upstream. Suspended and channel bed sediments were sampled in a 5 km section of the river during four seasonal surveys (January, March, July and November 2022) and suspended sediments during a stormflow event were also sampled.

Radionuclide activity concentrations of channel deposited sediments varied substantially within and between river bars and seasonally. Suspended sediment activity concentrations varied within the stormflow hydrograph and seasonally. Relationships between radionuclide activity concentrations and sediment storage, particle size, total organic carbon and C:N ratios were also evaluated. Channel sediment residence times obtained using 7Be/210Pbex activity ratios ranged between 0 to 110 days, reproducing the high variability found in activity concentrations. Future research will assess the influence of sediment sources on 7Be/210Pbex ratios and the relationship between sediment storage dynamics and sediment-bound contaminants. Sediment residence time modelling will allow an improved understanding of sediment dynamics in gravel-bed rivers which is essential to inform management decisions and prediction of the timescales of transfer and fate of associated contaminants.

How to cite: Munoz-Arcos, E., Millward, G., Clason, C., Bravo-Linares, C., and Blake, W.: Variability of Fallout Radionuclides in River Channels: Implications for Sediment Residence Time Estimations, EGU General Assembly 2023, Vienna, Austria, 23–28 Apr 2023, EGU23-15828, https://doi.org/10.5194/egusphere-egu23-15828, 2023.

EGU23-15946 | Posters on site | HS9.1

Exploring the particle size effect on the geochemical composition using experimental soil mixtures 

Borja Latorre, Leticia Gaspar, Iván Lizaga, William Blake, and Ana Navas

The impact of particle size on elemental content in soils is difficult to predict because the positive linearity between them does not apply equally to all elements. This assumption needs to be constantly examined and considered for fingerprinting studies. Overall, higher element enrichment in the fine fractions reflects the increasing adsorption potential of larger specific surface area (SSA), however, this relationship is often non-linear or more complex. Previous studies have been reported that the relationship between SSA and elemental geochemistry is different in terms of linearity, magnitude, and even direction for each element, and it could also depend on the type of sample. Fingerprinting approach is founded on the assumption that the properties of source and sediment mixtures are directly comparable, however, when a particle size correction (PSC) is needed because of the enrichment of sediment mixtures in fine particles, the use of a single PSC factor based on SSA could negatively affect unmixing results. Based on our previous study, in which we examined the behavioural characteristics of geochemical tracers in artificial mixtures with different grain size, we demonstrated that the source apportionment estimated with unmixing models was sensitive to particle size. In this contribution, we explore in detail, and tracer by tracer, the effect of the particle size variation on the correct estimation of source apportions. Artificial mixtures with known percentages contribution from three experimental sources have been used, comparing i) sources and mixtures at <63 μm, ii) sources at <63 μm and mixtures at <20 μm simulating fine enrichment and iii) sources at <63 μm and mixtures at <20 μm with particle size correction factor (PSC). These results support the need to develop alternatives to improve the use of correction factors in fingerprinting studies.

How to cite: Latorre, B., Gaspar, L., Lizaga, I., Blake, W., and Navas, A.: Exploring the particle size effect on the geochemical composition using experimental soil mixtures, EGU General Assembly 2023, Vienna, Austria, 23–28 Apr 2023, EGU23-15946, https://doi.org/10.5194/egusphere-egu23-15946, 2023.

EGU23-16431 | Posters on site | HS9.1

International Tracing Events 2021-2023 – Discussion and developments in sediment tracing 

Sabine Kraushaar, Olivier Evrard, and All of the “International Tracing Day” participants

Several innovative techniques have been developed recently opening up new avenues to establish the assessment of sediment flux in the critical zone. These techniques include the tracing or “fingerprinting” methods to identify sediment sources and quantify the dynamics of particle-bound contaminants. However, the use of these techniques is often associated with several methodological and statistical limitations, that are often reported by the international scientific community but rarely addressed in the framework of concerted actions.

This presentation will highlight the main developments and outcomes of the “International Tracing Day” 2022 and 2023, and the Tracing School organised in 2021. Based on the publication of an opinion paper (https://link.springer.com/article/10.1007/s11368-022-03203-1), new strategies to publish and disseminate sediment tracing databases will be presented. An example of a formatted dataset will be given, with the objective to test research hypotheses based on multiple datasets adopting the same format of data and meta-data. Other perspectives regarding improvements of the sediment fingerprinting method in terms of modelling, tracer options and selection will also be presented.

How to cite: Kraushaar, S., Evrard, O., and “International Tracing Day” participants, A. O. T.: International Tracing Events 2021-2023 – Discussion and developments in sediment tracing, EGU General Assembly 2023, Vienna, Austria, 23–28 Apr 2023, EGU23-16431, https://doi.org/10.5194/egusphere-egu23-16431, 2023.

EGU23-16821 | Orals | HS9.1

Deep learning insights into suspended sediment concentrations across the conterminous United States: Strengths and limitations 

Yalan Song, Piyaphat Chaemchuen, Farshid Rahmani, Wei Zhi, Li Li, Xiaofeng Liu, Elizabeth Boyer, Tadd Bindas, Kathryn Lawson, and Chaopeng Shen

Suspended sediment concentration (SSC) is a crucial indicator for aquatic ecosystems and reservoir management but is challenging to predict at large scales. This study seeks to test the feasibility of deep-network-based models to predict SSC at basin outlets given basin-averaged forcings and basin-physiographic attributes as inputs and extract insights by interpreting the spatially-varying model performances. We trained long short-term memory (LSTM) deep networks either separately for each of the 371 sites across the conterminous United States (local models), or on all the sites collectively (Whole-CONUS). The local and Whole-CONUS models presented median Nash-Sutcliffe Efficiency (NSE) values of 0.72 and 0.57, respectively, which are state-of-the-art results. However, this comparison disagrees with our previous “data synergy” conclusion for LSTM models and suggests there are still important yet unavailable sediment-related attributes. Both local and Whole-CONUS models tended to be more successful where SSC-streamflow correlations (Rs-q) were high - typically in the humid Eastern US - and with lower SSC. Low Rs-q basins were often found in the arid Southwest with higher SSC. The highly-nonlinear SSC-streamflow relationship is arguably due to heterogeneity in land cover and rainfall or limitations in sediment supply, suggesting these basins need to be simulated at higher spatial resolution. The local models mostly outperformed the Whole-CONUS one due to the latter lacking critical attributes, but the latter can be competitive in high-SSC regions with enough flow events. Moreover, the Whole-CONUS model also performed well for basins not included in the training dataset (median NSE=0.55), supporting large-scale modeling.

How to cite: Song, Y., Chaemchuen, P., Rahmani, F., Zhi, W., Li, L., Liu, X., Boyer, E., Bindas, T., Lawson, K., and Shen, C.: Deep learning insights into suspended sediment concentrations across the conterminous United States: Strengths and limitations, EGU General Assembly 2023, Vienna, Austria, 23–28 Apr 2023, EGU23-16821, https://doi.org/10.5194/egusphere-egu23-16821, 2023.

EGU23-679 | ECS | PICO | HS9.2 | Highlight

Heavy Metal Contamination in Ganga River Basin Sediments, India 

Stuti Kushwaha, nandimandalam janardhana raju, alagappan ramanthan, and anushla dhiman

Ganga River is one of the largest Asian rivers on which millions of livelihoods and economic growth depend. However, due to enhanced anthropogenic activities in recent times, the river is susceptible to various contaminants including heavy metals. Most heavy metals (Zn, Co, Cu, Ni, Mo, Mn) are vital components for the biological functioning of a living organism. However, short to long-term exposure to these metals can cause acute or chronic toxicity to aquatic ecosystems. These heavy metals could be sourced from natural as well as anthropogenic agents. Anthropogenic activities like agricultural runoff, sewage, and industrial runoff can potentially be sources of these metals. In this study, we have addressed the Spatio-temporal heavy metal pollution distribution along with its contributing sources in the Ganga River basin (26-bed sediment samples from Rishikesh to Bansberia). The post-monsoon concentrations are found to be low as compared to the monsoon season for Zn, Ni, and Co probably due to lesser erosional and accumulation activity in the riverbeds. Cr concentrations are high possibly due to agricultural activities and input coming from Yamuna and Chambal River confluence. However, Cu is possibly due to the confluence of the Yamuna and Ganga Rivers and human influence. The order of metals in the monsoon and the post-monsoon season is found similar i.e. Zn>Cr>Cu>Ni>Co. A positive correlation is found between Ni-Co, Ni-Cu, Ni-Cr, Cr-Co, Cr-Cu, and Co-Cu in monsoon season and between Ni-Co, Ni-Cr, Cr-Co, and Zn-Cu in post-monsoon season possibly due to their elution from common sources. Such a pattern is not uniform for each metal along the entire stretch of the study area in both seasons due to site-specific weathering and anthropogenic activities. Average concentrations of Ni, Cu, and Cr for both seasons are found to be exceeding the WHO/USEPA recommended values, showing the pollution of these heavy metals in the sediments.

How to cite: Kushwaha, S., janardhana raju, N., ramanthan, A., and dhiman, A.: Heavy Metal Contamination in Ganga River Basin Sediments, India, EGU General Assembly 2023, Vienna, Austria, 23–28 Apr 2023, EGU23-679, https://doi.org/10.5194/egusphere-egu23-679, 2023.

EGU23-2005 | ECS | PICO | HS9.2

Assessing temporal trends of soil erosion in the Pearl River Basin using the RUSLE model 

Xiaolin Mu, Junliang Qiu, Bowen Cao, Shirong Cai, Kunlong Niu, and Xiankun Yang

Healthy soil is the key foundation of the world’s agriculture and an essential resource to ensure the world’s food security. Soil erosion is one of the important forms of soil degradation and a major threat to sustainable terrestrial ecosystem, leading to a series of inevitable consequences such as reduced soil productivity, deteriorated water quality, low food yield, lost reservoir capacity, and even flood hazards. Therefore, controlling soil erosion has been one of the most important tasks of ecosystem management. In our study, we utilized a continuous Landsat satellite image dataset to map soil erosion dynamics (1990-2020) based on RUSLE model across the Pearl River Basin. Based on the results, We also analyzed the spatiotemporal dynamics in soil erosion in the Pearl River Basin from 1990 to 2020, and derived the causes of the changes, to provide a reliable result for soil erosion management and water and soil conservation in the Pearl River Basin. The study results indicated that: (1) The multi-year area-specific soil erosion average in the Pearl River Basin is approximately 538.95 t/(km2·a) with an annual soil loss of approximately 353 million tons; (2) The overall soil erosion displayed a decreasing trend over the  past 30 years with an annual decreasing rate of -13.44(±1.53) t/(km2·a). (3) soil erosion, dominated by low- and moderate-level erosion, primarily happened in the tributary basin of Xijiang River, especially in the areas with slopes > 15°, low vegetation coverage, or poorly managed forests; (4) NDVI and land cover were the dominant factors regulating soil erosion dynamics, versus the insignificant role of precipitation played in the erosion procedure. The study results are valuable for soil erosion management and water conservation in the Pearl River Basin.

How to cite: Mu, X., Qiu, J., Cao, B., Cai, S., Niu, K., and Yang, X.: Assessing temporal trends of soil erosion in the Pearl River Basin using the RUSLE model, EGU General Assembly 2023, Vienna, Austria, 23–28 Apr 2023, EGU23-2005, https://doi.org/10.5194/egusphere-egu23-2005, 2023.

EGU23-3346 | ECS | PICO | HS9.2

Contribution of small coastal rivers to copper export to the Gulf of Lions 

Yann Machu, Dominique Aubert, Wolfgang Ludwig, Bruno Charrière, Jennifer Sola, and Christine Sotin

Soils in the Gulf of Lions region (NW Mediterranean) show some of the highest copper (Cu) levels in Europe (Ballabio et al, 2018). The episodic and erosive nature of rainfall in the Mediterranean area (González-Hidalgo et al, 2007), historical intensive agricultural practices using Cu to fight the downy mildew and its relatively high solubility make the study of its transfer and consequences along the land-sea continuum a major issue. The main objective is to quantify the Cu fluxes from coastal rivers discharging in the Gulf of Lions and characterise their temporal variability highlighting the importance of floods on the transfer processes of matter and associated contaminants in the Mediterranean region.

Since 2006, the SNO MOOSE, a multi-platform and multi-site observation network designed to monitor the evolution of the Mediterranean basin in a context of global change, has been carrying out. Therefore, on a monthly monitoring basis, trace metal concentrations in suspended particulate matter (SPM) have been estimated in the five main small coastal rivers of the Gulf of Lions as well as the Rhone River.

These observations coupled with a sediment flux model (Sadaoui et al, 2016) allow the estimation of elemental fluxes. Small rivers have the highest average Cu content in suspended matter (80.3 µg/g) and in the soils of the catchment areas (79.7 µg/g) (approximatively a factor of 2 compared with the Rhone). Mean annual estimation of Cu fluxes are about 316T/year with an interannual variability of 36%. The Rhone River is by far the major contributor to the fluvial exports of particulate copper to the Gulf of Lion. However, although small coastal rivers account only for 6% of SPM inputs, their contribution to particulate Cu fluxes averages 9.7%.

Interannual variability of fluxes is controlled by the occurrence of episodic flash floods on coastal rivers typical of the functioning of Mediterranean watercourses (Roussiez et al, 2011, 2012).

The SPM transport originating from surface soil erosion and associated copper mainly takes place during these brief events for small coastal rivers (annual average of 66% of total Cu export against 19% for the Rhone). According to the number of events occurring each year their relative contribution of Cu fluxes compared to the Rhone is highly variable (from 2 % in 2012 up to 41% in 2011). Thus, the influence of coastal rivers on the global Cu budget to the Gulf of Lions is not negligible.

Moreover, copper transferred in rivers from the erosion of wine-growing soils is mainly in extractable form, which is more hazardous for the environment because it is both mobile and potentially assimilable by organisms.

How to cite: Machu, Y., Aubert, D., Ludwig, W., Charrière, B., Sola, J., and Sotin, C.: Contribution of small coastal rivers to copper export to the Gulf of Lions, EGU General Assembly 2023, Vienna, Austria, 23–28 Apr 2023, EGU23-3346, https://doi.org/10.5194/egusphere-egu23-3346, 2023.

The water authority of Israel has decided to create an unnatural flow starting at a point in the Tzalmon stream into Lake Kinneret (Sea of Galilee) 4 km upstream as a way to manage the lake water level. The national water company “Mekorot” use the existing national water carrier to take water from the desalination plants next to the Mediterranean Sea and transfer it to the Tzalmon river where the water will naturally flow within the stream into the lake. A test flow was conducted at changing discharge rates of 3,100, 4,500, and 6,000 m3 hour-1 for three hours for each flow rate for two days to examine the new flow system that leads desalinated water into the Tzalmon stream. Nevertheless, the test flow was a great opportunity to study the Tzalmon flow's ability to transport particles, nutrients, and bacteria as well as study their distribution dynamics in the lake. Fifteen temperature sensors were deployed in the Tzalmon river outlet to the lake to capture the mixing dynamics with the lake water during the test flow. During the flow release, profiles of temperature, electrical conductivity (EC), dissolved oxygen (DO), and pH were conducted along the flow path of the water into the lake using a boat in 5 locations. In addition, the boat sampled the water for total dissolved solids (TSS), nutrients, bacteria concentration, and general chemistry in those 5 locations in the river outlet. Along the river, six temperature sensors were deployed in and out of the water in three locations to understand the temperature change along the flow path from the discharging point to the lake. Furthermore, water samples from those 3 locations along the flow path were taken and analyzed to the above-mentioned parameters at each flow rate discharge. The results highlight the ability of the river flow to carry those parameters at different flow velocities along with their distribution dynamics in the lake water. Furthermore, the water reached the lake only at the end of the second flow period and during the third flow period due to losing conditions along the flow path. Therefore, there were only two occasions of river water mixing in the lake, and this mixing dynamic was studied and will be presented at the session. This new water discharge into an ephemeral river will start in the next few years and will change the river area ecosystem and will bring newly dissolved and solid materials into the lake. This test is the first examination of the system in which the constant flow release will potentially influence the lake ecosystem and the flow regime in the lake.

How to cite: Stein, S.: Mixing dynamics of stream water into Lake Kinneret through a short-period flow release test, EGU General Assembly 2023, Vienna, Austria, 23–28 Apr 2023, EGU23-4111, https://doi.org/10.5194/egusphere-egu23-4111, 2023.

EGU23-4132 | PICO | HS9.2

On bedload particle deposition and hop statistics 

Zi Wu, Weiquan Jiang, Li Zeng, and Xudong Fu

Understanding the statistics of bedload particle motions is of great importance. To model the hop events defined as trajectories of particles moving successively from the start to the end of their motions, recently, Wu et al. (Water Resour Res, 2020) have successfully performed individual-based simulations according to the Fokker–Planck equation for particle velocities. However, analytical solutions are still not available due to (i) difficulties in treating the velocity-dependent diffusivity, and (ii) a knowledge gap in incorporating the termination of particle motions for the equation. In the latest work (Wu et al., J Fluid Mech, 2023), we have specified a Robin boundary condition representing the deposition of particles; and devised a variable transformation to deal with the velocity-dependent diffusivity. The original bedload transport problem is thus found to be governed by the classic equation for the solute transport in tube flows with a constant diffusivity after the transformation. By solving the spatial and temporal moments of the governing equation, we have investigated the influence of the deposition rate on three key characteristics of particle hops. Importantly, we have related the deposition rate to the mean travel times and hop distances, enabling a direct determination of this physical parameter based on measured particle motion statistics. The analytical solutions are validated by experimental observations with different bedload particle diameters and transport conditions.

How to cite: Wu, Z., Jiang, W., Zeng, L., and Fu, X.: On bedload particle deposition and hop statistics, EGU General Assembly 2023, Vienna, Austria, 23–28 Apr 2023, EGU23-4132, https://doi.org/10.5194/egusphere-egu23-4132, 2023.

EGU23-5845 | ECS | PICO | HS9.2

Development of an erosion and transfer particulate phase pesticides model at the watershed scale 

Tulio Lima, Nadia Carluer, Michael Rabotin, Roger Moussa, and Claire Lauvernet

Pesticides are chemicals used in various agricultural practices to control pests, weeds and plant diseases. They are responsible for many negative impacts on the environment and human health. In addition, they are linked to the intensive use of agricultural machinery and equipment, and to mass production, often associated with monoculture. These non-ecological practices contribute to the contamination of freshwater by pesticides, as well as to the continuous soils degradation and the erosive processes increase. In this context, Rouzies et al. (2019) developed the dynamic and continuous model PESHMELBA with the aim of simulating pesticide transfers at the watershed scale, and comparing scenarios by explicitly taking into account the landscape spatial organisation. This model has a modular structure, which allows to improve the representation of some processes or landscape elements (such as plots, vegetative filter strips, ditches, rivers, etc.), or to add new ones. The current version of the model only estimates the pesticides transfer in solution (water), which may underestimate the impact of these solutes, as the part of them absorbed in the soil particles is not yet taken into account in the simulations.
Thus, an erosion module was developed in order to integrate the transfer of pesticides in the particulate phase into the PESHMELBA model, and to quantify the soil loss and the particles transfer at the watershed scale. This model differs from other existing erosion models by performing continuous dynamic simulations, i.e. it takes into account the variation of sediment concentrations in space and time, and the continuity between precipitation events. The developed model simulates soil detachment by rainfall (interrill erosion) and by runoff (rill erosion), transfer of particles by laminar and concentrated surface runoff, and deposition of particles when transport capacity is exceeded, in particular inside landscape elements as vegetated strips or hedges, or where slope decreases. This deposition consolidates along time between two surface runoff events.
This module integration inside PESHMELBA allows the comparison of different scenarios of agricultural practices and land use, by taking into account different configurations of the landscape elements. This first version of the erosion model is still in the testing phase, where the first simulations show consistent results and illustrate the interest of a continuous dynamic simulation, essential to represent pesticide transfer. Despite the current constraints and limitations of this model, it shows great potential to represent erosive processes in a more realistic way, by further refining and improving this first version in subsequent contexts.

How to cite: Lima, T., Carluer, N., Rabotin, M., Moussa, R., and Lauvernet, C.: Development of an erosion and transfer particulate phase pesticides model at the watershed scale, EGU General Assembly 2023, Vienna, Austria, 23–28 Apr 2023, EGU23-5845, https://doi.org/10.5194/egusphere-egu23-5845, 2023.

EGU23-5963 | ECS | PICO | HS9.2

Reactive transport in channel flows with bed adsorption and desorption 

Jie Zhan, Weiquan Jiang, and Zi Wu

Researches on the solute dispersion process with adsorption and desorption at boundaries are common in various fields, such as chemistry, biology and hydraulics. However, the Laplace transform as an available method for the adsorption-desorption boundary conditions, is complicated and difficult to apply. Recently, Jiang et al. (J. Fluid Mech., vol. 947, 2022, A37) proposed a much simpler analytical method based on the classic framework of separation of variables to derive solutions of concentration moments for a tube flow, which is valid for the entire range of the reactive transport process. The key of this approach is to solve the eigenvalue problem for the bulk and surface concentration distributions with the adsorption-desorption boundary conditions. Compared with the Laplace transform method, this new method can effectively avoid the complexity caused by the inverse Laplace Transform. Here we apply this simple approach to solute transport in channel flows with bed adsorption and desorption. We investigate the effect of adsorption-desorption on the dispersion process, and the influence of initial conditions on the non-uniformity of dispersion characteristics over the cross-section before the Taylor dispersion regime.

How to cite: Zhan, J., Jiang, W., and Wu, Z.: Reactive transport in channel flows with bed adsorption and desorption, EGU General Assembly 2023, Vienna, Austria, 23–28 Apr 2023, EGU23-5963, https://doi.org/10.5194/egusphere-egu23-5963, 2023.

EGU23-6452 | PICO | HS9.2

River load estimation of micropollutants: The Importance of event-driven sampling 

Nikolaus Weber, Steffen Kittlaus, Radmila Milacic, Ottavia Zoboli, Matthias Zessner-Spitzenberg, and Jörg Krampe

Thousands of micropollutants, emitted every day from numerous anthropogenic sources, end up in surface waters posing a risk to human health and the environment. Conventional monitoring approaches for an EQS-based assessment with e.g. monthly grab samples miss situations with high concentrations of total suspended solids (TSS) and associated chemicals. This is a clear shortcoming, especially in the context of load observations. To address this gap, we devolved a monitoring concept with event-driven sampling and applied it for the assessment of persistent micropollutants representative for different pollution sources and pathways in three Austrian rivers, namely the Wulka river and two of its tributaries.

The selected compounds belong to the groups of industrial chemicals with wide dispersive use, pharmaceuticals, herbicides, fungicides, and metals. An online monitoring station at each river measured water level/discharge, turbidity/TSS, and conductivity in 1 min timesteps, for the period of 20 months. Turbidity was measured to capture the river’s TSS variability on a high-resolution basis and to trigger automated autosamplers for sampling during specific flow events. Samples from high and base flow periods were analysed for concentration of the selected micropollutants in total and filtered samples.

The research allowed us to gain insights regarding the TSS and the related micropollutant transport dynamics of events and for the entire period. Preliminary results show that without event consideration the annual loads are underestimated for heavy metals and overestimated for pesticides.

The outcomes provide a better understanding of the transport of TSS and related chemicals and quantify the essential relevance of sampling during high-flow events for the assessment of transported loads of some micropollutants in rivers.

The monitoring was conducted within the EU Interreg Project Danube Hazard m3c.

How to cite: Weber, N., Kittlaus, S., Milacic, R., Zoboli, O., Zessner-Spitzenberg, M., and Krampe, J.: River load estimation of micropollutants: The Importance of event-driven sampling, EGU General Assembly 2023, Vienna, Austria, 23–28 Apr 2023, EGU23-6452, https://doi.org/10.5194/egusphere-egu23-6452, 2023.

EGU23-13155 | ECS | PICO | HS9.2

Including soil erosion and sediment delivery to surface waters in a high-resolution global hydrological model 

Florian Sorger-Domenigg, Ting Tang, and Dor Fridman

Soil erosion and sediment delivery to surface waters impact the human-water cycle in several ways. Eroded soil, along with nutrients, travels from intensive crop and grazing systems to waterbodies, reducing the fertility of agricultural land, degrading the integrity of freshwater ecosystems, and negatively impacting water quality on which the human population and other sectors depend. Furthermore, sedimentation reduces the functional capacity of vital energy and agricultural infrastructure, such as reservoirs and irrigation canals, resulting in reduced productivity and profitability of food and energy production systems. A few hydrologic models have accounted for the effects of soil erosion on water quality by implementing soil erosion models into their simulations. To our knowledge, soil erosion has not yet been included in large-scale hydrologic models. Our research adds an erosion-sediment transport module to the hydrological Community Water Model (CWatM). That is to assess soil erosion on a regional to a global scale and to simulate the concentration of suspended sediments in surface waters. CWatM is a fully-distributed, large-scale, open-source hydrological model. It runs on a daily time step and high resolution of up to 30 arc seconds (approximately 1 km at the equator). The model can account for human activity and management of water systems, including reservoir operations, water demand, and crop-specific irrigation requirements. A global dataset of 5 arc minutes is available for an easy simulation setup at a catchment, region, and global scale. The implementation of soil erosion and sediment delivery from terrestrial sources will rely on the Modified Universal Soil Loss Equation (MUSLE) and the stream network density within each grid cell. Further, simulating instream erosion uses a power law approach. Finally, the routing algorithm would move suspended soil particles downstream. For that purpose, we combine input datasets with CWatM variables, e.g., surface runoff. We apply this module to a case study in Uganda’s share of the Victoria Lake Basin at five arc minute resolution, where high soil erosion rates challenge the ecological integrity of the natural environment, as well as agricultural productivity and water quality. We further discuss the model sensitivity to input parameters’ variation (e.g., the fraction of daily rainfall in the half-hour of highest intensity).

How to cite: Sorger-Domenigg, F., Tang, T., and Fridman, D.: Including soil erosion and sediment delivery to surface waters in a high-resolution global hydrological model, EGU General Assembly 2023, Vienna, Austria, 23–28 Apr 2023, EGU23-13155, https://doi.org/10.5194/egusphere-egu23-13155, 2023.

EGU23-13623 | PICO | HS9.2 | Highlight

Effectiveness of an unprecedented decontamination program on river sediment and radioactive contaminant fluxes 

Rosalie Vandromme, Seiji Hayashi, Hideki Tsuji, Olivier Evrard, Thomas Grangeon, Valentin Landemaine, Patrick Laceby, Yoshifumi Wakiyama, and Olivier Cerdan

In the current context of raising concerns related to nuclear accidents and warfare, the lessons learnt from the Fukushima accident in 2011 are of particular interest. Indeed, the Japanese authorities implemented an ambitious decontamination program, which strongly differs from the strategy adopted in Chernobyl where the most contaminated area remains closed to the population nowadays. However, the impact of this strategy on the dispersion of radioactive contaminant fluxes across mountainous landscapes exposed to typhoons remains to be quantified. Based on the unique combination of river monitoring and modelling in a catchment representative of the most impacted area in Japan, we could demonstrate for the first time that decontamination only led to a decrease of 17% of the radionuclide fluxes in the river system. Furthermore, we calculated that 67% of the initial radiocesium remains stored in forests and may contribute to radiocesium dispersion in river systems in response to future erosive events. As the current research was conducted in an area representative of the 1,117 km²-area where remediation was completed early in 2017, it raises questions about the overall sustainability and cost-benefit effectiveness of such a remediation program that generated 9,100,000 m3 of waste for a cost of ~12 billion USD. Only a limited proportion of the initial population returned to their hometown (~30% by 2019), which remains a major challenge for the future of this region, although the primary goal of authorities to decrease the radiation dose rates in the inhabited areas was achieved. 

How to cite: Vandromme, R., Hayashi, S., Tsuji, H., Evrard, O., Grangeon, T., Landemaine, V., Laceby, P., Wakiyama, Y., and Cerdan, O.: Effectiveness of an unprecedented decontamination program on river sediment and radioactive contaminant fluxes, EGU General Assembly 2023, Vienna, Austria, 23–28 Apr 2023, EGU23-13623, https://doi.org/10.5194/egusphere-egu23-13623, 2023.

EGU23-15564 | PICO | HS9.2 | Highlight

The role of reservoir operation in sediment contribution to water quality: an spatiotemporal scale analysis along the Guadalquivir river 

Eva Contreras, Guillermo Salvador García, María José Polo, and Rafael Pimentel

In Mediterranean areas, where water scarcity is a common and recurrent problem, reservoirs play a key role in water resources management. Water allocation for different uses (e.g., urban, agricultural, hydroelectric, and ecological) can be affected by numerous external and internal factors limiting  their water quality condition in the reservoir and in the downstream areas. On the one hand, the loads of substances that alter water quality standards (e.g., sediments, nitrogen, phosphorus). On the other hand, the influence of the management and operation of the reservoir affects the streamflow natural regime. An example of these effects is found in the Guadalquivir river basin (Southern Spain), a highly regulated basin (113 reservoirs) with a relevant problem of sediment inputs throughout the river. The high sediment load is a consequence of the existence of high rates of erosion, favored by the complex orography, the high slopes, the extreme rainfall and the land uses, which partially or totally expose the surface of the land (e.g., olive groves). In this context, the objective in this work is to assess how water quality dynamics are affected by the management and operation of the Guadalquivir’ reservoirs system.

Historical information available for the study period 2011-2022 in 9 control points located in the Guadalquivir river and the main contributing subbasins was compiled,  including: 1) inflow, outflow, stored water volume and precipitation data in reservoirs on a monthly and daily basis, and 2) suspended solids concentration data on a monthly and hourly scale, all of them provided by public regional government data networks.

As result, the sediment loads received by the reservoirs located in the main axis of the Guadalquivir were estimated at daily, monthly, and annual time scales, showing direct relationships with water inputs. Two different scenarios depending on discharges and precipitation in the contributing subbasins were found to cause different effects in water quality: ordinary operation scenario and flood operation scenario. 

Therefore, the combined  understanding of the operational (discharges) and natural (rainfall events) drivers constitutes a relevant step for the effective, efficient, and sustainable management of water resources in reservoirs contributing to one of the challenges of society to comply with the Water Framework Directive in the current context of global warming.

Acknowledgements: This work has been funded by the project Integrated Management for the control of water inputs and sediments in reservoir systems in the Guadalquivir basin, with the economic collaboration of the European Funding for Rural Development (FEDER) and the Office for Economy, Knowledge, Enterprises and University of the Andalusian Regional Government.

How to cite: Contreras, E., García, G. S., Polo, M. J., and Pimentel, R.: The role of reservoir operation in sediment contribution to water quality: an spatiotemporal scale analysis along the Guadalquivir river, EGU General Assembly 2023, Vienna, Austria, 23–28 Apr 2023, EGU23-15564, https://doi.org/10.5194/egusphere-egu23-15564, 2023.

EGU23-16317 | PICO | HS9.2 | Highlight

The contribution of stream bank erosion to downstream dilution of mining-contaminated stream bed sediment in the Geul river in the Netherlands 

Marcel van der Perk, Reinder Hemstra, Simone Visschers, Harrie Winteraeken, Marco de Redelijkheid, and Didier Lemmens

The Geul river, a nearly 60 km long transboundary stream in the northeast of Belgium and southeast of the Netherlands, suffers from excessive fine sediment inputs. This causes the gravel bed to become clogged, which, in turn, hampers the reintroduction of salmonids in the river. To examine the occurrence and origin of fine sediments on the gravel bed of the Geul river, the fine sediment layer was mapped and sampled along the entire reach of the river from near the source to the mouth in late Spring 2021. The bed sediment samples were analysed for trace metal concentrations. The results from the trace metal analysis show that the diffuse ‘uncontaminated’ sediment inputs from the catchment resulting from soil erosion cannot fully explain the declining pattern of the zinc and lead concentrations in the bed sediments of the Dutch reach of the Geul river, downstream from the historic mining sites in the Belgian part of the catchment. This implies that additional sources of fine sediment that is less contaminated than the bed sediment exist. Assuming a model of a constant area-specific sediment yield from the catchment and a constant bank erosion rate per unit river length, the contribution of bank erosion in the Geul river was estimated to increase from 35% at the Belgian-Dutch border to about 67% at the river mouth. This model explains about 56% of the variance of measured zinc and lead concentrations in the bed sediments. The residual concentrations (modelled – measured) correlate negatively with the rubidium concentration in the bed sediment, which is a proxy for the clay mineral content of the sediment. The rubidium concentration explains about three quarters of the variance unexplained by the above sediment delivery model. The model assumptions and results are discussed against independent observations of suspended sediment transport and bank erosion in the Geul river.

How to cite: van der Perk, M., Hemstra, R., Visschers, S., Winteraeken, H., de Redelijkheid, M., and Lemmens, D.: The contribution of stream bank erosion to downstream dilution of mining-contaminated stream bed sediment in the Geul river in the Netherlands, EGU General Assembly 2023, Vienna, Austria, 23–28 Apr 2023, EGU23-16317, https://doi.org/10.5194/egusphere-egu23-16317, 2023.

EGU23-16546 | ECS | PICO | HS9.2

Spatial and temporal variation of sediment production in the upstream part of the Loire River (35000 km²) 

Brahim Hichem Belbal, Germain Antoine, Sébastien Boyaval, Olivier Cerdan, Florent Taccone, and Rosalie Vandromme

We try to explain the variations of the sediments flux ("daily production") measured at a water intake on the French Loire River during "10 years". Over the last decade, this intake channel has experienced a change in its siltation dynamic, resulting in changes of sediments type and volume settled at its bottom. These changes may be explained, either by the variation of sediments production rates (soil erosion) on the upstream watersheds or by the fluvial dynamics of the Loire River, in particular, by the storage and remobilization of fine sediments in the complex morpho dynamics of the riverbed.

In this context, we will evaluate the variation of sediments production rates (soil erosion) in the upstream watersheds, over an area of approximately 35,000 km². The aim is to determine how the produced fluxes evolve in space (spatial distribution) through the principle of sediment yield but also to study the changes in temporal dynamics and to identify its potential causes, for instance lithology, landuse, rainfall events…

How to cite: Belbal, B. H., Antoine, G., Boyaval, S., Cerdan, O., Taccone, F., and Vandromme, R.: Spatial and temporal variation of sediment production in the upstream part of the Loire River (35000 km²), EGU General Assembly 2023, Vienna, Austria, 23–28 Apr 2023, EGU23-16546, https://doi.org/10.5194/egusphere-egu23-16546, 2023.

The formulation of the reservoir desiltitation strategy has been addressed as an essential issue worldwide because the water resources crisis has become serious in recent years. The sediment-releasing operation using the current sluice gates or the bypass tunnel during flooding events can slow down the reservoir deposition and keep the storage capacity. However, the variation of downstream river morphology inevitably affected the channel stability due to the reservoir sediment-releasing operation. The sediment transportation downstream of the reservoir needs to be further investigated to determine the potential risk. This study adopted a calibrated two-dimensional numerical model, SRH-2D, to investigate the river morphology in the Tamshui River in northern Taiwan, East Asia. Three different typhoon events, Typhoon Hinnamnor, Soudelor, and Aere were considered slight, moderate, and severe scenarios. In addition, the original operation, sediment releasing, and bypass joint operation could be represented as the lowest, medium, and highest sediment released rate situation. The simulation shows the erosion and deposition location of different typhoon events and reservoir operations to highlight the potential disaster hotspot. As a result, this research can be a reference to reservoir management to adjust the operation principle to obtain the balance between reservoir storage capacity and downstream river stability.

How to cite: Huang, C.-C.: Simulation of River Morphology Change due to Reservoir Desiltitation Operation, EGU General Assembly 2023, Vienna, Austria, 23–28 Apr 2023, EGU23-109, https://doi.org/10.5194/egusphere-egu23-109, 2023.

Fluvial geomorphology is the study of various landforms while analyzing the changes that are happening on the earth surface due to climate change and anthropogenic activities. Fluvial geomorphological parameters change due to natural processes like erosion, transportation, and deposition of sediments. It also changes due to manmade activities such as the construction of dams, canals, irrigation projects, etc. In this regard, the present study aims to analyze the changes in various fluvial geomorphological parameters of the Godavari River basin such as sinuosity index, braiding index, channel length index, channel count index, etc. using the Landsat images at a frequency of every 2 years from 2000 to 2022, along the length of the channel in the Godavari River, India. The second objective of this study is to perform a river bank stability analysis by using the Automatic Water Extraction Index (AWEI) at different time scales. Thirdly, we aim to quantify length, areal and relief parameters using ALOS PALSAR Digital Elevation Model (DEM) for different sub-basins of the Godavari. Due to the changes in the geomorphology, cross-section of the river is altered; the silt content increases near the hydraulic structures, the velocity of the water changes, the sinuosity (meandering) increases and it tends to the formation of oxbow lakes. This analysis helps to investigate the performance of the sub-basins of Godavari River and how much sensitive they are to erosion. An economical river bank stabilization technique can be suggested based on the rate of river bank shift and type of soil information obtained from Food and Agricultural Organization.

How to cite: Prashanth, T. and Ganguly, S.: Analyzing the behavioural changes of various fluvial geomorphological parameters using multi-temporal satellite images for the Godavari River, India, EGU General Assembly 2023, Vienna, Austria, 23–28 Apr 2023, EGU23-300, https://doi.org/10.5194/egusphere-egu23-300, 2023.

EGU23-512 | ECS | Posters on site | HS9.3

Effect of Channel Bed Roughness on the Mode of Bedload Transport and Signal Response of Impact Plate with an Accelerometer 

Bidhan Kumar Sahu and Pranab Kumar Mohapatra

Studying bedload transport is essential for analysing erosion and deposition processes in the channels and designing hydraulic structures. Impact plate systems are indirect devices deployed to measure bedload consisting of a metal plate. When the bedload sediments strike the plate, they create vibrations which are recorded as signals by an acoustic sensor attached to the plate. The signal acquired is then processed to find the bedload properties. Flow velocity and mode of bedload transport can affect the signal. The effect of velocity on the impact plate signals is well documented in the literature. However, the role of channel bed roughness which hugely influences the mode of transportation of bedload, is yet to be studied in detail. This study investigates the effect of channel roughness on the mode of bedload transport and the signal registered in an impact plate in a laboratory flume. The impact plate is placed at the downstream end such that the top plate of the box is aligned with the bed of the flume. An accelerometer sensor is attached to the underside of the plate to record the vibrations. The bed of the flume 2.5m upstream of the impact plate is composed of a replaceable “rough” section. Four different tests are conducted considering four separate rough sections (smooth, 2mm, 5mm, and 10 mm). The bedload particles are sorted into five classes based on their size, from 2.36mm to 20mm. In each test, the particles from a particular grain size class are manually released 5m upstream of the impact plate. The signal generated from the bedload strike is used to develop a calibration equation relating to bedload size and channel roughness. A digital camera is used to capture the bedload movement over the plate to link the mode of bedload transport with the signal.

How to cite: Sahu, B. K. and Mohapatra, P. K.: Effect of Channel Bed Roughness on the Mode of Bedload Transport and Signal Response of Impact Plate with an Accelerometer, EGU General Assembly 2023, Vienna, Austria, 23–28 Apr 2023, EGU23-512, https://doi.org/10.5194/egusphere-egu23-512, 2023.

In hydraulic engineering, river discharge estimation is an important requirement for managing and planning the channel flow. Discharge measurements are of utmost importance for the purposes such as water availability analysis, reservoir operation, flood forecasting, designing of hydraulic structures, etc. In the discharge estimation process, the spatial velocity distribution in the transverse cross-section at the desired location of measurement is required. In traditional approaches such as Prandtl-Von Karman logarithmic law and power law, the velocity is employed deterministically, making its utility easier and providing accurate results for the wide channels only. In contrast, Shannon’s information entropy concept, which evaluates random variables probabilistically, is used in hydrology to determine entropy-based velocity distributions. In this approach, the velocity distributions obtained depends on a parameter called as entropy parameter, which is considered to be a fundamental measure of information about the channel characteristics such as channel bed slope and roughness. It provided better results for both the clear water and sediment-laden flow as compared to the former. In the present study, experiments for discharge estimation were performed on the experimental flume to collect the velocity data at different channel bed slope conditions to demonstrate the accuracy of the entropy-based concept. To prove the truthfulness of the entropy-based concept, the results were compared with the ones obtained from the classical method (velocity area method). Both the approaches have their respective advantages and limitations. Therefore, error analysis was necessary to check the efficiency and accuracy of the entropy-based model, which was performed by comparing the percentage error between the observed and computed discharge values. The final results revealed that the entropy model was a quick and accurate technique for discharge estimation as absolute percentage errors were less than 5% and the 95th percentile was 3%.

How to cite: Singh, G. and Khosa, R.: Discharge Estimation for Different Bed Slope Conditions Using Entropy-Based Concept: An Experimental Investigation, EGU General Assembly 2023, Vienna, Austria, 23–28 Apr 2023, EGU23-868, https://doi.org/10.5194/egusphere-egu23-868, 2023.

Habitat structures such as the Interception Rearing Complexes (IRC) are intended to aid endangered species such as the larval pallid sturgeon by increasing the movement of larval sturgeon out of the main river channel and into the channel margin through the construction or modification of river training structures. The studied IRC are designed to create fish pathways that access the lower velocities and generally shallower depths in the channel margin where juvenile sturgeon have a chance to mature in areas with critical food resources. A Two-Dimensional (2D) Adaptive Hydraulics/Sediment Library (AdH/SEDLIB) depth-averaged, shallow-water, finite element model has been created to study the potential effects that the construction of an IRC may have on other factors, such as long-term bed morphology, navigation, velocity distribution, water surface elevations, and potential flood risk. The model simulates a stretch of river under consideration for the construction of IRC structures. First, the model was set up with pre-existing riverbed and structure geometry. The model was validated for a period between 2017-2020. After calibration, the model was run with the implementation of the proposed IRC structure geometry and compared to system behavior without IRC construction. The validated model was used to evaluate the effects of the proposed IRC on other river processes, by performing simulations both with and without the implementation of the IRC and analyzing inter-model comparisons. The presentation will focus on the details of the modeling system including numerics, application and analysis of results.

How to cite: Savant, G., Denney, C., and Brown, G.: Numerical Model Based Analysis of River Training and Habitat Structures on River Processes: Straubs Bend of the Missouri River, EGU General Assembly 2023, Vienna, Austria, 23–28 Apr 2023, EGU23-1717, https://doi.org/10.5194/egusphere-egu23-1717, 2023.

EGU23-2270 | ECS | Orals | HS9.3

Rheological behavior of dense granular suspensions of cohesive particles 

Alireza Khodabakhshi, Sudarshan Konidena, and Bernhard Vowinckel

Intense sediment transport situations such as debris flows and mudslides consisting of fine-grained particles can pose serious threats to human infrastructures and lives. A thorough understanding of the rheology of such cohesive granular flows is crucial to predict the behavior of these types of flow and to mitigate their damaging effects. Whereas the rheology of non-cohesive granular flows has been studied extensively in the literature, the effect of cohesive inter-particle forces on the rheological behavior is still obscure and has not been sufficiently addressed. In this study, employing particle-resolved Direct Numerical Simulations, we simulate non-cohesive and cohesive dense suspensions sheared by moving walls. We perform several high-resolution simulations and compare the rheological parameters of the suspensions for different values of a dimensionless cohesive number, Co. Direct Numerical Simulations enable us to delve into the stress profiles in the vertical and streamwise directions and explore the contribution of different particle and fluid stresses to the total stress in each direction. We will also investigate the microstructure of the suspension and relate the microscopic interactions to macromechanical, rheological behavior of the dense cohesive suspension. 

How to cite: Khodabakhshi, A., Konidena, S., and Vowinckel, B.: Rheological behavior of dense granular suspensions of cohesive particles, EGU General Assembly 2023, Vienna, Austria, 23–28 Apr 2023, EGU23-2270, https://doi.org/10.5194/egusphere-egu23-2270, 2023.

EGU23-3820 | ECS | Orals | HS9.3

CFD Modelling of Local Scour and Flow Field around Isolated and In-Line Bridge Piers using FLOW-3D 

Harshvardhan Harshvardhan and Deo Raj Kaushal

Scouring at bridge piers is troublesome and inevitable at the same time. Numerous empirical studies have been conducted in the last century to predict scour depth, but they completely ignore the physics of the problem. The physics behind scouring at bridge piers can be best understood in terms of the effect of the flow field around the pier at different stages of scour. This study comprises experimental and numerical parts. Experiments are conducted in the laboratory in which the flow field data at equilibrium is collected using Acoustic Doppler Velocimeter (ADV) and the equilibrium scoured bed is measured around isolated and In-Line Piers. Additionally, the commercial CFD code “FLOW-3D HYDRO 2022 R1” is utilized to simulate the flow field and scour around bridge piers. The FLOW-3D model solves the three–dimensional momentum and continuity equations coupled with the sediment transport equations to calculate and predict the flow field and the equilibrium scoured bed. While the maximum scour depth at equilibrium has been used to validate various CFD codes in the past, point-wise comparison of scour depth is scanty in previous research works. Moreover, the flow field at the equilibrium scour stage obtained using FLOW-3D has also been compared with experimental data available in the literature and experiment conducted in the laboratory. The performance of the CFD model is evaluated, the flow field and scoured bed geometry at equilibrium are analyzed and results are presented.

How to cite: Harshvardhan, H. and Kaushal, D. R.: CFD Modelling of Local Scour and Flow Field around Isolated and In-Line Bridge Piers using FLOW-3D, EGU General Assembly 2023, Vienna, Austria, 23–28 Apr 2023, EGU23-3820, https://doi.org/10.5194/egusphere-egu23-3820, 2023.

EGU23-4383 | Posters on site | HS9.3

Investigating Intermittent Flow Stagnation at Channel Confluence of Braided River 

Anurag Handique, Shakti Kalyani, Arup Kumar Sarma, and Rajib Kumar Bhattacharjya

Confluences of rivers are classified as one of the most intricate hydrodynamic environments. The convergence of incoming flows at confluences generated by two rivers or subchannels in large braided rivers creates complex fluid motion patterns, including the growth of large-scale turbulence formations. A study on the dynamics of flow mixing and propagation from the adjoining channels could be tricky as the channels consisting of the confluence usually acts as a flow barrier to each other. The flow in the dominant channel would initially act as a virtual barrier to the incoming channel, intercepting its free movement to the main channel. Post this stagnation, the less dominant flow gain energy because of a temporary rise in its level due to flow accumulation and eventually merge into the main stream in due course of time. However, when the confluence involves two channels of relatively similar strengths, primarily observed in large complex braided rivers, the complete or partial flow stagnation is observed in both the sub-channels alternatively in subsequent times. This distinctive flow phenomenon was first observed by our research team during 2004 while doing a hydrographic survey for modelling purpose in the Brahmaputra River of Assam, India, and is popularly called “Hamol” by the riverine community. Owing to this peculiar occurrence, there can be several implications on the river, such as changes in sediment dynamics, influencing the aquatic biota and habitat alterations, etc. For numerical river flow modelling, accurately simulating confluence hydrodynamics is a significant challenge. In this work, this phenomenon is investigated in a confluence composed of two sub-channels with different strengths through a mathematical model study. The model is simulated in the Brahmaputra River near Bahari, Barpeta from the viewpoint of its complex braiding patterns existent in this stretch. A TVD McCormack predictor corrector technique is used in the mathematical model to solve a modified form of boundary fitted shallow water equations in the MATLAB environment. The stability of the model is governed by the Courant criteria, with the Courant number being less than unity. Through the model study, the variations of the depth-averaged streamwise velocities and the simulated flow depths in the grid points prior to the confluence juncture in the less dominant channel are compared in different timesteps. Alongside, the characteristic of such transitions is examined for different discharge ratios of the two adjoining channels. The study indicated the efficacy of the mathematical model in capturing the “Hamol” phenomenon observed practically in the field.

How to cite: Handique, A., Kalyani, S., Sarma, A. K., and Bhattacharjya, R. K.: Investigating Intermittent Flow Stagnation at Channel Confluence of Braided River, EGU General Assembly 2023, Vienna, Austria, 23–28 Apr 2023, EGU23-4383, https://doi.org/10.5194/egusphere-egu23-4383, 2023.

EGU23-5093 | ECS | Posters on site | HS9.3

Investigating the relationship between particle size of suspended sediments and optical sensor turbidity readings 

Tamara Kuzmanić, Klaudija Lebar, Mateja Klun, and Simon Rusjan

Optical sensors are widely used for turbidity measurements in suspended sediment concentration studies. When conducting continuous measurements of turbidity in the field with optical sensors, results are determined according to the calibration curve (relationship between suspended sediment concentration and turbidity readings from the optical sensors). The calibration curve is developed based on the samples of the material present in and/or around the investigated stream. The concentration data are useful in water-quality-related investigations as well as for evaluating the amounts of transported (flushed, eroded) material from the catchments as suspended load. The amounts and particle sizes of transported material depend on the hydrological conditions. Usually, the particles’ size is not directly considered when developing the calibration curve. However, different particle sizes of the material from the same study site can result in different turbidity readings. Taking into account one general calibration curve for suspended sediment concentration determination can lead to misestimation of the transported material amounts. Here, the results of turbidity sensor calibration for different particle size classes are presented. Additionally, the uncertainty of the suspended material concentrations due to this effect is estimated. Further, we show how different calibration curves affect the assessment of the amount of the transported suspended load from the selected experimental catchment.

How to cite: Kuzmanić, T., Lebar, K., Klun, M., and Rusjan, S.: Investigating the relationship between particle size of suspended sediments and optical sensor turbidity readings, EGU General Assembly 2023, Vienna, Austria, 23–28 Apr 2023, EGU23-5093, https://doi.org/10.5194/egusphere-egu23-5093, 2023.

EGU23-6198 | ECS | Orals | HS9.3

Finite-amplitude modeling of estuarine sand dunes 

Wessel van der Sande, Pieter Roos, Theo Gerkema, and Suzanne Hulscher

Estuarine sand dunes are primary bedforms existing in many sandy estuaries. They generally have lengths between those of river dunes (tens of meters) and marine sand waves (on the order of hundred meters). Estuaries are known for their complex flow patterns, arising from a mix of riverine and tidal flow, bringing in freshwater from land and salt water from the sea. Two particular flow patterns arising from the interaction between salt- and freshwater are the gravitational circulation and the strain-induced circulation, induced by a longitudinal and a vertical salinity gradient, respectively. Recent research was directed to understanding the influence of these flow patterns on estuarine sand dunes through a linear morphodynamic model ([1], [2]). Linear stability models are capable of capturing initial growth from a flat bed, and yield the system’s preferred bedform length and migration rate.

Here, we build upon the linear modeling approach with a nonlinear morphodynamic model capturing both the subsequent bedform development towards equilibrium, and the effect of dunes on the flow as they develop. The model domain has spatially periodic boundary conditions and a rigid lid at the surface; the hydrodynamic module is non-hydrostatic and is solved with a k-omega turbulence closure. Furthermore, we include bed-load sediment transport with a formulation that contains a slope term. Results show the height, length, shape and migration rate of dunes in an estuarine environment, and reveal the flow- and turbulence patterns over these bedforms. Furthermore, we show the deceleration of the flow with development of dunes, and thus quantify the effect of dunes on flow resistance.

[1]          Van der Sande, W. M., Roos, P. C., Gerkema, T., & Hulscher, S. J. M. H. (2021). Gravitational circulation as driver of upstream migration of estuarine sand dunes. Geophysical Research Letters, 48(14). DOI: 10.1029/2021GL093337

[2]          Van der Sande, W. M., Roos, P. C., Gerkema, T., & Hulscher, S. J. M. H. (in press).  Shorter estuarine dunes and upstream migration due to intratidal variations in stratification. Estuarine, Coastal and Shelf Science. DOI: 10.1016/j.ecss.2023.108216


How to cite: van der Sande, W., Roos, P., Gerkema, T., and Hulscher, S.: Finite-amplitude modeling of estuarine sand dunes, EGU General Assembly 2023, Vienna, Austria, 23–28 Apr 2023, EGU23-6198, https://doi.org/10.5194/egusphere-egu23-6198, 2023.

EGU23-6764 | ECS | Posters on site | HS9.3

Remotely sensed data in bed load transport models of mountain rivers 

Theresa Himmelsbach, Bernhard Gems, Katharina Baumgartner, and Markus Aufleger

While hydraulic models belong to the standard toolkit of engineers, numerical models for bed load transport in mountain rivers, here defined by steep slopes and coarse bed material, still lack reliability. On one hand, this is attributed to the complex processes in mountain rivers due to highly turbulent flows, changing flow conditions and higher form and spill drag due to immobile boulders compared to gravel-bed rivers. And on the other hand, the models highly depend on underlying input terrain data such as river section data, which in an alpine environment is generally difficult to access. The ongoing advances in remote sensing techniques, in particular in the field of topo-bathymetric laser scanning offer high-resolution bathymetry data. Compared to terrestrial laser scanning, topo-bathymetric laser scanning also captures the structure below the water surface. A water-penetrating laser system, using the green region of the electromagnetic spectrum (wavelength of 532 nm), provides valuable information across the whole river section. Depending on the conditions, such as turbidity and white water, the data achieves up to 20 - 50 survey points per square meter. Generally, the laser scanners are carried by aircrafts (manned or unmanned) to deliver large-scale high-resolution bathymetric survey data. The current research investigates the advances of high-resolution and spatially continuous bathymetry laser scanner data on sediment transport models for mountain rivers. Besides the general application as terrain data for bedload transport models, the research interest is also on the derivation of form drag through different parameters such as grain size D84 and standard deviation σz from the point cloud. For this research, available data from a mountain river in South Tyrol (Italy), covering a length of about 1.5 km over the whole river width with about 40 points/m², is applied. The river section has a slope of about 2 %, an anthropogenic-influenced cascade section in the upper part with single exposed boulders and a plan-bed character in the lower section. The mean particle size of the surface layer is about d90 = 0.10 m. With this data, the current research aims to derive extensive grain size and flow resistance information from topo-bathymetric laser scanner data and compare it with the traditional reference measurements from field data. Both data sets, from the remote-sensing and the field measurements, are tested on different approaches for bed-load transport capacity, form drag and critical flow, with particular respect to flow resistance. It is expected, that the higher information on a reach scale greatly improves the estimation of the flow resistance of mountain rivers and thus, improves the estimation of sediment transport rates in alpine environments. The contribution shows the first results of this research.

How to cite: Himmelsbach, T., Gems, B., Baumgartner, K., and Aufleger, M.: Remotely sensed data in bed load transport models of mountain rivers, EGU General Assembly 2023, Vienna, Austria, 23–28 Apr 2023, EGU23-6764, https://doi.org/10.5194/egusphere-egu23-6764, 2023.

EGU23-7152 | Orals | HS9.3

MultiPAC as a tool to monitor the sustainability of riverbed restoration measures 

Stefan Haun, Beatriz Negreiros, Sebastian Schwindt, Alcides Aybar Galdos, Markus Noack, and Silke Wieprecht

Many water bodies are, as a result of anthropogenic influences, such as river straightening, river bank fixation, or damming in accordance with the EU Water Framework Directive (2000/60/EC) not in a good ecological state anymore. With the aim to return to a good ecological status for surface waters, restoration measures are implemented in many rivers. However, the success and sustainability of such measures are often site-dependent and require hence an objective assessment.

In this study, the Multi-Parameter Approach to assess Clogging (MultiPAC) was used to assess the suitability and sustainability of different riverbed restoration strategies. MultiPAC is based on several measured physico-chemical parameters, which enable a detailed investigation of in-situ conditions of gravel-bed rivers. The approach includes measurements of the sediment composition for identifying surface and subsurface grain size distributions and fine sediment fractions. In addition, measurements of the porosity are obtained by using Structure-from-Motion and the Water Replacement Method of freeze-core samples. Finally, measurements of the interstitial oxygen concentration and so-called slurping rates, which are converted into hydraulic conductivity, were performed with a double-packer system called VertiCo.

The residual river stretch between Jettenbach and Töging at the Inn River in Germany provided a means to evaluate riverbed restoration measures, implemented in February and March 2020. Investigations were performed for several gravel bars, where sediment was replenished and a mechanical break-up of the bed armour layer was conducted. The MultiPAC investigations were performed before measure implementation, shortly afterwards (March 2020) and in November 2020 to investigate the impact of a flood event with a 10-year return period, which occurred in August 2020, and thus may have influenced the sustainability of the restoration measures.

From the measurements, it can be seen that sediment replenishment and the mechanical break-up of the armour layer significantly improved the ecological functioning of the riverbed. However, it became evident that the increase in the quality of the riverbed was only temporary. Hence, these measures will need to be repeated regularly with the aim of maintaining ecologically-valuable riverbed habitat conditions. The results of this study also showed that MultiPAC provides detailed insights into the riverbed sediments, their composition, and the permeability of the riverbed.

How to cite: Haun, S., Negreiros, B., Schwindt, S., Aybar Galdos, A., Noack, M., and Wieprecht, S.: MultiPAC as a tool to monitor the sustainability of riverbed restoration measures, EGU General Assembly 2023, Vienna, Austria, 23–28 Apr 2023, EGU23-7152, https://doi.org/10.5194/egusphere-egu23-7152, 2023.

EGU23-8007 | ECS | Orals | HS9.3

Near-bottom sediment transport during flood events on a small mountainous river 

Florian Meslard, François Bourrin, Yann Balouin, and Nicolas Robin

Small mountainous rivers provide an important part of the sedimentary inputs to the oceans. The particularity of theses rivers comes from the fact that their inputs take place mostly during brief and intense flood events. While the quantification of fine sediment flux is fairly well known, sandy inputs are very poorly known and field measurements are scarce. River mouth sand discharge is a key variable in the coastal sediment budget as it participates to the coastline evolution and its protection against marine events. Coarse sediments are mainly transported as bedload, making it difficult to estimate with traditional methods such as traps. In this study, a fixed Acoustic Doppler Current Profiler (ADCP Nortek Aquapro 1 MHz) was deployed on a bottom frame, near the mouth of the Têt river (SE France) to estimate near-bottom sediment transport during flood events. In addition, cross sections have been undertaken with a Sontek Hydroboard equipped with a Sontek M9 ADP at different water discharge during several flood events. A calibration of the backscatter index was carried out using gravimetric measurements and granulometric analysis of water samples to estimate the sediment flux and the sand proportion. Sediment fluxes were then compared with the altimetric variations observed from bathymetric surveys. Results allowed to characterize the variability of the boundary layer thickness and the sediment concentrations during flood events. Those results give useful information to estimate sand fluxes from mountainous rivers to the coastal area in a context where these are considered to be low or non-existent compared to large coastal rivers.

How to cite: Meslard, F., Bourrin, F., Balouin, Y., and Robin, N.: Near-bottom sediment transport during flood events on a small mountainous river, EGU General Assembly 2023, Vienna, Austria, 23–28 Apr 2023, EGU23-8007, https://doi.org/10.5194/egusphere-egu23-8007, 2023.

EGU23-8056 | ECS | Orals | HS9.3

Bifurcations in mountain rivers: insights on their hydraulics from field measurements 

Ivan Pascal, Raphaël Miazza, Bob de Graffenried, and Christophe Ancey

Although the importance of studying channel bifurcations is widely recognised, their hydraulic behaviour in shallow, rough mountain rivers has so far received little attention from researchers. Understanding the specific hydraulics of such units is essential for predicting and interpreting their morphodynamic evolution. Water discharge measurements in the incoming channel and distributaries are often difficult to perform in steep streams characterised by high relative roughness (grain size to depth ratio d/h > 0.1), aerated flow, and marked free-surface waves. Nonetheless, recent advances in Acoustic Doppler Current Profiler (ADCP) technologies open new possibilities for studying the flow configuration at stream bifurcations.

We monitored the flow repartition in a bifurcation of a mountain gravel-bed river by deploying an ADCP specifically designed for shallow flow conditions. This field campaign was combined with photogrammetric surveys for documenting the geomorphological evolution of the river bed, its surface grain size distribution and structure. Integrating data from these different sources provided useful information on the bifurcation evolution and hydrodynamics. During a period in which the river bed did not undergo noticeable elevation changes, we observed that the water discharge ratio of the distributaries was approximately constant for sensibly different total discharge values. Such result was compared with the outcomes of numerical simulations.

How to cite: Pascal, I., Miazza, R., de Graffenried, B., and Ancey, C.: Bifurcations in mountain rivers: insights on their hydraulics from field measurements, EGU General Assembly 2023, Vienna, Austria, 23–28 Apr 2023, EGU23-8056, https://doi.org/10.5194/egusphere-egu23-8056, 2023.

    Sediment dynamics is a key mechanism of the interaction between sediment particles and fluid particles. Therefore, the stochastic Diffusion Particle Tracking Model (SD-PTM), a Langevin equation-based model, was introduced to randomly simulate suspended sediment particles' movement by incorporating Brownian Motion (BM) in the Langevin equation.

    Under the framework of Kolmogorov's turbulence theory, large-scale eddies with a high Reynolds number (Re) show similarity while continuing to break into smaller eddies. A correlation thus exists between time increments. In addition, according to the bursting process near the bed region, we assume that sweep events with eddies of various sizes contribute mainly to the resuspension mechanism. Consequently, a generalized stochastic process is required to incorporate the correlation, interpreted as either a memory effect or long-range dependency. Fractional Brownian Motion (fBm), a continuous and centered Gaussian process characterized by the Hurst parameter(H), can describe the long-range dependency more precisely. Moreover, we seek to develop a relationship between the H-parameter and turbulent intensity.

    In addition, the dependent increment assumption invalidates the Ito formula. As such, advanced stochastic calculus should be adopted as an alternative. The Malliavin derivative and Skorohod integral, defined in Weiner space, are introduced to fulfill the assumption and to maintain the fundamental rules in the Riemann integral to a random variable. This study further introduces the Wick-Ito expansion with Hermit Polynomial to overcome the abovementioned computational issue; thus, both the fractional Brownian Motion and the stochastic ordinary differential equation (SODE) can be simulated.

    Last, to build a physically based SODE for sediment transport in open channel turbulent flow, we aim to more comprehensively determine the diffusion coefficient and Hurst parameter by the turbulent properties. In addition, the turbulent sweep events are known to entrain the sediment particles back into the water column in the near-wall region. Therefore, when including the particle memory effect attributed to turbulent sweep events by introducing fBm to the resuspension mechanism, particles in the near-wall region impacted by the sweep events can be more precisely simulated.

How to cite: Shen, W.-M. and Tsai, C. W.: Incorporating the resuspension mechanism into suspended sediment particle tracking by fractional Brownian Motion with Malliavin calculus, EGU General Assembly 2023, Vienna, Austria, 23–28 Apr 2023, EGU23-8077, https://doi.org/10.5194/egusphere-egu23-8077, 2023.

EGU23-8386 | ECS | Orals | HS9.3

Subwater particle image velocimetry and  photogrammetry  as solution for enhanced seasonal measurements of river dynamics (more precisely: bedload transport) 

Juha-Matti Välimäki, Eliisa Lotsari, Tuure Takala, Franziska Wolff, Virpi Pajunen, and Anette Eltner

Northern rivers are responding to global warming by changes in seasonal discharges, sediment transport rates and morphology. Very limited amount of studies about bedload transport rates have been carried out in the winter-season. Traditional methods of measuring bedload transport are limited by their proneness to user error, small spatial scales and uncertainties related to the equipment itself. Computer vision-based particle image velocimetry (PIV) and particle tracking velocimetry (PTV) methods have been successfully applied to measurements of water surface velocities and preliminary results show that they can be applied to underwater sediment transport velocity measurements. 

The aims of this study are to 1) to enhance the bedload calculations, by comparing traditional mechanical methods and computer vision-based particle image velocimetry methods applied to underwater video data sets. Additionally, topography created from underwater imagery is used to scale and  georeference the results with very good precision, and 2) understand the seasonal variation in bedload transport amounts based on both mechanical and image velocimetry methods.

The study is based on field data, measured at sub-arctic Pulmanki river, located in northern Finland. The data has been gathered in 2021 autumn and winter, 2022 spring, 2022 autumn, to cover different possible sediment transport conditions, from low flow ice-covered to high flow open channel periods. The preliminary results are presented. They show that the method is promising in enhancing the understanding of sediment transport processes and the seasonal transported amounts.

How to cite: Välimäki, J.-M., Lotsari, E., Takala, T., Wolff, F., Pajunen, V., and Eltner, A.: Subwater particle image velocimetry and  photogrammetry  as solution for enhanced seasonal measurements of river dynamics (more precisely: bedload transport), EGU General Assembly 2023, Vienna, Austria, 23–28 Apr 2023, EGU23-8386, https://doi.org/10.5194/egusphere-egu23-8386, 2023.

EGU23-9781 | Posters on site | HS9.3

Two-phase simulation of scour using a hybrid RANS-LES turbulence model 

Alban Gilletta de Saint Joseph, Julien Chauchat, Cyrille Bonamy, and Marie Robert

The coastal environment is meeting numerous anthropogenic changes especially with the increased implementation of bottom-fixed Offshore Wind Farms. Few feedbacks are available for these recent infrastructures facing a complex turbulent marine environment made of combined waves and currents. In the presence of a pile, strong hydrodynamical eddies structures form that are responsible for the scour process which may lead to the failure of the wind turbine. Former two-phase flow simulations of this problem [1] have been performed using the Reynolds-Averaged Navier-Stokes approach for turbulence modelling and they have shown some limitations to reproduce the main features of the scour process. Turbulence modelling was argued to be the major bottleneck. In order to further investigate this problem, an extensive study of the numerical simulation of the flow hydrodynamic around a wall-mounted cylinder has been carried out using a hierarchy of turbulence models including RANS, hybrid RANS-LES and LES. The range of Reynolds numbers is too large to allow for a well-resolved LES and therefore hybrid RANS-LES is essential to reproduce main hydrodynamical features at an affordable cost. In this study we evaluated the k-omega SST model coupled with the Improved Delayed Detached Eddy Simulation [2] and the Scale-Adaptative Simulation [3]. All the simulations have been performed using OpenFOAM an open-source Computational Fluid Dynamics toolbox. Our simulations suggest that the k-ω SST SAS is the best model for this configuration. It has been adapted for the two-phase flow Eulerian-Eulerian approach and implemented in sedFOAM [4]. Preliminary results of the two-phase simulation of Roulund and co-worker experiments [5] shows very encouraging results in terms of morphological features at short-time scales. These results will be presented during the conference together with in-depth analysis of the sediment transport fluxes.

References

[1] Nagel T., Chauchat J., Bonamy C., Liu X., Cheng Z. and Hsu T. - J., Three-dimensional scour simulations with a two-phase flow model, Advances in Water Resources (2020).

[2] M. S. Gritskevich, A. V. Garbaruk, J. Schütze and F. R. Menter, Development of DDES and IDDES Formulations for the k-ω SST Model, Flow Turbulence Combust (2012).

[3] F. R. Menter and Y. Egorov, A scale-adaptative simulation model using two-equation models, American Institute of Aeronautics and Astronautics Paper (2005).

[4] J. Chauchat, Z. Cheng, T. Nagel, C. Bonamy, and T.-J. Hsu, Sedfoam-2.0: a 3-d two-phase flow numerical model for sediment transport, Geoscientific Model Development (2017).

[5] Roulund A., Sumer B. M., Fredsøe J. and Michelsen J., Numerical and experimental investigation of flow and scour around a circular pile, Journal of Fluid Mechanics (2005).

How to cite: Gilletta de Saint Joseph, A., Chauchat, J., Bonamy, C., and Robert, M.: Two-phase simulation of scour using a hybrid RANS-LES turbulence model, EGU General Assembly 2023, Vienna, Austria, 23–28 Apr 2023, EGU23-9781, https://doi.org/10.5194/egusphere-egu23-9781, 2023.

EGU23-10102 | Posters on site | HS9.3

Modeling sediment transport in vegetative areas with a two-phase flow approach 

Julia Mullarney, Rémi Chassagne, and Vinay Nelli

In vegetated areas, water flow and sediment transport are highly influenced by their interactions with vegetation. The induced vegetation drag force reduces the water flow velocity but increases the TKE (turbulent kinetic energy). Recent laboratory experiments of flow within array of rigid cylinders have shown that the fluid bed shear stress, and consequently the sediment transport rate, are correlated with the TKE instead of with the depth-average velocity.

In this context, modeling sediment transport in vegetated areas represents a major challenge for the prediction of the geomorphic evolution of coastlines. In this study, a three-phase flow model for sediment transport in vegetation is presented. The governing equations are obtained from a double averaging procedure: a spatial and turbulence (Favre) averaging. The model is based on the sedFOAM solver, in which the particle phase is represented as a continuum with constitutive laws based on the kinetic theory of granular flows and a turbulence model is required for the fluid phase. The vegetation is represented as a passive phase which interacts with the other phases through a drag force.

First, simulations without sediment are performed and compared with measurements from existing laboratory experiments. The model demonstrates a very good capacity to predict the fluid bed shear stress and the turbulence intensity. The model is also compared with new high-resolution field data (Cook’s beach, New-Zealand). Secondly, sediment transport simulations are performed and compared with laboratory experiments. The results of the model are used to analyze the physics of sediment transport within vegetative regions and to discuss the next necessary steps toward larger-scale modeling.

How to cite: Mullarney, J., Chassagne, R., and Nelli, V.: Modeling sediment transport in vegetative areas with a two-phase flow approach, EGU General Assembly 2023, Vienna, Austria, 23–28 Apr 2023, EGU23-10102, https://doi.org/10.5194/egusphere-egu23-10102, 2023.

EGU23-10815 | ECS | Orals | HS9.3

Study of morphodynamic change caused by wing dams at large spatio-temporal scale 

Gergely T. Török and Gary Parker

Low water depth can be a problem for navigation on large rivers. Since the last century, a frequently-used method of river regulation has been the installation of wing dams (wing dikes, spur dikes, groins). With their help, the riverbed narrowed during low water, which created a greater water depth and a higher water level. However, the narrowed flow also generated a higher bed shear stress, which, due to bed erosion, simultaneously increased the water depth and lowered the water level.

From a flood protection point of view, questions arise as to how wing dam fields change flood levels as a result of the bed change caused by such intervention. The complexity of the answer increases if we examine the problem not only in a cross-section (or short reach scale), but at long scale, as in the case of the Mississippi River, USA, where a system of wing dams hundreds of kilometers long was installed.

We analyzed the problem in two steps: we apply a 3D sediment transport model on a local scale, and the results are then upscaled and implemented in a 1D model to enable study of the problem at large spatio-temporal scale (hundreds of km, several centuries).

How to cite: Török, G. T. and Parker, G.: Study of morphodynamic change caused by wing dams at large spatio-temporal scale, EGU General Assembly 2023, Vienna, Austria, 23–28 Apr 2023, EGU23-10815, https://doi.org/10.5194/egusphere-egu23-10815, 2023.

EGU23-11215 | Posters on site | HS9.3

Particle-resolved simulations of antidune migration in supercritical flows 

Bernhard Vowinckel, Christoph Schwarzmeier, Christoph Rettinger, Samuel Kemmler, Jonas Plewinski, Franciso Núñez-González, Harald Köstler, and Ulrich Rüde

Antidunes are an important feature in the morphodynamics of streams over steep slopes. These bed forms are short-wave periodic disturbances that develop on the surface of loose granular beds in response to the interaction with supercritical and near-critical shallow, turbulent flows. They arise in fluvial, coastal, and submarine environments and are closely tied to the resulting flow resistance, turbulence, and sediment transport. Antidunes are the only type of bedform that can migrate upstream under the presence of a free surface. This seems counterintuitive and has caught strong interest in hydraulic research. However, up to date little is known about the migration mechanism in connection to turbulence, bed morphology, and sediment transport, because of the challenging supercritical flow conditions, often associated to low submergences. This is in part related to the inherent technical challenges to reproduce rapid flows over an erodible bed in laboratory flumes, as well as to the difficulties to perform non-intrusive measurements. Consequently, experimental data sets in published literature are scarce. Numerical simulations of supercritical flows above an erodible bed can therefore constitute a methodological alternative for the study of antidunes. Such simulations, however, need to properly reflect the interplay of the fluid phase, the sediment particles, and the gas phase above the free surface. In this work we propose to use particle-resolved direct numerical simulations (pr-DNS) in conjunction with a deformable fluid surface to simulate the formation and propagation of upstream migrating antidunes in supercritical flows with high fidelity. We aim to numerically reproduce the experimental campaign recently reported by Pascal et al. (2021), who managed to measure the propagation of upstream migrating antidunes with a high spatial and temporal resolution. For this, we combine the lattice Boltzmann method with the discrete element method to simulate the fluid–particle and particle–particle dynamics (Rettinger & Rüde, 2022) and extend it with a volume of fluid scheme (Schwarzmeier et al., 2023) to track the strongly deformable free fluid surface. The parameter choices of Pascal et al. (2021), with coarse sediment grains and low relative submergence of the particles, allow for a direct overlap of experimental conditions with pr-DNS. In this manner, our simulations successfully close the gap between river morphodynamics experiments and pr-DNS, to couple bedform and free-surface interactions with large-scale simulations consisting of a sediment bed comprising thousands of particles in unidirectional, supercritical turbulent flows.

Schwarzmeier, C., Holzer, M., Mitchell, T., Lehmann, M., Häusl, F. & Rüde, U. (2023). Comparison of free-surface and conservative Allen–Cahn phase-field lattice Boltzmann method. Journal of Computational Physics 473, 111753 .

Rettinger, C., & Rüde, U. (2022) An efficient four-way coupled lattice Boltzmann – discrete element method for fully resolved simulations of particle-laden flows. Journal of Computational Physics 453, 110942

Pascal, I., Ancey, C., & Bohorquez, P. (2021). The variability of antidune morphodynamics on steep slopes. Earth Surface Processes and Landforms, 46(9), 1750-1765.

How to cite: Vowinckel, B., Schwarzmeier, C., Rettinger, C., Kemmler, S., Plewinski, J., Núñez-González, F., Köstler, H., and Rüde, U.: Particle-resolved simulations of antidune migration in supercritical flows, EGU General Assembly 2023, Vienna, Austria, 23–28 Apr 2023, EGU23-11215, https://doi.org/10.5194/egusphere-egu23-11215, 2023.

Sediment transport is a fundamental process to understand river morphodynamics. Bedload sediment transport during high flow energy governs channel geometry, though with variable response to flood events. Therefore, the sensitivity of bedload sediment transport to flood events is an important geomorphic query. We analysed the bedload transport process during the extreme flood event in the Purna River, a partial-bedrock river in peninsular India. The Purna River originates from an elevation of ~900 m and drains ~18,450 km2 area. This major tributary of the Tapi River flows ~360 km. The flood events were characterised through flood frequency analysis using the Gumble distribution on peak discharge data from 1980-2016. The bedload sediment transport was assessed for the highest flood event using the Mayer-Peter Muller equation. Daily data of discharge, wetted area, wetted perimeter, grain size (D50) data of pre- and post-monsoon, and the cross-section was obtained from the Central Water Commission (CWC), India. The bed slope was analysed using Manning’s equation. Our analysis shows that the return period for the highest flood at upstream station (Gopalkheda) is 35 years, while it is 136 years for downstream station (Yerly). The average bed shear stress was ~1.04 and ~1.55 times more than the critical shear stress using D50 during the flood event for upstream and downstream reaches, respectively. The average bed shear stress exceeded the equal mobility condition (τeq≈1.45τc) in the downstream reach leading to full mobilisation. Therefore, it causes high bedload transport and scouring of bed level by more than 1 m in the downstream reach. However, at upstream reach, there was low bedload sediment transport and insignificant change in the bed level due to partial mobilisation. Also, the Maximum Flow Efficiency (MFE) at the downstream station is 6-7 times more than the upstream reach, representing high erosion in the downstream reach. Therefore, Purna River is characterised by reach-scale variability in the channel process to the same flood event. The downstream reach is more sensitive than the upstream reach and hence more prone to morphological change. These alterations have implications for designing hydraulic structures, water management, and river ecology.

How to cite: Bind, V. K. and Jain, V.: Bed level variation and channel sensitivity analysis of a river channel to the extreme flood event, EGU General Assembly 2023, Vienna, Austria, 23–28 Apr 2023, EGU23-11614, https://doi.org/10.5194/egusphere-egu23-11614, 2023.

EGU23-11987 | ECS | Posters on site | HS9.3

Ongoing development of a three-dimensional sedimenttransport model for local scour study 

Matthias Renaud, Julien Chauchat, Cyrille Bonamy, and Olivier Bertrand

Erosion due to scouring processes around hydraulic structures is a major topic in hydraulic engineering. Despite more than a century
of active research, its accurate prediction remains poor and its numerical modelling is still a major challenge for civil engineers.
Different studies have particularly identified scouring phenomenon as a major cause for bridge failures making its forecasting of
outermost importance to assess bridge safety and resiliency to extreme events. Numerical prediction of scour around an obstacle
requires the accurate simulation of the complex turbulent fluid flow in the vicinity of the structure as well as its interactions with
the surrounding sediment and the bed morphology. This involves a wide variety of processes such as bed-load transport, turbulent
suspension and gravity-driven avalanches. The classical morphodynamics models used in the industry, although adapted to study
sediment transport at large scales, often fail to accurately simulate the scour process as well as the flow around hydraulic structures.
A detailed comparison of the flow hydrodynamics around a wall-mounted cylinder using TELEMAC-3D and OpenFOAM will be
presented. Furthermore, scour processes concern a wide range of structures with complex geometries that geophysical numerical
models are not able to consider e.g. vertical non-emerging structures or structures with pressurized flows. Other models better
reproduce the local physical processes such as SedFoam, based on a two fluid approach where the sediment is modeled as a continuum.
Unfortunately, the computational cost of such a model remain to high for engineering purposes. Those considerations emphasize the
need for an intermediate-scale model, able to solve the different turbulent flow structures associated with scouring at an affordable cost.
The development of such a model is the main objective of the present study and as first step, idealized benchmarks on sedimentation,
turbulent suspension and dune migration will be presented. In the future, ongoing work using SedFoam will be used to develop new
closures, that will be tested in the present model, which will be made open source.
This thesis work is carried out within the framework of the Oxalia Hydraulics Chair of the Grenoble INP Foundation.

How to cite: Renaud, M., Chauchat, J., Bonamy, C., and Bertrand, O.: Ongoing development of a three-dimensional sedimenttransport model for local scour study, EGU General Assembly 2023, Vienna, Austria, 23–28 Apr 2023, EGU23-11987, https://doi.org/10.5194/egusphere-egu23-11987, 2023.

EGU23-13076 | Orals | HS9.3

Determination of runoff and sediment transport in an Alpine torrent in Austria 

Josef Schneider, Sebastian Gegenleithner, Stefanie Pessenteiner, Oliver Sass, and Wolfgang Schöner

Floods including sediment transport are a significant threat to  communities in Austria. With climate change impacting the Alps, it is crucial to enhance and reassess protective measures. Predictions for the future of the Alpine climate indicate that there will be more winter precipitation and stronger, convective rain in the summer, even if the temperature goals set by the  Paris Agreement are met.

However, analyzing the impact of increased extreme precipitation on flood events in small Alpine catchments remains a challenge, and knowledge of the subsequent impacts on sediment transport is still insufficient. The catchment area of the Schöttlbach and thus the town of Oberwölz (Murtal, Styria) were affected by extreme flood events with extreme sediment transport in both 2011 and 2017, which caused heavy damage. The region was therefore selected to work with local stakeholders (especially the Austrian Torrent and Avalanche Control authorities) to improve the process understanding of flood events and sediment transport in a torrent catchment area and to draw possible climate change scenarios for the future.

It was the aim of the project „RunSed-CC“ (i) to estimate future runoff and sediment transport in an Alpine catchment using the latest climate projections (ÖKS15), (ii) to consider them in the light of the associated model uncertainties, and (iii) the potential for extrapolating the results to other Alpine catchments to test.

One focus of the project was the collection of natural data using a wide variety of measurements in the catchment area of an alpine torrent.The project RunSed-CC developed further a model that connects rainfall and runoff to sediment transport. The  hydrological model WaSiM was used, in combination with data on the  evolution of sediment source areas, to drive the 2D numerical models Telemac-2D (hydrodynamics) & Sisyphe (sediment transport). The main focus of the project was to  understand the potential impacts of future climate change on the  hydrologic regime, changes in sediment dynamics and sediment yield, and  associated uncertainties in the model.

This article is intended to provide a brief outline of the results of the extensive project, with a focus on the final findings of the sediment balances at the outlet of the catchment area.


How to cite: Schneider, J., Gegenleithner, S., Pessenteiner, S., Sass, O., and Schöner, W.: Determination of runoff and sediment transport in an Alpine torrent in Austria, EGU General Assembly 2023, Vienna, Austria, 23–28 Apr 2023, EGU23-13076, https://doi.org/10.5194/egusphere-egu23-13076, 2023.

EGU23-13691 | ECS | Orals | HS9.3

The Effect of Spatial and Cross-Profile Data on Morphodynamic Modelling 

Jakob Siedersleben, Stefan Jocham, Robert Klar, and Markus Aufleger

Morphodynamic modelling relies on different types of riverbed surveys. Surveys are essential as the basis of the evaluation of temporal river bed development, mesh creation, and model calibration. Spatial data, for example, obtained by topo-bathymetric airborne laser scanning (ALB) or sonar surveys results in a dense point cloud, providing detailed information on the river bathymetry. However, data gaps can occur due to restrictions in data acquisition (e.g. high water turbidity or water depth for ALB, low water for boat-mounted sonar). In contrast, cross-profiles contain only limited information on the bathymetry strongly dependent on the cross-profile and point spacing.

To assess the effect of the two survey data types on river bed development and morphodynamic predictions, the temporal evolution of a river stretch in the upper Danube at Donauwörth was analysed. The study area contains homogeneous river sections and sections with complex river geometry due to scours, bridge foundations, and river mouths.  Spatial sonar and ALB surveys were conducted from 2013 to 2020 and give detailed documentation of the river bed development. Cross-profiles with a cross-profile spacing of 200 m were derived from the spatial data. The spatial and cross-profile datasets show continuous river bed erosion. However, in this case, cross-profile data overestimate the overall erosion compared to spatial data. The geometry of homogeneous river stretches is depicted very similarly in the two datasets. For cross-profile data two cases exist for reaches with more complex river bed geometry: (i) The geometry lies in between two cross-profiles and it is missed entirely. (ii) The geometry is covered by a cross-profile and the resulting geometry is smeared in between the cross-profiles due to the interpolation process. Both possibilities result in an unsatisfactory depiction of the riverbed geometry.

To analyse the effect of morphological developments two morphodynamic models based either on the spatial or cross-profile datasets were set up. The models were calibrated against the datasets from 2013 to 2020 by adjusting the Strickler value for river sections with a length of 200 m. The Strickler values differ over the entire river stretch and not only in sections where complex river bed geometry occurs, meaning that the calibration errors propagate through the entire study area. Consequently, the deviations in calibration outcomes affect the model predictions, which simulate 7 years. In this case, the general shape of the predicted riverbed is similar, but due to the overestimation of riverbed erosion by cross-profile data, the morphodynamic model overestimates the erosion compared to the spatial data. However, the obtained error is for river reaches with low local variability within an acceptable range. If a project demands a highly accurate depiction of the river bed and the river geometry is known for having complex features, the use of spatial data is strongly advised.

How to cite: Siedersleben, J., Jocham, S., Klar, R., and Aufleger, M.: The Effect of Spatial and Cross-Profile Data on Morphodynamic Modelling, EGU General Assembly 2023, Vienna, Austria, 23–28 Apr 2023, EGU23-13691, https://doi.org/10.5194/egusphere-egu23-13691, 2023.

EGU23-13887 | ECS | Orals | HS9.3

UAV-based monitoring of sedimentary processes at a large-scale revitalisation of an alpine river – concept and outlook 

Hannes Zöschg, Tobias Bacher, Max Boschi, Christine Fey, Johannes Schöber, Robert Reindl, Martin Schletterer, and Markus Aufleger

In the 19th and 20th centuries, numerous alpine rivers were modified into straightened and monotonous channels by river regulations, which had significant negative effects on the ecology of the river systems and their floodplains. River revitalisations aim to restore river sections in order to create stepping stones in anthropogenic altered rivers. A large-scale example are the measures along the alpine Inn River between Stams and Rietz in Tyrol (Austria) over a length of about 3 river kilometres, which are implemented within the extension project of the hydropower plant Sellrain-Silz. During two low-water periods (October - April), starting in 2021, the existing bank protections were removed to a large extent, the river bed was widened up to 75 meters and a back water zone as well as a branch were created. As a result, the river stretch can develop by its own dynamics and ecologically valuable areas such as shallow water zones as well as gravel and sand banks are supposed to be formed.

In order to assess the morphodynamics and ecological functionality of these measures, while also maintaining flood protection, a comprehensive monitoring program is being conducted. This includes nine photogrammetric surveys using an unmanned aerial vehicle (UAV) between March and October 2022. The UAV data were used to generate ortho-images and digital elevation models. The accuracy was assessed by comparison with airborne LiDAR data from one flight in March 2022. The objective is to quantify the erosion and deposition processes in the area of the measures and to determine the sedimentological processes that occurred during the survey period using the UAV results and hydro-morphological data (e.g., hydrograph, suspended sediment concentration) from nearby gauging stations on the Inn River. In addition, the suitability of high-resolution data from UAV surveys for monitoring sediment and bedload dynamics in alpine rivers will be evaluated. First results show that deposition processes dominated in the area of the measures, while relatively low discharge values were recorded throughout the study period. Based on the data analysis, we elaborate a suggestion for further monitoring in addition to the cross-section surveys already conducted since 1980, i.e., one UAV flight per year at low-flow conditions in order to establish a long term monitoring of morphodynamics.

How to cite: Zöschg, H., Bacher, T., Boschi, M., Fey, C., Schöber, J., Reindl, R., Schletterer, M., and Aufleger, M.: UAV-based monitoring of sedimentary processes at a large-scale revitalisation of an alpine river – concept and outlook, EGU General Assembly 2023, Vienna, Austria, 23–28 Apr 2023, EGU23-13887, https://doi.org/10.5194/egusphere-egu23-13887, 2023.

Suspended sediment transport is an integral part of river systems and provides important services for ecological functioning and human use of river channels. Thus, measuring and monitoring suspended sediment is of great importance to understand the implications of suspended sediment transport and to improve sustainable river management. Suspended sediment in the German waterways is monitored at 62 monitoring stations by the German Water and Shipping Authorities staring in the 1960ties. The dataset provides valuable information on the long-term developments of suspended sediment transport in Germany. After the analysis of suspended sediment rating (Hoffmann et al. 2020) and the long-term trend (Hoffmann et al. 2022) based on the extensive suspended sediment dataset, we present first results on the seasonal variation and the seasonal shifts of suspended sediment transport in Germany. The results indicate that river systems in Germany are characterized by strongly differential seasonal behavior despite modest spatial variations of climatic conditions in Germany. These results will be discussed in terms of seasonal shifts during the last 50 years and the expected changes of the sediment regimes in German river systems due to future climate changes.


References:

Hoffmann, T.O., Baulig, Y., Fischer, H., Blöthe, J., 2020. Scale breaks of suspended sediment rating in large rivers in Germany induced by organic matter. Earth Surface Dynamics, 8(3), 661-678.

Hoffmann, T.O., Baulig, Y., Vollmer, S., Blöthe, J., Fiener, P., 2022. Back to pristine levels: a meta-analysis of suspended sediment transport in large German river channels. Earth Surf. Dynam. Discuss., 2022, 1-28.

How to cite: Hoffmann, T.: Seasonal variability and seasonal shifts of suspended sediment transport in large German river system, EGU General Assembly 2023, Vienna, Austria, 23–28 Apr 2023, EGU23-14612, https://doi.org/10.5194/egusphere-egu23-14612, 2023.

For future strategies in water depth maintenance in the Port of Hamburg, determining the navigability limit (i.e. the nautical safe depth) is of major importance. For this purpose, a project "Nautical Depth" was set up at the Hamburg Port Authority (HPA), which is dedicated to dealing with this issue. The aim is to measure a nautical safe depth under various boundary conditions and to identify limits for a safe passage of high concentrated soil suspensions. Among other things within the project monitoring data of suspended sediment fluxes and data from multibeam echo-sounders and sub-bottom profilers were analysed and compared.

Therefore, the backscatter along the cross-section of a long-term H-ADCP monitoring station was analysed and calibrated with water samples and data of optical backscatter sensors. The standard monitoring frequency of the data is 1 minute. The data were aggregated and summarized as half-tide values and flood-tide, ebb-tide and the residual sediment fluxes were calculated. These data sets were compared with hydroacoustic measurements of the bathymetry, including sub-bottom profilers, in the harbour basin Köhlfleethafen nearby the cross-section of the H-ADCP monitoring station. In a defined and shaped area volumetric calculations, layer densities and the amount of sedimented dry matter of the bottom layer were analysed.

The presentation will give a closer look to the sampling, monitoring and interpretation of the data. The data sets of sediment fluxes derived by the H-ADCP will be compared with the data sets of the hydroacoustic measurements. The influence of dredging campaigns will be shown, and an interpretation of the data will be given. The investigations also show, that the soil properties and analysed data sets are dependent from local and regional boundary conditions, as flow velocity, grain size distribution and especially in Hamburg from the organic matters and nutrients within the suspended and the soil material. All data sets are used to optimize the maintenance strategies of the nautical bottom in the Köhlfleethafen area, especial regarding sediment conditions methods with bed levellers or water injection dredgers.

References:

Nino Ohle, Thomas Thies, Rolf Lüschow, and Ulrich Schmekel - Sediment sampling and soil properties of sediments in the Hamburg port and the river Elbe in comparison with hydro-acoustic measurements , Proceedings of the EGU2020-16468, https://doi.org/10.5194/egusphere-egu2020-16468

Ahmad Shakeel, Claire Chassagne, Jasper Bornholdt, Nino Ohle, and Alex Kirichek - From fundamentals to implementation of yield stress for nautical bottom: Case study of the Port of Hamburg, Ocean Engineering, Volume 266, Part 2, 2022, 112772, ISSN 0029-8018, https://doi.org/10.1016/j.oceaneng.2022.112772

How to cite: Ohle, N., Shaikh, S., Thies, T., Strotmann, T., and Schmekel, U.: Monitoring of suspended mater with H-ADCP devices and comparison with sedimentation rates and soil properties in the Köhlfleethafen harbour basin of the Hamburg port, EGU General Assembly 2023, Vienna, Austria, 23–28 Apr 2023, EGU23-14726, https://doi.org/10.5194/egusphere-egu23-14726, 2023.

EGU23-14867 | ECS | Posters virtual | HS9.3

Correlating flow field with river bank erosion opposite to an accreting bank: a large-eddy simulation approach 

Pratik Chakraborty, Daniel Valero, Andrés Vargas-Luna, Francesco Bregoli, and Alessandra Crosato

Bank erosion in riverine systems is one of the most complex, yet rampant, morphodynamic processes with significant implications for riparian activities and thereby the population. Therefore, it is an important aspect of the geomorphological evolution of a river reach that must be taken into consideration by river engineers while planning training, restoration or other engineering works of interest. Erosion of river banks are in essence a result of a combination of bank material entrainment by the river flow and mass failure.

In particular, it has been found that bank accretion on one river side could play an important role in triggering erosion of the opposite bank. Such bank accretion could be a result of a natural bar formation due to morphodynamic instability or even forced by an intervention, such as a groyne. To understand this process, we conducted a computational fluid dynamics (CFD) numerical study.  We set up a high-resolution 3D Large Eddy numerical model replicating data-rich experiments which have been previously conducted in a large flume with a mobile bed, where bank erosion has been observed opposite to a bar formation.

The CFD hydrodynamic model takes as input the boundary conditions and the high-resolution bed topography data which had been collected during the experiment at given time intervals. The hydrodynamic simulation runs until steady-state, thus provides the flow field at that given time of the experiment, i.e., for a particular bed topography configuration. Thereafter, the next time-instances, with an updated bed topography, are simulated similarly. This provids a set of flow-field data for each time instance. The evolution of the flow field can then be related to the evolution of the opposite bank erosion. Various flow field variables and parameters such as near-bank velocities and Q-criterion, were analysed so as to determine the process driving factors. Furthermore, the large eddy simulations allowed for the identification of coherent turbulent structures and their role in driving bank erosion. Results are here presented and discussed.

How to cite: Chakraborty, P., Valero, D., Vargas-Luna, A., Bregoli, F., and Crosato, A.: Correlating flow field with river bank erosion opposite to an accreting bank: a large-eddy simulation approach, EGU General Assembly 2023, Vienna, Austria, 23–28 Apr 2023, EGU23-14867, https://doi.org/10.5194/egusphere-egu23-14867, 2023.

EGU23-15323 | Posters virtual | HS9.3

Long-term (1953-2020) changes in morphology of Chikugo River, Japan in response to natural and anthropogenic forces 

Gubash Azhikodan, Pan Ei Phyu, and Katsuhide Yokoyama

The sediments transported by the rivers are the primary source of materials to the downstream estuaries and tidal flats. Hence, human activities and increased natural forcing (driven by climate change) can strongly influence the sediment supply by the rivers to the downstream. This can directly impact the existence of tidal flat areas, the rate of bank erosion, and the health of the aquatic ecosystem. A quantitative analysis of the changes in river morphology on a long-term basis is necessary to understand the current situation and develop management strategies. Therefore, this study aims to analyze the long-term (1953-2020) changes in the riverbed elevation of the Chikugo River, Japan. This 143 km long river has a macrotidal estuary downstream (0-23 km). The bathymetric data measured at 200 m intervals from the river mouth (0 km) to the upstream (64 km) for 68 years (1953-2020) was collected from the Japanese government. Further, topographic data in the upstream estuary (10.2-17 km from the river mouth) at 1 km intervals were surveyed for 17 years (2005-2021).

Based on the time of human activities and disasters occurrence, the study period was divided into three periods: (1) the period of human activities (1953-1998), (2) the period of no human activities and no disasters (1998-2003), and (3) period of disasters (2003-2020). During period-1, the riverbed of the whole river was lowered, with maximum degradation occurring between 20-30 km. This was caused by extensive human activities such as dredging for flood control and land reclamation and sand mining for commercial use. During period-2, the riverbed (23-64 km) became stable because the dredging was stopped. However, bed elevation in the estuary (0-23 km) increased by nearly 1 m due to tide-induced landward sediment transport. During period-3, extreme floods and landslide disasters supplied massive sediments into the Chikugo River, which was deposited between 30 to 64 km and increased the riverbed elevation. However, the riverbed between 23 to 30 km was almost stable and the bed elevation in the estuary was (6-23 km) decreased. It seemed that sediments supplied by disasters were trapped by a bed sill located at 28.7 km and were not enough to reach the estuary. Further, the extreme flood discharge was strong enough to erode the sediment deposited upstream of the estuary by the tidal forcing and transport back downstream. The erosion of existing deposits and lack of sediment supply from the upstream caused the decreased bed elevation of estuarine areas. According to the results, the river is redistributing and restoring the sediments supplied by disasters at the place of extracted sediments in the past, which has reached mid-stream currently and is expected to arrive at the estuary and downstream soon.

How to cite: Azhikodan, G., Phyu, P. E., and Yokoyama, K.: Long-term (1953-2020) changes in morphology of Chikugo River, Japan in response to natural and anthropogenic forces, EGU General Assembly 2023, Vienna, Austria, 23–28 Apr 2023, EGU23-15323, https://doi.org/10.5194/egusphere-egu23-15323, 2023.

EGU23-15527 | Posters virtual | HS9.3

Modelling Of Hydro-Geomorphological Processes Related To Sediment Transport: Case Study of the Baganza River (Italy) 

Usman Ali Khan, Renato Vacondio, Susanna Dazzi, Alessia Ferrari, and Roberto Valentino

The accuracy and reliability of sediment transport models is crucial for understanding and predicting geomorphological changes in river systems, which can have important implications for conserving riverine ecosystem. This information can be used to make better informed decisions about the management of the river, as well as to predict and prepare for potential hazards such as flash flooding. In the past, various approaches have been used to model these processes for suspended and bedload sediment transport. However, many of these models have limitations including spatial and temporal scales, data requirements, model complexity, numerical stability and computational cost, particularly when it comes to simulating the transport of bedload sediments.

In this study, we tried to address these limitations by testing a 2D weakly coupled numerical model for bedload transport in a real application. The model was implemented by adopting schemes presented in previous works (Vacondio et al. 2014, doi.org/10.1016/j.envsoft.2014.02.003; Juez et al. 2014, doi.org/10.1016/j.advwatres.2014.05.014). The advantage of using a weakly coupled model is that it is flexible, computationally efficient and can be used to simulate bedload transport in large-scale systems while producing consistent and reliable results over time. It is based on the finite-volume method and uses the Shallow water and Exner equations for the liquid and solid phases, respectively. High computational efficiency is guaranteed by parallelization on Graphics Processing Units.

We selected the case study of the Baganza River (Italy), characterized by a catchment area of 228 km2 and a total length of 55 km. We focused on the 28 km-long stretch between Calestano and Parma, with an average slope in the order of 0.8-1.5% and grain sizes in the order of 2-30 mm. For the topography, we used high-resolution digital elevation model (DEM) from 2008, while grain size distribution data were obtained through a hybrid technique combining field sediment sampling and photogrammetry. The adopted approach for the characterization of fluvial sediments at different points along the river is desirable in order to accommodate the full range of particle sizes inside the riverbed. The inflow boundary condition is the 2008-2014 series of floods on the Baganza River, including a destructive flood that occurred in October 2014.The riverbed topography resulting from the numerical simulation was compared with the one extracted from the DEM provided by a LiDAR survey carried out after the October 2014 event. The overall fair agreement between measured and simulated results suggests the usefulness of 2D weakly coupled numerical model for simulating hydro-geomorphological processes in the Baganza River. Moreover, the hybrid technique adopted for the grain characterization provides realistic representation of the sediments and increases the accuracy and reliability of the model predictions.

How to cite: Khan, U. A., Vacondio, R., Dazzi, S., Ferrari, A., and Valentino, R.: Modelling Of Hydro-Geomorphological Processes Related To Sediment Transport: Case Study of the Baganza River (Italy), EGU General Assembly 2023, Vienna, Austria, 23–28 Apr 2023, EGU23-15527, https://doi.org/10.5194/egusphere-egu23-15527, 2023.

EGU23-16014 | ECS | Posters on site | HS9.3

Impact assessment of river regulations of the past century using 1D morphodynamic modeling on the Upper Hungarian Danube 

Emese Nyiri, Gergely Tihamér Török, and Sándor Baranya

Significant river regulation activities have been carried out on the Upper Hungarian Danube since the end of the 19th century. First, a main channel was created in the natural braided channel to improve the navigational conditions. Later, already in the 20th century, in order to facilitate the erosion of larger deposits, groin fields (wing dam system) were installed helping navigation and flood drainage. Finally, at the end of the 20th century, the Gabcikovo dam was built (10 km upstream from the Slovakian-Hungarian border section), which caused a lack of sediment in the examined section due to sediment trapping. These were the most relevant measures, however, other activities, such as dredging, have also been implemented.

Due to the lack of past measurement data, it is impossible to accurately reconstruct the original morphodynamic state of the river. Even the contribution of individual measures to the morphodynamic processes is unclear. For example, what effect the modification of the braided channel system could have had on the high water levels. Or which intervention contributed to what extent to the significant drop in river bed level experienced in the last century.

In our study, we built a schematic 1D morphodynamic model, which approximates the dynamic equilibrium state based on the bankfull stage. The concept was to implement the morphodynamic effect of the individual interventions in the model. The validation confirmed that the 1D model concept is a promising manner for the qualitative examination of the impact of interventions on morphodynamic processes.

How to cite: Nyiri, E., Török, G. T., and Baranya, S.: Impact assessment of river regulations of the past century using 1D morphodynamic modeling on the Upper Hungarian Danube, EGU General Assembly 2023, Vienna, Austria, 23–28 Apr 2023, EGU23-16014, https://doi.org/10.5194/egusphere-egu23-16014, 2023.

EGU23-16035 | ECS | Orals | HS9.3

From multi-method monitoring towards numerical simulations of flood flow events in a proglacial outwash plain 

Clemens Hiller, Jakob Siedersleben, Sebastian Leistner, Thomas Wibmer, Kay Helfricht, and Stefan Achleitner

Shifting runoff dynamics and highly intensified geomorphic processes are immediate consequences of the evident glacier mass loss in high-alpine headwater catchments. Rapidly retreating glaciers expose unconsolidated sediments to erosion in the proximity of meltwater-fed mountain streams impacting the catchment-scale sediment dynamics. Altering sediment fluxes can have considerable implications for the operation and management of water infrastructure, especially hydro-electric power facilities in otherwise non-regulated glaciated catchments. Bedload-rich outwash plains with typical braided channel networks serve as a deposition area for glacier debris under average runoff conditions. During flood flow conditions, the proglacial areas connect with the downstream catchment, delivering subglacial sediments to lower stream sections.

As such, they represent key elements in high-alpine river systems when considering future discharge and sediment yield from deglaciating catchments. Establishing a numerical model of this important component of the headwater catchment illuminates a data scarce fluvial process domain. Yet, model parametrization and setting boundary conditions for a glacier forefield are challenging. Direct measurements in the paraglacial transition zone of retreating glaciers are usually complicated to achieve, especially since outwash plains are frequently subject to intensive geomorphic processes. Therefore, innovative methods, minimizing labour-intensive and time-consuming manual surveying, are needed to overcome data scarcity in paraglacial environments.

A combined methodological approach to parameterize key boundary conditions of an Alpine proglacial outwash plain (Jamtal valley, Austria) with an area of 0.035 km2 and an average channel inclination of 4.8 % is presented. Measuring discharge in situ is difficult since the braided riverbed is not stable due to frequent relocation of sediment. Therefore, close range sensing techniques based on RGB imagery from hand-held and fixed time-lapse cameras used in combination with maximum water level gauges are used directly in the outwash plain to monitor flood runoff events. A conventional discharge gauge (non-contact flow velocity and water level sensor) was realized 3 km further downstream covering the recent hydrologic summers (2019-2022). UAV-borne RGB imagery was used to detect changes in topography, sediment budget and composition.

We present results on key parameters, essential for numerical modelling of hydraulic flood flow conditions, including: (i) multi-annual high-resolution topographic 3-D models of the frequently changing channel geometry, (ii) hydraulic roughness of surface sediments derived from areal grain size distribution maps (i.e., D50, D84) and (iii) spatio-temporal flood flow maps indicating the annual variability in the surveyed proglacial outwash plain. These interrelated survey results are then used to parameterize and calibrate a 2-D numerical model (TELEMAC 2-D) to simulate hydraulic base and flood flow conditions, demonstrating the applicability and robustness of the presented multi-method approach.

How to cite: Hiller, C., Siedersleben, J., Leistner, S., Wibmer, T., Helfricht, K., and Achleitner, S.: From multi-method monitoring towards numerical simulations of flood flow events in a proglacial outwash plain, EGU General Assembly 2023, Vienna, Austria, 23–28 Apr 2023, EGU23-16035, https://doi.org/10.5194/egusphere-egu23-16035, 2023.

EGU23-16306 | ECS | Posters on site | HS9.3

Monitoring sediment transport by means of optic-acoustic system to optimize the operation of a hydropower plant 

Slaven Conevski, Paul Alberto Quintanilla, Siri Stokseth, Massimo Guerrero, and Nils Ruther

The Cheves hydroelectric power plant (HPP) is located in the Andes Mountains in Peru near Lima. The operation of the Statkraft asset is heavily influenced by sediment transport during the rainy season (February to June), both by bed load and suspended load. To avoid sediments from filling up the reservoir, sediment routing during rainy season is applied. However, during the routing, high water velocities through the gates are causing flab abrasion resulting in high maintenance costs. In addition, the water being transferred to the head race tunnel is of high sediment concentration and causes severe erosion of the turbine blades, resulting in low efficiency. This occurs despite desanders are operating continuously during rainy season.

To optimize the operation of the power plant, both during power production and during sediment routing, a sediment monitoring instrument was installed at four locations on the HP system. The positions were chosen to provide accurate information on sediment inflow to all major units of HP, such as the desilting units, reservoir, forebay, headrace tunnel, and turbine outlets. Both acoustic (e.g., 8 MHz, acoustic backscatter) and optical (e.g., optical backscatter) instruments will be installed to accurately estimate suspended sediment concentration (SSC). The AoBS, manufactured by Sequoia AS, provides both acoustic-optical measurements and a proprietary method for combining the measurements and determining the SSC in mg/l. To validate SSC, a pump sampler was installed at each location to sample once a day in dry season and twice a day in the wet season. The water samples were analyzed using both the typical filter method and the laser diffraction method.

The initial results (in the dry season) confirmed that the combination of optical and acoustic methods provided the most accurate results, although the Sequoia AS method appears to underestimate by 30-50%. Another method based on a weighted summation of both results is under development and promises better results for the existing data. Based on these results, four indicators have been developed: i) intensity of sediment inflow in the turbine, ii) coarseness of particles at all positions (optics vs acoustics scattering index), iii) sediment discharge, iv) desander performance (sediment input from the desanders). Further testing needs to be conducted in the wet season to validate the indicators as well as the method of combined acoustic-optical sediment data collection.

How to cite: Conevski, S., Quintanilla, P. A., Stokseth, S., Guerrero, M., and Ruther, N.: Monitoring sediment transport by means of optic-acoustic system to optimize the operation of a hydropower plant, EGU General Assembly 2023, Vienna, Austria, 23–28 Apr 2023, EGU23-16306, https://doi.org/10.5194/egusphere-egu23-16306, 2023.

EGU23-16388 | ECS | Posters on site | HS9.3

Ranking methodology and geochemical character of different waste materials of an epithermal mineralization from the Recsk Mining Area, Hungary 

Naji Alwani, Gyozo Jordan, Péter Szabó, and Geza Hitka

Mining activities inevitably generate contaminants in high quantities that can pose a risk at soil, water, biota and humans. This article describes a systematic method to understand the geochemical properties of various mine waste heaps and to investigate the waste material of a flotation mud and a waste rock heap coming from a high-sulphidation epithermal mineralization of the Recsk Mining Area, Hungary, and an application of a risk evaluation technique is presented.

Field sampling took place in the Recsk Mining Area on the H2 tailings heap and on the H7 waste rock heap where a total of 48 samples were collected. The geochemical properties of the waste material were assessed to shed light on the behavior of the potential toxic elements. The element concentration of the samples was determined by inductively coupled plasma mass spectrometry (ICP-MS) inductively coupled plasma optical emission spectrometry (ICP-OES) and ion chromatography. In addition, the mineral phases present were detected by X-ray diffraction (XRD). Ranking of potential toxic mining waste was calculated using two indicators: the index of contamination (IC) and the Hazard Average Quotient (HA) which was used to calculate the Toxicity Factor (TF). The mobility of each element was estimated using a simple formula followed by univariate and bivariate data analysis methods.

Results show that the potentially toxic elements are present in varying concentrations in the two studied wase heaps, even though they are originating from the same mineralization. They also behave differently on the studied waste heaps in terms of mineral composition. The calculated IC values were very high, exceeding the limits, and TF values were low for mining waste according to the legislative concentration pollution limits. A unique approach is needed for each type of waste heap in order to facilitate a successful remediation or secondary raw material extraction.

Keywords: mining waste; geochemistry; contamination, index of contamination, Hazard Average Quotient

How to cite: Alwani, N., Jordan, G., Szabó, P., and Hitka, G.: Ranking methodology and geochemical character of different waste materials of an epithermal mineralization from the Recsk Mining Area, Hungary, EGU General Assembly 2023, Vienna, Austria, 23–28 Apr 2023, EGU23-16388, https://doi.org/10.5194/egusphere-egu23-16388, 2023.

EGU23-17507 | Orals | HS9.3

Monitoring flocculation during a deep-sea mining test in the Clarion-Clipperton Zone, eastern equatorial Pacific Ocean 

Melanie Diaz, Henko Stigter, Benjamin Gillard, Iason-Zois Gazis, Jochen Mohrmann, Karl Heger, Matthias Baeye, Laurenz Thomsen, and Jens Greinert

Where fine-grained marine sediments are being brought in suspension and become subject to transport by currents, aggregation of cohesive primary particles (flocculation) can occur. By changing the inherent particle properties, flocculation processes play an important role in speeding up settling and redeposition of sediment particles. However, while numerous laboratory experiments have been conducted to understand properties and behavior of flocs, so far, there is not yet an appropriate method to monitor flocculation in-situ. Gaining a better understanding of the flocculation process and how it will affect the dispersion of man-made sediment plumes is important to assess the impact of human activities on the environment, for example in the context of deep-sea mining or offshore dredging.
In this study, the inherent acoustical and optical properties of sediment particles are studied using in-situ plume monitoring data collected by the MiningImpact2 project consortium during the first deep-sea mining trial of a pre-prototype polymetallic nodule collector vehicle. The trial was conducted in April 2021 at 4500 m water depth in the Clarion-Clipperton Zone (eastern equatorial Pacific Ocean) by the Belgian contractor DEME-GSR. During this trial, one of the main goals was to monitor the spatiotemporal evolution of the sediment plume generated by the mining vehicle. For this purpose, numerous sensors were deployed around the test area including ADCPs of different frequencies, OBSs and deep-sea particle camera. In this study, the main interest is to use this dataset to gain knowledge on the variability of particle properties and to monitor flocculation in the generated plume.
The monitoring array of sensors proved successful in measuring the dispersion of the plume around the mining site. In the data recorded in the plume, a gradient in optical and acoustic response was found, suggesting a change in inherent particle properties such as their size and shape induced by flocculation. The evolution of particle size as inferred by the particle camera recordings (PartiCam) corroborated this finding. In combination with currents and environmental measurements, this dataset provided valuable information to better understand the flocculation process.

How to cite: Diaz, M., Stigter, H., Gillard, B., Gazis, I.-Z., Mohrmann, J., Heger, K., Baeye, M., Thomsen, L., and Greinert, J.: Monitoring flocculation during a deep-sea mining test in the Clarion-Clipperton Zone, eastern equatorial Pacific Ocean, EGU General Assembly 2023, Vienna, Austria, 23–28 Apr 2023, EGU23-17507, https://doi.org/10.5194/egusphere-egu23-17507, 2023.

HS10 – Ecohydrology, wetlands and estuaries: aquatic and terrestrial processes and interlinkages

Recent consecutive drought years have led to multiple negative impacts on water-related ecosystem services in many parts of the world; these include reduced crop yields, increased tree mortality, persistent soil moisture deficits, lower groundwater levels and stream flow becoming more intermittent. Continuing negative rainfall anomalies, coupled with climate change projections of increased drought severity and frequency, drive an urgent need to increase resilience and integration in land and water management strategies. However, complex interactions between land cover change, hydrological  partitioning and water availability are difficult to quantify, especially at different temporal and spatial scales. Process-based ecohydrological modeling, particularly when calibrated with multiple data streams, is a powerful tool for estimating water partitioning and assessing the impact of alternative land management strategies on catchment water resources. We employed the spatially-distributed and tracer-aided ecohydrological model, EcH2O-iso, to quantify the effects of current and potential future land use scenarios on ecohydrological water flux partitioning and water ages in a 66 km2 drought-sensitive catchment in the North European Plain, Germany. The model was calibrated using hydrometric, ecohydrological and isotopic data at daily time steps for a period of 13 years (Jan 2007 –  Dec 2019). In conjunction with local stakeholders, we developed plausible, alternative land-use scenarios (including forest diversification and agroforestry schemes) based on the existing four primary land-use types (i.e., broad-leaved forests, conifer forests, arable agriculture and pasture) to evaluate spatial and temporal changes to water flux partitioning and water ages. This sought to identify the most drought-resilient land management plan especially in the context of  increased drought frequency and severity. The results showed that replacing conifer forests with uneven-aged mixed forests with younger broad-leaved trees had the most positive impacts in terms of reducing total evapotranspiration and increasing groundwater recharge in the catchment. The mixed-forest management alternatives also significantly reduced groundwater ages and subsurface water turnover times. This indicates that under this management soil moisture and groundwater stores will recover more quickly from drought than under existing land management. This study demonstrates an ecohydrological modelling approach that provides importance science-based evidence for policy makers allowing quantitative assessment of the impact of different land-use types on water partitioning and water availability. Other current work is coupling the tracer-aided ecohydrological model with a nitrate model for future assessment of biogeochemical processes.

Keywords: ecohydrological modeling; drought-sensitive area; water partitioning; water age

How to cite: Luo, S., Tetzlaff, D., Smith, A., and Soulsby, C.: Using tracer-aided ecohydrological models to assess the impact of alternative land use strategies on optimizing water availability in drought-sensitive catchments, EGU General Assembly 2023, Vienna, Austria, 23–28 Apr 2023, EGU23-108, https://doi.org/10.5194/egusphere-egu23-108, 2023.

EGU23-340 | ECS | Posters virtual | HS10.1

Characterization of ecohydrological indicators (EHIs) in India: a multi-scale perspective 

Vijaykumar Bejagam and Ashutosh Sharma

The biogeochemical source and sink dynamics of terrestrial ecosystems play an important role in balance of carbon in the atmosphere. These biogeochemical processes such as carbon, water and energy cycles were affected by climate change and hydroclimatic disturbances. Hence, it is essential to understand the spatiotemporal variations and drivers of different ecohydrological indicators (EHIs) which links the carbon, water and energy cycles. This study assesses the three EHIs, namely water use efficiency (WUEe), rain use efficiency (RUEe), and light use efficiency (LUEe), as well as their drives based on Net Primary Productivity (NPP) in India from 2002 to 2017 at river basin, climatic zone, and land cover scales. All the three EHIs were found to be higher in forest ecosystems which are high productive regions. The mean annual WUEe and RUEe showed a slightly decreasing trend, and the mean annual LUEe experienced a slightly increasing trend. The ecosystem-based study shown that WUEe and LUEe in semi-arid zones and shrubland ecosystems experienced a positive trend. A similar trend was observed in RUEe for arid and shrubland ecosystems. The drivers investigated includes 11variables, CO2 concentrations, evapotranspiration (ET), humidity, leaf area index (LAI), normalized difference vegetation index (NDVI), precipitation (PRECIP), soil moisture (SM), solar radiation (SR), temperature (TEMP), vapor pressure deficit (VPD), and wind speed (WS). TEMP and SR were found to be more sensitive drivers of EHIs. Other drivers such as VOD, SM and humidity also played a significant role in local scales. This study will enhance our understanding of variations in EHIs and their mechanisms which can be a reference in predicting the ecosystem responses and resilience to changing climate and climate extremes.

How to cite: Bejagam, V. and Sharma, A.: Characterization of ecohydrological indicators (EHIs) in India: a multi-scale perspective, EGU General Assembly 2023, Vienna, Austria, 23–28 Apr 2023, EGU23-340, https://doi.org/10.5194/egusphere-egu23-340, 2023.

EGU23-1170 | Orals | HS10.1

Synchronous detection of vegetation structures in semi-terrestrial areas of the Rhine via unmanned surface vehicles and unmanned aerial vehicles and its benefits for river management 

Benjamin Eberhardt, Maike Heuner, Thomas Gattung, Magnus Hoffmann, Issa Hansen, Beat Lüthi, Julian Teege, Enrico Neumann, Ralf Becker, and Jörg Blankenbach

Maintenance of waterways is often a challenging task with conflicting interests between different parties. They are subject to economical stresses through the industry and transportation sector on the one hand, on the other the European Water Framework Directive dictates to ensure (or lead them back to) a chemically and ecologically “good status” (which benefits the balance between regulating, supporting, providing and cultural ecosystem services).

To have a good decision base for ecological measures, local-scale high resolution temporal and spatial data is needed to make sound decisions for a sustainable river management, which extends to assess and monitor the succession of restoration areas and to document change.

The objective of the project RiverCloud is the development of a data acquisition platform which enables synchronous data collection with unmanned aerial vehicles (UAV) and unmanned surface vehicles (USV). On the base of this platform different sensors can be used for a holistic data base in semiterrestrial areas of streams: e.g. acoustic doppler current profilers, multi-parameter sensors, multibeam-echosounders and a 360° camera for the USV; Sensors on the UAV consist of a bathymetric range finder and an industrial grade camera for structure from motion application to derive high-resolution point clouds and orthomosaics.

Building upon this data base, a further objective is the detection of vegetation structures such as a canopy height, single trees and the balancing of aboveground biomass, as a regulating ecosystem service for carbon sequestration, from high-resolution point clouds by using open source software. The results from remote sensing data are tested against comparative data collected in the field. Workflow, results and benefits for river management will be presented. All data was collected in September 2022 along the river Rhine near Karlsruhe, Germany.

How to cite: Eberhardt, B., Heuner, M., Gattung, T., Hoffmann, M., Hansen, I., Lüthi, B., Teege, J., Neumann, E., Becker, R., and Blankenbach, J.: Synchronous detection of vegetation structures in semi-terrestrial areas of the Rhine via unmanned surface vehicles and unmanned aerial vehicles and its benefits for river management, EGU General Assembly 2023, Vienna, Austria, 23–28 Apr 2023, EGU23-1170, https://doi.org/10.5194/egusphere-egu23-1170, 2023.

EGU23-1548 | ECS | Orals | HS10.1 | Highlight

How does ecosystem adaptation to a changing climate affect catchment Transit Times Distributions 

Siyuan Wang, Markus Hrachowitz, and Gerrit Schoups

Climate change can considerably control the catchment-scale root zone storage capacity (Sumax) which is a critical factor affecting the moisture exchange between land and atmosphere, hydrological response, and biogeochemical processes in terrestrial hydrological systems. However, direct quantification of the changes of Sumax over long time periods at the catchment-scalehas so far been rare. This is mostly a result that it is difficult to quantify the effect of climate change on parameters of terrestrial hydrological models, which in turn contributes to considerable uncertainties in predictions of the hydrological response under changing climatic conditions. As a consequence, it remains unclear how climate change affects Sumax (e.g., precipitation regime, canopy water demand) and how changes in Sumax may affect partitioning of water fluxes and as a consequence, as well as catchment-scale physical transport of water quality, described by transit and resident time distributions.

The objectives of this study in the upper Neckar river basin in Germany are therefore to provide an analysis of why changes in Sumax can be observed as a result of changing climatic conditions over the past 7 decades and how this further affects hydrological and transport dynamics. More specifically, we test the hypotheses that (1) the changes in water fluxes and storage dynamics over that a 70-year period can be attributed to adaptations of the root zone storage capacity resulting from the changing climate (e.g., precipitation frequency or wetness condition), which affects (2) the shape of travel time distributions and young water fractions, in particular for evaporation fluxes, which are most affected by the climate-induced change Sumax over different periods.The analysis is carried out based on long-term hydrological (1953-2022) and radioactive isotope data (1961-2018), using a distributed hydrological model coupled with StorAge Selection (SAS) functions, which is simultaneously modelling streamflow and tracer dynamics and provides estimates of transit time distributions of different water fluxes and of resident time distributions in different storage components.

How to cite: Wang, S., Hrachowitz, M., and Schoups, G.: How does ecosystem adaptation to a changing climate affect catchment Transit Times Distributions, EGU General Assembly 2023, Vienna, Austria, 23–28 Apr 2023, EGU23-1548, https://doi.org/10.5194/egusphere-egu23-1548, 2023.

EGU23-1618 | ECS | Orals | HS10.1

Examining the role of groundwater in the spatio-temporal variation of Ecosystem Water Use Efficiency in India 

Akriti Singh, Vijaykumar Bejagam, and Ashutosh Sharma

Ecosystem Water Use Efficiency (WUEe) is an ecohydrological indicator that shows the strength of coupling between the carbon cycle and water cycle, and it is calculated as the net carbon gain (estimated as Net Primary Productivity, NPP) per unit of water consumed by ecosystems (estimated as Evapotranspiration, ET). The carbon and water cycles, as well as the WUEe is influenced by groundwater (GW) as it is one of the sources for supplying moisture to the terrestrial ecosystem. Various factors like meteorological factors (precipitation, temperature, aridity), vegetation types, irrigation, etc. affect the interaction between GW and WUEe. Thus, the influence of GW on the dynamics of WUEe varies spatially and temporally. In this study, remote sensing-based datasets of NPP, ET and Potential ET (PET) along with precipitation data from India Meteorological Department (IMD) and the mean annual water table depth (WTD) values taken from the equilibrium WTD model of Eurasia were utilized to analyze the response of WUEe to GW fluctuations at yearly temporal scale across India. The concept of climatic elasticity of NPP (εNPP), ET (εET) and WUEeWUE), which is calculated as the ratio of normalised WUEe (or NPP and ET) to Aridity Index (AI) was used to quantify the effect of climate change on the terrestrial ecosystem’s productivity. Our results showed that in general, WUEe fluxes, i.e., NPP and ET, were higher in the regions having lower WTD, such as Western Ghats and north-eastern areas. Further, we examined the responses of vegetations to climatic changes at different WTD, and the effect of irrigation on WUEe and its fluxes were studied. In general, the interactions between WTD and WUEe (and its fluxes) were stronger in the irrigated croplands. Shrublands in arid regions of India (i.e., north-western states of India) were found to be more sensitive to aridity as compared to the wet and humid regions dominated by forests and croplands type of land cover. This study gives an insight into the interaction between the ecological performance of terrestrial ecosystem and groundwater, which will support reasonable land use and groundwater management over the entire country of India.

How to cite: Singh, A., Bejagam, V., and Sharma, A.: Examining the role of groundwater in the spatio-temporal variation of Ecosystem Water Use Efficiency in India, EGU General Assembly 2023, Vienna, Austria, 23–28 Apr 2023, EGU23-1618, https://doi.org/10.5194/egusphere-egu23-1618, 2023.

The past decades have witnessed an increase in dissolved organic carbon (DOC) concentrations in the catchments of the Northern Hemisphere. Increasing terrestrial productivity and changing hydrology may be reasons for the increases in DOC concentration. The aim of this study is to investigate the impacts of increased terrestrial productivity and changed hydrology following climate change on DOC concentrations. We tested and quantified the effects of gross primary production (GPP), ecosystem respiration (RE) and discharge on DOC concentrations in boreal catchments over 3 years. As catchment characteristics can regulate the extent of rising DOC concentrations caused by the regional or global environmental changes, we selected 
four catchments with different sizes (small, medium and large) and landscapes (forest, mire and forest- mire mixed). We applied multiple models: Wavelet coherence analysis detected the delay-effects of terrestrial productivity and discharge on aquatic DOC variations of boreal catchments; thereafter, the distributed- lag linear models quantified the contributions of each factor on DOC variations. Our results showed that the combined impacts of terrestrial productivity and discharge explained 62% of aquatic DOC variations on average across all sites, whereas discharge, gross primary production (GPP) and RE accounted for 26%, 22% and 3%, respectively. The impact of GPP and discharge on DOC changes was directly related to catchment size: GPP dominated DOC fluctuations in small catchments (<1 km2), whereas discharge controlled DOC variations in big catchments (>1 km2). The direction of the relation between GPP and discharge on DOC varied. Increasing RE always made a positive contribution to DOC concentration. This study reveals that climate change-induced terrestrial greening and shifting hydrology change the DOC export from terrestrial to aquatic ecosystems. The work improves our mechanistic understanding of surface water DOC regulation in boreal catchments and confirms the importance of DOC fluxes in regulating ecosystem C budgets.

How to cite: Zhu, X. and Berninger, F.: The role of terrestrial productivity and hydrology in regulating aquatic dissolved organic carbon concentrations in boreal catchments, EGU General Assembly 2023, Vienna, Austria, 23–28 Apr 2023, EGU23-2062, https://doi.org/10.5194/egusphere-egu23-2062, 2023.

EGU23-3831 | ECS | Orals | HS10.1

Wetlandscape hydrology and ecosystem services 

Imenne Åhlén, Peter Hambäck, Josefin Thorslund, Andrew Frampton, Georgia Destouni, and Jerker Jarsjö

Wetlands are increasingly considered as nature based solution as they provide valuable services and functions to the society and environment, such as water quality improvement and biodiversity support. However, while land use and climate change have been affecting the functions and service of these ecosystems, it has become important to study the large-scale behaviour of wetlands in the landscape. Consequently, previous studies have suggested studying wetlands within wetlandscapes, defined as catchments containing networks of several wetlands, in order to understand large-scale functions of wetlands and their response to land-use and climate changes. This emphasizes the ecohydrological interactions of wetlands rather than having focus of individual wetlands. As the concept of wetlandscape is new, we have been working on systematically quantifying its governing properties in two different studies.

In the first study, we systematically quantified ecohydrological properties of individual wetlands (e.g. wetland area, wetland catchment area and wetland type) in multiple wetlandscapes that may impact biodiversity and modulate nutrient flows as well as characteristics of the whole wetlandscape in terms of their large-scale processes and functions. Results from this work showed that large wetlandscapes generally contained features to support different ecosystem services compare to smaller wetlandscapes. More specifically, results indicated that small wetlandscapes have a poor ability to route water through their wetlands which was in contrast to large wetlandscapes. This implies that large wetlandscapes have a higher potential for large-scale retention of nutrients and contaminants.

The second study consisted of investigating spatial and temporal wetland storage dynamics for multiple wetlands in the landscape in order to address considerable knowledge gaps regarding hydrological functions of wetlands and wetlandscapes. More specifically, we use high-resolution monitoring of wetland water levels to assess storage patterns and inundation conditions. A key finding of this work is that the position of wetlands is important for storage dynamics and flood buffering. Notably we find that wetlands located in headwater regions showed larger water level variability during the growing season (spring, summer and autumn) and hence were more active in temporal water storage than wetlands located downstream in the wetlandscape. This variability in water level for headwater wetlands was also associated with complex and patchy inundation conditions, while downstream wetlands essentially showed dry-state conditions during the entire summer.

Results from both studies show that ecohydrological properties of wetlandscapes can have implications for ecosystem service delivery (e.g., biodiversity support and water quality) at regional level as well as for using wetlands as nature-based solution. Present results also support the importance of wetlandscape studies and the priority of a wetlandscape focus in future management programs to various regional environmental challenges.

How to cite: Åhlén, I., Hambäck, P., Thorslund, J., Frampton, A., Destouni, G., and Jarsjö, J.: Wetlandscape hydrology and ecosystem services, EGU General Assembly 2023, Vienna, Austria, 23–28 Apr 2023, EGU23-3831, https://doi.org/10.5194/egusphere-egu23-3831, 2023.

The understanding of soil hydrological processes in agroforestry systems has increased in recent years. However, key aspects determining the successful functionality of agroecosystems (e.g. plant-water availability, nutrient supply) are influenced by many factors and are therefore challenging to generalize. Such information is critical for management and planning strategies. If dominant processes such as evapotranspiration and the related controls on the soil water stock can be represented adequately in hydrological models at the plot scale, they can provide useful insights for practitioners.

Here, we tested whether the physically-based CATFLOW model is capable of reproducing soil moisture dynamics in a South African agroforestry system consisting of windbreaks and irrigated blackberry plants. We initialised the model with matric potential measurements and calibrated it to soil moisture dynamics at two locations with differing vegetation within the test site. After successful calibration, several numerical experiments were performed to shed light on the presence and absence of windbreaks and of different irrigation strategies on the seasonal dynamics of plant available soil water at the test site. The model and observations were also compared in the frequency domain by using empirical mode decomposition as an additional model verification.

The measured soil moisture time series are dominated by a gradual drying of the soil throughout the summer, which is less pronounced in the deeper soil ranges, while several rain events interrupted this general pattern. The model captured the drying as well as the amplitudes of the rain peaks well. However, there was an offset between measured and modelled absolute values due to the initiation based on matric potential. The simulated water balance revealed distinct differences between the windbreak and berry rows due to differences in rain interception, and evapotranspiration or irrigation patterns. Similarities in the frequency spectrum of observed and modelled values were apparent. On the other hand, the modelled time series showed more distinct spectra and less noise. Currently, more detailed analyses are being carried out to extract information from the frequency spectra.

How to cite: Hoffmeister, S. and Zehe, E.: Modelling soil moisture dynamics of an irrigated agroforestry windbreak system in South Africa, EGU General Assembly 2023, Vienna, Austria, 23–28 Apr 2023, EGU23-3847, https://doi.org/10.5194/egusphere-egu23-3847, 2023.

EGU23-3861 | ECS | Posters virtual | HS10.1

Changes of vegetation and hydrological dynamics in warming climate in a mountainous watershed 

Richao Huang, Xi Chen, Qi Hu, and Shanshan Jiang

The dynamic global vegetation model LPJ-WHyMe is improved and used, after calibration, to study vegetation and water cycle in a mountainous watershed in the Qilian Mountains in western China and their responses to the warming climate in recent decades. Major results show uphill expansion of all vegetations following the accelerated warming and moistening of the CO2-enriched climate since 1979. Associated with these habitat shifts are the changes of the water use efficiency (WUE) of these plants. Herbaceous plants have shown improved WUE with a peak at elevations 3500-4000 m asl, marked by greater increase of net primary production (NPP) than water use in the elevated warming. However, boreal needleleaf evergreen forest (BNE) show a slight decrease of WUE, though minor in higher elevations. These WUE changes of the vegetation along with increased warming and moistening in the high elevations (>3500 m asl) have redefined the water resources availability of the mountainous watershed. The increased WUE by herbaceous plants below 4000 m asl leaves more snowmelt water and precipitation for runoff, R. This addition of runoff is offset however by the increased surface evaporation and plant transpiration in higher elevations attributed to increased coverage of plants and warmer temperature. This near balance between the opposite effects on R from changes of herbaceous plants is brought to a net reduction of R by the decreased WUE of BNE plants and their expansion in altitude. These changes explain the reduction of total R yield in the study basin observed in the recent decades.

How to cite: Huang, R., Chen, X., Hu, Q., and Jiang, S.: Changes of vegetation and hydrological dynamics in warming climate in a mountainous watershed, EGU General Assembly 2023, Vienna, Austria, 23–28 Apr 2023, EGU23-3861, https://doi.org/10.5194/egusphere-egu23-3861, 2023.

EGU23-4727 | ECS | Orals | HS10.1

Attribution of Eco-hydrological changes based on coupled SWAT-ML method 

Qianzuo Zhao, Xuan Zhang, and Chong Li

Vegetation is an important part of terrestrial ecosystem, and the vegetation growth condition is closely related to hydro-meteorological elements. Accurate simulation of ecohydrological elements is an important guarantee to maintain the security of ecosystem. Building physical models based on mechanistic processes such as the Soil and Water Assessment Tool (SWAT) is a solid way to understand the ecohydrological processes, but the simulation of vegetation growth is not accurate enough to interpret the entire complexity of ecohydrological processes. Data-driven machine learning models can efficiently and accurately identify the relationship between vegetation and hydrometeorological elements. Coupling distributed hydrological models and machine learning models is beneficial to improve the ecohydrological simulation accuracy, and to provide support for maintaining ecosystem security.

A watershed ecohydrological simulation framework was constructed by coupling SWAT and six machine learning methods in the headwater basin of the Yangtze River, called Jinsha River basin, China. Firstly, we established a SWAT model to get the temporal and spatial patter of hydro-meteorological factors including soil moisture, runoff, evapotranspiration, temperature and precipitation in the watershed by using meteorological factors from the gauging stations. Then Pearson correlation coefficients was utilized to identify factors that are more relevant to vegetation growth based on the lagged response of vegetation changes to hydro-meteorological factors. We also applied machine learning models to construct the regression relationship between climatical factors and two indicators reflecting vegetation growth, which are normalized difference vegetation Index (NDVI) and solar-induced chlorophyll fluorescence (SIF), achieving the prediction of vegetation growth status. Based on this framework, the ecohydrological elements data series from 1965-2014 were completed in the monitoring data sparse area to conduct a long time series and sequential analysis. Finally, trend analysis and partial correlation analysis were used to explore the variation characteristics of ecohydrological elements and their relationships with climate factors.

The results show that (1) the SWAT model can simulate the runoff process well of the whole Jinsha River basin (R2>0.84, NS >0.68), and the machine learning model can well estimate the SIF of the whole Jinsha River basin (NS>0.98, MSE<0.0003) and NDVI (NS=0.98, MSE=0.0005) in the upstream. (2) The vegetation type in the middle and downstream of the Jinsha River is mainly woodland, and the NDVI index has oversaturation phenomenon, so machine learnings can produce large biases, while the SIF data do not have such phenomenon, which is a better indicator to characterize the vegetation growth. (3) The trends and drivers of ecohydrological elements have obvious regional, and seasonal differences, and in general, temperature is the main driver of vegetation and precipitation is the main driver of runoff. This research built a new method to simulate ecohydrological processes in a spatio-temporal continuum, providing a strong support for ecohydrological evolution analysis.

How to cite: Zhao, Q., Zhang, X., and Li, C.: Attribution of Eco-hydrological changes based on coupled SWAT-ML method, EGU General Assembly 2023, Vienna, Austria, 23–28 Apr 2023, EGU23-4727, https://doi.org/10.5194/egusphere-egu23-4727, 2023.

Soil-plant-water monitoring allows stakeholders to obtain rapid information on plant stress caused by water or nutrient deficiencies. The main objective of the study was to investigate soil-plant-water interactions based on field measurements of plant reflectance and soil water content (SWC) under different land use types and inter-row managed vineyards. Four main study sites were investigated during the vegetation period: forest, grassland, cropland (sunflower), and vineyard. Three different soil management applications were studied in the vineyard: tilled (T), cover crops (CC), and grass (NT) inter-rows. SWCs were also measured within the row and between rows of vines to get a more complete picture of the hydrology of the sites. At each study site, we had several measurement points along a slope section, where each slope is prone to erosion. For continuous hydrological monitoring soil water and temperature sensors were placed 15 and 40cm below the ground at the top and bottom of the slopes. Normalized Difference Vegetation Index (NDVI) and Photochemical Reflectance Index (PRI) sensors were used to measure leaf reflectance. All sites included a set of hemispherical sensor sets. Topsoil SWC, leaf NDVI and chlorophyll concentrations, and Leaf Area Index (LAI) were measured every two weeks using hand-held instruments.

Among the four land use types, the lowest SWC and soil temperature of the upper 20cm was observed in the forest, and the highest in the cropland. The in-row average topsoil SWCs and temperatures were lower in all study sites compared to the values measured in between rows. The lowest chlorophyll and NDVI values were observed in grassland, which also showed the highest drought stress. The grassed inter-row grapevines had significantly lower leaf chlorophyll contents than the other inter-row managed sites (p<0.001). The highest leaf chlorophyll contents were observed in the forest samples (17.14CCI) and the tilled vineyard (16.89CCI). Based on slope positions, the most distinguishable difference was observed for the CC vineyard plants, 17.6% higher values were observed at the top of the slope compared to the leaves at the bottom of the slope (p<0.01). The leaf NDVI values were not influenced by slope positions for the vineyard, cropland, or forest. However, significantly higher chlorophyll and NDVI values were noted for the grassland lower points than the upper. The most distinguishable differences between lower and upper slope positions’ SWC values were observed for the tilled vineyard slope, 59.4% and 35.0% higher overall SWC were measured for the in-row and between-row, respectively. Overall LAI values were the highest for the forest and the lowest for the grassland, where slope position did not affect plant leaf areas significantly. The steadily decreasing annual precipitation amount (from 740mm to 422mm between 2016 and 2022) makes the area more vulnerable to climate change and highlights the need for future work on the applications of water retention measures.

How to cite: Horel, Á., Bakacsi, Z., Zagyva, I., and Zsigmond, T.: Hydrological and plant growth changes in a small agricultural catchment: effects of inter-row soil management and land use types, EGU General Assembly 2023, Vienna, Austria, 23–28 Apr 2023, EGU23-5540, https://doi.org/10.5194/egusphere-egu23-5540, 2023.

EGU23-5773 | ECS | Orals | HS10.1

Urban groundwater fauna - natural or anthropogenically influenced? 

Fabien Koch, Kathrin Menberg, Svenja Schweikert, Jessica Hengel, Cornelia Spengler, Hans Jürgen Hahn, and Philipp Blum

Climate change and anthropogenic activities cause multiple changes in groundwater systems. Particularly, these processes lead to an increase in groundwater temperature under densely populated urban areas. While physico-chemical effects have been widely studied, the consequences for groundwater ecosystems are scarcely understood. However, a thorough understanding of how this sensitive ecosystem responds to various stressors, such as temperature, in urban environments is critical for a sustainable resource management.

Thus, the aim of this study is to provide an assessment of the groundwater fauna in and around the city of Karlsruhe, Germany. We examine the ecological status of an urban aquifer by analysing fauna and physico-chemical parameters in 39 groundwater monitoring wells between 2011 and 2022. For classification, we apply the groundwater ecosystem status index (GESI), in which a threshold of more than 70% of crustaceans and less than 20% of oligochaetes serves as an indication for very good and good ecological conditions. Our study reveals that only 35% of the wells in the residential, commercial and industrial areas, and 50% of wells in a natural forest area fulfil these criteria and can be classified as natural and unstressed groundwater habitats in 2011-2014. In 2022, however, all wells in the forest area show a very good or good ecological status, irrespective of changes in diversity and number of individuals. Repeated measurements in 2022 also show significant changes in groundwater fauna with only slight changes in the physico-chemical parameters over time. A significantly decreasing number of individuals per well together with a decreasing biodiversity both in the forest and urban areas is observed.

Overall, no clear spatial patterns in the ecological status are found with respect to land use and other anthropogenic impacts, such as groundwater temperatures. Nevertheless, we observe noticeable differences in the spatial distribution of groundwater species in combination with abiotic groundwater characteristics, such as groundwater temperature and geological settings. Monitoring wells in forest areas are characterized by lower groundwater temperatures, lower nitrate concentrations, and higher dissolved oxygen concentrations, indicating a link between abiotic groundwater characteristics and land use. In addition, these monitoring wells contain larger numbers of amphipods, which are considered as indicators of healthy ecosystems.

The results of our study reveal heterogeneous and time-varying conditions in urban and natural groundwater as a habitat, which do not allow a clear assessment of the ecological status with existing assessment approaches. In the future, additional indicators, such as groundwater temperature, local geology, presence of indicator species, delineation of site-specific characteristics and natural reference conditions, should be therefore also considered in ecological groundwater assessments.

How to cite: Koch, F., Menberg, K., Schweikert, S., Hengel, J., Spengler, C., Hahn, H. J., and Blum, P.: Urban groundwater fauna - natural or anthropogenically influenced?, EGU General Assembly 2023, Vienna, Austria, 23–28 Apr 2023, EGU23-5773, https://doi.org/10.5194/egusphere-egu23-5773, 2023.

EGU23-6409 | ECS | Orals | HS10.1

Spatially explicit linkages between redox potential cycles and soil moisture fluctuations 

Simiao Wang, Filippo Miele, Paolo Benettin, Rizlan Bernier-Latmani, and Andrea Rinaldo
Reduction-oxidation cycles measured through soil redox potential are associated with dynamic soil microbial activity. Understanding changes in the composition of, and resource use by, soil microbial communities requires redox potential predictability under shifting hydrologic drivers. Here, 50 cm soil column installations are manipulated to vary hydrologic and geochemical conditions, and are extensively monitored by a dense instrumental deployment to record the depth-time variation of physical and biogeochemical conditions. We contrast measurements of soil redox potential and saturation and key compounds in water samples (probing the majority of soil microbial metabolisms) with computations of the relevant state variables, to investigate the interplay between soil moisture and redox potential dynamics. Our results highlight the importance of joint spatially resolved hydrologic flow/transport and redox processes, the worth of contrasting experiments and computations for a sufficient understanding of the redox dynamics, and the minimum amount of biogeochemistry needed to characterise the dynamics of electron donors/acceptors that are responsible for the patterns of redox potential not directly explained by physical oxic/anoxic transitions. As an example, measured concentrations of sulfate, ammonium and iron II suggest coexistence of both oxic and anoxic conditions. We find that the local saturation velocity (a threshold value of the time derivative of soil saturation) exerts a significant hysteretic control on oxygen intrusion and on the cycling of redox potentials, in contrast with approaches using a single threshold saturation level as the determinant of anoxic conditions. Our findings improve our ability to target how and where hotspots of activity develop within soil microbial communities.

How to cite: Wang, S., Miele, F., Benettin, P., Bernier-Latmani, R., and Rinaldo, A.: Spatially explicit linkages between redox potential cycles and soil moisture fluctuations, EGU General Assembly 2023, Vienna, Austria, 23–28 Apr 2023, EGU23-6409, https://doi.org/10.5194/egusphere-egu23-6409, 2023.

EGU23-6560 | ECS | Orals | HS10.1

Shaping eco-hydrologic flow regimes at regional scale 

Chiara Arrighi, Marco De Simone, and Fabio Castelli

The EU Water Framework Directive WFD (60/2000) asks the achievement of a good ecological status of water bodies and requires the definition of ecological flows in Water Management Plans. Ecological flow definition goes beyond the minimum low-flow discharge and is defined as a hydrologic regime suitable for the aquatic ecosystem and preservation of biodiversity. Ecological status is monitored by environmental agencies and is based on the worst among the selected biological indicators (e.g., macroinvertebrate-based indices, nutrients and dissolved oxygen, macrophytes indices etc.). This work examines the hydrologic regimes of water bodies based on (i) monitored ecological status, (ii) water quality/quantity stressors and (iii) water balance computed with a distributed hydrologic model validated against recorded river discharge data. As water stressors climate, morphological alterations, land use, and water management indicators are accounted for in each river catchment. Machine learning classifiers are compared in their capability of predicting a good ecological status based on stressors.  The hydrologic model is used to determine flow duration curves and to extract seasonal patterns and characteristic discharges of river which currently satisfy the WFD requirements. The method is applied to the rivers of the Tuscany region (central Italy), which is part of the Hydrographic District of the Northern Appennines. The results show a significant role of climate and land use parameters in determining a less than good ecological status with a consequent need of dilution of pollutants and higher specific discharges. The different hydrologic regimes in different ecological status conditions highlight the capability of advanced eco-hydrologic modelling to overcome the limitations of the commonly adopted purely hydrologic approaches at district scale.

How to cite: Arrighi, C., De Simone, M., and Castelli, F.: Shaping eco-hydrologic flow regimes at regional scale, EGU General Assembly 2023, Vienna, Austria, 23–28 Apr 2023, EGU23-6560, https://doi.org/10.5194/egusphere-egu23-6560, 2023.

EGU23-6760 | ECS | Orals | HS10.1

Chemical and biological signatures of water and fluxes from clouds to rivers at the watershed level in a natural context. 

Tiphaine Labed-Veydert, Muriel Joly, Céline Judon, Martin Leremboure, Guillaume Voyard, Claude Forano, Angélica Bianco, Jean-Luc Baray, Joan Artigas, Clarisse Mallet, Delphine Latour, Erwan Roussel, Patrick Jame, Erik Bonjour, Franck Jabot, Julien Pottier, and Pierre Amato

Abstract:

The connectivity of environmental compartments through chemical and biological exchanges is often difficult to study. However, understanding the functioning of fluxes is essential in the context of climate change and the assessment of anthropogenic impacts. These exchanges can be realized through water cycle fluxes establishing interactions between the atmosphere, surface water and land.

To examine the interactions between the atmosphere, surface water and land via water fluxes, we conducted a large scale field study at the watershed level, involving multiple disciplines from chemistry to meteorology and microbiology. The chemical and biological contents of water from the atmosphere (cloud and rain), to mid-mountain hydrological continuum (streams, wetlands and lake) and soil (agricultural plots) were assessed in the natural and agricultural area from Puy De Dôme (Central France) along an altitudinal gradient from puy de Dôme Mountain summit (1465 m asl) to the plain (~ 600 m asl). We set up experimental procedures for sampling, handling and analysing each environmental matrix, and the environmental context was characterized through meteorological and hydrological measurements and models. The biological and chemical variables included: isotopes of water (1H/2H and 16O/18O; laser spectroscopy), major ions (Na+, NH4+, K+, Mg2+, Ca2+, Cl-, NO3-, SO4-, IC), amino acids (LC-MS), bacterial diversity (16S metabarcoding and high-throughput sequencing) and microbial enzymatic activity associated with the nitrogen, carbon and phosphorus cycles (fluorimetric activity assays for whole Beta-Glucosidase, Leucine Aminopeptidase and Phosphatase activities).

The multi-compartment analysis revealed significant differences between the compartments by the chemical variables, highlighting the compartment specificity. We estimated a chemical flux of major ions and amino acids from the atmosphere to the surface (soil and surface water). Bacterial diversity analysis showed a core community in these compartments, confirming their connectivity. Thereafter, we tried to explain bacterial diversity by the chemical variables from the studied compartments. Our analysis on microbial enzymatic activity showed an enzymatic activity associated with the nitrogen, carbon and phosphorus cycles in clouds and rain.

Here, our study contributes to the understanding of atmosphere-surface interaction through field observations and atmospheric models and we attempted to better understand environmental fluxes. Our field study emphasized the importance of considering the interaction of environmental compartments in future investigations for future and gobal assessments of anthropogenic impacts, such as agrosystem effects to natural ecosystems.


Key words:

Field observations, Environmental interaction, Chemical flux, Microbial diversity, Atmosphere, Surface water, Soil.

How to cite: Labed-Veydert, T., Joly, M., Judon, C., Leremboure, M., Voyard, G., Forano, C., Bianco, A., Baray, J.-L., Artigas, J., Mallet, C., Latour, D., Roussel, E., Jame, P., Bonjour, E., Jabot, F., Pottier, J., and Amato, P.: Chemical and biological signatures of water and fluxes from clouds to rivers at the watershed level in a natural context., EGU General Assembly 2023, Vienna, Austria, 23–28 Apr 2023, EGU23-6760, https://doi.org/10.5194/egusphere-egu23-6760, 2023.

EGU23-7055 | Orals | HS10.1

Effect of slope position on hydrochory processes: a natural rainfall study in tropical agroecosystem 

Seraphine Grellier, Wanwisa Pansak, Suphannika Intanon, Chanisara Rodprai, Khwanrawee Anusorn, Claude Hammecker, and Jean-Louis Janeau

Soil erosion due to land use change and consequently biodiversity loss are major concerns in agricultural areas. However, the link between runoff, soil loss and plant dispersion by water also called hydrochory is not yet well understood, especially in tropical climate. The displacement of native plant seeds on the soil surface by runoff may be influenced by soil properties and by agricultural practices. This may in return affect or modify biodiversity in agroecosystems.

This is why we propose to study the processes affecting seed displacement by runoff in steeply sloping maize field affected by rainfall and tillage erosion in Northern Thailand.

After a first study under rainfall simulation in situ (Janeau et al. 2022), we present here a two years study under natural rainfall to assess the role of position in the catena and soil properties on seed displacement, soil loss and nutrient losses. We used 24 plots of 1 m2 located at four positions in the catena. Two treatments were tested: (1) conventional system with tillage and (2) biochar incorporated into the soil. We measured the displacement of seeds (only for treatment 1), runoff volume, soil and nutrient losses and soil surface features (for the two treatments) during two years of study.

Preliminary results indicate a strong influence of catena position on all studied variables. This may be due to soil properties changing along the catena, as well as shape (concave or convex) of the slope position. As expected, rainfall intensity seemed influencing runoff and soil and nutrient losses, together with seed displacement.

This study, under tropical climate and steep slope conditions, highlights differences in soil surface features and runoff along the catena. We should consider catena position for improving soil management and using appropriate agroecological practices.

How to cite: Grellier, S., Pansak, W., Intanon, S., Rodprai, C., Anusorn, K., Hammecker, C., and Janeau, J.-L.: Effect of slope position on hydrochory processes: a natural rainfall study in tropical agroecosystem, EGU General Assembly 2023, Vienna, Austria, 23–28 Apr 2023, EGU23-7055, https://doi.org/10.5194/egusphere-egu23-7055, 2023.

EGU23-7733 | ECS | Orals | HS10.1

A stochastic eco-hydrological model reveals the impact of active stream dynamics and connectivity on metapopulation 

Leonardo Enrico Bertassello, Nicola Durighetto, and Gianluca Botter

The active portion of river networks varies in time thanks to event-based and seasonal expansion-retraction cycles that mimic the unstradiness of the underlying climatic conditions. These rivers, usually referred to as temporary streams, constitute a major fraction of the global river network. Temporary streams provide a unique contribution to riverine ecosystems, as they host unique habitats that promote biodiversity. Nonetheless, the impacts of network dynamics on ecological processes and ecosystem services are not fully understood. In this contribution, we present a stochastic framework for the coupled simulation of active stream dynamics and the related occupancy of a metapopulation. The framework combines a stochastic model for the generation of synthetic streamflow time series with the hierarchical structuring of river network dynamics, to enable the simulation of the full spatio-temporal dynamics of the active portion of the stream network under a wide range of climatic settings. The hierarchical nature of stream dynamics - which postulates that during wetting nodes are  activated sequentially from the most to the least persistent, and deactivated in reverse order during drying - represents a key feature of the approach, as it enables a clear separation between the spatial and temporal dimensions of the problem. The framework is complemented with a stochastic dynamic metapopulation model that simulates the occupancy of a metapopulation on the simulated stream. Our results show that stream intermittency negatively impacts the average occupancy and the probability of extinction of the focus metapopulation. Likewise, the spatial correlation of flow persistency along the network bears a sizable impact on the mean network connectivity and occupancy. This effect is particularly important in drier climates, where most of the network undergoes sporadic and flashy activations, and species dispersal is regularly inhibited by river fragmentation. This approach offers a robust but parsimonious mathematical framework for the synthetic simulation of stream network dynamics under a broad range of climatic and morphological conditions, providing useful insights on stream expansion and retraction in its ecological significance.

How to cite: Bertassello, L. E., Durighetto, N., and Botter, G.: A stochastic eco-hydrological model reveals the impact of active stream dynamics and connectivity on metapopulation, EGU General Assembly 2023, Vienna, Austria, 23–28 Apr 2023, EGU23-7733, https://doi.org/10.5194/egusphere-egu23-7733, 2023.

Ecosystem degradation and biodiversity loss have been caused by economic booms in developing countries over recent decades, and ecosystem restoration projects have been advanced in many countries. However, the post-restoration monitoring and evaluation of aquatic ecosystems across large spatial and temporal scales is underfunded or not well documented, especially outside of Europe and North America. The effectiveness of different approaches and indicators at large spatio-temporal scales (i.e., whole catchments) also remains poorly understood. Here, we first present a meta-analysis of abiotic and biotic indices to quantify post-restoration (2 month to 13 years) effects from reported aquatic restoration projects throughout the China-mainland, incorporating 39 lentic and 36 lotic ecosystems. Secondly, we assessed the effectiveness of a diverse array of 440 aquatic restoration projects (wastewater treatment, constructed wetlands, etc.) implemented and maintained from 2007 to 2017 across more than 2000 km2 of the northwest Taihu basin (Yixing, China). Synchronized investigations of water quality and invertebrate communities were conducted before and after restoration. Our analysis showed that: (1) decreases in dissolved nutrients (TN, NH4+-N, TP) post-restoration were rapid, but tended to slow after about 9.3 years; (2) Response ratios summarizing biodiversity responses (incorporating phytoplankton, invertebrates, vascular plants, fish and birds) typically lagged behind abiotic changes, suggesting longer timescales are needed for biotic indices to recover; (3) Spatial heterogeneity, reflecting the effects of different restoration approaches (e.g., sewage interception, polluted sediment dredging, artificial wetlands, etc.), had a significantly stronger effect on biotic than abiotic indices, particularly in rivers compared to standing waters. This reflects the complexity of fluvial ecosystem dynamics, and hints at a limitation in the reinstatement of ecological processes in these systems to overcome issues such as dispersal limitations; (4) Even though there was rapid urbanization at Yixing, nutrient (NH4+-N, TN, TP) concentrations and biological indices of benthic invertebrate (taxonomic richness, Shannon diversity, sensitive taxon density) improved significantly across most of the study area; (5) Improvements were associated with the type of restoration project, with projects targeting pollution-sources leading to the clearest ecosystem responses compared with those remediating pollution-sinks. Overall, our study suggests that the different timelines and processes by which abiotic and biotic indices recover after restoration should be taken into account when defining restoration targets and monitoring programs. We also demonstrated that ecological damage caused by recent rapid economic development in China could potentially be mitigated by massive restoration investments synchronized across whole catchments, although these effects could be expected to be enhanced if urbanization rates were reduced at the same time.

Related contents had been published see: (1) Fu, Hong, et al. "Mitigation of urbanization effects on aquatic ecosystems by synchronous ecological restoration." Water Research 204 (2021): 117587; (2) Fu, Hong, et al. "A meta-analysis of environmental responses to freshwater ecosystem restoration in China (1987–2018)." Environmental Pollution 316 (2023): 120589.

How to cite: Fu, H.: Assessment of long-term and large spatial scale aquatic ecosystem restoration practices in China: reveals divergence recovery timeline and how urbanisation effects could be mitigated, EGU General Assembly 2023, Vienna, Austria, 23–28 Apr 2023, EGU23-8122, https://doi.org/10.5194/egusphere-egu23-8122, 2023.

EGU23-8643 | ECS | Posters on site | HS10.1

Monitoring of soil moisture response as part of the ecohydrological cycle 

Katarina Zabret, Klaudija Lebar, Mark Bryan Alivio, Nejc Bezak, and Mojca Šraj

Ecohydrological cycle in addition to common hydrological components such as rainfall, runoff and evaporation, strongly focuses also on ecological elements, i.e. elements of the nature and their role in the water cycle. As such we have addressed the role of two natural elements in the water balance of the study plot: vegetation (trees) through rainfall interception process and the soil through water infiltration and soil moisture dynamics. The study plot covers small urban park in the city of Ljubljana, Slovenia and includes the opening with low-cut grass, group of birch trees and group of pine trees. There we are monitoring rainfall and its characteristics, as well as throughfall and stemflow under each group of trees since the year 2014. Additionally, in 2021 we have started to measure also soil moisture (volumetric water content; VWC) at three depths (16 cm, 51 cm and 74 cm) and at three locations: in the open, under the birch and under the pine trees. During the measurements of soil moisture, we have captured the distinctly dry period of spring and summer of 2022, as well as excess of rainfall amount according to the long-term average during September 2022. For the collected data set we have used statistical approaches to analyse influence of vegetation (rainfall interception) on values and response of soil moisture as well as influence of pre-event conditions on the response and dynamics of soil moisture.

Acknowledgments: Results are part of the CELSA project entitled “Interception experimentation and modelling for enhanced impact analysis of nature-based solution” and research programmes and projects P2-0180, J6-4629, and N2-0313 financed by the Slovenian Research Agency (ARRS).

How to cite: Zabret, K., Lebar, K., Alivio, M. B., Bezak, N., and Šraj, M.: Monitoring of soil moisture response as part of the ecohydrological cycle, EGU General Assembly 2023, Vienna, Austria, 23–28 Apr 2023, EGU23-8643, https://doi.org/10.5194/egusphere-egu23-8643, 2023.

EGU23-9147 | ECS | Orals | HS10.1

Investigating the effects of river regulation and water quality on macroinvertebrate communities in the Goulburn basin during the millennium drought 

Sudeep Banad, Yongping Wei, Chandrika Thulaseedharan Dhanya, and Ron Johnstone

Macroinvertebrates are essential components of the aquatic ecosystem, and their assemblages are influenced by a variety of abiotic and biotic factors. The effects of water quality parameters on macroinvertebrate assemblages were studied in regulated and unregulated reaches of the Goulburn River, Australia. Analysis of similarities (ANOSIM) revealed significant differences in macroinvertebrate community compositions between river reaches and revealed that regulation plays a vital role in the composition of macroinvertebrates. SIMPER analysis was conducted to determine the contribution of each species to the average similarity between unregulated reach R1 and regulated reach R2, which is influenced by hydropeaking. The results show that Psephenidae, Eustheniidae, and Synthemistidae play a significant role in the observed differences between the two reaches. Redundancy analysis (RDA) and threshold indicator taxa analysis (TITAN) identified the water quality parameters and their associated indicator species, and the appropriate response threshold was determined. The results show that dissolved oxygen is the most important water quality parameter influencing macroinvertebrate community assemblage in unregulated reaches, whereas total suspended solids and ammonia nitrogen influenced community structure in regulated reaches. This research provides insight into the relative effects of water quality parameters on macroinvertebrate assemblages and their resilience to anthropogenic disturbance.


How to cite: Banad, S., Wei, Y., Dhanya, C. T., and Johnstone, R.: Investigating the effects of river regulation and water quality on macroinvertebrate communities in the Goulburn basin during the millennium drought, EGU General Assembly 2023, Vienna, Austria, 23–28 Apr 2023, EGU23-9147, https://doi.org/10.5194/egusphere-egu23-9147, 2023.

EGU23-9151 | ECS | Posters on site | HS10.1

The Signature of Snow Drought: A Spatially-Connected Approach to Understanding Forest Water Stress 

Louis Graup and Naomi Tague

Globally, and especially in Mediterranean-type ecosystems (MTEs), forests are increasingly vulnerable to drought stress, leading to high rates of mortality. Global climate models project increased drought frequency and severity, with higher temperatures leading to snow droughts. Warm snow droughts are produced by warming temperatures that prevent precipitation from accumulating on the landscape as a snowpack. Dry snow droughts have very little rain or snow. Any drought reduces water availability and increases vegetation water stress. But in the complex topography of mountain environments, spatial patterns of drought stress and subsequent tree mortality are influenced by snowmelt and subsurface lateral redistribution. Along a hillslope, snowmelt induces hydrologic connectivity, enhancing groundwater recharge and lateral flows. Riparian vegetation benefits from these upslope subsidies, which makes riparian trees more productive but also more sensitive to climate variability. This research seeks to understand, what is the implication of snow drought for hillslope ecohydrology? Using observed sap flow data taken along a topographic gradient in an experimental watershed in the Sierra Nevada, CA, we calibrate an ecohydrological model (RHESSys) to consider the effects of climate, geology, and forest management on riparian water stress. We demonstrate that riparian trees are buffered against drought stress by lateral inputs at our groundwater-dominated study site. But riparian forests without a significant groundwater influence will not be so fortunate. I am proposing an international collaboration between US and EU ecohydrologists to understand the conditions that lead to greater riparian water stress in Mediterranean ecosystems and determine potential solutions to protect these sensitive hydrological microrefugia.

How to cite: Graup, L. and Tague, N.: The Signature of Snow Drought: A Spatially-Connected Approach to Understanding Forest Water Stress, EGU General Assembly 2023, Vienna, Austria, 23–28 Apr 2023, EGU23-9151, https://doi.org/10.5194/egusphere-egu23-9151, 2023.

EGU23-9503 * | Orals | HS10.1 | Highlight

Towards a better understanding of deep belowground water stores and their influence on land-atmosphere exchange and drought impacts 

Benjamin Stocker, Shersingh Joseph Tumber-Dávila, Alexandra G. Konings, Martha C. Anderson, Christopher Hain, Francesco Giardina, and Robert B. Jackson

Water availability controls vegetation activity and the carbon balance of terrestrial ecosystems across a large portion of the global land surface. Although the influence of terrestrial water storage (TWS) on the land carbon balance is evident in globally aggregated measures, it remains unknown whether the large annual amplitudes in TWS are causally linked to water availability in the rooting zone of vegetation, or whether they reflect a correlation of plant water stress with water stored in other landscape elements that may not directly be connected to vegetation functioning (lakes, rivers, groundwater). Global models of the land surface typically ignore hillslope-scale variations in plant water availability, and water stores that are located beyond the soil, and beyond prescribed plant rooting depths. This simplification is partly owed to a lack of empirical information.

Here, we approach this gap from two angles: from the site scale using eddy covariance observations, and from the global scale using earth observations. Water mass balance constraints derived from thermal infrared-based evapotranspiration (ET) estimates and precipitation reanalysis data indicate plant-available water stores that exceed the storage capacity of 2 m deep soils across 37% of the Earth’s vegetated surface. Large spatial variations of the rooting zone water storage capacity across topographic and hydro-climatic gradients are tightly linked to the sensitivity of vegetation activity (measured by sun-induced fluorescence and by the evaporative fraction) to water deficits. Similar patterns between ET and cumulative water deficits emerge from site-level flux measurements. We found large variations of the vegetation sensitivity to dry conditions across sites and at several sites a muted response of ET to dry conditions in spite of large (>300 mm) seasonal water deficits at some sites.

Taken together, results we show here hint at a critical role of plant access to deep water stores and the need to extend the focus beyond moisture in the top 1-2 m of soil for understanding and simulating land-atmosphere exchange. Our results add to the emerging evidence that water stored in the weathered bedrock and plant access to groundwater may have a more important role in regulating land-atmosphere exchange and the carbon cycle than previously appreciated.

How to cite: Stocker, B., Tumber-Dávila, S. J., Konings, A. G., Anderson, M. C., Hain, C., Giardina, F., and Jackson, R. B.: Towards a better understanding of deep belowground water stores and their influence on land-atmosphere exchange and drought impacts, EGU General Assembly 2023, Vienna, Austria, 23–28 Apr 2023, EGU23-9503, https://doi.org/10.5194/egusphere-egu23-9503, 2023.

EGU23-10267 | Posters on site | HS10.1

Assessment of phthalic acid esters (PAEs) in waters of the Atoyac River basin, Puebla-Tlaxcala, Mexico 

Ivón Vázquez Tapia, Abrahan Mora, Jaime Dueñas-Moreno, and Jürgen Mahlknecht

The present study demonstrated the presence of phthalates in the Atoyac River, considered the second most polluted river in Mexico. The results showed that 9 PAES were detected in river water of the 15 PAES studied. Among the detected PAES, Bis-(2-methoxyethyl) phthalate (DMEP), Bis(4-methyl-2-pentyl) phthalate (BMPP), Di-n-hexyl phthalate (DNHP) and Dipentyl phthalate (DPP) had concentrations higher than those reported in highly polluted worldwide rivers.

The main source of phthalate pollution in the river was the discharges of untreated or poorly treated wastewater coming from the metropolitan area of Puebla and Tlaxcala states, which holds hundreds of industries. The distribution study of the sampling sites indicated that the highest concentrations of phthalates were detected in industrial areas.  Sources of phthalates can be related to the presence of chemical plants, textile production, uses of solvents in the production of paper and mainly in the manufacture of plastic products.

In addition, the concentrations of the five most detected phthalates throughout the Atoyac River basin showed a decrease in the lotic water body (Valsequillo reservoir), which acts as a sewage oxidation lagoon, degrading some organic pollutants (including phthalates) present in the river waters

How to cite: Vázquez Tapia, I., Mora, A., Dueñas-Moreno, J., and Mahlknecht, J.: Assessment of phthalic acid esters (PAEs) in waters of the Atoyac River basin, Puebla-Tlaxcala, Mexico, EGU General Assembly 2023, Vienna, Austria, 23–28 Apr 2023, EGU23-10267, https://doi.org/10.5194/egusphere-egu23-10267, 2023.

This study assesses future extreme hydrological conditions in East Asia based on four Global Circulation Models (GCMs) from Coupled Model Intercomparison Project Phase 6 with biogeochemistry (CMIP6-BGC), which provides layers of vegetation and soil to estimate carbon and nitrogen cycle. We estimate the frequency and severity of extreme dry and wet conditions based on runoff using the threshold level method under Shared Socioeconomic Pathway and Representative Concentration Pathway (SSP-RCP) 585 scenarios. The differences in extremes between “standard”, which does not consider the detailed biogeochemical processes, and the “BGC” simulations are estimated to quantify the impacts of biogeochemical processes on the hydrological extremes. This study shows that the “standard” case is predicted to be more severe and pronged in intensity and duration of extremes in the future than that of the “BGC” case. For example, the duration of extreme dry and wet conditions in the “BGC” case shows less duration, about 21% and 12%, respectively, in the future than in the “standard” case in three GCMs ensemble. We demonstrate that the effects of the biogeochemical process should be considered to project future extremes because these extremes could be overestimated in “standard” simulations.


Acknowledgements

This work was supported by the Basic Science Research Program (2020R1A2C2007670) and the Framework of International Cooperation Program (2021K2A9A2A06038429) through the National Research Foundation of Korea (NRF).

How to cite: Lee, J. and Kim, Y.: Impacts of biogeochemical processes on hydrological extremes under future SSP585 scenario over East Asia, EGU General Assembly 2023, Vienna, Austria, 23–28 Apr 2023, EGU23-10583, https://doi.org/10.5194/egusphere-egu23-10583, 2023.

EGU23-10820 | ECS | Posters on site | HS10.1

Using Boa for Multi-Objective Optimization of the hydrodynamic canopy transpiration model FETCH3.14 

Madeline Scyphers, Justine Missik, Gil Bohrer, Joel Paulson, Yair Mau, Marcela Silva, Ashley Matheny, and Ana Maria Restrepo Acevedo
Species-specific hydraulic traits play a critical role in determining the response of ecosystem carbon and water fluxes to water stress. Improving the representation of plant hydraulic behavior in vegetation and land-surface models is critical for improving our predictions of the impacts of water stress on ecosystem carbon and surface fluxes given that biodiverse representation of forest canopies remain challenging for land-surface models. Here, we use FETCH3.14, a multispecies, canopy-level, hydrodynamic transpiration model which builds upon the previous versions of the Finite-difference Ecosystem-scale Tree Crown Hydrodynamics model (FETCH). FETCH3.14 is parameterized by our newly developed package, Bayesian Optimization for Anything (BOA), which facilitates and eases hyperparameter optimization using multi-scale and multi-variate observations.

BOA incorporates multiple sources of data easily, reduces optimization setup time, and eases advanced use cases such as High-Performance Computing (HPC) parallelization and optimization restarting. BOA facilitates multi-source data assimilation for FETCH3.14 from a disparate range of sources including ET observations, soil and stem water potential observations, and carbon flux observations to provide insights about species-specific hydraulic traits. We use flux data from representative model trees that get scaled to the plot level based on the composition of species and structure of the canopy in the plot, which allows parameterization using tree level observations (sap flux, stem water storage) and plot level observations (eddy covariance evapotranspiration). We use BOA to set up a multi-objective optimization inverse problem with little overhead or extra boilerplate code. This approach allows us to utilize multi-scale observations to resolve information about species-specific hydraulic parameters, including parameters that are difficult or impossible to measure in the field.

How to cite: Scyphers, M., Missik, J., Bohrer, G., Paulson, J., Mau, Y., Silva, M., Matheny, A., and Restrepo Acevedo, A. M.: Using Boa for Multi-Objective Optimization of the hydrodynamic canopy transpiration model FETCH3.14, EGU General Assembly 2023, Vienna, Austria, 23–28 Apr 2023, EGU23-10820, https://doi.org/10.5194/egusphere-egu23-10820, 2023.

EGU23-11275 | ECS | Orals | HS10.1

Post-fire effects on DOC concentrations in streams: A meta-analysis 

Jessenia Polack Huaman

Forest fires affects extensive areas each year around the world. An important percentage of those areas represent forested watersheds which provide water supply for different communities, from the microbial till the industrial scale. Forest fires can have an effect in erosion, runoff rates, loss of vegetation cover, rainfall interception, water repellence, among others, which affect the water quality in the streams. The change in the dynamic of a burned watershed produce variation in the DOC concentration, among other water quality parameters, which has a direct impact in the drinking water treatment. This meta-analysis explores post-fire effects in DOC concentrations, during the years after the fire. More than 50 watersheds were identified in the collection of the information. Changes in concentrations were documented primarily within the first 5 years after the fire. The studies were published between 2001 and 2020. We found that percentage of area burned, and fire severity have stronger effect on DOC concentrations. The study documents strong heterogeneity in responses to post-fire effects and DOC concentrations.

How to cite: Polack Huaman, J.: Post-fire effects on DOC concentrations in streams: A meta-analysis, EGU General Assembly 2023, Vienna, Austria, 23–28 Apr 2023, EGU23-11275, https://doi.org/10.5194/egusphere-egu23-11275, 2023.

EGU23-11339 | Orals | HS10.1

SINDBAD: A modular framework for model data integration of carbon-water processes across scales 

Sujan Koirala, Martin Jung, Tina Trautmann, Markus Reichstein, and Nuno Carvalhais

Terrestrial carbon and water cycles are intricately related across spatial (leaf to global) and temporal (instantaneous to multi-annual) scales through multitude of coupled biogeochemical processes that govern the land water and carbon states and fluxes and their feedback to climate. Yet, there are clear discrepancies in modeling key carbon-water processes that lead to large uncertainties in model simulations that often divert away the observations. In fact, the terrestrial biogeochemical models used to represent vegetation-water-carbon interactions vary in complexity and parameterization that are often underconstrained. The current era of rapid growth of satellite Earth Observation, observational networks, and well as observation-based estimate, therefore, provides unprecedented opportunities to improve the models. Unfortunately, most terrestrial biogeochemical models often contain too rigid model structures, and are too demanding to carry out model-data-fusion experiments that leverage the strengths of observational data constraints.

In this study, we present a newly developed terrestrial/ecosystem model-data-integration (MDI) framework, the SINDBAD, that allows for seamless integration of diverse observational data to constrain terrestrial models of varying complexity. The SINDBAD provides a modular framework to create different combinations of terrestrial processes to realize a terrestrial model structure, which can be driven by observed data of climate and/or land characteristic and optimized against provided observation constraints using different cost metrics and parameter optimization methods. To demonstrate the capabilities, we present three MDI experiments of SINDBAD: setup E1 - a global scale model focused on vegetation's role on water cycle; setup E2 - a regional scale model with physiological coupling of water and carbon cycle focused on role of interannual variability of vegetation fraction; and setup E3 - an ecosystem scale model with a prognostic carbon cycle that is used to evaluate the values of using data for ecosystem carbon states.

In the simplest E1 setup, where vegetation only has structural influence on the water cycle, we find that the spatial information of vegetation using satellite-based vegetation index as model input shows clear improvement in the simulation of monthly runoff, as well as interannual variability of terrestrial water storage in arid regions. In setup E2, use of vegetation fraction data from geostationary satellite to drive a physiologically coupled model of water-carbon relations shows a clear improvement in the simulations of interannual variability of gross primary productivity only when the data includes the year-to-year variability of vegetation fraction. In fact, we find that the using mean seasonal cycle of vegetation fraction is able to reproduce the monthly variation but not the interannual variability. Lastly, in setup E3, which includes fully coupled water-carbon model with prognostic evolution of carbon pools with dynamic allocation scheme (with competition for light and water) reveals that the remote sensing observation of carbon states provides better constraints for the carbon cycle compared to the experiment where only eddy covariance measurements are used. The results also indicate that even coarser remote sensing data have a potential to complement ecosystem scale measurements of water and carbon fluxes to improve the prediction of carbon-water coupling at the ecosystem scale.

How to cite: Koirala, S., Jung, M., Trautmann, T., Reichstein, M., and Carvalhais, N.: SINDBAD: A modular framework for model data integration of carbon-water processes across scales, EGU General Assembly 2023, Vienna, Austria, 23–28 Apr 2023, EGU23-11339, https://doi.org/10.5194/egusphere-egu23-11339, 2023.

EGU23-11496 | ECS | Posters virtual | HS10.1

Waterlogging and Drainage Congestion in the Kosi Fan of theHimalayan Foreland 

M Nniranjan Naik, Amrit Kumar Singh, Abhilash Singh, and Kumar Gaurav

This study uses optical and radar satellite images (i.e., Landsat and Sentinel-1 & 2) to monitor seasonal waterlogging in the Kosi Fan from the 1987-2021 period. We used Google Earth Engine (GEE) platform to process the satellite images. We applied Random Forest (RF) classifier to classify the image pixels that correspond to waterlogging from optical and microwave images. The optical images detect the waterlogging patches more accurately (70-80%) as compared to the radar images (50-65%). We observed that the waterlogging patches located along the road and stream networks show a high probability of occurrence. We have computed the probability of occurrence of waterlogging patches near the road and stream network intersection. The result indicates a high correlation of the occurrences of waterlogging patches in the proximity of structural interventions (rail, road, network embankment, etc) on the Kosi Fan.

How to cite: Naik, M. N., Singh, A. K., Singh, A., and Gaurav, K.: Waterlogging and Drainage Congestion in the Kosi Fan of theHimalayan Foreland, EGU General Assembly 2023, Vienna, Austria, 23–28 Apr 2023, EGU23-11496, https://doi.org/10.5194/egusphere-egu23-11496, 2023.

EGU23-12016 | ECS | Orals | HS10.1

Estimating water balance components of Pinus brutia and Cupressus sempervirens trees with observational tree sapflow and soil moisture data 

Hakan Djuma, Adriana Bruggeman, Marinos Eliades, Ioannis Sofokleous, Christos Zoumides, and Melpomeni Siakou

In the coming decades, the Mediterranean region is expected to be one of the areas most affected by climate change as models project a reduction in precipitation. It remains a question if some of the Mediterranean forests will be able to adapt and survive. Pinus brutia (pine) and Cupressus sempervirens (cypress) are two important forestry species in the Mediterranean region. Although they are both coniferous, they can have different strategies to cope with water stress. The objective of this study is to estimate water balance components of pine and cypress trees with observational tree sapflow and soil moisture data. The study site is located in Athalassa Forest Park, in Cyprus. The site has a surface area of 10 ha with an average slope of 4%. Average annual rainfall is 315 mm with a mean daily minimum temperature of 5° C during January and a mean daily maximum temperature of 37° C during August. The site was converted in 2011 from rainfed agriculture to a mixed forest by planting seedlings of different tree and shrub species. Hourly observations of sapflow (cm3) and volumetric soil moisture (%) from two pine and two cypress trees and surrounding soil were used for this study. Soil moisture sensors were installed under the tree canopy (0.4 to 0.9 m from the tree trunk), at the edge of the canopy (1.3 to 2.2 m from the tree trunk) and in the open area (midpoint between neighboring tree trunks, 2.6 to 3.5 m from the tree trunk). The sensors were installed at two opposite sides of each tree trunk, in the direction of the neighboring trees. Sensor depths were 10 cm, 30 cm and 50 cm, reaching a total of 60 sensors. Daily water balance calculations were made for the period 06/11/2020 to 29/06/2022 (20 months), in which total rainfall was 581 mm. The extent of the tree root zone area was estimated for different sets of assumptions. For a root zone depth of 60 cm and a root zone area radius of 2.2 m, transpiration amounted to 33.2% of the precipitation for one of the two cypress trees and 40.9% for the other tree, with losses (interception, soil evaporation and drainage) of 60.3% and 53.6% and soil moisture changes of 6.5% and 5.5%, respectively. The pine tree observations indicated a smaller root zone area. For a root zone depth of 60 cm and a radius of 1.7 m, the transpiration of the two pine trees amounted to 30.4% and 48.0% of the precipitation, losses were 60.6% and 50.7% and soil moisture changes were 9.0% and 1.3%. The effect of the different assumptions on the water balance components will be presented.

This research has received financial support from the PRIMA (2018 Call) SWATCH Project and the Water JPI (Joint Call 2018) FLUXMED Project, both funded by the Republic of Cyprus through the Cyprus Research and Innovation Foundation. The PRIMA programme is supported by Horizon 2020, the European Union's Framework Program for Research and Innovation.

How to cite: Djuma, H., Bruggeman, A., Eliades, M., Sofokleous, I., Zoumides, C., and Siakou, M.: Estimating water balance components of Pinus brutia and Cupressus sempervirens trees with observational tree sapflow and soil moisture data, EGU General Assembly 2023, Vienna, Austria, 23–28 Apr 2023, EGU23-12016, https://doi.org/10.5194/egusphere-egu23-12016, 2023.

Climate change is altering the spatiotemporal pattern of precipitation toward more extreme conditions. However, it’s still unclear how a more variable hydroclimate influences soil biogeochemical cycling and resultant soil carbon emission. One key challenge is our limited understanding of how hydroclimate coupling with other environmental drivers regulates the composition and functions of soil microbial communities. Moreover, how this environmental feedback of soil microbial communities mediates soil biogeochemical processes. To overcome this challenge, we integrated published metagenomics datasets across the US to identify eight general soil enzyme functional classes (EFCs) involved in soil carbon (C), nitrogen (N), and Phosphorus (P) cycles. We then integrated this omics-informed microbial functional information with the corresponding hydroclimate and other environmental data to train and test a machine learning (ML) pipeline for predicting the spatial distribution of EFC composition across the US domain and its variability with changing hydroclimate. This ML-predicted microbial functional feedback to changing hydroclimate was finally coupled with the Community Land Model (CLM5.0) to assess its impact on microbially-mediated soil carbon emission. Our study showed that soil enzyme functional composition is sensitive to changing hydroclimate. Microbial communities decrease the investment in EFCs involved in SOM decomposition under drying conditions. Incorporating this microbial feedback to hydroclimate into the CLM5.0 captured soil carbon dynamics in the water-limited region. Output from this study, including the gridded EFC composition dataset and coupled model framework, can be applied to mitigate the uncertainty in projecting soil carbon-climate feedback under changing hydroclimate.

How to cite: Song, Y. and Fan, C.: Integrating omics, machine learning, and process-based land surface model to predict hydroclimate feedbacks of microbial functions and its implication for soil carbon emission, EGU General Assembly 2023, Vienna, Austria, 23–28 Apr 2023, EGU23-12020, https://doi.org/10.5194/egusphere-egu23-12020, 2023.

EGU23-12853 | ECS | Orals | HS10.1

Agro-ecological impact assessment of irrigation canal rehabilitation scenarios under different hydrological conditions in the upper Mekong Delta, Cambodia 

Christina Orieschnig, Gilles Belaud, Jean-Philippe Venot, and Sylvain Massuel

The Cambodian part of the Mekong Delta, is characterized by specific irrigation infrastructures, namely Prek channels. These trapezoidal earthen channels traditionally connect the Mekong’s mainstream to low-lying floodplains by breaching the elevated river banks. They act as vectors for both flooding and drainage during the annual Monsoon inundations. Furthermore, they fulfil a diverse set of ecosystem services for local communities, from providing dry season irrigation water to channelling nutrient-laden sediments to increase the fertility of agricultural plots. Given the recent shifts in the hydrological regime of the Mekong River - mainly due to climate change, hydropower construction, and land use changes - the role of Preks  in the sustainable management of the  floodplain agroecosystems becomes a crucial issue. For this reason, various initiatives by local stakeholders as well as national ministries and international development agencies have aimed to rehabilitate Prek channels in recent years and restore functionalities that have become impeded due to erosion and sediment clogging. However, there are different ways in which to rehabilitate Preks, and numerous potential project sites to choose from. 


The aim of this study is to build a method to assess the impact of different Prek rehabilitation scenarios on the local agroecosystem, under different hydrological framework conditions. In order to do so, an eco-hydrological model has been constructed in Python. It depicts a case study area of 43 km², comprising 10 Preks, located approximately 70 km South of the Cambodian capital Phnom Penh. The model is based on the results of remote sensing analyses combining Sentinel-1 and -2 images to determine land use and land cover (LULC) evolution, as well as the spatial and temporal distribution of seasonal  inundations. It also takes into account the results of field surveys and interviews with local stakeholders to make explicit the link between the hydrological processes catalysed by Preks and the ecosystem services from which local communities benefit, especially the provision of irrigation water during the dry season. 


Subsequently, this model was used to compare different rehabilitation scenarios - different canal excavation depths (called shallow and deep calibration), and the rehabilitation of different numbers of Preks in the case study area. In addition, the simulations were carried out for three different hydrological scenarios, based on past observations - one in which the annual Monsoon flood peak is lower than average, one in which it corresponds to the long-term mean, and one in which it is higher than average. This helps account for the likely long-term impact of delta- and basin-wide developments like LULC change, climate change, and hydropower construction, on local hydrological conditions such as the timing and duration of inundations. Initial results indicate that Prek rehabilitation, especially using deep calibration, has a significant impact on agricultural production through irrigation water provision. For instance, simulations show that, even in below-average hydrological years, blanket deep calibration of Preks in the study area could increase agricultural production by 33% in comparison to the reference year.  

How to cite: Orieschnig, C., Belaud, G., Venot, J.-P., and Massuel, S.: Agro-ecological impact assessment of irrigation canal rehabilitation scenarios under different hydrological conditions in the upper Mekong Delta, Cambodia, EGU General Assembly 2023, Vienna, Austria, 23–28 Apr 2023, EGU23-12853, https://doi.org/10.5194/egusphere-egu23-12853, 2023.

The extent of water from river and floodplain (groundwater, rainfall, and snowmelt) in an inundation is related to ecological processes such as vegetation development. A prominent example of this phenomenon is the Biebrza floodplain, which is a 220km2 natural, temperate zone, fen wetland, with extensive river flooding. The lateral vegetation zonation in this area was related to the flooding frequency and water depth; however, more recent research showed that the extent of the river water zone within the inundation is a better predictor of the vegetation pattern. Despite its significance, the long-term sensitivity of vegetation zonation with respect to changing extent of water zones and climate was not investigated. In this study, we used the Hydraulic Mixing-Cell (HMC) method to simulate the extent of water from rainfall, snowmelt, groundwater discharge, and river flooding. The HMC is implemented in the HydroGeoSphere model, which was set up for the entire 7000 km2 Biebrza catchment. The model was forced using the Twentieth Century Reanalysis data for the period 1881-2015 and using an ensemble of ten EURO-CORDEX simulations for RCP 2.6, 4.5, and 8.5 for the 2006-2099 period. The model output was used to establish vegetation models using three vegetation maps from 1960, 1980, and 2000 and the random forests algorithm. The results show that the vegetation pattern in Biebrza wetlands was predicted with higher accuracy with the water sources zonation predictors from the HMC, whereas the vegetation models using surface water depth and duration or soil moisture, groundwater discharge, and groundwater levels predictors had lower accuracy. Finally, the vegetation was predicted for the entire two centuries period to show that the vegetation change in Biebrza wetlands may occur due to change in water sources’ zonation, which is driven by climate.

How to cite: Berezowski, T. and Wassen, M.: Vegetation pattern in a natural wetland floodplain is predicted better using river-floodplain inundation extents than standard hydrological variables, EGU General Assembly 2023, Vienna, Austria, 23–28 Apr 2023, EGU23-13159, https://doi.org/10.5194/egusphere-egu23-13159, 2023.

EGU23-13201 | Orals | HS10.1

Influence of bioturbation on sediment redistribution along climate gradient in Chile estimated by combining semi-empirical modelling, remote sensing and machine learning 

Paulina Grigusova, Annegret Larsen, Roland Brandl, Diana Kraus, Nina Farwig, and Jörg Bendix

Soil bioturbation activity affects soil texture, bulk density, soil water content and redistribution of nutrients. All of these factors influence surface and subsurface sediment and hydrological processes, and thus are expected to shape the surface on large temporal scales. Previous studies have shown that the impact of bioturbation on these processes is not homogenous.

However, the factors, which determine if bioturbation will positively or negatively affect the named processes, remain unknown. For this reason, the inclusion of bioturbation into erosion and landscape models have up until now been limited. The few models which include it in their algorithms assume a linear positive relationship between bioturbation rates, and erosion, soil mixing and vegetation cover.

In our study, we tested the possibilities and limitations of including bioturbation into soil erosion modelling. We modelled the impact of bioturbation on sediment redistribution, surface runoff, subsurface runoff and infiltration capacity within several climate zones and identified environmental parameters determining the positive or negative impact of bioturbation on surface processes.

Our study area was located along Chilean climate gradient. We measured the needed soil properties and location of burrows created by bioturbating animals in the field. Then we applied machine learning algorithms and used satellite data as predictors to upscale the soil properties and burrow distribution into the catchment. At each of the predicted burrow locations we adjusted the topography, soil properties and vegetation cover accordingly. We implemented the predicted parameters into a semi-empirical model and ran the model for a time period of 3 years under two conditions: With and without integrated bioturbation. We validated the model using sediment fences located at the base of each catchment.

Model with integrated bioturbation activity had an R2 of 0.71 while a model without bioturbation activity had an R2 = 0.45. Bioturbation increased sediment redistribution in all but humid climate zone. The surface runoff increased in semi-arid zone while the infiltration capacity and subsurface runoff increased in the mediterranean and humid climate zone. Bioturbation increased sediment erosion at high and middle values of elevation, at high values of inclination and connectivity, and at low values of profile curvature. Bioturbation increased sediment accumulation at high values of surface roughness and topographic wetness index and at low values of vegetation cover.

How to cite: Grigusova, P., Larsen, A., Brandl, R., Kraus, D., Farwig, N., and Bendix, J.: Influence of bioturbation on sediment redistribution along climate gradient in Chile estimated by combining semi-empirical modelling, remote sensing and machine learning, EGU General Assembly 2023, Vienna, Austria, 23–28 Apr 2023, EGU23-13201, https://doi.org/10.5194/egusphere-egu23-13201, 2023.

EGU23-13529 | ECS | Orals | HS10.1

Observations and modelling of water balance components with the Noah-MP land surface model in a Mediterranean pine forest 

Ioannis Sofokleous, Marinos Eliades, Hakan Djuma, Melpomeni Siakou, and Adriana Bruggeman

The Noah-MP land surface model is a multi-parameterization model that simulates the components of the energy and water balances at the land surface and the interaction of these components with the atmosphere. Modifying and parameterizing the model equations with the use of field observations can improve model applications for the local area but also for areas with similar environmental conditions. Our objective is to improve the simulation of ET (evaporation, transpiration, interception) in Noah-MP, using soil moisture, sapflow and throughfall observations from a monitoring site in a pine forest near the 78-km2 Peristerona watershed in Cyprus. The model simulations and evaluation period cover the years 2014 - 2018. The Jarvis stomatal conductance model in Noah-MP was modified to account for nocturnal transpiration.  The use of the Jarvis model with the nocturnal transpiration resulted in a substantial increase in transpiration. The modified Noah-MP simulated ET to amount to 79% of the total precipitation, close to the observed fraction of 76%, compared to a fraction of 45% obtained with the baseline set-up of Noah-MP with the Ball-Berry stomatal conductance model. The improved Noah-MP can be combined with the WRF-Hydro model and other hydrological models to simulate the entire terrestrial hydrological cycle.

This research has received financial support from the PRIMA (2018 Call) SWATCH Project, funded by the Republic of Cyprus through the Cyprus Research and Innovation Foundation. The PRIMA programme is supported by Horizon 2020, the European Union's Framework Program for Research and Innovation.

How to cite: Sofokleous, I., Eliades, M., Djuma, H., Siakou, M., and Bruggeman, A.: Observations and modelling of water balance components with the Noah-MP land surface model in a Mediterranean pine forest, EGU General Assembly 2023, Vienna, Austria, 23–28 Apr 2023, EGU23-13529, https://doi.org/10.5194/egusphere-egu23-13529, 2023.

EGU23-14127 | Posters on site | HS10.1

Elements of emerging concern: The “old” new contaminants in water and sediments of a Mediterranean wetland (the Albufera Natural Park, Valencia, Spain). 

Vicente Andreu, Eugenia Gimeno-Garcia, Julian Campo-Velasquez, and Yolanda Pico

In recent years increasing attention has been paid to a to a group of inorganic elements widely used but not well known, mainly in their toxicological aspects. Because of this lack of knowledge their possible toxic levels have not been regulated for many of them in the different environmental compartments. It is for these reasons that they have been included in the group of “emerging contaminants” or “contaminants of emerging concern”.

In this work, the presence and spatial distribution of 15 elements (Al, As, B, Be, Bi, La, Li, Mo, Rb, Se, Sr, Ti, Tl and V), considered as emerging contaminants and most of them scarcely studied, in waters and sediments of the Natural Park of L’Albufera of Valencia (Spain) have been studied, together with the influence of the environment (land uses, water sources, etc.). The Natural Park of La Albufera (Valencia, Spain), is one of the most important marshland of Europe, included in the RAMSAR agreement, but it suffers impacts derived from the high human and industrial occupation, and of the hydrological contributions from the connected irrigation systems. It includes a coastal lagoon, marshlands, dunes and pinewoods, surrounded by rice fields, orchard and citrus crops in its not urbanized part.

In this study area, 57 sampling zones were selected covering the different water sources and agricultural types. Total concentrations of the selected 15 elements were evaluated. Standard analytical methods were used to measure water physical and chemical properties. Total content of the elements in water and sediment samples were extracted by microwave acid digestion and determined by ICP-OES-MS.

Taking in to account that for many of these elements there are not regulations or even benchmarks, Al, Li, Sr and Tl showed levels above the stablished legislation for waters with maximum values of 5182.14, 77.83, 4310.03 and 11.37 µg/L, respectively. For sediments values above the existent legislation or benchmarks were observed for As, Sb and Se with maximums of 40040.25, 17.03 and 22.17 mg/kg. Water channels that irrigates rice crops at the south of the target area, and surrounding the lake showed the highest levels in almost all metals.

This study can be a solid base to assess the state of water quality of this wetland area, extrapolable to others in the Mediterranean, and to help in the knowledge of the dynamics of metals scarcely known such as Be, Mo, Se, Sr, Ti or Tl.

Acknowledgements

This work has been supported by the Generalitat Valenciana (Spain) through the project with reference CIPROM/2021/032.

How to cite: Andreu, V., Gimeno-Garcia, E., Campo-Velasquez, J., and Pico, Y.: Elements of emerging concern: The “old” new contaminants in water and sediments of a Mediterranean wetland (the Albufera Natural Park, Valencia, Spain)., EGU General Assembly 2023, Vienna, Austria, 23–28 Apr 2023, EGU23-14127, https://doi.org/10.5194/egusphere-egu23-14127, 2023.

EGU23-15075 | ECS | Posters on site | HS10.1

Agricultural ditch remediation strategies - Integrated hydrological and ecological methods for decision making 

John Livsey, Lukas Hallberg, Maarten Wynants, and Magdalena Bieroza

Agricultural drainage ditches are critical for the removal of excess water from fields. Their traditional trapezoidal shape is effective for this purpose, while also minimizing their footprint and being easy to maintain. However, these drainage ditches also act as transport pathways for phosphorus and nitrogen. Moreover, their steep banks are susceptible to erosion during high flows, which can be a source of additional sediment and phosphorous mobilisation in river systems.  Within Sweden, 60% of water bodies are classified as having poor chemical and ecological status, with diffuse agricultural pollution and hydromorphological pressures being key drivers. Further, the European Green Deal has the ambition to reduce nutrient losses from agricultural catchments by 50%. Therefore, mitigation strategies in agricultural catchments are urgently needed. Ditch remediation, through the construction of two-stage or shallow slope ditches, has been proposed as a solution to reduce nutrient exports and hydromorphological pressures, while maintaining good drainage. Numerous ditch remediation actions have taken place within Sweden, with encouragement and funding from agricultural agencies. However, we currently lack an understanding of the factors controlling the effectiveness of ditch remediation strategies. Further, as aquatic ecosystems provide services beyond simple water conveyance, we are also limited in our understanding of benefits/trade-offs that may occur to these ecosystems as a result of remediation. Therefore, through the synoptic sampling of traditional and remediated ditches, we will analyse and compare channel properties, stream chemistry and macroinvertebrate communities to assess the effect of ditch remediation on both pollution reduction and ecosystems. The obtained data will then be used to model the effectiveness of various remediation strategies. This unique integration of hydrological and ecological methods will increase our understanding of ditch remediation and ultimately support farmers, landowners, and authorities in the design of cost-effective mitigation measures.

How to cite: Livsey, J., Hallberg, L., Wynants, M., and Bieroza, M.: Agricultural ditch remediation strategies - Integrated hydrological and ecological methods for decision making, EGU General Assembly 2023, Vienna, Austria, 23–28 Apr 2023, EGU23-15075, https://doi.org/10.5194/egusphere-egu23-15075, 2023.

EGU23-15210 | ECS | Orals | HS10.1

Using travel time distributions and reactivity continuum to model terrestrial dissolved organic carbon export and reactivity in an Alpine catchment 

Giulia Grandi, Enrico Bertuzzo, Núria Catalán, Susana Bernal, Christina Fasching, and Tom J. Battin

Quantifying the transfer of organic carbon (OC) from the terrestrial to the riverine ecosystems is of crucial importance to fully appreciate the carbon cycle at the catchment, regional and global scales. Dissolved Organic Carbon (DOC) represents one of the main forms in which terrestrial OC is leached to inland waters and the oceans. Its concentration in streams, rivers and lakes is critical for aquatic metabolism but also for the transport of metals and pollutants. In the past years, several studies in different experimental catchments observed increasing trends in DOC concentration in rivers, possibly linked to changes in land use and hydrologic regime.  Moreover, these studies unveiled how hydrologic variability imposes a strong control on DOC transport with streamflow producing events disproportionately contributing to the overall DOC export.  In this study, we explore the interaction between water and carbon cycles in the critical zone of an alpine catchment in order to quantify the flux of DOC exported from the soil to the stream via superficial or subsuperficial runoff. We couple the Water Age  theory to unravel the time water spends within hillslopes with the Reactivity Continuum model to quantify the degradation of DOC along the transport. The model is applied to the Oberer Seebach basin (Austria) for which extensive time series of streamflow DOC concentration and hydrological variables are available at high-frequency resolution (sub-daily measurements). For a subset of the DOC samples, the excitation emission matrices and the absorbance spectra are also available and allow deriving information on the quality and reactivity of DOC. We reproduce DOC concentration estimating the travel time distribution of water and assuming it dictates the time available for the continuous degradation of the DOC mixture. Results show that the model is able to well reproduce DOC streamflow concentration, capturing its complex relation with streamflow discharge over the three years of observations. In addition, the framework allows the estimation of the reactivity distribution of the exported DOC. To validate these results, we compare the estimated average reactivity with multiple fluorescence and absorbance indexes calculated from data, revealing significant correlations.

How to cite: Grandi, G., Bertuzzo, E., Catalán, N., Bernal, S., Fasching, C., and Battin, T. J.: Using travel time distributions and reactivity continuum to model terrestrial dissolved organic carbon export and reactivity in an Alpine catchment, EGU General Assembly 2023, Vienna, Austria, 23–28 Apr 2023, EGU23-15210, https://doi.org/10.5194/egusphere-egu23-15210, 2023.

EGU23-15553 | Posters on site | HS10.1

Study of sediment cores to establish the history of organic and inorganic contaminants through the Anthropocene 

Yolanda Picó, Yolanda Soriano, Eugenia Gimeno, and Vicente Andreu

Sediments are excellent archives for studying the long-term variations of pollutants in the environment. For this reason, records derived from the chemical analysis of sediment cores are useful to trace the history of pollutant emissions.

This study aimed to study the vertical variation of organic contaminants (OCs) and metals sediment cores collected in two sites (northern and southern part) of the L´Albufera Natural Park (Valencia, Spain) to obtain information regarding historical variation in the composition of sediments. Other sediment characteristics, such as organic matter, organic carbon content, humidity, were also studied.

A sediment core sampler (57 mm inner diameter, 1.00 m length; Beeker, Eijelkamp) was used to extract the cores from the lake of L’Albufera. The cores were sampled from boat. The sediment cores were 80–87 cm in length and 5 cm in diameter. The tubes were kept upright in a bucket with ice until they arrived at the laboratory where they were frozen. Once frozen, the tubes were cut into 8 segments of the same thickness (8 slices of 10 cm) using a stainless steel cutter. Pharmaceuticals, pesticides, poly and perfluoroalkyl substances (PFASs) and phosphorous flame retardants (PFRs) were analysed using Orbitrap Exploris 120 mass spectrometer. The compounds were extracted by different extraction methods and determined both, using wide target screening against a positive list of compounds and non-target screening applying ddMS2 of the 4 more intense ions in each cycle as well as all ions fragmentation. Both positive and negative ionization were used.

 Several pollutants, especially pesticides such as Azoxystrobin, Imazalil, Molinate, Tebuconazole, Thiabendazole and Tricyclazol were detected in the sediment in contact with water. Some infiltration of the compounds in the inner layers of sediments were also detected. Superficial sediments provide information on the actual deposited material and the actual status of pollution but the study of sediment profiles provides information on the historical variation in the composition of sediments settled. These sediments can also be used to examine pollution mechanisms, which are significant for predicting future pollution tendencies and assessing potential environmental risks.

Acknowledgments: This work has been supported by Grant RTI2018-097158-B-C31 funded by MCIN/AEI/ 10.13039/501100011033 and by “ERDF A way of making Europe” and the grant of the Generalitat Valenciana Prometeo Programme CIPROM/2021/032. Y. Soriano also thanks MCIN/AEI/ 10.13039/501100011033 and ERDF for their Predoc contract (PRE2019-089042).

How to cite: Picó, Y., Soriano, Y., Gimeno, E., and Andreu, V.: Study of sediment cores to establish the history of organic and inorganic contaminants through the Anthropocene, EGU General Assembly 2023, Vienna, Austria, 23–28 Apr 2023, EGU23-15553, https://doi.org/10.5194/egusphere-egu23-15553, 2023.

EGU23-15587 | Posters on site | HS10.1 | Highlight

Asynchronous phenological dynamics in a deciduous plantation and their implications for the seasonal and annual carbon dynamics 

Christoforos Pappas, Simone Fatichi, Nikos Markos, and Kalliopi Radoglou

Forest phenological dynamics shape the underlying biogeophysical processes and impact the carbon balance from the seasonal to inter-annual time scales. Disentangling the phenological phases of the forest components (e.g., overstory and understory), could provide novel insights on ecosystem response to climate change. This quantitative description is particularly important not only for natural ecosystems but could also assist in the design of restoration and reclamation projects. Here, focusing on a deciduous plantation (black locust, Robinia pseudoacacia L.) in a degraded land of Northern Greece and combining multiyear field observations with detailed ecohydrological modeling, we assessed the ecosystem-level carbon dynamics and its individual components from seasonal to decadal time scales. Site-level long-term (>10 yr) biophysical processes were characterized with eddy covariance measurements together with detailed meteorological and soil data. In addition, ecosystem-level phenological dynamics were quantified with timelapse imagery available at the site and satellite remote sensing. These observations were used to parameterize and validate the ecohydrological model T&C which was then used for numerical experiments. Numerical simulations allowed us to disentangle the contribution of the overstory and understory to the overall carbon dynamics at the site, a separation hard to be done by field measurements alone. The phenological phases of the understory (perennial grass) and the canopy (black locust) were found to be asynchronous, with the former reaching its peak in late winter and the latter in late summer. Ground shading by black locust together with drying of the upper soil layer during the summer months lead to the observed mismatch, with grass activity only in winter and early spring. Yet, the asynchrony in the phenological phases of understory and canopy vegetation results in overall ecosystem-dynamics that are non-negligible over winter, despite the deciduous phenology of black locust. Quantitative description of the interplay between phenological cycles of the forest components enhances our process understanding including their interactions and intra- and inter-annual dynamics. Moreover, for species widely used in forest restoration projects, like the black locust, quantifying such interplays, where the forest is more than the tree, it is important for robust carbon balance estimations.

How to cite: Pappas, C., Fatichi, S., Markos, N., and Radoglou, K.: Asynchronous phenological dynamics in a deciduous plantation and their implications for the seasonal and annual carbon dynamics, EGU General Assembly 2023, Vienna, Austria, 23–28 Apr 2023, EGU23-15587, https://doi.org/10.5194/egusphere-egu23-15587, 2023.

EGU23-16130 | Orals | HS10.1

Shrinking and swelling soil cycles control a tropical wetland flooding through non-stationary infiltration effects 

Alice Alonso, Dorine Hall, Rafael Muñoz-Carpena, and Javaux Mathieu

The Palo Verde National Park Ramsar wetland (NW Costa Rica) has witnessed a shift in vegetation from diverse vegetation and large open water areas to a near monotypic stand of cattail (Typha domingensis) with limited open water. This resulted in a sharp reduction in the bird population and biodiversity overall.

Climate and anthropogenic-driven changes in the hydrologic regime of the wetland are thought to be among the drivers of this shift.  Yet, the understanding of the drivers and processes controlling the hydroperiod of the wetland remains limited.

In this study, we aimed to characterize the hydrological dynamics of the Palo Verde wetland based on a combination of in situ monitoring stations of the groundwater and surface water levels and remote sensing satellite data. We hypothesized that the shrinking and swelling cycles of the wetland’s clay soils play a major role in controlling wetland flooding through non-stationary infiltration effects. This phenomenon might modify the flooding pattern by the tidal river bordering the wetland. First, we analyzed the trend of the hydrological time series and several hydrological indicators to interrogate and characterize the shift in the hydroperiod. Then, based on a conceptual mass balance, we estimated water infiltration at a weekly resolution, taking into account the river input by overbank flooding during high tide events. We observed that the shrinking-swelling clay soil of the wetland generated contrasted infiltration patterns at the shift between the wet and dry seasons.

This work showcases how the combination of remote sensing and ground data can help in understanding eco-hydrological dynamics and shifts in complex systems such as Palo Verde.

How to cite: Alonso, A., Hall, D., Muñoz-Carpena, R., and Mathieu, J.: Shrinking and swelling soil cycles control a tropical wetland flooding through non-stationary infiltration effects, EGU General Assembly 2023, Vienna, Austria, 23–28 Apr 2023, EGU23-16130, https://doi.org/10.5194/egusphere-egu23-16130, 2023.

EGU23-16318 | Orals | HS10.1

Ecohydrological dynamics and temporal water origin in European Mediterranean vineyards: a case study in Tuscany, Central Italy 

Paolo Benettin, Francesca Manca di Villahermosa, Andrea Dani, Matteo Verdone, Carlo Andreotti, Massimo Tagliavini, and Daniele Penna

Viticulture is an essential sector in agriculture as wine production plays a vital role in the socio-economic life of Europe. Grapevines are a valuable, long-lived species able to grow in hot and dry regions. We currently do not know whether grapevines entirely rely on deep soil water or they make substantial use of shallow water from summer precipitation events. Without knowing this, we poorly understand what fraction of summer precipitation inputs actually contributes to grapevine transpiration. This has implications for how we quantify grapevine-relevant precipitation budgets and for predicting the impacts of climate change on grape and wine production.

We investigated grapevine water use in a vineyard in the Chianti region, central Italy. During the growing season 2021, we monitored precipitation, temperature, and soil moisture at 30 and 60 cm depth. We collected over 250 samples for stable isotope analysis (hydrogen and oxygen) from rainfall, soil and plants. Since traditional plant water sampling is problematic for grapevines, we collected samples from shoots, leaves and from condensed leaf transpiration after sealed plastic bags were wrapped around some top branches. We use these alternative plant samples to reconstruct the isotopic signal in the xylem water and infer the plants’ seasonal water origin throughout the growing season.

Preliminary results show a progressive shift in the isotopic composition of sampled water. Precipitation samples fell on the Local Meteoric Water Line (LMWL) while soil samples deviated from it because of the effects of soil evaporation. The analysis of the seasonal origin of water revealed that soil water, and consequently xylem water, was mostly recharged during winter rainfall, consistently with the precipitation seasonal regime typically of the Mediterranean climate. The reconstructed xylem samples were generally less variable than soil water, indicating stable water sources, although in some occasion they were more spatially heterogeneous.  These results contribute to a better understanding of water interactions and uptake dynamics in important socio-economic agroecosystems such as vineyards.

How to cite: Benettin, P., Manca di Villahermosa, F., Dani, A., Verdone, M., Andreotti, C., Tagliavini, M., and Penna, D.: Ecohydrological dynamics and temporal water origin in European Mediterranean vineyards: a case study in Tuscany, Central Italy, EGU General Assembly 2023, Vienna, Austria, 23–28 Apr 2023, EGU23-16318, https://doi.org/10.5194/egusphere-egu23-16318, 2023.

EGU23-2931 | Posters virtual | HS10.2

Four Riparian Corridors in the Lower Colorado River Basin: New Estimates of Riparian Evapotranspiration and Consumptive Water Use 

Pamela Nagler, Armando Barreto-Muñoz, Ibrahima Sall, and Kamel Didan

Accurate estimates of riparian vegetation water use are important to quantify. In these narrow riparian landscapes, we quantify loss of water from leaves and soil as one variable, actual evapotranspiration (ETa). ETa is the most difficult component of the water cycle to measure, but remote sensing estimates of ETa have been validated for dryland riparian corridors using ground-based sensors (e.g., sap flow, tower data). Increases in ETa are indicative of increasing vegetation cover and therefore increasing ‘losses’ of water through ETa represent positive trends in riparian ecosystem health; decreasing ETa may indicate dwindling riparian cover due to less available water for canopy growth due to drought, groundwater flux, beetle defoliation, fire, increasing salinity, etc.

The objectives of this study were to calculate ETa daily (mmd-1) and annually (mmyr-1) and derive riparian vegetation annual consumptive use (CU) in acre-feet (AF) for select riparian areas of four rivers in the Lower Colorado River Basin. Select riparian reaches from the Lower Colorado, Bill Williams, San Pedro, and Virgin Rivers were delineated using digitized riparian plant area, comprised of shrubs and trees, so that we could track plant greenness using the two-band Enhanced Vegetation Index (EVI2) and ETa with Landsat for the recent decade (2014-2022). We acquired Landsat-8 OLI scenes, processed and filtered the data and computed EVI2 as a proxy for vegetation every 16-days over the study period. We then computed daily potential ET (ETo, mmd-1) using the Blaney-Criddle formula with input temperature data from Daymet (1 km), an indirect remote sensing measurement from gridded weather data. These data were then averaged over 16-days using the 8-days before- and after- the Landsat overpass date. After fusing the delineated riparian areas with 30-m resolution Landsat data, riparian ETa was quantified using the Nagler ET(EVI2) approach to produce time-series ETa data and the first CU measurements for these riparian zones. Both a digitized-vector layer and best-approximation raster-area for each of the four riparian corridors were utilized in determining the water metrics, ETa and CU, based on these two acreage estimation methods.

The average annual ETa (mmyr-1) for the Lower Colorado River decreased from ca. 950 to 800 mmyr-1 (2014-2022). The average annual ETa (mmyr-1) for the Bill Williams River decreased from ca. 925 to 600 mmyr-1 (2014-2022). The average annual ETa (mmyr-1) for the San Pedro River increased from ca. 975 to 1075 mmyr-1 (2014-2022). The average annual ETa (mmyr-1) for the Virgin River increased from ca. 675 to 825 mmyr-1 (2014-2022). The two unaltered rivers depict positive riparian ecosystem responses. We produced four estimates of CU based on the corresponding riparian areas studied, each with a digitized vector area and best-approximation raster area. Our CU estimates for these four riparian corridors range from 30,000 AF (digitized) to 37,000 AF (best-approximation) and are in the range reported for similar arid riparian areas. This study provides valuable estimates of riparian water use that may assist with decision-making by natural resource managers tasked with allocating water and managing habitat along these riparian corridors.

How to cite: Nagler, P., Barreto-Muñoz, A., Sall, I., and Didan, K.: Four Riparian Corridors in the Lower Colorado River Basin: New Estimates of Riparian Evapotranspiration and Consumptive Water Use, EGU General Assembly 2023, Vienna, Austria, 23–28 Apr 2023, EGU23-2931, https://doi.org/10.5194/egusphere-egu23-2931, 2023.

EGU23-4030 | Posters virtual | HS10.2

Measuring evapotranspiration fluxes using a tunable diode laser-based open-path water vapor analyzer 

Ting-Jung Lin, Kai Wang, Yin Wang, Zhimei Liu, Xiaojie Zhen, Xiaohua Zhang, Li Huang, Jingting Zhang, and Xunhua Zheng

Evapotranspiration (ET) is one of the essential components of the hydrological cycle of terrestrial ecosystems. Among various techniques for measuring ET, the eddy covariance (EC) is the most direct one for measuring ET fluxes at field to ecosystem scales. It has been used worldwide to monitor the biosphere-atmosphere exchanges of energy, water, and carbon, particularly in some global and regional networks (e.g., FLUXNET) for ecosystem studies.

In recent years, laser-based gas spectrometers have shown good reliability and effectiveness in the high-frequency and high-sensitivity measurement of various atmospheric trace gases. We have earlier presented a cost-effective, open-path water vapor analyzer (Model: HT1800, HealthyPhoton Co., Ltd.) suitable for EC measurement of ET based on the tunable diode laser absorption spectroscopy (TDLAS) technology. The analyzer utilizes a low-power vertical cavity surface emitting laser (VCSEL) and a near-infrared Indium Galinide Arsenide (InGaAs) photodetector in an open-path design, which avoids delay or high-frequency damping due to surface adsorption. The analyzer has a precision (1σ noise level) of 10 μmol mol−1 (ppmv) at a sampling frequency of 10 Hz. The analyzer head has a weight of ~2.8 kg and dimensions of 46 cm (length) and 9.5 cm (diameter). It can be powered by solar cells, with a total power consumption of as low as 10 W under normal operations.

Recent studies have emphasized the importance of spectroscopic effect correction for EC measurement using a laser-based open-path gas analyzer. This additional correction arises from the absorption line broadening due to atmospheric water vapor, temperature, and pressure fluctuations. In this study, we prepared two HT1800 water vapor analyzers. One is equipped with an infrared laser operating near 1392 nm and the other near 1877 nm. The water vapor line near 1392 nm is one of the most used for detecting water vapor because laser and photodetector operating near this wavelength are readily available and relatively inexpensive. However, its broadening effect, mainly caused by temperature variation, is expected to be stronger than the 1877 nm line, according to theoretical analysis using the HITRAN database.

Using the two HT1800 analyzers, we conducted two EC measurement campaigns at an agricultural site in 2022. Two commercial gas analyzers, EC150 (Campbell Scientific Inc., Logan, UT, USA) and LI-7500RS (LI-COR Biosciences, Lincoln, Nebraska, USA), were also running during the campaigns to compare with HT1800. The first purpose of this study is to test the performance of HT1800 under field conditions and evaluate its applicability for ET flux measurements. The second purpose is to quantify and compare the spectroscopic effect on the ET fluxes using the 1392 nm and 1877 nm water vapor analyzers. Meanwhile, we proposed a hypothesis that the 1392 nm analyzer can provide comparable ET fluxes with LI-7500RS and EC150 after accounting for the spectroscopic effect. If it is the case, this cost-efficient water vapor analyzer will become an effective tool for water and ecological studies in the future.

How to cite: Lin, T.-J., Wang, K., Wang, Y., Liu, Z., Zhen, X., Zhang, X., Huang, L., Zhang, J., and Zheng, X.: Measuring evapotranspiration fluxes using a tunable diode laser-based open-path water vapor analyzer, EGU General Assembly 2023, Vienna, Austria, 23–28 Apr 2023, EGU23-4030, https://doi.org/10.5194/egusphere-egu23-4030, 2023.

EGU23-4147 | ECS | Posters on site | HS10.2

Empirical Estimation of Daily Evaporation from Shallow Groundwater with a Temperature Coefficient 

Huibin Gao, Qin Ju, and Zhenchun Hao

Shallow groundwater evaporation (Eg) is a major component of the hydrological cycle, especially in semiarid and arid locations. Existing Eg estimation processes mainly rely on three approaches: direct measurements, numerical models, and empirical methods. Empirical methods are more commonly used in practical applications due to good performances with more accessible inputs and simple forms. However, most of commonly used empirical methods can only weakly represent Eg variations along the soil depth and do not consider the energy driver. Therefore, a temperature coefficient was proposed and incorporated into two preferred empirical models to characterize the impacts of soil temperature and air temperature lags on Eg. The method was evaluated using in situ daily data obtained from nonweighing bare soil lysimeters. The results indicated that the models that considered the temperature gradient variable (T) conformed to the changes in the actual Eg values with depth more appropriately than the original models, accompanied by 4.3%–8.8% accuracy improvements overall. Shallow groundwater evaporation Eg was found to be influenced by the water table depth (H), T, and pan evaporation (E0) in descending order, and strong interactions were found between H and T. Moreover, bias of Eg measurement results from precipitation was investigated; measurements from dry days without precipitation revealed the actual Eg process, the relative errors in the cumulative Eg values derived at different depths demonstrated a positive relationship with infiltration recharge, and the errors related to precipitation induced 6.7%–8.3% Eg underestimations. These results contribute to a better understanding of evaporative losses from shallow groundwater and the typical Eg situation that occurs simultaneously with recharge, and they provide promising perspectives for corresponding integrated hydrologic modeling research.

How to cite: Gao, H., Ju, Q., and Hao, Z.: Empirical Estimation of Daily Evaporation from Shallow Groundwater with a Temperature Coefficient, EGU General Assembly 2023, Vienna, Austria, 23–28 Apr 2023, EGU23-4147, https://doi.org/10.5194/egusphere-egu23-4147, 2023.

EGU23-5535 | Posters on site | HS10.2

Influence of scale in water resources management for heterogeneous African semiarid rangelands. 

Ana Andreu, Rafael Pimentel, Elisabet Carpintero, María P. González-Dugo, Hector Nieto, Timothy Dube, and María José Polo

Semiarid rangelands (grasslands with scattered trees and shrubs) are one of Africa’s most complex and variable biomes. They are a mosaic of land uses, where extensive livestock is the main economic activity, and agriculture or conservational uses are also crucial. They are highly controlled by the availability of water, e.g., pasture and rainfed crop production. Although the vegetation is adapted to variable climatic conditions and dry periods, the increase in drought intensity, duration, and frequency, the changes in agricultural practices, and other socioeconomic and environmental factors precipitate their degradation. The combined differential functioning and characteristics of the vegetation components and communities affect water dynamics, resulting in high spatiotemporal variability that creates distinct patches. Therefore, the precision, resolution, and accuracy of the information required for water management differ according to the scales of these patches: from the local to the basin. We want to assess the optimal spatiotemporal scale when monitoring semiarid mosaic vegetation cover and its water consumption.


To answer this question, we evaluated the water use patterns of the typical vegetation patches (tree+grass savanna, grassland, crop area, and creek shore) estimated by different modeling approaches (FAO56 and TSEB) with spatial resolutions of 30 m, 250 m, and 1 km. From a farm/agricultural management viewpoint, we demonstrated the need for sufficient spatial and temporal resolution when evaluating water consumption and the difficulties when significant temporal gaps are present. Higher spatial-temporal scales were crucial to determining the pasture drying cycle and crop water use. In humid or denser areas that provide essential ecosystem services (e.g., wildlife habitat), transpiration rates were higher throughout the year and often underestimated when using coarse data. Over savanna patches, products with coarse resolution (1 km) reflected well the water use pattern. These metrics reflected the severe drought experienced during the 2015-2016 seasons due to an intense El Niño event, other dry events (e.g., 2002, 2007), and the recovery time of each vegetation patch.

How to cite: Andreu, A., Pimentel, R., Carpintero, E., González-Dugo, M. P., Nieto, H., Dube, T., and Polo, M. J.: Influence of scale in water resources management for heterogeneous African semiarid rangelands., EGU General Assembly 2023, Vienna, Austria, 23–28 Apr 2023, EGU23-5535, https://doi.org/10.5194/egusphere-egu23-5535, 2023.

EGU23-6897 | ECS | Posters on site | HS10.2

Satellite Remote Sensing and Hydrological Modeling for Estimating Daily Actual Evapotranspiration in a Semi-Arid Mediterranean Ecosystem 

Hassan Awada, Mirko Castellini, Simone Di Prima, Filippo Giadrossich, Costantino Sirca, Serena Marras, Donatella Spano, and Mario Pirastru

Evapotranspiration (ET) is the process by which water is lost from the Earth's surface through the combined mechanisms of evaporation from surfaces and transpiration from plants. It is an important factor in the soil-plant-atmosphere (SPA) system and plays a key role in the functioning of ecosystems. In semi-arid regions such as the Mediterranean, ET is a major contributor to water loss. An accurate understanding of the spatiotemporal dynamics of ET is crucial for effective water resource management and conservation, particularly in the face of increasing water resource pressure and potential climate change. Remote sensing (RS) can provide long-term data with relatively high spatial and temporal resolution, which can be valuable for sustainable ecosystem management. Surface energy balance (SEB) techniques based on satellite RS data have proven useful for quantifying actual evapotranspiration (ETa eb) at various temporal and spatial scales. However, limitations such as the temporal resolution of satellite data and gaps in image acquisition due to cloud cover can limit the usefulness of RS. This study proposes a model-based approach for constructing daily crop actual evapotranspiration (ETc act) between Landsat 8 acquisition days. The modeling approach aims to simulate the dynamics in the SPA system that occur between two Landsat acquisitions in order to estimate the daily time series of ETc act. The model integrates ETa eb estimates by SEBAL model on Landsat-8 acquisition days, RS-derived vegetative biomass dynamics, field measurements of potential evapotranspiration, and a hydrological modeling approach using the transient flow Richards equation to estimate soil moisture in the root zone. The results show that the proposed approach is well suited for modeling the dynamics in the soil-plant-atmosphere system that occurs between two Landsat acquisitions to estimate the daily time series of ETc act. This approach can provide valuable information for water resource management, drought monitoring, and climate change research, moreover accurate ETc act estimates can make significant contributions to near real time irrigation modeling and scheduling.

How to cite: Awada, H., Castellini, M., Di Prima, S., Giadrossich, F., Sirca, C., Marras, S., Spano, D., and Pirastru, M.: Satellite Remote Sensing and Hydrological Modeling for Estimating Daily Actual Evapotranspiration in a Semi-Arid Mediterranean Ecosystem, EGU General Assembly 2023, Vienna, Austria, 23–28 Apr 2023, EGU23-6897, https://doi.org/10.5194/egusphere-egu23-6897, 2023.

EGU23-7291 | Orals | HS10.2

Evapotranspiration and crop water use efficiency from airborne thermal infrared data at 1 to 4 m spatial resolution 

Chiara Corbari, Nicola Paciolla, Tian Hu, Franz Kai Ronellenfitsch, Martin Schlerf, Christian Bossung, Alessandro Ceppi, Mouna Feki, Rafael Llorens, Drazen Skokovic Jovanovic, Ahmad Al Bitar, Kaniska Mallick, Josè Sobrino, and Marco Mancini

Agriculture is the largest consumer of water worldwide, accounting for about 70% of the global freshwater      withdrawals. Thus, crop water use efficiency and impacts of water stress on crop water consumption are the key concerns for agricultural water management.

Present study investigates the variability of evapotranspiration (ET) and crop water use efficiency by integrating very high spatial resolution (1 – 4 m) thermal infrared (TIR) data from airborne measurements and visible to near infrared data from Planet satellite with a numerical water-energy balance model and a diagnostic surface energy balance model.     

The analysis is done for an intensive agriculture area in central Italy near the city of Modena, where several fruit trees fields are present along with fresh vegetables. An intensive airborne campaign was organized in the summer of 2022 for three consecutive days in July. A hyperspectral TIR camera (Telops Hyper-Cam LW) has been operated at a spectral resolution of 8 cm-1, resulting in 64 wavebands, and covering a wavelength range of 850 cm-1 to 1350 cm-1 (7,39 µm – 11,8 µm).  During the 3 days of flight acquisitions, three overpasses per day are planned: 9:00, 12:30 and 16:00 h, respectively and two areas were intensively      surveyed at both 4 and 1 m spatial resolution. Planet data at 3.7 m spatial resolution were used to derive different vegetation indices, such as vegetation fraction coverage, NDVI and leaf area index. During airborne overpasses ground data of spectral reflectance, vegetation variables, LST and soil water content (SM) were collected in different fields. In addition, two different pear trees fields were monitored with an eddy covariance station and soil moisture profile measurements, respectively.

To investigate the diurnal and spatial patterns of evapotranspiration, soil moisture variability and crop water use efficiency, we used two numerical models: the surface energy balance model STIC based on Penman-Monteith and Shuttleworth-Wallace (Mallick et al., 2018) and the water-energy balance model FEST-EWB which computes continuously in time and is distributed in space soil moisture and evapotranspiration fluxes solving for a land surface temperature that closes the energy–water balance equations (Corbari et al., 2011).

Differences and similarities in ET estimates have been analysed from the two models for different soil moisture conditions and crop types, considering crop water use efficiency and water stress, and have been compared to eddy covariance measurements for accuracy evaluation considering both instantaneous and daily data. The assimilation of instantaneous estimates of ET into the water-energy balance model allowed to directly derived soil moisture maps at high spatial resolution which have been found in agreement with ground SM measurements.

How to cite: Corbari, C., Paciolla, N., Hu, T., Ronellenfitsch, F. K., Schlerf, M., Bossung, C., Ceppi, A., Feki, M., Llorens, R., Skokovic Jovanovic, D., Al Bitar, A., Mallick, K., Sobrino, J., and Mancini, M.: Evapotranspiration and crop water use efficiency from airborne thermal infrared data at 1 to 4 m spatial resolution, EGU General Assembly 2023, Vienna, Austria, 23–28 Apr 2023, EGU23-7291, https://doi.org/10.5194/egusphere-egu23-7291, 2023.

EGU23-7847 | Orals | HS10.2

Measuring and Modelling Evapotranspiration over Complex Terrain 

Oscar Hartogensis, Mary Rose Mangan, Francisca Aguirre Correa, Felipe Lobos Roco, Robin Stoffer, and Jordi Vilà-Guerau de Arellano

This contribution deals with the spatial and temporal scales involved in the processes that control evapotranspiration (ET) and confront these with the merits and limitations of various observation and modelling techniques. We make a strong case for integrated approaches to further develop our understanding of evapotranspiration.

The most challenging, but at the same time most relevant conditions to accurately represent ET are found in semi-arid regions, specifically complex terrains with strong thermal contrasts between dry and wet (irrigated) areas. We will present three cases with different objectives in terms of processes that control ET and the methods used to study them. First is the LIAISE campaign, where we will focus on how to describe ET depending on the spatial scale considered ranging from regional to landscape to local scale. Second is the E-DATA campaign, where ET is controlled by a thermally driven and topographically enhanced regional flow that alters the turbulent mixing and the structure of the atmospheric boundary layer. Third deals with a machine learning approach to determine ET based on standard weather station data.

LIAISE took place during the summer of 2021 in the Pla d’Urgell region of the Ebro River Valley in Catalonia, Spain. The surface was homogeneous at the field scale (e.g. fields of alfalfa). However, the surface was heterogeneous at the regional scale (~10-100km) because of the spatial distribution of irrigated crops and dry natural vegetation. We examined the impact of the boundary layer on surface fluxes at two of the LIAISE sites: one in the irrigated, crop-covered area and one in the dry, naturally-vegetated area.  We use an atmospheric mixed-layer column model that is heavily constrained by the surface and boundary layer observations from the LIAISE experiment.

The E-DATA experiment took place during November 2018 and focussed on quantifying the processes that drive ET in a shallow lake surrounded by extremely dry conditions in a salt flat (Salar del Huasco) of the Chilean Atacama desert. We use the WRF model at 100-m resolution to represent the local processes as well as the heterogeneity and regional transport to understand the evaporation and ABL dynamics over the water.

The machine learning study explores whether a physics-informed machine learning  approach can be used to improve the estimated evapotranspiration for irrigated fields located in a desert environment, without arbitrary tuning after training  and only using readily available data (standard meteorological data and satellite derived vegetation indices). We focus on an irrigated pecan orchard in Northwest Mexico. Multi-year eddy-covariance ET estimates are used to train and validate the model.

How to cite: Hartogensis, O., Mangan, M. R., Aguirre Correa, F., Lobos Roco, F., Stoffer, R., and Vilà-Guerau de Arellano, J.: Measuring and Modelling Evapotranspiration over Complex Terrain, EGU General Assembly 2023, Vienna, Austria, 23–28 Apr 2023, EGU23-7847, https://doi.org/10.5194/egusphere-egu23-7847, 2023.

EGU23-7856 | ECS | Posters on site | HS10.2

Quantification of soil water balance components based on lysimeter measurements 

Dóra Incze, Zoltán Barcza, and Nándor Fodor

Among other factors, water availability strongly influences the amount and quality of crop yield. International interest in sustainable management of limited freshwater supplies has resulted in increased demand for measurements and modeling methods of cropland water balance components. In order to ensure adequate and sustainable crop production, it is necessary to understand the full water cycle of crop production including evapotranspiration. The purpose of the presented research is to quantify the soil water balance components of arable lands based on an experimental platform that can provide reference data for understanding processes and for model validation. Measurements by large weighing lysimeters are commonly used to test different evapotranspiration estimation methods. The data used for the research is provided by a weighing lysimeter station that was installed in 2018 at Martonvásár in Hungary. The station consists of twelve scientific lysimeters with soil temperature, soil water content, soil water potential sensors installed at several depths in the 2 m deep undisturbed soil profiles, and an ancillary meteorological tower. Every year since 2018 different crop varieties have been grown in six lysimeters. The other six lysimeters are not cultivated and are maintained vegetation-free (bare soil). The measurements are made with high accuracy and fine time resolution (1 reading per minute). Despite our best efforts, several types of errors occurred due to various reasons. The quality assurance and quality control (QA/QC) procedures used in the research help to minimize these errors in processing lysimeter datasets. A web application also contributes to a better interpretation of the data. The poster presents the first results with case studies focusing on wheat evapotranspiration.

How to cite: Incze, D., Barcza, Z., and Fodor, N.: Quantification of soil water balance components based on lysimeter measurements, EGU General Assembly 2023, Vienna, Austria, 23–28 Apr 2023, EGU23-7856, https://doi.org/10.5194/egusphere-egu23-7856, 2023.

EGU23-8184 | ECS | Orals | HS10.2

Actual evapotranspiration differences between measurements of eddy covariance and lysimeters over grasslands 

Qiong Han, Thomas Pütz, Harry Vereecken, Tiejun Wang, Alexander Graf, Matthias Mauder, Sinikka Paulus, Sung-Ching Lee, Tarek El-Madany, Katrin Schneider, Jeremy Price, Daniel Martínez-Villagrasa, Joan Cuxart, and Jannis Groh

Accurate measurements of actual evapotranspiration (ETa) play an important role in understanding land surface processes and agricultural management. Two of the most commonly used and established methods for quantifying ETa are eddy covariance (EC) and weighable lysimeters measurements. Previous studies on hourly or daily basis indicated sometimes large differences between the ETa of the two methods (Δly-EC). It is still unclear which factors influence these differences. Here, we examine and compare half-hourly ETa measurements from EC (ETEC) and weighable lysimeters (ETly) at four different sites. The four sites span a climatic gradient from humid conditions at a pre-alpine (Fendt, DE) and a mid-mountain grassland (Rollesbroich, DE) to semi-arid conditions at two sites with a natural grass and shrub (Els Plans, ES) and a tree-grass ecosystem (Majadas de Tiétar, ES). We used a boosted regression tree method to identify environmental drivers of Δly-EC during day and night at the half-hourly resolution.

Our results revealed that substantial differences were found with a mean annual Δly-EC of 117 mm, and Δly-EC displayed obvious spatiotemporal variabilities across the sites. Energy balance non-closure of EC was found to be the most important factor contributing to the large annual Δly-EC, especially at Majadas de Tiétar site. With the distinct climatic gradient, Δly-EC was negatively correlated with mean annual wind speed and vapor pressure deficit when they reached a specific level. Monthly ETEC and ETly agreed well with Δly-EC peaking in summer at the sites in Germany, while Δly-EC peaked earlier due to the different climate in Spain. Differences in grass height caused by field management and EC footprint also affected Δly-EC, especially at daily timescales for the pre-alpine and the mid-mountain grassland ecosystem. The relative impacts of different environmental variables to half-hourly ETEC and ETly were almost the same with soil water content (SWC) being more important for nighttime ETly. Meanwhile, we found that the dominant controlling factors of daytime Δly-EC changed with climatic conditions, but nighttime Δly-EC were mainly regulated by SWC. These findings provide a critical evaluation for the roles of climatic and land surface conditions on turbulent flux dynamics from different measurements, which has important implications for ecosystem water and energy balance.

How to cite: Han, Q., Pütz, T., Vereecken, H., Wang, T., Graf, A., Mauder, M., Paulus, S., Lee, S.-C., El-Madany, T., Schneider, K., Price, J., Martínez-Villagrasa, D., Cuxart, J., and Groh, J.: Actual evapotranspiration differences between measurements of eddy covariance and lysimeters over grasslands, EGU General Assembly 2023, Vienna, Austria, 23–28 Apr 2023, EGU23-8184, https://doi.org/10.5194/egusphere-egu23-8184, 2023.

EGU23-8311 | ECS | Posters on site | HS10.2

Using spectral and thermal UAS data to infer the influence of shaded and unshaded urban vegetation on evapotranspiration and land surface temperature 

Philipp Jordan, Stenka Vulova, Alby Duarte Rocha, Dörthe Tetzlaff, and Birgit Kleischmit

As the urban population has become predominant globally, heat stress and its negative consequences on human health have grown due to increasingly dense and artificial environments. Urban green infrastructures (UGI) mitigate heat stress by providing cooling services through evapotranspiration (ET) and by blocking solar radiation through shading. Even though ET is a crucial component of urban water and energy regimes, our understanding of the role of vegetation on urban water cycling is still poor when observed through remote sensing. To better understand the seasonal and diurnal variability of ET from urban vegetation, a comprehensive sampling campaign combining an unmanned aerial aircraft system (UAS) and field-based measurements in an urban ecohydrological research observatory in Berlin (Germany) was conducted. The sampling was undertaken throughout an entire growing period (from April to October 2019) to characterize the seasonality of both climatic drivers and phenological effects on ET. Three vegetation types were sampled in the study site  (grassland, forest, and shrubs). 

Field-based measurements included sap flow and stomatal conductance (LI-6800 gas exchange), to capture monthly and diurnal dynamics of transpiration, leaf area index (LAI), grassland vegetation height as well as soil moisture. Soil moisture and sap flow were available at hourly resolution while LAI, stomatal conductance and vegetation height were measured at monthly intervals. The images were captured by UAS flights with multi-spectral (Tetracam MCA) and thermal (Flir Tau 2) cameras on a monthly basis and, on some dates, at multiple times during the day to capture diel variability. UAS data were divided into shaded and unshaded areas within the three vegetation classes. ET estimates from UAS observations were derived using the inference method based on vegetation indices (VI) as described in (Nouri et al., 2013), Eddy flux data was used to validate modeled ET and also provided hydroclimatic data . 

Results showed clear differences for ET and land surface temperature (LST) between vegetation classes throughout the year, with trees and shrubs showing lower overall temperatures and higher ET estimations than grassland during the observation period. The influence of shadow on modeled ET and observed LST also became apparent for all classes, especially when multiple UAS observations were taken during a single day. Shaded areas exhibited lower overall LST and ET than non-shaded areas, with the starkest contrast exhibited for grassland where shaded areas showed up to 50% lower LST and estimated ET was reduced by up to 25%. Both ET and LST showed correlation to the measured sap flow and stomata conductance at both diurnal and seasonal temporal scale.

Our findings provide important insights into the influence of  different urban vegetation types in both ET and LST with respect to shaded and unshaded surfaces. Our study also highlights the importance of a detailed understanding of UGI characteristics and its cooling potential for further improvements in urban green management. Moreover, it could improve models of the urban water cycle and is important for upscaling ET to a broader city scale.

How to cite: Jordan, P., Vulova, S., Duarte Rocha, A., Tetzlaff, D., and Kleischmit, B.: Using spectral and thermal UAS data to infer the influence of shaded and unshaded urban vegetation on evapotranspiration and land surface temperature, EGU General Assembly 2023, Vienna, Austria, 23–28 Apr 2023, EGU23-8311, https://doi.org/10.5194/egusphere-egu23-8311, 2023.

Although the Operational Simplified Surface Energy Balance (SSEBOP) has been successfully applied to mesoscale evapotranspiration (ET) monitoring, its spatial resolution (1000 m) is too coarse for local and regional water resource management in agricultural applications. Based on land surface temperature and Normalized Difference Vegetation Index, a novel spatio-temporal evapotranspiration fusion method considering underlying surface factors was proposed. The proposed evapotranspiration spatio-temporal fusion method was applied to the SSEBOP evapotranspiration product to obtain temporally continuous high spatial resolution 30-m ET data corresponding to the spatial resolution of the Landsat Satellite images. The middle reaches of the Heihe River Basin in China were selected for an experimental study. The accuracy difference between the fused 30-m ET and in situ measurements will be discussed here in detail. We will also discuss the differences in spatial distribution texture between the SSEBOP and spatio-temporal fusion ET results. Finally, the influence mechanism of underlying surface factors on evapotranspiration spatio-temporal fusion will be discussed.

How to cite: sun, J.: A novel spatio-temporal fusion method of evapotranspiration for SSEBOP evapotranspiration product, EGU General Assembly 2023, Vienna, Austria, 23–28 Apr 2023, EGU23-8359, https://doi.org/10.5194/egusphere-egu23-8359, 2023.

EGU23-8428 | ECS | Orals | HS10.2

Large scale two-source energy balance modelling of evapotranspiration over Mediterranean region 

Paulina Bartkowiak, Mariapina Castelli, Bartolomeo Ventura, and Alexander Jacob

Remote sensing data play an important role in understanding the spatio-temporal variations in hydro-meteorological conditions at different spatial scales. In particular, one of the key processes of hydrological cycle for monitoring water loss from space is evapotranspiration (ET). In contrast to sparsely distributed in-situ measurements, development of two surface energy balance (TSEB) models forced by satellite observations has made a significant contribution to estimate ET with global coverage. In this regard, in the framework of ESA’s 4DMED-Hydrology project, we combine Copernicus data from Sentinel-2 (S2) Multispectral Instrument (MSI) and Sentinel-3 (S3) Land Surface Temperature Radiometer (SLSTR) with ERA5 climate reanalysis dataset derived within the period 2017-2021 for daily ET retrieval at high (100 m) spatial resolution. In this work, an open-source implementation of TSEB developed in the framework of the ESA’s Sen-ET project has been applied over wide areas represented by four Mediterranean basins in Italy, Spain, France, and Tunisia (Po, Ebro, Hérault and Medjerda). Considering large volume of satellite data and high computational requirements of the Sen-ET, all processes have been optimized to be run in the automatic manner by combining multiple steps into one processing workflow utilized in cloud computing platforms offered by EODC and ESA HPC of CloudFerro. First, due to incomplete time-series of S2 Level-2A, we pre-process Sentinel-2 data for further retrieval of 100-m reflectance and biophysical parameters needed for the ET estimation afterwards. Next, we downscale S3 land surface temperature (LST) product by exploiting relationships between 1-km Sentinel-3 and time-coincident 100-m S2 reflectances using decision trees (DT) algorithm. Apart from biophysical properties (e.g., leaf area index and fractional vegetation cover) and sharpened LST data, meteorological forcings and solar radiation from ERA5 have been generated for estimating instantaneous energy fluxes and daily evapotranspiration. Based on preliminary results over Po basin, DT algorithm allowed predicting 100-m LST with the average root mean square error (RMSE) of 3.2°C when compared to ground-derived skin temperature from two eddy covariance (EC) towers. Meanwhile, turbulent fluxes driven by downscaled LST resulted in RMSE equal to 52 Wm-2 and 108 Wm-2 for sensible and latent heat fluxes, respectively. Despite some limitations mainly related to the EC locations in complex mountain areas, ET estimates forced by satellite observations have potential for providing energy fluxes at wider scale.

Keywords: evapotranspiration, Sentinel-3, land surface temperature, Mediterranean region

How to cite: Bartkowiak, P., Castelli, M., Ventura, B., and Jacob, A.: Large scale two-source energy balance modelling of evapotranspiration over Mediterranean region, EGU General Assembly 2023, Vienna, Austria, 23–28 Apr 2023, EGU23-8428, https://doi.org/10.5194/egusphere-egu23-8428, 2023.

EGU23-9385 | ECS | Orals | HS10.2

A novel method for actual evapotranspiration from a soil moisture optical trapezoid model 

Ali Mokhtari, Morteza Sadeghi, Yasamin Afrasiabian, and Kang Yu

To bypass the thermal data requirement for actual evapotranspiration (ETa) estimation in satellite remote sensing, two general approaches have been taken into practice based on previous efforts: (1) Multi-sensor data fusion for thermal sharpening and (2) the use of the process-based models such as the Penman-Monteith and Shuttleworth-Wallace equations augmented with satellite-based crop parameters. To address this issue, this study introduced an optical satellite data-based ETa estimation model, OPTRAM-ET, based on the optical trapezoid model (OPTRAM) estimates of soil moisture. The new model has been applied to Sentinel-2 and Landsat-8 images over 16 eddy covariance flux towers in the United States and Germany. The flux towers were chosen in a way to cover different ranges of landcover types, e.g., agriculture, orchard, permanent wetlands, and foothill forests. In order to assess the model in comparison to a thermal-based conventional method, the land surface temperature (LST)-vegetation index (VI) model was utilized. The results of the proposed OPTRAM-ET model showed promising performance in all the studied regions. While agricultural sites showed higher correlation due to their wider range of ETa values, error indicators were lower in foothill forests because soil moisture changes were smaller compared to irrigated and wet lands. In addition, the OPTRAM-ET model showed comparable performance to the conventional LST-VI model. The OPTRAM-ET model however does not need thermal data, and it benefits from higher spatial and temporal resolution data provided by ever-increasing drone- and satellite-based optical sensors to predict crop water status and demand. It is worth noting that the thermal sharpening step was excluded in this model which subsequently makes the model substantially less computationally demanding than a thermal-based model. Unlike the LST-VI model, which needs to be calibrated for each satellite image, a temporally-invariant region-specific calibration is possible in the OPTRAM-ET model. Importantly, the model requires further enhancement due to limitations caused by the simplified basic assumptions.

How to cite: Mokhtari, A., Sadeghi, M., Afrasiabian, Y., and Yu, K.: A novel method for actual evapotranspiration from a soil moisture optical trapezoid model, EGU General Assembly 2023, Vienna, Austria, 23–28 Apr 2023, EGU23-9385, https://doi.org/10.5194/egusphere-egu23-9385, 2023.

    Accurate estimation of high resolutions of evapotranspiration (ET) is essential to study the variation of water resources in highly heterogeneous regions, but there is a severe paucity of ET products with high spatial resolution for long time series. This research improves the PML_V2 model to estimate a 30 m resolution monthly ET, called the PML_30 model. Furthermore, it is applied to estimate the monthly ET from 2000 to 2020 in the Yarkand Oasis. The method uses a linear transformation to harmonize remote sensing data from the Landsat-5 Thematic Mapper (TM), and the Landsat-7 Enhanced Thematic Mapper (ETM+) to the Landsat-8 Operational Land Imager (OLI), resulting in multi-source Landsat data with long time series. High spatial resolution and long-time series of leaf area index, land surface emissivity, and albedo are derived from the multi-source Landsat data to produce 30 m resolution ET products. The PML_30 model and PML_V2 models were compared to the regional water balance’s multi-year average ET of 380mm. The former is estimated at 344 mm with a relative error of 0.09, whereas the latter is at 304 mm with 0.2. At the point scale, the PML_30 model’s ET was compatible with the water consumption pattern of the related plant, and the variation in groundwater. The average annual ET for the Yarkand Oasis and its lower reaches is 343 mm/yr and 168 mm/yr, respectively. Between 2000 and 2015, the ET of the lower reaches increased by 2.86 mm/yr, but between 2016 and 2020, it decreased. The proposed PML_30 model is easily applicable to a larger scale with increased estimation accuracy and is well suited for areas with high heterogeneity such as areas with sparse vegetation cover.


How to cite: Liang, T. and Yang, H.: A High-resolution Estimation of Terrestrial Evapotranspiration from Landsat Images and its Applications in a Sparse Vegetation Region, EGU General Assembly 2023, Vienna, Austria, 23–28 Apr 2023, EGU23-10312, https://doi.org/10.5194/egusphere-egu23-10312, 2023.

EGU23-10936 | Orals | HS10.2

Do eddy-covariance measurements systematically underestimate evapotranspiration of coniferous forests? Results from a paired catchment – flux tower observatory near Dresden (Germany) 

Christian Bernhofer, Thomas Pluntke, Thomas Grünwald, Maik Renner, Heiko Prasse, and Stefanie Fischer

We combine long-term hydro-meteorological data from the small research catchment Wernersbach (WB, 4.6 km², dominated by Norway spruce) in operation since 1967 and from two eddy-covariance (EC) flux towers, all located in the Tharandt Forest, Germany. This combination forms an observatory, addressing actual evapotranspiration ET from a water budget perspective (catchment) and from an energy perspective (EC flux towers). However, obvious differences exist in time resolution. The spruce dominated tower DE-Tha is located a few kilometres east of the catchment. After a windbreak of another spruce stand (situated inside the catchment) and planting of deciduous oaks, the tower DE-Hzd was set up in 2009. We recently reported systematically about the observatory and the long-term water budgets in Pluntke & Bernhofer et al. (https://doi.org/10.1016/j.jhydrol.2022.128873).

The catchment and both towers did not show any systematic differences in meteorological data (especially wind-loss corrected precipitation totals are almost identical), allowing us to address observed differences in ET as (i) due to different soil and hydrogeological characteristics as well as (ii) due to methodological aspects. The catchment term ET plus storage, derived from precipitation P minus runoff R, showed the expected high variability with a significant increase over the more than 50 years of operation. The older, spruce-dominated flux-tower DE-Tha showed much lower inter-annual variability in ET with an average annual total of 486 mm (1997 to 2019), but no significant trend. For the same period, average catchment ET was 734 mm/year. The younger flux-tower DE-Hzd showed ET values closer to catchment ET at the very dry end of the ten-year record (2010 to 2019).

For the 23 years of parallel measurements, annual ET from EC was about 250 mm lower than catchment ET, despite the careful correction of tower ET for energy balance closure. Catchment ET = P – R might have a small bias towards larger ET, as the subsurface catchment size of WB could be up to 0.4 km² smaller. In addition, precipitation and runoff may contribute to higher catchment ET. However, the difference is too large to be explained by measurement bias alone. Flux tower ET is compared to (i) independent measurements of ET components, and (ii) model output of BR90. There is evidence from interception and transpiration measurements at the flux tower that more than 100 mm of intercepted water could be missing in the annual ET from EC. Model results show a large additional contribution of interception due to negative sensible fluxes in fall and winter. The difference in ET between tower and catchment of 250 mm is probably due to a variety of reasons: overestimation of catchment ET (up to 50 mm), soil characteristics (50-100 mm), and underestimation of tower ET (100-150 mm).

We conclude that the EC closure correction during interception events needs to be revisited. Generally, results of ET monitoring of similar evergreen forests in a humid climate should be checked for missing contribution of interception, as EC records might be generally too low. This illustrates the necessity of redundant and complementary measurements when dealing with large system complexity.

How to cite: Bernhofer, C., Pluntke, T., Grünwald, T., Renner, M., Prasse, H., and Fischer, S.: Do eddy-covariance measurements systematically underestimate evapotranspiration of coniferous forests? Results from a paired catchment – flux tower observatory near Dresden (Germany), EGU General Assembly 2023, Vienna, Austria, 23–28 Apr 2023, EGU23-10936, https://doi.org/10.5194/egusphere-egu23-10936, 2023.

EGU23-11808 | ECS | Orals | HS10.2

Analysis of Scale-dependent Spatial Correlations of Actual Evapotranspiration Measured by Lysimeters 

Xiao Lu, Jannis Groh, Thomas Pütz, Harry Vereecken, and Harrie-Jan Hendricks Franssen

Actual evapotranspiration (ETa) is difficult to measure and limited long-term information is available about ETa. With eddy covariance systems ETa can be measured at the field scale, but the method is associated with energy balance closure issues. For measuring ETa, weighing lysimeters are considered to be the most accurate and reliable method. However, weighing lysimeters have some disadvantages like elevated costs of installation and maintenance, and a small footprint (e.g., about 1 m2). A main question is therefore whether the precise ETa-measurements by lysimeters are representative for a larger area like a field, a meso-scale catchment, or even a larger region. Our hypothesis was that a lysimeter provides information about ETa that represents a larger area than its underlying measurement area. To this end, we examined here the daily ETa measurements from lysimeter at four study sites across Germany (separation distances 10 - 500 km) for the years 2015 to 2020. The Pearson correlations of the standardized anomalies (SA) of daily ETa between different lysimeters were calculated and compared with SA of daily ETa obtained from the corresponding eddy covariance tower. The correlations were further analyzed and related to spatial correlations of SA of environmental controls like precipitation, potential evapotranspiration (ET0), and soil moisture. We found that SA of daily ETa shows high spatial correlations (>0.5) for considerable separation distances between sites of up to 50km, with similar correlations for lysimeters and eddy covariance systems. ET0 is the dominant factor for the spatial correlation of ETa, as SA of ET0 shows stronger spatial correlations than SA of ETa.

How to cite: Lu, X., Groh, J., Pütz, T., Vereecken, H., and Hendricks Franssen, H.-J.: Analysis of Scale-dependent Spatial Correlations of Actual Evapotranspiration Measured by Lysimeters, EGU General Assembly 2023, Vienna, Austria, 23–28 Apr 2023, EGU23-11808, https://doi.org/10.5194/egusphere-egu23-11808, 2023.

EGU23-11996 | ECS | Posters on site | HS10.2

Towards sub-daily satellite-based interception loss estimates 

Emma Tronquo, Feng Zhong, Niko E.C. Verhoest, and Diego G. Miralles

Terrestrial evaporation (E) plays a crucial role in the Earth system, acting as a link between the water and carbon cycles and playing a major role at the complex interplay between land and atmosphere. Therefore, accurate monitoring of E and its different components is crucial. However, since E cannot be observed directly from satellite sensors, current E retrieval algorithms are largely indirect and satellite-based E estimates remain highly uncertain, especially in what respects to the partitioning of evaporation into its different components. In particular interception loss (Ei), the volume of precipitation captured by plant surfaces and evaporated back into the atmosphere without reaching the ground, remains one of the most uncertain components in the global water balance. Moreover, current existing E datasets only deliver daily satellite-based Ei estimates, being unable to resolve precipitation event scales.  

The research presented here is focused on estimating Ei on a sub-daily scale. To do so, the Global Land Evaporation Amsterdam Model (GLEAM; Miralles et al., 2011) is used. GLEAM is an E model that simulates the different components (transpiration, soil evaporation, interception loss) using satellite data, including microwave observations of surface soil moisture and vegetation optical depth (VOD). We adapted GLEAM to function at sub-daily resolution, by (1) relying on sub-daily satellite-based forcing data and (2) extending the recent interception model presented by Zhong et al. (2022) by following a Rutter approach (Rutter et al., 1975) to make it applicable at sub-daily scales. This interception model calculates a running balance in time of rainfall, throughfall, evaporation and changes in canopy storage, whereby Ei is the evaporation from the wet canopy. The model is driven by satellite-observed vegetation dynamics, potential evaporation and precipitation. The sub-daily Ei estimates are compared to existing daily estimates and diurnal cycles are analyzed, and this at different spatial scales.

References:

Miralles, D. G., Holmes, T. R. H., De Jeu, R. A. M., Gash, J. H., Meesters, A. G. C. A., & Dolman, A. J. (2011). Global land-surface evaporation estimated from satellite-based observations. Hydrology & Earth System Sciences, 15, 453–469. 

Rutter, A. J., Morton, A. J., & Robins, P. C. (1975). A predictive model of rainfall interception in forests. II. Generalization of the model and comparison with observations in some coniferous and hardwood stands. Journal of Applied Ecology, 12, 367–380.

Zhong, F., Jiang, S., van Dijk, A. I. J. M., Ren, L., Schellekens, J., & Miralles, D. G. (2022). Revisiting large-scale interception patterns constrained by a synthesis of global experimental data. Hydrology & Earth System Sciences, 26, 5647–5667. 

How to cite: Tronquo, E., Zhong, F., Verhoest, N. E. C., and Miralles, D. G.: Towards sub-daily satellite-based interception loss estimates, EGU General Assembly 2023, Vienna, Austria, 23–28 Apr 2023, EGU23-11996, https://doi.org/10.5194/egusphere-egu23-11996, 2023.

Evapotranspiration (ET) is an important part of surface hydrological cycle and energy exchange process. Under the background of frequent drought and water resource shortage, it is of great significance to study the seasonal and interannual variations in ET and energy budget of farmland ecosystem in arid regions. This will help to reveal the process of crop ET and water consumption in farmland ecosystems and its response to drought conditions and environmental factors. Based on continuous eddy-covariance observation data, this study analyzed the seasonal and interannual variations in ET and energy budget of one maize farmland ecosystem in the semi-arid region of Chinese Loess Plateau and its response to environmental changes during 2019-2020. Results showed that ET and meteorological factors presented obvious seasonal and interannual changes during the study period. The annual total ET was 339.3 mm/yr and 386.5 mm/yr during the drought year 2019 and the normal year 2020, respectively. It was 16.4% and 30.4% lower than the annual total precipitation (P) in the same period. The ET/P ratio for two years was 0.84 and 0.70, respectively. While the latent heat flux and sensible heat flux showed obvious seasonal and interannual variation trends, it also reflected that the latent heat flux dominated the net radiation energy budget in the growing season and the sensible heat flux is the main consumption component of the net radiation energy budget in the non-growing season. During 2020, due to better moisture conditions, the Bowen ratio was smaller and sensible heat exchange was more moderate, making the air more stable. The volatility of albedo in 2020 was significantly greater than that in 2019, which was closely related to the frequent precipitation in the normal year. The results of the path analysis model showed that soil water content (SWC) had stronger impacts on the ET variation during the drought year (2019) at the scales of entire year, growing season and non-growing season. Meanwhile, leaf area index (LAI) had more significant impacts on the ET variation during the hydrologically normal year (2020) when the water supply was much more sufficient. We also found that there was a strong coupling relationship between the atmosphere and vegetation during the study period (decoupling factor Ω varied between 0 and 0.5), indicating that the ecosystem ET is mainly controlled by canopy conductance(gs) and vapor pressure deficit (VPD). Moreover, gs decreased with the increase of VPD, and VPD played a stronger role in controlling gs during 2020 which was with better water supply condition.

How to cite: Zheng, H. and Sun, Y.: Seasonal and interannual variations in evapotranspiration and energy budget over a rainfed maize field in the Chinese Loess Plateau, EGU General Assembly 2023, Vienna, Austria, 23–28 Apr 2023, EGU23-12065, https://doi.org/10.5194/egusphere-egu23-12065, 2023.

EGU23-12253 | ECS | Orals | HS10.2

GLEAM-HR: current state and future prospects 

Petra Hulsman, Akash Koppa, and Diego Miralles

Reliable, high-resolution evaporation data are needed for large-scale agricultural and hydrological management applications. However, field observations are too sparse to monitor large regions continuously, and satellite-based datasets are often too coarse or restricted to specific regions. An example of such satellite-based datasets is the Global Land Evaporation Amsterdam Model (GLEAM)1. GLEAM is a state-of-the-art, global evaporation product which has been widely applied over the past decade in climate studies. However, due to its coarse original resolution (0.25 degree), it has not been used in hydrological and agricultural applications until recently2. Ongoing developments have culminated in a high-resolution (HR, i.e. ~1 km) GLEAM version covering the Mediterranean region, over the 2015–2021 period. The Mediterranean region is characterised by intense human activities, different hydroclimatic conditions ranging from temperate cold to tropical, and intense seasonal rainfall at irregular spatial distributions. As a result, the region is prone to droughts, floods and landslides, making it an ideal testbed for GLEAM-HR. Here, we present current activities and future plans regarding this new dataset. Prospective plans include the extension from the Mediterranean domain to the entire European and African continents, by adopting a series of developments that have so far been confined to the coarse-scale application of the model. These include modifications in the interception module3, the incorporation of groundwater effects4, and the use of deep learning for the estimation of transpirational stress5.


1 Miralles, D. G., Holmes, T. R. H., De Jeu, R. A. M., Gash, J. H., Meesters, A. G. C. A., and Dolman, A. J.: Global land-surface evaporation estimated from satellite-based observations, Hydrol. Earth Syst. Sci., 15, 453–469, https://doi.org/10.5194/hess-15-453-2011, 2011.
2 Martens, B., De Jeu, R. A. M., Verhoest, N. E. C., Schuurmans, H., Kleijer, J., and Miralles, D. G.: Towards estimating land evaporation at field scales using GLEAM. Remote Sens., 10, 1720, https://doi.org/10.3390/rs10111720, 2018.
3 Zhong, F., Jiang, S., van Dijk, A. I. J. M., Ren, L., Schellekens, J., and Miralles, D. G.: Revisiting large-scale interception patterns constrained by a synthesis of global experimental data, Hydrol. Earth Syst. Sci., 26, 5647–5667, https://doi.org/10.5194/hess-26-5647-2022, 2022.
4 Hulsman, P., Keune, J., Koppa, A., Schellekens, J., and Miralles, D. G: Incorporating plant access to groundwater in existing global, satellite-based evaporation estimates, ESS Open Archive, https://doi.org/10.1002/essoar.10512478.1, in review, 2022.
5 Koppa, A., Rains, D., Hulsman, P., Poyatos, R., and Miralles, D. G.: A deep learning-based hybrid model of global terrestrial evaporation, Nat. Commun., 13, 1912, https://doi.org/10.1038/s41467-022-29543-7, 2022.

How to cite: Hulsman, P., Koppa, A., and Miralles, D.: GLEAM-HR: current state and future prospects, EGU General Assembly 2023, Vienna, Austria, 23–28 Apr 2023, EGU23-12253, https://doi.org/10.5194/egusphere-egu23-12253, 2023.

EGU23-12768 | ECS | Orals | HS10.2

Evapotranspiration measurements on an eroded cropland using an automated and mobile chamber system: gap filling strategies and impact of soil type and topsoil modification 

Adrian Dahlmann, Mathias Hoffmann, Gernot Verch, Marten Schmidt, Michael Sommer, Jürgen Augustin, and Maren Dubbert

In light of the ongoing global change in climatic conditions and a related trend to increases in extreme hydrological events, it is increasingly crucial to assess ecosystem resilience and - in agricultural systems - to ensure sustainable management and food security.  A comprehensive understanding of ecosystem water cycle budgets and spatio-temporal dynamics is indispensable. Evapotranspiration (ET) plays a pivotal role returning up to 90 % of ingoing precipitation back to the atmosphere. Here, we studied impacts of soil types and management on an agroecosystem's water budgets and agronomic water use efficiencies (WUEagro). To do so, a plot experiment with winter rye (September 17, 2020 to June 30, 2021) was conducted at an eroded cropland which is located in the hilly and dry ground moraine landscape of the Uckermark region in NE Germany. Along the experimental plot (110 m x 16 m), a gantry crane mounted mobile and automated two chamber system (FluxCrane as part of the AgroFlux platform within the CarboZALF-D research site) was used for the first time to continuously measure water fluxes and determine evapotranspiration. Three soil types representing the soil erosion gradient related to the hummocky ground moraine landscape (extremely eroded: Calcaric Regosol, strongly eroded: Nudiargic Luvisol, non-eroded: Calcic Luvisol) and additional soil manipulation (topsoil removal and subsoil admixture) were investigated (randomized block design, 3 replicates per treatment). Five different gap-filling approaches were used and compared in light of their potential for reliable water budgets over the entire crop growth period as well as reproduce short-term (day-to-day, diurnal) water flux dynamics. The best calibration performance was achieved with approaches based on machine learning, such as support vector machine (SVM) and artificial neural networks (with Bayesian regularization; ANN_BR), while especially SVM yielded in most reliable predictions of measured ET during validation.

We found significant differences in dry biomass (DM) and minor in evapotranspiration between soil types, resulting in different water use efficiencies (WUEagro). The Calcaric Regosol (extremely eroded) shows a maximum of around 37% lower evapotranspiration and a maximum of around 52% lower water use efficiency (WUEagro) compared to the non-eroded Calcic Luvisol.  The key period contributing to ~ 70% of overall ET of the entire growth period was from April until June (harvest), however differences in the overall ET budget (ETsum) between soil types and manipulation resulted predominantly from small differences between the treatments over the entire growth period.


How to cite: Dahlmann, A., Hoffmann, M., Verch, G., Schmidt, M., Sommer, M., Augustin, J., and Dubbert, M.: Evapotranspiration measurements on an eroded cropland using an automated and mobile chamber system: gap filling strategies and impact of soil type and topsoil modification, EGU General Assembly 2023, Vienna, Austria, 23–28 Apr 2023, EGU23-12768, https://doi.org/10.5194/egusphere-egu23-12768, 2023.

EGU23-13844 | ECS | Posters on site | HS10.2

The algorithm of remote sensing thermal imagery calibration dedicated for UAV-based hydrological studies. 

Radosław Szostak, Mirosław Zimnoch, and Przemysław Wachniew

Remote sensing measurements of land surface temperature play a key role in the estimation of evapotranspiration. Thermal cameras used in Unmanned Aerial Vehicles are prone to errors manifested by fluctuations in temperature readings of the same object on different thermal images, vignette effect, and bias against the actual temperature. These problems were addressed with the calibration algorithm. It consists of two steps: i) georeferencing of images using EXIF data, key points matching, and global optimization of relative image positions with the gradient descent method; ii) calibration of temperature offsets occurring between images by correcting sequentially for differences between values on overlapping areas of adjacent images starting from single reference image. The calibration principle is based mainly on the observation that the temperature readings from two overlapping thermal images are shifted by an offset that is approximately constant for the entire overlapping area of the images. Thanks to the algorithm used, it was possible to increase the precision of the georeferencing of aerial images to a level that allows the direct creation of a mosaic of images without the photogrammetric software and reduce the standard deviation of the water surface and vegetation temperature measurements.

Research was partially supported by the National Science Centre, Poland, project WATERLINE (2020/02/Y/ST10/00065), under the CHISTERA IV programme of the EU Horizon 2020 (Grant no 857925) and the "Excellence Initiative, Research University" program at the AGH University of Science and Technology.

How to cite: Szostak, R., Zimnoch, M., and Wachniew, P.: The algorithm of remote sensing thermal imagery calibration dedicated for UAV-based hydrological studies., EGU General Assembly 2023, Vienna, Austria, 23–28 Apr 2023, EGU23-13844, https://doi.org/10.5194/egusphere-egu23-13844, 2023.

EGU23-14103 | ECS | Orals | HS10.2

From site-scale land-atmsophere water fluxes to globally gridded products: Advances with the FLUXCOM-X framework 

Jacob A. Nelson, Sophia Walther, Basil Kraft, Weijie Zhang, Gregory Duveiller, Fabian Gans, Ulrich Weber, Zayd Mahmoud Hamdi, and Martin Jung

While eddy covariance (EC) is a standard for measuring total ecosystem evaporation (evapotranspiration, ET), upscaling from the tower to the regional and global scales is still marred with uncertainties. Here, we explore this scale translation via the FLUXCOM-X framework, which links data from EC measurements and remote sensing to machine learning techniques to produce models for generating globally gridded products. In particular, we explore potential sources of uncertainty inherent to this pipeline and how these influence the resulting gridded products: training data quality including site-selection and coverage of in-situ data, and modelling distinct water flux components (i.e., transpiration (T) and abiotic evaporation) individually compared to total evapotranspiration.

Overall, changes in the FLUXCOM-X framework compared to previous versions (Jung et al. 2019) results in tangible improvements to the spatial and temporal patterns of the global evapotranspiration products. Furthermore, the predictions of a corresponding transpiration product provide an empirical estimate of plant controlled water fluxes. The resulting global T/ET ratios are consistent with current estimates from isotopic analyses, but with the advantage of high spatio-temporal coverage. Lessons learned from this analysis provide a more targeted line of inquiry into potential avenues for further improvements in global evapotranspiration modeling.

Jung, M., Koirala, S., Weber, U. et al. The FLUXCOM ensemble of global land-atmosphere energy fluxes. Sci Data 6, 74 (2019). https://doi.org/10.1038/s41597-019-0076-8

How to cite: Nelson, J. A., Walther, S., Kraft, B., Zhang, W., Duveiller, G., Gans, F., Weber, U., Hamdi, Z. M., and Jung, M.: From site-scale land-atmsophere water fluxes to globally gridded products: Advances with the FLUXCOM-X framework, EGU General Assembly 2023, Vienna, Austria, 23–28 Apr 2023, EGU23-14103, https://doi.org/10.5194/egusphere-egu23-14103, 2023.

Interception of a Norway spruce stand was analysed based on canopy water balance measurements Emass and for Eddy Covariance (EC) related measurements. The study site is located in the Tharandt Forest (Germany) and the analysis covers a long period from 2008 to 2018. Emass was calculated as residual between gross rainfall above and net rainfall below the canopy. EC related observations are based on the water equivalent either directly measured (uncorrected) by Eddy Covariance (ETEC) or as residual in the Energy Balance equation (ETEB). Additionally, evaporation of intercepted water was modelled with the Penman-Monteith equation, which was adapted for a gradually wetted canopy (ERutter) by the use of the Rutter model. The latter approach was used to integrate the time series of all methods over the duration of modelled interception events leading to different estimates of wet canopy evaporation.

The canopy water balance from 2008 to 2018 shows a mean annual gross precipitation of 936±173mm and a mean annual interception evaporation of 376±56mm (Emass). The majority of rainfall events (81%) is characterized by a depth less than 5mm, which leads to a high fraction of annual precipitation being captured by the canopy surface (0.41). The application of the Rutter model yielded good results with a mean modelled annual interception ERutter of 361±47mm being very close to Emass. Thus, the model served as a good standard to define interception events. The water equivalent of wet canopy evaporation as the residual of the energy balance ETEB and from gas analyser measurements ETEC are both systematically underestimating Emass, to a higher extent for the winter than summer half-year. On a mean annual basis, ETEB and ETEC underestimate Emass by 145mm and 288mm, respectively. Comparing the totals over the majority of interception events, ETEB corresponds to only 72% and ETEC to only 33% of canopy water balance based measurements.

One reason for this underestimation might be a scaling problem between the interception measurement site and the flux tower footprint, which could not be resolved by the application of a simple scaling factor. A more likely explanation is the underestimation of turbulent fluxes by the EC method. The data is most affected during raining conditions with the highest gap in winter. An annual analysis of the linear relation between the sum of turbulent fluxes and available energy shows the lowest slope (0.57±0.15) for measurements during rain, while the highest slopes occur under completely dry conditions (0.76±0.03). Wet canopy conditions without rainfall seem not to be as crucial for energy imbalance as rain, but affect the closure gap for the winter half-year.

Records of EC measurements are generally too low and the magnitude of supplied sensible heat and sustained latent heat flux rates during interception events remains unclear. We conclude that gap filling and correction of both turbulent fluxes should be done separately for rain (interception) and dry (transpiration) conditions in order to determine proper amounts of evapotranspiration with the eddy-covariance method.

How to cite: Fischer, S., Moderow, U., Queck, R., and Bernhofer, C.: Rainfall interception – a year-round crucial component of evapotranspiration and potential consequences for eddy-covariance measurements. Comparing long-term measurements of canopy water budget and eddy-covariance fluxes at a Norway spruce site, EGU General Assembly 2023, Vienna, Austria, 23–28 Apr 2023, EGU23-14179, https://doi.org/10.5194/egusphere-egu23-14179, 2023.

EGU23-14383 | ECS | Orals | HS10.2

Transpiration of Acacia plantations in a managed tropical peatland Sumatra, Indonesia 

Yogi Suardiwerianto, Sofyan Kurnianto, Muhammad Fikky Hidayat, Nurcahaya Simamora, Mhd. Iman Faisal Harahap, Nurul Azkiyatul Fitriyah, Abdul Jabbar, Chandra Prasad Ghimire, and Chandra Shekhar Deshmukh

Waterlogged and anoxic conditions facilitate the preservation of carbon-rich peat layers in tropical peatlands coexisting with peat swamp forests. Peatlands in Southeast Asia, which host one-third of the tropical peatland area, have high temperatures throughout the year and high soil moisture availability, which support high evapotranspiration rates. The majority of existing land cover in Southeast Asia peatland is a canopy-covered ecosystem. Therefore, these ecosystems are considered to support high transpiration rates. However, the understanding of transpiration rates and their governing factors for existing land cover in Southeast Asia peatlands remains poorly understood due to limited measurements.

Here, we quantified transpiration rates and explored governing factors in Acacia crassicarpa plantations (fast-growing species, harvested on a 4-5 year rotation) in the coastal peatland of Eastern Sumatra, Indonesia, between 2020 and 2022. Transpiration was quantified by measuring in situ sap flow rate using the HFD8-50 and SFM1 (ICT International, Australia) during the plantation age of 2 to 4 years. We measured the sapwood cross-sectional area using an increment borer (Haglöf, Sweden). In addition, we implemented a sampling strategy that considered tree size, azimuth, height, and radial factors, to account for the variability and upscaling from tree to stand level of transpiration.

Our results showed that the greatest source of variability to determine transpiration were the radial and tree size. On a diel and daily basis, tree transpiration was affected by vapour pressure deficit and solar radiation. Further, we did not observe a relationship between seasonal rainfall variations and transpiration. We found that stand-level transpiration in deeper groundwater level sites (around -80 cm below peat surface) was higher by 20% than those in shallower sites (around -40 cm below peat surface) due to the higher stand density and total sapwood area. Overall measured transpiration rates (0.8 – 1.0 mm d-1) represent 20-24 % of evapotranspiration measured by eddy covariance. This study provides the first insights into the eco-hydrological characteristics of the Acacia crassicarpa plantation and improves the understanding of water balance from this globally important ecosystem.

How to cite: Suardiwerianto, Y., Kurnianto, S., Hidayat, M. F., Simamora, N., Harahap, Mhd. I. F., Fitriyah, N. A., Jabbar, A., Ghimire, C. P., and Deshmukh, C. S.: Transpiration of Acacia plantations in a managed tropical peatland Sumatra, Indonesia, EGU General Assembly 2023, Vienna, Austria, 23–28 Apr 2023, EGU23-14383, https://doi.org/10.5194/egusphere-egu23-14383, 2023.

EGU23-15128 | ECS | Orals | HS10.2

The contribution of remote sensing data assimilation to simulate daily evapotranspiration of irrigated and non-irrigated crops in semi-arid context 

Chloé Ollivier, Luis Olivera-Guerra, Pierre Laluet, Vincent Rivalland, Vincent Simonneaux, Jérôme Demarty, Olivier Merlin, and Gilles Boulet

Remote sensing data provide valuable information on the spatial distribution of land surface conditions and properties, such as soil moisture, soil and vegetation water status. However, the frequency and resolution of remotely sensed data vary depending on the satellite and sensor. The frequency of observation of thermal infrared that allows an estimation of evapotranspiration is carried out daily by the satellites AQUA and TERRA (res. 1km), every 2 days by Sentinel-3 (res. 1km), 8 days by LANDSAT-8 and 9 (res. 60m) and will be 3 times per period of 8 days by the satellite TRISHNA (res. 60m). In addition, there is no data on days with heavy cloud cover. In order to obtain a daily evaluation of ET, we propose to correct the trajectory of a surface model based on the water balance with the assimilation of ET data from remote sensing. The question is what are the advantages of assimilation compared to open-loop or interpolation of observation. We present our work on modelling evapotranspiration and irrigation at the field scale with the SAMIR (Satellite monitoring of irrigation) model. This is a crop water balance model forced by weather data, soil and crop parameters to simulate the daily components of the water balance. A particle filter method is implemented to assimilate evapotranspiration from remote sensing. This evaluation is performed on several types of crops (wheat, barley and olive), irrigated or not, and in a semi-arid Mediterranean context (Tunisia and Morocco). Compared to open loop simulations, data assimilation allows to quickly reduce the simulation uncertainty. On the other hand, the higher the revisit frequency, the more the simulation uncertainty depends on the observation uncertainty and the model uncertainty is reduced.

How to cite: Ollivier, C., Olivera-Guerra, L., Laluet, P., Rivalland, V., Simonneaux, V., Demarty, J., Merlin, O., and Boulet, G.: The contribution of remote sensing data assimilation to simulate daily evapotranspiration of irrigated and non-irrigated crops in semi-arid context, EGU General Assembly 2023, Vienna, Austria, 23–28 Apr 2023, EGU23-15128, https://doi.org/10.5194/egusphere-egu23-15128, 2023.

EGU23-15995 | ECS | Posters on site | HS10.2

Land surface models and vertical gradient estimation of evapotranspiration and other turbulent fluxes 

Belen Marti, Aaron Boone, Daniel Martinez-Villagrasa, Joan Cuxart, and Jeremy Price

The Land surface Interactions with the Atmosphere over the Iberian Semi-arid Environment (LIAISE) campaign took place in Catalonia near Lleida, in the northeastern part of the Iberian Peninsula. It lasted from April to October with an intensive measurement period for the last half of July, 2021, when surface conditions between a large irrigated area and the much drier surroundings was maximum. Measurements of surface energy fluxes and atmospheric and soil conditions were made over several locations which comprised several crop types in irrigated, drip irrigated and non irrigated areas. These data were used to test the quality of the approximations made when modeling in semi-arid environments.
 
Turbulent fluxes can be estimated using two measurements at different heights of the relevant atmospheric variable with statistically-based methods like Monin-Obukhov theory or simulated from LSMs (Land Surface Models). For latent heat flux, the first approach is limited by the lack of development of the necessary functions when they are used in locations with different conditions from which they were originally developed. The second requires the determination of many parameters which depend on large scale databases or a derived land cover classification to be accurate, together with an appropriate parameterization of the physical processes. Furthermore,  evapotranspiration (ET) estimates for the LIAISE sites are affected by more complex interactions such as the heterogeneity of the region, with areas irrigated by flooding (mainly corn and alfalfa) or drip irrigation (e.g. fruit trees, vineyards) verses relatively dry rain-fed surfaces (natural grass or low vegetation, bare soil), and sudden man-induced changes such as flooding or harvest.  
    
The relationship between the lower atmospheric vertical gradients and fluxes is explored and the LSM SURFEX (Surface Externalisée in French) is evaluated with field data of LIAISE to test its ability to simulate the key processes modulating the surface fluxes (notably the impact of irrigation) over several contrasting sites.

How to cite: Marti, B., Boone, A., Martinez-Villagrasa, D., Cuxart, J., and Price, J.: Land surface models and vertical gradient estimation of evapotranspiration and other turbulent fluxes, EGU General Assembly 2023, Vienna, Austria, 23–28 Apr 2023, EGU23-15995, https://doi.org/10.5194/egusphere-egu23-15995, 2023.

EGU23-16565 | ECS | Posters on site | HS10.2

Evaporation measurement and modelling of an alpine saline lake influenced by freeze–thaw on the Qinghai–Tibet Plateau 

Fangzhong Shi, Xiaoyan Li, and Deliang Chen

 Saline lakes on the Qinghai–Tibet Plateau (QTP) profoundly affect the regional climate and water cycle through loss of water (E, evaporation under ice–free (IF) and sublimation under ice–covered (IC) conditions). Due to the observation difficulty over lakes, E and its underlying driving forces are seldom studied targeting saline lakes on the QTP, particularly during the IC. In this study, E of Qinghai Lake (QHL) and its influencing factors during the IF and IC were first quantified based on six years of observations. Subsequently, two models were chosen and applied in simulating E and its response to climate variation during the IF and IC from 2003 to 2017. The annual E sum of QHL is 768.58 ± 28.73 mm, and E sum during the IC reaches 175.22 ± 45.98 mm, accounting for 23% of the annual E sum. The E is mainly controlled by the wind speed, vapor pressure difference, and air pressure during the IF, but driven by the net radiation, the difference between the air and lake surface temperatures, wind speed, and ice coverage during the IC. The mass transfer model simulates lake E well during the IF, and the model based on energy achieves a good simulation during the IC. Moreover, wind speed weakening results in an 11.14% decrease in E during the IC of 2003–2017. Our results highlight the importance of E in IC, provide new insights into saline lake E in alpine regions, and can be used as a reference to further improve hydrological models of alpine lakes. 

How to cite: Shi, F., Li, X., and Chen, D.: Evaporation measurement and modelling of an alpine saline lake influenced by freeze–thaw on the Qinghai–Tibet Plateau, EGU General Assembly 2023, Vienna, Austria, 23–28 Apr 2023, EGU23-16565, https://doi.org/10.5194/egusphere-egu23-16565, 2023.

EGU23-16933 | Posters on site | HS10.2

Air-Water Interactions Along the Dead Sea Rift 

Nadav G. Lensky, Shai Abir, Guy Tau, Hamish McGowan, and Ziv Mor

Rifts, tectonic depressions, stretches along continents and typically collect a wide variety of waterbodies, including wetlands, lakes, terminal lakes and locked seas. Here we exploit the waterbodies along the Dead Sea Rift, which vary by geo-climatic settings (from humid Mediterranean to hyper-arid), water depth, water salinity, etc., by simultaneously measuring surface heat, gas and momentum fluxes using Eddy Covariance towers. These waterbodies are subjected to similar radiative forcing. We show that in the two desert waterbodies differ significantly by surface heat flux partitioning: In the Gulf of Eilat (extension of the Red Sea), the evaporation rate is three times larger than in the Dead Sea (a hypersaline terminal lake), this is due to the effect of water salinity in reducing water vapor pressure. In the two northern water (Lake Kinneret and Agmon Hula), which resides in the more humid, Mediterranean region, the evaporation rate is suppressed by humidity, in comparison to the Gulf of Eilat. These two waterbodies differ by their depth, which determines the dynamics of evaporation, surface heat fluxes and thermoregulation. We analyze the role of the timing of the Mediterranean Sea Breeze on evaporation rate. This observational setup, of concurrent measurements of air-water interactions along the gradients within the Dead Sea Rift provides a rare opportunity to quantify various aspects of water management policies, the formation of rocks within these waterbodies, the effect of local micrometeorology and synoptic scale circulation on the waterbodies and their surroundings.

How to cite: Lensky, N. G., Abir, S., Tau, G., McGowan, H., and Mor, Z.: Air-Water Interactions Along the Dead Sea Rift, EGU General Assembly 2023, Vienna, Austria, 23–28 Apr 2023, EGU23-16933, https://doi.org/10.5194/egusphere-egu23-16933, 2023.

EGU23-1767 | Orals | HS10.3 | Highlight

Concentrative drop impacts by a bunch of canopy drips: hotspots of soil erosion in forest 

Ayumi Katayama, Kazuki Nanko, Seonghun Jeong, Tomonori Kume, Yoshinori Shinohara, and Steffen Seitz

Soil erosion induced by rainwater in forest ecosystems is mainly determined by throughfall kinetic energy (TKE) and ground vegetation cover. TKE is determined by raindrop size and velocity as well as precipitation amounts. Lateral canopy water flow paths can create localized concentrations of throughfall as impact points with considerable high TKE. At structurally mediated woody surface drip points notably bigger canopy drips can thus be formed under forest canopy. It is also assumed that TKE per 1mm rainfall amount (i.e., unit TKE) at impact locations is considerably higher than that at general locations due to increased rain drop sizes, resulting in a higher risk of soil erosion. However, the TKE and subsequent splash erosion potential at these impact locations have rarely been described in the previous literature and have not been quantified yet. The objectives of this study are (1) to evaluate the intensity of TKE and unit TKE at an impact location and (2) to compare those with general locations and freefall kinetic energy. We measured TKE using splash cups at seven points under a beech tree in a cool temperate forest, Japan, during five rainfall events in each leafed and leafless season. Five splash cups were further installed at an open area outside the forest as a reference. A rainfall collector was installed next to each splash cup, and throughfall at each point was quantified. TKE at the impact location (9142 ± 5522 J m-2) was 15.2 times higher than that at general locations under beech (601 ± 495 J m-2) and 49.7 times higher than at the open area (184 ± 195 J m-2). The ratio of TKE at the impact location to those at general locations was higher in the leafless season. Unit kinetic energy at the impact location (39.2 ± 23.7 J m-2 mm-1) was higher than those at general locations (22.0 ± 12.7 J m-2 mm-1) and at the open area (4.5 ± 3.5 J m-2 mm-1). The branch height at the impact location was lower than most areas at general locations, suggesting that higher unit TKE was induced by a bigger drop size. Our results imply that big-sized canopy drips in addition to intense throughfall amount generated at specific structurally-mediated points of the branch surface contribute far above the average to the erosion potential under the forest.

How to cite: Katayama, A., Nanko, K., Jeong, S., Kume, T., Shinohara, Y., and Seitz, S.: Concentrative drop impacts by a bunch of canopy drips: hotspots of soil erosion in forest, EGU General Assembly 2023, Vienna, Austria, 23–28 Apr 2023, EGU23-1767, https://doi.org/10.5194/egusphere-egu23-1767, 2023.

EGU23-2389 | Posters on site | HS10.3

Vegetation diversity and plant traits affect throughfall partitioning and subsequent splash erosion in managed woodlands 

Steffen Seitz, Corinna Gall, Christian Geißler, Philipp Goebes, Zhengshan Song, and Thomas Scholten

Soil erosion is a serious environmental problem in many parts of the world, especially in ecosystems with high anthropogenic influences. Even if forest stands generally mitigate soil losses, important rates of sediment transport were measured in woodlands in relation with natural and anthropogenic disturbances. Forests provide a multi-storey canopy layer which largely influences rain throughfall patterns as well as a covering layer on the forest floor which protects the soil against direct raindrop impact. Both layers provide different storage capacities and modify the water flow as well as topsoil erosivity. So far, only little research was conducted on how soil erosion control is affected by tree diversity and individual species characteristics under forest stands. Furthermore, ecohydrological processes within the protective leaf litter cover and pioneer non-vascular vegetation developing after disturbances are often not clear.

Here, we summarize results on effects of species diversity, species identity, functional traits of both the tree and the soil covering vegetation layer on soil erosion in subtropical and temperate forest ecosystems with disturbances caused by timber harvesting. We focus on interrill soil erosion determined by micro-scale runoff plots under natural and simulated rainfall and throughfall kinetic energy (TKE) of raindrops measured with splash cups.

Results show that neighbourhood diversity increases TKE, and tree species richness can partly affect sediment discharge, runoff and TKE, although this effect will presumably become more visible after an early successional forest stage. Species identity strongly influences initial soil erosion processes under forest and erosion-promoting and -mitigating species can be clearly identified. That also applies to the leaf litter cover, where single leaf species show varying influences on sediment discharge. Therefore, the appropriate choice of tree species during the establishment of reforestations plays a major role for erosion control. Interestingly, within the soil covering leaf litter layer, the presence of meso- and macrofauna increases soil erosion and thus effects of this fauna group must be considered in erosion experiments. Moreover, species-specific functional traits of trees affect soil erosion rates. High crown cover and leaf area index reduce soil erosion, whereas it is enhanced by increasing tree height. TKE is effectively minimized by low LAI, low tree height, simple pinnate leaves, dentate leaf margins, a high number of branches and a low crown base height. Finally, bryophyte-dominated biological soil crusts (BSCs) importantly mitigate sediment delivery and runoff generation in mesic forest environments and this effect varies tremendously with species specific bryophyte traits. It can be concluded that the ability of BSCs to quickly colonise soil surfaces after disturbance are of particular importance for soil erosion control in early-stage subtropical and temperate forests.

How to cite: Seitz, S., Gall, C., Geißler, C., Goebes, P., Song, Z., and Scholten, T.: Vegetation diversity and plant traits affect throughfall partitioning and subsequent splash erosion in managed woodlands, EGU General Assembly 2023, Vienna, Austria, 23–28 Apr 2023, EGU23-2389, https://doi.org/10.5194/egusphere-egu23-2389, 2023.

EGU23-2433 | Posters on site | HS10.3

Throughfall variability between oak and beech trees in a mountainous Mediterranean catchment 

Marco Dionigi, Matteo Verdone, Daniele Penna, Silvia Barbetta, and Christian Massari

Forests and trees are integral part to the global water cycle and therefore vital for water security. Forest and mountain ecosystems serve as source areas for more than 75% renewable water supply, delivering water to over half the world’s population.

Throughfall generally represents about 70% of bulk precipitation, with a much smaller portion, less than 5%, delivered to the forest floor along tree trunks (i.e., stemflow), and the remainder (~25%) intercepted by the forest canopy and evaporated back to the atmosphere.

The partitioning of water into these three pathways is largely controlled by seasonality, precipitation characteristics, meteorological conditions in addition to physiological and morphological traits related to forest composition.

This study aims to determine the spatial and seasonal variability of throughfall in oak and beech trees growing on two hillslopes of contrasting aspect in the Ussita stream basin (44 km2), Apennine Mountains, central Italy.

Throughfall was measured during 30 sampling periods between July 2022 and December 2022 at four locations by means of gutters connected to tipping buckets. characterized by different land cover, e.g., beech trees and oak trees. Specifically, two monitoring plots are located on a hillslope facing south and the monitoring two stations are located on a hillslope facing north. Moreover, two meteorological stations provide open-area precipitation measurements.

The measurements show that the leafed canopy phase reduced the amount of throughfall in all four experimental sites. In particular, beech trees exhibited the largest inter seasonal differences in throughfall partitioning. This is mainly related to the rapid defoliation characterizing the beeches’ sites starting from September.

The volumetric throughfall was higher during medium and severe rainfall events, while during low rainfall the forest canopy was found intercepting most of the precipitation. On the contrary, during severe events, the forest canopy storage capacity was saturated and most of the rainfall occurring after the saturation was converted into throughfall.

The measurements carried out during medium rainfall events indicate that the differences between canopy structure in oak and beech trees, such as the number of canopy layers and branches orientation, can strongly affect the rainfall partitioning. Oak trees, with high number of canopy layers, low seasonal defoliation and roughness of the bark, have higher canopy storage values than beech trees and are able to generate less throughfall.

Additional data to be collected during the next months will allow us to extend the results achieved in the first phase of analysis.

How to cite: Dionigi, M., Verdone, M., Penna, D., Barbetta, S., and Massari, C.: Throughfall variability between oak and beech trees in a mountainous Mediterranean catchment, EGU General Assembly 2023, Vienna, Austria, 23–28 Apr 2023, EGU23-2433, https://doi.org/10.5194/egusphere-egu23-2433, 2023.

Accurate estimation of carbon assimilation and allocation plays a significant role in the plant growth and terrestrial ecosystems. The STEMMUS-SCOPE model integrates photosynthesis, fluorescence emission, and transfer of energy, mass, and momentum in the soil–plant–atmosphere continuum system, and has good performances in estimating water, energy, and carbon fluxes. However, the plant growth states (i.e., leaf area index (LAI) and plant height (PH)) are needed as inputs for running the STEMMUS-SCOPE model, and are obtained either from interpolating observations or taking as constants over the time. As a result, the physical interactions are not adequately captured between radiative transfer, plant growth and soil water movements. The objective of this study is to consider the plant growth in STEMMUS-SCOPE model via coupling a crop growth module (i.e., WOFOST module). The coupled STEMMUS-SCOPE-WOFOST model was evaluated with plant functioning measurements. The results indicate that the simulation of LAI and PH is significantly improved and consistent with the dynamic of the water stress and gross primary production (GPP). Besides, the additional generated state variables (i.e., the biomass of root, leaf, stem as well as yield) can also agree well with the observations. Finally, the interactions between the land surface fluxes, soil moisture dynamic and plant growth are all well simulated. The STEMMUS-SCOPE-WOFOST model provides a mechanistic window to link the satellite observation of solar-induced fluorescence to above- and below-ground biomass, land surface fluxes, and root zone soil moisture, in a physically consistent manner.

How to cite: Yu, D., Zeng, Y., Wang, Y., and Su, B.: Integrated modeling of radiation transfer, plant growth, and the movement of soil moisture in the soil–plant–atmosphere continuum (STEMMUS–SCOPE-WOFOST v1.0.0), EGU General Assembly 2023, Vienna, Austria, 23–28 Apr 2023, EGU23-2531, https://doi.org/10.5194/egusphere-egu23-2531, 2023.

EGU23-2558 | Posters virtual | HS10.3

Rainwater canopy flowpath estimated by raindrop measurements 

Kazuki Nanko, Richard Keim, Sean Hudson, Munehiro Ebato, and Delphis Levia

Water flowpaths caused by incident rainfall onto forest canopy surfaces have a notable effect on the water budgets and chemistry of wooded ecosystems. The objective of this work was to use drop-size distributions in throughfall to identify canopy flowpaths at the intra-event scale and across the phenological transition from leafed to leafless states for a set of three American beech (Fagus grandifolia Ehrh.) trees and konara oak (Quercus serrata Murray) in a multilayered canopy.

Simultaneous measurements of raindrops and throughfall drops by laser disdrometers were analyzed during the transition from leafed to leafless phenophases. Throughfall was partitioned into free throughfall, splash throughfall, and canopy drip with four drop size classes. The partitioning was based on the difference of drop size distributions between open rainfall and throughfall.

Throughfall drop size distributions and volume of each throughfall type varied at both intra-event and inter-event scales. As for American beech, smaller canopy drips, <5.5 mm in diameter, were initiated earlier in rain events, whereas more rainfall accumulation was necessary to generate larger canopy drips, >5.5 mm in diameter. Smaller canopy drips were more dominant in the leafed phenophase when some structurally-mediated woody surface drip points were more muted. These results suggested throughfall from foliar surfaces generated smaller-sized canopy drip with shorter residence time, whereas throughfall from structurally-mediated woody surface drip points generated larger-sized canopy drip with longer residence time. There was also an increase in both free throughfall and splash droplets from leafed to leafless states, consistent with increased canopy gaps and direct interaction with woody surfaces in the leafless state.

Similar analysis was conducted for konara oak. More rainfall accumulation was necessary to generate larger canopy drips as with the American beech, but the amount of the larger canopy drips was stable after generation during rain events compared with smaller canopy drips. Thus, the fluctuation of throughfall amount was correlated with that of the amount of smaller canopy drips.

Based on the results, a conceptualization of the genesis and development of leaf and branch flowpaths in canopies is proposed.

This research was supported by JSPS KAKENHI (Grant numbers JP21K05837, JP17KK0159, JP15H05626). A part of the study is published in Nanko et al. (2022) in Journal of Hydrology (doi: 10.1016/j.jhydrol.2022.128144).

How to cite: Nanko, K., Keim, R., Hudson, S., Ebato, M., and Levia, D.: Rainwater canopy flowpath estimated by raindrop measurements, EGU General Assembly 2023, Vienna, Austria, 23–28 Apr 2023, EGU23-2558, https://doi.org/10.5194/egusphere-egu23-2558, 2023.

EGU23-3420 | Posters virtual | HS10.3 | Highlight

Quantity vs. Efficiency: Differing patterns of self-organized xerophytic shrubs lead to distinct rain harvesting strategies 

Chuan Yuan, Li Guo, Delphis F. Levia, Max Rietkerk, Bojie Fu, and Guangyao Gao

Canopy structure alters net precipitation inputs, partly governing the quantity of water recharging soil moisture. Clumped and scattered shrublands are structured with aggregated and isolated canopies, respectively, demonstrating contrasting self-organized patterns. However, the influence of self-organization on rain harvesting is largely unknown. Hence, we compared rainfall redistribution patterns of different self-organized shrubs of Vitex negundo and soil moisture responses during the 2020–2021 rainy seasons on the Loess Plateau of China. Our results indicated that the scattered shrubs harvested more throughfall (85.6% vs. 74.7%) and net precipitation (90.8% vs. 83.8%) than clumped shrubs. Comparatively, stemflow of clumped shrubs was initiated (57.2 vs. 60.4 min) and peaked (198.9 vs. 207.7 min) earlier, ceased later (84.4 vs. 54.5 min), lasted longer (8.9 vs. 8.4 h), transported more swiftly (397.0 vs. 373.8 mm∙h–1), and yielded a larger quantity (400.8 vs. 355.1 mL), respectively. This flux was funneled more efficiently with 160.1 vs. 140.5 fold to rain per branch, and was productive (1.768 vs. 1.346 mm‧g–1) with unit biomass investment per event. For both self-organized patterns, more throughfall led to wetter soils, but more stemflow resulted in quicker response of soil moisture. Comparatively, the top-layer soil moisture remained more stable post rain under clumped shrubs. Therefore, via canopy interception, the scattered organization was conducive for V. negundo to harvest more rain, but the clumped shrubs harvested rain more efficiently. This might relate to morphological adaptations of shrubs to resist drought and consequent formation and maintenance of self-organizations at the landscape scale.

How to cite: Yuan, C., Guo, L., Levia, D. F., Rietkerk, M., Fu, B., and Gao, G.: Quantity vs. Efficiency: Differing patterns of self-organized xerophytic shrubs lead to distinct rain harvesting strategies, EGU General Assembly 2023, Vienna, Austria, 23–28 Apr 2023, EGU23-3420, https://doi.org/10.5194/egusphere-egu23-3420, 2023.

EGU23-3577 | Orals | HS10.3

The concentration of neutral sugars in stemflow with respect to tree species and canopy phenophase 

Delphis F. Levia, Jeffrey L. Chang, and Thomas H. Epps, III

It is well known that stemflow contains soluble carbohydrates. While neutral sugars play an important role in tree metabolism, data on the concentrations of neutral sugars in stemflow are scant. Neutral sugar inputs via stemflow could influence soil solution chemistry and microbial activity in near-trunk soils. Accordingly, to fill the existing knowledge gap, this study quantifies stemflow neutral sugar concentrations with respect to tree species and phenophase. The concentrations of L-rhamnose, D-glucose, D-mannose, D-galactose, L-arabinose, and D-xylose in stemflow were determined using orbitrap liquid chromatography-mass spectrometry as a function of both tree species (Betula lenta L. [sweet birch], Fagus grandifolia Ehrh. [American beech], Liriodendron tulipifera L. [yellow poplar], and Pinus rigida Mill. [pitch pine]) and phenophase (emergence, leafed, senescence, leafless for deciduous species and emergence, leafed-spring/summer, senescence, leafed-winter for pine). Overall, the median concentrations for all sugars were higher for yellow poplar and pitch pine, and by phenophase, the leafless (or leafed-winter) phenophase had the highest (galactose, arabinose/xylose) or second highest (rhamnose, glucose, mannose) median concentrations for all sugars. We recommend the quantification of neutral sugar concentrations and fluxes in studies seeking a more comprehensive understanding of the physiological ecology of wooded ecosystems.

________________

Funding note: This research was supported by funds from the US National Science Foundation (Award No. GCR-CMMI-1934887).

How to cite: Levia, D. F., Chang, J. L., and Epps, III, T. H.: The concentration of neutral sugars in stemflow with respect to tree species and canopy phenophase, EGU General Assembly 2023, Vienna, Austria, 23–28 Apr 2023, EGU23-3577, https://doi.org/10.5194/egusphere-egu23-3577, 2023.

The capture of colloidal fine suspended particles by vegetation plays an important role in water quality of the shallow aquatic system under rainfall. Quantifying impact of rainfall intensity and vegetation condition on this process remains poorly characterized. In this study, the colloidal particle capture rates under three rainfall intensities, four vegetation densities and with submerged or emergent vegetation were investigated in different travel distance in a laboratory flume. Considering vegetation as porous media, non-Darcy’s law with rainfall as a source term, was coupled with colloid first-order deposition model, to simulate the particle concentration changes with time, determining the particle deposition rate coefficient (kd), representing capture rate. We found that the kd increased linearly with rainfall intensity; but increased and then decreased with vegetation density, suggesting the existence of optimum vegetation density. The kd of submerged vegetation is slightly higher than emergent vegetation. The single collector efficiency (η) showed the same trend as kd, suggesting colloid filtration theory well explained the impact of rainfall intensity and vegetation condition. Flow hydrodynamic enhanced the kd trend, e.g., the theoretical strongest flow eddy structure represented in the optimum vegetation density. This study is helpful for the design of wetland under rainfall, to remove colloidal suspended particles and the hazardous material, for the protection of the downstream water quality.

How to cite: Yu, C.: Capture of colloidal fine suspended particle by aquatic vegetation under rainfall, EGU General Assembly 2023, Vienna, Austria, 23–28 Apr 2023, EGU23-5699, https://doi.org/10.5194/egusphere-egu23-5699, 2023.

EGU23-6330 | Orals | HS10.3

Triple-funneling of trees? Intra-canopy preferential flow of water and elements induced by tree canopies 

Beate Michalzik, Alexander Tischer, Patrick Zerhusen, Ronny Richter, Rolf A. Engelmann, Kirsten Küsel, Christian Wirth, and Martina Herrmann

Trees affect the direction and distribution of crucial components of the hydrological cycle, which were mostly described by measurements on the quantity of precipitation, stemflow and throughfall (TF) collected underneath the canopy. However, due to poor accessibility of tree canopies, our knowledge on hydrological processes within canopies is limited. 

We propose that canopy structure shapes the spatial distribution of incoming rainfall (RF) within the canopy as well as the intra-canopy TF composition. The Leipzig Canopy Crane facility allows to (i) determine water fluxes from above the canopies (RF) and with TF at top, mid and bottom position within the canopy of three tree species – Quercus robur, Fraxinus excelsior, and Tilia cordata, and (ii) to determine the transport of dissolved and particulate organic carbon and nitrogen with TF. In total, 81 TF collectors were set up every month for a two-weeks-period from March to October 2021.

We found amplified water fluxes in TF collectors at top and mid canopy positions compared to incoming RF fluxes, while TF volumes at the bottom decreased. Dimensions of change appear related to RF amount and tree species. Moreover, stability plot analysis indicated that spatial “hot spots” of water fluxes within canopies were temporally persistent.

Our results raise the question whether the concept of a “double-funneling of trees” introduced by Johnson and Lehmann (2006) needs to be extended to a “triple-funneling” approach involving the intra-canopy preferential flow of water and elements occurring in upper to mid canopy positions. Canopy spots with higher water and matter accumulation will alter the chemical, biological, and hydrological heterogeneity in canopy habitat structures below, with strong implications for canopy-associated microbial communities and epiphytes and ecosystem functions.

How to cite: Michalzik, B., Tischer, A., Zerhusen, P., Richter, R., Engelmann, R. A., Küsel, K., Wirth, C., and Herrmann, M.: Triple-funneling of trees? Intra-canopy preferential flow of water and elements induced by tree canopies, EGU General Assembly 2023, Vienna, Austria, 23–28 Apr 2023, EGU23-6330, https://doi.org/10.5194/egusphere-egu23-6330, 2023.

EGU23-6861 | ECS | Posters on site | HS10.3

Water-related soil-moss interactions at different scales 

Corinna Gall, Martin Nebel, Thomas Scholten, Sonja M. Thielen, and Steffen Seitz

Despite being small in size, mosses fulfill vital roles in ecosystem functioning, especially in temperate ecosystems. Due to their unique ecology and physiology, they affect water and nutrient cycles, even at larger scales. This study investigated water-related interactions between soil and moss from the site scale of skid trails in temperate forests to the microscopic scale of individual structural moss traits. First, the natural succession of mosses in skid trails was surveyed, together with their effect on soil erosion using a rainfall simulator. Second, different soil-moss combinations and their impact on runoff formation, percolation, and sediment discharge were investigated. In addition, the temporal dynamics of soil water content were recorded during erosion measurements as well as during watering and subsequent desiccation. Third, a detailed study on how structural traits affect maximum water storage capacity (WSCmax) and its interactions with soil water content was conducted on the species level.

Mosses appeared in our temperate forests as biocrusts during the first few weeks after disturbance and developed for four months until they formed a mature moss cover and biocrust characteristics steadily disappeared. Soil erosion was most reduced when moss-dominated biocrusts were abundant. In general, mosses made a major contribution to erosion control in skid trails after disturbance, showing stronger impacts than vascular plants. The different soil-moss combinations showed clear variations among bare & dry, bare & wet, moss & dry and moss & wet treatments in terms of surface runoff, percolated water volume and sediment discharge. Surface runoff and soil erosion were significantly decreased in the moss treatments, while the amount of percolated water was increased; however, these processes were superimposed by desiccation cracks and water repellency. Moss treatments exhibited lower water contents over time compared to bare treatments, highlighting the strong influence of moss covers and desiccation cracks on the soil water balance. During watering of soil-moss combinations, no clear relationships between water absorption and moss structural traits could be found, which suggests capillary spaces as important influencing factor. In general, mosses were no barrier for infiltration in case of high precipitation rates and they did not store much of the applied water themselves, but passed it on to the soil. During desiccation, mosses with high leaf area index had lower evaporation rates and they prevented desiccation of the substrate, although even dense moss covers did not completely seal the surface. WSCmax of the studied moss species varied widely, which could not be explained by their total surface area or leaf area index, and higher WSCmax values were correlated with low leaf area and high leaf frequency.

Our results underlined the importance of mosses for the soil water balance and protection of soil against erosion in disturbed forest ecosystems. However, it became simultaneously apparent that the role of mosses in forest ecosystems is not yet fully understood and that there is still great potential for further research on soil-water relations and erosion control.

How to cite: Gall, C., Nebel, M., Scholten, T., Thielen, S. M., and Seitz, S.: Water-related soil-moss interactions at different scales, EGU General Assembly 2023, Vienna, Austria, 23–28 Apr 2023, EGU23-6861, https://doi.org/10.5194/egusphere-egu23-6861, 2023.

EGU23-9231 | ECS | Orals | HS10.3 | Highlight

Sheltering Effect from Floating Photovoltaics over the Waterbody-atmosphere Interface 

Baptiste Amiot, Martin Ferrand, Rémi Le berre, Javier Vidal Hurtado, and Stéphanie Giroux--Julien

Floating Photovoltaics (FPV) technology benefits from a remarkable support worldwide for two main reasons: it produces energy for a reasonable carbon budget and it has a lower land-use footprint compared to similar renewable installations. With increasing concerns about freshwater availability, a third asset is likely to boost the momentum of FPV: the potential water savings of reservoirs. As shown in Figure 1, the FPV array is made up of buoys and photovoltaic modules that are prone to reduce the energy input and the action of vapour removal on the surface of the water basin. However, giving a precise assessment of how much water would be saved is complicated, as it relies on the technology of floaters (water surface openings) and the modified physics of the water-atmosphere interface. In this case, looking at the whole system as a canopy that acts on the water-atmosphere interface seems relevant to study the evaporative levels.


This contribution proposes a new modelling approach based on Computational Fluid Dynamics (CFD) calculations to assess the amount of water vanishing into the atmosphere when a reservoir is covered by a half-open structure. A first computational domain is built in which the PV module is explicitly represented as if it were standing in the PV array, considering modules as grid-aligned obstacles (Figure 2). The airflow located below the modules is assimilated to the canopy airflow, and modifying the module geometry has an impact on the advection-diffusion processes of the vapour at the bottom of the canopy. Evaporative rates are computed and a numerical function is created to link the rates to the velocity and direction of the wind. In order to obtain the rate at the reservoir level, a second simulation is setup using a microscale domain that encompasses a reservoir partially covered by an FPV array and the surrounding lands. The numerical function is plugged into the model so that the actions of the FPV array on the atmosphere and canopy flows are conserved during the upscaling process. The methodology is supported by a case study that includes a nominal FPV module geometry. A specific reservoir is analysed, the real elements of geographic information are digitised for this purpose, and a micrometeorological station is installed in the real reservoir. Preliminary measurements show good agreement with the humidity level predicted in the atmosphere, so spatially extrapolated results are proposed to estimate reservoir-level evaporation, and a modified advection-diffusion law related to wind velocity is proposed.

By linking local-scale interactions driven by structure effects (geometries of the floating setup) and the microclimate at the reservoir level, the contribution opens the door to floating structure optimisation with respect to water savings. Moreover, it allows one to predict how the reservoir system will be altered by the half-covered situation using lake modelling (e.g., Global Lake Modelling). This aspect is critical to better predict the evolution of physical parameters below the interface that may have a strong retroaction on the interface and the atmosphere.

How to cite: Amiot, B., Ferrand, M., Le berre, R., Vidal Hurtado, J., and Giroux--Julien, S.: Sheltering Effect from Floating Photovoltaics over the Waterbody-atmosphere Interface, EGU General Assembly 2023, Vienna, Austria, 23–28 Apr 2023, EGU23-9231, https://doi.org/10.5194/egusphere-egu23-9231, 2023.

EGU23-9508 | ECS | Orals | HS10.3

Drivers of root water uptake patterns in a beech-dominated mixed forest 

Gökben Demir, Andrew J. Guswa, Janett Filipzik, Johanna Clara Metzger, and Anke Hildebrandt

Throughfall constitutes the majority of water  entering most forest ecosystems' root zones. Previous studies showed that throughfall patterns are temporally stable and influence soil moisture response to rainfall. However, their impact on soil water distribution ceases rapidly. The spatial variation in root water uptake was proposed as a reason for this decoupling throughfall and soil water patterns, but,  to the best of our knowdeldge experimental evidence is lacking. Therefore, we investigated root water uptake patterns with comprehensive field observations in an unmanaged forest site in the 2019 (April-August) growing season. The research site (1 ha) is a part of Hainich CZE in Thuringia, Germany. In the site, the tree community consists of 574 individuals of various ages (diameter at breast height ≥ 5cm). The European beech dominated site also hosts other temperate species such as Sycamore maple, European ash, and Norway maple. The field observation setup was composed of closely paired (within 1 m) throughfall and soil water content measurements at 34 locations. While soil water content was recorded every six minutes, throughfall was measured weekly. Moreover, we measured open rainfall in an adjacent open grassland (distance 250 m)  at the same time as  throughfall .

We derived root water uptake at each location from diurnal variations within the soil moisture time series. While daily average transpiration ranged between 0.9 mm d and 3 mm potential evapotranspiration changed between 1.8 mm and 3.1 mm. Further, we applied a linear mixed-effect model to identify controlling factors for horizontal patterns of root water uptake throughout the growing season. We found that temporally stable throughfall patterns do not influence root water uptake patterns. Instead, soil water distribution and vegetation features significantly influence local water uptake. We show that greater local soil water storage promoted root water uptake, slightly modulated by field capacity. Further, seasonally declined soil water storage, on average, likely shifted water extraction depth to deeper layers. A higher number of species is also related to higher root water uptake, which possibly signifies water competition among trees. Our findings suggest that elevated throughfall is neither taken up by roots nor retained in the soil matrix, probably due to local processes such as fast flow. Ultimately, the soil water availability and adaptation of co-existing trees to changes in accessible water storage regulate root water uptake patterns.

How to cite: Demir, G., Guswa, A. J., Filipzik, J., Metzger, J. C., and Hildebrandt, A.: Drivers of root water uptake patterns in a beech-dominated mixed forest, EGU General Assembly 2023, Vienna, Austria, 23–28 Apr 2023, EGU23-9508, https://doi.org/10.5194/egusphere-egu23-9508, 2023.

EGU23-9771 | ECS | Orals | HS10.3

Quercus robur and Ulmus laevis water use patterns differ significantly under drought conditions and high vapor pressure deficit in the active floodplain of the lower middle Elbe. 

Lizeth Karina Vásconez Navas, Henrik Busch, Simon Thomsen, Joscha Becker, Volker Kleinschmidt, Alexander Gröngröft, and Annette Eschenbach

Temperate hardwood floodplain forests (HFF) are highly heterogeneous and productive ecosystems threatened by anthropogenic influence and effects of global warming. Quercus robur (oaks) and Ulmus laevis (elms) are acknowledged in literature as the two highest the highest and second highest aboveground carbon biomass stores along the lower middle Elbe floodplain. Both species are adapted to the hydrological fluctuations of floodplain soils. However, in Central Europe, these hydrological fluctuations  are threatened by the IPCC (2022) expected increase of streamflow drought, soil moisture drought and lower groundwater levels, hindering key ecosystem services provided by HFF. Thus, we wanted to assess the water use patterns of both species under water limiting conditions and high vapor pressure deficit (VPD).

The study was conducted during the vegetation period of 2020 in the active floodplain of the Elbe. To understand the influence of soil texture in the soil water dynamics, two sites were selected, a sandy site located in the  high sand embankments and a loamy site, representing the low positioned sites of the floodplains. Sap flow was measured in 5 trees per species per site, using heat-ratio method devices. Additionally, 3 soil profiles per site were instrumented with volumetric water content and water tension sensors in defined depths up to 1.60 meters below ground. One week in June was selected to represent high soil water availability and one in August with less soil water availability, both periods shared similar VPD.

Both species show different reactions to soil type and water availability. Elms kept higher mean daytime sap velocity than oaks even under low water availability (~50% higher). Nonetheless, a steep decrease was recorded for the elms during August in sandy soils, what could be evidence of loss of conductivity due to cavitation. In both, the loamy and the sandy site, oaks had significantly lower mean daytime sap flow velocity than elms (E.g. in loamy soils: 13cm/h and 6cm/h, for elms and oaks respectively).  Intraspecific variability was observed for the oaks when the influence of the soil texture was considered. The oak reduced sap velocity in sandy soils significantly by approximately 50% compared to loamy soils. This indicates higher sensitivity of this species to soil texture and associated soil water potential. Furthermore, to understand the impact of soil texture on tree water use, the Jarvis model was applied. In the sandy site, under drought, the model was not able to explain the reduction in sap velocity considering potential evapotranspiration, thus under this condition soil water potential plays a stronger role in sap velocity regulation.

These results provide insights to the function that different adaptations by species and the influence of site-specific abiotic conditions could have over increased drought periods, providing information that may increment the success of restoration efforts of this ecosystem.

How to cite: Vásconez Navas, L. K., Busch, H., Thomsen, S., Becker, J., Kleinschmidt, V., Gröngröft, A., and Eschenbach, A.: Quercus robur and Ulmus laevis water use patterns differ significantly under drought conditions and high vapor pressure deficit in the active floodplain of the lower middle Elbe., EGU General Assembly 2023, Vienna, Austria, 23–28 Apr 2023, EGU23-9771, https://doi.org/10.5194/egusphere-egu23-9771, 2023.

EGU23-10350 | Orals | HS10.3

Sediment coatings reduce leaf and canopy scale photosynthesis in a salt marsh: a novel soil-plant-atmosphere linkage 

Thomas L. O'Halloran, Michelle E. Furbeck, Erik M. Smith, Thomas J. Mozdzer, and Kyle Barrett

Salt marshes gain vertical elevation to persist under sea level rise by building soil through primary production and trapping inorganic sediments.  Current models assume inorganic sediments contribute positively to marsh elevation, and that plants facilitate deposition and accretion through sediment trapping, suggesting rates of sediment trapping may be positively related to primary productivity.  Here we examine a phenomenon observed in a high salinity salt marsh estuary whereby inorganic sediments contribute to coating the Spartina alterniflora canopy and we investigate whether these coatings can inhibit photosynthesis.  Using eddy covariance observations of carbon dioxide flux, chamber measurements of leaf level photosynthesis, and measurements of leaf and canopy phenology we determined that 1) during rainless periods leaf and canopy greenness decline due to coating development, which is rinsed by rain proportionally to rain amount, 2) canopy light use efficiency declines as coatings develop for up to six days, 3) leaf level quantum use efficiency increases when coatings are removed, 4) canopy light use efficiency is weakly inversely correlated with creek salinity, 5) rinsing leaves amplifies the enhancement of canopy photosynthesis by diffuse light.  This study identifies a new mechanism in which inorganic sediments can inhibit S. alterniflora photosynthesis. Further work is needed to quantify the magnitude of the effect in terms of biomass production to determine whether this is a concern for marsh accretion.  If climate change and sea level rise enhance epiphytic coating development or residence time through, for example, creek bank erosion, sediment mobilization, or by extending rain-free periods, then this process may need to be incorporated in marsh elevation models.

How to cite: O'Halloran, T. L., Furbeck, M. E., Smith, E. M., Mozdzer, T. J., and Barrett, K.: Sediment coatings reduce leaf and canopy scale photosynthesis in a salt marsh: a novel soil-plant-atmosphere linkage, EGU General Assembly 2023, Vienna, Austria, 23–28 Apr 2023, EGU23-10350, https://doi.org/10.5194/egusphere-egu23-10350, 2023.

EGU23-10524 | ECS | Posters on site | HS10.3

Temporal Changes in Deciduous and Coniferous Stemflow Dissolved Organic Matter Composition 

Robyn O'Halloran, Delphis Levia, Jennifer Guerard, and Yu-Ping Chin

Stemflow is rainwater that runs down the trunk of trees and transport canopy derived dissolved organic matter (DOM) to the forest floor. The chemical composition of stemflow may create hot spots and hot moments of biogeochemical reactivity in the soil and water table. The amount and character of stemflow DOM throughout a 12-month period were analyzed to better understand the effect of phenophases (e.g., leafless, emergence, leafed, senescence for deciduous species and leafed-winter, emergence, leafed-spring/summer, senescence for pine) on tree-derived DOM composition. This study collected stemflow from four major species in the eastern United States, Betula lenta L. (sweet birch), Fagus grandifolia Ehrh. (American beech), Liriodendron tulipifera L. (yellow poplar), and Pinus rigida Mill. (pitch pine), on a monthly basis. A total of 157 samples were analyzed for organic carbon concentration, fluorescence, and light absorbance characteristics. Results from one of the absorbance characterizations, specific ultraviolet absorbance at 254nm, SUVA254, indicated a change in DOM composition throughout the phenophases for the four species. American beech and sweet birch increase in SUVA254 values with the lowest values occurring during emergence with progressively higher values from leafless to leafed and finally senescence phases. Pitch pine’s trend from smallest to largest values follows a different pattern beginning with leafed-winter, then leafed-spring/summer then emergence to senescence. Yellow poplar also demonstrates a different trend with no change occurring between emergence and the leafed phase with those two seasons having the smallest values, then progressively increasing in the leafless phase and then senescence. The fluorescence index (FI) values obtained demonstrate similar phenophase trends as the SUVA254 analysis except for sweet birch. The FI values for sweet birch were highest and identical in emergence and leafed, while FI successively declined between senescence and leafless phenophases. These trends indicate species and season influence sources that alter the quantity and compositional characteristics of DOM, e.g., aromatic content, which varied greatly. We are building a parallel factor analysis (PARAFAC) model based upon the total fluorescence of stemflow DOM to further investigate these changes and provide a more in-depth analysis of its chemical components throughout the different phenophases of these four trees.

Funding note: This research was supported by funds from the US National Science Foundation (Award No. GCR-CMMI-1934887).


How to cite: O'Halloran, R., Levia, D., Guerard, J., and Chin, Y.-P.: Temporal Changes in Deciduous and Coniferous Stemflow Dissolved Organic Matter Composition, EGU General Assembly 2023, Vienna, Austria, 23–28 Apr 2023, EGU23-10524, https://doi.org/10.5194/egusphere-egu23-10524, 2023.

EGU23-11214 | ECS | Posters virtual | HS10.3 | Highlight

Performance of natural mangrove structure in downstream velocity reduction as compared to engineered porcupine and geobag structure using OpenFOAM 

Riddick Kakati, Subashisa Dutta, and Santosha Dwivedy

Bank erosion is a regular occurrence along most rivers. In low-income nations such as India and Bangladesh, economical engineered structures such as porcupines and geobags have been used to counteract such erosions. Nonetheless, at times of extreme flooding, these structures often become unstable and are subsequently washed away, thereby failing to protect the banks. Vetiver grass, which ties the soil with its roots, is a natural method for preventing bank erosion. However, its flexible structure is unable to significantly reduce velocity. In this study, the OpenFOAM open-source hydrodynamic model was used to assess the efficacy of mangrove root structure in reducing flow velocity. It has been compared to single screen porcupine, dual screen porcupine, and geobag structure in terms of performance in downstream flow velocity reduction. It was observed that single screen porcupine was the least effective at reducing velocity (0.32 %), followed by dual screen porcupine (3.63 %) and single geobag (5.66 %). On the other hand, the mangrove structure was able to lower downstream velocity by 14.26%. In terms of its downstream influence, the single screen porcupine had its influence upto 3.63 cm, followed by dual screen porcupine with 5.53 cm, and single geobag with 13.03 cm. The mangrove structure influence zone on the other hand was very close to the geobag structure (11.53 cm). With its greater velocity reduction capabilities and a considerable zone of influence, mangrove plantations on riverbanks may therefore function as a cost-effective and ecologically sustainable soil erosion management strategy.

How to cite: Kakati, R., Dutta, S., and Dwivedy, S.: Performance of natural mangrove structure in downstream velocity reduction as compared to engineered porcupine and geobag structure using OpenFOAM, EGU General Assembly 2023, Vienna, Austria, 23–28 Apr 2023, EGU23-11214, https://doi.org/10.5194/egusphere-egu23-11214, 2023.

EGU23-11322 | ECS | Orals | HS10.3

Towards a representation of complex ecosystems in the ORCHIDEE Land Surface Model 

Julien Alléon, Gordon Bonan, Josefine Ghattas, Anne-Sofie Lansoe, Sebastiaan Luyssaert, Jérôme Ogée, Catherine Ottlé, Philippe Peylin, Jan Polcher, Andrée Tuzet, and Nicolas Vuichard

Complex ecosystems, such as mixed forests or savannahs, are poorly represented in Land Surface Models (LSM). Those models mainly use simple and efficient representations such as the “big leaf” model for the energy budget in order to minimize time calculation. However, this approach prevents them from modelling more complex processes such as intra-canopy climate or competition for water between different vegetation strata which are highly important processes in order to understand the behavior and the responses of complex and mixed ecosystems in a changing climate. Although some ecosystem-specific models start to represent the 3D structure of complex ecosystems, including competition for light, water and nutrient between species and vertical / horizontal organization, these approaches are still too complex to be fully included in global LSM. However, first steps can be made towards this direction by representing the exchanges and interactions of biophysical fluxes such as water, carbon and energy. This study proposes some first steps towards this direction. We refined the computation of the energy and water transfers in the soil –plant – atmosphere continuum, working both on the horizontal and vertical heterogeneity. On the water transfers side, we implemented the soil-plant-atmosphere continuum model developed by Tuzet et al. (2017) which introduces a proper representation of the water flow inside the vegetation and a stronger coupling between plant water status and stomatal conductance. On the energy budget point of view, we implemented the multi-layer energy budget developed by Ryder et al. (2016) which represents the exchanges and turbulent transport of light and energy within a canopy. Finally, those two works being adapted for site-level modelling, we introduced a sub-grid heterogeneity representation of the energy and water budget in order to implement those developments for global applications. The study focuses on the two first developments which are firstly tested over several forest sites where intra-canopy gradients of humidity and temperature have been measured. A model inter-comparison between two LSM who have developed a vertical multi-layer energy budget, ORCHIDEE and CLM5 (Lawrence et al. (2019)), and the forest model MuSICA (Ogée et al. (2003)) allowed to highlight some of the model strengths and weaknesses. Finally, the expected improvements for complex ecosystems modelling and future developments in ORCHIDEE based on those representations will be presented.

How to cite: Alléon, J., Bonan, G., Ghattas, J., Lansoe, A.-S., Luyssaert, S., Ogée, J., Ottlé, C., Peylin, P., Polcher, J., Tuzet, A., and Vuichard, N.: Towards a representation of complex ecosystems in the ORCHIDEE Land Surface Model, EGU General Assembly 2023, Vienna, Austria, 23–28 Apr 2023, EGU23-11322, https://doi.org/10.5194/egusphere-egu23-11322, 2023.

The seasonal variation of precipitation intensity in continental semi-arid flatlands determines the shifting influence of interception in the throughfall and soil moisture regimes under distinct vegetation covers including conifer, broadleaved, grassland and rainfed croplands (i.e., wheat). In a study case located at Sierra de Atapuerca, in the high plains of North Spain, where continental climate defines a very contrasting precipitation intensity between the cold and warm season, the study analyzes the seasonal difference between the low and high energy rain drops affecting throughfall and soil moisture recharge levels along the year. Results identify the distinct response of throughfall, and the subsequent soil moisture change to distinct rainfall events and its consequences for the sustainability of surface conditions afterwards. The study outcomes highlight the major role of vegetation type on modulating the throughfall and soil moisture evolution which influences the exposure of the surface to soil erosion. Snow remarkably distorts the throughfall/interception balance between seasons, representing a third type of alteration, particularly for soil moisture, concerning the vegetation cover. Secondary atmospheric variables such as relative humidity and radiation also seem influential in the soil moisture anomalies and soil surface developing under the different vegetation covers of this environment. The type of canopy cover additionally influences the interaction between different levels of the soil moisture profile which subsequently determines the resilience to drought of the vegetation cover. Consequently, the study contributes to understanding the reciprocal interaction between vegetation and hydrology in the definition of surface processes and land-surface sustainability.

How to cite: Gaona Garcia, J.: Differences in the interception/throughfall balance and its influence on soil moisture regimes under forest, grassland and cropland canopies of a semi-arid continental flatland., EGU General Assembly 2023, Vienna, Austria, 23–28 Apr 2023, EGU23-12115, https://doi.org/10.5194/egusphere-egu23-12115, 2023.

EGU23-12588 | ECS | Posters on site | HS10.3

Modelling sub-canopy landscape-scale shortwave radiation in Eucalyptus forests using a modified Beer-Lambert law combined with airborne LiDAR 

Christopher Lyell, Petter Nyman, Thomas Duff, Glenn Newnham, Assaf Inbar, Patrick Lane, Tegan Brown, and Gary Sheridan

In forest systems, direct shortwave radiation (SWR) plays a vital role in fundamental energy and water processes that require high-resolution modelling at the landscape scale. We propose an alternative approach to modelling high resolution, landscape scale, direct SWR transmittance through forest canopies. This approach utilises airborne LiDAR (AB LiDAR) to calibrate a modified Beer-Lambert Law. Over a three-year period, we established the most comprehensive spatial and temporal sub-canopy dataset of 1-minute pyranometer measurements over 31 diverse sites with varying forest densities and age classes in south-eastern Australia. Measuring below canopy SWR at sub-daily and seasonal variations in zenith angle, as well as peak daily and accumulative radiation loads. The modified Beer-Lambert Law (Rbc = Race-kL), utilises path length through the canopy (L) and AB LiDAR as a representation of the sun's beam to measure transmittance (Rbc/Rac) of above canopy (Rac) to below canopy (Rbc) radiation; To calculate a site-specific extinction coefficient (k). This approach links the theoretical framework of the Beer-Lambert law with the canopy penetrating properties of AB LiDAR, allowing for large-scale spatial extrapolation of SWR transmittance in forest canopies. This differs from previous studies, which either: apply the Beer-Lambert law or the LiDAR penetrating properties separately, use AB LiDAR to represent the vegetation structure from which a Leaf Area Index (LAI) is calculated and transmittance modelled using specific leaf projection functions, or use computationally intense approaches such as ray tracing. These approaches have limitations as they either require site-specific calibration at the point scale, don’t account for seasonal variations in beam penetration angle, are difficult to parameterise across the landscape, or are too computationally intense to feasibly run at the landscape scale. The proposed model combined with LiDAR calibration addresses these limitations as the path length changes with zenith angle, and the calibration of the extinction using LiDAR allows for landscape-level parameterisation in a computationally friendly workflow. With the expanding availability of AB and spaceborne LiDAR, the linking of the penetrating properties of LiDAR with the theoretical concept of the Beer-Lambert law will allow below canopy direct SWR to be modelled with improved accuracy at large scales over daily and seasonal timespans. This improves our ability to model radiation loading below forest canopies across diverse landscapes and terrains, improving the modelling of hydrological, micro-climate, energy and water processes.

How to cite: Lyell, C., Nyman, P., Duff, T., Newnham, G., Inbar, A., Lane, P., Brown, T., and Sheridan, G.: Modelling sub-canopy landscape-scale shortwave radiation in Eucalyptus forests using a modified Beer-Lambert law combined with airborne LiDAR, EGU General Assembly 2023, Vienna, Austria, 23–28 Apr 2023, EGU23-12588, https://doi.org/10.5194/egusphere-egu23-12588, 2023.

EGU23-110 | ECS | Orals | HS10.4

High-resolution water and stable isotope dynamics in drought-stressed urban vegetation 

Ann-Marie Ring, Dörthe Tetzlaff, Maren Dubbert, and Chris Soulsby

Urban green spaces are highly valuable in supporting the climate and infrastructure of cities through rainwater retention, evaporative cooling and shading. Investigating the diurnal and seasonal ecohydrological process dynamics in the urban soil-plant-atmosphere continuum is crucial to understand what types of landcover might best balance water re-distribution for a particular urban landscape providing cooling effects whilst not compromising groundwater recharge.

Stable water isotopes are very useful tools to investigate these complex interactions between soil properties, plant physiology and atmospheric drivers. In 2022, we conducted an experimental study looking at the complex patterns of the urban soil-plant-atmosphere interface at high temporal resolution at an urban tree stand and a grassland in Berlin, Germany during an entire growing season. To assess atmospheric moisture demand and vegetation water dynamics, we performed novel in-situ and real-time sequential measurements in the field at different heights in tree xylem and in the atmosphere. This was complemented by destructive sampling of soil water isotopes from multiple depths and eddy flux measurements at an open field near the sites.

We could identify clear evaporative and drought signals in the different water cycle components, including the extensive summer drought across continental Europe in July and August 2022. Results showed faster and larger responses to precipitation inputs in the upper soil moisture signal at the grassland. Atmospheric fluxes indicated clear evaporative losses just above the grass (15 cm height). Underneath tree canopies, upper soils responded more slowly to precipitation inputs and the atmospheric profile showed more homogenous spatio-temporal distribution of water vapour signals. Xylem water dynamics revealed contrasting diurnal and seasonal variations in different tree species and tree heights. Plant water sources were mostly drawn from deeper soil (70 cm) horizons. During the extended period of water scarcity in August, drought signals came from enriched atmospheric water vapour and low sap flux.

This knowledge of the water dynamics under different drought-stressed urban vegetation is extremely useful for the development of isotope aided ecohydrological models and allows science-based evidence for sustainable urban planning tackling climate change and urban densification.

How to cite: Ring, A.-M., Tetzlaff, D., Dubbert, M., and Soulsby, C.: High-resolution water and stable isotope dynamics in drought-stressed urban vegetation, EGU General Assembly 2023, Vienna, Austria, 23–28 Apr 2023, EGU23-110, https://doi.org/10.5194/egusphere-egu23-110, 2023.

EGU23-166 | ECS | Orals | HS10.4

Stable isotope-based understanding of water fluxes in the critical zone at the forest plot scale under Mediterranean climate 

Loujain Alharfouch, Pilar Llorens, Juan J. Hidalgo, Rafael Poyatos, Pauline Saurat, and Jérôme Latron

How, why, and what water flows through the soil-plant continuum are quite complex questions that are not yet well understood quantitatively. Soil and plant-induced heterogeneity, soil evaporation, and root water uptake are some of the main controlling factors of water flow dynamics in the soil-plant continuum. Coupling these processes is thus of quite importance to advance our understanding of subsurface mixing and soil-plant interaction and, especially, water sources used by trees. In this study, we combine hydrological and stable water isotopes (2H and 18O) field data in an integrated flow and transport model to investigate which water sources are used up by trees under different wetness conditions.

We conducted a field experiment on two sets of three Scots pine trees (Pinus sylvestris) in a forested plot within the Vallcebre research catchments (NE Spain). The experiment was carried out from May to September 2022. We monitored throughfall, sap flow, and dial stem diameter variation, as well as soil water potential and soil water content (in vertical profiles down to 70cm) at high temporal (5min) resolution. Furthermore, we sampled weekly water from the different water pools (throughfall, soil water (bulk and mobile), groundwater, and xylem water (twigs)) for isotopic analysis. The analysis of these data helped in clarifying the interaction between the different water pools and the effect of soil water potential and soil water content dynamics on the isotopic signals in the soil-plant continuum.

To further analyze the field data, we developed a numerical model using R-SWMS to simulate the flow in the vadose zone by solving Richards equation coupled with root water uptake, soil evaporation, and isotopic fractionation. To achieve this, we created a 3-D heterogeneous soil matrix that contains a root system. Field data (soil water retention and conductivity curves, initial water content, environmental conditions) from this and previous studies conducted in the catchment were used as the input data. The root system and its hydraulic properties were determined from theoretical values from literature. The isotopic fractionation during evaporation was modelled using the Craig-Gordon model. The model was used to estimate root water uptake distribution, soil water potential, soil water content, and isotopic composition distribution.


How to cite: Alharfouch, L., Llorens, P., Hidalgo, J. J., Poyatos, R., Saurat, P., and Latron, J.: Stable isotope-based understanding of water fluxes in the critical zone at the forest plot scale under Mediterranean climate, EGU General Assembly 2023, Vienna, Austria, 23–28 Apr 2023, EGU23-166, https://doi.org/10.5194/egusphere-egu23-166, 2023.

EGU23-294 | ECS | Orals | HS10.4

Interspecific interaction and species identity effects on water uptake of beech and spruce trees by using stable isotope labelling 

Laura Lee Kinzinger, Judith Mach, Simon Haberstroh, Maren Dubbert, Markus Weiler, Natalie Orlowski, and Christiane Werner

Understanding the interactions within the soil-plant-atmosphere-continuum becomes more important considering the eco- and hydrological impacts of climate change. Especially stand specific flow pathways and the characteristic timescales of water movement potentially provide important information on drought resilience of different forest ecosystems. This study analysed tree stand specific water uptake dynamics through water stable isotopy at high temporal resolution for two isotopic labelling events (7mm with δ2H +1000 ‰ and 23mm with δ2H +800‰) during the 2022 drought in south-west Germany. Measurements in pure and mixed tree stands of European beech (Fagus sylvatica, n=18) and Norway spruce (Picea abies, n=18) included sap flow, in-situ water isotopy of soil and xylem water, radial stem growth and microclimatic conditions. Our central hypothesis is that species identity and water competition between tree species are major drivers for ecohydrological flux dynamics. The results of the two labelling events showed differences in label water uptake of the two tree species and the transit times of the label in the system. The labelling events showed different transit times in the tree xylem depending on the label intensity. P. abies showed a slightly higher uptake of shallow soil water label in mixed stands than in pure patches. When labelled water infiltrated into deeper soil layers water was taken up faster by F. sylvatica in mixed forest patches than in pure forest patches and showed a generally slower uptake in P. abies than in F. sylvatica. The faster response time in water uptake during the second labelling was supported through an increase in measured sap flux and modelled branch water potential. Those dynamics of water isotopy measured in a high temporal resolution allow for a better understanding of root water uptake dynamics and water use strategies but also show species interaction effects on ecohydrological fluxes.

How to cite: Kinzinger, L. L., Mach, J., Haberstroh, S., Dubbert, M., Weiler, M., Orlowski, N., and Werner, C.: Interspecific interaction and species identity effects on water uptake of beech and spruce trees by using stable isotope labelling, EGU General Assembly 2023, Vienna, Austria, 23–28 Apr 2023, EGU23-294, https://doi.org/10.5194/egusphere-egu23-294, 2023.

EGU23-698 | ECS | Posters on site | HS10.4

Which water do beech and chestnut trees prefer? Insights from a stable isotope approach in a small pre-alpine catchment 

Diego Todini, Giulia Zuecco, Chiara Marchina, Daniele Penna, and Marco Borga

*Corresponding author, email: diego.todini@iusspavia.it


Stable isotopes are tracers used for the investigation of water flow paths, the quantification of the relative contribution of water sources to stream runoff or root water uptake, as well as to determine the spatial and temporal origin of water exploited by plants for transpiration. Previous studies have shown that uncertainties associated to samplings, soil and plant water extraction methods and the spatial variability in the isotopic composition of the water sources in a catchment can hamper the understanding of water cycling and the interactions between soil and plants.

In this work, we used isotopic data collected during four growing seasons in a small forested catchment in the Italian pre-Alps to i) investigate the spatial and temporal variability of the isotopic composition of the sampled water sources, ii) determine the seasonal origin of the water sources, and iii) quantify the contribution of soil water to the root water uptake of beech and chestnut trees.


The ecohydrological monitoring took place in the 2.4-ha Ressi catchment. Elevations are comprised between 598 and 721 m a.s.l., and the climate is temperate humid. The catchment is covered by a deciduous forest, with beech, chestnut, hazel and maple as the main tree species.

Water samples for isotopic analysis were taken monthly from bulk precipitation, approximately bi-weekly from stream water, shallow groundwater and soil water by two suction lysimeter cups in the riparian zone. Plant water and bulk soil water samples were extracted by cryogenic vacuum distillation bi-weekly during summer. All water samples were analysed by laser spectroscopy, except plant water that was analysed by mass spectrometry.


Results show that stream water, groundwater and soil water extracted by suction lysimeters were isotopically similar to precipitation, and on average they had an autumn or spring origin. Bulk soil water obtained by cryogenic vacuum distillation showed an evaporation signature, particularly on the hillslope sites where soil moisture was lower. At greater depths, bulk soil water extracted by cryogenic vacuum distillation was slightly less evaporated and less enriched in heavy isotopes compared to soil water extracted from shallow layers. Plant water was more similar to soil water extracted by cryogenic vacuum distillation, and mainly had a summer origin. Riparian trees tended to take up more water from shallow soil layers, whereas hillslope trees had a slightly larger preference for deep bulk soil water, particularly during the driest months.

Our results suggest that, in the study area, trees likely use more bulk soil water than the mobile soil water, groundwater and stream water, and the preference for more shallow or deep soil water is likely due to the different rooting depth of the vegetation in the hillslope and the riparian zone.


Keywords: stable isotopes; soil water; plant water; forested catchment; cryogenic vacuum distillation.

How to cite: Todini, D., Zuecco, G., Marchina, C., Penna, D., and Borga, M.: Which water do beech and chestnut trees prefer? Insights from a stable isotope approach in a small pre-alpine catchment, EGU General Assembly 2023, Vienna, Austria, 23–28 Apr 2023, EGU23-698, https://doi.org/10.5194/egusphere-egu23-698, 2023.

Within arid and semi-arid ecosystems, water availability is crucial in determining the growth and distribution of plants due to intense evaporation and limited precipitation. Ecological water conveyance has now become an important measure to mitigate the ecological degradation of plants in arid and semi-arid regions. However, different from water conveyance during growing seasons, there has been little research directly exploring the response of water use strategies of plants to ecological water conveyance during the non-growing season. In this context, whether and how non-growing season water conveyance can be used by lakeshore plants in the following growing seasons are interesting issues. Previous studies in regional scale and simple site scale have shown that plant growth can be influenced by ecological water conveyance during non-growing seasons in regional scale and simple site scale. However, the mechanisms of storage and transformation of water conveyed during the non-growing season and the extent and scope of the impact of non-growing season water conveyance are still unclear. To deepen the understanding of plants' adaptation to water conveyance during non-growing seasons, a comprehensive approach of water availability exploration and stable isotope (D, 18O) tracer model (MixSIAR) was used to analyze the water use strategies of typical plants (Phragmites australis, Nitraria tangutorum, Haloxylon ammodendron, and Peganum harmala L.), and the Qingtu Lake was taken as the study area, which is the terminal lake of the Shiyang River, China. Results indicate that water extraction depths of plants tend to deepen with the increase of the distance from the lake, and for the central areas, Phragmites australis mainly use almost saturated soil water or lake water nearby; for the transitional areas, the depth of water extraction by Phragmites australis, Nitraria tangutorum, and Peganum harmala L. was significantly changed from different depths of soil water during the growing season; for the almost no influence areas, the depths of water extraction by Phragmites australis, Nitraria tangutorum, and Haloxylon ammodendron were more evenly distributed over the whole soil profile, with no significant change during different seasons. Combining the monitoring data of water table depth, soil temperature, volumetric soil water content, and the survey data of soil texture, we realized that: water conveyance during the non-growing season in late summer and early autumn rapidly forms recharge for groundwater and soil water, while the soil texture characteristics of sandy and clay distributed in mutual layers and the seasonal freeze-thaw phenomenon from late November to early April create conditions for the storage of this water, thus providing support for water needs of the plant sprouting in spring and plant growth in summer. Our results provide insight into the storage and transformation mechanisms of non-growing season water conveyance for plant uptake and utilization in arid regions and have practical implications for the scientific management of ecological water conveyance in arid regions.

How to cite: Wang, J. and Sun, Z.: How does water conveyance during non-growing seasons affect the water use strategy of lakeshore plants in arid northwestern China?, EGU General Assembly 2023, Vienna, Austria, 23–28 Apr 2023, EGU23-4197, https://doi.org/10.5194/egusphere-egu23-4197, 2023.

EGU23-4203 | Orals | HS10.4

Assessing the temporal origin of root water uptake and drainage water using a virtual tracer experiment in HYDRUS-1D 

Paolo Nasta, Tiantian Zhou, Christine Stumpp, Jirka Simunek, and Nunzio Romano

The temporal origin of root water uptake and drainage provides insights into the impact of natural and anthropogenic disturbances on plant resilience and aquifer vulnerability. In-situ and virtual tracer experiments provide information on rainfall partitioning and transit times, which help to enhance the understanding of the hydrological response of a soil-plant-atmosphere continuum (SPAC) to climate variability and contaminant transport. A virtual tracer experiment was carried out in a 150-cm-thick soil lysimeter planted with winter rye in Austria. Water flow and tracer transport dynamics were simulated in the SPAC using HYDRUS-1D, previously calibrated with hydrochemical measurements. The root water uptake (τR) and drainage (τD) transit times (τ) were assessed by identifying arrival times when a prescribed percentage of the tracer mass breakthrough curves was reached. The estimates of τR and τD were compared to those derived from a particle tracking algorithm that simulates the particle trajectories subject to convective transport. The tracer-based arrival times were in close agreement with those determined using particle tracking when 50% of the tracer output flux was reached. On average, it took 19 or 234 days for water originating from rainfall in the growing season to be taken up by roots (21%) or exit as drainage (36%), respectively. In contrast, in the dormant season, 10% of rainfall water was taken up by roots after 245 days, while 79% became drainage after 241 days. The results from each daily event can be aggregated at any desired temporal resolution to investigate the effects of climate seasonality on water balance and timing. The temporal origin of water can be explored in other plots using the standard guidelines proposed in this study.

How to cite: Nasta, P., Zhou, T., Stumpp, C., Simunek, J., and Romano, N.: Assessing the temporal origin of root water uptake and drainage water using a virtual tracer experiment in HYDRUS-1D, EGU General Assembly 2023, Vienna, Austria, 23–28 Apr 2023, EGU23-4203, https://doi.org/10.5194/egusphere-egu23-4203, 2023.

EGU23-6442 | ECS | Posters on site | HS10.4

Plant water use strategy is strongly constrained by species size in Mediterranean ecosystems  

Francisco Javier Muñoz Gálvez, Jose Ignacio Querejeta Mercader, Cristina Moreno Gutiérrez, Wei Ren, Gonzalo González Barberá, Enrique García de la Riva, and Iván Prieto Aguilar

Global warming and changes in precipitation regimes resulting from climate change are altering plant water availability and water use efficiency, which compromises key ecosystem services such as vegetation productivity, ecosystem carbon storage, and ecohydrological regulation. The study of plant water sources and leaf-level water use strategies is particularly important for the management and conservation of Mediterranean ecosystems, which are threatened by increasing climatic aridity. We investigated the water use strategies of 66 woody plant species distributed across 10 sites along a steep 600 km aridity gradient in  south-eastern and central Iberian Peninsula. We used soil and plant water stable isotopes (δ2H and δ18O) to quantify the proportion of water extracted from different soil layers, as well as leaf stable isotopes (δ13C, δ18O and Δ18Oenrichment above source water) as proxies for water use efficiency and stomatal regulation. Our results indicate that water extraction depth along the soil profile is strongly constrained by plant species size and height. Bayesian models revealed that small and medium size shrubs use a much greater proportion of shallow soil water than large shrubs and trees, a pattern that is remarkably consistently across study sites and species. Mixed models revealed strong associations between leaf δ13C, Δ18Oenrichment and xylem water δ18O across sites, indicating that woody species with tighter stomatal regulation achieve higher water use efficiency and generally extract water from deeper soil layers. This conservative water use strategy is much more common in larger woody species than in smaller ones. Our findings demonstrate the coexistence of sharply contrasting water use strategies in Mediterranean plant communities.  Small and mid-size woody species are heavily reliant on shallow soil water and exhibit a highly acquisitive and profligate water use strategy that enables them to take rapid advantage of an ephemeral resource (topsoil water) after rainfall pulses, although they are less efficient in the use of water at leaf level. On the other hand, large shrubs and trees that use more stable deeper water sources exhibit a much more conservative water use strategy. 

How to cite: Muñoz Gálvez, F. J., Querejeta Mercader, J. I., Moreno Gutiérrez, C., Ren, W., González Barberá, G., García de la Riva, E., and Prieto Aguilar, I.: Plant water use strategy is strongly constrained by species size in Mediterranean ecosystems , EGU General Assembly 2023, Vienna, Austria, 23–28 Apr 2023, EGU23-6442, https://doi.org/10.5194/egusphere-egu23-6442, 2023.

EGU23-6740 | ECS | Posters on site | HS10.4

Estimating uptake and internal transport dynamics of irrigation water in apple trees using deuterium-enriched water 

Nicola Giuliani, Agnese Aguzzoni, Francesco Comiti, Daniele Penna, and Massimo Tagliavini

Climate change will likely increase crop water demand and reduce the availability of water for irrigation. A deeper knowledge on water uptake dynamics and its translocation inside plants would help optimize irrigation management. Stable isotopes are widely used in ecohydrological studies to track the origin of plant water and to determine the contribution of different water sources to the plants’ requirements. Despite the extensive literature dealing with water relations in fruit orchards, very little is known about the time interval between the irrigation water supply and the presence of irrigation water inside the tree. The present study addressed the following questions: 1. What is the time interval between irrigation and the arrival of irrigation water at different tree heights? 2. To which extent can irrigation water uptake and transport be accelerated by increasing the portion of soil volume receiving drip irrigation water?

To address our goals, we set up a field experiment in summer 2021 in an apple orchard and an ancillary pot experiment in the lab. In the field experiment, we tested the effect of different drip irrigation layouts on the extent and rapidity of water uptake by mature apple trees. Trees were irrigated using deuterium-enriched water (δ2H = 12050 ‰) using 1, 2 or 4 drippers per tree (each dripper delivered 3 L in one hour). Shoot and fruit samples were collected in the bottom (1.5 m) and top (3 m) part of the canopy at regular intervals following the irrigation event. Soil was sampled at different depths and distances from the dripper after the irrigation. In the pot experiment, the soil was saturated with labelled water (δ2H = 1779 ‰) and xylem samples were collected at different time intervals and heights along the apple tree trunk. Water was extracted by cryogenic vacuum distillation and analyzed by IRMS. A two end-member mixing model allowed to quantify the fraction of labelled irrigation water in soil and trees. Irrigation flow velocity within the tree was estimated by the first sampling time at which the shoot δ2H value at a given height was significantly different from the values before the irrigation. Irrigation water could be detected in potted trees at 0.5 m after 1 h and at 1 m after 2 h; in field-grown trees, labelled water first appeared in the shoots in the bottom and top part of the canopy after 2 h and 4-6 h, respectively. By increasing the number of drippers per tree, the fraction of irrigation water in the shoots increased accordingly (ranging from 1% to 3% of total water after 32 h). However, uptake and transport velocity were unaffected by the number of drippers, ranging from 0.6 to 0.8 m h-1. No irrigation water was detected in the fruits.

How to cite: Giuliani, N., Aguzzoni, A., Comiti, F., Penna, D., and Tagliavini, M.: Estimating uptake and internal transport dynamics of irrigation water in apple trees using deuterium-enriched water, EGU General Assembly 2023, Vienna, Austria, 23–28 Apr 2023, EGU23-6740, https://doi.org/10.5194/egusphere-egu23-6740, 2023.

EGU23-7157 | Orals | HS10.4

Seasonal dynamics of 2H2O passage and 15N accumulation in a dual-label pulse-chase experiment in a mature, irrigated Scots pine forest 

John Marshall, Marco Lehmann, Frank Hagedorn, Matthias Saurer, Kerstin Treydte, and Arthur Gessler

Tree roots are responsible for the bulk of water and nitrogen (N) uptake by forests, but the detailed mechanism of resource uptake and their role in the spatial exploitation of water and nitrogen resources is incompletely understood. Theory and empirical evidence suggest that there are two processes delivering N to root surfaces for uptake: 1) convection of dissolved N carried in soil water as it is drawn toward the roots and 2) diffusion of dissolved N in still water toward the low concentrations at the root surface.  Quantifying these processes has, however, been difficult, particularly in forest trees. Recently paper by Henriksson et al. Our objective here was to make a similar comparison in an irrigation experiment.

We applied highly labelled 2H2O and 15N on a small area at the beginning of the growing season a similar and tracked 2H and 15N in tissues of adjacent trees and shrubs, aiming to assess not only correlations between the water and N tracers at the end of the season, but also the dynamics of label passage and accumulation through repeated measurements. Synchronicity of the nitrogen accumulation with the water label passage would strengthen evidence for the role of water uptake in nitrogen uptake.

We found that the 2H-label in water, as measured in extracted water, passed through the system as a pulse, disappearing by late in the season. In contrast, the 15N label, as measured from leaf tissue, accumulated toward an asymptotic maximum. Among tree individuals, the rate of 15N increase was correlated with the plant-water 2H2O labelling at any point in time, supporting the notion that the 15N uptake was predominantly driven by water uptake. No difference was detected between the irrigated and the non-irrigated plots, perhaps because high rainfall overrode any irrigation effects.

Next steps will be to also compare the cumulative δ2H of the wood in the new growth ring to the δ2H of the xylem water that passed through individual trees. If the correlation is strong, we will map the patterns of water and N uptake around the labelled plots to provide a detailed spatial description of the correlated water and N uptake processes. When combined with the current study, these results will show the spatial and temporal extent to which root water uptake facilitates nitrogen delivery to the roots.

How to cite: Marshall, J., Lehmann, M., Hagedorn, F., Saurer, M., Treydte, K., and Gessler, A.: Seasonal dynamics of 2H2O passage and 15N accumulation in a dual-label pulse-chase experiment in a mature, irrigated Scots pine forest, EGU General Assembly 2023, Vienna, Austria, 23–28 Apr 2023, EGU23-7157, https://doi.org/10.5194/egusphere-egu23-7157, 2023.

Plant water use in hydrologic, land-surface, and earth system models is frequently estimated by a series of equations reliant on unknown model parameters controlling plant hydraulic function. Estimating these plant hydraulic traits is critical for accurate simulation of terrestrial water storage, flow paths, tree resistance to drought, and ultimately, ecosystem response to climate change. Despite the prevalence of δXYLEM observations, few studies have used δXYLEM to estimate plant traits numerical ecohydrologic models We calibrated EcH2O-iso, an isotopic-enabled, fully distributed ecohydrologic model, with δXYLEM observations of 30 Eastern Hemlock (Tsuga canadensis) trees across seven months. Calibrated values for maximum stomatal conductance, canopy light interception, and rooting depths were validated with independent datasets of latent heat flux, canopy light interception, and δXYLEM from a nearby hemlock stand. Results indicate significant correlations between tree diameter (DBH), topographic position, and the calibrated values of several vegetation traits. Our results demonstrate that δXYLEM data can be used to accurately parameterize plant traits; however, the locations and sizes of the sampled trees should be considered when upscaling measured or calibrated plant-traits from individual trees into larger horizontal scales.

How to cite: Li, K., Kuppel, S., and Knighton, J.: Integrated Xylem Water Isotopic Observations and Process-based Ecohydrological Model Simulations Reveal Species-Level Plant Hydraulics, EGU General Assembly 2023, Vienna, Austria, 23–28 Apr 2023, EGU23-7685, https://doi.org/10.5194/egusphere-egu23-7685, 2023.

EGU23-8979 | Posters on site | HS10.4

Testing simplifying hypotheses for modelling forest throughfall and stemflow water stable isotopes 

Pilar Llorens, Francesc Gallart, Juan Pinos, Carles Cayuela, and Jérôme Latron

The stable isotope composition of the water entering the hydrological system is frequently used as natural tracer for plant, soil and catchment hydrology studies in forested areas. For these studies is important to know how the isotopic composition of precipitation is modified when rainfall passes through the canopies, therefore, the modelling of these processes would be very useful. However, it has been described as a complex task due to the complexity of the insufficiently known mechanisms involved. As an alternative way, we propose to test a set of hypotheses that try to simplify the main driving mechanisms. The hypotheses being tested are: i) The enriched isotopic composition of stemflow is in dynamic equilibrium with that of air moisture; ii) Dripping water has the same isotopic composition than stemflow; and iii) Throughfall isotopic composition is a mixing of those of free throughfall and stemflow. The measured event and intra-event isotopic composition of rainfall, throughfall and stemflow measured in a Scots pine plot during several years at the Vallcebre Research Catchments (South-Eastern Pyrenees), combined with Rutter and Gash models, previously tested in the studied plot, are being used to test these hypotheses.

How to cite: Llorens, P., Gallart, F., Pinos, J., Cayuela, C., and Latron, J.: Testing simplifying hypotheses for modelling forest throughfall and stemflow water stable isotopes, EGU General Assembly 2023, Vienna, Austria, 23–28 Apr 2023, EGU23-8979, https://doi.org/10.5194/egusphere-egu23-8979, 2023.

EGU23-10743 | ECS | Posters virtual | HS10.4

Isotopic exploration of eco-hydrological connectivity in the riparian zones of Southern Western Ghats, India 

Saranya Puthalath, Sreelash Krishnan, Akhil Thulaseedharan, Abdur Rahman, Amzad Laskar, and Sanjeev Kumar

Understanding the route of precipitation through the soil-vegetation-atmosphere continuum is significant for partitioning evapo-transpiration (ET) into its components. The δ18O of water has been used in the present study to understand the eco-hydrological connectivity in the tropical humid Western Ghats, India. We conducted spatially distributed sampling of stream water, xylem, groundwater, root, and soil pore water. The results suggest that the vegetation mostly accessed water from the intermediate soil layer and not from the streams. Though the shallow roots exhibited enriched isotopic signatures due to the availability of evaporated soil water, the xylem water exhibited rather depleted signatures suggesting that the dominant uptake happened from the layers beneath the topsoil. While a significant Isotopic elevation effect (-0.09/100 m elevation) was observed in the stream water, the xylem water elevation effect was not significant. The major discontinuity of the Western Ghats, the Palghat Gap, exhibited the circulation of 18O enriched water in the soil-vegetation-atmosphere continuum due to the evaporative enrichment of source water and the subsequent abstraction by trees. The calculated leaf water enrichment at the evaporative site of the leaf (∆Le) and the ET fluxes recorded in the weighing lysimeters as well pointed towards the isotopic enrichment in the Palghat Gap. Additionally, the lysimeter ET flux and the mixing model-based partitioning of ET show the transpiration component to be 88%.

How to cite: Puthalath, S., Krishnan, S., Thulaseedharan, A., Rahman, A., Laskar, A., and Kumar, S.: Isotopic exploration of eco-hydrological connectivity in the riparian zones of Southern Western Ghats, India, EGU General Assembly 2023, Vienna, Austria, 23–28 Apr 2023, EGU23-10743, https://doi.org/10.5194/egusphere-egu23-10743, 2023.

EGU23-10902 | ECS | Orals | HS10.4

Vegetation controls spatial patterns of soil water isotopes in a tropical dry forest and UAV’s can help to predict them 

Matthias Beyer, Malkin Gerchow, Alberto Iraheta, Kathrin Kuehnhammer, Paul Koeniger, Ricardo Sanchez-Murillo, David Dubbert, Maren Dubbert, Ana Claudia Callau-Beyer, and Christian Birkel

Analyzing water stable isotopes in soils and plants is a key method to identify the water sources for transpiration. However, the spatial representation of such studies is often limited and typically data from one or only a few soil water isotope profiles are used for analyzing plant water sources for much larger areas.   

Contrary, it is well known from soil sciences that soil physical and hydraulic properties are highly heterogeneous, even over small areas. Only few studies have investigated the spatial variability of soil water isotopes, despite its potential importance for water uptake depth analysis. Goldsmith et al., (2018) showed that vegetation can have a substantial influence on the spatial pattern of soil water isotopes in a tropical cloud forest. We extend the hypothesis that vegetation does not only have an influence on soil water isotopes in wet environments, but also under dry conditions: The isotopic enrichment of soil water isotopes under steady-state dry conditions is controlled by vegetation (canopy parameters). 

In order to test this hypothesis, we undertook a spatial sampling of ten soil water isotope depth profiles (at 6 depths up to 2m depth) and ~60 evergreen and deciduous trees at the peak of dry season in February 2019 in a tropical dry forest in the northwest of Costa Rica. We then correlated the spatial patterns of water content and isotopes of the soil with 12 vegetation indices and surface (leaf/soil) temperature derived from UAV (Unmanned aerial vehicles; drones) overflights (Jan-Apr 2019) in order to investigate if spatial patterns of soil water isotopes can be predicted using additional information. Finally, we interpolated (external drift kriging) the soil water isotope values using the highest correlated vegetation indices in order to provide a spatially distributed map of soil water isotope depth profiles.

Our findings indicate that i.) soil water isotopes are (highly) spatially heterogeneous, even under steady-state conditions (no rain); ii.) this heterogeneity is particularly pronounced for the near-surface soil (first 50 cm) and diminishes with soil depth; iii.) there is a significant correlation between soil water isotopes and multiple vegetation indices. Surprisingly, the highest correlations (0.82 for water content, 0.75 for 𝛿2H and 0.62 for 𝛿18O, all for 10 cm soil depth) were found for indices based on color infrared (CIR) and the red-edge triangular vegetation index (RTVI), and not NDVI (Normalized Difference Vegetation Index).  We proved the theoretical concept (more vegetation cover = lower soil temperatures = less fractionation) to hold true by correlating the soil surface temperatures at each sampling location to the water isotope values (R² = 0.75 for both 𝛿2H and 𝛿18O at the soil surface).

This research demonstrates that classic approaches of assigning one or few soil water isotope profiles for characterization of water uptake depths of larger areas are highly error-prone. Vegetation and soil water isotopes affect each other and need to be incorporated into spatial analyses. The interpolated soil water isotope depth profiles we provide can act as a baseline for more robust spatial investigations of soil water uptake depths in highly heterogeneous environments.

How to cite: Beyer, M., Gerchow, M., Iraheta, A., Kuehnhammer, K., Koeniger, P., Sanchez-Murillo, R., Dubbert, D., Dubbert, M., Callau-Beyer, A. C., and Birkel, C.: Vegetation controls spatial patterns of soil water isotopes in a tropical dry forest and UAV’s can help to predict them, EGU General Assembly 2023, Vienna, Austria, 23–28 Apr 2023, EGU23-10902, https://doi.org/10.5194/egusphere-egu23-10902, 2023.

EGU23-11570 | Posters on site | HS10.4

Tracing metabolic water in living tissues using triple oxygen isotopes 

Daniel Herwartz, Mohammed El-Shenawy, Michael Staubwasser, Alvaro Zύñiga-Reinoso, and Reinhard Predel

Animals and plants metabolize carbohydrates to acquire energy. The most common oxidant is air O2, which comprises a distinct negative Δ’17O anomaly. Vertebrate bones and teeth inherit this anomaly providing a tool to approximate metabolic rates, aridity or paleo atmospheric compositions. In order to directly trace the Δ’17O anomaly in invertebrates, plants or soil water, we have developed a technique to quantitatively extract water from any organic tissue without heating or freeze drying. The method is based on water transfer from the organic matrix to initially dry, hygroscopic CaCl2 salt in closed containers and is presented in detail by El-Shenawy et al. (this conference).

A sprouted potato is examined as an example for respiration by plant roots. Clear negative Δ’17O anomalies derived from air O2 are observed within the water extracted from the tribes and especially the small fruits that only develop after prolonged time of spouting in a dark cabinet. Apparent evaporation trajectories evolve in δ18O vs. d-excess space, but these are mostly artifacts due to production of metabolic water with high δ18O within the potato and the tribes. Clearly, the production of such metabolic water within plants and soils must be accounted for, especially when interpreting δ18O vs. d-excess trajectories as evaporation slopes.

We examined Insect body water from lab reared beetles and silverfish as well as free ranging specimens form the Atacama Desert in Chile. A large interspecies range in δ18O vs. Δ’17O is observed, which is mainly interpreted to reflect variable water acquisition strategies. Metabolic water derived from air O2 can make up large proportions of body water in some species, but not others. Respective body water mass balance models are presently constructed and will be presented.

How to cite: Herwartz, D., El-Shenawy, M., Staubwasser, M., Zύñiga-Reinoso, A., and Predel, R.: Tracing metabolic water in living tissues using triple oxygen isotopes, EGU General Assembly 2023, Vienna, Austria, 23–28 Apr 2023, EGU23-11570, https://doi.org/10.5194/egusphere-egu23-11570, 2023.

EGU23-14839 | Orals | HS10.4 | Highlight

Reconstructing the history of flowing waters and stream water isotopes from freshwater mussels 

Laurent Pfister, Bernd Schöne, Turk Guilhem, Gey Christoph, Thielen Frankie, Hissler Christophe, Barnich François, and Leonard Loic

With the intensification of the hydrological cycle, the identification and assessment of factors controlling catchment climate resilience are key. A major obstacle to the design and implementation of precautionary measures against ‘once in a lifetime’ flood events is the still very limited understanding of the hydrological mechanisms involved. Along similar lines, the clustering of extreme events remains elusive until this day.

Stable isotopes of O and H in streams and precipitation are cardinal tools for investigating questions related to water source, flowpaths and transit times. However, their spatial and temporal variability remain largely unknown – essentially due to the limited availability of long historical time series of O-H isotope signatures in stream water, as opposed to the multi-decadal records in precipitation.

Based on their quality as natural archives of in-stream environmental conditions, freshwater mussels have been recently used for complementing stream water δ18O isotope records. Their potential is far from being exhausted, with nearly 1200 freshwater bivalve species inhabiting a large variety of river systems and lakes around the globe. Their average life span is ca. 10 years, even though many species can live much longer (up to 200 years for the freshwater pearl mussel). Here, we introduce an innovative avenue for pushing the boundaries in hydrological time series reconstruction even further. Our proof-of-concept work from the Our River (Luxembourg) is geared towards widening the portfolio of analysed proxies in shells, eventually extending the high-resolution (seasonally to annually resolved) reconstruction from stream water δ18O to river discharge.

Note that the newly gained knowledge on multi-decadal and centennial changes in streamflow generation is of direct relevance for freshwater mussel population dynamics – an issue that is at the heart of all past and ongoing projects for the protection of freshwater molluscs.

How to cite: Pfister, L., Schöne, B., Guilhem, T., Christoph, G., Frankie, T., Christophe, H., François, B., and Loic, L.: Reconstructing the history of flowing waters and stream water isotopes from freshwater mussels, EGU General Assembly 2023, Vienna, Austria, 23–28 Apr 2023, EGU23-14839, https://doi.org/10.5194/egusphere-egu23-14839, 2023.

Low temperature is the main driver behind the upper elevational and higher latitudinal distribution range of trees. As the limit for tree growth in general, the alpine treeline is traditionally in the focus of most studies on the effect of low temperature limits of trees, but all other tree species that reach their distribution limits below the treeline have species-specific low-temperature limits, as well (Körner, 2021). Restricted water uptake and deteriorated hydraulic relations at low root zone temperatures might be one of the drivers for the species-specific cold distribution limits of trees. Negative cold soil effects on the hydraulic conductivity of trees can thus potentially amplify the direct effects of cold temperatures on growth and contribute to the cold limit of temperate tree species. Thus, we put forward two hypotheses: (1) the natural cold distribution limit of temperate tree species is related to their capacity to take up water at cold root temperatures; (2) cold root temperatures lead to drought-like water limitations that are more severe in low- compared to high-elevation species. In this study, we investigated the low temperature sensitivity of root water uptake and transport in seedlings of 16 European broadleaved and conifer temeprate tree species, which reach their natural upper elavation distribution limits at different distances to the alpine treeline acsross a ca. 1500 m elevational range. We tested the temperature sensitivy of root water uptake and whole tree water transport by exposing the seedlings to three different constant root temperatures (15, 7 and 2°C) while all seedlings received the same warm abovground temperatures. To quantify the negativ low temperature effects on water transport, we used 2H-H2O pulse labelling of the source water in hydroponic systems. The result showed a correlation of the thermal distance to treeline of the natural upper distribution limits of each species with its relative water uptake at 7°C root temperature revealed a moderate but significant linear relationship, whereby water uptake and transport tends to be more limited the larger the species’ thermal distance to treeline (i.e. the lower the high elevation distribution limit). In contrast, 2°C root temperatures strongly reduced water uptake, with consequently no significant correlation between relative water uptake and the species-specific distribution limits. We concluded low root temperatures lead to species-specific restrictions of water uptake and drought-like stress with reduced water potentials and stomatal conductance. Furthermore, species that reach their upper distribution at higher elevations are less sensitive to low root temperatures and vice versa. Low temperature-caused hydraulic restrictions might thus contribute to the cold distribution limits of temperate tree species.

How to cite: Li, Y. and Hoch, G.: Physiological drought-like water limitation at low root temperature in temperate tree species with different elevational distribution limits, EGU General Assembly 2023, Vienna, Austria, 23–28 Apr 2023, EGU23-15149, https://doi.org/10.5194/egusphere-egu23-15149, 2023.

There is increasing global interest in employing nature-based solutions (NbS) to help reduce risks to economies and society, including floods, drought, and water pollution reduction that are likely to become worse under future extreme climate.  Thai government has implemented flood retention system since 2017 along Yom and Chao Phraya rivers and their tributaries to create “room for the river”.  This flood retention scheme concept, already in place, consistently serves as a potential NbS for reducing disaster risks and impacts as well as for adaptation to those impacts, however, evidence on the benefits of the approach is still quite limited.  This study therefore aims to provide and enhance an evidence-based quantitative and qualitative indicators for NbS monitoring and evaluation stemmed from available and reliable data using a dynamic surface water-groundwater isotope composition assessment as the stable isotope fingerprinting technique has been demonstrated to be invaluable in helping understand basin-scaled functioning and are widely used in catchment hydrology.  The study area is located in the downstream of Yom river basin known as Bang Rakam model where the lowland has been used as flood retention area to prevent overflowing from Yom river into agricultural zones and reduce flood risks in lower Chao Phraya basin and Bangkok city further downstream.  Local precipitation, surface water, and groundwater along the main Yom river courses and their tributaries are directly samples (inside and outside of the Bang Rakam area). Massive precipitation isotopic composition database from existing IAEA monitoring network (GNIB) along with local Bangkok precipitation isotopic signature are compared with precipitation from Chiang Mai province to better identify the rainfall isotopic compositions. In addition to the isotopic differentiation of precipitation in the area, its impacts on isotopic characteristics of surface water and groundwater are additionally explored. LMWLs (Local Meteoric Water Line) for local rainfall in Bangkok and Chiang Mai are generated with some seasonal variation due to rain out effect. Surface water is influenced by evaporation at some degree, revealing that rainfall may not be the primary source of surface water. Yom river’s isotope values are far more D and 18O-enriched compared to Ping’s and Nan’s, reviewing the mixing of groundwater with river water and/or the source of surface water may come from dry-period precipitation. The isotopic similarity with the more depleted δD and δ18O of groundwater samples suggests the potential mixing of groundwater with river water by different mixing processes (54% from river water and 46% from rainfall). Isotopic composition analyses of groundwater samples collected from the Bang Rakam area are more depleted (up to 25%) in heavy isotopes compared to those from groundwater baseline.  A shift in groundwater origin (61% from river water and 39% from rainfall) suggests the direct enhancement of groundwater recharge from flood water retention in lowland area along Yom river.  d-excess stable isotope analyses are beneficial to identify the relative contributions of the wet and dry seasonal sources to the groundwater recharge. The results indicate that groundwater sources are composed of ~ 71.4% wet seasonal sources and ~28.6% dry seasonal sources.

How to cite: Putthividhya, A., Jirasirirak, S., and Prajamwong, S.: Monitoring and Evaluation of Nature-Based Solution (NbS) Approach Implementation for Flood Risk Reduction using Evidence-Based Dynamic Groundwater Isotope Compositions Assessment in Lowland Catchment of Thailand, EGU General Assembly 2023, Vienna, Austria, 23–28 Apr 2023, EGU23-16502, https://doi.org/10.5194/egusphere-egu23-16502, 2023.

EGU23-17210 | Posters on site | HS10.4

A simple experiment to trace stemflow infiltration and subsurface flow paths based on stable water isotopes 

Chiara Marchina, Giulia Zuecco, and Diego Todini

Stemflow has a relevant role in forested catchments because it affects the amount of precipitation reaching the soil, and how water infiltrates and interacts with soil particles. The role of stemflow in various subsurface processes depends on the infiltration area and its size is currently a topic of interest and debate within the ecohydrological community. Stemflow infiltration area is generally estimated based on the ratio between stemflow input rate and the mean soil infiltration capacity, whereas direct observations of stemflow infiltration areas are rare. Direct observations of stemflow infiltration areas are usually made by the application of dye tracers, which have proven to be useful for monitoring double-funneling. On the contrary, few direct observations are based on the application of isotopically-labelled water to assess stemflow infiltration area and subsurface flow paths. 

Therefore, in this study, we present a simple experiment carried out in a forested catchment in the Italian pre-Alps to simulate stemflow by using isotopically-labelled water and to quantify stemflow infiltration area and volume. The experiment was conducted during a dry period to observe better changes in the isotopic signal in the soil water. Stemflow was simulated with a rainfall depth and intensity similar to typical summer storms in the catchment, and by using water with an isotopic composition very different compared to the composition of soil water during summer months. The isotopically-labelled water was applied to a beech tree monitored by electrical resistivity tomography during different wetness conditions, as well as during this stemflow experiment.

Soil samples collection for isotopic analysis was carried out after the experiment, at different distances from the stem and at different depths (e.g., 0-15, 15-30, and 30-45 cm). Soil moisture was also measured at 0-6 and 0-12 cm depths at different distances from the stem. Preliminary results showed a rapid infiltration of stemflow along the root system of the beech tree and the usefulness of isotopically-labelled water to simulate stemflow and trace double-funneling.  


Keywords: stable water isotopes; soil water; stemflow; forested catchment.

How to cite: Marchina, C., Zuecco, G., and Todini, D.: A simple experiment to trace stemflow infiltration and subsurface flow paths based on stable water isotopes, EGU General Assembly 2023, Vienna, Austria, 23–28 Apr 2023, EGU23-17210, https://doi.org/10.5194/egusphere-egu23-17210, 2023.

EGU23-232 | ECS | Posters on site | HS10.7

Characterization of lowland permafrost mires in subarctic Sweden 

Radhakrishna Bangalore Lakshmiprasad, Stephan Peth, Susanne Karoline Woche, and Thomas Graf

25% of the Northern hemisphere is underlain by permafrost, and this area has decreased during recent decades because of climate change. The effects of climate change are especially pronounced in subarctic regions such as the Abisko region in Sweden. Abisko is located along the southern boundary of permafrost occurrence in Eurasia. The existence of permafrost is also observed at low altitudes due to the combined effect of peatlands and low precipitation. Seasonal thawing of permafrost results in the development of the active layer. The active layer depth is one of the climate change indicators which influences the ecological, hydrological, and biogeochemical processes in permafrost regions. Prior studies show that the active layer thickness in subarctic Sweden is increasing at 0.7 - 1.3 cm/year.
The main purpose of the study is to establish a methodology to collect input and calibration datasets for cryohydrogeological models. The following experiments were conducted at the Storflaket mire in Abisko to determine the (i) thermal properties by the installation of temperature loggers, estimation of thermal conductivity, and heat capacity, (ii) hydrological properties by the installation of soil moisture sensors, determination of soil moisture retention properties, and hydraulic conductivity, and (iii) geological properties by estimating porosity, bulk density, organic matter content, and visual soil parameters (color, distance to permafrost table from surface, and rooting depth). Results of the experiments demonstrated that the permafrost mire is a highly porous, organic matter-rich soil with variable rooting depth. The van Genuchten Mualem model was found to adequately represent the variably saturated properties of the soil. The soil moisture and temperature sensors showed spatial variability affected by surface type, soil type, and vegetation depth. The measured mean thermal conductivity and specific heat capacity of 0.409 W/(mK) and 3.15 MJ/(m3K) are within the range of literature values for highly organic peatland soils. The measured parameters provide the database for cryohydrogeological models to estimate active layer depth due to climate change.

How to cite: Bangalore Lakshmiprasad, R., Peth, S., Karoline Woche, S., and Graf, T.: Characterization of lowland permafrost mires in subarctic Sweden, EGU General Assembly 2023, Vienna, Austria, 23–28 Apr 2023, EGU23-232, https://doi.org/10.5194/egusphere-egu23-232, 2023.

EGU23-2297 | ECS | Orals | HS10.7 | Highlight

Impacts of wildfire and drought on hydrological connectivity and solute dynamics in a temperate blanket peat catchment 

Abbey L. Marcotte, Juul Limpens, João Pedro Nunes, Kieran Khamis, Stefan Krause, Sami Ullah, and Nicholas Kettridge

Intact peatlands provide crucial ecosystem services, regulating discharge by retaining water and providing high water quality by retaining solutes. These services can become compromised when peatlands become degraded by natural disturbances such as wildfire and drought. Such disturbances in traditionally non-fire prone regions will likely become more frequent and severe under future climates, potentially impacting downstream water quality. Understanding how fire and drought alter hydrological and biogeochemical processes in these regions is necessary for future risk assessment.

The 2018 Saddleworth moorland wildfire (England) offered a unique opportunity to study the combined impacts of severe wildfire and drought on stream water quality fed from a peatland-dominated catchment in a traditionally non-fire prone region (i.e., northern Europe). Capitalising on this event, our study aimed to (1) quantify stream chemistry changes and (2) understand patterns of element mobilisation and transport within the disturbed catchment. We evaluated concentration-discharge (C-Q) responses for nine variables (dissolved organic carbon, sulphate, Na, Ca, Pb, Zn, Al, Cu and turbidity) in five post-fire storm events over a nine-month period. C-Q responses were considered together with hysteresis and flushing indices (HI and FI, respectively) to further describe solute dynamics within storms.

Highest average concentrations of nutrients and base cations occurred in the storms immediately following the wildfire (~0 – 3 months post-fire) and average concentrations decreased into the autumn and spring (~3 – 9 months post-fire). In contrast, average metal concentrations began increasing in autumn and into the spring storms, coinciding with the timing of catchment re-wetting. Element behaviour patterns inferred from C-Q responses and HI/FI indices suggest rapid mobilisation and flushing of nutrients and base cations following the wildfire, and a shift to dilution behaviours in the spring storms. This shift indicates a change from surface transport and an exhaustion of readily available burnt materials. Metals consistently displayed delayed mobilisation, where concentrations peaked after the discharge peak, indicating a within-peat or distal headwater sources.

Our results suggest that seasonal re-wetting and rejuvenated hydrologic connectivity of the catchment following extreme drought was a dominating factor controlling source zone activation, mobilisation and transport of solutes in our catchment. Additionally, water quality impacts appeared to be limited to the first ~3 months following the wildfire, suggesting certain aspects of wildfire impacts in temperate peatlands may be short-lived. Our results contribute to defining potential water quality risks in drought and wildfire disturbed peat catchments under future climates.

How to cite: Marcotte, A. L., Limpens, J., Nunes, J. P., Khamis, K., Krause, S., Ullah, S., and Kettridge, N.: Impacts of wildfire and drought on hydrological connectivity and solute dynamics in a temperate blanket peat catchment, EGU General Assembly 2023, Vienna, Austria, 23–28 Apr 2023, EGU23-2297, https://doi.org/10.5194/egusphere-egu23-2297, 2023.

EGU23-4593 | Orals | HS10.7

The role of sub-peatland critical zone structure on the hydrology of northern peatlands 

Lee Slater, Xavier Comas, Andrew Reeve, Henry Moore, and Victoria Niedzinski

The hydrology of northern peatlands is increasingly recognized to be influenced by groundwater flow between peat and underlying mineral sediments. These hydrologic fluxes have been measured in peatlands of central and northern Maine where peatlands formed in depressions within the complex landscape left after the last glacial ice retreat. Although most of these peatlands formed on top of a low permeability confining glaciomarine clay, surface digital elevation maps and subsurface geophysical datasets (ground penetrating radar, electromagnetic and resistivity imaging) indicate that, in places, they are often in hydrogeological contact with eskers (glacial outwash deposits) and possibly even directly in contact with bedrock. Hydrogeological datasets, including direct hydraulic head observations and indirect observations of seepage fluxes, support the case that these points of hydrogeological contact exert a profound influence on the surface hydrology, including pool formation, and ecology of these peatland systems. The unique properties of peat, including the formation of pipe structures, result in highly focused discharges of mineralized water as evidenced from temperature sensing and aqueous geochemistry data (specific conductance, dissolved iron, dissolved manganese). These pipe networks may exert a control on carbon cycling in peatlands via the delivery of nutrients, or possibly by serving as conduits for the release of free phase gas stored in the deep peat. Preliminary observations using gas traps lend support to this hypothesis.

How to cite: Slater, L., Comas, X., Reeve, A., Moore, H., and Niedzinski, V.: The role of sub-peatland critical zone structure on the hydrology of northern peatlands, EGU General Assembly 2023, Vienna, Austria, 23–28 Apr 2023, EGU23-4593, https://doi.org/10.5194/egusphere-egu23-4593, 2023.

Peat soils exist because the rate of accumulation of organic matter is faster than the rate of organic matter decomposition. This balance of rates can be in favour of net organic matter accumulation if: the rate of primary productive is relative high; the decomposition rate is relative slow; or, a combination of both. Slowing the decomposition rate has been ascribed to the presence of plants composed of decay-resistant components and to water-logged conditions. Water-logged conditions limit ingress of oxygen and oxygen is rapidly consumed by the supply of organic matter leaving decomposition dependent on other, less available and less energetically favourable terminal electron acceptors such as nitrate, sulphate and iron. The water-logged conditions can occur due to position in the landscape, high precipitation inputs, and/or restricted drainage within the peatland. Classic texts on peat formation refer to the development of restricted drainage within peat profiles but are vague on how it forms – for example “At first the porous structure survives, just as a wall with a few bricks removed does. But eventually the structure collapses. The dry bulk density increases abruptly” – Clymo and Pearce (1995). However, despite this processing being referred to in most texts the process and role of compaction in the formation of peat is not detailed nor has it been studied. Therefore, in this study we measure the initial development of peat from sphagnum moss and question which is more important in the development of peat soil – is it self-weight compaction or degradation - and are these two processes independent?

Using sphagnum moss mesocosms we compared the change in peat depth with the flux of CO2 from the peats. Over periods of more than 1 year the surface recession and CO2 flux were monitored in 12  sphagnum mesocosms relative to water table and climatic conditions.

The results show:

  • Dry bulk density did not significantly change over the course of the experiment.
  • The initial surface recession was between 1.7 to 35 % of depth with a median = 9.7%
  • Young’s modulus had a median = 1.9 MPa ranging between 0.4 and 13.0 MPa.
  • Given the values of the Young’s modulus calculated for these mesocosms then the viscosity varied between 2.2 and 20.4 Ns/m2 with a median of 6.1 Ns/m2. These calculations suggest that the sudden stress is readily adsorbed.
  • After 214 days a median of 23.7 % surface recession had occurred or a median of a further 33% surface occurring after the initial surface recession.
  • Comparison between the extrapolated CO2 flux and the measured surface recession across the entire experiment between -2 and 75% with a median of 29% due to self-weight compaction. There is no apparent correlation between length of the experiment and proportion of the effect due to self-weight compaction.

This study has been shown that, although self-weight compaction was a major component of the development of the peat, the initially phases of peat development were dominated by degradation of the peat. Further that degradation was able to equilibrate with initial self-weight compaction.

How to cite: Worrall, F. and Howden, N.: How do peat soils form? Self-weight compaction versus decomposition in the early stages of peat development, EGU General Assembly 2023, Vienna, Austria, 23–28 Apr 2023, EGU23-5099, https://doi.org/10.5194/egusphere-egu23-5099, 2023.

EGU23-5237 | ECS | Orals | HS10.7 | Highlight

Long-term changes in the pore and runoff water quality in restored boreal peatlands 

Lassi Päkkilä, Hannu Marttila, Petra Korhonen, Lauri Ikkala, Santtu Kareksela, and Anna-Kaisa Ronkanen

In Finland over half of the mire habitat types are endangered mainly due to drainage-induced succession towards more forested type ecosystems. Restoration is thought to be an important tool to improve the status of degraded peatlands. National and European Union level strategies to improve nature conservation have a target of increasing the allocation of restoration actions to peatlands in Finland. Thus, the effects of peatland restoration need to be understood.

Peatland drainage lowers the water table and exposes peat to decomposition. Restoration aims to raise the water table, but it simultaneously causes a new disturbance to surface layers often resulting in elevated nutrient and organic carbon concentrations in pore and runoff waters. Typically, the water quality disturbance starts to dampen out in the subsequent years after restoration. The rate and disturbance level depend on e.g., the actual measures, peatland type, and trophic level. To minimize and avoid impacts as well as to find the best restoration practices, knowledge of the long-term (over 10 years) effects of restoration measures is needed.

The hydrology of drained and restored peatlands and pristine counterpart mires have now been monitored for almost 15 years in the Parks and Wildlife Finland’s (Metsähallitus) peatland monitoring network. The data consists of high-frequency water table data and pore water quality measurements (four times per growing season) from 46 sites all over Finland with varying nutrient levels and openness (as one of the key indicators for peatland type). Additionally, ten sites have been tested for surface peat quality. Runoff water quality and quantity have been monitored in three of the pristine and five drained and restored sites. In this study, we report the long-term effects of peatland restoration on the water table and water quality in different peatland types. We also focus on understanding the connection of water quality variation in pore and runoff waters, intending to simplify the practical evaluation of peatland restoration success.

How to cite: Päkkilä, L., Marttila, H., Korhonen, P., Ikkala, L., Kareksela, S., and Ronkanen, A.-K.: Long-term changes in the pore and runoff water quality in restored boreal peatlands, EGU General Assembly 2023, Vienna, Austria, 23–28 Apr 2023, EGU23-5237, https://doi.org/10.5194/egusphere-egu23-5237, 2023.

EGU23-5307 | ECS | Posters on site | HS10.7

Hydrogeophysical characterization of a peatland hillslope in the Belgian High Fens 

Maud Henrion, Kristof Van Oost, Yanfei Li, and Sébastien Lambot

Despite the fact that peatlands play an important role in climate regulation, biodiversity support, water regulation, carbon storage etc., they are understudied biotopes. The objective of this study, conducted in the Belgian High Fens, was to characterize and understand the soil surface and subsurface long-term characteristics which are conditioning the shorter-term hydrogeophysical processes. To this end, Ground-Penetrating Radar (GPR) and Electromagnetic Induction (EMI) were used and this source of information was complemented with soil coring and in situ soil water conductivity measurements. The GPR and soil coring allows to reconstruct the soil structure which is composed of a layer of approximately 80 cm of peat that developed on an impermeable clay layer issued of the slate bedrock decomposition. The EMI shows a bulk soil electrical conductivity (EC) around 10 mS/m, which is consistent with the relatively low values observed in other peat studies. The EC is lower in the slope, where the water fluxes are higher. The EC was higher (of about 3 mS/m) in summer than in spring. The EC values and dynamics seem to be mainly controlled by the ion content of the soil solution. This ion content is controlled by the water fluxes on the site evacuating the ions downhill to a river. The soil water content is believed to have a low impact on the EC as the site is quite saturated most of the year. No clear correlation was found between the EC patterns and the soil structure. A novel drone-borne, low-frequency GPR (< 50 MHz) is being applied on the study site to allow for a faster and easier EC mapping. This study highlights the major influence of the ion content on the EC patterns and dynamics in a peat site. This study will also be a basis to interpret further measurements that will be made on the site (water, soil and vegetation monitoring).

How to cite: Henrion, M., Van Oost, K., Li, Y., and Lambot, S.: Hydrogeophysical characterization of a peatland hillslope in the Belgian High Fens, EGU General Assembly 2023, Vienna, Austria, 23–28 Apr 2023, EGU23-5307, https://doi.org/10.5194/egusphere-egu23-5307, 2023.

EGU23-5498 | Posters on site | HS10.7

FORCE - FORecasting hydrological response, Carbon balance and Emissions from different types of mires in arctic-to-temperate zone transect in abrupt climatic change 

Mateusz Grygoruk, Hanna Silvennoinen, Krzysztof Kochanek, Wiktor Kotowski, Anders Lyngstad, and Grzegorz Sinicyn

Mires remain the most significant terrestrial carbon stock of the world. The most up to date research results have informed that former estimates of the amounts of carbon stored in mires can be underestimated by even as high as 100%. Dominant direct drivers of mire status originate from hydrology, namely the type (i.e., rain- or groundwater feeding) and quantities of water supplied to a mire and removed from this system in result of natural drainage and evapotranspiration. Impaired peat accumulation processes can result in a positive feedback of the emission of CO2 as a response to supply of mineral-rich groundwater (resulting from permafrost thaw and increase of the fen catchment area in Arctic palsa mires) and water balance changes (resulting from shortages of water in temperate fens and sloping fens). FORCE project is focused at the verification of the hypothesis that ET-driven and catchment-change driven water balance and carbon balance changes on different mires in Arctit-to-temperate transect remains in a positive feedback with the abrupt climatic changes, resulting in expected decrease of carbon accumulation in peatlands and an increased emission of greenhouse gasses that will likely not to be stopped by any management measures. In order to verify this hypothesis we formulated set of research tasks based on general context analysis, groundwater flow modelling, Monte-Carlo parameter estimation and statistical techniques of risk assessment, isotope analyses of groundwater, surface water and vegetation and emission quantification to be integrated in a Bayesian belief approach. All of the research activities were based on the results of original data collected in a number of scheduled field research campaigns . Study sites represent the most significant examples of mires exposed to abrupt climat-change-related issues across the Arctic-to-temperate gradient: from Nordic permafrost (Suossjarvi) through the bog-lake system with expected significant role of aquatic ecosystems in total CO2 and CH4 balance (Midtfjellmosen), to fens in river valley dependent both on the draining role of the river and limited supply of water to the mire (Rospuda Valley, PL). In the framework of the project (i) we plan to reveal the amounts of CO2 transported by groundwater to the mires analysed and see how does the probable emission of CO2 from groundwater in mires contribute to total emission of CO2 from mires; (ii) we will establish groundwater flow models in order to reveal the origin of water supplying particular objects and its changes in modelled abrupt climatic change scenarios represented as changed parameters of ET, P in a Monte-Carlo procedure; (iii) we will assess the isotope composition of groundwater and surface water in order to confirm the origin of water feeding particular zones of the mire and calibrate groundwater flow models; and (iv) we will conduct laboratory estimation of greenghouse gasses and groundwater quality. It is likely that the messages resulting from the FORCE project implementation will influence international strategies oriented at promotion of mire research and conservation, placing new threads of peatland hydrology, emissions and carbon accumulation in a management context.

How to cite: Grygoruk, M., Silvennoinen, H., Kochanek, K., Kotowski, W., Lyngstad, A., and Sinicyn, G.: FORCE - FORecasting hydrological response, Carbon balance and Emissions from different types of mires in arctic-to-temperate zone transect in abrupt climatic change, EGU General Assembly 2023, Vienna, Austria, 23–28 Apr 2023, EGU23-5498, https://doi.org/10.5194/egusphere-egu23-5498, 2023.

EGU23-6146 | ECS | Orals | HS10.7

What causes rising DOC concentrations in streams from peat-affected catchments? Insights with high-resolution water quality analysis 

Tobias Houska, Laura Degenkolb, Marc Brösing, Ingo Müller, Klaus Kaiser, Klaus-Holger Knorr, Maximilian Lau, Conrad Jackisch, and Karsten Kalbitz

Peatlands are an important natural terrestrial carbon store. Any impacts on the drivers of hydro-biogeochemical processes in these ecosystems can be particularly severe. Climate change and degradation through drainages and ditches are changing peatlands dramatically. Degraded peats turn from powerful carbon sinks to emitters. They can also threaten drinking water supplies, as (heavy) metals can be leached from degraded peats along with dissolved organic carbon (DOC). However, quantifying DOC discharges from terrestrial to aquatic ecosystems is challenging. The hydro-biogeochemical processes occurring at the soil-aquatic interface are not only complex but also occur at different spatial and temporal scales. These processes depend on a variety of constantly changing external conditions such as temperature, nutrition- as well as oxygen availability. On top, there is no sensor available, which can measure the DOC concentrations of streams in situ and directly.

Here we investigated the DOC concentration in two nested catchments of two adjacent streams in the Ore Mountains of southern Saxony in Germany. One stream is dominated by mineral soils, while the other is dominated by (degraded) peat soils. Each of the four sites is equipped with YSI-EXO fDOM sensors. Further data comprise discharge, water temperature, turbidity and electric conductivity. A machine-learning algorithm (Random Forest) was trained to predict DOC concentration from the available data set (validation r² between 0.85 and 0.98). We investigated the gained 15-minute resolution DOC data on potential driving factors. Interestingly, the area-specific loads of the peat-dominated catchment with 3.5 mg C m-2 a-1 did not differ significantly from that of the mineral soil-dominated catchment with 3.1 mg C m-2 a-1. However, the loads over the year were almost twice as high as previously detected from data collected on a monthly basis. With the high-resolution DOC data, we can detect the drivers of extreme DOC concentrations (up to 40 mg l-1) after heavy rainfall events in summer and constant high-level DOC concentrations of 20 mg l-1 during snowmelt in winter. By applying the algorithm on DOC:DON ratios, we were further able to quantify the different sources of plant-based material from the peat soils and microbial-degraded material from the mineral soil-dominated catchment.

Previous DOC measurements, mostly based on 2-week to monthly measurements, likely greatly underestimate the contribution of DOC to C fluxes in ecosystems. For C-rich ecosystems such as Peatlands, this is particularly significant.

How to cite: Houska, T., Degenkolb, L., Brösing, M., Müller, I., Kaiser, K., Knorr, K.-H., Lau, M., Jackisch, C., and Kalbitz, K.: What causes rising DOC concentrations in streams from peat-affected catchments? Insights with high-resolution water quality analysis, EGU General Assembly 2023, Vienna, Austria, 23–28 Apr 2023, EGU23-6146, https://doi.org/10.5194/egusphere-egu23-6146, 2023.

EGU23-7981 | ECS | Orals | HS10.7

On the use of MARRMoT for rainfall-runoff modelling in Irish raised bogs 

Behzad Mozafari, Fiachra O'Loughlin, Michael Bruen, Shane Donohue, Shane Regan, and Florence Renou-Wilson

Peatlands cover over 20% of Ireland’s landscape, but most have been disturbed by human activities, including land use changes, which alter their natural hydrological functions. As a result, there is a growing need for restoration measures, which require reliable predictive modelling tools for assessing their feasibility and effectiveness. However, choosing a suitable hydrological model, particularly at the catchment scale, can prove challenging. While simplified conceptual rainfall-runoff models remain indispensable water management tools due to their fewer parameters, less input data, and low computational requirements, a critical issue is the limited number of conceptual models that have been successfully applied to peatlands. This is reflected in the lack of intercomparison studies that explore the performance of different model structures for different peatland types. Here, we report on the use of the Modular Assessment of Rainfall-Runoff Models Toolbox (MARRMoT) to analyze the performance of various model structures for three drained, restored, and natural Irish raised bogs. The framework provides a flexible platform for emulating (to a reasonable extent) and comparing different conceptual models within its structure. We emulated the Wageningen Lowland Runoff Simulator (WALRUS) model, which is designed specifically for lowland catchments, and compared it with the other 47 existing models within the framework. The performance of each model was assessed using four goodness-of-fit (GOF) measures. The results revealed a wide range of applicability, which led to several models being excluded from consideration. While the warm-up and calibration periods were limited to less than one year, the reported GOFs provide an invaluable insight into the dynamic performance of the models and the choice of model structure for simulating surface runoff in Irish raised bogs.

How to cite: Mozafari, B., O'Loughlin, F., Bruen, M., Donohue, S., Regan, S., and Renou-Wilson, F.: On the use of MARRMoT for rainfall-runoff modelling in Irish raised bogs, EGU General Assembly 2023, Vienna, Austria, 23–28 Apr 2023, EGU23-7981, https://doi.org/10.5194/egusphere-egu23-7981, 2023.

EGU23-8929 | ECS | Posters on site | HS10.7

Trends in surface moisture conditions of European peatlands in the last decades - a remote sensing approach 

Laura Giese, Jonathan Bahlmann, Maiken Baumberger, Jan Lehmann, Marvin Ludwig, Emilio Sanchez, Henning Schneidereit, Klaus-Holger Knorr, and Hanna Meyer

Representing the Earth’s most efficient terrestrial carbon store, intact peatlands play a key role in climate change mitigation strategies and provide multiple other ecosystem services such as flood prevention and refugia for rare species. The carbon sink function of peatlands is yet highly dependent on water saturation and vegetation composition. Nevertheless, drainage and peat extraction during the past centuries until today led to intense peatland degradation and turned more than half of all European peat soils and more than 90 percent of peat soils in Germany into a carbon source. Efforts have been increasingly made since the 1990s to restore peatlands, mainly by rewetting to recover peatland typical hydrological conditions. However, there is a lack of knowledge on restoration success for numerous sites, due to difficulties in funding long-term hydrological monitoring. Satellite remote sensing is an excellent method to address this deficiency, as it provides spatially continuous and temporally highly resolved information on the environment, including peatlands.

Making use of freely available data of the Landsat Mission, this study aims to analyze trends in surface moisture conditions of European peatlands over the last decades, a time frame in which many restoration measures have been implemented. We performed a pixel-wise trend analysis for European peatlands using the Normalized Difference Moisture Index as moisture indicator based on image time-series reaching back to 1984 and a spatial resolution of 30 x 30 m. Trend statistics using Mann-Kendall’s tau and Sen’s slope were calculated for each month separately to also enable analysis of changes in specific seasons, such as the growing season or shoulder seasons important for water recharge of the sites. Based on a random sample of peatland sites across all Europe, we show first results of european-wide trend patterns. For small-scale visualization and to facilitate a spatially explicit long-term monitoring of peatlands in active restoration management, we further present an open-source Google-Earth-Engine (GEE) application which additionally provides insights into changes in vegetation, as represented by the Normalized Difference Vegetation Index. 

Besides allowing the interpretation of changes in surface moisture conditions over the past decades, the GEE tool can also be used in the future to assess potential restoration sites or to improve our understanding concerning the resilience of peatlands in scenarios of a warming climate, where research is still in its infancy. The continental coverage of the analysis in combination with a temporal coverage of several decades on a monthly resolution offers exceptional possibilities for spatial planning and evaluation of European peatland restoration and can therefore contribute to a cost-effective implementation of climate change mitigation measures.

How to cite: Giese, L., Bahlmann, J., Baumberger, M., Lehmann, J., Ludwig, M., Sanchez, E., Schneidereit, H., Knorr, K.-H., and Meyer, H.: Trends in surface moisture conditions of European peatlands in the last decades - a remote sensing approach, EGU General Assembly 2023, Vienna, Austria, 23–28 Apr 2023, EGU23-8929, https://doi.org/10.5194/egusphere-egu23-8929, 2023.

EGU23-9226 | ECS | Orals | HS10.7

Hydrological response to rewetting of drained peatlands – case study of three raised bogs in Norway 

Marta Stachowicz, Paweł Osuch, Kjell Tore Hansen, and Mateusz Grygoruk

The presence of water in a peatland determines its proper functioning and is a prerequisite for its provision of ecosystem services other than water retention. Since the majority of degraded peatlands were drained for agriculture through the construction of ditches, the most common first step in the restoration of drained peatlands is rewetting through drain-blocking. The aim of this study was to analyze the hydrological response of three independent drained raised bogs in Norway (Aurstadmåsan, Midtfjellmosen and Kaldvassmyra) to ditch-blocking. The hydrological response to rewetting as well as the drain-blocking efficiency were assessed based on groundwater level monitoring conducted from 2015 to 2021 as a BACI design (Before-After-Control-Impact). The data was retrieved from water level loggers installed in piezometers placed in several locations at each of the sites. Rewetting technique used in the study sites included blocking the ditches draining the mires with peat dams. In each of the sites points with increased mean groundwater levels after rewetting were observed. It was also found, that the differences in precipitation before and after rewetting had no significant effect on groundwater levels. Both in Aurstadmåsan and Midtfjellmosen most of the piezometers reported an increase in average groundwater levels after rewetting. In Kaldvassmyra, 3 out of 8 piezometers reported an increase in mean groundwater levels. Even though in all sites precipitation was very similar before and after performed rewetting actions, comparison in Kaldvassmyra shows that the period after the implementation of restoration measures was noticeably drier. This might have inhibited the rewetting role of the dams in that site, which shows in the results. Considering the data from all impact piezometers, the groundwater levels increased by an average of 0.062 m. The same value for control piezometers was -0.003 m. The influence range of the ditch-blocking was 12.7-24.8 m, with the average of 17.2 m. Obtained results show that ditch-blocking might be an effective tool in restoring the hydrological conditions of peatlands, although it might be limited by meteorological factors, such as low precipitation. Assessment of the success of restoration should be integrated with the analyses of other conditions, including changes in vegetation cover or gas emissions (CO2, CH4, N2O).

How to cite: Stachowicz, M., Osuch, P., Hansen, K. T., and Grygoruk, M.: Hydrological response to rewetting of drained peatlands – case study of three raised bogs in Norway, EGU General Assembly 2023, Vienna, Austria, 23–28 Apr 2023, EGU23-9226, https://doi.org/10.5194/egusphere-egu23-9226, 2023.

EGU23-9288 | ECS | Posters on site | HS10.7

Illuminating Permeable Mineral Soil Groundwater Seepage Pathways Feeding Peatland Pools Using Thermal and Electrical Conductivity Signatures 

Henry Moore, Xavier Comas, Martin Briggs, Andrew Reeve, Victoria Niedzinski, and Lee Slater

Wetland environments are well documented to contain unique hydrogeomorphic subsystems that benefit from nutrient and temperature regimes provided by upwelling groundwater sources. Matrix seepage and preferential flow can both serve as groundwater inputs that control carbon-cycling within these environments. Recent work in a northern boreal peatland of Maine illuminates parallel dynamics to other wetland environments, with matrix seepage and preferential flow pathways (PFPs) identified and quantified proximal to peatland pools. PFPs around the peatland pools have been interpreted as peat pipes, known to transport nutrients within the peat matrix. Thermal signatures surrounding the peatland pool sources were mapped using point temperature measurements, handheld thermal imagery, and airborne thermal infrared mapping. Electrical geophysical methods were deployed to image the structure and stratigraphy of the underlying mineral sediments to delineate the source of focused upwelling around the peatland pools. Ground-penetrating radar (GPR) surveys show discontinuities in the impermeable glacio-marine clay controlling the hydrogeomorphic development of the peatlands studied. These mineral soil discontinuities in the GPR surveys, interpreted to be regional glacial esker deposits, are located proximal to the overlying peatland pools. Electromagnetic induction surveys were deployed to map the bulk electrical conductivity structures associated with the near-surface geology beneath the peatland pools. Point specific conductance measurements were taken at identified zones of thermal anomalies to further validate contrasts between peat pore water and mineral soil groundwater in the peatlands. Water samples were collected at the seepage sites and analyzed for iron and manganese trace elements to support the hypothesis that upwelling occurs from permeable glacial esker deposits. Focused groundwater inputs into peatlands may define a key hydrogeomorphic development process for peatland pool systems and the surrounding ecology. Further, these inputs could have implications for carbon-cycling, building on the established regional relationship between groundwater flow and carbon transport. Illuminating the focused groundwater flowpaths and interpreting their hydrogeologic origins may serve as a basis for future carbon-cycling exploration within peatlands at novel, fine-scales.

How to cite: Moore, H., Comas, X., Briggs, M., Reeve, A., Niedzinski, V., and Slater, L.: Illuminating Permeable Mineral Soil Groundwater Seepage Pathways Feeding Peatland Pools Using Thermal and Electrical Conductivity Signatures, EGU General Assembly 2023, Vienna, Austria, 23–28 Apr 2023, EGU23-9288, https://doi.org/10.5194/egusphere-egu23-9288, 2023.

EGU23-9683 | Orals | HS10.7

Ecohydrological and geological controls on contaminant reservoirs in degrading permafrost peatlands 

Jennifer M. Galloway, Mariusz Gałka, Graeme T. Swindles, Michael Parsons, Liam Taylor, Omid Ardakani, Stephen A. Wolfe, Peter D. Morse, Matt Amesbury, R. Timothy Patterson, Hendrik Falck, and Michael Palmer

Peatlands are important sinks and/or sources of carbon, solutes, and elements of potential concern (e.g., Hg, As, Pb, Cu, Zn) to their surrounding environments. Minerogenic permafrost peatlands that receive input of elements from groundwater and weathering of bedrock and surficial materials accumulate substantial amounts of geogenic-derived elements over millennia, which are then frozen in place. As the Arctic cryosphere thaws due to 21st. c climate warming, understanding of permafrost contaminant reservoirs and tracking their release is a growing challenge due to a lack of knowledge on the cumulative and interacting influences of bedrock and surficial geology, vegetation, climate, fire, and ecohydrology on contaminant accumulation in permafrost peatlands. We examined the Holocene history of two permafrost peatlands from the Northwest Territories, Canada, that are underlain by mineralized volcanic and metasedimentary (Daigle Lake peatland) and unmineralized granitoid (Handle Lake peatland) bedrock. Laboratory methods included pyrolytic speciation to determine the quality and quantity of solid organic matter; plant macrofossil and macroscopic charcoal analysis to reconstruct vegetation, peatland development, and fire history; testate amoebae to reconstruct paleohydrological conditions; and inorganic geochemical analyses to determine elemental concentration over time. Both sites have undergone several marked and broadly coincident hydrological shifts and phases of ecohydrological development. During the early Holocene (ca. 8000-5000 cal BP) initial shallow lake environments at both sites transitioned to rich fen and were colonized by Picea. Elevated concentrations of Zn (up to 65 mg.kg-1), Cu (up to 52 mg.kg-1), As (up to 140 mg.kg-1), and Cr (up to 65 mg.kg-1) occur in the basal lacustrine sediments, particularly at the Daigle Lake peatland that is underlain by mineralized bedrock, but become lower in overlying material that accumulated in a fen setting. Depth to water table increased by almost 30 cm in the Handle Lake peatland between ca. 5900 and 4900 cal BP, coincident with the Holocene Thermal Maximum. At this time, local fires were severe and frequent at both sites and associated with elevated Hg (up to 50 µg.kg-1) in the peat. After this dry interval, the water table rose at ca. 3000 cal BP at the Handle Lake peatland and by ca. 2200 cal BP at the Daigle Lake peatland. Fire occurrence declined, coincident with the relatively cool and wet conditions of the Neoglacial interval. A bog was established at both sites between ca. 2700 and 2200 cal BP. Fire occurrence and the concentration of Hg (up to 175 µg.kg-1), As (up to 300 mg.kg-1), and Zn (up to 50 mg.kg-1) have increased over the past 1000 cal yrs, likely due to a combination of anthropogenic input of As and Hg associated with gold mining in the region and global industrialization as well as warming climate and permafrost thaw. This study illustrates the influence of ecohydrology and bedrock geology on the chemical stores of permafrost peatlands.

How to cite: Galloway, J. M., Gałka, M., Swindles, G. T., Parsons, M., Taylor, L., Ardakani, O., Wolfe, S. A., Morse, P. D., Amesbury, M., Patterson, R. T., Falck, H., and Palmer, M.: Ecohydrological and geological controls on contaminant reservoirs in degrading permafrost peatlands, EGU General Assembly 2023, Vienna, Austria, 23–28 Apr 2023, EGU23-9683, https://doi.org/10.5194/egusphere-egu23-9683, 2023.

EGU23-9926 | Posters on site | HS10.7

Variability in water table conditions in degraded upland peatlands – a hydrological baseline for the Great North Bog 

Emma Shuttleworth, Danielle Alderson, Tim Allott, Martin Evans, Jonathan Ritson, Dominic Hinchley, Beth Thomas, and Tim Thom

The restoration of damaged UK peatlands is a major conservation concern and landscape-scale restoration initiatives are extensive in areas of blanket peatland in upland Britain. Because of the importance of a high water table to healthy peatland systems, it is the primary physical parameter considered in the monitoring the impacts of peatland restoration projects. Degraded peatland water tables can be highly variable in both time and space so require characterisation at a variety of scales. As such, a baseline understanding of landscape scale water table behaviour is required to properly assess the outcome of restoration projects.

This paper presents the preliminary findings of the first major restoration works of the Great North Bog Initiative – a new and exciting partnership that brings together the seven regional peatland restoration partnerships across the north of England under a single collaborative banner. The Protected Landscapes of the Great North Bog represent around 92% of the upland peat in England and includes four National Parks and three Areas of Outstanding Natural Beauty. This first phase of restoration spans 5670 ha of peatland across Yorkshire and the North Pennines, with the aim of abating 455,500 of CO2eq over a 50 year trajectory of recovery.  

We report the results of pre-restoration water table monitoring at ten sites with different degrees of management and degradation, including: drained, eroding and topographically ‘intact’ surfaces; heather and grass dominated vegetation covers; and unfavourable through to favourable national conservation designations. Our findings will provide a solid understanding of hydrological variation across these different sites and will form the baseline from which trajectories of recovery will be assessed.

How to cite: Shuttleworth, E., Alderson, D., Allott, T., Evans, M., Ritson, J., Hinchley, D., Thomas, B., and Thom, T.: Variability in water table conditions in degraded upland peatlands – a hydrological baseline for the Great North Bog, EGU General Assembly 2023, Vienna, Austria, 23–28 Apr 2023, EGU23-9926, https://doi.org/10.5194/egusphere-egu23-9926, 2023.

EGU23-9984 | Orals | HS10.7

A multi-sensor approach to the study of geomorphic, vegetation and hydrogeologic patterns of Alpine peatlands 

Sonia Silvestri, Anna Sartori, Marco Assiri, Regine A. Faelga, and Beatrice M.S. Giambastiani

Geomorphic and vegetation patterns within peatlands are strictly related, and reflect the interactions among topography, hydrogeology, and climate. Vegetation patterns are closely related to soil moisture, drainage patterns, bulk density and carbon content, and the spatial distribution of different plant species as well as the spatial variability of vegetation density may provide important information on key hydrogeological variables at the peatland scale. Therefore, the accurate mapping of vegetation patterns is a fundamental step to study the spatial distribution of peat properties and hydrogeological variables in the near-surface layer, where the roots of living plants develop, and peat accumulation and degradation processes occur. In this study we present the results obtained on two Alpine peatlands located in the Italian Dolomitic area, using field and UAV-based observations. Concurrent acquisitions of LiDAR, VIS/NIR Hyperspectral and VIS/NIR Multispectral sensors onboard of UAV systems were performed in July 2021 and July 2022. Field observations started in spring 2020 and ended in October 2022, including: water table summer monitoring (levels and temperature), soil sampling and analyses (bulk density, carbon content, peat layer thickness), vegetation sampling (plant associations, above- and below-ground biomass), and organic matter degradation assessment (based on the Tea Bag Index – TBI, Keuskamp et al. 2013). The combined analysis of field and UAV data allowed us to explore the correlation between vegetation, microtopography and hydrogeological patterns across the studied peatlands, determining the plant associations that best adapt to specific hydrogeological conditions (a phenomenon called “zonation”). Our results show that plant distribution, leaf area index and biomass are related to microtopography and water table levels and that they can be successfully mapped and monitored using UAV systems. Moreover, applying the TBI we explored the variability of the organic matter decomposition across the different plant associations as well as with depth (from the soil surface to the saturated zone). Our results show that the decomposition rate decreases with depth at all sites, while the stabilization factor increases, showing a significant correlation with the depth of the water table. Since the microtopography spatial variation is strongly linked to different soil moisture conditions, and therefore to different vegetation associations, we show that such associations can be used to map different hydrogeological conditions. The results of this study will be used to calibrate and validate an eco-hydrological model to forecast the future development of Alpine peatlands in different climate-change scenarios.

How to cite: Silvestri, S., Sartori, A., Assiri, M., Faelga, R. A., and Giambastiani, B. M. S.: A multi-sensor approach to the study of geomorphic, vegetation and hydrogeologic patterns of Alpine peatlands, EGU General Assembly 2023, Vienna, Austria, 23–28 Apr 2023, EGU23-9984, https://doi.org/10.5194/egusphere-egu23-9984, 2023.

EGU23-10683 * | Orals | HS10.7 | Highlight

The Alaska Peatland Experiment:  two decades of hydrologic experiments show resilience in peatland CO2 respiration 

Merritt Turetsky, Evan Kane, Eugenie Euskirchen, Catherine Dieleman, Allison Rober, Kevin Wyatt, Jason Keller, William Cox, and Hailey Webb

Northern peatlands are experiencing some of the most rapid climate warming on the planet, which is compounded by increases in the extent and severity of climate-related disturbances such as drought, wildfire, and permafrost thaw.  Cumulatively these changes lead to both peatland wetting and drying at various scales. Since 2005, we have maintained large-scale flooding and drought experiments in an Alaskan rich fen. While peatland science is dominated by the paradigm that deep catotelm C is protected from mineralization by lack of O2 supply, our results show remarkable resilience or lack of sensitivity of ecosystem respiration to fluctuations in water table position. This presentation will outline the rationale and support for three hypotheses we are testing to explain this trend: 1) changes in food web dynamics between detrital and algal channels promotes resilience in peatland autotrophic respiration; 2) changes in plant species composition in response to wetting or drying, such as increases in sedge abundance affects soil redox pool recharge and ultimately controls the ratio of CO2 to methane production; and 3) humic substances contribute to the regeneration of electron acceptor pools via electron shuttling, leading to more sustained anaerobic respiration rates than previously described.  Support for these hypotheses are not mutually exclusive, and demonstrate that the influence of hydrologic changes on peatland carbon emissions will be mediated by complex vegetation and soil processes.

How to cite: Turetsky, M., Kane, E., Euskirchen, E., Dieleman, C., Rober, A., Wyatt, K., Keller, J., Cox, W., and Webb, H.: The Alaska Peatland Experiment:  two decades of hydrologic experiments show resilience in peatland CO2 respiration, EGU General Assembly 2023, Vienna, Austria, 23–28 Apr 2023, EGU23-10683, https://doi.org/10.5194/egusphere-egu23-10683, 2023.

Permafrost peatlands are responding to recent high-latitude climate warming in dramatic fashion. These changes in terrain surface characteristics are affecting hydrology in a variety of ways. Increasing summer precipitation is leading to top-down thaw of permafrost across a variety of ecotypes. At smaller scales, studies are reporting the expansion of lateral thaw features and increased rates of thermokarst formation. Surface water plays a critical role in these processes. We have been combining site level field measurements, geophysics, remote sensing, and machine learning geospatial analyses to establish connections between the snowpack, vegetation, and permafrost thaw. The relationships we have identified allow projection of our site scale measurements across broader regions. This presentation summarizes results of recent studies by our research group at a variety of Interior Alaska peatland sites. In the first study, of the seasonal snowpack, we combined airborne hyperspectral and LiDAR measurements with machine learning methods to characterize relationships between ecotype and more than 26,000 snow end of winter snowpack measurements. We focused from 2014-2019 at three field sites representing common boreal ecoregion land cover types. These winters represent anomalously low (2016), typical mean, and high (2018) snowpacks. Hyperspectral measurements account for two thirds or more of the variance in the relationship between ecotype and snow depth. An ensemble analysis of model outputs using hyperspectral and LiDAR measurements yielded the strongest relationships between ecotype and snow depth. Since the seasonal snowpack often provides more than half of the yearly water equivalent these results have ramifications for surface water dynamics. In another study we used Landsat products to estimate fire-induced thaw settlement across the ice-rich Tanana Flats lowland in Interior Alaska that contains fens, bogs, and a variety of other wetland features. After linking fire areal extent, burn severity, land cover changes, and post-fire vegetation recovery we developed an object-based machine learning ensemble approach to estimate fire-induced thaw settlement from comparing repeat LiDAR to Landsat products. Our model delineated thaw settlement patterns across six unique fire scars and explained ~65% of the variance in LiDAR-detected elevation change. Results from a long term study of fen hydrology and climatology across Tanana Flats has tracked changes to hydrologic features and thermokarst development using historical image analysis, site scale measurements, and ground based geophysics. Repeat electrical resistivity tomography and high resolution ground surface elevation measurements identified thaw subsidence at a 10 year fire scar of more than a meter as a result of up to three meters of top-down permafrost thaw. At the same sites we have been able to quantify how lateral thaw of permafrost has led to the expansion of small ponds and bogs. We are now working to combine these geophysical and survey measurements with remote sensing information to project these land cover changes over a larger spatial extent.

How to cite: Douglas, T., Zhang, C., and Jorgenson, T.: Associations between peatland vegetation, the seasonal snowpack, and summer thaw processes in Interior Alaska permafrost with a focus on hydrologic ramifications, EGU General Assembly 2023, Vienna, Austria, 23–28 Apr 2023, EGU23-10728, https://doi.org/10.5194/egusphere-egu23-10728, 2023.

EGU23-11126 | ECS | Posters on site | HS10.7

How to find water for groundwater table management in cultivated peatlands? – Catchment based approach 

Miika Läpikivi, Maarit Liimatainen, Björn Klöve, and Hannu Marttila

Cultivated peatlands cause greenhouse gas emissions and nutrient leaching into water courses but are often important for local agriculture. Water table management, namely raising the water table (WT) in the soil horizon with controlled drainage or subirrigation, has been suggested as the most important management option for minimizing environmental impacts while continuing conventional agriculture. However, in many regions, including the Finnish west coastal areas near Bothnian Bay, it is difficult to obtain sufficient water volume for subirrigation purposes. Even with a flat topography and positive annual water balance, many cultivated fields require additional water input (subirrigation) if a higher-than-normal water table is desired during the summer. In areas with low lake percentages, this would require utilization of runoff from the upper catchment areas or storage of springtime excess water if summertime runoff is insufficient.

This project aims to improve practical knowledge and form an analytical framework to assist water management in cultivated peatlands. We measure WT fluctuations and soil physical properties, bulk density, and loss on ignition from 11 cultivated peatlands in the North Ostrobothnian region, and analyze the upper catchment properties, including the catchment area, soil surface, land use, and flow network for individual fields. We use WT and soil property measurements to analyze potential subirrigation needs for study fields, and catchment data to calculate the potential for upper catchment areas to produce or store the required water volumes. This analysis is used to form a practical framework for using a catchment-scale approach to address water management challenges in cultivated peatlands.

How to cite: Läpikivi, M., Liimatainen, M., Klöve, B., and Marttila, H.: How to find water for groundwater table management in cultivated peatlands? – Catchment based approach, EGU General Assembly 2023, Vienna, Austria, 23–28 Apr 2023, EGU23-11126, https://doi.org/10.5194/egusphere-egu23-11126, 2023.

EGU23-11270 | ECS | Posters on site | HS10.7

Fine-scale dynamic modelling of water table depths (WTD) in Danish peatlands 

Tanja Denager, Raphael Schneider, and Simon Stisen

In Denmark, re-wetting of drained peatland is considered an effective measure for reduction of agricultural greenhouse gas (GHG) emissions, due to the well-established relationship between water table depth and GHG emissions. Returning peatlands to their natural hydrological state, has additional benefits for nutrient loads and biodiversity and has becomes central in environmental policies.

Prevailing WTD-dependent GHG upscaling methods for peatlands are based on long term average WTD estimates, while there is limited understanding of the impact of WTD variability, extremes and how those effect rewetting strategies. This project aims to increase our knowledge on peatland WTD variability in space and time in high resolution to enable better estimation of the emission reduction potential and to support the rewetting strategies. Process-based hydrological models are important tools to support that effort.

We base our detailed simulation of peatland hydrology on an optimization of the national-scale Danish groundwater flow model with focus on the spatio-temporal patterns in peatlands. We identify the processes that govern peatland dynamics, including estimation of model parameters corresponding to those processes.

Besides local-scale insights on WTD dynamics from a highly instrumented peatland, we combine the physically based 3D groundwater flow model with remote sensing-based estimates of WTD in a spatial oriented optimization of the hydrological model.

Through scenario simulations we analyze the effects of climate variability and change, and especially how extreme events (e.g. droughts) impact GHG emissions controlled by WTD.

Those achievements enhance simulation of peatland processes, and the understanding of the climate response to the changes in WTD and will thereby support the Danish rewetting strategies and enables better upscaling of GHG emissions for national inventories.

How to cite: Denager, T., Schneider, R., and Stisen, S.: Fine-scale dynamic modelling of water table depths (WTD) in Danish peatlands, EGU General Assembly 2023, Vienna, Austria, 23–28 Apr 2023, EGU23-11270, https://doi.org/10.5194/egusphere-egu23-11270, 2023.

EGU23-11830 | ECS | Orals | HS10.7

UAS-SfM-derived Elevation Models to Evaluate Changes in the Flow Accumulation and Wetness in Minerotrophic Peatland Restoration Monitoring 

Lauri Ikkala, Anna-Kaisa Ronkanen, Jari Ilmonen, Maarit Similä, Sakari Rehell, Timo Kumpula, Lassi Päkkilä, Bjørn Kløve, and Hannu Marttila

Most northern peatlands are severely degraded by land use and drainage. Peatland restoration is an effective way to return the natural functions of peatlands in the catchment hydrology, discontinue the peat degradation and re-establish the long-term carbon sinks. The main aim of the rewetting is to direct the water flows back to the pristine routes and to increase the water-table levels. Conventional monitoring methods such as stand-pipe wells are typically limited to sparse locations and cannot give a spatially representative overview.

We introduced a novel high-resolution approach to spatially evaluate the surface flow path and wetness changes after restoration. We applied a UAS SfM (Unmanned Aerial System Structure-from-Motion) method supported by ubiquitous LiDAR (Light Detection and Ranging) data to produce digital elevation models, flow accumulation maps and SWI (SAGA Wetness Index) models for two boreal, minerotrophic restoration sites and their pristine control sites. The pristine sites were to represent natural changes and technology-related uncertainty.

According to our results, the hydrological restoration succeeded at the sites showing that the wetness increased by 2.9–6.9% and its deviation decreased by 13–15% 1–10 months after the restoration. Absolute changes derived with data from simultaneous control flights at the pristine sites were 0.4–2.4% for wetness and 3.1–3.6% for the deviation. Also, restoration increased the total length of the main flow routes by 25–37% while the controlling absolute change was 3.1–8.1%.

The validity of the topography-derived wetness was tested with field-gathered soil moisture samples which showed a statistically significant correlation (R2 = 0.26–0.42) for the restoration sites but not for the control sites. We conclude the water accumulation modelling based on topographical data potential for assessing the changed surface flows in peatland restoration monitoring. However, the uncertainties related to the heterogenic soil properties and complex groundwater interactions require further method development.

How to cite: Ikkala, L., Ronkanen, A.-K., Ilmonen, J., Similä, M., Rehell, S., Kumpula, T., Päkkilä, L., Kløve, B., and Marttila, H.: UAS-SfM-derived Elevation Models to Evaluate Changes in the Flow Accumulation and Wetness in Minerotrophic Peatland Restoration Monitoring, EGU General Assembly 2023, Vienna, Austria, 23–28 Apr 2023, EGU23-11830, https://doi.org/10.5194/egusphere-egu23-11830, 2023.

EGU23-15100 | Orals | HS10.7

Multispectral and thermal UAV monitoring of peatland response to climate warming 

Jakub Langhammer, Theodora Lendzioch, and Lukáš Vlček

Montane peatlands are one of the most sensible ecosystems influencing water storage, runoff volume, dynamics of runoff response, and water chemistry. Peat bogs in headwater catchments are also highly vulnerable to climate change's effects, particularly climate warming. 

This study examines the changes in mid-latitude montane peatland in response to the effects of climate warming. We tested a methodological approach for monitoring peatland changes in transient climate using multispectral and thermal Unpiloted Aerial Vehicles (UAV) imaging, enabling the understanding of spatial and temporal dynamics of changes in the peat bog at a high level of spatial detail. Our research aims to test the hypothesis, assuming that the decrease in precipitation and rise in air temperatures translates to drying, degradation, and reduction of the retention potential of montane peatlands. 

The study was conducted on the Rokytka mountain peat bog in Šumava, Czech Republic, which represents the largest complex of mountain peat bogs in Central Europe. The monitoring took place in the 2018-19 growing season, which represented the culmination of a prolonged period of heat and drought in the region, and was compared with 2021-22, representing, on the contrary, a wet season. Images were taken from an altitude of 100 meters using a UAV platform and Micasense RedEdge/Altum and FLIR sensors. The UAV monitoring was combined with continuous hydrological and hydropedological monitoring and in-situ calibration measurements. 

The high-resolution data showed different trajectories of changes in spectral vegetation indices and thermal response in the montane peatland. Multispectral imaging showed a progression of changes in the extent of wetland areas in response to warming and drought. High-resolution thermal mapping using UAVs then showed differential land surface temperatures in different vegetation categories and peatland zones. 

The study showed that the response of montane peatlands to climate change is highly diversified, even at a high level of spatial detail, among different zones of the given peat bog. For montane peatlands in remote areas and with often limited access, UAV monitoring using multispectral and thermal sensors proved to be a reliable tool for determining and modeling changing environmental conditions.

How to cite: Langhammer, J., Lendzioch, T., and Vlček, L.: Multispectral and thermal UAV monitoring of peatland response to climate warming, EGU General Assembly 2023, Vienna, Austria, 23–28 Apr 2023, EGU23-15100, https://doi.org/10.5194/egusphere-egu23-15100, 2023.

EGU23-15359 | ECS | Orals | HS10.7 | Highlight

Comparing the NFM potential of standard and optimised peat blocks used in peatland gully restoration 

Adam Johnston, Emma Shuttleworth, Tim Allott, Martin Evans, David Milledge, and David Brown

Extensive erosional gully networks are commonplace in degrading peatlands. Gullying produces local water table drawdown and the increase in drainage density associated with gully networks increases hydrological connectivity between hillslope and channel. Peatland restoration methods commonly involve blocking of gullies with peat or timber dams to limit further erosion and promote higher water tables. Blocking is also demonstrated to attenuate channel flow in peatland catchments, suggesting that gully blocks can provide Natural Flood Management (NFM) benefits. Block design can be further optimised for flood attenuation purposes, such as including an outlet pipe through the block to provide dynamic in-storm storage. 

This paper compares the hydrological functioning of standard peat dams and piped-peat dams optimised for NFM from neighbouring microcatchments (<2.5 ha) in the Peak District National Park, UK. Pre-restoration discharge was monitored for 12 months prior to installation of 6 standard peat dams in one microcatchment and 10 piped-peat dams in the other. Bottom of reach discharge and individual dam pool height was recorded for the following 12 months. The series of piped-peat dams are demonstrated to have a higher impact on catchment discharge than standard peat dams, reducing peak discharges and increasing lag times. Standard peat dams provide little storage volume during storm events compared to the dynamic storage provided by the outlet in piped-peat dams. However, the requirement for maintenance of pipe-peat dams is identified, with pipe blockages compromising dynamic storage. These findings have implications for understanding of NFM benefits from standard and NFM optimised peat dams. 

How to cite: Johnston, A., Shuttleworth, E., Allott, T., Evans, M., Milledge, D., and Brown, D.: Comparing the NFM potential of standard and optimised peat blocks used in peatland gully restoration, EGU General Assembly 2023, Vienna, Austria, 23–28 Apr 2023, EGU23-15359, https://doi.org/10.5194/egusphere-egu23-15359, 2023.

EGU23-15555 | ECS | Orals | HS10.7 | Highlight

A model-based investigation of hydrological processes in an agricultural peatland field 

Aleksi Salla, Harri Koivusalo, Heidi Salo, Mika Tähtikarhu, Maarit Liimatainen, Hannu Marttila, and Miika Läpikivi

Drained peatlands have peculiar hydrological properties and cause environmental concerns due to carbon dioxide emissions and nutrient fluxes resulting from decomposition of organic matter in peat. As peat degradation is strongly controlled by soil moisture conditions, it is assumed that flexible water management methods, such as controlled drainage, can be used to reduce the environmental impacts of drained peatlands in agriculture. While peat soils have been extensively researched, there is a need for increased understanding about the hydrological responses of peatlands to various water management schemes. Research is needed to quantify these responses, and a promising approach is to exploit simulation models for describing peatland hydrology at field scale. The goal was to calibrate and validate a hydrological model FLUSH to describe the hydrology of an agricultural field block having a shallow peat cover and managed with controlled drainage. FLUSH is a spatially distributed three-dimensional (3D) process model which simulates the hydrology of agricultural fields managed with controlled subsurface drains and open ditches. The soil description of FLUSH includes both soil matrix and macropores accounting preferential flow. Richards equation and Mualem-van Genuchten water retention model are applied for subsurface flow. The modeled field block is located in Ruukki, northwestern Finland, and the study period was from August 2018 to October 2021. Groundwater table depth and drain discharge observations were used for the calibration and validation. The Kling-Gupta efficiencies for the simulated groundwater table depths in soil matrix and macropore domains were 0.50 and 0.47, respectively, during the calibration period, and 0.23 and 0.33 during the validation period. The efficiency values for the simulated drain discharge during the calibration and validation periods were 0.18 and 0.19, respectively. Limiting the modeled area to the block lead to cumulative drain discharges clearly smaller than the observations. The underprediction was improved by extending the modeled area beyond the block, which suggested a presence of a hydrological connection in terms of groundwater flux originating from outside the block. Thus, the surrounding environment can play a role in the hydrology of peatland fields, and this should be considered in water management design. Despite the large difference between observed and simulated cumulative drain discharges, the main hydrological dynamics were captured, and the model formed a useful tool to simulate drainage scenarios in peatlands and to study the role of the surrounding areas on field hydrology.

How to cite: Salla, A., Koivusalo, H., Salo, H., Tähtikarhu, M., Liimatainen, M., Marttila, H., and Läpikivi, M.: A model-based investigation of hydrological processes in an agricultural peatland field, EGU General Assembly 2023, Vienna, Austria, 23–28 Apr 2023, EGU23-15555, https://doi.org/10.5194/egusphere-egu23-15555, 2023.

EGU23-15608 | Orals | HS10.7

Scenario-based groundwater modeling of a raised bog with Mike She 

Sebastian Friedrich, Alexander Gerner, Chiogna Gabriele, and Markus Disse

Water table modeling in peatlands is often done on the large scale and, consequently, based on coarsely resolved models. The models commonly used in literature are often either not capable of modelling the full water cycle or they are not purely physically based. In particular in Bavaria there is a high number of small isolated peatlands with a dense drainage network, therefore a coarse model is not feasible. For rewetting success and climate impact analysis the fully integrated and largely physically based Mike She modelling software by DHI was used in the KliMoBay Project.

The main goal was to achieve a temporally and spatially highly resolved model enabling water table investigations for different rewetting stages as well as associated vegetation and soil changes.

For this purpose, the partially rewetted raised bog Königsdorfer Weidfilz in Bavaria was monitored and replicated in Mike She. Active and partially rewetted drainage ditches were implemented in the hydrodynamic model Mike Hydro and coupled with the Mike She model. After calibration and validation on twelve automatic water level gauges, scenario analyses were conducted. Compared with the climatic reference period (1961 – 1990), the dry year 2018 and the average year 2020 were modeled for three different scenarios: 1. current state, 2. drainage ditches deactivated, 3. vegetation and soil property succession after rewetting. The influence on the water table was analyzed based on a reference depth of - 0.15 m which is considered as an average threshold for climate impact. For this purpose, seasonal and annual mean water table maps were created, as well as standard deviation maps to portray high water table dynamics within the respective mean season.   

As the model results show, it is possible to investigate even small peatland areas for their rewetting potential. Furthermore, we could show the positive impact of rewetting measurements on reducing climate active areas with water levels below - 0.15 m in raised bogs. Vegetation and thus soil property changes in the model – which are assumed to occur after sufficient rewetting along with active acrotelm growth – increase the effect even more. Although, the impact of dry seasons is still significant, the resilience of the peatland increases.

Using the example of the partially rewetted raised bog we were able to proof, that areas with different drainage states could be modeled. The areas rewetted in the respective model scenario react similar to the areas already rewetted in nature. Thus, we assume that the method is capable for planning stages. Consequently, it can offer a descriptive decision support tool. However, the process of model setup, calibration and validation is rather time consuming. Regarding fen peatland management, further models can be set up considering the capability of Mike Hydro to model controllable weirs.

How to cite: Friedrich, S., Gerner, A., Gabriele, C., and Disse, M.: Scenario-based groundwater modeling of a raised bog with Mike She, EGU General Assembly 2023, Vienna, Austria, 23–28 Apr 2023, EGU23-15608, https://doi.org/10.5194/egusphere-egu23-15608, 2023.

EGU23-16283 | ECS | Posters on site | HS10.7

Can peat reduce evaporation during dry periods? 

Tomáš Weiss and Lukáš Vlček

Peat soils not only provide a habitat for distinctive fauna and flora, but are also the most efficient carbon sink on the planet, as peatland flora captures carbon dioxide released from the peat. However, many peatlands are currently drained because of agriculture, peat extraction, or forestry, thus leading to oxidation and decomposition of the organic matter causing carbon dioxide to be released into the atmosphere. Another potential risk of peat drying comes from the increasing probability of heat waves due to climate change. We therefore conducted sub-profile-scale laboratory experiments that aim to answer the question of how extreme heat influences hydrological behaviour of mountain peat from the Sumava mountains, Czechia.


The preliminary results suggest that during dry periods, such as prolonged heat waves, our tested peat in fact decreases the evaporation rate, provided that the depth of the groundwater table is kept constant. However, when we allow peat to dry completely without controlling the groundwater table level, desiccation cracks form, which work as conduits for ever deeper subsurface evaporation. Therefore, the level of groundwater table is critical in answering the question.


The described negative feedback showing that extreme potential evaporation can cause a decrease in actual evaporation comes as a surprise, since peatlands are usually understood as a wet land cover that cools the surrounding environment. We have shown that this does not always have to be the case, and we suggest that this mechanism should be studied further. Our small-scale laboratory experiments should also be tested in a natural setting to confirm these results.

How to cite: Weiss, T. and Vlček, L.: Can peat reduce evaporation during dry periods?, EGU General Assembly 2023, Vienna, Austria, 23–28 Apr 2023, EGU23-16283, https://doi.org/10.5194/egusphere-egu23-16283, 2023.

EGU23-17199 | ECS | Posters on site | HS10.7

Identifying the dominant hydrochemical processes post wetland restoration along stream valleys, Denmark 

Filippa Fredriksson, Marta Baumane, Lars Båstrup-Spohr, Hans Henrik Bruun, Kenneth Thorø Martinsen, Sofie Aagaard, Bjørg Friis Michelson, Kaj Sand-Jensen, and Søren Jessen

Restoration and rewetting of wetlands previously drained for agriculture, is currently used to decrease net greenhouse gas (GHG) emissions, while improving biodiversity. Wetland hydro(geo)logy is known to exert a key control on GHG-retention and on conditions facilitating improved biodiversity. Yet knowledge of the major hydrochemical processes that occur in wetlands prior to drainage and after restoration is limited, although links between wetland hydrochemistry, GHG-retention and biodiversity might well exist. To reduce the knowledge gap, we sample surface waters, precipitation, and shallow (<1 m) groundwater from 61 wells. The sampling sites are either near-natural or restored wetlands of the riparian zone, and are distributed along three separate stream valleys, with subsurface geologies consisting of carbonate rock, glacial till or sand from glacial outwash. Furthermore, the wetlands are categorized based on management (grazed or unmanaged). Surface and groundwater samples are analyzed for dissolved major ions, methane (CH4), organic carbon (DOC), fluorescence, and all samples are analyzed for stable water isotopes (δ18O, δD) and electrical conductivity (EC). EC, pH, dissolved oxygen (O2) and temperature are measured in the field using a flow cell. Initial results from the groundwater wells in the wetlands indicate EC values between 101-5300 μS/cm (the high end due to marine influence), O2 between 0.1-6.7 mg/L, and that the pH varies from acidic (min. 5.0) to alkaline (max. 7.7). The groundwater’s Fe(II) concentration appears to be significantly elevated in restored stream valley sites versus the near-natural sites. The results suggest differences in redox conditions that in turn may control production of GHGs, such as CH4. In addition, the hydrochemistry and subsurface geology seem to be a key factor in the development of the present vegetation in the various field sites. With shifting climate, terrestrial wetness will change too, under influence of hydrogeochemical-vegetation interactions. To understand the associated climate feedbacks, a detailed understanding of wetland hydrology and ecology is needed. Through a method-independent approach, this study helps clarify the response related to hydrochemistry, geology, and time. The increased understanding could also contribute to fine-tuning of current and future restoration programs, thus increasing their success.

How to cite: Fredriksson, F., Baumane, M., Båstrup-Spohr, L., Bruun, H. H., Martinsen, K. T., Aagaard, S., Michelson, B. F., Sand-Jensen, K., and Jessen, S.: Identifying the dominant hydrochemical processes post wetland restoration along stream valleys, Denmark, EGU General Assembly 2023, Vienna, Austria, 23–28 Apr 2023, EGU23-17199, https://doi.org/10.5194/egusphere-egu23-17199, 2023.

Hydrological turnover (HT), i. e. gross gains and losses of water along a stream or river is highly variable, producing spatial exchange patterns influenced by local surface and groundwater levels, geology, topography, channel morphology and sediment structures. However, seasonal variations of discharge and catchment storages might be additional factors influencing the locally occurring fraction of streamflow subject to HT.

We studied these process interactions at a third order tributary of the river Mosel in Trier, Germany by measuring HT 133 times (in total 399 individual discharge measurements) at two different stream reaches (~500 m each) over a period of two years. The two reaches show a pronounced seasonality in drainage behavior and differ mainly in valley width.  The underlying, silicate rich Devonian schists and slates enable the use of silicate as a marker for prolonged contact with the underground. Hence, we took samples for silicate concentrations in stream water as well as in the near-stream groundwater, regularly (in total 270 samples). For this purpose, we installed three sets of two groundwater wells at each reach. The first well of each set was located directly at the stream bank and the second well in a distance of 3 m from the stream. Thus, we created snapshots of the boundary layer between ground- and surface water where turnover induced mixing occurs. The results show in accordance with literature a site specific negative correlation of HT with discharge, while reach scale net Q changes correlate with HT only at the upstream site which is characterized by steeper hillslopes compared to the downstream section. Analyzing reach specific variation of silicate concentrations between stream and wells suggests that in-reach silica variation increases with the decrease of hydrological turnover and vice versa. This relationship differs between the two reaches and shows significant seasonal effects. These findings are supported by the results of a delayed/base flow separation analysis for both reaches, which shows a faster drainage behavior and a less pronounced contribution of longer delayed groundwater sources for the narrow valley upstream site.

These results imply that besides the discharge-induced HT variability seasonal states of groundwater storages might be an additional control on the magnitudes of HT affecting physical stream water composition throughout the year.


How to cite: Bäthke, L. and Schuetz, T.: How catchment properties shape variation in groundwater- surface water interaction: Using geogenic silicate as a tracer in hydrological turnover research, EGU General Assembly 2023, Vienna, Austria, 23–28 Apr 2023, EGU23-655, https://doi.org/10.5194/egusphere-egu23-655, 2023.

It is well known that the intensive biogeochemical activity in hyporheic zone of groundwater and antibiotic contaminated river water induced the pollution diffusion and variation of biogeochemical transformation. However, the complex interaction process caused by water level fluctuation is difficult to accurately depict on a larger, catchment scale. Therefore, a loosely coupled HYDRUS-3D/GMS was established in Chaobai river basin to simulate the sulfamethazine (SMZ) pollution interaction process caused by river and groundwater level fluctuation. The upward fluctuation of river water level increased the migration of SMZ from surface water to the hyporheic zone soil and groundwater with the rate of 3.04 m/(y·m), which accelerated the pollution diffusion. Moreover, the rise of river water level reduced DO and ORP in hyporheic zone, which induced the biochemical transformation of SMZ from aerobic to anoxic and anaerobic, thus reduced 25% decomposition rate and increasing 7 times expression of resistance genes. The expression of ARGs sul1, sul2, sul3 were positively correlated with the SMZ concentration with coefficient of 0.9954, 0.9856, 0.9689. The biogeochemical behavior of SMZ was completely opposite when the river water level fell back in the dry season compared with that of water level rising, which contributed to the decomposition of accumulative antibiotics in the hyporheic zone. However, the upward fluctuation of groundwater table led to the secondary release of 20% SMZ accumulated in hyporheic zone soil and the reverse interaction of river water pollution, which induced increase in the abundance of resistant bacteria, thereby enhancing the expression intensity of ARGs. In addition, the accumulation and diffusion of SMZ were also closely related to soil physicochemical properties (P<0.01 to BET; P<0.001 to TOC) and microbial community structure during the interaction between groundwater and surface water in hyporheic zone. The accumulation of SMZ increased the ecological risk and induced the variation of microbial community structure and relative abundance. The enrichment of these antibiotic degrading genera, Hyphomicrobium, Thermomonas and Comamondaceae, improve the degradation of antibiotics and enhanced the expression of resistance genes sul1 and sul2, which increased the risk of drug resistance of superbacteria. This study provided a new approach to predict the variation of SMZ biogeochemical behavior and expression of resistance genes in the hyporheic zone due to water level fluctuation, which can effectively improve removal technologies and the drinking safety of groundwater.

How to cite: Zhu, S., Zhang, L., Niu, J., and Ma, W.: Water level fluctuation induced variation of sulfamethazine biogeochemical behavior and expression of resistance genes in the hyporheic zone: A case study of Chaobai river, China, EGU General Assembly 2023, Vienna, Austria, 23–28 Apr 2023, EGU23-821, https://doi.org/10.5194/egusphere-egu23-821, 2023.

EGU23-867 | ECS | Posters on site | HS10.8

Simulating wet front evolution along a sinuous riverbank to understand impact of bank slope on hyporheic flow and transport 

Yiming Li, Zhang Wen, Stefan Krause, and Uwe Schneidewind

Hyporheic exchange flow (HEF) is one important driver determining the spatial and temporal evolution of the biochemical characteristics predominant in the hyporheic zone (HZ) of rivers. As such, better understanding of HEF patterns will allow us to improve our quantitative estimates of the biochemical reaction potential in the HZ and the wider river corridor. While HEF has been found to be impacted by riverbank morphology (including sinuosity and bank slope) past studies have specifically neglect the effect of bank slope in combination with river sinuosity.


Here we simulate and assess the impact of bank slope on the spatial extent of the HZ of a meandering river and on the evolution of HEF and residence times (RT) into the alluvial aquifer under varying aquifer transmissivity conditions. We use a 2-D numerical finite element model set up in COMSOL and implement variations in lateral bank slope by using a deformed geometry method (DGM) to simulate the wet front evolution into the alluvial aquifer during a dynamic flood event. Different scenarios were run for varying combinations of bank slope angle and aquifer transmissivity.          


Our results show that the impact of bank slope on HEF and wet front evolution was more pronounced in aquifers with lower transmissivity. Furthermore, the impact of bank slope can lead to both shorter and longer residence time of river water in the alluvial aquifer, depending on whether HEF is infiltrating a point bar or cut bank.


Aquifers with high transmissivity were more impacted by bank slope during the flood event, whereas aquifers with lower transmissivity were less impacted by bank slope during the flood event but while this impact lasted much longer into the post-flood-event phase. Overall, our study shows that river sinuosity and bank slope should be considered when assessing HEF and RT in river corridors.

How to cite: Li, Y., Wen, Z., Krause, S., and Schneidewind, U.: Simulating wet front evolution along a sinuous riverbank to understand impact of bank slope on hyporheic flow and transport, EGU General Assembly 2023, Vienna, Austria, 23–28 Apr 2023, EGU23-867, https://doi.org/10.5194/egusphere-egu23-867, 2023.

EGU23-874 | ECS | Orals | HS10.8

Multitemporal analysis of hydropeaking and surface water-groundwater interaction at regional scale 

Mónica Basilio Hazas and Gabriele Chiogna

The management of hydropower plants affects the discharge of the rivers at multiple temporal scales, including daily, weekly and yearly signals, which in turn propagate into the aquifer. In this work, we apply wavelet analysis techniques to study how the weekly signal affects the groundwater table in an Alpine valley in the north of Italy. The valley is traversed by four reaches differently affected by hydropeaking. In our study, we prepared a transient model of the aquifer during two different hydrological years: 2009/10 and 2016/17, the second characterized by lower precipitation. We analyze both the river and the groundwater heads using continuous wavelet analysis and wavelet coherence analysis. Results show that hydropeaking displays a stronger weekly signal during drought conditions, not only in the river fluctuations but also in the groundwater heads and the exchanged water between the rivers and the aquifer. In addition, maps based on the weekly signal reveal that despite the stronger impact during the drought conditions, the area of the aquifer affected by hydropeaking is similar in the two compared years.

How to cite: Basilio Hazas, M. and Chiogna, G.: Multitemporal analysis of hydropeaking and surface water-groundwater interaction at regional scale, EGU General Assembly 2023, Vienna, Austria, 23–28 Apr 2023, EGU23-874, https://doi.org/10.5194/egusphere-egu23-874, 2023.

EGU23-1271 | ECS | Orals | HS10.8

Quantifying braided river loss to groundwater using Active Distributed Temperature Sensing 

Alice Sai Louie, Leanne Morgan, Eddie Banks, David Dempsey, and Scott Wilson

Globally, braided river systems are a major recharge mechanism for alluvial aquifer systems providing a significant contribution to groundwater, yet this process of surface water – groundwater (SW - GW) interaction is a gap in hydrological research. River leakage from braided rivers is the main source of groundwater recharge in the Canterbury Plains of New Zealand (Coluccio & Morgan, 2019). This study investigated surface water – groundwater interaction in the Waikirikiri Selwyn River, in the South Island of New Zealand, using Active-Distributed Temperature Sensing (A-DTS) and estimated groundwater recharge to the alluvial aquifer system, as outlined in Banks et al. (2022).

The field study site is within an ephemeral losing reach of the river and contains two active channels. Braided rivers are dynamic, high-energy environments; therefore, the fibre-optic cables were installed beneath the ground to protect this infrastructure from regular flood events. Novel horizontal Directional Drilling was used to construct two, 100 m long drillholes at a depth of approximately 5 m below ground level and perpendicular to the river channel. The drillholes were completed with a hybrid fibre optic cable containing four multi-mode fibres and copper conductors. Additionally, a vertical A-DTS installation was constructed to 30 m depth adjacent to the river channel and horizontal drillhole. 

A series of twelve back-to-back A-DTS surveys on the horizontal and vertical A-DTS installations were conducted over 48-hrs. River stage and flow during the survey period was constant, hence steady-state groundwater recharge conditions were assumed. The localised temperature variations along the cables indicated spatial variation of preferential groundwater recharge pathways. Groundwater velocities were derived using both analytical and numerical solutions and preliminary results indicate vertical groundwater velocities exceeding 10 m/d. By calculating groundwater velocities it is possible to quantify groundwater recharge from braided rivers with high spatial and temporal resolution, which can aid in understanding the recharge process and the relationship between river stage height and groundwater recharge rates.


References

Banks, E. W., et al. (2022). "Active distributed temperature sensing to assess surface water–groundwater interaction and river loss in braided river systems." Journal of Hydrology 615: 128667.


Coluccio, K. and L. K. Morgan (2019). "A review of methods for measuring groundwater-surface water exchange in braided rivers." Hydrology and Earth System Sciences 23: 4397-4417.

How to cite: Sai Louie, A., Morgan, L., Banks, E., Dempsey, D., and Wilson, S.: Quantifying braided river loss to groundwater using Active Distributed Temperature Sensing, EGU General Assembly 2023, Vienna, Austria, 23–28 Apr 2023, EGU23-1271, https://doi.org/10.5194/egusphere-egu23-1271, 2023.

EGU23-1724 | ECS | Posters on site | HS10.8

Natural constraints and the damaged Meli gold mining: forecasting impact on the water resources quality of the Meli area and the surroundings, Tigray  

Kaleab Adhena Abera, Berhane Abrha, Tesfamichael Gebreyohannes, Abdelwassie Hussien, Miruts Hagos, Gebremedhin Berhane, and Kristine Walraevens

Natural constraints and the damaged Meli gold mining: forecasting impact on the water resources quality of the Meli area and the surroundings, Tigray 

 Kaleab Adhena Abera 1, Berhane Abrha 2,  Tesfamichael Gebreyohannes 2, Abdelwassie Hussien 2 ,  Miruts Hagos 2, Gebremedhin Berhane 2, and Kristine Walraevens 1

1 Laboratory for Applied Geology and Hydrogeology, Department of Geology, Ghent University, Belgium (kaleabadhena.abera@ugent.be)

2 Department of Geology, School of Earth Science, Mekelle University, Ethiopia


Abstract: Meli is the only modern gold mining site in the Tigray region, Northern Ethiopia. Water resources of this area and the surroundings are currently very susceptible to pollution by toxic chemicals than ever before, due to both the natural geological setup of the area and anthropogenic impacts, specifically because of the recent war in northern Ethiopia. The war that was started on November 03, 2020, resulted in the complete destruction of the mining company and tailings dam due to bombing. This potentially could lead to the uncontrolled movement of wastewater from the dam to the environment. The area is characterized by quite complex geology and associated geological structures. In addition to the direct flow of contaminant plumes to downstream areas as surface water, the naturally existing geological fractures, as well as faults, could also act as conduits and increase the infiltration rate of the pollutants to the groundwater resource. In this research, integrated geological, structural, and remote sensing methods were applied. Mapping of geology and geological structures was compiled using both Spot and Landsat satellite images and a physical field survey conducted before the war started. Metavolcanics, metasediments, granite, and sandstone are the identified lithologies in the area. The detailed fracture measurement helps determine the possible flow direction of water and the pollutants. Totally, 110 structural measurements were taken, and the area is affected by a series of Neoproterozoic structures. These include WNW–ESE striking compression, NE –SW striking exfoliation fractures, and variably oriented faults. Moreover, structures such as folds, minor strike-slip faults, and joints were observed. The chemicals used in the gold mining company were evaluated. The Meli area tailing dam contains wastewater with a very high concentration of cyanide, caustic soda, heavy metals, and salts which are very toxic. The possible impact of these pollutants on water resources was forecasted and threat-solving mechanisms were proposed. The result of this research work will serve as a baseline for further pollution impact studies at a larger catchment scale and as an input for groundwater resource pollution modeling works of the Meli area and the surroundings.

How to cite: Abera, K. A., Abrha, B., Gebreyohannes, T., Hussien, A., Hagos, M., Berhane, G., and Walraevens, K.: Natural constraints and the damaged Meli gold mining: forecasting impact on the water resources quality of the Meli area and the surroundings, Tigray , EGU General Assembly 2023, Vienna, Austria, 23–28 Apr 2023, EGU23-1724, https://doi.org/10.5194/egusphere-egu23-1724, 2023.

EGU23-2145 | ECS | Posters on site | HS10.8

Effects of solute release position on transient solute dispersion across the sediment-water interface: A modeling study 

Pengcheng Xu, Lingling Wang, Jin Xu, Zhe Wang, Han Chen, and Mengtian Wu

Understanding the fundamental mechanisms of solute transfer across the sediment-water interface (SWI) is essential for comprehending river functioning. Considering the stochastic and complex pollutant emissions across the SWI, we investigate the effects of release position on the solute transport in this work. Linking turbulent momentum and solute transport in the hyporheic zone through numerical modeling. Simulation results reveal that the location of the point source release determines the initial convection and dispersion intensity, which in turn affects the process of solute dispersion across the SWI. The location of solute release can affect hyporheic mixing processes more significantly than changes in streambed permeability. The penetration of turbulence into the streambed directly controls both interfacial exchange and mixing within a transition layer below the SWI, which is consistent with previous findings. In addition, the finite-time Lyapunov exponents are used to describe the lagrangian coherent structures of the flow field in the whole process, which provides a new perspective to reveal the mixing process of solutes across the SWI.

Acknowledgments

This research was funded by the National Key R&D Program of China (2022YFC3202605), the Fundamental Research Funds for the Central Universities (B200204044), the Research funding of China Three Gorges Corporation (202003251).

How to cite: Xu, P., Wang, L., Xu, J., Wang, Z., Chen, H., and Wu, M.: Effects of solute release position on transient solute dispersion across the sediment-water interface: A modeling study, EGU General Assembly 2023, Vienna, Austria, 23–28 Apr 2023, EGU23-2145, https://doi.org/10.5194/egusphere-egu23-2145, 2023.

EGU23-2177 | Posters virtual | HS10.8

Modeling stream heat budget with HFLUX in a subtropical alpine intermittent river 

Tsung-Yu Lee, Yen-Wei Pan, and Yung-Chia Chiu

Surface water and groundwater interactions between the stream and the hyporheic zone profoundly affect river intermittency and biogeochemical processes, yet they are rarely quantified. As an excellent natural tracer, temperature was used to quantify unknown patterns of hydrologic fluxes and to understand their impact on heat budget over time and space. The Yousheng Creek (a first-order upstream of Chichiawan Creek in Taiwan) is one of the crucial habitats for the endangered species of Formosan land-locked salmon. In recent years, stream disconnection seriously limited the expansion of the salmon habitat, hampering the rehabilitation work. This study takes heat as a tracer to examine exchange processes in the intermittent reach of Yousheng Creek, with the application of fiber-optic distributed temperature sensor (FO-DTS). The combined use of FO-DTS, stream heat budget model (the HFLUX computer program), drone imagery, meteorological measurements, and field surveys allowed for identifying, quantifying, and mapping groundwater inputs beneath the 1924 meters reach. Analysis of the temperature traces measured from June 23rd to June 25th, 2019, have identified several active hyporheic zones and groundwater discharge points, providing significant cooling in the study section. HFLUX successfully modeled the river temperature through time and space with a normalized root mean square error of 3.12%. Inference from the model indicates a series of high infiltration zones at midstream whereas primary groundwater discharge from the downstream. The results suggest that different groundwater contributions along the Yousheng Creek significantly impact river temperatures. These insights of groundwater-surface water interactions can be applied to improve the knowledge of hydrology processes and energy budgets in headwaters

How to cite: Lee, T.-Y., Pan, Y.-W., and Chiu, Y.-C.: Modeling stream heat budget with HFLUX in a subtropical alpine intermittent river, EGU General Assembly 2023, Vienna, Austria, 23–28 Apr 2023, EGU23-2177, https://doi.org/10.5194/egusphere-egu23-2177, 2023.

EGU23-2459 | Posters on site | HS10.8

Reliability-Based Approach to Hyporheic Zone Depth Delineation for Groundwater Remediation Strategy 

Heejung Kim, Jae E Yang, and Minha Lee

Natural phenomena like hyporheic zone depths show intrinsic statistical behavior due to large variability of related parameters. In the previous researches, authors proposed a deterministic method to delineate hyporheic zone depth using a simple field temperature measurement, and studied a probabilistic method to present a proper statistical distribution model for hyporheic zone depth. As a next step forward, this research proposes remediation strategies on contaminated groundwater system in relation to hyporheic zone depth management. Primarily, demand of hyporheic zone depth to achieve a required recovery ratio is predetermined. The field hyporheic zone depth is, then, changed according to each strategies. The two probabilistic variables, demand and field values, are modified such that the difference are reduced. 

The index applied to evaluate each strategy in this paper was adopted from the concept of reliability index. This approach is frequently used in many fields of science and engineering, including a safety design of structures. The key point of safety design involves sufficiency of safety margins between a strength criterion and the requirements, and this is what the reliability index evaluates. The paper is structured to introduce reliability-based approach in terms of general concept and hyporheic zone depth management first, and proceeds to a development of index. The paper concludes with performance evaluation of strategies. This paper is of value because a combination of the previous research on the probabilistic property extraction of hyporheic zone depth and the presented approach of performance evaluation has potential to offer another useful tool to the remediation of contaminated groundwater.

Acknowledgement: This research was funded by the Korea Ministry of Environment through the strategic EcoSSSoil Project at the Korea Environmental Industry and Technology Institute (grant no. 2019002820004) and National Research Foundation of Korea (NRF), funded by the Ministry of Education (grant numbers 2019R1I1A2A01057002 and 2019R1A61A0303

How to cite: Kim, H., Yang, J. E., and Lee, M.: Reliability-Based Approach to Hyporheic Zone Depth Delineation for Groundwater Remediation Strategy, EGU General Assembly 2023, Vienna, Austria, 23–28 Apr 2023, EGU23-2459, https://doi.org/10.5194/egusphere-egu23-2459, 2023.

EGU23-3588 | ECS | Posters on site | HS10.8

Mixing magnitude and extent within the benthic biolayer for different morphology types 

Ahmed Monofy, Fulvio Boano, and Stanley B.Grant

Mixing between water column and sediment is a crucial physical process for the fate of nutrients and for the biogeochemical reactions in the stream ecosystem. There are two factors that characterize this mixing process: the mixing magnitude at the sediment water interface, which controls the amount of solutes exchange between water column and its underlying sediment layer; and the mixing extent that defines how quickly the mixing rate decays with depth of the sediment laye.  The vertical mixing process has been shown to be well represented by a 1-D equivalent diffusivity model with exponentially decaying profile in the vertical direction. This exponential profile is controlled by two parameters: the effective diffusion at the sediment water interface, that is equivalent to the mixing magnitude, and the decay coefficient of the exponential, that represents the reciprocal of the mixing extent.

The 1-D diffusivity model was applied to a large dataset of experiments from literature that were conducted with conservative solutes on three different morphology types: flat beds, dunes and ripples, and alternate bars. The mixing magnitude and extent appears to be the largest in alternate bars, the smallest in flatbed and intermediate in dunes and ripples. Afterwards, the dependence of the mixing magnitude and mixing extent on stream and sediment characteristics was studied to derive a regression model to infer the values of the mixing controlling parameters from stream and sediment characteristics. This regression model was developed in dimensionless form using the Multiple Linear Regression (MLR) technique.  The regression formulae demonstrate no dependence of the mixing magnitude on morphology type, while it is significantly correlated to the permeability Reynolds number (Re_k) that depends on sediment permeability, shear velocity and water viscosity. On the other hand, the mixing extent of solutes within the benthic biolayer can be categorized based on the morphology type. Specifically, for flat beds the mixing extent exhibits different trends of dependance on the permeability Reynolds number due to the dominance of different physical process for each interval of Re_k. Instead, for dunes and ripples the mixing extent is monotonically correlated to the bedform (ripple or dune) wave number, as expected from literature. Finally, due to the limited number of experiments on alternate bars we were not able to derive a robust and reliable regression formula for this morphology type. Therefore, more experiments under different conditions should be performed with alternate bars. These results help to unravel the influence on mixing processes of different characteristics of streams and their sediments.

How to cite: Monofy, A., Boano, F., and B.Grant, S.: Mixing magnitude and extent within the benthic biolayer for different morphology types, EGU General Assembly 2023, Vienna, Austria, 23–28 Apr 2023, EGU23-3588, https://doi.org/10.5194/egusphere-egu23-3588, 2023.

Nitrogen pollution is an important cause of lake eutrophication, and the deterioration of lake water quality caused by nitrogen pollution has attracted wide attention worldwide. Honghu Lake is a large lake located in the middle and lower reaches of the Yangtze River in China, which has been threatened by nitrogen pollution for a long time. We studied the evolution of Hong Lake from 1990 to 2020. From 1990 to 2005, the natural water area of Hong Lake decreased by 72%, and most of the natural water was converted into aquaculture water, resulting in the rapid deterioration of lake water quality. Farming was gradually banned after 2005 and the area of natural water has been restored, but the lake's water quality has not improved, indicating that the lake is also threatened by other sources of pollution. According to the results of two groundwater surveys in 2011-2012 and 2019-2020, we found that the nitrate nitrogen content in groundwater in the study area increased from 1.29mg/L to 3.58mg/L. We also collected sediment samples from the lakeshore zone, and the test results showed that a large amount of exchangeable nitrogen was adsorbed on the sediment. Groundwater is one of the important factors causing nitrogen pollution in lake.

How to cite: Tang, L.: Nitrogen accumulation in a big lake along wetland evolution affected by groundwater and surface water interaction in central Yangtze River Basin, EGU General Assembly 2023, Vienna, Austria, 23–28 Apr 2023, EGU23-4778, https://doi.org/10.5194/egusphere-egu23-4778, 2023.

EGU23-5649 | ECS | Orals | HS10.8

Innovative real-time iFLUX sensors reveal rapidly changing groundwater – surface water dynamics in peatlands of the Upper Biebrza Basin (Poland) 

Niels Van Putte, Marjan Joris, Timothy De Kleyn, Joris Cools, Maria Grodzka-Łukaszewska, and Goedele Verreydt

Interactions between groundwater and surface water are of crucial importance for the ecological functioning of wetland systems since they control groundwater levels in the wetlands, water temperature in the river and exchange of solutes. Anthropogenic impacts such as the construction of drainage systems in the vicinity of wetlands can completely change the magnitude and direction of groundwater – surface water exchange, often negatively affecting the ecological functioning of the wetlands.

Management practices aiming to conserve the ecological status strongly depend on estimates of groundwater – surface water exchange. However, currently established methods to estimate groundwater flow (i) rely on point measurements, missing the effect of crucial short term events (e.g. precipitation), (ii) rely on differences in physical characteristics between the groundwater and surface water (e.g. temperature and/or conductivity), which are not always present or (iii) require extensive modelling.

In this presentation, we present a newly developed sensor, the iFLUX sensor. Two versions of this sensor exist, for measuring horizontal and vertical flow, respectively. The sensor probe for horizontal flow consists of two bidirectional flow sensors that are superimposed and is installed in a monitoring well with dedicated pre-pack filter, allowing for measurement of both groundwater flux magnitude and direction. The probe measuring vertical flow can be installed directly in the soil, in the riverbed or in a monitoring well. With a broad measuring range of groundwater fluxes from 0.5 cm/day to 2000 cm/day and measurements every second, this setup can map rapidly changing flow conditions.

Here, we show a selection of results from a case study in North-East Poland. In the Biebrza National Park, high groundwater levels resulting from subsurface runoff from the uplands protect the highly valuable peatland system. During most of the year, the river is gaining, with a sharp increase in upward groundwater flux in the hyporheic zone during summer months. In the valley surrounding the river, groundwater flows towards the river, as expected. However, the data show a remarkable diurnal pattern of both flow magnitude and direction, with the highest flow velocity occurring in the late afternoon, suggesting a relation with evapotranspiration. After large precipitation events, the flow direction reverses, suggesting infiltration of surface water into the aquifer.

Since these events occur on a small temporal scale, they were never measured before in the area with traditional methods. As such, our sensors provide new insights in groundwater – surface water interactions and will become an invaluable tool in ecohydrological studies worldwide, ultimately leading to more integrated management strategies to protect our remaining wetlands.

How to cite: Van Putte, N., Joris, M., De Kleyn, T., Cools, J., Grodzka-Łukaszewska, M., and Verreydt, G.: Innovative real-time iFLUX sensors reveal rapidly changing groundwater – surface water dynamics in peatlands of the Upper Biebrza Basin (Poland), EGU General Assembly 2023, Vienna, Austria, 23–28 Apr 2023, EGU23-5649, https://doi.org/10.5194/egusphere-egu23-5649, 2023.

EGU23-7419 | Posters on site | HS10.8

Surface Water – Groundwater Flow of the  Wairau Plains, New Zealand 

Thomas Wöhling, Moritz Gosses, Scott Wilson, Hannah Nguyen, and Peter Davidson

The Wairau Plain in Marlborough, New Zealand, host a shallow, highly conductive gravel aquifer which is mainly recharged by the braided Wairau River. The groundwater of the Wairau Aquifer is an important source of drinking water in the region and provides irrigation water for viticulture. Managing the groundwater is increasingly challenging because of a decline in levels and spring flows combined with a natural seasonality and an expected high vulnerability to climate change and overexploitation.

A prerequisite for groundwater managment and limit-setting is the knowledge of the water supply (recharge) as well as the water discharge and takes from the aquifer. Both are spatialy and temporally highly variable and difficult to measure. In addition, the aquifer is influenced by ephemeral streams which could potentially lead to unknown groundwater sinks and sources and periodical shifts of boundary locations.

In order to investigate these aspects and to estimate the water balance components and fluxes in the associated groundwater system, a coupled surface water – groundwater flow model (MODFLOW) has been set up. A variety of observations, ranging from groundwater heads to spring/river flows and exchange rates, were built into the model. Metered groundwater abstraction data was used to test and adapt a spatio-temporally distributed soil water balance model that is coupled to the MODFLOW model.

The complex surface flow network of the Wairau Plain and strong contrasts of hydraulic conductivity (up to 4 orders of magnitude) between older hydrogeological units and more recent, interwoven fluvial sediments have been a major challenge in the model setup. An iterative procedure with step-wise increasing complexity of parameterization was adopted to derive a plausible model structure, that is commensurable with the various observation types. Model parameters were calibrated and (linear) uncertainty bounds estimated using the PEST software.

The model performs well with respect to the plausibility of the groundwater flow field and the overall water balance. Groundwater heads, river-groundwater exchange flows and spring flows are generally well covered by the predictive uncertainty bounds during the evaluation period (data not utilized for calibration). The model provides insights into the relative contributions and the seasonality of the various water balance components of the Wairau Aquifer. It has been confirmed that the Wairau River is the main contributor to groundwater recharge, but also that recharge in a given year is matched by equal levels of discharge to low-land springs and off-shore. Although large river flood events during the wet period lead to interim excess groundwater storage, the recession to pre-flood groundwater levels is surprisingly fast (less than one year). On the other hand, unremarkable (high return period) flood events in the summer period, which keep river flows at elevated levels, have a noticeable effect on groundwater storage. This effect can last up until the following dry season.

The model proved useful for assessing the status quo of the Wairau Aquifer groundwater resources. This is a prerequisite for the search and testing of alternative management options that are imminent due to the observed trends in groundwater levels.

How to cite: Wöhling, T., Gosses, M., Wilson, S., Nguyen, H., and Davidson, P.: Surface Water – Groundwater Flow of the  Wairau Plains, New Zealand, EGU General Assembly 2023, Vienna, Austria, 23–28 Apr 2023, EGU23-7419, https://doi.org/10.5194/egusphere-egu23-7419, 2023.

EGU23-9225 | Orals | HS10.8

Conceptualisation of Groundwater Recharge from Braided Rivers 

Scott Wilson, Antoine Di Ciacca, Hoyle Jo, Richard Measures, Thomas Woehling, Eddie Banks, and Leanne Morgan

Braided rivers are a significant source of groundwater recharge for New Zealand’s gravel aquifers. However, their spatial and temporal complexity has made quantification of recharge and representation in numerical models particularly challenging. This presentation summarises the results of a research programme aimed to understand the structural controls on leakage from braided rivers and develop a conceptual model of how they function in the subsurface.

Instrumentation and field campaigns were established in the main losing reaches of three New Zealand braided rivers, the Selwyn, Wairau, and Ngaruroro. A multi-method approach was undertaken to characterise three key physical aspects: longitudinal flow change, sediment structure, and subsurface saturation. The field methods applied were lidar, bathymetry, coring, grainsize analysis, earth resistivity, nuclear magnetic resonance sounding, thermal sensing, radon sampling, differential flow gauging, and hydrological monitoring. In addition, some hypothesis testing was carried out using Hydrus 2D.

Subsurface saturation in all three study rivers was found to be associated with gravels of the contemporary braidplain. Due to repeated flood mobilisation, the gravels in the contemporary blaidplain have a smaller fraction of silt and clay, and are also less compacted than the underlying and adjacent gravels. Sediment mobility associated with flooding therefore enables a high permeability aquifer to form within these gravels, with shallow groundwater flow subparallel to the dominant river flow direction. This alluvial aquifer, which we are calling the ‘braidplain aquifer’ provides a storage reservoir for hyporheic and parafluvial exchange to occur. Water exchange between the river and regional aquifer is mediated by the braidplain aquifer (there is no direct exchange of water between the river and regional aquifer). 

The implication of this conceptualisation is that hydrological connectivity between a braided river and groundwater (e.g. as formulated by Brunner et al. 2009) occurs at two spatial scales; at the river-braidplain aquifer interface, and at the braidplain aquifer-regional aquifer interface. For assessing regional scale water balances, the latter spatial scales is most relevant. In a case where the braidplain aquifer is perched above the regional aquifer, recharge to the regional aquifer is regulated by vertical hydraulic conductivity in the underlying sediments, and the rate of recharge is fairly steady throughout the year. In a case where the braidplain aquifer is hydraulically connected to the regional aquifer, our results suggest that the exchange is controlled by horizontal conductivity of the sediments on the margins of the braidplain, vertical conductivity of the underlying sediments, and the hydraulic gradient. As such, flow losses can be highly variable throughout the year and appear to form a power-law relationship with flow (Woehling et al. 2018).

References

Brunner, P., Cook, P. G., and Simmons, C. T. (2009), Hydrogeologic controls on disconnection between surface water and groundwater, Water Resources Research 45: W01422

Wöhling, Th., Gosses, M., Wilson, S., Wadsworth, V., Davidson, P. (2018). Quantifying river-groundwater interactions of New Zealand's gravel-bed rivers: The Wairau Plain. Goundwater 56: 647-666

How to cite: Wilson, S., Di Ciacca, A., Jo, H., Measures, R., Woehling, T., Banks, E., and Morgan, L.: Conceptualisation of Groundwater Recharge from Braided Rivers, EGU General Assembly 2023, Vienna, Austria, 23–28 Apr 2023, EGU23-9225, https://doi.org/10.5194/egusphere-egu23-9225, 2023.

EGU23-9626 | Posters on site | HS10.8

Characterizing nitrogen dynamics in a groundwater-dependent wetland in South Korea using field and novel laboratory methods 

Eung Seok Lee, Thomas Johns, Luke Linville, Hee Sun Moon, and Yongchul Kim

Wetlands are affected by and also have a significant influence on climate change because of their ability to regulate atmospheric concentrations of the greenhouse gases such as carbon dioxide (CO2), methane (CH4) and nitrous oxide (N2O). This study aimed to characterize nitrogen dynamics in a groundwater-dependent wetland in South Korea. Soil textures and compositions, surface and groundwater constituents, groundwater levels, and air temperatures were determined in the field and laboratory in summer, 2021. Production rates and isotopic signatures of N2O gases were measured using static chamber and novel kinetic cell methods. Production rates of N2O gas were were up to 78.8 g N2O N/ha/d, N2O production was most active at 20-32 cm depths, and the source of N2O production was identified as denitrification of nitrate in groundwater. Statistical analyses indicated N2O flux generally increased with increased groundwater level and air temperature. Quantitative analyses via in situ N2O gas isotopic transport modeling will provide novel approach for rapidly characterizing the sources and dynamics of nitrogen and other greenhouse gases in groundwater-dependent wetlands around the world.

How to cite: Lee, E. S., Johns, T., Linville, L., Moon, H. S., and Kim, Y.: Characterizing nitrogen dynamics in a groundwater-dependent wetland in South Korea using field and novel laboratory methods, EGU General Assembly 2023, Vienna, Austria, 23–28 Apr 2023, EGU23-9626, https://doi.org/10.5194/egusphere-egu23-9626, 2023.

EGU23-10521 | ECS | Orals | HS10.8

Influence of Drying on Riverine Sediment Biogeochemistry Across the Contiguous United States 

James Stegen, Kenton Rod, Maggi Laan, Dillman Delgado, Sophia McKever, Lupita Renteria, Amy Goldman, Brieanne Forbes, Matthew Kaufman, Vanessa Garayburu-Caruso, and Brianna Gonzalez

Global change is altering where and when there is enough water for streams to flow. This leads to changes in where and when riverine sediments are inundated with an overlying water column, and affects the associated wet/dry dynamics those sediments experience. Previous work has shown that these changes in inundation and wet/dry dynamics have strong influences over biogeochemical rates, organic matter chemistry, and organismal ecology. For example, a global study of riverbed sediments showed that respiration rates increased up to 66-fold upon rewetting. A current knowledge gap is how respiration rates in re-wetted sediments compare to sediments that are consistently inundated, and what factors govern the effect-size of drying on respiration. To help address this gap we are conducting a manipulative laboratory experiment using sediments from the shallow hyporheic zone (~5cm into the riverbed). The sediments are being crowdsourced from across the contiguous United States to span a broad range of environmental conditions. The experiment has two treatments: one in which sediments are allowed to air dry and another in which sediments are kept inundated. In both cases sediments are constantly shaken to encourage aerobic conditions. After three weeks of these conditions, aerated water is added to both treatments to remove all headspace and oxygen consumption is measured over two hours using custom built oxygen optodes that provide data every two minutes. Results show that in some sites drying and re-wetting has almost no influence over respiration rates, but in other sites drying and re-wetting leads to dramatically lower respiration rates in air dried sediments compared to rates in consistently inundated sediments. These initial outcomes complement previous work showing that while respiration rates following re-wetting may be elevated compared to dry conditions, rates following re-wetting may not be elevated compared to rates in consistently inundated sediments. Combining insights from previous work and the current experiment can, therefore, provide an increasingly holistic understanding of the biogeochemical impacts of changes in where and when streams flow.

How to cite: Stegen, J., Rod, K., Laan, M., Delgado, D., McKever, S., Renteria, L., Goldman, A., Forbes, B., Kaufman, M., Garayburu-Caruso, V., and Gonzalez, B.: Influence of Drying on Riverine Sediment Biogeochemistry Across the Contiguous United States, EGU General Assembly 2023, Vienna, Austria, 23–28 Apr 2023, EGU23-10521, https://doi.org/10.5194/egusphere-egu23-10521, 2023.

EGU23-11109 | ECS | Orals | HS10.8

Effects of groundwater fluctuations on nutrient transformation in riparian sediments in a Mediterranean catchment - Column study 

Fabian Willert, Christian Roumelis, Maria Scaccia, Jesús Carrera, Albert Folch, Susana Bernal, Miquel Salgot, Alycia Insalaco, Susan Welch, Rachel Gabor, and Audrey H. Sawyer

A clear need exists to understand the role that water table fluctuations play in mobilizing nutrients in soils and shallow groundwater near streams, particularly in dry Mediterranean watersheds, which experience marked wetting and drying seasonal patterns. As groundwater level varies, so does the supply of inorganic nitrogen and organic carbon from different soil layers, which affects processes such as coupled nitrification-denitrification and the chemistry of groundwater that flows to streams. Along discharging groundwater flow paths, carbon-rich soils release dissolved organic carbon (DOC), which biogeochemically reacts with nitrogen (N) and oxygen (O) as groundwater levels rise and become saturated. For understanding the biogeochemical dynamics in N at the interface between soils and groundwater, a cylindrical, meter-long polyvinyl chloride (PVC) soil column was constructed and filled with heterogeneous soil and aquifer layers of decreasing organic matter with depth. A cyclical water level cycle was imposed for 16 days using influent to the column from local groundwater at the experimental site with < 1 mg nitrate-N/L. Water table dynamics were monitored with a pressure sensor, tensiometer, and two soil moisture sensors. Vertical arrays of redox sensors and pore water samplers were used to observe changes in pore water chemistry. Water samples were analysed for pH, ammonium-N (NH4-N), nitrate-N (NO3-N), nitrite-N (NO2-N), and DOC. Soil samples were taken for microbial activity and solid chemistry analysis. Near the soil-aquifer transition, nitrate accumulates under aerobic conditions and DOC from organic matter is mobilized under anaerobic conditions. Preliminary pore water analysis shows that during wetting cycles, there is an increase in dissolved inorganic N (NO3+NO2) near the surface (57 mg N/L at 40 cm depth) but a decrease in DIN concentrations in deeper layers (0.92 mg N/L at 55-100 cm depth), suggesting that nitrification and denitrification processes stratified with depth. The results illustrate the significance of groundwater level fluctuations on DIN and DOC cycling and mobilization in Mediterranean riparian soils during wetting events.

How to cite: Willert, F., Roumelis, C., Scaccia, M., Carrera, J., Folch, A., Bernal, S., Salgot, M., Insalaco, A., Welch, S., Gabor, R., and Sawyer, A. H.: Effects of groundwater fluctuations on nutrient transformation in riparian sediments in a Mediterranean catchment - Column study, EGU General Assembly 2023, Vienna, Austria, 23–28 Apr 2023, EGU23-11109, https://doi.org/10.5194/egusphere-egu23-11109, 2023.

EGU23-13178 | ECS | Posters on site | HS10.8

Dynamic hyporheic zone: Impact of non-steady stream flow and moving streambeds on the fate of trace organic contaminants 

Maria Alejandra Villa Arroyave, Stephanie Spahr, Shai Arnon, and Jörg Lewandowski

The occurrence of trace organic compounds (TrOCs) such as pharmaceuticals and personal care products in aquatic ecosystems has been a growing concern in urban environments in recent decades. Incomplete removal of organic compounds in conventional wastewater treatment along with increasing use of chemicals, especially due to urbanization, increase the contamination of rivers and groundwaters with high loads of TrOCs. Different strategies to combat this type of environmental pollution have been researched, leading to a better understanding of the occurrence and fate of these contaminants. For instance, the natural attenuation of TrOCs by processes occurring in the hyporheic zone has been recognized as an efficient alternative for contaminant removal. However, little is known about the effects of stream flow velocity and bedform celerity on TrOCs removal, although bedform migration is a common process in many natural and urban streams. Our research project evaluates the influence of bedform migration on the fate of sixteen organic contaminants and their transformation products due to dynamic hyporheic zone exchange. Both controlled flume experiments and field measurements in a side channel of the River Erpe in Germany contribute to understanding the effects of dynamic flow conditions on the biotransformation of TrOCs. The knowledge obtained may be applied to enhance water management remediation programs, considering water bodies' ecological and chemical status.

Keywords: TrOCs, hyporheic zone, bedform migration, flume experiments, attenuation, biotransformation.

How to cite: Villa Arroyave, M. A., Spahr, S., Arnon, S., and Lewandowski, J.: Dynamic hyporheic zone: Impact of non-steady stream flow and moving streambeds on the fate of trace organic contaminants, EGU General Assembly 2023, Vienna, Austria, 23–28 Apr 2023, EGU23-13178, https://doi.org/10.5194/egusphere-egu23-13178, 2023.

EGU23-13829 | ECS | Orals | HS10.8

Investigation of naturally occurring radionuclides in a riverbank filtered drinking water supply system 

Máté Márk Mezei, Petra Baják, Endre Csiszár, Katalin Hegedűs-Csondor, Bálint Izsák, Márta Vargha, Ákos Horváth, and Anita Erőss

Riverbank filtered drinking water supply systems are strongly dependent on the river stage. Climate change-induced extremely low or high river stage may cause water quantity and quality problems. In this study, a riverbank-filtered drinking water supply system along the Danube River was investigated from a radioactivity point of view: we aimed to understand the origin of elevated (>100 mBq L–1) gross alpha activity measured in some wells and the variation in water quality with river level fluctuation.

10 producing, 2 monitoring wells, and the Danube were sampled at lower and higher river stages. The water samples were analyzed for major ions and trace components. Total U (234U+235U+238U) and 226Ra activity concentration were determined by alpha spectrometry using Nucfilm discs, and 222Rn activity was measured by liquid scintillation counting.

Total uranium activity was measured in the highest concentration (up to 334 mBq L–1). Radium and radon activities were barely above the detection limit. Based on our results the previously measured elevated gross alpha activity is most likely caused by dissolved uranium in the groundwater. Uranium activity concentrations show increasing values from N to S which corresponds well to the occurrence of organic matter-rich, clayey floodplain deposits underlying the aquifer.

Besides spatial variation, a temporal change can also be observed: lower uranium activity was measured at a lower river stage (32–248 mBq L–1) compared to a higher river stage (26–334 mBq L–1). This phenomenon could be explained by the dynamic relationship between the groundwater and the river. At the low river stage, oxygen-rich (ground)water flows from the river toward the inland and may cause the remobilization of uranium from the clayey basement layers. This process will be more and more dominant by extremely low river stages during long-lasting drought periods in the future causing water quality problems.

The research was funded by the National Multidisciplinary Laboratory for Climate Change, RRF-2.3.1-21-2022-00014 project.

How to cite: Mezei, M. M., Baják, P., Csiszár, E., Hegedűs-Csondor, K., Izsák, B., Vargha, M., Horváth, Á., and Erőss, A.: Investigation of naturally occurring radionuclides in a riverbank filtered drinking water supply system, EGU General Assembly 2023, Vienna, Austria, 23–28 Apr 2023, EGU23-13829, https://doi.org/10.5194/egusphere-egu23-13829, 2023.

EGU23-13883 | ECS | Posters on site | HS10.8

Hydrological and thermal signatures to characterize groundwater influence and improve a spatialized regional hydrological model 

Léo Rouchy, Flora Branger, Guillaume Hévin, and Florentina Moatar

Groundwater flow and stream-aquifer interactions are the most fundamental processes that control the physical and biological characteristics of entire hydrographic networks during low-flow periods.

Our study focuses on these complex flows represented in a physically based, regional, and fully distributed hydrological model. We use the J2000 hydrological model, applied to the case study of the Saône river in France. This 30,000 km² watershed has a contrasted lithology, with karstic sectors, which makes it possible to study the performance of the model according to the karstification of its sub-watersheds. It is also a heavily monitored watershed with daily flow measures at 227 hydrological stations evenly distributed over the study area and 587 hourly temperature measurement stations.

J2000 model performance is estimated by calculating widely used hydrological signatures such as BFI (Base Flow Index), IGF (Interbasin Groundwater Flow), or FDC (Flow Duration Curve) characteristics. This set of signatures evaluates the performance of the model with respect to the representation of groundwater flows. In addition, we calculate thermal signatures derived from the relationship between air and water temperature (damping factor, time lag, slope). They are not used as a performance criterion but they give some more information about the spatial distribution of thermal regime and the type of groundwater contribution.

The analysis of observed and simulated hydrological signatures, and observed thermal signatures, revealed various hydrological and thermal responses (e.g. shallow and deep groundwater signature), depending of the lithology of the sub-basin. In our future work, we will couple the J2000 model with the process-based thermal model T-NET (Thermal NETwork). The work presented aims to increase the performance of the thermal regime determination, which has shown significant sensitivity to groundwater contributions.

How to cite: Rouchy, L., Branger, F., Hévin, G., and Moatar, F.: Hydrological and thermal signatures to characterize groundwater influence and improve a spatialized regional hydrological model, EGU General Assembly 2023, Vienna, Austria, 23–28 Apr 2023, EGU23-13883, https://doi.org/10.5194/egusphere-egu23-13883, 2023.

Groundwater is a major source of water supply over most regions, accounting for nearly one-third of all water abstraction globally. However, due to overreliance on this resource, many aquifers around the United States have experienced rapid depletion, while some aquifers have seen increasing water levels due to extensive recharge efforts. It is essential to have a comprehensive understanding of the rate at which groundwater storages are changing to assess the potential availability of groundwater in the future. In this work, we estimate groundwater storage changes across more than 1000 watersheds over the US from a proposed algorithm for baseflow extracted using streamflow and precipitation observations. We also study the spatial and temporal variations in the characteristic of baseflow recession. We compare the storage change estimated from baseflows with those obtained from the estimates from the Gravity Recovery and Climate Experiment (GRACE) and observations from monitoring wells. The results help in validating the application of the proposed baseflow-based storage estimates in different aquifers and climatic regions. The proposed approach is simple and computationally efficient for estimating baseflows and groundwater storage changes in poorly-gauged watersheds.

How to cite: Hameed, M., Nayak, M., and Ahanger, M.: Groundwater Storage Changes in the United States using Baseflow Recession Method: Comparison with GRACE, and Observation Well Data, EGU General Assembly 2023, Vienna, Austria, 23–28 Apr 2023, EGU23-15784, https://doi.org/10.5194/egusphere-egu23-15784, 2023.

EGU23-16274 | Posters on site | HS10.8

Mapping and quantifying water fluxes at the land-sea interface using temperature, stable isotopes and pore water chemistry: An example from Königshafen, Sylt 

Benjamin Gilfedder, Ramona Riedel, Joana List, Michael E. Böttcher, and Sven Frei

Beach faces form the interface between terrestrial and marine systems. They act as a reactive zone between these two compartments, transporting and biogeochemically modifying chemical constituents such as nutrients, pollutants and carbon. Re-circulation of sea water through beach sediments is largely driven by tidal pumping and pressure gradients caused by tides, wave setup, and storm events that pile sea water up on the beach face. In contrast, terrestrial groundwater systems provide a source of low salinity and often nutrient rich water to the coastal zone. Mixing between these water sources is complicated by catchment morphology, variable density flow and very dynamic boundary conditions across temporal scales (e.g. tides, storms, yearly variations in terrestrial groundwater levels). Thus tracing water and nutrients fluxes through the subterranean estuary is not trivial. In this work we use a combination of point and long-term (7 months) temperature profile measurements and heat modelling to estimate water fluxes through the beach sediments into the Königshafen, on Sylt Island, Northern Germany. Temperature measurements were complemented by stable isotope and pore water chemistry measurements to infer the origin of discharge into the bay. The results showed that flow paths are complex, with dune morphology influencing the focal point for fresh groundwater discharge, with fluxes up to 20 cm d-1. Moreover it appears that either the islands fresh groundwater isotopic signature is either variable or at least two end-members contribute to the freshwater signature. Seaward, saline and brackish discharge occurs into the tidal creek draining the bay. Overall temperature measurements and heat modelling combined with pore water chemistry show potential to understand water and chemical exchange through the subterranean estuary and thus help to understand water and material fluxes at the terrestrial-ocean interface.

How to cite: Gilfedder, B., Riedel, R., List, J., Böttcher, M. E., and Frei, S.: Mapping and quantifying water fluxes at the land-sea interface using temperature, stable isotopes and pore water chemistry: An example from Königshafen, Sylt, EGU General Assembly 2023, Vienna, Austria, 23–28 Apr 2023, EGU23-16274, https://doi.org/10.5194/egusphere-egu23-16274, 2023.

EGU23-68 | ECS | Orals | HS10.9

Three-dimensional gravity flows in an idealized stratified ice-covered lake 

Fatemeh Sadat Sharifi, Reinhard Hinkelmann, Tore Hattermann, and Georgiy Kirillin

The combined effect of gravity and viscosity forces produces a flow along any inclined solid lateral wall in a density-stratified fluid. The flow becomes an important driver of circulation in ice-covered lakes isolated from wind forcing. We present numerical results from the Regional Ocean Modeling System (ROMS) investigating three-dimensional buoyancy-driven circulation in an ice-covered lake of simplified symmetric shape. The numerical results revealed vertical current velocities of 10-6 m s-1 and horizontal current velocities of 10-3 m s-1. The model simulated an upward current along sloping boundaries, with downwelling return flow throughout the bulk of the lake's water column. For the typical internal Rossby radius of 14 km, basin-scale circulation in a lake with a horizontal dimension of 45 km turns to a counterclockwise gyre in the lake half depth. We investigated the dependence of the boundary flow and the residual lake-wide circulation on the lake size, bottom slope inclination, and earth rotation. The obtained magnitudes of the boundary flow were compared against known simplified analytical solutions. The outcomes demonstrated that the ROMS model, on the basis of the Boussinesq hydrostatic equation, is able to simulate weakly energetic flows governed by viscous forces and rotation in enclosed thermally stratified ice-covered domains. The results contribute to a better understanding of the processes driving the under-ice freshwater circulation with wider applications, including dynamics of buoyancy-driven flows affected by nonlinear effects, such as freshwater density anomaly.

How to cite: Sharifi, F. S., Hinkelmann, R., Hattermann, T., and Kirillin, G.: Three-dimensional gravity flows in an idealized stratified ice-covered lake, EGU General Assembly 2023, Vienna, Austria, 23–28 Apr 2023, EGU23-68, https://doi.org/10.5194/egusphere-egu23-68, 2023.

EGU23-366 | ECS | Orals | HS10.9 | Highlight

Breathing at Sleep: Respiration in Arctic Lakes During Polar Nights 

Ezgi Asirok, Georgiy Kirillin, and Hans-Peter Grossart

Polar nights are unique periods to understand metabolism in ice-covered lakes from physical and biological perspectives. Despite the nearly zero primary production, polar nights cannot be disregarded as periods of biological stagnation, and recent data on biological processes and biogeochemical interactions are not yet fully understood, but can provide valuable information on lake ecosystem functioning in the absence of sunlight. Seasonally ice-covered Arctic Lake Kilpisjärvi at the latitude of 69° N experiences night time conditions from December to mid-January. Here, we use the continuous high-frequency time series of high-resolution temperature and oxygen from Kilpisjärvi to understand temperature and depth-related changes in respiration levels for three years from 2019 to 2022. In parallel, we aim to derive vertical microbial community composition by analysing water samples from different depths during the ice-covered period and correlate the outputs with oxygen dynamics to understand bacterial adaptations along biogeochemical gradients in Lake Kilpisjarvi.


How to cite: Asirok, E., Kirillin, G., and Grossart, H.-P.: Breathing at Sleep: Respiration in Arctic Lakes During Polar Nights, EGU General Assembly 2023, Vienna, Austria, 23–28 Apr 2023, EGU23-366, https://doi.org/10.5194/egusphere-egu23-366, 2023.

EGU23-1430 | ECS | Orals | HS10.9

Slower drawdown rates in lakes promote the growth and reproduction of lakeshore vegetation 

Amali Dahanayake, Angus Webb, Joe Greet, and Justin Brookes

Soil erosion on lakeshores due to the fluctuating water levels, waves, and other factors, remain a world-wide problem. Lakeshore vegetation can be helpful in preventing erosion. We investigated the effects of drawdown rate and depth on the growth and reproduction of a keystone lakeshore plant. We hypothesised that plants with access to water for longer would grow better and have higher reproductive output.

We subjected 108 Spiny Sedge (Cyperus gymnocaulos) plants to six treatments comprising three drawdown rates (static, slow, fast) and two water depths (shallow and deep). We measured plant stem heights and numbers of flowers and bulbils weekly, and the initial and final biomass of the above ground and below ground components.

Plants in treatments without access to water for long periods had the lowest growth and reproductive output. However, if the final water level was deep but drawdown was done slowly, plants were able to maintain similar growth and reproduction rates to plants with continuous access to water.

Fluctuating water levels in lakes cause lakeshore plants at lower elevations to be inundated for longer and plants at higher elevations to be deprived of water for longer. Plants located at mid-elevations will thrive if their roots have access to water and their above ground parts are not fully submerged.

Our findings are useful to water managers and ecologists concerned about preserving lakeshores from erosion by promoting vegetation. Both the rate and depth of drawdown should be considered in managing lake water levels. Where water levels fluctuate over large depths slower rates of drawdown will enable most plants to have access to water for longer, promoting their growth and reproduction, hence, reducing the lakeshore erosion.


Keywords: lakes, vegetation, drawdown, erosion, sustainability

How to cite: Dahanayake, A., Webb, A., Greet, J., and Brookes, J.: Slower drawdown rates in lakes promote the growth and reproduction of lakeshore vegetation, EGU General Assembly 2023, Vienna, Austria, 23–28 Apr 2023, EGU23-1430, https://doi.org/10.5194/egusphere-egu23-1430, 2023.

EGU23-1577 | Orals | HS10.9

Cooling by Cyprus Lows of Surface and Epilimnion Water in Subtropical Lake Kinneret in Rainy Seasons 

Pavel Kishcha, Yury Lechinsky, and Boris Starobinets

Cyprus lows are the main reason for precipitation over Lake Kinneret during the rainy season (December–May): these lows are centered over the Mediterranean Island of Cyprus. Cyprus lows are responsible for cold weather conditions when westerly winds transport cold moist air from the eastern Mediterranean into north Israel (including Lake Kinneret). Such cold weather conditions, accompanied by rainfall and a decrease in solar radiation (due to an increase in cloudiness over the lake), could cause cooling of Kinneret and eastern Mediterranean water temperature (WT) in rainy seasons.

However, in the Eastern Mediterranean and in Lake Kinneret, surface water temperature is increasing by ~1.5 oC over the last 40 years. Moreover, climate model predictions showed a reduction by one third in the appearance of Cyprus lows by the end of the 21st century. This suggests a reduction in cooling by Cyprus lows of water in the Eastern Mediterranean and in Lake Kinneret. Therefore, a comprehensive investigation of the influence of Cyprus lows on water temperature in subtropical Lake Kinneret and the Eastern Mediterranean is environmentally important.

Comparisons, conducted on a monthly basis, between high-precipitation (HP) years and low-precipitation (LP) years led to our main findings, which are as follows: Cyprus lows are instrumental in the cooling of surface and epilimnion water in subtropical Lake Kinneret and in the cooling of eastern Mediterranean surface water (Kishcha et al., 2022). In particular, comparison between HP and LP years of Kinneret surface water temperature (SWT) and epilimnion water temperature (WT) have shown water cooling of up to 2 °C in HP years, in the daytime. This study was carried out using the 21-year period of satellite and in-situ data: (1) MODIS 1 km × 1 km resolution records of SWT, and (2) shipboard measurements of WT vertical profiles down to a depth of 40 m (2000–2020). We found that the decrease in solar radiation (caused by Cyprus lows due to an increase in cloudiness) was the main factor contributing to Kinneret water cooling. In spring (March–April), SWT and epilimnion WT, averaged over the HP years, was lower by ~2 °C and ~1.4 °C, respectively, than SWT and epilimnion WT averaged over the LP years. This was when SR increased and became the main factor contributing to water heating. In situ shipboard measurements of WT at a depth of 1 m and 5 m, at five monitoring sites within Lake Kinneret, showed similar patterns of the WT difference between HP and LP years. This is evidence that cooling by Cyprus lows of Kinneret water was evenly distributed within the lake. Water cooling by Cyprus lows was also observed in eastern Mediterranean surface water. In particular, in the spring months (March–April), Mediterranean SST averaged over the same HP years was lower by ~1.2 oC than that averaged over LP years. This is evidence of the regional character of the water-cooling phenomenon caused by Cyprus lows.

Reference:

Kishcha et al. (2022).  Remote Sensing 2022, 14, 4709. https://doi.org/10.3390/rs14194709

How to cite: Kishcha, P., Lechinsky, Y., and Starobinets, B.: Cooling by Cyprus Lows of Surface and Epilimnion Water in Subtropical Lake Kinneret in Rainy Seasons, EGU General Assembly 2023, Vienna, Austria, 23–28 Apr 2023, EGU23-1577, https://doi.org/10.5194/egusphere-egu23-1577, 2023.

Continuous lake sediment archives integrate valuable information of geodynamic transformations, climatic fluctuations and anthropogenic environmental forcing through time. In many parts of the world, such as sub-Saharan Africa, lake ecosystems are important pillars of biodiversity and wildlife preservation and evolution, as well as political and economic stability, especially with regard to the rapid population growth and increasing food and water demand.

Located in the central part of the rift valley region, lake Naivasha is the second largest freshwater lake in Kenya, covers a catchment area of ca. 3400 km2 and is considered a “wetland of international importance” (RAMSAR convention, 2011). Previous studies and real-time observations documented a rapid intensification of agricultural activities ranging from subsidy economy (upper catchment) to industrial-sized horticulture practices (lower catchment) from the second half of the 20th century towards the present. These were suggested to have significantly influenced the drainage systems of the catchment and hydrochemistry of the lake, with potentially negative effects on the entire ecosystem. In addition, potential anthropogenic metal influx from other modern, diffuse sources (such as fossil fuel combustion) due to the increasing anthropogenic density and activities in the immediate vicinity of the lake remain poorly constrained.

We analysed major- and trace elements and Pb isotope compositions of lake sediments covering the past ca. 150 years, as well as the surrounding lithologies in order to reconstruct the pathway(s) and source(s) of elemental influx and accumulation into the lake. The characterization of the geological background in this tectonically and volcanologically active region was primarily set on the northern part of the catchment where, the two main lake-feeding rivers Malewa and Gilgil discharge into the lake. Element correlation indices point to i) a strong influence of the local geological background and, ii) a relatively stable catchment for this time-period as seen from sub-parallel REE+Y patterns along the monolith. Lead isotope compositions, on the other hand, show more radiogenic values in the sediment deposited before the 1900’s (206Pb/204Pb: 19.502 – 19.546) and a significant shift towards less radiogenic isotopic ratios from the second half of the 20th century (206Pb/204Pb: 19.228 – 19.304), which persists towards the top of the core. We combine our extended geochemical data with geospatial projections of the land use to build a time-integrated cause-and-effect assessment of metals into lake Naivasha and disentangle the cause for the change in the Pb isotope composition.

How to cite: Rosca, C., Junginger, A., Kübler, S., and Schoenberg, R.: Trace element- and Pb isotope fingerprints of natural vs. anthropogenically induced geochemical changes in tropical lake catchments: A case study from lake Naivasha, Kenya, EGU General Assembly 2023, Vienna, Austria, 23–28 Apr 2023, EGU23-2074, https://doi.org/10.5194/egusphere-egu23-2074, 2023.

EGU23-2406 | Orals | HS10.9

Hydrological Drivers for the Spatial Distribution of Wetland Herbaceous Communities in Poyang Lake 

Wenqin Huang, Tengfei Hu, Jingqiao Mao, Carsten Montzka, Roland Bol, Songxian Wan, Jianxin Li, Jin Yue, and Huichao Dai

Hydrological processes are known as major driving forces in structuring wetland plant communities, but the specific relationships are not always well understood. The recent dry conditions of Poyang Lake (i.e., the largest freshwater lake in China) are having a profound impact on its wetland vegetation, leading to the degradation of the entire wetland ecosystem. We developed an integrated framework to quantitatively investigate the relationship between the spatial distribution of major wetland herbaceous communities and the hydrological regimes of Poyang Lake. First, the wetland herbaceous community classification was built using a support-vector machine and simultaneous parameter optimization, achieving an overall accuracy of over 98%. Secondly, based on the inundation conditions since 2000, four hydrological drivers of the spatial distribution of these communities were evaluated by canonical correspondence analysis. Finally, the hydrological niches of the communities were quantified by Gaussian regression and quantile methods. The results show that there were significant interspecific differences in terms of the hydrological niche. For example, Carex cinerascens Ass was the most adaptable to inundation, while Triarrhena lutarioriparia + Phragmites australis Ass was the least. Our integrated analytical framework can contribute to hydrological management to better maintain the wetland plant community structure in the Poyang Lake area.

How to cite: Huang, W., Hu, T., Mao, J., Montzka, C., Bol, R., Wan, S., Li, J., Yue, J., and Dai, H.: Hydrological Drivers for the Spatial Distribution of Wetland Herbaceous Communities in Poyang Lake, EGU General Assembly 2023, Vienna, Austria, 23–28 Apr 2023, EGU23-2406, https://doi.org/10.5194/egusphere-egu23-2406, 2023.

EGU23-2637 | Posters on site | HS10.9

A preliminary test to estimate the carbon sequestration from lake sediments of Sun Moon Lake in Taiwan 

Pi-Ju Tsou, Huei-Fen Chen, and Zih-Wei Tang

Considering the carbon sinks and carbon sequestration, people often think of forests, trees, oceans. However, the carbon sequestration capacity of the lake was underestimated, until now the change of carbon accumulation in Sun Moon Lake has not been accurately estimated. Sun Moon Lake is the largest natural lake in Taiwan. After the dam was built in 1934, the water source of Sun Moon Lake came from Zhuoshui River from the storage in Wujie Dam . The water depth of the lake increased from 4 meters to 27 meters deep, which makes the lake area to expand suddenly and the sedimentary rate was accelerated. Changes in the environment and human behaviors had caused huge changes in the organic matter of Sun Moon Lake. In this study, the carbon element content was mainly analyzed through sediment cores  in Sun Lake and Moon Lake.  Before the construction of the dam, there were many records of charcoal layers left by the aboriginal people burning forests for reclamation in the core.  The carbon content of the lake can be estimated by the formula CO2e=3.67 * TOC% * BD (g/cm3) * D (cm) * Area (ha). Therefore, we can use this formula to estimate the accumulated carbon sink content in Sun Moon Lake sediments. We try to estimate the carbon storage methods based on inorganic and organic carbon during different periods in the future work. To determine the age control is a critical point in core sediments, so we will use XRF data to reconstruct the timing of typhoon events and human contaminations. The volume of lake sediment can be estimated by the sedimentary rates of cores and seismic profile. Now, we need to measure contents of organic and inorganic carbon for the core sediments. 

Key words: lake, sediments, carbon, organic, inorganic

How to cite: Tsou, P.-J., Chen, H.-F., and Tang, Z.-W.: A preliminary test to estimate the carbon sequestration from lake sediments of Sun Moon Lake in Taiwan, EGU General Assembly 2023, Vienna, Austria, 23–28 Apr 2023, EGU23-2637, https://doi.org/10.5194/egusphere-egu23-2637, 2023.

EGU23-5873 | ECS | Orals | HS10.9 | Highlight

Seiche-induced fish-kills in the Sea of Galilee may explain the biblical miraculous catch of fish 

Ehud Strobach, Yael Amitai, Shmuel Assouline, David Hamilton, Aminadav Nishri, and Tamar Zohary

On May 31, 2012, thousands of dead fish were found along the north-western shore of the Sea of Galilee. Analysis of fish gill tissue revealed no evidence of poisoning, and the fish looked healthy. This event adds to reports of similar fish kills at the same location, from the early 1990s, from May 2007, and a subsequent event on June 27, 2012, a month after the May 31 event. The common hypothesis for the massive kill suggests that a seiche induced by strong winds caused the upwelling of colder and anoxic hypolimnetic water along the western shores of the lake. Still, this hypothesis has not yet been tested.

The WRF (The Weather Research and Forecasting) atmospheric model was recently coupled with the ocean model MITgcm (MIT general circulation model). The coupled model was named SKRIPS (Scripps–KAUST Regional Integrated Prediction System). The two SKRIPS model components (WRF and MITgcm) are well-tested at high resolution, allowing us to investigate the physical mechanism of the fish-kill event in an interactive system. To test the hypolimnetic water upwelling hypothesis for the massive fish-kill, we have set up and integrated the SKRIPS model for the May 31, 2012, event at a horizontal grid resolution of 400 m2, both for the atmospheric and lake component of the model.

In this talk, I will present results from a high-resolution coupled atmosphere-lake regional simulation indicating an upwelling of cold anoxic hypolimnetic water into the surface during the event. The upwelling of cold water is increased close to the shore. The discussion will be supplemented by field data of temperature and oxygen concentrations, collected before, during, and after the fish-kill event. Our simulation results agree with the field observations, adding confidence to the anoxic hypolimnetic water upwelling hypothesis. Such fish-kill events may explain the biblical ‘miraculous catch of fish’ and the ‘miracle of the loaves and fish’. Also, it may provide a possible seasonal time frame (spring) for their occurrence in the past.

How to cite: Strobach, E., Amitai, Y., Assouline, S., Hamilton, D., Nishri, A., and Zohary, T.: Seiche-induced fish-kills in the Sea of Galilee may explain the biblical miraculous catch of fish, EGU General Assembly 2023, Vienna, Austria, 23–28 Apr 2023, EGU23-5873, https://doi.org/10.5194/egusphere-egu23-5873, 2023.

EGU23-6178 | Posters on site | HS10.9 | Highlight

Differential cooling in lakes 

Damien Bouffard, Tomy Doda, Cintia Ramón, and Hugo Ulloa

We present the results of a project on differential cooling in lakes. This project aimed at quantifying the cross-shore convective circulation induced by differential cooling, also known as the thermal siphon (TS). Our case study was a small peri-alpine wind-sheltered lake (Rotsee, CH), where we studied the seasonal evolution of  TS over a year using a combination of field observations and high-resolution RANS and LES models. We found that TS  is a frequent cross-shore transport process which can be predicted using laboratory-based scaling formulae. We also observed that penetrative convection modifies the dynamics of the cross-shore flow, which has implications for the littoral-pelagic connectivity. In addition, we quantified the TS-induced lateral transport of dissolved gases, including oxygen and methane. We extended our findings to other lakes in order to improve the prediction of TS occurrence and intensity and we developed a procedure for predicting TS-induced transport based on factors such as lake bathymetry, meteorological forcing (including wind and cooling), and the vertical thermal structure of the lake.

How to cite: Bouffard, D., Doda, T., Ramón, C., and Ulloa, H.: Differential cooling in lakes, EGU General Assembly 2023, Vienna, Austria, 23–28 Apr 2023, EGU23-6178, https://doi.org/10.5194/egusphere-egu23-6178, 2023.

EGU23-6490 | Orals | HS10.9 | Highlight

Impact of extreme hydro-meteorological events on the anoxia dynamics in a small urban lake 

Brigitte Vinçon-Leite, Guilherme Calabro-Souza, Felipe Breton, Céline Casenave, Mohamed Saad, Philippe Dubois, Bruno J. Lemaire, and Francesco Piccioni

Urban lakes provide essential ecosystem services (hotspot of biodiversity, stormwater management, reduction of pollutant loadings…).
During late summer and early autumn 2021, two whole-lake anoxia events occurred in Lake Champs-sur-Marne (Great Paris, France).  This sandpit lake, principally fed by groundwater from the nearby Marne River, is continuously monitored by an autonomous station equipped with underwater sensors (water temperature, oxygen, Chlorophyll-a, CDOM, Nitrate). At the same point, a meteorological station is installed on a buoy, above the lake surface.
During the two anoxia events (end of August and mid-September), oxygen concentration dropped from supersaturation level corresponding to a high peak of phytoplankton biomass, to 0% within a few days. During this summer period, successive heavy rainfall events occurred, causing a flood of the Marne River and rising the watertable level to unusual values in Summer. This resulted in high water and nutrient fluxes from the river towards the lake. 
The observed whole-lake anoxia can be explained according to the following assumptions: (1) the groundwater nutrient loading, favored by the high level of the Marne River, caused a huge phytoplankton production; (2) then, the phytoplankton decline was associated to an intense mineralization of the biomass organic carbon; (3) the lake oxygen was completely exhausted, leading to a massive fish kill. 
These results highlight the severe impact of a non-extreme but high and long hydro-meteorological event on a lake ecosystem. In Lake Champs-sur-Marne, the nutrient limitation of phytoplankton production generally occurs during late summer. In 2021, the limitation was removed by the Summer exceptional nutrient loading. In temperate regions, summer algal blooms are not limited by water temperature but by nutrient availability. Climate change is expected to increase the frequency of extreme hydro-meteorological events.  Higher frequency of summer heavy rainfall may trigger repeated phytoplankton blooms, deteriorating the ecological status of lake ecosystems.

How to cite: Vinçon-Leite, B., Calabro-Souza, G., Breton, F., Casenave, C., Saad, M., Dubois, P., Lemaire, B. J., and Piccioni, F.: Impact of extreme hydro-meteorological events on the anoxia dynamics in a small urban lake, EGU General Assembly 2023, Vienna, Austria, 23–28 Apr 2023, EGU23-6490, https://doi.org/10.5194/egusphere-egu23-6490, 2023.

Lake evaporation (EW) is an important component of both basin evapotranspiration (ETB) and lake water balance for lake-basins on the inner Tibetan Plateau (IB), and it greatly influences lake water storage change (ΔSW). However, the effects of EW on ETB and ΔSW at lake-basin scale have never been reported for most basins on the IB. In this study, the EW of 117 large lakes (area > 50 km2) in 95 closed lake-basins (area > 1000 km2) were estimated, and its effects on ETB and ΔSW over 2001-2018 were examined using several newly derived diagnostic equations from the aspects of EW amount, rate, trend slope and inter-annual variability. During the study period, mean annual EW rate and total EW amount for the lakes are 994.25 ± 20.48 mm, and 24.83 ± 0.52 km3 respectively. The significant increasing trend (0.29 ± 0.04 km3/a) in annual EW amount is mainly caused by the increase (224.65 km2/a) in lake area (82.13%), and the increase (2.12 ± 1.28 mm/a) in EW rate is responsible for the rest (17.87%). EW accounts for 23.16% ± 4.94% of the ETB (107.24 ± 21.90 km3) for the 95 basins, and its impact has increased significantly (0.20% ± 0.09%/a) over the period. The increasing trends of EW rate and lake area ratio (0.06%, P < 0.05) contributed 14.49% and 52.69% to the increase trend in ETB (0.85 mm/a), and their variances contributed 1.60% ~ 4.79% and 1.64% ~ 6.50% to ETB variance (155.44 ± 107.97 mm2), respectively. The contribution of EW, quasi lake inflow (RL, 23.48 km3), and lake surface precipitation (PW, 9.18 km3) to mean ΔSW (7.82 km3) are -43.02%, 40.84% and 15.96%, respectively. And the increasing trends of the three components (EW, RL and PW) account for -58.02%, 29.59% and 12.39% of the decrease trend in annual ΔSW (-0.81 × 10 km3/a, P > 0.05), respectively. Basin RL, derived based on lake water balance, is significantly correlated with two independent land surface net precipitation estimates (0.57 < R < 0.86), and basin lake area ratio is a good indicator of basin EW and lake inflow in the IB.

How to cite: Wang, L., Wang, J., and Li, X.: Lake evaporation and its effects on basin evapotranspiration and lake water storage on the inner Tibetan Plateau, EGU General Assembly 2023, Vienna, Austria, 23–28 Apr 2023, EGU23-6834, https://doi.org/10.5194/egusphere-egu23-6834, 2023.

EGU23-6893 | ECS | Posters on site | HS10.9

Global scale estimation of evaporative losses from large lakes located in different climatic zones 

Hannes Nevermann, Milad Aminzadeh, Kaveh Madani, and Nima Shokri

Reliable projection of evaporative fluxes from lakes is at the core of a wide range of hydrological, climatological, and environmental modeling processes. Evaporation results in losses of blue water from lakes in regions with limited freshwater resources and affects aquatic and terrestrial biodiversity. While current estimates of evaporative losses from lakes remain largely empirical depending on locally calibrated heat and mass transfer coefficients or remotely sensed surface temperature data, we propose a physically-based framework that builds on inherent lake characteristics (e.g., bathymetry, light attenuation characteristics) and atmospheric forcing variables to quantify energy dynamics of the water body and surface evaporative fluxes from the largest lakes across different climatic zones on a global scale. To evaluate the performance of the model, the modelling results determining the seasonal variation of vertical temperature profiles and latent heat loss were compared with in situ measurements of water temperature and surface heat fluxes measured in Lake Mead, in the Southwestern USA. We found good agreements between the physically-based estimations and the measured data. We then quantified evaporative losses from 30 lakes in 30 different climate zone sub-types with an average depth ranging from 1.1 m to 577 m and a surface area of 45 km² to 82,000 km². Our preliminary findings for 2020 indicate that variation of first-order atmospheric parameters (i.e., wind, radiation, air temperature, and humidity) across climatic zones and the change in lake bathymetry altering local vertical temperature profiles within the water body significantly affect evaporative losses. The energy-constrained model enables quantifying the extent of evaporative water losses from lakes and provides a theoretical basis for delineating potential impacts on water management and ecological and climatological processes under different climate change scenarios.

How to cite: Nevermann, H., Aminzadeh, M., Madani, K., and Shokri, N.: Global scale estimation of evaporative losses from large lakes located in different climatic zones, EGU General Assembly 2023, Vienna, Austria, 23–28 Apr 2023, EGU23-6893, https://doi.org/10.5194/egusphere-egu23-6893, 2023.

Lake surface water temperature (LSWT) is a physical property of lakes. LSWT is a critical parameter for evaluating lakes' water quality and biodiversity. The change in LSWT can also be an indicator of climate change. Therefore, it is crucial to monitor LSWT to improve our understanding of the spatiotemporal dynamics of LSWT for many applications. Conventionally and ideally, we can install in-situ gauge stations or monitoring sites to measure surface water temperature in lakes, and these in-situ measurements are generally the most accurate. However, in-situ measurements in lakes are often sparse and limited in terms of spatial coverage and temporal length, which leaves many lakes with no measurements or lacking long-term continuous measurements. For example, Lake Vänern (surface area of about 5,655 km2, the largest lake in the European Union) has only two operational stations for measuring LSWT. The existing in-situ measurements are at irregular intervals (approximately bi-weekly) and have many data gaps. Many lakes globally have the same data situation as Lake Vänern. As a result, in-situ measurements cannot sufficiently capture the spatiotemporal dynamics of LSWT in large lakes.

Satellite remote sensing has emerged as an essential method to monitor LSWT. Thermal infrared satellite data have been widely used to estimate the surface temperature at relatively high spatial resolution (higher and up to 1 km resolution). One of the most used satellite products for surface temperature is the MODIS (Moderate Resolution Imaging Spectroradiometer) global land surface temperature product, which is available from 2000 at 1 km-daily spatial-temporal resolutions. However, many studies stressed that cloud influence could significantly degrade the quality and availability of satellite-derived surface temperature for certain lakes, calling for a dedicated investigation to address this issue. Besides MODIS data, there are many other satellite-derived LSWT products at different spatial-temporal resolutions and spatial coverage, e.g., the ones available at http://www.laketemp.net. In addition, the recent ERA5-Land, a state-of-the-art reanalysis dataset, can also provide spatially complete and temporally continuous land surface variables, including the lake temperature at 0.1 degree-hourly spatial-temporal resolutions from 1950 to present. Each of the aforementioned products has its own advantages and limitations.

Our initial analysis showed a significant data gap in LSWT from MODIS product for Lake Vänern due to cloud influence, which motivates us to conduct this study. This study aims to evaluate multiple existing LSWT products and, more importantly, to combine them with the advanced data fusion and bias correction method to develop a new spatially complete and temporally continuous LSWT dataset for Lake Vänern, Sweden. New in-situ measurements of LSWT will be collected from boats and drones at many locations of Lake Vänern; such measurements, together with existing data from the two stations, will be used to evaluate multiple LSWT products, the developed method, and the merged dataset. The newly developed LSWT dataset for Lake Vänern will benefit many applications, such as lake evaporation estimation, water balance analysis, air-lake interactions, and local climate forecasting.

How to cite: Duan, Z. and Schultze, A.: Development of a new spatially complete and daily continuous lake surface water temperature dataset for Lake Vänern, Sweden, EGU General Assembly 2023, Vienna, Austria, 23–28 Apr 2023, EGU23-6928, https://doi.org/10.5194/egusphere-egu23-6928, 2023.

EGU23-7068 | Posters on site | HS10.9

Thermal conditions and lake metabolism in the ice-covered North Aral Sea 

Georgiy Kirillin, Alexander Izhitsky, and Abilgazi Kurbaniyazov

Rapid desiccation of the Aral Sea, the former 4th largest lake worldwide, attracts continuous attention of researchers as an example of fast anthropogenically driven change of a large aquatic ecosystem on unprecedentedly large spatial scales. As a countermeasure preventing further desiccation, a dam was constructed in 2005 separating the northern part of the Aral Sea from the rest of the basin. The effort led to stabilization of the North Aral volume and salinity and was widely recognized as an exceptional success in large-scale water management and restoration. The “restarted” ecosystem developed within several years to a highly productive large lake. Owing to the cold arid climate, the lake is covered by ice for several months in winter while gaining significantly higher amount of solar radiation than temperate and polar ice-covered lakes. We present new results revealing characteristic features of large low-latitude brackish lake dynamics under ice cover: strong internal basin-scale waves with long periods, heating of the water column by solar light penetrating the ice cover, and arresting of vertical convective mixing by freshening of upper waters during the ice melt. The under-ice dissolved oxygen content was analyzed in terms of whole-lake metabolism and demonstrated primary production taking place during the entire ice-covered period with a strong intensification in spring months after the snow melt increased the photosynthetically active radiation level under ice.

How to cite: Kirillin, G., Izhitsky, A., and Kurbaniyazov, A.: Thermal conditions and lake metabolism in the ice-covered North Aral Sea, EGU General Assembly 2023, Vienna, Austria, 23–28 Apr 2023, EGU23-7068, https://doi.org/10.5194/egusphere-egu23-7068, 2023.

Desert terminal lakes are important signals to discern ecological degradation crises, partic- ularly in arid areas where an artificial project of ecological water diversion has designated a quota of river water to prevent lake body shrinkage and protect the ecosystem. Knowledge of the minimum ecological water demand (EWD) is thus necessary to ensure the basic health of lake ecosystems. This study analyzed the spatiotemporal evolution of water boundaries using Landsat satellites data via remote sensing technology from 2002 to 2017 in East Juyan Lake, an inland desert terminal lake of the Heihe River in northwest China. The minimum lake water demand was determined using two estimation methods: the lake-evaporation-oriented EWD method and the minimum water level method. In the latter method, both lake topography (using water-level area curves) and biological survival demands (using bighead carps as indicators) were considered to derive the minimum lake EWD. Water diversion to the lake over the past 15 years has increased the lake’s area, but there are still marked intra-annual seasonal variations. The annual minimum lake water demand was suggested to be 54 × 106 m3/year by comparing the different methods; however, it was not satisfied, and the lake survival was endangered when the occurrence frequency of the annual runoff in the Zhengyixia hydrological station exceeded 65%. This study offered promising directions for inland lake water resource management.

How to cite: Li, L.: Ecological Water Demand Estimations for Desert Terminal Lake Survival under Inland River Water Diversion Regulation, EGU General Assembly 2023, Vienna, Austria, 23–28 Apr 2023, EGU23-7208, https://doi.org/10.5194/egusphere-egu23-7208, 2023.

EGU23-7630 | ECS | Orals | HS10.9 | Highlight

Development of surface temperatures of alpine lakes in Austria under climate change 

Katharina Enigl, Hanna Pritsch, and Rainer Kurmayer

Lake Surface Temperature (LST) is a key characteristic that reflects meteorological and climatological influences on lakes. In general, there is limited LST data from high elevation lakes available as these areas are remote and not part of regular monitoring programs. Nonetheless, for the development of effective management strategies for high-altitude lakes, it is important to understand their response to climate warming. This study aims at both the reconstruction of LST back to 1998 and the projection of LSTs for 21 alpine lakes (1500-2300 m a.s.l.) in the Niedere Tauern region in Austria until the year 2100. For the determination of the relationship between atmospheric variables (temperature and precipitation), near-lake snow depth and observed LST, general additive models were trained with a daily temporal resolution for the years 1998-2003, and 2019-2020. We subsequently employed the model with the highest fit to reconstruct LSTs for the whole period 1998 to 2003. Furthermore, we estimate LST until 2100 using an ensemble of regional climate projections for the RCP2.6 (in-line with the COP 21 Paris Agreement), RCP4.5 and RCP8.5 (“worst-case”) scenario. Under the RCP8.5 scenario, the average rise for August lake surface temperatures in the far future (2071-2100) is predicted to increase by 2.3 °C compared to temperatures in the near future (2020-2049).  Consequently, the ice-free period is expected to rise on average 1-1.2—fold in the near future (2031-2060) and 1-1.5-fold in the distant future. These alterations in the lakes’ temperature regime probably affect multiple limnological parameters related to ecological quality such as primary productivity and trophic state.

How to cite: Enigl, K., Pritsch, H., and Kurmayer, R.: Development of surface temperatures of alpine lakes in Austria under climate change, EGU General Assembly 2023, Vienna, Austria, 23–28 Apr 2023, EGU23-7630, https://doi.org/10.5194/egusphere-egu23-7630, 2023.

EGU23-7710 | ECS | Orals | HS10.9

Consequences of drying-out of Lake Neusiedl on the GHG budget of the reed belt 

Pamela Alessandra Baur, Andreas Maier, Thomas Zechmeister, and Stephan Glatzel

Lake Neusiedl, a shallow brackish lake of Austria and Hungary, is the westernmost steppe lake of Europe with an area of ca. 320 km² and the second largest coherent reed population in Europe. Half of Lake Neusiedl consists of a wetland ecosystem dominated by Phragmites australis, which forms a seasonally varying mosaic of water, reed and sediment patches, is highly sensitive to climate variations and which we investigated here.

Little is known about the effects of climate change on reed dominated wetlands and the contribution of central European reed belts as a source of greenhouse gases (GHG). The current ongoing drought periods at Lake Neusiedl affect especially the water balance but also the carbon fluxes in the reed belt. Therefore, we investigated the drought influenced carbon and water fluxes and their drivers of the reed ecosystem of a brackish lake over the last three years.

We used the eddy covariance (EC) technique to continuously quantify the vertical turbulent GHG exchange between the reed belt and atmosphere. The EC observations have been conducted near Illmitz in the natural zone of National Park Lake Neusiedl from summer 2018 to now. For taking the reed development of the studied ecosystem into account, vegetation indices data were used.

The annual CO2 emissions decreased by 95 % from 200.5 g C m-2 in 2019 to 9.2 g C m-2 in 2021. Gross primary production and ecosystem respiration both increased from 2019 to 2021. The annual emissions of CH4 decreased by 59 % from 9.0±1.0 g C m-2 in 2019 to 3.7±1.9 g C m-2 in 2021. The reed belt tended from a strong to a low carbon source if only the vertical flows are taken into account. One explanation is the decreasing water level in the lake between 2019 to 2021, which was followed by a drying out of the reed belt (≙ no water above surface) in the late summer of 2020 and a longer period in 2021. The second explanation is the increasing reed growth (in area and biomass) inside the reed belt which increased the photosynthetic rate. The vegetation indices like NDVI, EVI and LAI from the reed belt support this by an increasing tendency from 2019 to 2021. The third explanation is that due to the low water levels less (or almost no) lateral exchange occurred via channels between the reed belt and the open water areas of the lake in 2021 compared to 2019.

The apparent disconnection between the open water area of Lake Neusiedl and the reed belt re-directs carbon cycles and ecosystem functioning.

How to cite: Baur, P. A., Maier, A., Zechmeister, T., and Glatzel, S.: Consequences of drying-out of Lake Neusiedl on the GHG budget of the reed belt, EGU General Assembly 2023, Vienna, Austria, 23–28 Apr 2023, EGU23-7710, https://doi.org/10.5194/egusphere-egu23-7710, 2023.

EGU23-10445 | ECS | Posters on site | HS10.9

Monitoring Glacial Lakes in High Mountain Asia from 2008 to 2016 

Meimei Zhang and Fang Chen

Glacial lake outburst floods (GLOFs) are among the most serious natural hazards in mountainous regions in the last several decades. The recent global warming has caused dramatic glacial lake changes and increased potential GLOF risk, particularly in High Mountain Asia (HMA) region. Thus, there is a pressing need to detect and monitor lake area changes and spatial distribution of glacial lakes in this region. In this research, we produce more accurate and complete maps of glacial lake extent in the HMA in 2008, 2012 and 2016 with consistent time intervals using Landsat satellite images and the Google Earth Engine (GEE) cloud computing platform, and further study the formation, distribution and dynamics of the glacial lakes. In total 17016 and 21249 glacial lakes were detected in 2008 and 2016, respectively, covering an area of 1420.15±232.76 km2 and 1577.38±288.82 km2; the lakes were mainly located at altitudes between 4400 m and 5600 m. The annual areal expansion rate was approximately 1.38 % from 2008 to 2016. To explore the cause of the rapid expansion of individual glacial lake, we investigate their long-term expansion rates by measuring changes in shoreline positions. The results show that glacial lakes are expanding rapidly in areas close to glaciers, had a high expansion rate of larger than 20 m/yr from 2008 to 2016. Glacial lakes in the Himalayas show the highest expansion rate of more than 2m/yr, followed by the Karakoram Mountains (1.61 m/yr) and the Tianshan Mountains (1.52 m/yr). The accelerating rate of glacier ice and snow melting caused by global warming is the primary contributor to glacial lake growth. These results may provide information that will help in the understanding of lake detailed dynamics and the mechanism, and also facilitate the scientific recognition of the potential hazards associated with glacial lakes.

How to cite: Zhang, M. and Chen, F.: Monitoring Glacial Lakes in High Mountain Asia from 2008 to 2016, EGU General Assembly 2023, Vienna, Austria, 23–28 Apr 2023, EGU23-10445, https://doi.org/10.5194/egusphere-egu23-10445, 2023.

EGU23-10658 | ECS | Orals | HS10.9

Contributions from climate variation and human activities to flow regime change of Tonle Sap Lake and Mekong River from 2001 to 2020 

Khosro Morovati, Lidi Shi, Keer Zhang, Fuqiang Tian, Mahmut Tudaji, and Pouria Nakhaei

The flow regime of the largest lake in Southeast Asia, Tonle Sap Lake, is driven by the reverse flow phenomenon caused by its link with the Mekong River. This reverse flow makes the lake one of the most productive aquatic ecosystems globally and thus provides important economic opportunities for local communities. The recent human activities in the upstream, as well as climate variations, have resulted in unforeseen alterations in the flow regime of the Mekong River and Tonle Sap Lake. However, little is known about the explicit attribution of different parts of the upstream basin to these variations, which would be essential for transboundary water management. To unveil these attributions, we developed a novel modeling setup consisting of hydrodynamic, hydrological, and machine learning models. This modeling setup allowed us to separate the impacts of a) climate variation, b) human activities in the Chinese part of the basin, and b) the lower part of the basin (i.e., Laos, Thailand, and Vietnam). During the 2001–2009 baseline, when human modifications to the flow were still minimal, we found that Tonle Sap Lake received, on average, 42.4 km3/yr water from the Mekong, 48.2 % of the total inflow to the lake. During the period of increased human activities, 2010–2020, this decreased due to climate variation to 40.1 km3/yr (a 5.7 % drop), which was further exacerbated by the increased human activities in the upstream parts of the basin (China ~ 7.3%, Laos, Thailand, and Vietnam ~ 9 %). Additionally, during the flow period when water flows from the lake towards the Mekong, on average, 31 % of the total inflow into the Mekong Delta originated from the lake during the baseline period. Climate variation decreased this by 4 percentage points (pp), i.e., to 27 %, while the human activities in China and lower parts of the basin decreased this by 1.6 pp (25.4 %) and 1.9 pp (25.1 %), respectively. Our findings unveiled the attributions of different drivers on Tonle Sap Lake’s hydrology and will facilitate transboundary water management in the basin. The impacts of future plans on different parts of the basin should be carefully evaluated together with existing anthropogenic impacts, as well as climate change, to minimize the further impacts on the lake and Mekong River.

How to cite: Morovati, K., Shi, L., Zhang, K., Tian, F., Tudaji, M., and Nakhaei, P.: Contributions from climate variation and human activities to flow regime change of Tonle Sap Lake and Mekong River from 2001 to 2020, EGU General Assembly 2023, Vienna, Austria, 23–28 Apr 2023, EGU23-10658, https://doi.org/10.5194/egusphere-egu23-10658, 2023.

EGU23-14467 | ECS | Orals | HS10.9 | Highlight

Regime shifts in a euxinic marine lake 

Iva Dominović, Marija Marguš, Mathieu Dutour Sikirić, and Irena Ciglenečki

Numerous limnological studies have been investigating lake overturning regimes in the frame of possible future climate scenarios, mainly regarding the predicted surface air temperature change. Overturning regime shifts are expected to manifest in the stratification onset and offset timing, as well as in stratification duration. In addition, the lakes' vertical water column is expected to become more stable, and thus less inclined to overturn. Since aquatic life in the lake depends thoroughly on its phenology, the predicted regime shifts are going to influence the whole lake ecosystem, along with the microclimate of its surrounding area.

An interesting example of regime shifting can be found in the central part of the Adriatic coast (43° 32' N, 15° 58' E). Lake Rogoznica (also known as "Dragon's Eye" lake) is a marine lake that is connected to the nearby Adriatic Sea through the porous karstic landscape. Although this connection is confirmed by high salinity values that reach those found in the surrounding sea (~38 PSU) and the visible tides, the newest research suggests that the complete overturning of the lake is governed by the delicate balance between the freshwater input (precipitation and runoff) and seawater input (Adriatic Sea), together with substantial surface air temperature fluctuations. Namely, Rogoznica Lake seems to exhibit complete overturns with irregular periodicity: sudden and abrupt holomixis occurred in the Autumn of 1997, 2011, 2016, 2020, and 2021. Another peculiarity of the lake is the complete anoxia with high levels of free sulfides that accompanies every such event, and the consequent mass mortality of the lake's aerobic life - the complete opposite of the oxygenation effect that seasonal overturning usually has in lakes.

It is still unclear whether sudden anoxic holomixis and their frequency are a consequence of local tourist activities, regional climate variability, or climate change affecting the Mediterranean, as the effects of all mentioned could have an intertwined effect on the small, complex system of Rogoznica Lake. In this work, we present the latest findings regarding the Rogoznica Lake water column stratification with a two-sided approach: a comprehensive sea-atmosphere measurements analysis and numerical modelling attempts.

How to cite: Dominović, I., Marguš, M., Dutour Sikirić, M., and Ciglenečki, I.: Regime shifts in a euxinic marine lake, EGU General Assembly 2023, Vienna, Austria, 23–28 Apr 2023, EGU23-14467, https://doi.org/10.5194/egusphere-egu23-14467, 2023.

EGU23-15065 | ECS | Orals | HS10.9

Detecting lake mixing anomalies using Earth Observation 

Elisa Calamita, Michael Brechbühler, Iestyn Woolway, Clement Albergel, and Daniel Odermatt

Lakes are responding rapidly to climate change and one of the most tangible responses is the increase in lake surface water temperature. Such an increase can intensify thermal stratification and dampen the intensity of vertical mixing. In turn, surface warming has the potential to alter the mixing regime of lakes, potentially leading to abrupt shifts in ecosystem functioning. Reduced mixing between the surface and bottom waters can indeed decrease the upwelling of essential nutrients from deep water to the lake surface and the oxygen transport in the opposite direction. This can result in a decrease in lake productivity and can increase the risk of anoxia at depth, respectively.

Despite the important consequences of such lake mixing anomalies, we lack a systematic overview of their occurrence, mainly due to the lack of systematic data to detect and analyze them worldwide. Remotely sensed lake surface water temperature available from ESA CCI (Climate Change Initiative) and similar sources represent spatial skin temperature gradients, but they do not resolve vertical gradients. They are hence often used to prove the lakes’ long-term warming in terms of spatial average. However, the horizontal gradients of such data could help us better understand the internal processes of lakes and the identification of lake mixing anomalies. Given that seasonal overturning often occurs at different times across the lake, the spatial character of remotely sensed data can reveal important processes in freshwater systems and can help assess the long-term variability in the overturning behaviour of large lakes in the context of climate change. Within our project, we use the spatial component of satellite Earth Observation data to reveal information about lake mixing and mixing anomalies. We apply a thermal front tracking method, a technique much more exploited in oceanography than limnology, to identify mixing anomalies in dimictic lakes worldwide.

Our study suggests that the spatially distributed property of Earth Observation can be useful to spot lake mixing anomalies in dimictic lakes worldwide. Thus, we present the first global-scale assessment of lake mixing anomalies occurrence in the last 20 years. Earth Observation data can also be used to calculate how susceptible lakes are to undergo a mixing regime shift. Interestingly, we found that lakes experiencing more mixing anomalies are also those more susceptible to undergoing a mixing regime shift. Moreover, using Earth Observation, we detected mixing anomalies that have already been documented and, more interestingly, we spotted mixing anomalies occurring in unstudied remote lakes. Although further investigations would be needed to specifically assess the impact of climate change on these remote lakes, these cases highlight that remote sensing can be used as a first screening tool to spot lake mixing anomalies worldwide. Thus, Earth Observation and our methodology can be potentially used as an early warning system for lake mixing regime shifts.

How to cite: Calamita, E., Brechbühler, M., Woolway, I., Albergel, C., and Odermatt, D.: Detecting lake mixing anomalies using Earth Observation, EGU General Assembly 2023, Vienna, Austria, 23–28 Apr 2023, EGU23-15065, https://doi.org/10.5194/egusphere-egu23-15065, 2023.

EGU23-15524 | Posters on site | HS10.9 | Highlight

Evidence of heatwaves in two deep Italian lakes in summer 2022 

Giulia Valerio, Stella Volpini, and Elena Benvenuti

Lakes and their biodiversity are threatened by global warming, responding rapidly to climatic change and incorporating the effects occurring in the drained catchments. The thermal characteristics of lakes have undergone substantial alterations in response to the progressive increased air temperature. Surface waters have worldwide warmed, with a global average rate of 0.34°C per decade between 1985 and 2009 during summer. Over the last few years, increased attention is given to the response of lakes to extreme events, such as storms and heatwaves. There is evidence that climate change is leading to longer and more frequent marine heatwaves at the surface of the ocean, while much less is known about heatwaves in lakes, where field studies are generally lacking.

According to the C3S ERA5 dataset, August 2022 globally tied as the third warmest on record, 0.30°C warmer than the 1991-2020 average for August and 0.42°C warmer than the 1981-2010 average in this data record. The month of August was particularly warm over Europe and was also remarkable in terms of hydrological variables with drier than normal conditions over western Europe, sustained by heatwaves with significant impacts on economy and society. In this contribution, we show the thermal response of two deep Italian lakes (Lake Garda and Lake Iseo) under the extreme meteorological conditions occurred in summer 2022. In both these lakes, a floating station measured at a 1/min sampling rate the meteorological forcing at the lake surface as well as water temperature down to 100 m of depth with 0.01 °C accuracy. Thanks to the temperature data, we identified and characterized, in terms of intensity and duration, several long-lasting heatwaves and we compared their characteristics with past observations, showing evidence of an exceptional surface warming over the last 20 years. The overall high-resolution dataset allowed us to compute the thermal balance of the two lakes, comparing the relative importance of the different forcing and that of the morphological and hydrological characteristics of the two water bodies, and to discuss the impact of the internal hydrodynamics on the surface heating. This analysis underlined the fundamental role played by the wind, which affects both the thermal fluxes at the water surface and the vertical distribution of temperature. This result raises the issue about the degree of reliability of the prediction of extreme events in lakes under climate change due to the uncertainties of the wind predictions, especially in geographical context, such as pre-alpine or alpine regions, where the wind fields provided by large-scale resolution models are less accurate. 

How to cite: Valerio, G., Volpini, S., and Benvenuti, E.: Evidence of heatwaves in two deep Italian lakes in summer 2022, EGU General Assembly 2023, Vienna, Austria, 23–28 Apr 2023, EGU23-15524, https://doi.org/10.5194/egusphere-egu23-15524, 2023.

EGU23-16150 | Orals | HS10.9

Lake Neusiedl wetland (Austria/Hungary) in a changing environment: anthropogenic versus anthropogenic effects 

Erich Draganits, Michael Weißl, András Zámolyi, and Michael Doneus

Lake Neusiedl and adjacent lakes at the Austrian/Hungarian boundary represent a unique wetland, situated at the geodynamical and geomorphological boundary between the Alps, Carpathians and the Pannonian Basin, and therefore represents an important transition zone concerning terrain, climate, vegetation and fauna. The more than 700 km2 large area is one of the flattest regions of Austria with less than 17 m relief variation. Today, Lake Neusiedl measures some 320 km2 with less than 1.8 m depth and a tectonic origin is widely accepted. East of the lake, about 30 shallow lakes still exist, of which the largest measures less than 2 km length and less than 1 m depth. At present, the water level of Lake Neusiedl shows the lowest values since 1965 and all the shallow lakes were dry during the summer 2022. We use high-resolution topographical, sedimentological, geomorphological as well as historical maps and historical charters to investigate the formation end evolution of Lake Neusiedl and adjacent lakes. Our data show that the present-day conditions and processes of Lake Neusiedl strongly diverge from conditions in the past. The earliest preserved record of modification of the lake´s hydrological conditions is from 1568, followed by increasing drainage efforts and the building of a dam road in the southeast, finished in 1780, which subsequently cut off the lake from its most important tributaries from the south. This palaeohydrological reconstruction of Lake Neusiedl and Hanság also implies an episodic lower salt content of the water compared to modern values, especially during flood periods. Therefore, it is not useful to compare the hydrological situation of Lake Neusiedl before 1780 (or even 1568) and after. The documented variation of the water level of Lake Neusiedl between desiccation and highest flood level is around 4.2 m. These variations affected enormous areas in this low-relief region, with a huge impact on the landscape, fauna, vegetation, human settlement patterns, land use, communication routes and even possible occurrence of malaria – which should be considered in regional archaeological, historical and biological interpretations. The numerous shallow lakes and presently dry basins, detected in the high-resolution airborne laser scanning data in the Seewinkel originally formed as thermokarst lakes during permafrost degradation after the end of the Last Glacial Maximum. In total, more than 370 enclosed depressions are visible. The depressions of eastern Austria represent one of the first Latest Pleistocene thermokarst lakes documented in central Europe. Although man-made climate change has a clear impact on the water balance of the lakes, they reinforce past hydrological modifications.

How to cite: Draganits, E., Weißl, M., Zámolyi, A., and Doneus, M.: Lake Neusiedl wetland (Austria/Hungary) in a changing environment: anthropogenic versus anthropogenic effects, EGU General Assembly 2023, Vienna, Austria, 23–28 Apr 2023, EGU23-16150, https://doi.org/10.5194/egusphere-egu23-16150, 2023.

EGU23-16527 | Posters on site | HS10.9 | Highlight

Central and Eastern Siberian High Latitude Lake Hydrochemistry 

Birgit Heim, Mareike Wieczorek, Kathleen Stoof-Leichsenring, Boris K. Biskaborn, Anne Morgenstern, Paul P. Overduin, Antje Eulenburg, Izabella Baisheva, Stefan Kruse, Evgenii S. Zakharov, Luidmila A. Pestryakova, Kirsten Elger, and Ulrike Herzschuh

We present a long-year data collection of freshwater chemistry from 590 high latitude lakes based on water sampling during our past expeditions in the Central and Eastern Siberian continuous permafrost regions. We compiled and standardised all acquired seasonal limnological data on major ions, alkalinity, pH and Electrical Conductivity including time series of data from lakes that we sampled repeatedly. The data collection encompasses diverse Siberian regions with numerous lakes along climate and vegetation gradients in the Khatanga and central Yakutian lowlands, to the glacial lakes of the Chukotka mountain region in Eastern Siberia and the central Lena Delta in the Arctic zone. 

The data collection is rich in standardised metadata following the metadata schema of the International Generic Sample Number (IGSN), which provides a unique and persistent identifier for physical objects (samples). Within the project FAIR Workflows to establish IGSN for Samples in the Helmholtz Association (FAIR WISH), funded by the Helmholtz Metadata Collaboration Platform (HMC), we customised the GFZ-specific IGSN schema to better describe lakes and water samples in a hierarchical (parent and child) scheme with standardised metadata on lake and sample characteristics, ecoregions, principal investigators and many more.

This standardised data collection will be made available in the PANGAEA data repository (www.pangaea.de) to enable analyses of land-to-lake geochemical fluxes and will support biodiversity, biogeochemical, bioindicator and many more analyses. In this presentation, we visualize the data in form of Piper and Schoeller plots in order to categorize the water bodies and investigate their geographic distribution and links to catchment vegetation, active layer depth, permafrost disturbances and lithology.

How to cite: Heim, B., Wieczorek, M., Stoof-Leichsenring, K., Biskaborn, B. K., Morgenstern, A., Overduin, P. P., Eulenburg, A., Baisheva, I., Kruse, S., Zakharov, E. S., Pestryakova, L. A., Elger, K., and Herzschuh, U.: Central and Eastern Siberian High Latitude Lake Hydrochemistry, EGU General Assembly 2023, Vienna, Austria, 23–28 Apr 2023, EGU23-16527, https://doi.org/10.5194/egusphere-egu23-16527, 2023.

EGU23-17259 | ECS | Posters on site | HS10.9

Intercomparison and sensitivity assessment of lake primary production models for remote sensing 

Jonas Wydler, Mortimer Werther, Camille Minaudo, Alexander Damm, and Daniel Odermatt

Lakes are highly biodiverse ecosystems and are providing a wide range of ecosystem services to human wellbeing such as drinking water, water for irrigation, access to fisheries and recreational areas. Anthropogenic activities threaten these services both through local impacts on water bodies (e.g. eutrophication) and globally (e.g. climate change). The trophic state and the aquatic carbon cycle are sensitive indicators to evaluate the state and health of lake ecosystems. Monitoring the spatial and temporal dynamics of primary production is therefore a high priority in lake research.
Primary production can be assessed in several ways. The most common approach involves the incubation and measurement of labelled carbon isotopes in lake water samples that are exposed to certain light conditions. Alternatively, primary production can be estimated using diel variations in oxygen concentration or fast repetition rate fluorometry. Both approaches are accurate but can hardly be used to cover large spatial heterogeneities. For global assessments, only bio-optical primary production models based on remote sensing data allow a consistent upscaling in a cost-efficient manner.
A wide range of bio-optical primary production models exist and have been applied to lakes. Generally, these models describe the availability of light in the water column and the efficiency of the algae particles to absorb photon energy and to use this energy for subsequent carbon assimilation. The main challenges related to such approaches are to accurately the retrieve required information from satellite data and to precisely estimate sensible model parameters. The upcoming hyperspectral mission Plankton, Aerosol, Cloud, ocean Ecosystem (PACE) by NASA will help to improve the accuracy of primary productivity estimates.
This contribution aims to improve understanding of sensitivities and validity of available bio-optical primary production models to eventually maximise the benefits of improved information retrievals from PACE. We particularly reviewed state-of-the-art primary production models for remote sensing data of oceans and lakes, provided an overview of relevant model inputs and calculated Sobol sensitivity indices for a range of input parameters and models. Our results facilitate future applications of primary production models to hyperspectral PACE data and will particularly help to identify most sensitive input variables, to improve empirical model parameterizations and to guide the selection of suited models for freshwater systems.

How to cite: Wydler, J., Werther, M., Minaudo, C., Damm, A., and Odermatt, D.: Intercomparison and sensitivity assessment of lake primary production models for remote sensing, EGU General Assembly 2023, Vienna, Austria, 23–28 Apr 2023, EGU23-17259, https://doi.org/10.5194/egusphere-egu23-17259, 2023.

EGU23-560 | ECS | Orals | HS10.10

Measured temporal variations of CO2 concentration and atmospheric emissions in a hydropeaking-impacted river 

Giulio Dolcetti, Sebastiano Piccolroaz, Maria Cristina Bruno, Elisa Calamita, Stefano Larsen, Guido Zolezzi, and Annunziato Siviglia

Rivers are increasingly recognised as active players in the global carbon cycle. They are able to transport, transform, and exchange organic matter, and can emit considerable fluxes of greenhouse gases (e.g., CO2) into the atmosphere, with a magnitude comparable to the global carbon input to the oceans. However, the quantification of these processes is still affected by considerable uncertainties, driven by an incomplete understanding of the interplay between physical, geochemical, and biological parameters, and by a lack of spatially and temporally resolved high-quality data. For instance, and despite a potentially strong impact on kilometres of rivers worldwide, the effects of hydropeaking on riverine CO2 emissions have been almost completely neglected until recently (Calamita et al., Unaccounted CO2 leaks downstream of a large tropical hydroelectric reservoir, PNAS 2020). As a contribution to filling this knowledge gap, we present the results of a field-measurement campaign performed in a single-thread Alpine river (River Noce, Italy) during multiple hydropeaking events. Data of water-dissolved CO2, water temperature, and flow discharge, were collected sub-hourly both downstream and upstream of the outlets of a hydropower plant, revealing a complex pattern of variation in time at both locations. Water released from the hydropower plant during hydropeaking had oversaturated CO2 concentrations relative to the atmosphere, in close agreement with water samples collected in the hypolimnion of the upstream reservoir. Higher flow rates during hydropeaking events were associated with higher rates of gas exchange through the water-air interface. Higher exchange rates and higher CO2 concentrations in water during hydropeaking events enhanced CO2 fluxes, as confirmed by measurements with a floating CO2 flux chamber. Meanwhile, the CO2 concentration upstream of the outlets displayed strong diel fluctuations around the atmospheric equilibrium concentration, which were likely driven by primary production within the residual flow during the day. It is shown that the residual flow can have a previously unacknowledged added value as a CO2 sink during the day, fueled by its biological activity. Hydropower releases bypassed the residual flow and discharged hypolimnetic water oversaturated with CO2 at high flow rates during hydropeaking, offsetting CO2 concentration and fluxes downstream of the outlets and increasing emissions on average. These results highlight the ubiquity of hydropeaking impacts also with respect to greenhouse gas emissions. They illustrate the complexity of the riverine carbon cycle and demonstrate the importance of temporally and spatially-resolved data for the accurate assessment of the riverine carbon balance.

How to cite: Dolcetti, G., Piccolroaz, S., Bruno, M. C., Calamita, E., Larsen, S., Zolezzi, G., and Siviglia, A.: Measured temporal variations of CO2 concentration and atmospheric emissions in a hydropeaking-impacted river, EGU General Assembly 2023, Vienna, Austria, 23–28 Apr 2023, EGU23-560, https://doi.org/10.5194/egusphere-egu23-560, 2023.

EGU23-656 | Posters on site | HS10.10

Hydropeaking: a multiscale perspective 

Gabriele Chiogna, Monica Basilio Hazas, Giorgia Marcolini, Teresa Pérez Ciria, and Francesca Ziliotto

This presentation aims at covering different and interdisciplinary research aspects focusing on hydropeaking, highlighting in particular which temporal scales are relevant at different spatial scales. We will present how the impact of hydropeaking at the catchment scale changed in the past decades due to changes in legislation and the energy market and the role of hydropeaking in the context of energy complementarity. We will then focus on the effects of sudden river stage fluctuations at the reach scale and their impact on surface water-groundwater interaction and eventually on energy and mass transfer processes, considering seasonal, weekly and sub-daily time scales. Finally, laboratory scale investigations will show the effects of hydropeaking on solute mixing in porous aquifers. The environmental impact of hydropeaking on the ecosystem calls for effective mitigation strategies and policies to find a sustainable compromise between energy production and ecosystem preservation which are capable of tackling processes occurring at multiple spatial and temporal scales.

How to cite: Chiogna, G., Basilio Hazas, M., Marcolini, G., Pérez Ciria, T., and Ziliotto, F.: Hydropeaking: a multiscale perspective, EGU General Assembly 2023, Vienna, Austria, 23–28 Apr 2023, EGU23-656, https://doi.org/10.5194/egusphere-egu23-656, 2023.

EGU23-2851 | ECS | Posters on site | HS10.10

Characterisation of wave attenuation by eelgrass meadows via laboratory experiments 

Davide Vettori and Costantino Manes

Coastal areas are among the most endangered zones worldwide due to ever increasing physical and environmental pressures exacerbated by the effects of climate change. Eelgrass ecosystems represent a promising nature-based solution because they promote biodiversity and carbon capture. Recent works have concluded that eelgrass can also contribute to reduce physical pressures on coastal areas by damping incoming waves. However, the large number of governing physical parameters and the limited amount of data available make it hard to quantify the wave attenuation due to eelgrass in natural scenarios.

In the present work extensive laboratory experiments were conducted to characterise the wave attenuation properties of eelgrass in a range of natural scenarios. Experiments were conducted in a 50m long wave tank wherein a 4m long and 0.1m high meadow of eelgrass replicas was located. Eelgrass replicas modelled a range of eelgrass species (e.g. Cymodocea nodosa, Zostera marina) to a scale between 1:1 and 1:8 depending on the conditions considered. Replicas were designed using both Cauchy and Froude similarities and considering the morphology and flexural rigidity of eelgrass. A total of 330 experiments were performed varying the most important governing parameters, namely: water depth (from 0.15m to 0.6m), plant densities (up to 1338 plant/m2), wave height (up to 0.16m depending on the water depth) and length (between 1m and 4m). Thus, the wave Cauchy number in the tests ranged from unity up to 7000. During experiments the water surface level along the tank and the meadow was measured by means of 8 resistance gauges that recorded at 128 Hz with a relative error up to 2%. From water surface level data, the mean wave height at each location was calculated and the wave attenuation coefficient of eelgrass was estimated based on the variation of mean wave height along the patch.

The resulting wave attenuation coefficients agree well with the model proposed by Lei & Nepf (2019) for submergence ratios larger than 0.2, even though for low attenuations the relative uncertainty is high. The wave attenuation caused by the eelgrass meadow is significantly larger than that due to the friction at the bed and lateral walls for submergence ratios over 0.2 and meadows denser than 251 plants/m2. These values may represent important thresholds for eelgrass contribution to wave attenuation in coastal areas.

How to cite: Vettori, D. and Manes, C.: Characterisation of wave attenuation by eelgrass meadows via laboratory experiments, EGU General Assembly 2023, Vienna, Austria, 23–28 Apr 2023, EGU23-2851, https://doi.org/10.5194/egusphere-egu23-2851, 2023.

EGU23-3548 | Orals | HS10.10

Nature-Based Features: developing a framework to shift them from risky investments to reliable and robust solutions 

Jennifer Olszewski, John Kucharski, Matthew Smith, Marriah Abellera, and Todd Steissberg

Nature-based features (NNBFs) have emerged over the past two decades as tools to leverage natural processes that provide a range of functions from flood reduction to pollutant removal. Despite their growing popularity, a notable gap remains between our understanding of internal NNBF processes and our ability to design NNBFs for specific objectives (e.g., x% reduction of peak storm flow, x% nitrogen reduction) by leveraging such processes. NNBF benefits are, as a result, difficult to quantify, making them a riskier investment compared to tried-and-true grey infrastructure alternatives. This knowledge gap must be filled if we want to design effective and sustainable NNBFs that are viewed on equal footing with grey infrastructure. This presentation will discuss the development of a non-tidal constructed wetland model for the purpose of evaluating design suitability across a range of performance metrics. This model, written in MATLAB, couples hydrologic, hydraulic, and water quality modules. It also allows the user to adjust the constructed wetland configuration (i.e., shape, area, grid cell water depths, vegetation placement, etc.) to maximize specific performance objectives including flood control, wildlife habitat, and water quality. Current efforts are also underway to build upon this design model concept to (1) expand to tidal wetland environments like salt marshes, (2) incorporate vegetation growth/death and morphologic processes, and (3) to incorporate future uncertainty into the design process to support the development of robust and sustainable NNBFs across a range of potential futures and landscape contexts. The overall aim of this work is to develop a framework that allows engineers and policy-makers to evaluate NNBF performance on level footing with grey infrastructure alternatives.

How to cite: Olszewski, J., Kucharski, J., Smith, M., Abellera, M., and Steissberg, T.: Nature-Based Features: developing a framework to shift them from risky investments to reliable and robust solutions, EGU General Assembly 2023, Vienna, Austria, 23–28 Apr 2023, EGU23-3548, https://doi.org/10.5194/egusphere-egu23-3548, 2023.

Zeeshan Tahir Virka, Faisal bin Ashrafa,b, Ali Torabi Haghighia, Bjorn Klovea, Seppo Hellstenc, Hannu Marttilaa

a University of Oulu, Faculty of Technology, Water, Energy, Environmental engineering Research Unit

b Stockholm Environment Institute (SEI)

c Finnish Environment Institute (SYKE)


Fluctuating energy prices in the Nordic region call for short-term river flow regulation at hydropower plants (HPPs). This short-term regulation leads to Hydropeaking – the pulsating water flow downstream of an HPP. Hydropeaking is detrimental to the overall health of the river, impacting all riverine and riparian ecosystem services. One of the major ecosystem services affected by hydropeaking in Nordic rivers is the socio–recreational ecosystem service (SRES), which holds significant value for Nordic culture and human wellbeing. We examine how SRES are affected by hourly hydropeaking events in a large Nordic River reach. Employing two indicators based on normalized daily maximum flow difference and sub-daily flow ramping we estimated annual and seasonal trends of hydropeaking in the studied reach of the Kemijoki River system. The study reach was found to be under “High Pressure” peaking class in all seasons. For SRES impact assessment, we applied a novel methodological approach to multiple layers of high-resolution spatio-temporal data. An overlay analysis of inundation maps derived from 2D-hydrodynamic modeling and a customized land classification map based on a machine learning algorithm resulted in identification of SRES areas under influence of sub-daily hydropeaking within the study reach. The degree of impact on SRES corresponded to seasonal variations of sub-daily hydropeaking where the highest impact was observed in the summer season The most affected recreational land uses were the shore and litorine areas. Furthermore, as intraday flow ramping results in peaking waves downstream of the HPP, our results show that most part of the river channel becomes hydraulically unsafe during hydropeaking events, especially in summer, which is popular in the context of Nordic culture and tourism. Consequently, hydropeaking can seriously impact the social, and recreational services offered by Nordic rivers; therefore, regulation practices at the HPPs should also consider SPES aspects.  We recommend further research to evaluate these services so that tradeoffs between energy production at HPPs and ecosystem services of rivers can be balanced.

How to cite: Virk, Z.: Nordic socio-recreational ecosystem services in a hydropeaked river system, EGU General Assembly 2023, Vienna, Austria, 23–28 Apr 2023, EGU23-4122, https://doi.org/10.5194/egusphere-egu23-4122, 2023.

EGU23-5314 | Posters on site | HS10.10

100 key questions to guide hydropeaking research 

Daniel Hayes, Maria Cristina Bruno, Maria Alp, Isabel Boavida, Ramon Batalla, Maria Dolores Bejarano, Markus Noack, Davide Vanzo, Roser Casas-Mulet, Damian Vericat, Mauro Carolli, Diego Tonolla, Jo Halleraker, Marie-Pierre Gosselin, Gabriele Chiogna, and Terese Venus

Hydropeaking has received increasing attention in the last years, but many knowledge gaps remain, potentially hampering effective policy and management efforts in rivers under such type of hydropower production. In this study, we collected open hydropeaking research questions from over 200 experts in river science, practice, and policy across the globe using an online survey available in five languages. We used a systematic method of determining expert consensus (Delphi method) to identify 100 core questions related to the following thematic fields: (i) hydrology, (ii) physico-chemical properties of water, (iii) river morphology and sedimentology, (iv) ecology and biology, (v) socio-economics and energy markets, (vi) policy and regulation, as well as (vii) management and mitigation measures. The consensus list of questions shall inform and guide researchers in focusing their efforts to foster a better science-policy interface, thereby improving the sustainability of peak-operating hydropower in a variety of settings.

How to cite: Hayes, D., Bruno, M. C., Alp, M., Boavida, I., Batalla, R., Bejarano, M. D., Noack, M., Vanzo, D., Casas-Mulet, R., Vericat, D., Carolli, M., Tonolla, D., Halleraker, J., Gosselin, M.-P., Chiogna, G., and Venus, T.: 100 key questions to guide hydropeaking research, EGU General Assembly 2023, Vienna, Austria, 23–28 Apr 2023, EGU23-5314, https://doi.org/10.5194/egusphere-egu23-5314, 2023.

EGU23-5678 | ECS | Orals | HS10.10

Stranding of early cyprinid life stages: effects of artificial flow down-ramping on Barbus barbus L. and Chondrostoma nasus L. under experimental conditions 

Simon Führer, Daniel S. Hayes, Thomas Hasler, David R. M. Graf, Felix Stoisser, Elora Fauchery, Anna Coudrais, Antonin Olejarz, Daniel Mameri, Stefan Schmutz, and Stefan Auer

Artificial sub-daily flow fluctuations caused by peak-operating hydropower plants are considered one of the most significant impacts on riverine ecosystems downstream of dams. These rivers have, therefore, been subject to numerous studies in recent decades. However, cyprinid fish, in contrast to salmonids, have hardly been addressed in hydropeaking studies yet, and extensive knowledge gaps remain. Therefore, our experimental study aims to assess the effects of rapid flow reductions on the early life stages of two European cyprinid indicator species, the common barbel (Barbus barbus L.) and the common nase (Chondrostoma nasus L.).

We conducted mesocosm experiments (2.25×2 m) under semi-natural conditions at an outdoor experimental facility (http://hydropeaking.boku.ac.at), simulating different hydropeaking scenarios with varying down-ramping rates during day and night. At each trial, 100 fish from one species (body length <20 mm) were stocked at peak flow (80 L.s-1). After an acclimation time (15 min.), the flow rate was reduced with variable ramping rates (0.3–1.8 cm.min-1) to constant low flow conditions (10 L.s-1). As a response parameter, larval stranding on a gently sloped shoreline mimicking typical nursery habitats was quantified during day and night.

The results reveal distinct diurnal patterns for both species, with increased stranding rates at night for all experimental scenarios. In addition, the data indicate differences between the tested down-ramping rates and show interaction effects between both parameters. The difference between species may result from water temperature and ecological factors. The study outcomes will benefit the ongoing discussion on species-specific hydropeaking mitigation by providing first insights on the direct effects of artificial flow down-ramping on early life stages of cyprinid fish.

How to cite: Führer, S., Hayes, D. S., Hasler, T., Graf, D. R. M., Stoisser, F., Fauchery, E., Coudrais, A., Olejarz, A., Mameri, D., Schmutz, S., and Auer, S.: Stranding of early cyprinid life stages: effects of artificial flow down-ramping on Barbus barbus L. and Chondrostoma nasus L. under experimental conditions, EGU General Assembly 2023, Vienna, Austria, 23–28 Apr 2023, EGU23-5678, https://doi.org/10.5194/egusphere-egu23-5678, 2023.

EGU23-6159 | ECS | Posters on site | HS10.10

Case study of extensive green roof with growing media amended with recycled materials and hybrid constructed wetland-extensive green roof 

Marek Petreje, Michal Sněhota, Petra Heckova, Bara Rybova, Tomas Chorazy, and Michal Novotny

Implementation of a green roof can require large amounts of natural resources such as water and natural components of the substrate. Therefore, green roof system that uses the principles of a circular economy has been developed and tested. Two studies were performed to evaluate performance of substrate for green roof amended with a recycled crushed brick and pyrolyzed sewage sludge (biochar). In order to design and select a suitable substrate, 8 substrate variants were prepared and tested. Physical properties such as maximum water capacity, retention curves, bulk density, grain size and pH were analyzed in order to selected suitable substrates for case studies.

First case study was performed on green roof size 7x5 m2. The aim was to evaluate the performance of the substrate in real conditions and to compare it with a commercially available substrate. To assess the effect of pyrolyzed sewage sludge, only part of the green roof contained biochar (9.5 vol. %), whereas the crushed brick was part of both substrates (37.5 vol. %).

Second study was performed on two elevated experimental beds in order to verify performance of the novel concept of combination of constructed wetland and extensive green roof irrigated with pre-treated grey water which we call hybrid green roof. The substrates amended with the same recycled materials as in the first study were used.

In hybrid green roof system, greywater is first pumped into the constructed wetland to be treated and then is used for irrigation of green roof. Performance of this hybrid green roof system was assessed on the basis of water balance measurements, laboratory analyses of water samples taken from various parts of the experimental beds, temperature and water content measurements along the experimental bed´s layers height. The hybrid green roof system is viable. There are relatively low concentrations of nutrients (phosphorus and nitrogen) in the leachate from test beds, namely because the irrigation provides the water directly to the drainage layer and nutrient rich substrate enriched with biochar isn't leached by irrigation water. Concentrations of nutrients increases only in response to precipitation. The constructed wetland part of the system proven a high potential to reduce the nutrients concentration in pre‑treated grey water.

The vegetation formed by Sedum spp. carpets is prospering well on both elevated experimental beds in the second study as well as on green roof in the first study. Nutrients from biochar are apparently available for the vegetation. Therefore, the vegetation on the bed and green roof with biochar amended substrate shows more vigorous growth and higher evapotranspiration. Substrates amended with recycled materials developed in the study had comparable properties (maximum water capacity, bulk density, pH) with commercial substrates.

This research has been funded by research projects: TN01000056/03, GA22-25673S

How to cite: Petreje, M., Sněhota, M., Heckova, P., Rybova, B., Chorazy, T., and Novotny, M.: Case study of extensive green roof with growing media amended with recycled materials and hybrid constructed wetland-extensive green roof, EGU General Assembly 2023, Vienna, Austria, 23–28 Apr 2023, EGU23-6159, https://doi.org/10.5194/egusphere-egu23-6159, 2023.

EGU23-6368 | Posters on site | HS10.10

Compilation of new evidence for the effectiveness of measures to emulate natural flood management (NFM) in the last 5 years 

Eleanor Pearson, Barry Hankin, Nick Chappell, Keith Beven, and Steve Rose

This poster summarises a range of new findings on monitoring and modelling the effectiveness of Natural Flood Management including from NERC/UKRI NFM programme over the last five years covering a range of nature based solutions designed to slow, store and infiltrate flood water. The updates cover the following areas: Quantitative evidence (monitoring and modelling) of effectiveness of different NFM features or systems of features; Performance failure of NFM measures or systems of measures; Evidence for climate change resilience of measures;  Trade-offs between clusters of NFM features versus large individual NFM features; Evidence for resilience of NFM at high and low flows and; Evidence for integrated benefits including water resources and water quality in combination with flood risk regulation; Advances in distributed modelling of different NFM features and evidence for shifts in effective parameter shifts; Scaling modelled parameter shifts to represent changes at larger scales.

The poster also solicits additional quantitative evidence from international colleagues and will be used to update evidence summaries being used in the UK.

How to cite: Pearson, E., Hankin, B., Chappell, N., Beven, K., and Rose, S.: Compilation of new evidence for the effectiveness of measures to emulate natural flood management (NFM) in the last 5 years, EGU General Assembly 2023, Vienna, Austria, 23–28 Apr 2023, EGU23-6368, https://doi.org/10.5194/egusphere-egu23-6368, 2023.

The thermal regime of regulated rivers is altered by rapid discharge variation downstream of hydropower plants (hydropeaking). This strongly modifies the thermal regime of such rivers, due to both the upstream water storage and the associated regular release to downstream, resulting in a thermal wave as the water temperature is different from the river temperature (thermopeaking). This temperature alteration needs to be considered when managing hydropower installations because of its influence on the health of aquatic ecosystems. On a longer timescale, global climate change is also influencing the natural thermal regime of rivers through changes in air temperature, vegetation, hydrology, etc. Thus, the assessment of the effects of hydropower on streams needs also to consider the extent to which changing climate will modify existing hydropower impacts, and also the mitigation methods that have been developed for current climate situations.

To evaluate the evolution of river temperature under different scenarios, deterministic coupled, hydrodynamic and temperature modelling can be used. Such models have been used previously to replicate the thermal regime of rivers or evaluate the impact of climate change on river temperature. However, there is a growing realisation that external drivers of stream temperature are more complex than hitherto thought, especially in per-Alpine streams. For instance, such streams can have significant shading whose importance changes as a function of time within the year. Equally, between the zone of water off-take and return, the residual flow may not occupy the full channel perimeter meaning that it is also necessary to consider the energy balance effects of water-adjacent sediments.

To address this challenge this paper identifies the necessary ingredients of deterministic coupled hydrodynamic and temperature modelling for hydropower impacted streams. This is supported by a unique and very high-quality stream temperature dataset which we use to identify the minimum process representation required for such models. In order to reproduce such data, we show that such models need to have a spatially-explicit and time-dependent correction of two key processes: (1) solar shading; and (2) stream bed sediment effects.

How to cite: Dorthe, D., Pfister, M., and Lane, S. N.: The necessary ingredients for deterministic modelling of hydropower management and climate change impacts on stream temperature in peri-Alpine streams, EGU General Assembly 2023, Vienna, Austria, 23–28 Apr 2023, EGU23-7088, https://doi.org/10.5194/egusphere-egu23-7088, 2023.

EGU23-7770 | ECS | Posters on site | HS10.10

Local resources for dike revetment in managed realignments 

Kim van den Hoven, Carla J. Grashof-Bokdam, Pieter A. Slim, Ludolph Wentholt, Patrik Peeters, Davy Depreiter, André R. Koelewijn, Carolien Kroeze, and Jantsje M. van Loon-Steensma

Managed realignment is the landward relocation of flood infrastructure to reintroduce the tide on former reclaimed land. A managed realignment site is an ecological restoration site. At the same time, it forms a new type of hybrid flood defence that makes use of Natural and Nature Based Features. Nature-based flood protection is provided by the flood risk reduction capacity of the restored habitat such as saltmarshes, complemented by the landward relocated flood defence infrastructure, i.e., the realigned dike. The realigned dike is either a (reinforced) existing or newly constructed dike. The realigned dike can be built or reinforced from local resources such as the saltmarshes and formerly reclaimed land. Material from the removed dikes can also be re-used. In history, saltmarsh sods have been used as building material for the dikes themselves and for their revetment. The sods were also used as emergency dike repair material. In addition to the use of local resources as building material for flood infrastructure, the mining of local resources can simultaneously support nature restoration under the dynamic circumstances of the coast.
      We tested the historic sod technique for dike revetments at a managed realignment project in progress where the dikes were available for real size experiments. On a dike with grass revetment, we studied the erosion resistance of transplanted dike grass sods after one growth season. Grass sods were transplanted to the inner and outer dike slope. The erosion resistance of the transplanted sections was tested under calm and extreme conditions with a grass pull test, a wave impact simulator, an overflow generator, and by analysing roots development. After one growth season, we found that the vegetation of transplanted sods continued to grow and started to connect to the original dike revetment. While some erosion occurred under extreme circumstances, the grass pull test revealed the transplanted sod revetment was stronger than a bare clay revetment. The erosion resistance of transplanted sods after one growth season is promising when compared to for instance a newly seeded grass revetment.
      In conclusion, the sod application technique can provide local resources for the revetment of realigned dikes. Sod transplantation can also be used to introduce target species at for instance the dike toe. At the same time, mining of (grass) sods from former land or saltmarshes can support nature restoration and development. Our results can hereby contribute to increase our ability to design flood infrastructure with Natural and Nature Based Features.

How to cite: van den Hoven, K., Grashof-Bokdam, C. J., Slim, P. A., Wentholt, L., Peeters, P., Depreiter, D., Koelewijn, A. R., Kroeze, C., and van Loon-Steensma, J. M.: Local resources for dike revetment in managed realignments, EGU General Assembly 2023, Vienna, Austria, 23–28 Apr 2023, EGU23-7770, https://doi.org/10.5194/egusphere-egu23-7770, 2023.

EGU23-8797 | Posters on site | HS10.10

Understanding the impact of agricultural activity in groundwater by water isotopes and dual isotope of dissolved nitrate 

Prasanta Sanyal, Santrupta Samantaray, and Ritwick Mandal

In general, availability of groundwater have shaped human settlement and land-use patterns by providing water for the people living in an area. However, anthropogenic activities including the agricultural practice impacted the quality and quantity of groundwater significantly. Therefore, it is crucial to monitor and quantify the human impact, and to find pathways towards more sustainable use of groundwater. The Hindon basin in the north-west part of Indo-Gangetic plain in India which once witnessed the Indus valley civilisation, now negatively affected by human influences. The river basin covers an area of ca. 7000 km2 and is inhabited by more than 10 million people. The catchment of the Hindon river hosts sugar mills, paper mills, textile industry and intensified agricultural activities. The land-use pattern data shows that 66% of land is utilised for agriculture including orchards, 15% is used for settlements, 0.5% for industrial purposes, and less than 2% of the basin area has forest cover which is of poor quality. The main crops in the area is sugarcane, and urea is used extensively in the agricultural field. The run-off of nutrients and agrichemicals from the fields deteriorating the water quality, making the Hindon one of the most polluted stretches in the Indo-Gangetic plain.

To quantify the impact of agricultural activities in groundwater, water isotopes (δ2H and δ18O) and dual isotopes of dissolved nitrate (δ15N and δ18O) been measured in groundwater. The water isotope data suggest that impact in groundwater is so severe that the canal water, sourced from the glacier melt of the Himalaya, which pass of though the basin is recharging into the groundwater. The dual isotopes of nitrate suggest that the dissolved nitrate which is much above the WHO prescribed limit is mostly sourced from the fertilizer urea. Our result suggests that for sustainability, a multi-crop agricultural practice with less demanding water crop with reduction of use of urea is the need of the hour.

How to cite: Sanyal, P., Samantaray, S., and Mandal, R.: Understanding the impact of agricultural activity in groundwater by water isotopes and dual isotope of dissolved nitrate, EGU General Assembly 2023, Vienna, Austria, 23–28 Apr 2023, EGU23-8797, https://doi.org/10.5194/egusphere-egu23-8797, 2023.

EGU23-11623 | Posters on site | HS10.10

Modelling seed recruitment controls in an Alpine floodplain subject to hydropeaking 

Davide Vanzo, Looser Michael, David F. Vetsch, Sabine Fink, and Francesco Caponi

Hydropower production has different recognized impacts on river ecosystems. In particular, it alters the natural hydrological regime with extended low-residual flow conditions interrupted by rapid daily and sub-daily flow fluctuations, i.e. hydropeaking. Hydropeaking impacts both biotic and abiotic compartments: an increasing body of literature suggests that it can influence the physiological activity of plants, seed germination, and seedling growth, altering the chance of survival of several plant species.

Riparian vegetation is a key indicator of the status of river hydro-morphological processes. Several riparian plant species are nowadays endangered because of the degradation of river ecosystems worldwide, as a result of the exploitation of river resources. River floodplains, by hosting large amounts of biodiversity and habitat types, are crucial objectives for river management and restoration.

Vegetation establishment in floodplains and in-channel morphologies is linked to river hydro-morphodynamic processes: seeds of many riparian species are transported along the river by water, deposited on shorelines as the water level recedes, and establish depending on different environmental factors. The hydrological regime at seasonal-yearly scale (for example flood-drought seasonality), has recognized effects on seed recruitment.

In this study, we applied a vegetation recruitment model based on the Windows of Opportunity concept to study the main hydro-morphological controls on seed recruitment in an Alpine river subjected to hydropeaking. The study site is a small gravel-dominated floodplain of Moesa River (Switzerland). The model predicts potential colonization sites for vegetation after seed dispersal events by comparing water stress caused by water level fluctuations and time-varying plant resistance to inundations. We test alternative hydrological scenarios, comparing business-as-usual and no-hydropeaking conditions, and also different morphological configurations, using river topographical scans from different epochs (pre- and post- natural floods). We use a two-dimensional depth-averaged hydrodynamic model to simulate water levels in every scenario. The different hydro-morphological configurations are then fed into the seed recruitment model, to finally evaluate spatially distributed maps of successful rate of seed recruitment. Each hydrological and morphological scenario is tested also against different vegetation resistance to water stress, hence comparing stress-intolerant and stress-tolerant plant species. In addition, we qualitatively compared our results with an existing dataset of German Tamarisk (Myricaria germanica) dynamics in the floodplain.

Our results show the influence of vegetation resistance on the successful recruitment rate in terms of spatial extension and distribution. The influence of hydropeaking seems to be increased/smoothed depending on the hydrological year. Morphological variations due to natural floods appear to have relevant impact on vegetation dislocation, but less on total amount. Developing quantitative tools to simulate eco-morphodynamic river processes is supportive for both river managers and scientists. Eventually the understanding of key physical drivers of riparian vegetation dynamics in hydropeaking rivers is crucial for the conservation and restoration of functional river ecosystems.

How to cite: Vanzo, D., Michael, L., Vetsch, D. F., Fink, S., and Caponi, F.: Modelling seed recruitment controls in an Alpine floodplain subject to hydropeaking, EGU General Assembly 2023, Vienna, Austria, 23–28 Apr 2023, EGU23-11623, https://doi.org/10.5194/egusphere-egu23-11623, 2023.

EGU23-11683 | ECS | Orals | HS10.10

Decadal intertidal vegetation development in an estuary and its effect on the wave damping capacity 

Jesse Bootsma, Bas Borsje, Daphne van der Wal, and Suzanne Hulscher

Intertidal vegetation is renowned for its capacity to reduce wave energy and thereby enhance coastal safety. At present, this concept is well established on local scales (meters to marsh-mudflat system) and relatively short terms (hours to years). However, the development of intertidal vegetation on larger scales (i.e. the spatial scale of an estuary and the temporal scale of decades) is unknown. Consequently, it is impossible at the moment to quantify the wave damping capacity at these scales. In this paper, the decadal spatiotemporal characteristics and dynamics of intertidal vegetation are studied by combining available data (e.g. from field surveys) and remote sensing techniques (Combining SAR and optical remote sensing). For this analysis, the Scheldt estuary, with a tidal reach of more than 160km from the mouth near Vlissingen, the Netherlands, till Gent, Belgium, is used as study area. Intertidal vegetation located in salt, brackish and freshwater environments is considered to cover the changes in salinity regimes in estuaries. More specifically, the vegetation species considered in this study are: Common glasswort (Salicornia europaea), Common cordgrass (Spartina anglica), Saltmarsh bulrush (Scirpus maritimus), Common reed (Phragmites australis) and Common willow (Salix alba). The variability in vegetation distribution in this study has three components: (1) the areal extent i.e. total marsh dimensions and associated variability in this (expansion/retreat); (2) the variability in vegetation characteristics e.g. density, biomass, height and seasonality; and (3) shifts in vegetation species i.e. going from one species to another at the same location over time. Since the wave damping capacity of a vegetated intertidal area is a combination of the wave attenuation from the bottom friction and the attenuation due to the presence of vegetation, the bed topography corresponding to the vegetation pattern is established from laser altimetry (LiDAR) data. Ultimately, the wave damping capacity of intertidal vegetated areas under various storm conditions is determined using a Simulating WAves Nearshore (SWAN) model, based on the spatial vegetation patterns and characteristics, as well as the variation in bathymetry. Quantification of the decadal dynamics of intertidal vegetation in estuaries and its impact on the wave damping capacity will help us to give recommendations for the effectiveness and the design of nature-based coastal protection measures.

How to cite: Bootsma, J., Borsje, B., van der Wal, D., and Hulscher, S.: Decadal intertidal vegetation development in an estuary and its effect on the wave damping capacity, EGU General Assembly 2023, Vienna, Austria, 23–28 Apr 2023, EGU23-11683, https://doi.org/10.5194/egusphere-egu23-11683, 2023.

EGU23-14621 | Orals | HS10.10

Assessing the eco-hydraulic effects of a hydropeaking mitigation measure with increased energy production in the Noce River (Italian Alps) 

Guido Zolezzi, Francesca Vallefuoco, Anna Casari, Stefano Larsen, Valentina Dallafior, and Maria Cristina Bruno

We investigated the ecohydraulic effects of a recently implemented hydropeaking mitigation measure in the Upper Noce Stream (NE Italy, Italian Alps), which also allows for additional hydropower production. The Upper Noce, a 3rd order gravel-bed stream, was affected since the mid-1920s by storage hydropower production and associated hydropeaking. The mitigation measure consisted in the diversion of most of the released hydropeaks into a sequence of three newly-installed, cascading run-of-the-river power plants, fed by a penstock running almost parallel to the former hydropeaking reach. The hydropeaking-diversion mitigation measure markedly reduced hydropeaking on a 10-km stream reach, and hydropeaking is now released immediately upstream the confluence with a major free-flowing tributary, which increases the hydropeaking baseflow. The flow regime in the mitigated reach shifted from hydropeaking-dominated to baseflow-dominated regime in winter, with flow variability represented only by snowmelt and rainfall in late spring and summer. We applied two sets of indicators (the Hydropeaking Indicators HP1, HP2 and the COSH method) and conducted a simplified hydraulic analysis of the hydropeaking wave propagation. We assessed the ecological effects of the mitigation measure using three complementary data sources: the analysis of (a) the benthic and (b) hyporheic invertebrate communities, based on datasets collected before and after the implementation of the diversion measure, and (c) ancillary data monitored by the diversion plant manager for required environmental monitoring, which included the suspended sediment regime and the Extended Biotic Index, measured yearly from the year before to the four subsequent years after the implementation of the mitigation measure.

Three main changes in eco-hydraulic processes associated with hydropeaking mitigation were detected. i) The flow regime in the mitigated reach changed to a residual flow type, with much less frequent residual hydropeaks, with an average two-fold increase in downramping rates that were recorded downstream the junction with a major tributary. ii) The functional composition of the macrobenthic communities shifted slightly in response to flow mitigation, but the taxonomic composition did not recover to conditions typical of more natural flow regimes. This was likely due to the reduced dilution of pollutants and resulting slight worsening in water quality. iii) The hyporheic communities conversely showed an increase in diversity and abundance of interstitial taxa, especially in the sites most affected by hydropeaking, and this effect was likely due to changes in the interstitial space availability, brought by an alteration of the previous time-space pattern of fine sediment transport, which eventually resulted in reduction of fine sediments clogging of the gravel bed interstices.

Besides illustrating a feasible hydropeaking mitigation option for Alpine streams, this work suggests the importance of monitoring both benthic and hyporheic communities, together with the flow and sediment supply regimes, and physico-chemical water quality parameters, for carefully detecting changes in eco-hydraulic processes associated with hydropeaking mitigation that may not be fully expected in the design phase.

How to cite: Zolezzi, G., Vallefuoco, F., Casari, A., Larsen, S., Dallafior, V., and Bruno, M. C.: Assessing the eco-hydraulic effects of a hydropeaking mitigation measure with increased energy production in the Noce River (Italian Alps), EGU General Assembly 2023, Vienna, Austria, 23–28 Apr 2023, EGU23-14621, https://doi.org/10.5194/egusphere-egu23-14621, 2023.

EGU23-16568 | Orals | HS10.10

Mitigating the hydropeaking using flow refuge: an experimental case-study 

Isabel Boavida, Renan Leite, Maria João Costa, Anthony Merianne, Daniel Mameri, Fernando Afonso, José Maria Santos, and António Pinheiro

The artificial pulsed flows occurring downstream of hydropower plants due to electricity demand, i.e. hydropeaking, affect habitat selection by fish. This effect is particularly unknown for cyprinids, which are the most representative freshwater fish family in European rivers. This study aimed to evaluate the utility of two types of flow-refuge by Iberian barbel (Luciobarbus bocagei) at an indoor flume (6.5m x 0.7m x 0.8m) as a potential solution to mitigate the effects of pulsed flows associated to hydropower production. Based on previous comprehensive research conducted on cyprinids and with the results of this study, the best type of flow-refuge was selected, up-scaled and implemented downstream of small hydropower plants. Two different approach angles with the flume wall - 45⁰ and 70⁰ - were tested to assess the effectiveness of the created hydraulic conditions on attracting fish to the flow-refuge. For each type we tested a base flow event (7 l.s-1), simulating river natural conditions, and a peak flow event (60 l.s-1), simulating pulsed flows. For each setting, two flow-refuges (downstream and upstream) were installed in the flume and tested with a school of five Iberian barbels. The utility of the flow-refuges was assessed by the frequency and time of use by fish at two distinct flow-refuge locations i.e., downstream (area between the flume and the adjacent flow-refuge walls), and inside (the effective covered area of the flow-refuge). Blood glucose and lactate levels were quantified to identify potential physiological adjustments associated with the pulsed flows and the flow-refuge type. Preliminary results indicate that fish behavior differs according to flow event and the type of flow-refuge. The frequency of a single fish using the flow-refuge was higher in the 45⁰ refuge during pulsed flows than in the 70⁰. Overall, the average time spent inside the flow-refuges was higher during pulsed flows for both types and higher in the 45⁰ refuge.  After the 60 l.s-1 events, the blood glucose and lactate levels were higher than in the 7 l.s-1 events. In addition, lactate levels for the 45⁰ flow-refuge during the 60 l.s-1 events, were the highest when compared to 7 l.s-1 events. These results may be explained by the higher velocities created in the presence of the 45⁰ flow-refuge, shown by ADV results, that favoured individual use and rheotactic behaviour, setting off physiological adjustments, increasing residency time and the efficiency to use the flow-refuge.

How to cite: Boavida, I., Leite, R., Costa, M. J., Merianne, A., Mameri, D., Afonso, F., Santos, J. M., and Pinheiro, A.: Mitigating the hydropeaking using flow refuge: an experimental case-study, EGU General Assembly 2023, Vienna, Austria, 23–28 Apr 2023, EGU23-16568, https://doi.org/10.5194/egusphere-egu23-16568, 2023.

The fundamental water resources problem to be solved in adaptation to climate change is increasing rainfall variability: generally, flood peaks are increasing, and dry-season water availability is decreasing. Large, centralized adaptation strategies such as reservoirs impounded behind tall dams typically perform well at both attenuation of flood peaks, and augmentation of dry season flows. They come with substantial costs, however, in terms of capital cost outlays and damages to local ecological and human environments. The Intergovernmental Panel on Climate Change, the United States (US) Government, the European Union, the United Nations, and many other institutions and agencies are currently advocating for the adoption of “nature-based solutions” (NbS), which are believed able to reduce adverse climate change impacts at community scale, while supporting biodiversity and securing ecosystem services. However, the potential of NbS to provide the intended benefits has not been rigorously assessed. This talk presents a preliminary assessment of climate change vulnerabilities for the Chimanimani biosphere reserve in Zimbabwe, and an evaluation of the tradeoffs between conventional “hard” civil infrastructure and decentralized NbS.

How to cite: Ray, P. and Tracy, J.: Quantitative assessment of the tradeoffs between conventional “hard” civil infrastructure and nature-based solutions for climate change adaptation, EGU General Assembly 2023, Vienna, Austria, 23–28 Apr 2023, EGU23-16603, https://doi.org/10.5194/egusphere-egu23-16603, 2023.

The application of nature-based solutions for flood protection in low-lying coastal areas has recently received much attention. The solution is attractive because it may lower the costs for coastal defense, increase the effectiveness and resilience of defense measures, curb negative trends in biodiversity of globally important animal populations and contribute to carbon capture and storage.

Nature-based flood defense measures are based on relatively well-established biogeomorphological principles of self-organisation in coastal landscapes. Vegetated foreshores in particular contribute to wave damping, accumulation and stabilization of sediments maintaining a shallow bathymetry, capacity to adjust bed level to sea level rise and, in some conditions, provision of accommodation space for storm surges. Uncertainties in the contribution of ecosystems to flood safety arise from incomplete modeling capacity for sediment dynamics, inclusion of sub-grid phenomena, complex spatial structure, limited understanding of edge dynamics and sparse knowledge of ecosystem behavior under extreme loading. For application at regional scale, the most difficult problem is that nature-based solutions are needed most where natural processes are weakest, e.g. due to extreme encroachment of the coast.

In the broader context of use of nature-based solutions as measure to adapt to increased relative sea level rise, a crucial question is how these solutions will behave at longer term. Geological evidence shows that increased rates of sea level rise forces coastal wetlands to become narrower and to move faster inland. An important factor determining this behavior is the sediment mass balance, inhibiting the vertical rise of an ever-larger surface of marshes with increasing sea level. A second factor is the stability of the seaward edge under conditions of increased wave attack in deeper coastal profiles. These phenomena are observed in contemporary systems with high rates of subsidence.

Future-proof nature-based solutions for flood defense will have to resolve the issues related to the regional sediment mass balance and long-term stability of the coastal ecosystems. Whether the strategy is to hold the line of the coast or to withdraw, future coastlines will need sufficient sediment sources, sufficient sediment transport capacity and sufficient ecosystem resilience to provide extended services combining flood defense and biodiversity conservation. Major scientific challenges in the design and use of nature-based solutions are identified at this system scale.

How to cite: Herman, P.: Nature-based solutions for flood protection in a systems perspective, EGU General Assembly 2023, Vienna, Austria, 23–28 Apr 2023, EGU23-17143, https://doi.org/10.5194/egusphere-egu23-17143, 2023.

HS11 – Short Courses of specific interest to Hydrological Sciences

HS13 – Further sessions of interest to Hydrological Sciences

Flux partitions between surface water and energy terms are essentially important to the climate system. They can potentially affect assessments of climate risk projections in the future. However, the characterization of surface flux partitioning in numerical models is rarely evaluated due to the absence of large-scale observational evidence. Here, we use long-term satellite datasets and observational meteorological records to evaluate the flux partitioning regime presented in four widely-used Land surface models (LSMs) over two study regions (i.e., China and Continental U.S.). We show that the regime in LSMs differs significantly from satellite-based estimations, which can be due to unrealistic representations of land surface characteristics. The biases in models’ flux partitioning regime may lead to the underestimated potential for climate risks, especially over regions with typical land surface characteristics. The results highlight that particular attention should be paid to the calibration of surface flux partitioning regimes in LSMs. Large model spreads in surface flux partitioning strength and climate risk maps are also reported.

How to cite: He, Q., Lu, H., and Yang, K.: Observation-based assessments of surface flux partitioning regimes in 4 commonly-used land surface models, EGU General Assembly 2023, Vienna, Austria, 23–28 Apr 2023, EGU23-333, https://doi.org/10.5194/egusphere-egu23-333, 2023.

In recent years, drought has become an increasing problem in agricultural production in many places where these problems did not exist in the past. The frequency and intensity of agricultural droughts are increasing, so it is very important to detect temporal and spatial variability of drought. This study analyzed the properties of agricultural drought (duration and intensity) in Bărăgan region (Romania) and Prekmurje region (Slovenia) between 1991-2020 based on the Standardized Precipitation Index (SPI) and the Standardized Precipitation Evapotranspiration Index (SPEI) at different time scales. The reasons for comparing the two regions are similar climatic conditions, the importance of maize cultivation for food security, and repeated droughts in the recent period in these regions. The meteorological data for Romania were provided from ROCADA database, and for Slovenia from SLOCLIM database. Furthermore, relationships between drought-sensitive phenological stages of maize (germination, formation of the first 2 leaves, and flowering), growing season length, thermal time above threshold 10 °C, standardized yields, and calculated drought indicators were calculated. Based on our analysis, we expect to be able to evaluate whether SPI and SPEI can be used to monitor conditions on a variety of time scales and to provide indicators at regional scales on the likely occurrence of drought during critical phenological phases of maize, as well as the differences and similarities between the two regions will be discussed.

How to cite: Kobulniczky, B., Holobâcă, I.-H., Črepinšek, Z., Pogačar, T., Jiman, A.-M., and Žnidaršič, Z.: Comparison of Standardized Precipitation Index (SPI) and Standardized Potential Evapotranspiration Index (SPEI) applicability for drought assessment during the maize growing period between Bărăgan (Romania) and Prekmurje (Slovenia) regions (1991, EGU General Assembly 2023, Vienna, Austria, 23–28 Apr 2023, EGU23-499, https://doi.org/10.5194/egusphere-egu23-499, 2023.

The surface-air temperature difference (Ts-Ta) is the main contributor to the sensible heat flux, and also an important indicator for land degradation. However, as the main influencing factor, the effect of soil moisture (SM) on Ts-Ta at the global scale has not been well articulated. Here, based on the ERA5-land reanalysis data from 1981 to 2019, the impacts of SM on Ts-Ta were studied. It was found that Ts-Ta over 54% of the global land increased, and SM across 70.7% of the world land decreased. In the increased SM areas, the increased soil evaporation weakened the increasing trend of Ts resulting in smaller Ts-Ta. In the decreased SM areas, the latent heat flux increased with soil evaporation and Ts-Ta decreased when SM was relatively high, and the larger sensible heat flux due to decreased soil evaporation aggravated Ts-Ta when SM was relatively low. The effect of SM on Ts-Ta presented nonlinear relationship due to the different background value of SM and temperature. The variation of SM at low SM or low temperature areas had an amplification effect on Ts-Ta. These findings will provide new insights into the different regional characteristics of global changing climate and the improvement of land degradation assessment indicators.

How to cite: jiang, K.: Influence patterns of soil moisture change on surface-air temperaturedifference under different climatic background, EGU General Assembly 2023, Vienna, Austria, 23–28 Apr 2023, EGU23-557, https://doi.org/10.5194/egusphere-egu23-557, 2023.

EGU23-799 | ECS | Posters on site | CL4.1

The role of atmospheric humidity in controlling land-atmosphere feedbacks over forest: regional and global-scale analyses 

Shulin Zhang, Weiguang Wang, and Adriaan J. Teuling

Abstract:

The interaction of land cover and atmosphere can affect the climate patterns via biogeochemical and biogeophysical process. The afforestation contributes to increase the biogeochemical cycles like carbon sequestration. Meanwhile, the landcover change modify the biogeophysical parameters perturbs the energy and water fluxes. The latter will be the most direct process to affect the atmosphere and its effects from landcover change outweigh radiative forcing triggered off by CO2 emissions.

After the “Grain to Green Program”, the Loess Plateau (LP) has experienced a widespread forest expansion. Up to 2012, the extension of forest area in the central LP (Ningxia, Shanxi, and Shaanxi) accounted for 11.2 % of the area of the three provinces. The greening trend has changed the energy and water cycle, hence to a climate variability. The moist heat stress (a combined climate metric) has been recently investigated because it is directly related to human health. However, the affection of afforestation to moist heat stress is still unclear in LP.

In a recent study, we used the Weather Research and Forecasting (WRF) model to simulate the modulation of moist heat in LP caused by the afforestation. The result demonstrates that the intensive revegetation in LP shows a cooling effect on regional average near surface air temperature, especially in central LP. In addition, an increase of relative humidity caused by afforestation is detected. Driving by the near-surface temperature, sensible heat flux, and the subsidence of the planetary boundary layer the moist heat stress has obvious change after afforestation. The average moist heat stress decreases in central LP. While the decrease rate of moist heat stress is slower than near-surface temperature. It is worth noting that, an increased signal occurs in the maximum moist heat stress which might expose humans to the risk of moist heat stress. Our sensitivity results imply that the moist heat stress should be accounted for in climate change adaptation.

In ongoing work, we study the role of atmospheric VPD on mitigating land-atmosphere feedbacks over forest and non-forest land cover based on a global analysis of FLUXNET data. Preliminary results show a strong climate control on the effect of VPD on land-atmosphere exchange, in particular during heatwaves.

Reference: Zhang, S., Wang, W., Teuling, A. J., Liu, G., Ayantobo, O. O., Fu, J., & Dong, Q. (2022). The effect of afforestation on moist heat stress in Loess Plateau, China. Journal of Hydrology: Regional Studies, 44, 101209

How to cite: Zhang, S., Wang, W., and Teuling, A. J.: The role of atmospheric humidity in controlling land-atmosphere feedbacks over forest: regional and global-scale analyses, EGU General Assembly 2023, Vienna, Austria, 23–28 Apr 2023, EGU23-799, https://doi.org/10.5194/egusphere-egu23-799, 2023.

The EC-Earth earth system model is characterized by biases in various aspects of the simulated climate. Biases in precipitation result in biases in soil moisture, while biases in temperature and precipitation contribute to biases in vegetation. In this study, the extent to which the biases in soil moisture and vegetation contribute to the biases in the surface energy fluxes (which, in turn, lead to near-surface climate biases) in EC-Earth through interactions with the atmosphere is investigated.

The study is based on two simulations for the recent period 19719-2017: an offline simulation with the land-surface component of EC-Earth, combining the HTESSEL land surface model and the LPJ-GUESS dynamical vegetation model forced, by the meteorological conditions from the ERA5 re-analyses, and a simulation with the atmospheric version of EC-Earth, where the land-surface conditions, i.e., soil moisture and vegetation, are prescribed from the offline simulation.

The purpose of the study is twofold: By comparing the offline simulation with the land-surface component of EC-Earth with observational estimates of the surface energy fluxes, it is investigated to which extent the land-surface component, combing HTESSEL and LPJ-GUESS, is capable to simulate the surface energy fluxes under “perfect” climate conditions. And by comparing the simulation with the atmospheric component of EC-Earth with the offline simulation, the effects of the land-surface atmosphere interactions on the biases of the surface energy fluxes in EC-Earth are assessed. These effects are, to a large extent, related to climate biases in the atmospheric component of EC-Earth, e.g., the radiative fluxes, precipitation or the near-surface climate conditions.

How to cite: May, W.: The role of land-surface interactions for the surface energy fluxes in the EC-Earth earth system model, EGU General Assembly 2023, Vienna, Austria, 23–28 Apr 2023, EGU23-1067, https://doi.org/10.5194/egusphere-egu23-1067, 2023.

EGU23-1689 | ECS | Posters on site | CL4.1

Contrasting influences of biogeophysical and biogeochemical impacts of historical land use on global economic inequality 

Shu Liu, Yong Wang, Guang Zhang, Linyi Wei, Bin Wang, and Le Yu

Climate change has significant implications for macro-economic growth. The impacts of greenhouse gases and anthropogenic aerosols on economies via altered annual mean temperature (AMT) have been studied. However, the economic impact of land-use and land-cover change (LULCC) is still unknown because it has both biogeochemical and biogeophysical impacts on temperature and the latter differs in latitudes and disturbed land surface types. In this work, based on multi-model simulations from the Coupled Model Intercomparison Project Phase 6, contrasting influences of biogeochemical and biogeophysical impacts of historical (1850–2014) LULCC on economies are found. Their combined effects on AMT result in warming in most countries, which harms developing economies in warm climates but benefits developed economies in cold climates. Thus, global economic inequality is increased. Besides the increased AMT by the combined effects, day-to-day temperature variability is enhanced in developing economies but reduced in developed economies, which further deteriorates global economic inequality.

How to cite: Liu, S., Wang, Y., Zhang, G., Wei, L., Wang, B., and Yu, L.: Contrasting influences of biogeophysical and biogeochemical impacts of historical land use on global economic inequality, EGU General Assembly 2023, Vienna, Austria, 23–28 Apr 2023, EGU23-1689, https://doi.org/10.5194/egusphere-egu23-1689, 2023.

Heavy precipitation (HP) events can be preceded by moist heatwaves (HWs; i.e., hot and humid weather), and both can be intensified by urbanization. However, the effect of moist HWs on increasing urban HP remains unknown. Based on statistical analyses of daily weather observations and ERA5 reanalysis data, we investigate the effect of moist HWs on urban-intensified HP by dividing summer HP events into NoHW- and HW-preceded events in the Yangtze River delta (YRD) urban agglomeration of China. During the period 1961–2019, the YRD has experienced more frequent, longer-lasting, and stronger intense HP events in the summer season (i.e., June–August), and urbanization has contributed to these increases (by 22.66%–37.50%). In contrast, urban effects on HP are almost absent if we remove HW-preceded HP events from all HP events. Our results show that urbanization-induced increases in HP are associated with, and magnified by, moist HWs in urban areas of the YRD region. Moist HWs are conducive to an unstable atmosphere and stormy weather, and they also enhance urban heat island intensity, driving increases in HP over urban areas.

How to cite: Gu, X., Li, C., and Slater, L.: Urbanization-Induced Increases in Heavy Precipitation are Magnified by Moist Heatwaves in an Urban Agglomeration of East China, EGU General Assembly 2023, Vienna, Austria, 23–28 Apr 2023, EGU23-1814, https://doi.org/10.5194/egusphere-egu23-1814, 2023.

EGU23-2064 | ECS | Posters virtual | CL4.1

Hot weather amplifies the urban dry island effect, especially in wetter climates 

Sijia Luo and Xihui Gu

Atmospheric humidity is usually drier in cities than the surrounding rural areas, a phenomenon known as the urban dry island (UDI) effect. However, the response of atmospheric humidity to hot weather in urban versus rural settings remains unknown. Using long-term summer (June-August) observations at 1658 stations over 1961-2020, we find that China is dominated by drying trends in atmospheric humidity (i.e., increasing vapor pressure deficit [VPD]). These drying trends are aggravated on hot days and amplified by urbanization, i.e., the UDI effect is stronger in hot weather. This amplification of the UDI effect on hot days is more prominent in humid than in arid regions. Attributions show that the stronger VPD-based UDI effect on hot days is explained by increased contribution of air temperature in southeastern China, and specific humidity in North China. We suggest that adaptations are required to mitigate adverse combined effects of urban heatwaves and UDIs.

How to cite: Luo, S. and Gu, X.: Hot weather amplifies the urban dry island effect, especially in wetter climates, EGU General Assembly 2023, Vienna, Austria, 23–28 Apr 2023, EGU23-2064, https://doi.org/10.5194/egusphere-egu23-2064, 2023.

EGU23-2078 | Posters on site | CL4.1

A new satellite-based product for studying land-atmosphere interactions 

Jian Peng and Almudena García-García

Information about the energy and water exchanges between the land surface and the lower atmosphere (i.e. land-atmosphere interactions) is necessary for example to improve our understanding of the effect of land-atmosphere interactions on the exacerbation of temperature and precipitation extremes. Observations of energy and water fluxes at the land surface usually rely on the eddy covariance method. There is a wide network of these measurements providing data over all continents but with large spatial gaps in Africa, Asia, South America and Oceania. Additionally, other problems are associated with these observational methods such as the energy and water balance non-closure. To improve the spatial coverage of land-atmosphere interactions data considering the energy and water balance closure, we explore the combination of remote sensing data and a physical-based model. The High resOlution Land Atmosphere Parameters from Space (HOLAPS) framework is a one dimensional modelling framework that solves the energy and water balance at the land surface using remote sensing data and reanalysis products as forcings. Preliminary results from the evaluation ofHOLAPS outputs over Europe at 5 km resolution show an improvement in the simulation of latent heat flux when using remote sensing data in comparison with results using only reanalysis data as forcing. Additionally, we see a moderate improvement in HOLAPS latent heat flux estimates against energy-balance corrected eddy covariance measurements in comparison with other products that solve the energy and water balance equations, such as the ERA5Land product. The new HOLAPS product is available at hourly resolution for the period 2001 to 2016 and these estimates can be useful for agriculture and forest management activities and to evaluate the representation of land-atmosphere feedbacks in weather and climate models.

How to cite: Peng, J. and García-García, A.: A new satellite-based product for studying land-atmosphere interactions, EGU General Assembly 2023, Vienna, Austria, 23–28 Apr 2023, EGU23-2078, https://doi.org/10.5194/egusphere-egu23-2078, 2023.

EGU23-3211 | ECS | Orals | CL4.1

Characterisation and interpretation of local climate evolution in the South-West of France 

Marine Lanet, Laurent Li, and Hervé Le Treut

Summer 2022 has been the second hottest summer after 2003 in France since 1900, with 33 cumulative days of heatwaves. It has also been one of the 10 driest summers in France since 1959. The average precipitation deficit reached 20% compared to the 1991-2020 period, exceeding 60% in some regions, even though June 2022 broke the monthly record of storm occurrences.

These extreme climate conditions led to water restrictions and fostered the development of many wildfires. In particular, so called “megafires” burnt more than 28,000 hectares of the Landes forest in the Nouvelle-Aquitaine region, in the South-West of France.

Starting from the 18th century, this swampy region has been dried out by planting maritime pines and digging ditches to drain away excess water. Due to recent events, these land management practices are questioned : the record-breaking soil dryness of summer 2022 enabled fire to propagate underground and resurface further away, making firemen’s work extremely difficult.

By controlling ditch drainage, is it possible to reduce soil dryness and thus fire risk in summer, as well as mitigate heavy precipitation impacts in this flood prone area ? To answer this question, this work first aims at characterizing and interpreting local climate evolution during the last decades, in terms of trends, changes in the seasonal cycle and extreme events, using  ERA 5 reanalysis, the E-Obs dataset, and MODIS satellite observations. CORDEX regional climate projections are also analysed. Nouvelle-Aquitaine will experience both more frequent and intense heatwaves and droughts and an increase in heavy precipitations. Landes forest management thus has to be adapted.

The perspective of this work is to develop a conceptual ditch drainage model and quantify the drought and flood risk reduction potential using storylines based on plausible short and long term climate conditions in Nouvelle-Aquitaine.

In a broader perspective, the objective of this work is to develop a methodology replicable in other regions of the world to analyse the impacts of climate change at a local scale and explore how climate science can provide quantitative information to help decision making.

How to cite: Lanet, M., Li, L., and Le Treut, H.: Characterisation and interpretation of local climate evolution in the South-West of France, EGU General Assembly 2023, Vienna, Austria, 23–28 Apr 2023, EGU23-3211, https://doi.org/10.5194/egusphere-egu23-3211, 2023.

EGU23-3549 | ECS | Posters virtual | CL4.1

The incorporation of 250 m soil grid textural layers in the NOAH-MP land surface models and its effects on soil hydrothermal regimes 

Kazeem Ishola, Ankur Sati, Matthias Demuzere, Gerald Mills, and Rowan Fealy

Effective representation of soil heterogeneity in land surface models is crucial for accurate weather and climate simulations. The NOAH-MP land surface model uses dominant soil texture from State Soil Geographic (STATSGO)/Food and Agriculture Organization (FAO) datasets, considerably introducing uncertainty in the simulation of soil hydrothermal changes and terrestrial water and energy fluxes, at a fine scale. This study investigates the likely added value of incorporating an alternative high resolution soil grid data at different depths, for a better representation of soil hydrothermal dynamics in NOAH-MP v4.3. The model is set up at 1 km grid space over all Ireland domain and soil layer thicknesses of 0.07, 0.21, 0.72 and 1.55 m, with a cummulative soil depth of 2.55 m. The thicknesses are selected to match the layers of initial soil input fields. Model experiments are carried out based on two soil data options namely, (1) the STATSGO/FAO dominant soil texture and (2) the 250 m global soil grid textural compositions from the International Soil Reference and Information Centre (ISRIC), in combination with PedoTransfer Functions (PTFs). The current model integration is applied within the high resolution land data assimilation (HRLDAS) framework to simulate soil temperature and soil liquid water, and evaluated for wet and dry periods using observations from the newly established Terrain-AI data platforms (terrainai.com). Ultimately, the study highlights the importance of using realistic dynamic soil information, which could provide insightful scientific contributions to better monitor surface climate and the influences on land use and land management under climate change.

How to cite: Ishola, K., Sati, A., Demuzere, M., Mills, G., and Fealy, R.: The incorporation of 250 m soil grid textural layers in the NOAH-MP land surface models and its effects on soil hydrothermal regimes, EGU General Assembly 2023, Vienna, Austria, 23–28 Apr 2023, EGU23-3549, https://doi.org/10.5194/egusphere-egu23-3549, 2023.

EGU23-3780 | ECS | Orals | CL4.1

Greening vegetation alleviates hot extremes in the semiarid region of China 

Yipeng Cao, Weidong Guo, Jun Ge, Yu Liu, Chaorong Chen, Xing Luo, and Limei Yang

China has shown a world-leading vegetation greening trend since 2000, which may exert biophysical effects on near-surface air temperature (SAT). However, such effects remain largely unknown because prior studies either focus on land surface temperature, which differs from SAT, or rely on simulations, which are limited by model uncertainties. As a widely used metric in climate and extremes research, SAT is more relevant to human health and terrestrial ecosystem functions. Therefore, it is necessary to explore impacts of greening on SAT and extremes based on observations. Here, we investigate the greening effects on SAT and subsequent extremes over 2003–2014 in China based on high-resolution SAT observations combined with satellite datasets. We find that greening can cause cooling effects on the mean SAT and more pronounced cooling effects on SAT extremes over semiarid regions. Such cooling effects are attributed to enhanced evapotranspiration caused by greening and strong coupling between evapotranspiration and SAT in semiarid regions. Semiarid regions in China are the transitional zone of both climate and ecosystem and deeply influenced by human agricultural and pastoral activities. These factors make the ecosystem of these regions fragile and extremely vulnerable to climate change. Our results reveal a considerable climate benefit of greening to natural and human systems in semiarid regions, and have significant implications for on-going revegetation programs implemented in these regions of China.

How to cite: Cao, Y., Guo, W., Ge, J., Liu, Y., Chen, C., Luo, X., and Yang, L.: Greening vegetation alleviates hot extremes in the semiarid region of China, EGU General Assembly 2023, Vienna, Austria, 23–28 Apr 2023, EGU23-3780, https://doi.org/10.5194/egusphere-egu23-3780, 2023.

EGU23-4818 | ECS | Posters on site | CL4.1

Simulating regional inter-annual crop yield variability over multiple decades with the Community Land Model (CLM5) 

Theresa Boas, Heye Bogena, Dongryeol Ryu, Harry Vereecken, Andrew Western, and Harrie-Jan Hendricks-Franssen

Global climate change with a predicted increase in weather extremes entails vulnerability and new challenges to regional agriculture. While the general impacts of climate change on global food security are a much studied topic, the implications for regional inter-annual yield variability remain unclear. In this study, we analysed the effects of weather trends on regional crop productivity within two agriculturally managed regions in different climate zones, simulated with the latest version of the Community Land Model (version 5.0) over two decades (1999-2019). We evaluated the models’ potential to represent the inter-annual variability of crop yield in comparison to recorded yield variability and different weather indicators, e.g., drought index and growing season length and evaluated which variables (i.e., temperature, precipitation, initial soil moisture content) dominantly drive changes in CLM5-predicted yield variability. The simulation results were able to reproduce the sign of crop yield anomalies, and thus provide a basis on which to study the effects of different weather patterns on inter-annual yield variability. However, the simulations showed limitations in correctly capturing inter-annual differences of crop yield in terms of total magnitudes (up to 10 times lower than in official records). Our results indicate that these limitation arise mainly from uncertainties in the representation of the subsurface soil moisture regime and a corresponding lack of sensitivity towards drought stress. Insights from this work were used to summarize implications for future analysis of CLM5-BGC simulation results over agriculturally managed land and allowed us to discuss and investigate possible technical model improvements.

How to cite: Boas, T., Bogena, H., Ryu, D., Vereecken, H., Western, A., and Hendricks-Franssen, H.-J.: Simulating regional inter-annual crop yield variability over multiple decades with the Community Land Model (CLM5), EGU General Assembly 2023, Vienna, Austria, 23–28 Apr 2023, EGU23-4818, https://doi.org/10.5194/egusphere-egu23-4818, 2023.

EGU23-5624 | ECS | Orals | CL4.1

Abrupt late 1980s surface climate warming effects on drought risk over main french crop production basins 

Léa Laurent, Albin Ullmann, and Thierry Castel

Since late 1980s, warming trend intensifies strongly over Western Europe, resulting in an abrupt shift in air surface temperature over France (Sutton & Dong 2012; Reid et al., 2016). This rapid warming has modified the hydrological cycle with especially a significant decrease in runoff between January and July (Brulebois et al., 2015). As cumulative annual liquid precipitation didn’t significantly evolve after 1987/1988, evapotranspiration might be the main driver of the water cycle evolution.

Along with this abrupt warming, stagnation of crop yields is observed since the 1990s over France, especially for bread wheat (Schauberger et al., 2018). In addition to maize and grapevine, the impact of climate hazard and agro-climatic risk linked to water cycle on the evolution of bread wheat yields is a major issue for agricultural insurance companies (Fusco et al., 2018). In this context, two major concerns need to be assessed: what are the patterns of water balance responses to abrupt changes in temperature? How did this abrupt warming impact drought risk over crops of interest main production basins?

SIM (Safran-Isba-Modcou) dataset of reanalyzed surface meteorological observations offers the opportunity to address the complexity of processes leading to changes in local water cycle (Soubeyroux et al., 2008). Daily liquid precipitation and potential evapotranspiration on an 8km spatial resolution from 1959 to 2021 are used to quantify the evolution of climate hazard linked to water cycle on a continuous time-scale and over the entire French territory. A simplified two reservoirs water balance model is also used to compute daily water balance using agronomic parameters of crops of interest, taking into account crop cover stage (Jacquart & Choisnel, 1995). The evolution of frequency and intensity of drought risk is analyzed using Tweedie distributions (Dunn, 2004).

Our results suggest that the abrupt warming in air temperature in 1987/1988 had strong influence on water balance evolution. Potential evapotranspiration significantly increases after 1987/1988 over the whole French territory especially in spring and summer. The evolution of annual and seasonal cumulative liquid precipitation differs in space and time and is less pronounced, leading to an intensification of water cycle. Water balance displays various evolutions depending on the crop and the production basin studied. The exceeding of water stress threshold is more frequent or more pronounced, leading to modifications of intensity and/or duration of drought events that significantly modify the risk. Risk evolution depends on the crop cover and main production basin.

Evolving climate hazard linked to water cycle impacts agro-climatic risks, identified as one of the main factor affecting the evolution of crop yields. Both mean conditions changes and modifications of the spatio-temporal variability of water balance affect the probability to overcome risk threshold. This is of major concern for the agricultural sector, especially insurance companies, and may lead to adaptation process from managers.

How to cite: Laurent, L., Ullmann, A., and Castel, T.: Abrupt late 1980s surface climate warming effects on drought risk over main french crop production basins, EGU General Assembly 2023, Vienna, Austria, 23–28 Apr 2023, EGU23-5624, https://doi.org/10.5194/egusphere-egu23-5624, 2023.

EGU23-5726 | ECS | Posters on site | CL4.1

Ground surface temperature linked to remote sensing land surface temperature in mountain environments 

Raul-David Șerban, Paulina Bartkowiak, Mariapina Castelli, and Giacomo Bertoldi

Ground surface temperature (GST), measured at approximately 5 cm into the ground is a key parameter controlling all the subsurface biophysical processes at the land-atmosphere boundary. Despite the GST significant importance, the current observational network for GST is sparse, particularly in mountain regions. This work exploits the relationship between the GST and satellite-based land surface temperature (LST) derived from MODerate resolution Imaging Spectroradiometer (MODIS). The GST and LST were compared at 14 weather stations in Mazia Valley, North-eastern Italian Alps. The 1-km MODIS LST was downscaled to a spatial resolution of 250-m using the random forest algorithm. The LST dataset covers the years 2014-2017 during the phenological cycle, between April and October. The in-situ GST measurements were recorded using Campbell Scientific CS655 data loggers. LSTs were usually larger than GSTs with temperature differences ranging from 0.1 to 22 °C and an average of 7.9 °C. The lowest and largest average difference was 4.49 °C (1823 m, pasture, south slope) and 10.27 °C (1778 m, forest, north slope), respectively. GST was positively correlated with LST with an R2 ranging from 0.24 to 0.52 and was above 0.45 for 57 % of the stations. The RMSE ranged between 6.05 and 11.05 °C, while for 71 % of the stations was below 9.3 °C. The statistics were influenced by the number of available pairwise for comparison that were ranging from 110 to 377 due to cloud contamination or logger malfunction. Although the RMSE was relatively high, the LST closely followed the pattern of the GST variability suggesting the possibility of linking GST to LST products.

How to cite: Șerban, R.-D., Bartkowiak, P., Castelli, M., and Bertoldi, G.: Ground surface temperature linked to remote sensing land surface temperature in mountain environments, EGU General Assembly 2023, Vienna, Austria, 23–28 Apr 2023, EGU23-5726, https://doi.org/10.5194/egusphere-egu23-5726, 2023.

EGU23-5961 | ECS | Orals | CL4.1 | Highlight

Soil Hot Extremes are Increasing Faster than Air Hot Extremes Regionally 

Almudena García-García, Francisco José Cuesta-Valero, Diego G. Miralles, Miguel D. Mahecha, Johannes Quaas, Markus Reichstein, Jakob Zscheischler, and Jian Peng

Hot temperature extremes are changing in intensity and frequency. Quantifying these changes is key for developing adaptation and mitigation strategies. The conventional approach to study changes in hot extremes is based on air temperatures. However, many biogeochemical processes, i.e. decomposition of organic material and release of CO2, are triggered by soil temperature and it remains unclear whether it changes as does air temperature. Here, we demonstrate that soil hot extremes are intensifying and becoming even more frequent faster than air hot extremes over central eastern and western Europe. Based on existing model simulations, we also show that the increase in hot soil extremes could amplify or spread future heat waves by releasing sensible heat during hot days. We find an increase of 3 (7) % in the number of hot days with a contribution of heat from the soil under a warming level of 2.0 (3.0) °C than under a warming level of 1.5 °C. Furthermore, defining intensity and frequency extreme indices based on soil and air temperatures leads to a difference of more than 1 °C in intensity and 10% in frequency regionally during the last decades of the 21st century under the SPP5 8.5 emission scenario. In light of these results, maximum soil temperatures should be included in ecological risk studies as a complementary perspective to the conventional approach using extreme indices based on air temperatures.


How to cite: García-García, A., Cuesta-Valero, F. J., Miralles, D. G., Mahecha, M. D., Quaas, J., Reichstein, M., Zscheischler, J., and Peng, J.: Soil Hot Extremes are Increasing Faster than Air Hot Extremes Regionally, EGU General Assembly 2023, Vienna, Austria, 23–28 Apr 2023, EGU23-5961, https://doi.org/10.5194/egusphere-egu23-5961, 2023.

EGU23-6528 | ECS | Posters on site | CL4.1

Improving the temporal and spatial vegetation variability in land surface models based on satellite observations  

Fransje van Oorschot, Ruud van der Ent, Markus Hrachowitz, Emanuele di Carlo, Franco Catalano, Souhail Boussetta, Gianpaolo Balsamo, and Andrea Alessandri

Land-atmosphere interactions are largely controlled by vegetation, which is dynamic across spatial and temporal scales. Most state-of-the-art land surface models do not adequately represent the temporal and spatial variability of vegetation, which results in weaknesses in the associated variability of modelled surface water and energy states and fluxes. The objective of this work is to evaluate the effects of integrating spatially and temporally varying vegetation characteristics derived from satellite observations on modelled evaporation and soil moisture in the land surface model HTESSEL. Specifically, model fixed land cover was replaced by annually varying land cover, and model seasonally varying Leaf Area Index (LAI) was replaced by seasonally and inter-annually varying LAI. Additionally, satellite data of Fraction of green vegetation Cover (FCover) was used to formulate and integrate a spatially and temporally varying model effective vegetation cover parameterization. The effects of these three implementations on model evaporation and soil moisture were analysed using historical offline (land-only) model experiments at a global scale, and compared to reference datasets.

The enhanced vegetation variability lead to considerable improvements in correlation of anomaly evaporation and surface soil moisture in semiarid regions during the dry season. These improvements are related to the adequate representation of vegetation-evaporation-soil moisture feedback mechanisms during water-stress periods in the model, when integrating spatially and temporally varying vegetation. These findings emphasize the importance of vegetation variability for modelling land surface-atmosphere interactions, and specifically droughts. This research contributes to the understanding and development of land surface models, and shows that satellite observational products are a powerful tool to represent vegetation variability.

How to cite: van Oorschot, F., van der Ent, R., Hrachowitz, M., di Carlo, E., Catalano, F., Boussetta, S., Balsamo, G., and Alessandri, A.: Improving the temporal and spatial vegetation variability in land surface models based on satellite observations , EGU General Assembly 2023, Vienna, Austria, 23–28 Apr 2023, EGU23-6528, https://doi.org/10.5194/egusphere-egu23-6528, 2023.

The diurnal air temperature range (DTR) is strongly shaped by solar radiation but is modulated by hydrologic cycling through changes in atmospheric (clouds) and land-surface (evaporation) characteristics. Here, we aim to determine the distinct patterns in DTR over dry and wet periods and identify their respective controls. To do this, we develop a simple energy balance model that constrains the land-atmosphere exchange using the thermodynamic limit of maximum power. In this framework, we explicitly account for changes in radiative conditions due to clouds and changes in boundary layer heat storage associated with surface water limitation, both of which affect the maximum power limit. Using observations of radiative forcings and surface evaporation, our model predicts DTR reasonably well across 81 FLUXNET sites in North America, Europe, and Australia. We show that DTR is primarily shaped by the trade-off between the heat gain due to solar absorption and heat lost at the surface due to evaporation. Radiation remains a primary control on DTR over very dry and wet conditions where evaporation is either close to zero or limited by available energy. Over these regions, changes in DTR are strongly modulated by clouds which alters the radiative conditions. DTR becomes coupled to the land surface during the transition regime where changes in surface water availability directly control the evaporation rates. Over these regions, increased soil moisture results in more evaporation and reduced DTR. These responses were consistent in both, observations and maximum power estimates. We then apply our framework to quantify the response of DTR to global warming. Our model projects a decrease in DTR by 0.18K for a 1K rise in global temperature, which is consistent with the current observed response. Our findings imply that the predominant controls on DTR are set by clouds and evaporation as they directly modulate the diurnal heating of the lower atmosphere and can be further altered by increased greenhouse forcing.

How to cite: Ghausi, S. A., McColl, K., and Kleidon, A.: Determining the radiative and hydrologic controls on the diurnal air-temperature range using the thermodynamic limit of maximum power, EGU General Assembly 2023, Vienna, Austria, 23–28 Apr 2023, EGU23-7721, https://doi.org/10.5194/egusphere-egu23-7721, 2023.

EGU23-9421 | ECS | Orals | CL4.1

An emergent constraint exposes widespread underestimation of drought impacts by Earth System Models 

Julia K. Green, Yao Zhang, Xiangzhong Luo, and Trevor Keenan

The response of vegetation canopy conductance (gc) to changes in moisture availability gc) during drought is a major source of uncertainty in climate projections. Representing ϒgc accurately in Earth System Models (ESMs) is particularly problematic because no regional scale gc observations exist with which to evaluate it. Here, we overcome this challenge by deriving an emergent constraint on ϒgc across ESMs from Phase 6 of the Coupled Model Intercomparison Project (CMIP6). We leverage an ensemble of satellite, reanalysis and station-based estimates of surface temperatures, which are physically and statistically linked to ϒgc due to the local cooling effect of gc. We find that models systemically underestimate ϒgc by ~50%, particularly in semi-arid grasslands, croplands, and savannas. Based on the mediating effect of gc on carbon, water and energy fluxes through land-atmosphere interactions, the underestimation of modeled ϒgc in these regions contributes to biases in temperature, transpiration and gross primary production. Our results provide a novel benchmark to improve model representation of vegetation dynamics and land-atmosphere feedbacks in these regions, thus improving forecasting ability of climate extremes under future climate change scenarios.

How to cite: Green, J. K., Zhang, Y., Luo, X., and Keenan, T.: An emergent constraint exposes widespread underestimation of drought impacts by Earth System Models, EGU General Assembly 2023, Vienna, Austria, 23–28 Apr 2023, EGU23-9421, https://doi.org/10.5194/egusphere-egu23-9421, 2023.

EGU23-9767 | ECS | Posters on site | CL4.1

Diagnosing above- and below-canopy temperature impacts of forest in the Netherlands during heatwaves 

Jingwei Zhou, Adriaan J. Teuling, and Michiel K. van der Molen

Heatwaves have significant effects on ecosystems and human populations. Human habitability is impacted severely as human exposure to heatwaves is projected to increase. Future risk of heatwaves has demonstrated the need of effective measures for adaptation to persistent hot temperature extremes and ambitious mitigation to limit further increases in heatwave severity.

At local scales, forest management could be a potential approach of modifying surface energy budget and in this way alleviating heatwave impacts. In this study,  open-site, below-canopy, and above-canopy climatic conditions from 4 different sites during the time period 1997-2020 in the Netherlands were compared to investigate canopy functions of affecting above-canopy macroclimate and as a thermal insulator to regulate understory microclimate and land surface ecology. Using high-resolution sub-daily data sets from Loobos, in which water vapor and heat fluxes were measured every half an hour by a combination of eddy covariance flux measurements and a profile system, we analysed temperatures at three levels of Loobos (23.5m, 7.5m, and soil litter layer) of the same profile and compared them with those measured at open sites in De bilt and Deleen.

Heatwave periods are defined as a sequence of at least five days during which the daily maximum temperature exceeds the climatological mean over the reference period 1997-2010 by at least 5 °C. During heatwave periods, the cooling effects of the canopy on surface temperatures are stronger compared to normal periods while the canopy may aggravate the temperature above it during certain hours. By contrast, temperature differences are higher during normal times than heatwave periods when considering temperature buffer effects of canopy on understory climate (7.5m).

Further study on heat fluxes, Bowen ratio, and canopy effects on heat stress during normal conditions and heatwaves will be conducted as well. Relative humidity will be incorporated in measuring heat stress to reflect real conditions living bodies experience.

How to cite: Zhou, J., Teuling, A. J., and van der Molen, M. K.: Diagnosing above- and below-canopy temperature impacts of forest in the Netherlands during heatwaves, EGU General Assembly 2023, Vienna, Austria, 23–28 Apr 2023, EGU23-9767, https://doi.org/10.5194/egusphere-egu23-9767, 2023.

EGU23-9777 | Orals | CL4.1

Leaves, land-atmosphere interactions and extremes 

Gregory Duveiller

Leaves are the main interface between terrestrial ecosystems and the atmosphere. They govern the exchange of carbon, water and energy between vegetation and the atmospheric boundary layer. They are the surface designed to capture light and transform it to sugars via photosynthesis, but they also regulate how much water they transpire through their stomata. Their colour, density and orientation will affect their albedo, which determines how much energy is reflected back to the atmosphere, while their overall configuration within the canopy structure can affect the roughness length of the surface.

When we manage landscapes, be it by planting crops or cutting down forests, we are typically changing the quantity and type of leaves covering the surface of the land. By doing so, we can modify the land-atmosphere interactions and thereby have an effect on the climate. For instance, a substantial local cooling effect could be attained by using cover crops in winter, especially with highly reflective chlorophyll deficient mutants. Increasing forest cover appears to lead to more cloud cover, which itself could affect albedo at the top of the atmosphere. But the amount of leaves in the landscape can further affect extremes.

Here I will illustrate how leaves affect land-atmosphere interactions in the context of extreme events with two studies. The first study looks at the known biophysical effect of land use change on local surface temperature, but extends it to explore its sensitivity across the globe during the extremes observed in 20 years of satellite remote sensing records. The second study shows how much getting leaves right matters within the reanalysis records of ERA5 and ERA5-Land, where prescribed seasonal cycles of leaf area index (LAI) lead to biases in modelling land surface temperature (LST), thereby underestimating the intensity of heat waves over Europe.

How to cite: Duveiller, G.: Leaves, land-atmosphere interactions and extremes, EGU General Assembly 2023, Vienna, Austria, 23–28 Apr 2023, EGU23-9777, https://doi.org/10.5194/egusphere-egu23-9777, 2023.

EGU23-9838 | ECS | Orals | CL4.1

Vegetation-climate coupling and vegetation sensitivity to climate extremes in growing seasons 

Minchao Wu, Gabriele Messori, Giulia Vico, Stefano Manzoni, Zhanzhang Cai, Jing Tang, Torbern Tagesson, and Zheng Duan

Terrestrial vegetation is largely mediated by vegetation-climate coupling. Growing conditions control vegetation growth, which in turn feeds back to climate through changes in biophysical and biogeochemical properties and processes, such as canopy structure and carbon and water exchanges. The vegetation-climate coupling is thus highly variable in space and time. However, little is known on how the large-scale vegetation-climate coupling varies within growing season, and how vegetation responds to climate extremes. In this contribution, we present some recent findings on seasonal and intra-seasonal vegetation-climate coupling and vegetation sensitivity to droughts using multiple remote sensing products including MODIS EVI, GIMMS3g NDVI and VIP EVI2. We account for the differences in phenological stages of growing seasons affected by both climate and landscape heterogeneity. Based on a novel analytical framework incorporating meteorological and vegetation conditions to locally defined vegetation growing seasons, we analyse vegetation-climate couplings using both local climate conditions and teleconnection indices (e.g., Jet Latitude Index). In addition, vegetation sensitivity to droughts and post-drought vegetation changes are assessed. Our results highlight the importance of considering vegetation phenology in understanding sub-seasonal land-atmosphere interaction and vegetation dynamics. The developed analytical framework is suggested to be an effective approach for evaluating vegetation and climate dynamics simulated by Earth System Models.

How to cite: Wu, M., Messori, G., Vico, G., Manzoni, S., Cai, Z., Tang, J., Tagesson, T., and Duan, Z.: Vegetation-climate coupling and vegetation sensitivity to climate extremes in growing seasons, EGU General Assembly 2023, Vienna, Austria, 23–28 Apr 2023, EGU23-9838, https://doi.org/10.5194/egusphere-egu23-9838, 2023.

EGU23-9920 | ECS | Posters on site | CL4.1

Diurnal to interannual variability in Cabauw simulated by the ECLand land surface model 

Luís Fróis, Pedro M. A. Miranda, and Emanuel Dutra

Land surface plays a fundamental role in the earth system, mediating the water, energy and carbon fluxes between the land and the atmosphere. The land surface physical and biophysical processes act on time scales ranging from sub-daily to decades with relevant impacts from weather forecasts to climate change. However, there are very few available in-situ observations of land surface state and fluxes extending for several years to decades, limiting an integrated validation of the models on the different time scales. The long time series of Cabauw (Netherlands) observations provides a unique opportunity to evaluate land surface processes and their representation in land surface model at time scales ranging from sub-diurnal to interannual. In this study, we take advantage of the uniqueness of Cabauw observational record to investigate the performance of the ECMWF land surface model ECLand for the period 2001-2020 (20 years). Emphasis is given to the summer season and to evaporation and evaporative fraction. An idealized simulation without canopy resistance is performed along with other model configurations with changes to the constraints of canopy resistance (soil moisture availability and atmospheric humidity deficit) and the vertical discretization of the soil layers.

Observational uncertainties impact the surface energy budget closure. For example, the model shows a large overestimation of the ground heat flux diurnal cycle. However, part of this can be attributed to observational uncertainties associated with the sinking of the temperature sensors.  The default configuration of ECLand shows an underestimation of latent heat and evaporative fraction, which can be partially attributed to the model’s representation of canopy resistance. The increased vertical discretization of the soil layers has a neutral impact on the simulated turbulent fluxes, showing an improved representation of near-surface soil temperature. Our results show limitations in the representation of the summer interannual variability of the turbulent fluxes. These are associated with the representation of extreme events (droughts) and are not fully addressed in any of the model configurations tested. These results suggest that other processes relevant to the representation of evaporation in dryness stress conditions need to be further investigated.

This work was developed in the framework of the project NextGEMS funded through the European Union’s Horizon 2020 research and innovation program under the grant agreement number 101003470. Luis Frois was funded by the FCT Grant 2020.08478.BD. The authors also acknowledge the financial support of the Portuguese Fundação para a Ciência e a Tecnologia (FCT) I.P./MCTES through national funds (PIDDAC) – UIDB/50019/2020- IDL.

How to cite: Fróis, L., Miranda, P. M. A., and Dutra, E.: Diurnal to interannual variability in Cabauw simulated by the ECLand land surface model, EGU General Assembly 2023, Vienna, Austria, 23–28 Apr 2023, EGU23-9920, https://doi.org/10.5194/egusphere-egu23-9920, 2023.

EGU23-10118 | ECS | Orals | CL4.1

Mechanistic patterns of land hydroclimate changes in a changing climate 

Suqin Duan, Kirsten Findell, and Stephan Fueglistaler

Climate model predictions of land hydroclimate changes show large geographic heterogeneity, and differences between models are large. We introduce a new process-oriented phase space that reduces the dimensionality of the problem but preserves (and emphasizes) the mechanistic relations between variables. This transform from geographical space to climatological aridity index (AI) and daily soil moisture (SM) percentiles allows for interpretation of local, daily mechanistic relations between the key hydroclimatic variables in the context of time-mean and/or global-mean energetic constraints and the wet-get-wetter/dry-get-drier paradigm. Focusing on the tropics (30S-30N), we show that simulations from 16 different CMIP models exhibit coherent patterns of change in the AI/SM phase space that are aligned with the established soil-moisture/evapotranspiration regimes. Results indicate the need to introduce an active-rain regime as a special case of the energy-limited regime. In response to CO2-induced warming, rainfall only increases in this regime, and this temporal rainfall repartitioning is reflected in an overall decrease in soil moisture. Consequently, the regimes where SM constrains evapotranspiration become more frequently occupied, and hydroclimatic changes align with the position of the critical soil moisture value in the AI/SM phase space. Analysis of land hydroclimate changes in CMIP6 historical simulations in the AI/SM phase space reveal the very different impact of CO2 forcing and aerosol forcing. CESM2 Single Forcing Large Ensemble Experiments are used to understand their roles.

How to cite: Duan, S., Findell, K., and Fueglistaler, S.: Mechanistic patterns of land hydroclimate changes in a changing climate, EGU General Assembly 2023, Vienna, Austria, 23–28 Apr 2023, EGU23-10118, https://doi.org/10.5194/egusphere-egu23-10118, 2023.

EGU23-11343 | ECS | Posters on site | CL4.1

The relevance of coupled climate model WRF-CTSM for land-atmosphere interactions analysis 

Iris Mužić, Øivind Hodnebrog, Terje Koren Berntsen, Yeliz Yilmaz, Jana Sillmann, David Lawrence, Sean Swenson, and Negin Sobhani

A credible assessment of spatial and temporal variability of the water and energy budget is of viable importance for the quantification of the observed changes and prediction of extremes in a changing climate. However, an accurate representation of feedback mechanisms between the land surface and the atmosphere is a key source of uncertainty in climate models.

WRF-CTSM (Weather Research and Forecasting model, WRF, and Community Terrestrial Systems Model, CTSM) is a state-of-the-art modelling tool that represents the forefront in the climate modelling community and unifies the recent model development activities across weather, climate, water and ecosystem research. This study is the first to provide a systematic regional scale assessment of the WRF-CTSM coupled climate model performance in the European context - in the high-latitude region encompassing Norway, Sweden and Finland.

A 10-year-long regional WRF-CTSM simulation (2010-2020) using meteorological boundary conditions from the ERA5 reanalysis is performed on a 10.5 km horizontal resolution to evaluate the representation of hydroclimatic variables through comparison against ERA5 and a range of observational datasets. Changes in boundary layer variables such as soil and near-surface air temperature, soil moisture and snowpack are essential for the assessment of the land-atmosphere feedbacks in this region and are thus selected as central for the analysis of the model skill. Besides the WRF-CTSM simulations using default CTSM settings, this study investigates the added value of including the recently developed Hillslope Hydrology model in WRF-CTSM runs that has the potential to improve the understanding of the role of topography and hydrology on the soil moisture and snowpack variability.

Preliminary results indicate the capacity of WRF-CTSM to identify the high-temperature susceptible areas in Norway, Sweden and Finland and reproduce the interannual variability and spatial patterns of hydroclimatic variables in the respective region.

How to cite: Mužić, I., Hodnebrog, Ø., Berntsen, T. K., Yilmaz, Y., Sillmann, J., Lawrence, D., Swenson, S., and Sobhani, N.: The relevance of coupled climate model WRF-CTSM for land-atmosphere interactions analysis, EGU General Assembly 2023, Vienna, Austria, 23–28 Apr 2023, EGU23-11343, https://doi.org/10.5194/egusphere-egu23-11343, 2023.

EGU23-11538 | Orals | CL4.1

Mesoscale Gradients in Soil Moisture over South America Lead to Enhanced Convection 

Francina Dominguez, Divyansh Chug, Christopher Taylor, Cornelia Klein, and Stephen Nesbitt

This work presents the first observationally-based study over subtropical South America linking the spatial location of convection and drier soil patches of the order of tens of kilometers, as well as observational evidence of the control of background flow on the sign of SM-PPT feedbacks at convective scales. Using satellite data from multiple infrared and microwave radiometers, we track nascent, daytime convective clouds over subtropical South America and quantify the underlying, antecedent (morning), SM heterogeneity. We find that convection initiates preferentially on the dry side of strong dry-wet SM boundaries that are associated with spatially drier and warmer patches of tens of kilometers scale consistent with findings in other parts of the world. This preference maximizes during weak background low-level wind, high convective available potential energy, low convective inhibition and low vegetation density when analyzing surface gradients of 30 km length scale. On the other hand, surface gradients of 100 km length scale are significantly associated with afternoon convection during convectively unfavorable synoptic conditions and strong background flow, unlike previous studies. The location of the precipitation maxima following CI onset is most sensitive to the lower tropospheric background flow at the time of CI. The wind profile during weak background flow does not support propagation of convective features away from the dry regions and rainfall accumulates over the dry patch. Convection during strong background flow leads to greater rainfall hundreds of kilometers away from the CI location. 


How to cite: Dominguez, F., Chug, D., Taylor, C., Klein, C., and Nesbitt, S.: Mesoscale Gradients in Soil Moisture over South America Lead to Enhanced Convection, EGU General Assembly 2023, Vienna, Austria, 23–28 Apr 2023, EGU23-11538, https://doi.org/10.5194/egusphere-egu23-11538, 2023.

EGU23-12925 | ECS | Orals | CL4.1

Interannual Variation of Land-Atmosphere Interactions and their Connection with Extremes over Europe 

Lisa Jach, Thomas Schwitalla, Volker Wulfmeyer, and Kirsten Warrach-Sagi

The land surface supplies heat and moisture to the atmosphere influencing the regional climate during the convective season. Availability of soil moisture for evapotranspiration, vegetation phenology and atmospheric conditions influence the strength of the land surface impact on the atmosphere, and the mechanisms predominating the heat and moisture exchange. As both the synoptic conditions as well as the vegetation state vary on sub-seasonal to interannual time scales, the strength of land-atmosphere (L-A) interaction is expected to fluctuate on these time scales.

Up to now, research typically either focuses on case studies to understand the mechanisms of how land surface and atmosphere interact, or on climatic time scales to quantify co-variances in the climate system based on a sufficient sample size. Timescales in between remain rarely considered in land-atmosphere feedback studies.

In our study, we applied various L-A coupling measures to evaluate land surface impacts on the atmosphere and quantify interactions associated with the triggering of convective precipitation and droughts for all summers between 1991 and 2022 over Europe based on ERA5 data.

Our results highlight that differently strong L-A interactions evolve in dependence of atmospheric wetness, temperature, and the circulation pattern, as well as the root zone soil moisture and vegetation cover. Under warm and dry conditions such as in 2003, 2018 and 2022, soil moisture availability imposed limits for evapotranspiration not only in Southern Europe, but also in Central and Eastern Europe, interfering with vegetation growth and atmospheric moisture supply. Limited moisture and excessive heat supply amplified the already high temperatures and low near-surface moisture, which finally aggravated the unfavorable conditions for local precipitation and caused extreme drought conditions. On the contrary, warm and wet conditions such as in 2021 provided well-suited conditions for vegetation growth, which enhanced the moisture supply to the atmosphere. Together with stronger atmospheric instability, this provided more favorable preconditions for convective precipitation. Generally, most L-A interactions perform as an intensifier of persisting anomalies, particularly under warm and dry atmospheric conditions over Europe.

How to cite: Jach, L., Schwitalla, T., Wulfmeyer, V., and Warrach-Sagi, K.: Interannual Variation of Land-Atmosphere Interactions and their Connection with Extremes over Europe, EGU General Assembly 2023, Vienna, Austria, 23–28 Apr 2023, EGU23-12925, https://doi.org/10.5194/egusphere-egu23-12925, 2023.

EGU23-13277 | ECS | Posters on site | CL4.1

Earth observation time series for the monitoring of droughts in Cyprus: Patterns and drivers of vegetation dynamics 

Soner Uereyen, Christina Eisfelder, Ursula Gessner, Sophie Reinermann, Sarah Asam, Constantinos F. Panagiotou, Marinos Eliades, Ioannis Varvaris, Eleni Loulli, Zampela Pittaki, Diofantos Hadjimitsis, Claudia Kuenzer, and Felix Bachofer

With amplified climate warming, climate extremes over Europe become more frequent. Since the 2000’s, many years have been characterized by extreme events such as droughts and heat waves. For example, in Central Europe, extreme droughts and heat waves took place in the years 2003 and 2018. In comparison, Cyprus experienced strong droughts during 2003 and 2016-2018. Such extreme climate events can have severe impacts on agricultural yields, the productivity of natural vegetation, and on water resources. In this regard, long-term Earth observation (EO) time series are essential to quantitatively assess and analyse changes on the land surface, including vegetation condition. In this study, a joint analysis of geoscientific time series over the last two decades, including EO-based MODIS vegetation indices and meteorological variables is performed to assess drought events and analyse trends as well as potential drivers of vegetation dynamics in Cyprus. The analysis of drought events and vegetation trends is based on the full archive of MODIS imagery at 250 m spatial resolution covering the period 2000-2022. In detail, climate-related effects on vegetation were analysed by means of the deviations of MODIS 16-day vegetation index composites from their long-term mean. Next, trends of the MODIS vegetation index were calculated to evaluate spatial patterns of vegetation change over the investigated period. These analyses were additionally performed for geographically stratified regions, including diverse vegetation classes such as cropland and grassland. Furthermore, the application of a causal discovery algorithm reveals linkages within a multivariate feature space, in particular between vegetation greenness and climatic drivers. Preliminary analyses showed that drought patterns differ with respect to seasons and the investigated vegetation class. For example, the strong drought year 2008 is clearly reflected in the results, whereas forest areas appear to be least affected by the drought during the spring months. Moreover, considering the significant trends over the last two decades, an increase in vegetation greenness could be observed.

How to cite: Uereyen, S., Eisfelder, C., Gessner, U., Reinermann, S., Asam, S., Panagiotou, C. F., Eliades, M., Varvaris, I., Loulli, E., Pittaki, Z., Hadjimitsis, D., Kuenzer, C., and Bachofer, F.: Earth observation time series for the monitoring of droughts in Cyprus: Patterns and drivers of vegetation dynamics, EGU General Assembly 2023, Vienna, Austria, 23–28 Apr 2023, EGU23-13277, https://doi.org/10.5194/egusphere-egu23-13277, 2023.

EGU23-13932 | Posters on site | CL4.1

The Impact of Recent European Droughts and Heatwaves on Trace Gas Surface Fluxes: Insights from Land Surface Data Assimilation 

Paul Hamer, Heidi Trimmel, Jean-Christophe Calvet, Bertrand Bonan, Catherine Meurey, Islen Vallejo, Sabine Eckhardt, Gabriela Sousa-Santos, Virginie Marecal, and Leonor Tarrason

Heatwave and drought extremes can have significant impacts on vegetation, which can in turn lead to important effects on reactive trace gas fluxes at the land-atmosphere interface that can ultimately alter atmospheric composition. We present results from the EU-funded Sentinel EO-based Emission and Deposition Service (SEEDS) project, which aimed at developing upgrades to the existing Copernicus Atmospheric Monitoring Service (CAMS) component on European air quality. In this work, we used land surface modelling (SURFEX – Surface Externalisée) combined with data assimilation (Extended Kalman Filter - EKF) of satellite leaf area index (LAI) to deliver improved estimation of the land surface state. The land surface model is coupled with an online model for dry deposition and an offline model (MEGANv3.1) for biogenic volatile organic compounds (BVOCs) to estimate trace gas losses and emissions, respectively. This approach exploits methods at the forefront of land surface modelling (dynamic vegetation simulation and data assimilation) and combines them with the latest algorithms to estimate trace gas fluxes at the surface. We present findings from two extreme events in Europe: the 2018 drought and the 2019 June/July heat waves. SURFEX was forced using ECMWF meteorology at 0.1° × 0.1° resolution that captured both events. Both extreme events provoked strong responses in the models for dry deposition velocity and BVOC emissions. The 2018 drought began in spring and endured through summer, during which dry deposition velocities declined steadily beyond seasonal norms due to increased stomatal resistance forced by the vegetation response to drought. Over continental Europe, BVOCs initially increased in the early phase of the drought, but then sharply declined into July in the worst-affected regions in Germany, Denmark, and Poland. Meanwhile, BVOCs increased in Scandinavia relative to seasonal norms due to the warmer-than-average conditions. The first episode of severe heat in 2019 arrived in late June, which initially caused a large increase in BVOC emissions compared to seasonal norms. Then drought set in during July and despite a second large heat wave BVOC emissions were lower overall compared to seasonal norms. In fact, the European-wide BVOC emissions were higher in June compared to July due to the drought effects that commenced later in the heat wave cycle. This reverses the normal seasonal cycle in BVOC emissions, and drought impacts on vegetation were the primary driver behind this. Dry deposition velocities are reduced during both heat waves, but we see a larger decline in the second heat wave in July when drought conditions are more severe.

Our findings suggest that these impacts on trace gas surface fluxes would have a strong effect on atmospheric composition, and on photochemical ozone formation. We, therefore, conclude that these effects likely played a contributory role to the ozone pollution episodes that occurred coincidentally in time with the heat wave events in both 2018 and 2019. The project aim within SEEDS is to eventually test the BVOC emissions and dry deposition velocities within a chemical transport model participating within the CAMS regional ensemble (MOCAGE) and to therefore evaluate the impact on ozone.

How to cite: Hamer, P., Trimmel, H., Calvet, J.-C., Bonan, B., Meurey, C., Vallejo, I., Eckhardt, S., Sousa-Santos, G., Marecal, V., and Tarrason, L.: The Impact of Recent European Droughts and Heatwaves on Trace Gas Surface Fluxes: Insights from Land Surface Data Assimilation, EGU General Assembly 2023, Vienna, Austria, 23–28 Apr 2023, EGU23-13932, https://doi.org/10.5194/egusphere-egu23-13932, 2023.

EGU23-14104 | ECS | Orals | CL4.1

Transpiration in forest ecosystems based on deep learning and sap flow observations 

Marco Hannemann, Almudena García-García, and Jian Peng

Transpiration (T), the component of evaporation (E) controlled by vegetation, dominates terrestrial Evaporation, but measurements are highly uncertain. In the light of the importance of evaporation for studying the terrestrial water cycle, hydro-climatic extremes such as droughts and heatwaves and land-atmospheric interactions, there is a strong demand on novel approaches to reliably estimate T. Currently available approaches to estimate T mostly rely on its relationship with photosynthesis, but parameterizing this relationship is difficult and estimates of T strongly disagree among each other in terms of magnitude. Moreover, in-situ measurements are scarce and and evaporation cannot be measured directly from space.

We developed a hybrid Priestley-Taylor (PT) model using Deep Learning to learn the relationship between T and state variables such as soil moisture, vapor pressure deficit and the fraction of photosynthetic active radiation for different plant functional types (PFTs). We use globally available variables from reanalysis and remote sensing data as forcing to train an artificial neural network on the PT-coefficient α obtained by inverting the PT model on sap flow based ecosystem T. In this way, we can predict Transpiration at local scales independently from hard-to-obtain fluxes like E or vegetation parameters such as stomatal conductance. We evaluate our algorithm against T estimates from flux partitioning methods based on water use efficiency at eddy covariance sites for different PFTs and regions. Also, we compare our estimates with other available products of transpiration like GLEAM, PML-V2 and ERA5-Land. Preliminary results of this research showed that the developed model can learn the relationship between T and few influencing variables, without incorporating variables such as net radiation or GPP. Our findings contribute to dissolving the scarcity of T estimates in forest ecosystems based on actual observations. Future work is needed to apply our method to the larger scale for studying spatial patterns of T, e.g. across the European continent.

How to cite: Hannemann, M., García-García, A., and Peng, J.: Transpiration in forest ecosystems based on deep learning and sap flow observations, EGU General Assembly 2023, Vienna, Austria, 23–28 Apr 2023, EGU23-14104, https://doi.org/10.5194/egusphere-egu23-14104, 2023.

EGU23-14158 | Posters on site | CL4.1

Continuous observations of CO2 and CH4 exchange from East-African rangelands 

Lutz Merbold, Vincent Odongo, Thomas Dowling, Francesco Fava, Ilona Glücks, Anton Vrieling, Martin Wooster, and Sonja Leitner

Semi-arid rangelands in Sub-Saharan Africa (SSA) are an important source of food security and nutrition but are under increased anthropogenic pressure by a growing population. These rangelands are characterized by nutrient poor soils and distinct wet and dry season(s). Due to the soil and climate combination, conventional crop agriculture is rarely feasible without irrigation and mineral fertilizer amendments, which in turn are limited by prohibitively high fertilizer prices and lack of water. Instead, pastoral livestock keeping is a valuable option to use these marginal lands and – under the right management – can be a sustainable form of food production and biodiversity protection given that most of these landscapes have co-evolved with megafauna over millennia. Despite the global role of livestock systems on climate change, there is still limited understanding on the role of SSA rangelands. At the same time, livestock systems emit greenhouse gases (GHG) and can promote global warming. But despite the impact of livestock systems on climate change, our understanding of the role of SSA rangelands is limited. To date, a thorough assessment that includes continuous GHG exchange measurement in combined wildlife-livestock systems on the African continent has not been undertaken. Here we provide the first eddy covariance (EC) measurements of CO2/CH4/H2O fluxes from the ILRI Kapiti Wildlife Conservancy - a benchmark rangeland site in East Africa that is grazed by livestock and wildlife. Our results show continuous ecosystem CO2 uptake from the wet to dry seasons with considerable CO2 emission pulses following precipitation events after long dry periods that turn the landscape into short-term net CO2 emitters. In contrast to CO2, CH4 fluxes are highly variable and depend particularly on wildlife and/or livestock being present in the fetch of the EC tower. In addition to EC measurements and given the need for scaling of our results, we relate CO2 and CH4 fluxes to simple remote sensing measurements of vegetation greenness derived from phenological cameras. Our results show good agreement between the two approaches. Yet, more observations across a climatic gradient and along varying management intensities are needed to reduce existing uncertainties in the effect of SSA rangelands on climate change. To build a complete GHG budget, hot spots of greenhouse gas emissions such as from livestock enclosures or water bodies as well as soil carbon sequestration have yet to be accounted for.

How to cite: Merbold, L., Odongo, V., Dowling, T., Fava, F., Glücks, I., Vrieling, A., Wooster, M., and Leitner, S.: Continuous observations of CO2 and CH4 exchange from East-African rangelands, EGU General Assembly 2023, Vienna, Austria, 23–28 Apr 2023, EGU23-14158, https://doi.org/10.5194/egusphere-egu23-14158, 2023.

EGU23-14377 | Posters on site | CL4.1

Sensitivity to soil moisture initialization in the simulation of Indian pre-monsoon season, using a regional climate numerical model 

Arjun Vasukuttan, Lorenzo Sangelantoni, Ka Shateesan, and Gianluca Redaelli

Soil moisture content is crucial for the representation and predictability of hydroclimatic extremes of different spatial/temporal scales such as heavy rainfall, droughts and heatwaves. In order to include these effects and the relevant feedback with the atmosphere in a regional climate model, the soil moisture initialization has to be adequate.

This study explores the soil moisture precipitation (SM-P) feedback, the soil moisture temperature (SM-T) feedback and the heat fluxes over the entire domain and 3 smaller regions of interest. A hydrostatic version of the Regional Climate Model  4.7 (RegCM4.7) with Arakawa B grid is used to run the simulations. The simulations  are performed for the months February to May during the years 2008, 2009 and 2010 with a spatial resolution of 12 km and temporal resolution of 3 hours. The initial and boundary conditions(ICBC)  are derived from the ERA5 data.  We examine results from simulations initiated using three different soil moisture datasets, namely, the control, dry and wet datasets. The soil moisture data from the ERA5-Land reanalysis is used for the control simulation. A dry/wet simulation is run using dry/wet datasets derived from the ERA5-Land data. This is done by halving/doubling the soil moisture values from ERA5-Land data, giving rise to new soil moisture values with lower/higher soil moisture as compared to the control dataset (ERA5-Land). CMORPH (Climate Prediction Center (CPC) Morphing Technique (MORPH)) and CRU (Climate Research Unit) datasets are used as reference to evaluate the precipitation and temperature values resulting from the control simulation.

The results display the mean changes in the dry/wet simulation results with respect to the control simulation. Plots showing the vertical profile changes in relative humidity and air temperature, and changes in lower tropospheric wind and specific humidity, indicates the build-up of the observed precipitation events and temperature patterns induced by the initial soil moisture perturbation. Interestingly the simulation results show negative SM-P feedback.  In other words, the average precipitation seemed to increase/decrease for the dry/wet cases with respect to the control simulation. This is contrary to the general expectation that dry/wet soil moisture decreases/increases precipitation. The possible reasons for the negative SM-P feedback and its distribution over the region include the proximity to the ocean, topography, and the pre-monsoon dryline. The SM-T and the heat fluxes on the other hand display expected behaviour with few exceptions in some regions in the dry simulation case.

How to cite: Vasukuttan, A., Sangelantoni, L., Shateesan, K., and Redaelli, G.: Sensitivity to soil moisture initialization in the simulation of Indian pre-monsoon season, using a regional climate numerical model, EGU General Assembly 2023, Vienna, Austria, 23–28 Apr 2023, EGU23-14377, https://doi.org/10.5194/egusphere-egu23-14377, 2023.

Numerous cyclones develop in the Bay of Bengal during the pre-monsoon and post-monsoon seasons. The heavy rain associated with these cyclones causes devastating damage to life and property during landfall. The modern numerical weather prediction models and high temporal satellite observation data have significantly increased the accuracy of cyclone prediction in recent years. However, accurately predicting rainfall intensity and its dissipation after landfall is still challenging. Previous studies have indicated that land-based evapotranspiration plays an essential role in determining the intensity and decay of cyclones post-landfall. In this study, we quantify the contribution of land-based evapotranspiration to the rainfall associated with cyclones and the impact of land conditions on the speed and track of cyclones originating in the Bay of Bengal. For this purpose, we employed the Weather Research Forecasting (WRF) model upgraded with Eulerian water tagging capabilities to track evapotranspiration from land. The tagging model will tag the evapotranspiration originating on land and track it throughout the atmosphere till it precipitates or moves out of the domain. We simulated six cyclones of varying intensities, with three during the pre and three during the post-monsoon seasons. We conducted sensitivity experiments with dry and wet initial soil moisture conditions to determine the impact of perturbed soil moisture on TC. To account for the model's internal variability, we simulated an ensemble with four members for the control simulation. The ensemble is created by changing each member's model initialization time by six hours. This ensemble helped identify the magnitude of the model's internal variability, which was less than the variability due to soil moisture changes. The study revealed that soil moisture conditions prior to TC formation have an impact on its evolution. By analyzing the latent heat, temperature, and wind pattern, we found that the initial soil moisture during the pre and post-monsoon seasons alters the synoptic features over the Indian subcontinent, resulting in variations in the TC evolution. The relatively low-intensity TC tracks are more sensitive to the initial soil moisture conditions. The rainfall originating from land-based evapotranspiration is more significant as the cyclone approaches land. Therefore, land-based evapotranspiration plays a crucial role in the end phase of the cyclone (from just before landfall till its decay). For post-monsoon cyclones, the rainfall from land-based evapotranspiration is as high as 20% to 30% after landfall, whereas, for pre-monsoon cyclones, the land contribution is around 5% to 10%. In addition to soil moisture, factors such as proximity to land, track length over land, and TC intensity also have a role in determining the quantity of precipitation originating from the land for a TC.

How to cite: Lanka, K. and Navale, A.: Influence of Soil Moisture on the Evolution of Landfalling Tropical Cyclones during pre and post-monsoon seasons, EGU General Assembly 2023, Vienna, Austria, 23–28 Apr 2023, EGU23-15299, https://doi.org/10.5194/egusphere-egu23-15299, 2023.

EGU23-15403 | Orals | CL4.1 | Highlight

Global observations highlight regions where vegetation can enhance S2S predictability 

Christopher Taylor and Bethan Harris

The land surface is a key source of predictability for forecasts at the subseasonal-to-seasonal (S2S; 2 weeks to 2 months) timescale, since variables such as root zone soil moisture and leaf area vary more slowly than the atmospheric state. Previous work has mostly focused on the predictability gained from realistic soil moisture initialisations. Considering observable land surface variables, vegetation shows more persistent changes than surface soil moisture following subseasonal rainfall events, and therefore has the potential to provide predictability at longer lead times. We therefore perform the first investigation of vegetation feedbacks onto near-surface air temperatures using global daily data, to ascertain in which regions and seasons these feedbacks can provide S2S predictability. We use daily datasets of Vegetation Optical Depth (VOD, from the VODCA X-band product) and 2m temperature (from ERA5) at 0.25° horizontal resolution, and compute lagged correlations to identify where spatial structures in VOD anomalies are associated with similar structure in 2m temperature anomalies. Using daily data allows us to investigate how the correlations decay as a function of lead time within the S2S timescale. At zero lag, water-limited regions exhibit negative correlations, indicating that an increase in vegetation water content is associated with increased evapotranspiration and reduced sensible heat, leading to cooler near-surface air temperatures. We find extensive regions in the semi-arid tropics and sub-tropics where at certain times of year VOD anomaly patterns are anti-correlated with temperature patterns 2 weeks ahead. These periods tend to occur outside of the wettest time of year. In some regions, e.g. southern Africa in MAM,  predictability of temperature from VOD anomalies extends to lags of 30 days, suggesting that incorporating vegetation variability can improve S2S forecasting. We develop a model for the strength and persistence of vegetation feedbacks to near-surface temperatures based on seasonal cycles of rainfall and vegetation.

How to cite: Taylor, C. and Harris, B.: Global observations highlight regions where vegetation can enhance S2S predictability, EGU General Assembly 2023, Vienna, Austria, 23–28 Apr 2023, EGU23-15403, https://doi.org/10.5194/egusphere-egu23-15403, 2023.

EGU23-16444 | ECS | Orals | CL4.1

Exploring deep root water uptake, soil moisture, and land surface fluxes in the Amazon 

Carolina Bieri, Francina Dominguez, Gonzalo Miguez-Macho, and Ying Fan

Plant roots act as critical pathways of moisture from subsurface sources to the atmosphere. Moreover, deep plant roots allow vegetation to meet water demand during seasonally dry periods by taking up moisture from accessible groundwater. This is an important resilience mechanism in the Amazon, a hydrologically and ecologically significant region. However, most regional land-atmosphere computational models do not adequately capture the link between deep roots and groundwater. This study details the implementation of a dynamic rooting scheme in the Noah-Multiparameterization (Noah-MP) land surface model, a widely used tool for studying the exchange of energy and moisture between the land and atmosphere. The rooting scheme is a first-order representation of dynamic rooting depth based on the soil water profile and includes quantification of deep root water uptake (RWU). The scheme is easily scalable and ideal for regional or continental-scale climate simulations. It is used in conjunction with a groundwater scheme which captures high-resolution spatial groundwater variations, allowing us to capture the critical link between deep roots and groundwater. We perform 10-year simulations with and without the root scheme for a test region in the Amazon to validate the enhanced model. We analyze time series of soil moisture, RWU, and evapotranspiration for points with differing vegetation cover and elevation. This allows us to demonstrate functionality of the root scheme and ensure it behaves properly for varying conditions. Representation of deep RWU is critical for realistic simulation of the soil-plant-atmosphere system. As the land surface is an important component of atmospheric predictability, inclusion of deep RWU can contribute to improved prediction of atmospheric variables such as precipitation.


How to cite: Bieri, C., Dominguez, F., Miguez-Macho, G., and Fan, Y.: Exploring deep root water uptake, soil moisture, and land surface fluxes in the Amazon, EGU General Assembly 2023, Vienna, Austria, 23–28 Apr 2023, EGU23-16444, https://doi.org/10.5194/egusphere-egu23-16444, 2023.

EGU23-787 | ECS | PICO | CR2.3

Mapping stagnant ice and age in the Dome Fuji region, Antarctica, by combining radar internal layer stratigraphy and flow modeling 

Zhuo Wang, Olaf Eisen, Ailsa Chung, Daniel Steinhage, Frédéric Parrenin, and Johannes Freitag

The Dome Fuji (DF) region in Antarctica is a potential site for holding an ice record older than one million years. Here, we combine the internal airborne radar stratigraphy with a 1-D inverse model to reconstruct the age field of ice in the DF region. As part of the Beyond EPICA - Oldest Ice reconnaissance (OIR), the region around DF was surveyed with a total of 19000 km of radar lines in the 2016/17 Antarctic summer. Internal stratigraphy in this region has now been traced. Through these tracked radar isochrones, we transfer the age-depth scale from DF ice core to the adjacent 500 km2 region. A 1-D inverse model has been applied at each point of the survey to extend the age estimates to deeper regions of the ice sheet where no direct or continuous link of internal stratigraphy to the ice cores is possible, and to construct basal thermal state and accumulation rates. Through the reliability index of each model, we can evaluate the reliability of the 1-D assumption. Mapped age of basal ice and age density imply there might exist promising sites with ice older than 1.5 million years in the DF region. Moreover, the deduced basal state, i.e., melting rates and stagnant ice provide constraints for finding old-ice sites with a cold base. The accumulation rate ranges from 0.014 to 0.038 m a-1 (in ice equivalent) in the DF region, which is also an important criterion for potential old ice.

How to cite: Wang, Z., Eisen, O., Chung, A., Steinhage, D., Parrenin, F., and Freitag, J.: Mapping stagnant ice and age in the Dome Fuji region, Antarctica, by combining radar internal layer stratigraphy and flow modeling, EGU General Assembly 2023, Vienna, Austria, 23–28 Apr 2023, EGU23-787, https://doi.org/10.5194/egusphere-egu23-787, 2023.

EGU23-792 | ECS | PICO | CR2.3

What to watch out for when assimilating ice-cores as regional SMB proxies? 

Marie G. P. Cavitte, Hugues Goosse, Kenichi Matsuoka, Sarah Wauthy, Rahul Dey, Vikram Goel, Jean-Louis Tison, Brice Van Liefferinge, and Thamban Meloth

Ice cores remain the highest resolution proxy for measuring past surface mass balance (SMB) that can be used for model-data comparison. However, there is a clear difference in the spatial resolution of the ice cores, with a surface sample on the order of cm2, and the spatial resolution of models, with at best a surface footprint on the order of a few km2. Comparing ice core SMB records and model SMB outputs directly is therefore not a one-to-one comparison. In addition, it is well known that ice cores, as point measurements, sample very local SMB conditions which can be affected by local wind redistribution of the SMB at the surface.

We set out to answer the question: how representative are ice-cores of regional SMB? For this, we use several ground-penetrating radar (GPR) surveys in East Antarctica, which have co-located ice core drill sites. Most of our sites share a relatively similar climatology, as they are all coastal ice promontories/rises along the Dronning Maud Land coast, with the exception of the Dome Fuji survey on the high plateau in the interior of the continent.

We will show that the comparison of the SMB signals of the GPR and the ice core records allows us to estimate the spatial footprint of the ice cores, and that this spatial footprint varies widely from site to site. We will provide a summary of the spatial and temporal characteristics for each location.

How to cite: Cavitte, M. G. P., Goosse, H., Matsuoka, K., Wauthy, S., Dey, R., Goel, V., Tison, J.-L., Van Liefferinge, B., and Meloth, T.: What to watch out for when assimilating ice-cores as regional SMB proxies?, EGU General Assembly 2023, Vienna, Austria, 23–28 Apr 2023, EGU23-792, https://doi.org/10.5194/egusphere-egu23-792, 2023.

EGU23-2178 | ECS | PICO | CR2.3

Radar-derived ice fabric anisotropy and implications on flow enhancement along the Thwaites Glacier Eastern Shear Margin 

Tun Jan Young, Carlos Martin, Thomas Jordan, Ole Zeising, Olaf Eisen, Poul Christoffersen, David Lilien, and Nicholas Rathmann

Glaciers and ice streams account for the majority of ice mass discharge to the ocean from the Antarctic Ice Sheet, and are bounded by intense bands of shear that separate fast-flowing from slow or stagnant ice, called shear margins. The anisotropy of glacier ice (i.e. a preferred crystal orientation) stemming from high rates of shear at these margins can greatly facilitate fast streaming ice flow, however it is still poorly understood due to a lack of in-situ measurements. If anisotropy is incorporated into numerical ice sheet models at all, it is usually as a simple scalar enhancement factor that represents the "flow law" that governs the model's rheology. Ground-based and airborne radar observations along two transects fully crossing the Eastern Shear Margin of Thwaites Glacier reveal rapid development of highly anisotropic fabric tightly concentrated around a lateral maximum in surface shear strain. These measurements of fabric strength at the centre of the shear margin are indicative of a horizontal pole configuration, which potentially represents ice that is “softened” to shearing in some directions and hardened in others. The resulting flow enhancement revealed by our results suggest that the viscosity of ice is highly variable and regime-dependent, and supports the importance of considering anisotropic flow laws to model the rheology of ice sheets.

How to cite: Young, T. J., Martin, C., Jordan, T., Zeising, O., Eisen, O., Christoffersen, P., Lilien, D., and Rathmann, N.: Radar-derived ice fabric anisotropy and implications on flow enhancement along the Thwaites Glacier Eastern Shear Margin, EGU General Assembly 2023, Vienna, Austria, 23–28 Apr 2023, EGU23-2178, https://doi.org/10.5194/egusphere-egu23-2178, 2023.

Permafrost, the frozen layer beneath a freezing and thawing active layer, is an impermeable frozen soil that persists for multiple years. The gradual thawing of permafrost and thickening of the active layer allows a glimpse into the evolution of the hydraulic processes that shape the periglacial landscape. One question in understanding the governing mechanics within the rapidly evolving periglacial landscape is how water retains within or segregates through the active layer to eventually feed rivers. 

In this exploratory study, we analyze data from multiple periglacial hydraulic catchments over time and characterize their hydraulic response rate to stressors. We test whether deconvolution and demixing of noisy time series can isolate precipitation from thawing permafrost signals in river discharge. We use the Ensemble Rainfall-Runoff (ERRA) script, which is effective in inferring nonstationary and nonlinear responses to precipitation using Runoff Response Distribution (RRD), to further test temperature signatures. Using this tool, we measure the RRD for the same catchments both over the years and over the summer months. We hypothesize that an increase in active layer thickness over years and over summer months will delay the RRD due to an increase in water storage.

By analyzing the parameters that change the RRD of periglacial systems with time, soil moisture content, average seasonal and yearly temperatures, and precipitation, we can begin a systematic understanding of how the active layer modulates hydraulic responses and how the responses may be different from other hydraulic systems.

How to cite: Culha, C. and Kirchner, J.: Characterizing melt water properties in the periglacial active layer through seasonal and yearly variations in catchment hydrology., EGU General Assembly 2023, Vienna, Austria, 23–28 Apr 2023, EGU23-4291, https://doi.org/10.5194/egusphere-egu23-4291, 2023.

EGU23-5504 | PICO | CR2.3

Sensitivity of the mass conservation method to the regularisation scheme 

Fabien Gillet-Chaulet, Eliot Jager, and Mathieu Morlighem

While being one of the most important variables for predicting the future of the ice sheets, observations of ice thickness are only available along flight tracks, separated by a few to a few tens of kilometres. For many applications, these observations need to be interpolated on grids at a much higher resolution than the actual average spacing between tracks.

The mass conservation method is an inverse method that combines the sparse ice thickness data with high resolution surface velocity observations to obtain a high-resolution map of ice thickness that conserves mass and minimizes the departure from observations.  As with any inverse method, the problem is ill-posed and requires some regularisation. The classical approach is to use a Tikhonov regularisation that penalizes the spatial derivatives of the ice thickness and therefore favours smooth solutions with implicit spatial correlation structures. In a Bayesian framework, regularization can be seen as an implicit assumption for the prior probability distribution of the inverted parameter. Other popular geostatistical interpolation algorithms, such as kriging, usually require to parameterize the spatial correlation of the interpolated field using standard correlation functions (e.g., gaussian, exponential, Matèrn).

Here we replace the Tikhonov regularisation term in the mass conservation method  by a term that penalises the departure from a prior, where the error statistics are parametrized with the same standard correlation functions. This makes the regularisation independent from grid spacing and regularisation weights do not need to be adjusted. We present and discuss the sensitivity of the mass conservation method to the regularisation scheme using a suite of synthetic and “true” bed from deglaciated areas and show that prescribing the correct regularisation always provides the most accurate solution.

How to cite: Gillet-Chaulet, F., Jager, E., and Morlighem, M.: Sensitivity of the mass conservation method to the regularisation scheme, EGU General Assembly 2023, Vienna, Austria, 23–28 Apr 2023, EGU23-5504, https://doi.org/10.5194/egusphere-egu23-5504, 2023.

EGU23-6770 | PICO | CR2.3

Greenland ice-stream dynamics: short-lived and agile? 

Olaf Eisen, Steven Franke, Paul D. Bons, Julien Westhoff, Ilka Weikusat, Tobias Binder, Kyra Streng, Daniel Steinhage, Veit Helm, John D. Paden, Graeme Eagles, and Daniela Jansen

Reliable knowledge of ice discharge dynamics for the Greenland ice sheet via its ice streams is essential if we are to understand its stability under future climate scenarios as well as their dynamics in the past, especially when using numerical models for diagnosis and prediction. Currently active ice streams in Greenland have been well mapped using remote-sensing data while past ice-stream paths in what are now deglaciated regions can be reconstructed from the landforms they left behind. However, little is known about possible former and now defunct ice streams in areas still covered by ice. Here we use radio-echo sounding data to decipher the regional ice-flow history of the northeastern Greenland ice sheet on the basis of its internal stratigraphy. By creating a three-dimensional reconstruction of time-equivalent horizons, we map folds deep below the surface that we then attribute to the deformation caused by now-extinct ice streams. We propose that locally this ancient ice-!ow regime was much more focused and reached much farther inland than today’s and was deactivated when the main drainage system was reconfigured and relocated southwards. The insight that major ice streams in Greenland might start, shift or abruptly disappear will affect our approaches to understanding and modelling the past or future response of Earth’s ice sheets to global warming. Such behaviour has to be sufficiently reproduced by numerical models operating on the mid- to longer-term timescales to be considered adequate physical representations of the naturally occuring dynamic behaviour of ice streams.

How to cite: Eisen, O., Franke, S., Bons, P. D., Westhoff, J., Weikusat, I., Binder, T., Streng, K., Steinhage, D., Helm, V., Paden, J. D., Eagles, G., and Jansen, D.: Greenland ice-stream dynamics: short-lived and agile?, EGU General Assembly 2023, Vienna, Austria, 23–28 Apr 2023, EGU23-6770, https://doi.org/10.5194/egusphere-egu23-6770, 2023.

EGU23-6900 | ECS | PICO | CR2.3

Determining Basal Mass Balance of Ice Shelves Using Simulation-Based Inference 

Guy Moss, Vjeran Višnjević, Cornelius Schröder, Jakob Macke, and Reinhard Drews

The ice shelves buttressing the Antarctic ice sheet determine its stability. Over half of all mass loss in Antarctica occurs due to ice melting at the water-ice boundary at the base of ice shelves. Different contemporary methods of estimating the spatial distribution of the melting rates do not produce consistent results, and provide no information about decadal to centennial timescales. We explore a new method to infer the spatial distribution of the basal mass balance (BMB) using the internal stratigraphy which may contain additional information not present in other sources such as ice thickness and surface velocities alone. The method estimates the Bayesian posterior distribution of the BMB,  and provides us with a principled measure of uncertainty in our estimates. 


Our inference procedure is based on simulation-based inference (SBI) [1], a novel machine learning inference method. SBI utilizes artificial neural networks to approximate probability distributions which characterize those parameters that yield data-compatible simulations, without the need of an explicit likelihood function. We demonstrate the validity of our method on a synthetic ice shelf example, and then apply it to Ekström ice shelf, East Antarctica, where we have radar measurements of the internal stratigraphy. The inference procedure relies on a simulator of the dynamics of the ice shelves. For this we use the Shallow Shelf Approximation (SSA) implemented in the Python library Icepack [2], and a time-discretized layer tracing scheme [3].  These detailed simulations, along with available stratigraphic data and the SBI methodology, allows us to compute a spatially-varying posterior distribution of the melting rate. This distribution corroborates existing estimates and extends upon them by quantifying the uncertainty in our inference. This uncertainty should be incorporated in future forecasting of ice shelf dynamics and stability analysis.


[1] Lueckmann et al.: Benchmarking simulation-based inference (2020).

[2] Shapero et al.: icepack: a new glacier flow modeling package in Python, version 1.0. (2021).

[3] Born: Tracer transport in an isochronal ice-sheet model (2017).


How to cite: Moss, G., Višnjević, V., Schröder, C., Macke, J., and Drews, R.: Determining Basal Mass Balance of Ice Shelves Using Simulation-Based Inference, EGU General Assembly 2023, Vienna, Austria, 23–28 Apr 2023, EGU23-6900, https://doi.org/10.5194/egusphere-egu23-6900, 2023.

EGU23-8775 | PICO | CR2.3

Advancements in RUC Snow Model for Implementation in the Regional Application of the Unified Forecasting System (UFS) 

Tatiana Smirnova, Anton Kliewer, Siwei He, and Stan Benjamin

RUC land surface model (LSM) was designed for short-range weather predictions with an emphasis on severe weather. The model has been operational at NCEP since 1998. Currently it is utilized in the operational WRF-based Rapid Refresh (RAP) and High-Resolution Rapid Refresh (HRRR) regional models. Being available to the world WRF community, RUC LSM is also used as a land-surface component in operational weather prediction models in Austria, New Zealand and Switzerland.

At present time, RUC LSM is being tested in the regional application of the UFS-based Rapid Refresh FV3 Standalone (RRFS) model to replace operational RAP and HRRR at NCEP.

RUC LSM has improved and matured over the years. The unique feature of this land-surface model is continuous evolution of soil/snow states within moderately coupled land data assimilation (MCLDA). To avoid possible drifts, this feature requires high skill from RUC LSM as well as accurate atmospheric forcing. Continuous snow cycling includes the following snow state variables: snow cover fraction, snow depth, snow water equivalent and snow temperature. To avoid possible inaccuracies in the location of cycled snow on the ground, snow depth is corrected daily using 4-km IMS snow cover information. Work is also underway to further improve RUC snow model for better surface predictions over snow-covered areas. RUC snow model uses “mosaic” approach to account for subgrid variability of snow cover. Within this approach, snow-covered and snow-free portions of the grid cells are treated separately in the solution of energy and moisture budgets. Thus, snow cover fraction becomes a critical parameter, and modifications to its computation have been developed and tested in the RRFS retrospective experiments. Results from these validation experiments will be presented at the meeting.

How to cite: Smirnova, T., Kliewer, A., He, S., and Benjamin, S.: Advancements in RUC Snow Model for Implementation in the Regional Application of the Unified Forecasting System (UFS), EGU General Assembly 2023, Vienna, Austria, 23–28 Apr 2023, EGU23-8775, https://doi.org/10.5194/egusphere-egu23-8775, 2023.

EGU23-9080 | ECS | PICO | CR2.3

Historical snow and ice temperature compilation documents the recent warming of the Greenland ice sheet 

Baptiste Vandecrux, Robert S. Fausto, Jason E. Box, Federico Covi, Regine Hock, Asa Rennermalm, Achim Heilig, Jakob Abermann, Dirk Van As, Anja Løkkegaard, Xavier Fettweis, Paul C. J. P. Smeets, Peter Kuipers Munneke, Michiel Van Den Broeke, Max Brils, Peter L. Langen, Ruth Mottram, and Andreas P. Ahlstrøm

The Greenland ice sheet mass loss is one of the main sources of contemporary sea-level rise. The mass loss is primarily caused by surface melt and the resulting runoff. During the melt season, the ice sheet’s surface receives energy from sunlight absorption and sensible heating, which subsequently heats the subsurface snow and ice. The energy from the previous melt season can also enhance melting in the following summer as less heating is required to bring the snow and ice to the melting point. Subsurface temperatures are therefore both a result and a driver of the timing and magnitude of surface melt on the ice sheet. We present a dataset of more than 3900 measurements of ice, snow and firn temperature at 10 m depth across the Greenland ice sheet spanning the years from 1912 to 2022. We construct an artificial neural network (ANN) model that takes as input the ERA5 reanalysis monthly near-surface air temperature and snowfall for the 1954-2022 period and train it on our compilation of observed 10-meter temperature. We use our dataset and the ANN to evaluate three broadly used regional climate models (RACMO, MAR and HIRHAM). Our ANN model provides an unprecedented and observation-based description of the recent warming of the ice sheet’s near-surface and our evaluation of the three climate models highlights future development for the models. Overall, these findings improve our understanding of the ice sheet’s response to recent atmospheric warming and will help reduce uncertainties of ice sheet surface mass balance estimates.

How to cite: Vandecrux, B., Fausto, R. S., Box, J. E., Covi, F., Hock, R., Rennermalm, A., Heilig, A., Abermann, J., Van As, D., Løkkegaard, A., Fettweis, X., Smeets, P. C. J. P., Kuipers Munneke, P., Van Den Broeke, M., Brils, M., Langen, P. L., Mottram, R., and Ahlstrøm, A. P.: Historical snow and ice temperature compilation documents the recent warming of the Greenland ice sheet, EGU General Assembly 2023, Vienna, Austria, 23–28 Apr 2023, EGU23-9080, https://doi.org/10.5194/egusphere-egu23-9080, 2023.

EGU23-12495 | ECS | PICO | CR2.3

Radar forward modelling as a precursor for statistical inference 

Leah Sophie Muhle, Guy Moss, A. Clara J. Henry, and Reinhard Drews

Projections of the future development of the Antarctic Ice Sheet still exhibit a large degree of uncertainty due to difficulties in constraining parameters of ice-flow models such as basal boundary conditions. Deriving better estimates of these parameters from radargrams could greatly improve model accuracy, but integration of inferred radar attributes into ice-flow models is not yet widespread.

Here, we develop a radar forward modeling framework that is geared to train a machine learning workflow (likely simulation-based inference) to extract radar attributes such as the internal stratigraphy and basal boundary conditions (e.g., frozen vs. wet) from radar data. The workflow starts with ice-dynamic forward models predicting physically sound stratigraphies and internal/basal temperatures for synthetic flow settings using shallow ice, shallow shelf and higher order ice-flow models. This is then used as input to the radar simulator (here gprMax), which calculates the radar image produced by such a stratigraphy. To do so, we match the synthetic permittivities of the modeled stratigraphy with statistical properties known from ice-core logging data and prescribe temperature dependent attenuation via an Arrhenius relation. gprMax is optimized for acceleration using GPUs which can be efficiently employed when solving the FDTD discretized Maxwell equations. Currently, 200 m wide and 500 m deep sections can be simulated on a single NVIDIA GeForce RTX 2070 Super graphics card within 390 minutes. The runtime can be substantially improved in a HPC environment. In order to obtain radar simulations comparable with observations, we also add system specific noise and contributions from volume scattering with variable surface roughness. Here, we focus on 50 MHz pulse radar for which we have many observational counterparts. However, the workflow is designed to encompass multiple ice-dynamic settings and different radar frequencies.

The application of physical forward models will result in physically meaningful radargrams which are indistinguishable from observations. This provides a tool to create datasets for training machine learning workflows for inference without the limitations of hand-labeled data.

How to cite: Muhle, L. S., Moss, G., Henry, A. C. J., and Drews, R.: Radar forward modelling as a precursor for statistical inference, EGU General Assembly 2023, Vienna, Austria, 23–28 Apr 2023, EGU23-12495, https://doi.org/10.5194/egusphere-egu23-12495, 2023.

EGU23-12553 | ECS | PICO | CR2.3

At the bottom of ice streams: unraveling the physics of sliding onset through a glacier-scale field experiment 

Elisa Mantelli, Reinhard Drews, Olaf Eisen, Daniel Farinotti, Martin Luethi, Laurent Mingo, Dustin Schroeder, and Andreas Vieli

Fast ice stream flow at speeds of hundreds to thousands of meters per year is sustained by sliding at the ice sheet base, whereas slow flow outside of ice streams is characterized by limited-to-no basal sliding. In this sense, the transition from no sliding to significant sliding exerts a key control on ice stream flow. The detailed physical processes that enable the onset of basal sliding are somewhat debated, but laboratory experiments, recent theoretical work, and a handful of direct observations support the notion of sliding initiating below the melting point as a result of regelation and premelting. 

In this contribution we describe a recently funded glacier-scale field experiment that has been designed to advance the understanding of sliding onset physics by testing the hypothesis that sliding starts below the melting point. The experiment will take place at the Grenzgletscher (Swiss Alps), which is known to have a cold-based accumulation region and a temperate-based ablation region. Our work will involve extensive surface geophysics (radio echo sounding, terrestrial radar interferometry, radar thermal tomography) aimed at identifying the sliding onset region. This work will guide the site selection for a subsequent borehole study of englacial deformation that is meant illuminate the relation between sliding velocity and basal temperature. The borehole work will allow us to test systematically the hypothesis that sliding starts below the melting point through an extended region of temperature-dependent sliding, and possibly to advance the formulation of temperature-dependent friction laws that are used to describe the onset of sliding in ice flow models.

The focus of this contribution will be specifically on the experimental design - how it is informed by existing theory and observations, and how it will support theoretical and ice flow modeling advances, at the glacier scale and beyond.

How to cite: Mantelli, E., Drews, R., Eisen, O., Farinotti, D., Luethi, M., Mingo, L., Schroeder, D., and Vieli, A.: At the bottom of ice streams: unraveling the physics of sliding onset through a glacier-scale field experiment, EGU General Assembly 2023, Vienna, Austria, 23–28 Apr 2023, EGU23-12553, https://doi.org/10.5194/egusphere-egu23-12553, 2023.

EGU23-14292 | ECS | PICO | CR2.3

Bias correction of climate models using observations over Antarctica. 

Jeremy Carter, Erick Chacón Montalván, and Amber Leeson

Regional Climate Models (RCM) are the primary source of climate data available for impact studies over Antarctica. These climate-models experience significant, large-scale biases over Antarctica for variables such as snowfall, surface temperature and melt. Correcting for these biases is desirable for impact models being driven by meteorological data that aim to produce optimal estimates of for example surface run-off and ice discharge. Typical approaches to bias correction often neglect the handling of uncertainties in parameter estimates and don’t account for the different supports of climate-model and observed data. Here a fully Bayesian approach using latent Gaussian processes is proposed for bias correction, where parameter uncertainties are propagated through the model. Advantages of this approach are demonstrated by bias-correcting RCM output for near-surface air temperature over Antarctica.

How to cite: Carter, J., Chacón Montalván, E., and Leeson, A.: Bias correction of climate models using observations over Antarctica., EGU General Assembly 2023, Vienna, Austria, 23–28 Apr 2023, EGU23-14292, https://doi.org/10.5194/egusphere-egu23-14292, 2023.

EGU23-15374 | ECS | PICO | CR2.3

Reconstructing accumulation rates of the Greenland ice sheet using dated radiostratigraphy 

Philipp Immanuel Voigt and Andreas Born

The stability of the Greenland ice sheet is poorly constrained even for benchmark periods such as the mid-Holocene or Eemian. Since ice stratigraphy holds a record of both surface mass balance (SMB) and ice dynamics, dated radiostratigraphy offer a potential route to improved reconstructions. Here we explicitly simulate isochrones and employ inverse methods to optimize the solution. The Englacial Layer Simulation Architecture (ELSA) coupled with a thermomechanical ice sheet model computes the isochrones or ice layers, which enable the direct comparison with the radiostratigraphy data. The accumulation rates force ELSA, and are adjusted until the model reproduces the observations within their uncertainties. We deploy the Ensemble Kalman Smoother for the data assimilation. This results in not only the reconstruction of the SMB; an optimized simulation of the ice sheet is obtained by solving the corresponding forward problem. Hence, the contribution to sea level change by Greenland over the same period can also be constrained.

Here we present our initial approach and preliminary results of SMB reconstruction. Future plans and expansions of the work are also presented, involving the study of several model parameters such as basal traction.

How to cite: Voigt, P. I. and Born, A.: Reconstructing accumulation rates of the Greenland ice sheet using dated radiostratigraphy, EGU General Assembly 2023, Vienna, Austria, 23–28 Apr 2023, EGU23-15374, https://doi.org/10.5194/egusphere-egu23-15374, 2023.

EGU23-1712 | ECS | PICO | BG3.8 | Highlight

Evaluation of Hargreaves method for calculation of reference evapotranspiration in selected stations of Slovakia 

Viera Rattayová, Marcel Garaj, Mirowslav Kandera, and Kamila Hlavčová

Evapotranspiration has an essential role in the hydrological cycle by affecting the volume of surface runoff and the amount of available water on the land. It is an input parameter for many hydrological models based on water balance; it is an important parameter for calculating agricultural land irrigation and water management. In the current hydrology, the role of evapotranspiration is increasingly important because of global warming and the increasing occurrence of drought. Many methods for evaluating drought are based on the value of Actual evapotranspiration, which is not directly measured, and data about this variable are not available from a national database. For this reason, the Reference evapotranspiration, which can be calculated from more frequently measured meteorological variables, is gaining in importance. FAO Penman-Monteith (P-M) method is a method for the calculation of Reference Evapotranspiration recommended by many international organizations and worldwide used by researchers like reference method in research. However, the high demand for required P-M method input meteorological parameters caused its difficult usability in the case of research covering large regions. For this reason, the methods less demanding on inputs for reference evapotranspiration calculation were derived. The accuracy of this method is necessary to verify in local conditions.

This research aims to describe the spatial and temporal distribution of reference evapotranspiration and evaluate the Hargreaves method accuracy in the selected stations of Slovakia. The punctuality of the Hargreaves method showed a positive correlation with the increasing altitude of the Climatological station. The correlation coefficient of P-M and Hargreaves reaches more accuracy in comparing monthly values for all Climatological stations. The results bring information about the usability of the Hargreaves method in different conditions, which is mainly essential for hydrological modelling.

This publication is the result of the project implementation: „Scientific support of climate change adaptation in agriculture and mitigation of soil degradation” (ITMS2014+ 313011W580) supported by
the Integrated Infrastructure Operational Programme funded by the ERDF; and was supported by the Slovak Research and Development Agency under Contract No. APVV-18-0347; and grant number VEGA 1/0782/21.

How to cite: Rattayová, V., Garaj, M., Kandera, M., and Hlavčová, K.: Evaluation of Hargreaves method for calculation of reference evapotranspiration in selected stations of Slovakia, EGU General Assembly 2023, Vienna, Austria, 23–28 Apr 2023, EGU23-1712, https://doi.org/10.5194/egusphere-egu23-1712, 2023.

Forests are increasingly exposed to extreme global warming-induced climatic events. However, the immediate and carry-over effects of extreme events on forests are still poorly understood. Using eddy covariance data from 34 forest sites in the Northern Hemisphere, we analyzed the responses of ecosystem gross primary productivity capacity under light saturation (GPP2000) of forest ecosystems to late spring frost (LSF) and growing season drought. The immediate and carry-over effects of frost and droughts on needle-leaf (NF) and broadleaf (BF) forests were analyzed. Path analysis was applied to reveal the plausible reasons behind the varied responses of forests to extreme events. The results show that LSF had clear immediate effects on the GPP2000 of both NF and BF. However, GPP2000 of NF was more sensitive to drought than that of BF. There was no interaction between LSF and drought in either NF or BF; instead, drought effects were masked by the LSF effect in NF. Path analysis further showed that the response of GPP2000 to drought differed between NF and BF, mainly due to the difference in the sensitivity of canopy conductance. Moreover, LSF had a more severe and long-lasting carry-over effect on forests compared to drought. These results enrich our understanding of the mechanisms of forest response to extreme events across forest types.


How to cite: Chen, L.: Immediate and carry-over effects of late spring frost and growing season drought on forests in the Northern Hemisphere, EGU General Assembly 2023, Vienna, Austria, 23–28 Apr 2023, EGU23-2442, https://doi.org/10.5194/egusphere-egu23-2442, 2023.

EGU23-3342 | PICO | BG3.8 | Highlight

What are the effects of forests on the hydrological cycle in connection with the changing climate? 

Bence Bolla and Bálint Horváth

In the effort to successfully sustain the forests in Hungary: the most important limitation factors are the available water sources and the climate conditions. As the expected effects of the climate change (e.g.: decrease of precipitation in the vegetation period, the increase in frequency of the extreme intensity precipitation events, increase of the length of drought periods, increase of the evapotranspiration due to the mean temperature increase) this will be an increasing challenge to the forest managers in future. The forest stands have an ability to reduce the temperature, increase the humidity and soften the drying effect of the strong wind. So, the protection of our forest stands will become the one of most important tasks in our future. Thus, the research of the interconnection between the forests and the hydrological cycles is an urgent meanwhile difficult task due to the complexity of these systems. Our recent work presents the main conclusions of the recent drought period by our hydro-meteorological system.

Acknowledgements:

This article was made in frame of the project TKP2021-NKTA-43 which has been implemented with the support provided by the Ministry of Innovation and Technology of Hungary (successor: Ministry of Culture and Innovation of Hungary) from the National Research, Development and Innovation Fund, financed under the TKP2021-NKTA funding scheme.

How to cite: Bolla, B. and Horváth, B.: What are the effects of forests on the hydrological cycle in connection with the changing climate?, EGU General Assembly 2023, Vienna, Austria, 23–28 Apr 2023, EGU23-3342, https://doi.org/10.5194/egusphere-egu23-3342, 2023.

The combination of flash droughts and high temperature may have a significant effect on the ecosystem because of the soil and atmospheric moisture deficits. However, the stress of soil and atmospheric moisture deficits on carbon and water use of the ecosystem during flash droughts, particularly during the drought periods with hot conditions, are unclear over a large region. In this study, we decoupled the atmospheric and soil water stress over eastern China by using vegetation remote sensing products during flash droughts and their sub-periods that are accompanied by high temperature and intense radiation. The results showed that soil moisture (SM) stress on gross primary productivity (GPP) was significantly greater than the vapor pressure deficit (VPD) stress over eastern China, especially in humid area. In contrast, the atmospheric water stress in the North China Plain was more significant. By excluding the radiation effect, high VPD dominated the water stress on light use efficiency (LUE) in over 55% of the areas during flash droughts. For the hot periods of flash droughts, the GPP subject to VPD stress increased from 8% to 36% of the areas, especially in semi-arid and semi-humid regions. The concurrent hot and drought conditions also increased water use efficiency (WUE) for most areas. Moreover, the effect of water stress on LUE and WUE was similar to that during flash droughts. The reason may be that during hot periods of flash drought, the rise in VPD led to a decrease in vegetation stomatal conductance, which further reduced GPP, photosynthetically active radiation absorbed by vegetation and evapotranspiration at the similar rate.

How to cite: Xi, X. and Yuan, X.: Atmospheric and soil water stress on ecosystem carbon and water use during flash droughts, EGU General Assembly 2023, Vienna, Austria, 23–28 Apr 2023, EGU23-4061, https://doi.org/10.5194/egusphere-egu23-4061, 2023.

EGU23-5311 | ECS | PICO | BG3.8

Evaluating the erosion risk using the USLE tool in a small agricultural area 

Matúš Tomaščík, Michaela Danáčová, Jana Grečnárová, Roman Výleta, and Kamila Hlavčová

Abstract

USLE (Universal Soil Loss Equation) was used as a standard tool for evaluating Slovakia's water erosion risk. Understanding interactions between land cover, land use management, and topographical properties of the land are essential to effectively control soil erosion by implementing best management practices. Two ways for LS factor calculation are recommended for use in practice. The first way is in the computing method based on the USLE 2D software, and the second is the other computing algorithms. Various forms can assess the LS factor but with different results. This article aimed to show the differences in LS factor assessment methods in the Myjava Hills – Sobotište study area, a small agricultural area strongly threatened by water erosion. All in two variants before and after the application of anti-erosion measures (water retention grass ditch). Changes in the LS factor were directly indicated in calculating the long-term average soil loss by water erosion. After applying a complex system of anti-erosion measures, results show a significant reduction of the mean long-term soil loss by water erosion in both comparisons.

Keywords: USLE, LS factor, anti-erosion measures, soil loss

Acknowledgement: This study was supported by PhD student project LABEX. The study was also supported by the VEGA grant agency under the contract numbers VEGA 1/0632/19.

How to cite: Tomaščík, M., Danáčová, M., Grečnárová, J., Výleta, R., and Hlavčová, K.: Evaluating the erosion risk using the USLE tool in a small agricultural area, EGU General Assembly 2023, Vienna, Austria, 23–28 Apr 2023, EGU23-5311, https://doi.org/10.5194/egusphere-egu23-5311, 2023.

EGU23-5669 | PICO | BG3.8

Analysis of changes in long-term mean annual discharge in Slovakia 

Katarina Jeneiova, Jana Poorova, Zuzana Danacova, Katarina Melova, and Katarina Kotrikova

As the climate change and the research surrounding it intensifies, the assessment of the hydrological regime for the decision making processes also gains significance, as the design values are directly used for example for floods and droughts management.

In this contribution we have analysed changes in the long-term mean annual discharges at 113 water gauging stations with long term observations in the period 1961-2020 over different time periods. To identify potential changes in the hydrological regime, the analysis was focused on the comparison of the 10, 20, 30, 40, 50-year long moving averages of the long-term mean annual discharges in the period 1961-2020 in comparison with the 1961-2000 reference period currently used in Slovakia for calculation of design values.

The results point out that the new reference period to be used for calculating design values in Slovakia should include the time period after the year 2000, but to determine its precise length, more detailed analysis, especially in the area of the low flows, is needed.

Acknowledgement: This work was supported by the Slovak Research and Development Agency under the Contract no. APVV-20-0374.

How to cite: Jeneiova, K., Poorova, J., Danacova, Z., Melova, K., and Kotrikova, K.: Analysis of changes in long-term mean annual discharge in Slovakia, EGU General Assembly 2023, Vienna, Austria, 23–28 Apr 2023, EGU23-5669, https://doi.org/10.5194/egusphere-egu23-5669, 2023.

EGU23-5986 | ECS | PICO | BG3.8 | Highlight

Effect of biochar application on soil hydrophysical properties and erosion potential 

Peter Roncak, Zuzana Nemetova, Justina Vitkova, Natalia Botkova, and Lucia Tokova

Biochar application is considered a beneficial strategy for improving soil ecosystem services and also takes place in carbon sequestration, decreasing greenhouse gas emissions, renewable energy, elimination of waste, and as a soil remedy. The literature reports that, in general, biochar application reduces runoff by 5-50% and soil loss by 11-78%, suggesting that it may be effective in reducing water erosion, but the extent of erosion reduction is highly variable. The main mechanism by which biochar can reduce water erosion is by improving soil properties (i.e., organic carbon, hydraulic conductivity, aggregate stability) that affect soil erodibility.
The subject of this study is the application of a relatively new approach to estimating soil erosion in small catchment using the physically-based erosion Erosion-3D model. The model has been developed as a physically-based model for predicting soil erosion by water on agricultural land, amount of runoff and sediment concentration.  Erosion-3D model is predominantly built on physical principles and simulates surface runoff, erosion, deposition and separation of soil particles for individual events and provides a beneficial tool for simulating and quantifying soil erosion.
The impact of biochar application on soil water erosion was determined for several scenarios in order to cover various condition and reflect the answer of biochar application to different soil properties. Based on the results, it can be concluded that the application of biochar has a positive effect on erosion activity to a certain extent.
The positives and negatives of biochar application to different soil properties were identified and provide a useful basis for further research.

Keywords: Erosion 3D model, biochar, soil water erosion, physically-based model

This article was created with financial support from the project of the Scientific Grant Agency VEGA 2/0155/21.

How to cite: Roncak, P., Nemetova, Z., Vitkova, J., Botkova, N., and Tokova, L.: Effect of biochar application on soil hydrophysical properties and erosion potential, EGU General Assembly 2023, Vienna, Austria, 23–28 Apr 2023, EGU23-5986, https://doi.org/10.5194/egusphere-egu23-5986, 2023.

EGU23-6179 | ECS | PICO | BG3.8 | Highlight

A vine copula-based approach for constructing nonparametric synthetic design flood hydrographs 

Anna Liová, Roman Výleta, Kamila Hlavčová, Silvia Kohnová, Tomáš Bacigál, and Ján Szolgay

Reliable flood risk management needs to correctly estimate and design the size of volumes in reservoirs, spillways of dams and flood levees. To design secure and well-serving hydraulic structures, we often need to use design flood hydrographs that allow a sufficient description of the impacts of flood events in many cases.

In this study, a methodology is proposed based on using both empirical and statistical approaches for constructing nonparametric synthetic design flood hydrographs. It is based on flood hydrographs that are observed in the hourly discharge time series, in which is respected the dependence among the peaks, volumes and duration of a set of observed seasonal flood hydrographs. The method consists of seasonality analysis of floods, sampling of seasonal flood hydrographs, normalization of the hydrographs into flood fragments, dependence modelling of peaks, volumes and durations using the vine copulas, rescaling of hydrograph fragments with the appropriate design flood into synthetic design hydrographs and determining the joint conditional return period of the flood volume and the duration conditioned on the flood peak for each synthetic hydrograph.

By that, the designer is furnished with a set of design flood hydrographs, which have diverse shapes, volumes, and durations for a selected design discharge with a known joint conditional return period of the volumes and durations for flood risk analysis.  The method was tested and carried out on gauged discharge data from the Horné Orešany reservoir in the watershed of the Parná river in Slovakia. Using flood regionalization approaches can be this method also applicable to ungauged catchments.


Acknowledgements:

This study was supported by PhD student project SYLUETI.  The study was also supported by the Slovak Research and Development Agency under Contract No. APVV-20-0374.

How to cite: Liová, A., Výleta, R., Hlavčová, K., Kohnová, S., Bacigál, T., and Szolgay, J.: A vine copula-based approach for constructing nonparametric synthetic design flood hydrographs, EGU General Assembly 2023, Vienna, Austria, 23–28 Apr 2023, EGU23-6179, https://doi.org/10.5194/egusphere-egu23-6179, 2023.

EGU23-6181 | PICO | BG3.8 | Highlight

Comparison of spatial and temporal future changes of hydrological regime in selected river basins of Slovakia 

Zuzana Sabová, Zuzana Németová, and Silvia Kohnová

Changes in the hydrological cycle are increasingly influenced by climate change. Every year, droughts and floods increase and strongly threaten the landscape, buildings, human settlements and lives. Climate data from climate scenarios are used to predict extreme events in the future. Many methods can process the climate data and evaluate the hydrological characteristics, according to which it is possible to determine the changes in the hydrological regime in the landscape.

The paper aims to characterize future changes in the hydrological regime for eight selected basins of Slovakia, which were divided into four groups according to location, i.e., eastern Slovakia, northern Slovakia, central Slovakia, and western Slovakia. The input data include mean daily discharges and are divided into four groups. The first group consists of observed daily discharges provided by the Slovak Hydrometeorological Institute and represents the reference period from 1981 to 2010. The second group generates mean daily discharges using the HBV type TUW rainfall-runoff model in 1981-2010. The third and fourth groups simulate mean daily discharges using the meteorological inputs from the KNMI and MPI climate scenarios, containing data from 1981 to 2100. The available data were inputs to The Indicators of Hydrologic Alteration program, and subsequent analyses are focused on mean monthly discharges, M-day minimum and maximum discharges, the occurrence of maximum and minimum discharge, and baseflow index. For assessing the future changes in hydrological regime characteristics, the reference and future period 2070-2100 were compared.

The results indicated that the spring's most significant decrease in mean monthly discharges occurred in eastern Slovakia. Summer is characterized by a decrease in mean monthly discharges throughout Slovakia, especially in eastern Slovakia. In eastern Slovakia, a decrease in selected M-day minimum discharges is also expected. Minor changes are expected in the characteristics of the 90-day minimum discharge Q90d in the Topľa – Hanušovce and Topľou gauging station. The most significant changes can be expected in the Laborec - Humenné gauging station, where the 90-day minimum discharge Q90d can decrease by up to 38% compared to the reference period. The results show a rise of M-day maximum discharges of up to 50% in the gauging stations in the eastern part of Slovakia. The minimum discharge is shifted from November/January to October and the maximum from March to February/March.

According to the increasing base flow index, the Váh River basin will have the best conditions for maintaining minimum discharges in drier periods. In the other basins, the values of the baseflow index decrease.

An increase in mean monthly discharges may indicate future, increasing precipitation in given basins, predominantly in liquid form, or, on the other hand, increasing temperatures that can eliminate snow cover.


Acknowledgement:

This study was supported by PhD student project ARPMP. The study was also supported by the Slovak Research and Development Agency under Contract No. APVV-20-0374.

How to cite: Sabová, Z., Németová, Z., and Kohnová, S.: Comparison of spatial and temporal future changes of hydrological regime in selected river basins of Slovakia, EGU General Assembly 2023, Vienna, Austria, 23–28 Apr 2023, EGU23-6181, https://doi.org/10.5194/egusphere-egu23-6181, 2023.

EGU23-6334 | ECS | PICO | BG3.8

Exploring the impact of satellite products on the calibration of the conceptual hydrological model 

Milica Aleksić, Martin Kubáň, Lynda Paulíková, Kamila Hlavčová, and Ján Szolgay

The observations made from satellite technology enable more and more scientific communities to test and rely on this kind of product. Moreover, data acquired from satellite products is of great use regarding conceptual hydrological modeling. This study represents the process of testing the advanced scatterometer (ASCAT) remote sensing product-ASCAT SWI. In regions with little or no data, soil moisture products have significant value. They represent the relationship between surface and root zone soil moisture as a function of time. SWI represents the soil moisture content equal to a soil depth of 1 meter represented in percentage (%), with a minimum of 0% and a maximum value of soil moisture at 100% of soil capacity. In this study, the tested data in focus are soil moisture data with changing values of modeled water infiltration into the different soil layers (T). In addition to these data, the hydrometeorological data are used for hydrological modeling. These are data from water gauge stations such as runoff values (Q), precipitation (P), air temperature (T), and potential evapotranspiration (PET). All the data used in the hydrological model represent the time series from 01.01.2007 to 31.12.2019. The spatial resolution of the datasets is 500x500 meters, and the temporal resolution is one day. Calibration was performed using the lumped hydrological model developed at Technical University in Vienna-TUWdual. Areas of interest in modeling are selected catchments in Slovakia with various land use and height above sea level. Another aim of this study is to test the correlation between the measured soil moisture and the modeled one using the TUWdual model. The expected outcome of the study should point out the catchment areas that would benefit more from the additional data on satellite soil moisture in Slovakia.


Acknowledgment: This study was supported by a Ph.D. student project HYDRODIAĽ.

How to cite: Aleksić, M., Kubáň, M., Paulíková, L., Hlavčová, K., and Szolgay, J.: Exploring the impact of satellite products on the calibration of the conceptual hydrological model, EGU General Assembly 2023, Vienna, Austria, 23–28 Apr 2023, EGU23-6334, https://doi.org/10.5194/egusphere-egu23-6334, 2023.

EGU23-6366 | ECS | PICO | BG3.8

The elimination of climatic extremes using vertical gardens in densely urbanised areas 

Martina Majorošová and Miriam Zaťovičová

This case study focuses on climate change adaptation strategy for densely urbanised areas. The phenomenon of heavy urbanization has significantly intensified during the last decades. Building constructions are still expanding, resulting in the decline or even elimination of green spaces. Not only does it cause the eradication of green spaces, but it also prevents unbuilt areas from the further development of green infrastructure. The pressure of developers urges the maximum use of urban areas for financial profit at the expense of greenery, which does not generate such profit. However, the benefits of greenery on human health are more significant, hence it is necessary to educate the public about these positive aspects and create and promote adaptation strategies for climate change. Furthermore, hydrological extremes are increasingly and more regularly repeating during the year, and it is necessary to create a green infrastructure to mitigate the impacts of these extremes. In severely and densely urbanised spaces, such as the historic city centres, there is no longer an option to provide areas for the possible further creation of green spaces. Therefore, in this case study we focused on the possibility of creating green infrastructure using the vertical gardens and bringing all the benefits of green spaces to vertical dimension, which does not require any land space. The example of the Old Town district of Bratislava, Slovakia was used in this case study. This proposal presents a selection of possible spaces for the creation of vertical gardens, which are also designed as an information system for visitors navigating them from major transport hubs to the city centre.

How to cite: Majorošová, M. and Zaťovičová, M.: The elimination of climatic extremes using vertical gardens in densely urbanised areas, EGU General Assembly 2023, Vienna, Austria, 23–28 Apr 2023, EGU23-6366, https://doi.org/10.5194/egusphere-egu23-6366, 2023.

EGU23-7340 | PICO | BG3.8

Analysis of erosion drivers in the Hydrological Open Air Laboratory Petzenkirchen 

Gerhard Rab, Carmen Krammer, Thomas Brunner, Elmar Schmaltz, Borbála Széles, Günter Blöschl, and Peter Strauss

Soil erosion and sediment loading are mainly caused by extreme events with rare occurrence. Thus, long term observation is necessary for identification of causes and factors that trigger the erosion process and lead to the generation of river sediment.

To investigate the main drivers of erosion in the catchment of the Hydrological Open Air Laboratory (HOAL) Petzenkirchen, we performed time series analyses for the period of 2002-2022, including agricultural land use, precipitation, discharge and sediment load with high temporal and spatial resolution. The HOAL Petzenkirchen, located in the alpine forelands of Lower Austria, extends to 66 ha and is mainly used for intensive agriculture.

To highlight the effect of heavy precipitation events, a 100-year flood event that occurred in 2021 is analysed in detail to demonstrate the immense impact of such events on the sediment loading.

How to cite: Rab, G., Krammer, C., Brunner, T., Schmaltz, E., Széles, B., Blöschl, G., and Strauss, P.: Analysis of erosion drivers in the Hydrological Open Air Laboratory Petzenkirchen, EGU General Assembly 2023, Vienna, Austria, 23–28 Apr 2023, EGU23-7340, https://doi.org/10.5194/egusphere-egu23-7340, 2023.

EGU23-8592 | ECS | PICO | BG3.8 | Highlight

Isotopic hydrograph separation in the Hydrological Open Air Laboratory, Austria 

Borbála Széles, Ladislav Holko, Juraj Parajka, Stefan Wyhlidal, Katharina Schott, Christine Stumpp, Michael Stockinger, Patrick Hogan, Lovrenc Pavlin, Gerhard Rab, Peter Strauss, and Günter Blöschl

The rainfall-runoff process transforms a precipitation input to a catchment into runoff output and is an important indicator for river water quality and quantity. Since runoff events are comprised of precipitation event water and stored pre-event water of the catchment, exploring the event and pre-event components of runoff events using the stable isotopes of water (δ18O, δ2H) and two-component and ensemble isotopic hydrograph separation may further our insights into overall catchment behaviour and the origin of water. The aim of this study is to investigate the origin of water for different streamflow gauges in a small agricultural catchment that represent different runoff generation mechanisms. The analysis is performed at the Hydrological Open Air Laboratory (HOAL) in Austria, which is a 66 ha experimental catchment dominated by agricultural land use. One of the main features of this research catchment is that several tributaries of the catchment representing different runoff generation mechanisms are gauged. Two-component and ensemble isotopic hydrograph separations (for both δ18O and δ2H) are conducted for three streamflow gauges (the catchment’s inlet and outlet and a tile drainage system) for multiple events in the warm periods of 2013-2018. The results of the two methods are compared and discussed for different runoff generation mechanisms.

How to cite: Széles, B., Holko, L., Parajka, J., Wyhlidal, S., Schott, K., Stumpp, C., Stockinger, M., Hogan, P., Pavlin, L., Rab, G., Strauss, P., and Blöschl, G.: Isotopic hydrograph separation in the Hydrological Open Air Laboratory, Austria, EGU General Assembly 2023, Vienna, Austria, 23–28 Apr 2023, EGU23-8592, https://doi.org/10.5194/egusphere-egu23-8592, 2023.

EGU23-8647 | PICO | BG3.8 | Highlight

Assessment of climate change impacts and anthropogenic activities on the eastern part of the Nile Delta of Egypt 

Hany Abd-Elhamid, Martina Zeleňáková, Abd Elnaby Kabeel, Mohamed Mahdy, Jacek Barańczuk, and Katarzyna Barańczuk

Abstract 

Climate change and anthropogenic activities could have extensive impacts of coastal areas especially Deltas and lowlands that may be extremely affected by sea level rise and different human activities. According to the IPCC reports, the mean sea levels have been raised between 10 to 20 cm over the last century and expected to rise between 20 to 88 cm at the end of the current century. If no actions are taken, this rise could have extensive effects on coastal areas such as shoreline erosion, submergence of coastal cities and increasing the seawater intrusion into coastal aquifers. Also, anthropogenic activities including changes in the land use could increase such effects. This study aims to highlight the effect of climate change and anthropogenic activities on the Nile Delta of Egypt. The study focusses on the eastern part of the Nile Delta (Port Said governorate) where many changes in the land use have been observed in the last decades. The effect of climate change and anthropogenic activities on the Nile Delta are detected using GIS, RS data and numerical models. The Digital Shoreline Analysis System (DSAS) with ArcGIS are used in monitoring the shoreline change (SLC) based on satellite images for 50 years from 1974 to 2023. GIS is used to monitor shoreline changes and forecast future changes for the next 10 and 20 years. The results indicated that the shoreline had shifted inland with varying values along the coasts between 1974 and 2023, and the predictions indicated that it would continue to shift in 2034 and 2044. The rate of shoreline loss was 14 m/year from 1974 to 2000 and 16 m/year from 2001 to 2023 and predicted to be 12 m/year from 2023 to 2044. RS and GIS are used for investigating the land use changes (LUC) over the last 50 years for the period from 1974 to 2023 based on satellite images that were geometrically corrected by Supervised Classification to identify LUC in the Nile Delta. The results for the study period from 1974 to 2023 (50 years) reveal that urbanization has increased 18%, vegetation cover has increased 22%, water bodies and fish farms increased 40% and the bare land decreased 60% due to the development of the area in the studied period. The Eastern part of the Nile Delta is enormously affected by climate change and anthropogenic activities which require application of protection measures. Significant changes in shoreline and land cover for the study area were observed in the period from 1974 to 2023. Policy makers may use the results of this study to develop adaptation plans to safeguard the Nile Delta from anthropogenic activities and climate change.

Keywords: Climate change, anthropogenic activities, shoreline change (SLC), land use change (LUC), RS and GIS, Nile Delta of Egypt.

How to cite: Abd-Elhamid, H., Zeleňáková, M., Kabeel, A. E., Mahdy, M., Barańczuk, J., and Barańczuk, K.: Assessment of climate change impacts and anthropogenic activities on the eastern part of the Nile Delta of Egypt, EGU General Assembly 2023, Vienna, Austria, 23–28 Apr 2023, EGU23-8647, https://doi.org/10.5194/egusphere-egu23-8647, 2023.

In recent years, the changing weather patterns caused by climate change have already impacted the population, but in 2022, these weather extremes surpassed the ones of previous years. Severe droughts across Europe posed significant challenges, primarily through water scarcity and caused severe (security of supply and economic) damages to different societal sectors. Drier summers and warmer, snow-less winters significantly change the water cycle and thus the amount of naturally retained rainwater on site. A long-term, sustainable solution is the widespread implementation of nature-based solutions.

The Lake Velence watershed in Hungary has been showing signs of drying up for years. To implement nature-based solutions, the catchment's natural features, the stakeholders' general requirements, the economic opportunities, and possible benefits must be incorporated. Small- and large-scale agricultural activities face a growing deficit in irrigation water, while the surrounding settlements of Lake Velence can collect a significant amount rainwater. The research focuses on the potential amount of rainwater that can be collected in the selected hilly settlements, it’s uses, and its ability to generate additional income. We evaluated the costs and benefits of implementing or non-implementing nature-based solutions based on the extent of rainwater usage. Using basic calculations of the area's present and possible future cultivation/agricultural activities, we examined the impacts of blue-green infrastructures on local GDP through a lost profit versus available surplus income comparison.

How to cite: Kalman, A. and Bene, K.: Financial benefits from the implementation of nature-based solutions in the settlements – a case study on a catchment of Lake Velence, EGU General Assembly 2023, Vienna, Austria, 23–28 Apr 2023, EGU23-9476, https://doi.org/10.5194/egusphere-egu23-9476, 2023.

EGU23-12726 | ECS | PICO | BG3.8

Increasing ENSO variability synchronizes tree growth in subtropical forests 

Jiajia Su, Xiaohua Gou, Janneke HilleRisLambers, David Zhang, Wuji Zheng, Mingmei Xie, and Rubén Manzanedo

Rising El Niño–Southern Oscillation (ENSO) variability is expected to influence Earth’s forest ecosystems, through changes in how coordinated annual tree growth is across large spatiotemporal scales. However, the mechanisms by which changes in ENSO variability affect tree growth remains poorly understood, especially in understudied subtropical forests. We use a newly built tree ring network collected from 4,028 trees at 144 forest locations across East Asian subtropical forests (EASF) at subcontinental scales (∼2,000 km), to assess long-term influences of ENSO on the spatiotemporal variability in tree radial growth across China. Our results demonstrate a west-east dipole pattern of synchronized tree growth in EASF moisture-limited tree populations, with positive growth responses to El Nino in southeastern China, and negative growth responses in the southwestern China. Specifically, trees grew more in El Niño years in eastern populations, but less in western populations. This pattern likely results from the contrasting effects of ENSO on drought limitation along a longitudinal gradient. Our results also show that increasingly severe El Niño/La Niña years have caused a sharp rise in tree growth coherence over past 150 years in these moisture-limited populations. A further increase in climate variability, as is expected with climate change, could destabilize subtropical forest ecosystems by synchronizing tree growth to an unprecedented level. In all, our results highlight the need for further research on the ecological implications of rising synchrony, given its increasing relevance to global forest ecosystems in a time of rising climate variability.

How to cite: Su, J., Gou, X., HilleRisLambers, J., Zhang, D., Zheng, W., Xie, M., and Manzanedo, R.: Increasing ENSO variability synchronizes tree growth in subtropical forests, EGU General Assembly 2023, Vienna, Austria, 23–28 Apr 2023, EGU23-12726, https://doi.org/10.5194/egusphere-egu23-12726, 2023.

EGU23-13019 | ECS | PICO | BG3.8

Groundwater transpiration of a salt steppic oak forest in the extreme dryness of 2022 

Zsombor Kele, Csaba László Kiss, Zoltán Gribovszki, Zsolt Pinke, Tamás Ács, Zsolt Kozma, and Péter Kalicz

Groundwater use of a lowland forest is especially important from the point of view forest ecosystem survival as drought periods become more severe, and the groundwater is going deeper in the Great Hungarian Plain. Diurnal methods using high frequency water table data are more and more popular nowadays to quantify groundwater consumption of groundwater dependent ecosystems. 

Riparian forest ecosystems were typical natural vegetation form alongside Great Hungarian Plain Rivers. These ecosystems were supplied by the river inundation of the river. Nowadays these forests are very rare and generally groundwater dependent. A representative of the rest of this ecosystem is a salt steppic oak forest in Ohat, on the edge of Hortobágy. Maps from the 18. century proof, that this area was continuously covered by forests before the great levee-building and water-regulation of Hungary, which drained the significant part of the Hungarian Great Plain.

The hydrological year of 2021-2022 is particularly interesting in terms of water uptake analysis because of its extreme dryness and heat.

Two groundwater wells settled in this research area and were instrumented by pressure transducers. The groundwater time series shows strong diurnal water table fluctuations, which we used for the calculation of oak forest groundwater transpiration. We found significant relationship

Forest groundwater transpiration was significant at the first part of the growing season despite the relatively deep water table. When the water table sank to a depth of 4.7-4.8 m transpiration from the groundwater reduced very significantly. The relationship between water table depth and groundwater transpiration is significantly different when comparing the years 2021 and 2022. Results showed that drought caused lowering of the water table poses a threat to the groundwater dependent forest ecosystem.

This article was made in frame of the project TKP2021-NKTA-43 which has been implemented with the support provided by the Ministry of Innovation and Technology of Hungary (successor: Ministry of Culture and Innovation of Hungary) from the National Research, Development and Innovation Fund, financed under the TKP2021-NKTA funding scheme.

How to cite: Kele, Z., Kiss, C. L., Gribovszki, Z., Pinke, Z., Ács, T., Kozma, Z., and Kalicz, P.: Groundwater transpiration of a salt steppic oak forest in the extreme dryness of 2022, EGU General Assembly 2023, Vienna, Austria, 23–28 Apr 2023, EGU23-13019, https://doi.org/10.5194/egusphere-egu23-13019, 2023.

EGU23-13030 | ECS | PICO | BG3.8

Soil moisture dynamic in the regeneration gap cutting of a hornbeam-oak stand 

Luca Félegyházi, Csenge Veronika Horváth, Bence Kovács, Péter Kalicz, and Zoltán Gribovszki

The “Pilis Lék Experiment” is taking place since 2018 as a join project of the MTA Centre for Ecological Research and Pilisi Parkerdő Zrt. A 90-year old oak-hornbeam forest is under investigation in the experimental area near Pilisszentkereszt.

Gap-cutting was applied with different sizes and shapes of gaps. The purpose of the experiment is to investigate how the shape (circular/elongated), size (small/large), method of cutting (in one/two steps) affect the microclimate of gaps and the regrowth in them. Also researched, which of the listed sizes and shape characteristics helps the preservation of biodiversity and habitat conditions of the forest the most.

In this study we analyzed the soil moisture conditions of two selected gaps and their effects.We chose gaps with the same size, but different shapes. We started working with a large circle and a large elongated gap.

The manual soil moisture mapping frequency was monthly.The field measurements were carried out with a Field Scout TDR300 soil moisture meter at the points of test transects already established.

In addition to the evaluation of soil moisture measurements and regional meteorological data, the experiment is completed by laboratory tests on soil physical parameters taken at several measurement points in the gaps.

The research investigates whether there are differences between the soil moisture conditions of the two gaps. How these differences manifest themselves and relate to the shape of gaps. The analysis also examines how dynamics of soil moisture affects the growth of oak seedlings, the composition of vegetation and the intensity of vegetation cover.

ACKNOWLEDGEMENTS: This article was made in frame of the project TKP2021-NKTA-43 which has been implemented with the support provided by the Ministry of Innovation and Technology of Hungary (successor: Ministry of Culture and Innovation of Hungary) from the National Research, Development and Innovation Fund, financed under the TKP2021-NKTA funding scheme.

How to cite: Félegyházi, L., Horváth, C. V., Kovács, B., Kalicz, P., and Gribovszki, Z.: Soil moisture dynamic in the regeneration gap cutting of a hornbeam-oak stand, EGU General Assembly 2023, Vienna, Austria, 23–28 Apr 2023, EGU23-13030, https://doi.org/10.5194/egusphere-egu23-13030, 2023.

EGU23-13412 | ECS | PICO | BG3.8

API and AWBI calculation based on precipitation data between 2017 – 2022 in the Hidegvíz Valley experimental catchment, Hungary 

Csenge Nevezi, Zoltán Gribovszki, András Herceg, Katalin Anita Zagyvai-Kiss, and Péter Kalicz

Hydro-meteorological data collection has started with automated data loggers and manual devices in the Hidegvíz Valley experimental catchment in the early 1990s. The automated instruments have been operating daily, and mostly measured three important factors: precipitation, air temperature, and air humidity. We used for calibration manual devices: a Hellmann-type ombrometer for measuring the precipitation, and a Fieldscout TDR 300 for the surface soil moisture. For further statistical analyses and future modeling, we compared daily precipitation, daily temperature, and weekly surface soil moisture datasets of two different surface covers (a riparian forest and a wet meadow) in the last five years. After pre-processing and correcting, daily precipitation and daily temperature data has been used for calculating antecedent precipitation index (API), and antecedent water balance index (AWBI), and they were compared to the surface soil moisture data. Our goal with these calculations was to determine, which index is more accurate for soil moisture estimation in case of different surface covers.

key words: data processing, tipping bucket rain gauge, API, AWBI, soil moisture

ACKNOWLEDGEMENTS: This article was made in frame of the project TKP2021-NKTA-43 which has been implemented with the support provided by the Ministry of Innovation and Technology of Hungary (successor: Ministry of Culture and Innovation of Hungary) from the National Research, Development and Innovation Fund, financed under the TKP2021-NKTA funding scheme.

How to cite: Nevezi, C., Gribovszki, Z., Herceg, A., Zagyvai-Kiss, K. A., and Kalicz, P.: API and AWBI calculation based on precipitation data between 2017 – 2022 in the Hidegvíz Valley experimental catchment, Hungary, EGU General Assembly 2023, Vienna, Austria, 23–28 Apr 2023, EGU23-13412, https://doi.org/10.5194/egusphere-egu23-13412, 2023.

EGU23-13698 | ECS | PICO | BG3.8 | Highlight

Water supply impacts on forest’s groundwater levels with water-balance analysis: a case study at Szentai forest (Hungary) 

Péter Kalicz, András Herceg, László Horváth, and Zoltán Gribovszki

Climate change can be characterized by a definite warming trend with its most significant impact on the water cycle through altering precipitation and evapotranspiration processes. The anticipated changes induce the higher water consumption of plants, thus a lower groundwater table may appear and the regeneration of groundwater-dependent forest communities are called into question. In Hungary, woodlands on the plains with high water requirements and wetlands are particularly affected.

Kaszó LIFE project is a respectable example of positive water supply interventions (for groundwater-dependent forest ecosystems). This project aimed the water supply’s improvement of the forests, small fens and grasslands at West Inner-Somogy micro-region, in the Szentai forest, utilizing log weirs and lake rehabilitation to restore the degraded habitats.

The goal of this study is the analysis of the hydrological impacts of water supply interventions on the groundwater level. In case of three different forest ecosystems water balance modeling was also carried out to analyze in a complex way the effects of the interventions.

The main conclusion of this work is that, however, the rehabilitation of lakes and the construction of new ones significantly affected the water levels in the surrounding groundwater wells, but the effects of the log weirs were undetectable.

Acknowledgement: This article was made in frame of the project TKP2021-NKTA-43 which has been implemented with the support provided by the Ministry of Innovation and Technology of Hungary (successor: Ministry of Culture and Innovation of Hungary) from the National Research, Development and Innovation Fund, financed under the TKP2021-NKTA funding scheme.

How to cite: Kalicz, P., Herceg, A., Horváth, L., and Gribovszki, Z.: Water supply impacts on forest’s groundwater levels with water-balance analysis: a case study at Szentai forest (Hungary), EGU General Assembly 2023, Vienna, Austria, 23–28 Apr 2023, EGU23-13698, https://doi.org/10.5194/egusphere-egu23-13698, 2023.

EGU23-13980 | PICO | BG3.8

Spatial and temporal water table dynamic of a common alder riparian forest 

Zoltán Gribovszki, András Herceg, Blanka Holik, Csenge Nevezi, Péter Kalicz, Tamás Bazsó, Gábor Brolly, and Katalin Anita Zagyvai-Kiss

Forested riparian areas are valuable because they are rich in biodiversity and more productive than their adjacent upland areas, but they could be threatened by drought. The groundwater level of the riparian zone is an important parameter to quantify the forest hydrological processes thus for their survival. This study examines the influence of riparian zone groundwater level dynamics on the water balance of an alder forest. 

Our research area is a streamside alder ecosystem at the eastern foothills of the Alps, in Hidegvíz Valley (Hungary) experimental catchment. We analysed the water table dynamics in the period 2017-2022 using seven manually detected groundwater wells data. In the case of a selected well, we measured groundwater levels using an automatic pressure probe with high frequency. The related meteorological parameters were also collected in the immediate vicinity of the area.

Using manually measured groundwater level data we found that in summer dry periods streamside water table fall below the level of the streambed causing the stream status changes from effluent to influent. 

Using high frequency water table data we analysed groundwater temporal dynamic and relationship with other environmental parameters seasonally. According to our calculations alder forest ecosystem groundwater transpiration is great in hot rainless periods. As a conclusion these riparian forest types can be characterised as a vulnerable ecosystem  in the changing climate because long dry periods will become more and more common in the future.

Acknowledgement: This article was made in frame of the project TKP2021-NKTA-43 which has been implemented with the support provided by the Ministry of Innovation and Technology of Hungary (successor: Ministry of Culture and Innovation of Hungary) from the National Research, Development and Innovation Fund, financed under the TKP2021-NKTA funding scheme.

How to cite: Gribovszki, Z., Herceg, A., Holik, B., Nevezi, C., Kalicz, P., Bazsó, T., Brolly, G., and Zagyvai-Kiss, K. A.: Spatial and temporal water table dynamic of a common alder riparian forest, EGU General Assembly 2023, Vienna, Austria, 23–28 Apr 2023, EGU23-13980, https://doi.org/10.5194/egusphere-egu23-13980, 2023.

EGU23-13990 | PICO | BG3.8

Assessment of the impact of expected changes in the frequency of weather patterns on extreme flows in the Upper Danube basin 

Peter Valent, Jürgen Komma, Korbinian Breinl, Miriam Bertola, Klaus Haslinger, Annemarie Lexer, Selina Thanheiser, Markus Homann, and Günter Blöschl

Several major flood events of recent years have encouraged research focused on a better understanding of climatological and hydrological causes of floods. In practice, these findings can be used in flood risk management, and in the light of ongoing climate change, also in preparing effective adaptation strategies. This study builds on the results of the Wetrax+ research project which combined a stochastic weather generator and a high-resolution fully-distributed rainfall-runoff model to produce a unique dataset of 10 000 years of hourly simulations of air temperatures, precipitations and river discharges in the Upper Danube River basin. As the generated dataset accounted for the expected changes in the frequencies and persistence of the identified weather patterns, it was used to assess the possible changes in the very extreme flows in the study basin. The length of the dataset maintained that numerous flood events that were larger than the most extreme observed floods occurred in the dataset and were available for analysis. The results indicated that on average the floods should occur sooner in the year in most of the Upper Danube sub-basins. Moreover, the frequency of floods associated with weather patterns related to heavy precipitation also increased. Despite the predictions about the future, changes in weather pattern frequencies cannot be taken for granted the results of the study can be useful in identifying the sources and causes of the most extreme floods helping those responsible to focus their mitigation efforts on certain sub-basins.

How to cite: Valent, P., Komma, J., Breinl, K., Bertola, M., Haslinger, K., Lexer, A., Thanheiser, S., Homann, M., and Blöschl, G.: Assessment of the impact of expected changes in the frequency of weather patterns on extreme flows in the Upper Danube basin, EGU General Assembly 2023, Vienna, Austria, 23–28 Apr 2023, EGU23-13990, https://doi.org/10.5194/egusphere-egu23-13990, 2023.

EGU23-14221 | ECS | PICO | BG3.8

Carbon stock of the Gemenc forest (Hungary) 

Adrienn Horváth, Dániel Szász, Pál Balázs, Péter Végh, and András Bidló

We made our investigation in the Gemenc forest, which is situated beside the Danube river near the southern border of Hungary. Mainly the Danube and in the last decades, watercourse management played a significant role in landscape evolution. Most of the area is on the saved side today, so it doesn’t get flooded. The Danube usually brings calcium carbonate to this area with its sediment. The flooded areas are built from fine sediment materials. Meadow soils rich in calcium carbonate are characteristic, and the forests of this land grow healthy here (assuming that are high-quality forest types). Farther away from the river, higher plains have sand with humus soils and Chernozem soils.

Forest ecosystems of this area are probably one of the most important members of the continental vegetation that stores carbon. Because of their size, they take huge part of the global carbon cycle. The amount of carbon stored in the soil – similar to the carbon stored in wood- and the consequences of human activities on this carbon are less known in Hungary. The reason for this is the small amount of information we have about this topic. During our examinations, we visited six Quercus petraea and Robinia pseudoacacia forests and measured the carbon stock of those forest soil besides the determination of water holding capacity. The humus content of the examined soil samples varied between 0.7 and 6.9 %. Since the study areas are no longer or rarely affected by flooding, the highest organic matter content was found in the topsoil layer for each sample. SOM content gradually decreased with depth. The effect of flooding is clearly shown by the fact that we found organic matter in the samples even in the layer below 100 cm, and in several cases, we found buried humus levels. Accordingly, the organic carbon stock of these soils may be higher than average. However, the decreasing number of floods endangers the vitality of forest stands. With less flooding, decreasing groundwater level, and an increase in the temperature at night, dew formation becomes more limited, and evaporation increases. These changes also affect the decomposition processes taking place in the soil, the circulation of nutrients, and soil respiration. Increasing temperature, the speed of decomposition, and the intensity of soil respiration increase, which can further increase the decrease in the soil's C pool.

This article was made in frame of the project TKP2021-NKTA-43 which has been implemented with the support provided by the Ministry of Innovation and Technology of Hungary (successor: Ministry of Culture and Innovation of Hungary) from the National Research, Development and Innovation Fund, financed under the TKP2021-NKTA funding scheme.

How to cite: Horváth, A., Szász, D., Balázs, P., Végh, P., and Bidló, A.: Carbon stock of the Gemenc forest (Hungary), EGU General Assembly 2023, Vienna, Austria, 23–28 Apr 2023, EGU23-14221, https://doi.org/10.5194/egusphere-egu23-14221, 2023.

EGU23-14513 | ECS | PICO | BG3.8

Historical land cover changes of the Erebe-islands forest reserve (Hungary) and their effects on carbon cycle 

Pál Balázs, Adrienn Horváth, Péter Végh, and András Bidló

In our study, we analysed the long-term land cover changes and soils of the Erebe-islands forest reserve (Hungary). The historical land cover investigation is based on digitized military survey maps dating back to the 18th century and the lately finished national ecosystem basemap. Based on the analysed map series in the core area forests first appeared in the middle of the 20th century. The buffer zone was covered by water and grassland until the first half of the 20th century. Results can contribute to the investigation of interrelations between historical land use and actual soil and vegetation properties, especially carbon storage.

This article was made in frame of the project TKP2021-NKTA-43 which has been implemented with the support provided by the Ministry of Innovation and Technology of Hungary (successor: Ministry of Culture and Innovation of Hungary) from the National Research, Development and Innovation Fund, financed under the TKP2021-NKTA funding scheme.

How to cite: Balázs, P., Horváth, A., Végh, P., and Bidló, A.: Historical land cover changes of the Erebe-islands forest reserve (Hungary) and their effects on carbon cycle, EGU General Assembly 2023, Vienna, Austria, 23–28 Apr 2023, EGU23-14513, https://doi.org/10.5194/egusphere-egu23-14513, 2023.

EGU23-14570 | ECS | PICO | BG3.8

Hydrogeological, physicochemical, and thermal conditions as drivers of faunal diversity in an urban groundwater ecosystem 

Julia Becher, Konstantin Gardt, Laura Meyer, Christian Griebler, Martina Hermann, and Peter Bayer

Shallow urban groundwater is habitat of microorganisms as well as invertebrate fauna. Both communities are assumed to be strongly influenced by multiple stressors, such as increased groundwater temperatures and enhanced local hydraulic fluctuations, acting in the urban subsurface. To date, ecological studies mainly focused on natural and arable environments, with little attention to biodiversity and the role of anthropogenic factors in urban groundwater habitats. Our project targets the subterranean regime of the city of Halle (Saale) as an ideal benchmark to explore spatial and temporal dynamics of subsurface biodiversity on the urban scale. The unique hydrogeological setting of Halle, which covers a broad range of different aquifer types, with characteristic subsurface urban warming, allows for the evaluation of selected abiotic factors related to hydraulics, hydrochemistry and temperature trends. We expect new insight into the individual and concerted role of these factors on groundwater microorganisms and fauna.

First data were collected within a field campaign in June/July 2022. Physico-chemical parameters in groundwater were recorded with a multiparameter probe at each sampling point. Hydrochemical analysis including major anions and dissolved organic carbon (DOC) was conducted with the water samples from the wells and freshly pumped groundwater. Groundwater animals were collected from the bottom of the wells with a net sampler. Animals were sorted and counted at the level of higher taxonomic groups (e.g. amphipods, copepods, isopods, ostracods, oligochaetes, nematodes, and mites). In the presentation, first results on the hydrogeology, hydrochemistry, microbiology and faunal diversity of the urban center and surroundings of Halle are introduced. We show major spatial trends and how faunal abundance and diversity relates to direct urban temperature effects and zones of anoxic conditions. Moreover, research activities planned for the near future will be discussed.

How to cite: Becher, J., Gardt, K., Meyer, L., Griebler, C., Hermann, M., and Bayer, P.: Hydrogeological, physicochemical, and thermal conditions as drivers of faunal diversity in an urban groundwater ecosystem, EGU General Assembly 2023, Vienna, Austria, 23–28 Apr 2023, EGU23-14570, https://doi.org/10.5194/egusphere-egu23-14570, 2023.

EGU23-14941 | PICO | BG3.8

Impact of climate change on the water balance of the Thaya basin 

Juraj Parajka, Adam Vizina, Jürgen Komma, Peter Valent, Petr Štepánek, Klaus Haslinger, Theresa Schellander-Gorgas, Marek Viskot, Milan Fischer, Walter Froschauer, Mirek Trnka, and Günter Blöschl

The Thaya is a trans-national river basin that is situated in the Czech Republic and Austria. Different human activities in the basin and multiple water uses increase the water demand. This increase, combined with the recent droughts events in 2017 and 2018, has recently resulted in reconsidering the water management strategies for future climates. This contribution aims to evaluate the effect of climate change on the water balance of the Thaya. The aim is to apply two different hydrological models in an identical setting (the same model inputs, scenarios, and regional and water use data) and to identify water availability and its change under various climate and water use scenarios. The assessments compare BILAN and TUWmodel hydrological models coupled with the WATERRES water use module and a large sample of climate projections (the CMIP5 and CMIP6 models), which represent various socioeconomic pathways combined with projections of possible changes in water use. The results will demonstrate an insight into how the water balance in different parts of the Thaya basin has changed in the past and what are the possible effects of climate change on these water resources in the future.

How to cite: Parajka, J., Vizina, A., Komma, J., Valent, P., Štepánek, P., Haslinger, K., Schellander-Gorgas, T., Viskot, M., Fischer, M., Froschauer, W., Trnka, M., and Blöschl, G.: Impact of climate change on the water balance of the Thaya basin, EGU General Assembly 2023, Vienna, Austria, 23–28 Apr 2023, EGU23-14941, https://doi.org/10.5194/egusphere-egu23-14941, 2023.

EGU23-17067 | ECS | PICO | BG3.8

Divergence of ecosystem functioning and stability under climatic extremes in a 24-year long-term grassland experiment 

Md Lokman Hossain, Jianfeng Li, Samuel Hoffmann, and Carl Beierkuhnlein

Ecosystem functioning is impacted by the rising intensity and frequency of climatic extremes. Given the substantial evidence of the impacts of climatic extremes on ecosystem productivity, plant ecologists have been fascinated by the role of species richness in sustaining ecosystem functioning and stability under climatic extremes. Using the above-ground net primary productivity (ANPP) and climate data of a long-running (1997-2020) biodiversity experiment in Bayreuth, Germany, we examined the (i) effects of climatic conditions on species richness and ANPP, and (ii) role of species richness on resistance and resilience of ecosystem under different climatic conditions. Bayreuth Biodiversity Experiment was established in 1996, which comprises 64 plots (each plot is 2m×2m in size). Biomass was harvested twice a year (June and September) at 5 cm above the ground within the centre of each plot. We employed the Standardized Precipitation Evapotranspiration Index (SPEI) to classify the growing season (3-month SPEI) and annual (12-month SPEI) climatic conditions (ranging from extreme wet to extreme dry conditions) into a 5-class and 7-class climatic conditions classifications. A number of pairwise tests (ANOVA and post-hoc) were used to assess the differences in species richness and ANPP among various climatic conditions. We utilized generalized linear models to assess the relationships between species richness and ANPP, and linear mixed-effects models to examine the relationships between species richness and resistance and resilience under different directions (e.g., dry or wet) and intensities (e.g., extreme, moderate and mild) of climatic conditions. Results show that ANPP varied greatly with respect to climatic intensity and direction, peaking in extreme wet conditions and declining in extreme dry ones. Species richness and ANPP formed a concave-up (unimodal) pattern for the dry conditions and a negative linear (positive linear) pattern for the wet conditions in June (September) harvests. Species richness increased ecosystem resistance regardless of intensity, direction and classification of climatic conditions, while decreased ecosystem resilience towards dry climatic conditions. Ecosystem resilience remained steady towards wet climatic conditions. Our study stresses the importance of maintaining a community with higher species richness to stabilize ecosystem functioning and enhance resistance to various climatic conditions.

How to cite: Hossain, M. L., Li, J., Hoffmann, S., and Beierkuhnlein, C.: Divergence of ecosystem functioning and stability under climatic extremes in a 24-year long-term grassland experiment, EGU General Assembly 2023, Vienna, Austria, 23–28 Apr 2023, EGU23-17067, https://doi.org/10.5194/egusphere-egu23-17067, 2023.

EGU23-40 | PICO | CR2.2

Investigating firn and ice anisotropy around the EastGRIP Camp, North East Greenland Ice Stream, from ambient noise surface waves 

Emma Pearce, Dimitri Zigone, Charlie Schoonman, Steven Franke, Olaf Eisen, and Joachim Rimpot

We use cross-correlations of ambient seismic noise data between pairs of 9 broadband three component seismometers to investigate variations in velocity structure and anisotropy in the vicinity of the EastGRIP camp along and across flow of the Northeast Greenland Ice Stream (NEGIS).

From the 9-component correlation tensors associated with all station pairs we derive dispersion curves of Rayleigh and Love wave group velocities between station pairs at frequencies from 1 to 25 Hz. The distributions of the Rayleigh and Love group velocities exhibit anisotropy variations for the along and across flow component. To better assess those variations, we invert the dispersions curves to shear wave velocities in the horizontal (Vsh) and vertical (Vsv) direction for the top 300 m of the NEGIS using a Markov Chain Monte Carlo approach.

The reconstructed 1-D shear velocity model revels radial anisotropy in the NEGIS. Along and across flow vertical shear wave velocities (Vsv) identify comparable velocity profiles for all depths. However, horizontal shear wave velocities (Vsh) are faster by approximately 250 m/s in the along flow direction below a depth of 100 m, i.e. below the firn-ice transition.

This type of anisotropy seems to arise from the alignment of a crystallographic preferred orientation, due to deformation associated with shear zones. The role of anisotropy as e.g. created by air bubbles in the firn and ice matrix, is yet unclear.

Faster Vsh velocities in the along flow direction support that the NEGIS has crystal orientation alignment normal to the plane of shear compression (i.e. ice crystals orientated across flow) within the upper 300 m of the ice stream and are in alignment with the results from other methods. We demonstrate that simple, short duration (2-3 weeks), passive seismic deployment and environmental noise-based analysis can be used to determine the anisotropy of the upper part of ice masses.

How to cite: Pearce, E., Zigone, D., Schoonman, C., Franke, S., Eisen, O., and Rimpot, J.: Investigating firn and ice anisotropy around the EastGRIP Camp, North East Greenland Ice Stream, from ambient noise surface waves, EGU General Assembly 2023, Vienna, Austria, 23–28 Apr 2023, EGU23-40, https://doi.org/10.5194/egusphere-egu23-40, 2023.

EGU23-92 | ECS | PICO | CR2.2

Improving identification of glacier bed materials using converted-wave seismics 

Ronan Agnew, Adam Booth, Alex Brisbourne, Roger Clark, and Andy Smith

When modelling ice sheet and glacier dynamics, a consideration of basal conditions is essential. Bed topography, hydrology and materials provide important controls on ice flow; however, the materials underlying large sections of the polar ice sheets are unknown. Seismic amplitude-versus-offset (AVO) analysis provides a means of inferring glacier bed properties, namely acoustic impedance and Poisson's ratio, by measuring bed reflectivity as a function of incidence angle.

However, existing methods of applying AVO to glaciology only consider the compressional-wave component of the wavefield and solutions suffer from non-uniqueness. This can be addressed using multi-component seismic datasets, in which a strong converted-wave arrival (downgoing compressional-wave energy converted to shear-wave energy upon reflection at the glacier bed) is often present. We present a method of jointly inverting compressional (PP) and converted-wave (PS) seismic data to improve constraint of glacier bed properties.

Using synthetic data, we demonstrate that for typical survey geometries, joint inversion of PP- and PS-wave AVO data delivers better-constrained bed acoustic impedance and Poisson’s ratio estimates compared with PP-only inversion. Furthermore, joint inversion can produce comparably constrained results to PP inversion when using input data with a smaller range of incidence angles/offsets (0-30 degree incidence for joint inversion, versus 0-60 degrees for PP- only). This could simplify future field acquisitions on very thick ice, where obtaining data at large incidence angles is difficult.

Joint AVO inversion therefore has the potential to improve identification of glacier bed materials and simplify field acquisitions of glacial AVO data. We also present preliminary results from Korff Ice Rise, West Antarctica, where better constraints on bed conditions can help improve our knowledge of ice sheet history in the Weddell Sea sector. Routine measurements of this kind will help constrain ice-sheet model inputs and reduce uncertainty in predictions of sea-level rise.

How to cite: Agnew, R., Booth, A., Brisbourne, A., Clark, R., and Smith, A.: Improving identification of glacier bed materials using converted-wave seismics, EGU General Assembly 2023, Vienna, Austria, 23–28 Apr 2023, EGU23-92, https://doi.org/10.5194/egusphere-egu23-92, 2023.

EGU23-93 | ECS | PICO | CR2.2

Efficient neural network-based detection of seismicity in fibre optic data from Store Glacier, West Greenland 

Andrew Pretorius, Adam Booth, Emma Smith, Andy Nowacki, Sjoerd de Ridder, Poul Christoffersen, and Bryn Hubbard

Seismic surveys are widely used to characterise the properties of glaciers, their basal material and conditions, and ice dynamics. The emerging technology of Distributed Acoustic Sensing (DAS) uses fibre optic cables as seismic sensors, allowing observations to be made at higher spatial resolution than possible using traditional geophone deployments. Passive DAS surveys generate large data volumes from which the rate of occurrence and failure mechanism of ice quakes can be constrained, but such large datasets are computationally expensive and time consuming to analyse. Machine learning tools can provide an effective means of automatically identifying seismic events within the data set, avoiding a bottleneck in the data analysis process.

Here, we present a novel approach to machine learning for a borehole-deployed DAS system on Store Glacier, West Greenland. Data were acquired in July 2019, as part of the RESPONDER project, using a Silixa iDAS interrogator and a BRUsens fibre optic cable installed in a 1043 m-deep borehole. The data set includes controlled-source vertical seismic profiles (VSPs) and a 3-day passive record of cryoseismicity.  To identify seismic events in this record, we used a convolutional neural network (CNN). A CNN is a deep learning algorithm and a powerful classification tool, widely applied to the analysis of images and time series data, i.e. to recognise seismic phases for long-range earthquake detection.

For the Store Glacier data set, a CNN was trained on hand-labelled, uniformly-sized time-windows of data, focusing initially on the high-signal-to-noise-ratio seismic arrivals in the VSPs. The trained CNN achieved an accuracy of 90% in recognising seismic energy in new windows. However, the computational time taken for training proved impractical. Training a CNN instead to identify events in the frequency-wavenumber (f-k) domain both reduced the size of each data sample by a factor of 340, yet still provided accurate classification. This decrease in input data volume yields a dramatic decrease in the time required for detection. The CNN required only 1.2 s, with an additional 5.6 s to implement the f-k transform, to process 30 s of data, compared with 129 s to process the same data in the time domain. This suggests that f-k approaches have potential for real-time DAS applications.

Continuing analysis will assess the temporal distribution of passively recorded seismicity over the 3 days of data. Beyond this current phase of work, estimated source locations and focal mechanisms of detected events could be used to provide information on basal conditions, internal deformation and crevasse formation. These new seismic observations will help further constrain the ice dynamics and hydrological properties of Store Glacier that have been observed in previous studies of the area.

The efficiency of training a CNN for event identification in the f-k domain allows detailed insight to be made into the origins and style of glacier seismicity, facilitating further development to passive DAS instrumentation and its applications.

How to cite: Pretorius, A., Booth, A., Smith, E., Nowacki, A., de Ridder, S., Christoffersen, P., and Hubbard, B.: Efficient neural network-based detection of seismicity in fibre optic data from Store Glacier, West Greenland, EGU General Assembly 2023, Vienna, Austria, 23–28 Apr 2023, EGU23-93, https://doi.org/10.5194/egusphere-egu23-93, 2023.

EGU23-952 | PICO | CR2.2

Variability of surface density at Dotson Ice Shelf, West Antarctica 

Clare Eayrs, Lucas Beem, Choon-Ki Lee, Won Sang Lee, Jiwoong Chung, Christopher Pierce, Jamey Stutz, and David Holland

The ice mass balance of Antarctica has been steadily and strongly decreasing over recent decades, with major ramifications for global sea levels. Satellite remote sensing offers global, daily coverage of ice mass changes, which is essential for understanding land ice changes and their effects on global climate. However, we need to correct for processes including firn densification, glacial isostatic adjustment, elastic compensation of the Earth’s surface, ocean tides, and inverse barometer effect. Of these corrections, understanding the changes to the firn layer constitutes one of the largest uncertainties in making estimates of the surface mass balance from space. Furthermore, the development of firn models that aid our understanding of firn densification processes is hampered by a lack of observations.

Radar sounder reflections contain information about the roughness and permittivity of the reflecting interface, allowing us to map the spatial variability of the ice surface characteristics. In 2022, a helicopter-mounted ice-penetrating radar system developed by the University of Texas Institute for Geophysics collected high-quality radar observations over the Dotson Ice Shelf, West Antarctica. These surveys obtained clearly defined surface and bed reflections. We derived near-surface density along these survey flight lines using the radar statistical reconnaissance method developed by Grima, 2014. We calibrated our estimates with contemporary observations, including ground penetrating radar, a shallow ice core, an Autonomous phase-sensitive Radio Echo-sounder (ApRES), and radar soundings of well-defined surfaces from a calibration flight.

How to cite: Eayrs, C., Beem, L., Lee, C.-K., Lee, W. S., Chung, J., Pierce, C., Stutz, J., and Holland, D.: Variability of surface density at Dotson Ice Shelf, West Antarctica, EGU General Assembly 2023, Vienna, Austria, 23–28 Apr 2023, EGU23-952, https://doi.org/10.5194/egusphere-egu23-952, 2023.

EGU23-1137 | ECS | PICO | CR2.2

Hydraulic behaviour of a mountain permafrost subsoil revealed by an infiltration experiment and ERT time-lapse measurements 

Mirko Pavoni, Jacopo Boaga, Alberto Carrera, Giulia Zuecco, Luca Carturan, and Matteo Zumiani

Although rock glaciers represent a common periglacial landform in the alpine environment, and have a significant contribution to the hydrological regime of the related areas, their hydrodynamic is relatively less defined if compared to moraines, talus, and hillslope deposits. So far, the hydraulic behaviour of frozen layers that may be found inside rock glaciers has been investigated only with geochemical analysis of their spring water. These previous studies observed that the frozen layer acts as an aquiclude (or aquitard) and separates a supra-permafrost flow component, originating from snow-ice melting and rainwater, and a deeper aquifer at the bottom of the rock glacier systems.

In this work we verified, for the first time with a geophysical monitoring method, the low-permeability hydraulic behaviour associated to the frozen layer of mountain permafrost subsoils. In the inactive rock glacier of Sadole Valley (Southern Alps, Trento Province, Italy) we performed an infiltration experiment combined with 2D electrical resistivity tomography (ERT) measurements in time-lapse configuration. Considering the same ERT transect, a time zero dataset (t0) has been collected before the water injection, subsequently about 800 liters of salt water have been spilled (approximately in a point) on the surface of the rock glacier in the middle of the electrodes array, and 10 ERT datasets have been collected periodically in the following 24 hours. To highlight the variations of electrical resistivity in the frozen subsoil, related to the injected salt water flow, only the inverted resistivity model derived from t0 dataset has been represented in terms of absolute resistivities, while the other time steps results have been evaluated in terms of percentage changes of resistivity with respect to the t0 initial model.

Our results clearly agree with the assumption that a frozen layer acts as an aquiclude (or aquitard) in a mountain permafrost aquifer, since during the infiltration experiment the injected salt water was not able to infiltrate into the underlying permafrost layer. The positive outcome of this test, fronting impervious environment and logistic constraints, opens up interesting future scenarios regarding the application of this geophysical monitoring method for the hydraulic characterization of rock glaciers. The experiment, used in this work to evaluate the permeability of the frozen layer, could be adapted in future to evaluate (in a quantitative way) the hydraulic conductivity of the active layer in rock glacier aquifers.

How to cite: Pavoni, M., Boaga, J., Carrera, A., Zuecco, G., Carturan, L., and Zumiani, M.: Hydraulic behaviour of a mountain permafrost subsoil revealed by an infiltration experiment and ERT time-lapse measurements, EGU General Assembly 2023, Vienna, Austria, 23–28 Apr 2023, EGU23-1137, https://doi.org/10.5194/egusphere-egu23-1137, 2023.

EGU23-2250 | ECS | PICO | CR2.2

Ice slab thickening drives surface runoff expansion from the Greenland Ice Sheet’s percolation zone - and vice versa 

Nicolas Jullien, Andrew Tedstone, and Horst Machguth

On the Greenland Ice Sheet, the firn layer holds the potential to trap and refreeze surface meltwater within its pore space. Acting as a buffer, it prevents meltwater from leaving the ice sheet. However, several meter-thick ice slabs have developed in the firn during the last two decades, reducing subsurface permeability and inhibiting vertical meltwater percolation. Ice slabs are located above the long-term equilibrium line along the west, north and northeast coasts of the ice sheet. Through time, ice slabs have thickened while new ones have developed at higher elevations. Concomitantly, the area of the ice sheet drained by surface rivers has increased by 29% from 1985 to 2020. Nowadays, 5-10% of surface losses through meltwater runoff originates from these newly drained areas, which correspond strongly with where ice slabs are located.

Here, we demonstrate that the highest elevation which is drained by surface rivers – termed the maximum visible runoff limit – is controlled by the ice content in the subsurface firn. Using ice slab thickness derived from the accumulation radar and annual maximum visible limit retrievals from Landsat imagery from 2002 to 2018, we show that a sub-surface ice content threshold triggers the shift from a ‘firn deep percolation regime’ to a ‘firn runoff regime’. Although ice slabs act as an aquitard, vertical meltwater percolation can still take place where visible meltwater ponds at the surface. We show that once the firn runoff regime is underway, ice slabs are thicker in locations with active surface hydrology compared to locations where no meltwater is visible at the surface. Spatial heterogeneity in ice slab thickness is therefore predominantly controlled by surface hydrology features.

How to cite: Jullien, N., Tedstone, A., and Machguth, H.: Ice slab thickening drives surface runoff expansion from the Greenland Ice Sheet’s percolation zone - and vice versa, EGU General Assembly 2023, Vienna, Austria, 23–28 Apr 2023, EGU23-2250, https://doi.org/10.5194/egusphere-egu23-2250, 2023.

EGU23-2856 | ECS | PICO | CR2.2

New Representation of Synthetic Aperture Radar Images for Enhanced Ice-Sounding Interpretation 

Álvaro Arenas-Pingarrón, Hugh F.J. Corr, Paul V. Brennan, Carl Robinson, Tom A. Jordan, Alex Brisbourne, and Carlos Martín

The processing of Synthetic Aperture Radar (SAR) images is based on the coherent integration of Doppler frequencies. The associated Doppler spectrum is generated from the variation of the relative location between the radar and the scatterer. In geometries where the moving radar-platform follows a straight trajectory at constant velocity, the Doppler frequency depends on the angle of elevation from the radar to the scatterer, according to the electromagnetic (EM) propagation. In ice-sounding by airborne SAR, the EM path depends on the air-ice interface and the firn ice properties. For any of the scatterers under test, after integrating the received radar echoes from the multiple radar locations into a single pixel, the resulting amplitude image forgets which is the backscattering angle from each of the radar locations. However, this information is still within the Doppler spectrum of the image. We decompose the Doppler spectrum of the SAR image into three non-overlapping sub-bands; assign to each sub-band one of the primary colours red, green or blue, forming three sub-images; and finally merge the sub-images into a single one. Rather than a single full-beamwidth averaged amplitude value, the new composition now includes angular backscattering information, coded by one of the primary colours. Blue colour is assigned to scattering received from forwards, when the scatterer is ahead of the radar (positive Doppler frequencies); green approximately from the vertical (near zero-Doppler geometries); and red to scattering received from backwards (negative Doppler). Thus, heterogeneous scattering will be represented by one or two colours, whereas homogeneous scattering will be grey, with all the primary colours uniformly weighted. Features like internal layering, crevasses, SAR focussing quality and discrimination of multiple reflections from surface and bottom, can now be better interpreted. We present and discuss the results from the British Antarctic Survey (BAS) airborne radar PASIN2 for deep-ice sounding, in Recovery and Rutford ice streams, respectively in East and West Antarctica during seasons 2016/17 and 2019/20.

How to cite: Arenas-Pingarrón, Á., Corr, H. F. J., Brennan, P. V., Robinson, C., Jordan, T. A., Brisbourne, A., and Martín, C.: New Representation of Synthetic Aperture Radar Images for Enhanced Ice-Sounding Interpretation, EGU General Assembly 2023, Vienna, Austria, 23–28 Apr 2023, EGU23-2856, https://doi.org/10.5194/egusphere-egu23-2856, 2023.

In many regions of the Northern Hemisphere, permafrost is thawing due to climate change. In steep terrain, this permafrost degradation can affect slope stability. In one of Iceland's eastern fjords, Seyðisfjörður, nine major landslide cycles have occurred in the last century, originating from the lower parts (< 500 m a.s.l.) of the Strandartindur slopes, with the largest landslide event ever recorded in Iceland occurring in December 2020. Its triggering mechanism is being intensively studied and its development is being monitored. In addition to these instabilities, slow movements are also observed in the upper part (> 500 - 1010 m a.s.l.) of these slopes. In these upper areas, it is not known whether permafrost is present in the subsurface or what is causing it to creep downward. To further investigate the stability of these slopes, it is important to know and map the distribution and condition of possible permafrost layers. Therefore, electrical resistivity tomography (ERT) and ground penetrating radar (GPR) measurements were performed to study the presence and distribution of permafrost in the mountain, Strandartindur, above Seyðisfjörður. A combination of measurements is used as ERT responds primarily to the electrical resistivity of the subsurface, but this can depend strongly on other factors such as porosity, water content, etc., and GPR can help map the presence of different interfaces in the soil determined by their different physical properties, such as relative electrical permittivity, but also conductivity, which is the reciprocal of resistivity. Combining the two methods allows us to get a clearer picture of the subsurface. As a benchmark for ERT measurements in the field, a laboratory setup was performed with soil and rock samples at different temperatures and water saturations to study the behavior of frozen and non-frozen conditions in our geologic environment. With all of these measurements, we aim to answer the questions of whether permafrost is present in the selected area, what the distribution of permafrost is, whether we can use laboratory ERT to establish reference resistivity values, and if these methods are appropriate for this area.

How to cite: von der Esch, A., Piispa, E. J., and Sæmundsson, Þ.: Electrical Resistivity Tomography and Ground-Penetrating Radar Measurements for Permafrost Detection on a Mountain Slope at Strandartindur, Seyðisfjörður - East Iceland, EGU General Assembly 2023, Vienna, Austria, 23–28 Apr 2023, EGU23-4135, https://doi.org/10.5194/egusphere-egu23-4135, 2023.

EGU23-4895 | ECS | PICO | CR2.2

Detecting permafrost freeze-thaw front propagation using time-laps ERT observations in a large column experiment 

Jelte de Bruin, Victor Bense, and Martine van der Ploeg

Cold regions are increasingly subjected to higher air temperatures, causing warming of permafrost and a deepening of the active layer. This activates hydrogeological groundwater flow and new groundwater pathways to emerge. Monitoring of the active layer depth occurs mainly with the use of temperature observations, but a more flexible and non-invasive method to study transient subsurface processes is with the use of Electrical Resistivity Tomography (ERT) observations. 

Automated time-laps ERT arrays are used to monitor the frozen ground evolution during various seasons, observing resistivity variations during freezing and thawing. Similarly, the leaching of meltwater into the ground under freezing/thawing conditions can be observed. Not only geophysical changes such as fluctuations in water content and water table, but also temperature variations affect the electrical resistivity field. In order to track the development of permafrost active-layer freeze-thaw fronts using ERT observations, it is thus essential that the effect of temperature on the resistivity is clearly defined at realistic scales representing field conditions. Our aim is to determine fluid resistivity at various stages during freezing and thawing and validate current temperature–resistivity relations for partly frozen soils.

This study used a soil column (0.4 m diameter, 1 m heigh) equipped with 96 stainless steel electrodes placed at 8 horizontal rings of 12 electrodes each at various heights around the circumference of the column alongside with temperature sensors. The column was fully insulated on the sides and top except for the bottom, creating a 1D heat transfer system. The soil column was filled with quartzite sand with a D50 of 350 (μm) and organic matter content of 5 (wgt %). The experimental setup was placed within a climate chamber where the column was frozen to -4 °C and thawed to 3 °C over a 3-month period. During the freezing and thawing phase, a full 3D resistivity image was collected using the ERT at a weekly interval. Initial results show that the setup is capable of simulating permafrost freezing and thawing dynamics and ongoing work focuses on the relation between the temperature and time lapse ERT resistivity observations.

How to cite: de Bruin, J., Bense, V., and van der Ploeg, M.: Detecting permafrost freeze-thaw front propagation using time-laps ERT observations in a large column experiment, EGU General Assembly 2023, Vienna, Austria, 23–28 Apr 2023, EGU23-4895, https://doi.org/10.5194/egusphere-egu23-4895, 2023.

EGU23-5545 | ECS | PICO | CR2.2

High resolution maps of the sub-ice platelet layer in Atka Bay from electromagnetic induction sounding 

Mara Neudert, Stefanie Arndt, Markus Schulze, Stefan Hendricks, and Christian Haas

We present maps of the sub-ice platelet layer (SIPL) thickness and ice volume fraction beneath the land-fast sea ice in Atka Bay adjacent to the Ekström Ice Shelf (southeastern Weddell Sea, Antarctica). The widespread SIPL beneath Antarctic fast ice is indicative of basal melt of nearby ice shelves, contributes to the sea ice mass balance and provides a unique ecological habitat. Where plumes of supercooled Ice Shelf Water (ISW) rise to the surface rapid formation of platelet ice can lead to the presence of a semi-consolidated SIPL beneath consolidated fast ice.

Here we present data from extensive electromagnetic (EM) induction surveying with the multi-frequency EM sounder GEM-2 between May and December, 2022. It includes monthly survey data along a fixed transect line across Atka Bay between May and October, as well as comprehensive mapping across the entire bay in November and December. The GEM-2 surveys were supplemented by drill hole thickness measurements, ice coring and CTD profiles. A new data processing and inversion scheme was successfully applied to over 1000 km of EM profiles with a horizontal resolution of one meter. We obtained layer thicknesses of the consolidated ice plus snow layer, the SIPL, and the respective layer conductivities. The latter were used to derive SIPL ice volume fraction and an indicator for flooding at the snow-ice interface. The robustness of the method was validated by drill hole transects and CTD profiles.

Our results support conclusions about the spatial variability of the ocean heat flux linked to outflow of ISW from beneath the ice shelf cavity. Temporally, we found that the end of SIPL growth and the onset of its thinning in summer can be linked to the disappearance of supercooled water in the upper water column.

How to cite: Neudert, M., Arndt, S., Schulze, M., Hendricks, S., and Haas, C.: High resolution maps of the sub-ice platelet layer in Atka Bay from electromagnetic induction sounding, EGU General Assembly 2023, Vienna, Austria, 23–28 Apr 2023, EGU23-5545, https://doi.org/10.5194/egusphere-egu23-5545, 2023.

EGU23-5851 | PICO | CR2.2

Measuring snow and avalanche properties using acoustic and seismic distributed fiber optic sensing 

Alexander Prokop, Nicola P. Agostinetti, and Bernhard Graseman

Since 2012 we monitor avalanche activity using distributed acoustic and seismic fiber optic sensing at our avalanche test area at Lech am Arlberg, Austria. The method is based on an optical time domain reflectometer system that detects seismic vibrations and acoustic signals on a fiber optic cable that can have a length of up to 30 km in 80 cm resolution. While in the first years we focused on successfully developing an operational avalanche detection system that is able to tell in real time reliably when an avalanche was triggered and what the size of the avalanche is, we now present our investigations of the seismic signals to measure snow properties such as snow depth and avalanche properties such as flow behavior. Our test in winter 2022 recorded by blasting triggered avalanches and during data post processing we extracted seismic guided waves. We discuss methods for extracting information from guided waves for measuring snow depth, which was verified against spatial snow depth measurements from terrestrial laser scanning. Analyzing the seismic signals of avalanches with run-out distances ranging from a few metres to approximately 250 m allows us to differentiate between wet and snow avalanches, which is discussed in the context of avalanche dynamics.

How to cite: Prokop, A., Agostinetti, N. P., and Graseman, B.: Measuring snow and avalanche properties using acoustic and seismic distributed fiber optic sensing, EGU General Assembly 2023, Vienna, Austria, 23–28 Apr 2023, EGU23-5851, https://doi.org/10.5194/egusphere-egu23-5851, 2023.

EGU23-6935 | PICO | CR2.2

A new view of a 1970s radar dataset from Greenland 

Nanna Bjørnholt Karlsson, Dustin Schroeder, Louise S. Sørensen, Winnie Chu, Thomas Teisberg, Angelo Tarzano, Niels Skou, and Jørgen Dall

The short observational record is one of the main obstacles to improving the present understanding of the future of the Polar ice sheets. While the quantity and quality of observations presently are increasing observations from before the 1990s are scarce. Here, we present the first results from a newly digitized ice-penetrating radar dataset acquired over the Greenland Ice Sheet in the 1970s. The data consist of more than 170,000 km of radar flight lines. While the ice thickness information from the data has been digitized by previous studies, the data itself (notably the z-scopes) were until recently only available as 35-mm films, microfiche copies of the films, and enlarged positives: Formats that are not usable for digital analysis.

In 2019, the film rolls were scanned by a digital scanner and subsequently, a large effort has been directed at carrying out quality control of the data with the view of making them publicly available.  Here we present the first results from this digitization. The overall data quality is good, and we are able to retrieve valuable information on layer stratigraphy and ice-flow dynamics.

How to cite: Karlsson, N. B., Schroeder, D., Sørensen, L. S., Chu, W., Teisberg, T., Tarzano, A., Skou, N., and Dall, J.: A new view of a 1970s radar dataset from Greenland, EGU General Assembly 2023, Vienna, Austria, 23–28 Apr 2023, EGU23-6935, https://doi.org/10.5194/egusphere-egu23-6935, 2023.

EGU23-7198 | PICO | CR2.2

Climatic imprint in the mechanical properties of ice sheets and its effect on ice flow: Observations fromSouth Pole and EPICA Dome C ice cores 

Carlos Martin, Robert Mulvaney, Howard Conway, Michelle Koutnik, C. Max Stevens, Hugh Corr, Catherine Ritz, Keith Nicholls, Reinhard Drews, and M. Reza Ershadi

The climatic conditions over ice sheets at the time of snow deposition and compaction imprint distinctive crystallographic properties to the resulting ice. As it gets buried, its macroscopic structure evolves due to vertical compression but retains traces of the climatic imprint that generate distinctive mechanical, thermal and optical properties. Because climate alternates between glacial periods, that are colder and dustier, and interglacial periods, the ice sheets are composed from layers with alternating mechanical properties. Here we compare ice core dust content, crystal orientation fabrics and englacial vertical strain-rates, measured with a phase-sensitive radar (ApRES), at the South Pole and EPICA Dome C ice cores. In agreement with previous observations, we show that ice deposited during glacial periods develops stronger crystal orientation fabrics. In addition, we show that ice deposited during glacial periods is harder in vertical compression and horizontal extension, up to about three times, but softer in shear. These variations in mechanical properties are ignored in ice-flow models but they could be critical for the interpretation of ice core records. Also, we show that the changes in crystal orientation fabrics due to transitions from interglacial to glacial conditions can be detected by radar. This information can be used to constrain age-depth at future ice-core locations.

How to cite: Martin, C., Mulvaney, R., Conway, H., Koutnik, M., Stevens, C. M., Corr, H., Ritz, C., Nicholls, K., Drews, R., and Ershadi, M. R.: Climatic imprint in the mechanical properties of ice sheets and its effect on ice flow: Observations fromSouth Pole and EPICA Dome C ice cores, EGU General Assembly 2023, Vienna, Austria, 23–28 Apr 2023, EGU23-7198, https://doi.org/10.5194/egusphere-egu23-7198, 2023.

EGU23-7695 | ECS | PICO | CR2.2

Spatial variation of ice crystal fabric and implications of anisotropic flow in the Northeast Greenland Ice Stream 

Tamara Gerber and Olaf Eisen and the NEGIS community

Anisotropic crystal fabrics in ice sheets develop as a consequence of deformation and hence record information of past ice flow. Simultaneously, the fabric affects the present-day bulk mechanical properties of glacier ice because the susceptibility of ice crystals to deformation is highly anisotropic. This is particularly relevant in dynamic areas such as fast-flowing glaciers and ice streams, where the formation of strong fabrics might play a critical role in facilitating ice flow. Anisotropy is ignored in most state-of-the-art ice sheet models, and while its importance has long been recognized, accounting for fabric evolution and its impact on the ice viscosity has only recently become feasible. Both the application of such models to ice streams and their verification through in-situ observations are still rare. We present an extensive dataset of fabric anisotropy derived from ground-based and air-borne radar data, covering approximately 24,000 km2 of the Northeast Greenland Ice Stream onset region. Our methods yield the horizontal anisotropy and are based on travel time anisotropy as well as birefringence-induced power modulation of radar signals. These methods complement each other and show good agreement. We compare the in-situ observations with the results obtained from a fabric-evolution model employed along flow line bundles in the ice stream onset to discuss the fabric in light of past flow history and its significance for the current flow mechanics of the ice stream.


How to cite: Gerber, T. and Eisen, O. and the NEGIS community: Spatial variation of ice crystal fabric and implications of anisotropic flow in the Northeast Greenland Ice Stream, EGU General Assembly 2023, Vienna, Austria, 23–28 Apr 2023, EGU23-7695, https://doi.org/10.5194/egusphere-egu23-7695, 2023.

EGU23-8197 | ECS | PICO | CR2.2

Ice rise evolution derived from radar investigations at a promontory triple junction, Dronning Maud Land, East Antarctica 

M. Reza Ershadi, Reinhard Drews, Veronica Tsibulskaya, Sainan Sun, Clara Henry, Falk Oraschewski, Inka Koch, Carlos Martin, Jean-Louis Tison, Sarah Wauthy, Paul Bons, Olaf Eisen, and Frank Pattyn

Promontory ice rises are locally grounded features adjacent to ice shelves that are still connected to the ice sheet. Ice rises are an archive for the atmospheric and ice dynamic history of the respective outflow regions where the presence, absence, or migration of Raymond arches in radar stratigraphy represents a memory of the ice-rise evolution. However, ice rises and their inferred dynamic history are not yet used to constrain large-scale ice flow model spin-ups because matching the arch amplitudes includes many unknown parameters, e.g., those pertaining to ice rheology. In particular, anisotropic ice flow models predict gradients in ice fabric anisotropy on either side of an ice divide. However, this has thus far not been validated with observations.


The ground-based phase-sensitive Radio Echo Sounder (pRES) has previously been used to infer ice fabric types for various flow regimes using the co-polarized polarimetric coherence phase as a metric to extract information from the birefringent radar backscatter. Here, we apply this technique using quad-polarimetric radar data along a 5 km transect across a ridge near the triple junction of Hammarryggen Ice Rise at the Princess Ragnhild Coast. A comparison with ice core data collected at the dome shows that the magnitude of ice fabric anisotropy can reliably be reconstructed from the quad-polarimetric data. We use the combined dataset also to infer the spatial variation of ice fabric orientations in the vicinity of the triple junction. The observations are integrated with airborne radar profiles and strain rates based on the shallow ice approximation. We then discuss whether estimated anisotropy from radar polarimetry on ice rises, in general, can be another observational constraint to better ice rises as an archive of ice dynamics.

How to cite: Ershadi, M. R., Drews, R., Tsibulskaya, V., Sun, S., Henry, C., Oraschewski, F., Koch, I., Martin, C., Tison, J.-L., Wauthy, S., Bons, P., Eisen, O., and Pattyn, F.: Ice rise evolution derived from radar investigations at a promontory triple junction, Dronning Maud Land, East Antarctica, EGU General Assembly 2023, Vienna, Austria, 23–28 Apr 2023, EGU23-8197, https://doi.org/10.5194/egusphere-egu23-8197, 2023.

EGU23-9273 | ECS | PICO | CR2.2

Layer-optimized SAR processing with a mobile pRES to illuminate the internal layering of an alpine glacier 

Falk M. Oraschewski, Inka Koch, Mohammadreza Ershadi, Jonathan Hawkins, Olaf Eisen, and Reinhard Drews

The internal, isochronous layering of glaciers is shaped by accumulation and ice deformation. Information about these processes can be inferred from observing the layers using radar sounding. The reflectivity of the layers depends on density (permittivity) and acidity (conductivity) contrasts which tend to decrease with depth. At places like alpine glaciers where logistic limitations often only allow the deployment of lightweight and power-constrained ground-penetrating radar systems, it can therefore be challenging to illuminate the deeper radio-stratigraphy.

The phase-sensitive Radio Echo Sounder (pRES) is a lightweight frequency modulated continuous wave radar which allows the use of coherent Synthetic Aperture Radar (SAR) processing techniques to improve the signal-to-noise ratio of internal reflection horizons. Using a mobile pRES we collected a radar profile on an alpine glacier (Colle Gnifetti, Italy/Switzerland). Here, we demonstrate how to apply layer-optimized SAR techniques to make deep internal layers visible, which could not be seen by a conventional pulsed radar. We evaluate the requirements on spatial resolution and positioning accuracy during data acquisition, necessary for applying layer-optimized SAR processing, as they constrain the feasibility of the method. We further discuss implications on how density and acidity contribute to decreasing dielectric contrasts.

How to cite: Oraschewski, F. M., Koch, I., Ershadi, M., Hawkins, J., Eisen, O., and Drews, R.: Layer-optimized SAR processing with a mobile pRES to illuminate the internal layering of an alpine glacier, EGU General Assembly 2023, Vienna, Austria, 23–28 Apr 2023, EGU23-9273, https://doi.org/10.5194/egusphere-egu23-9273, 2023.

EGU23-9619 | ECS | PICO | CR2.2

High-density 3D and 4D GPR data acquisitions over alpine glaciers using a newly developed drone-based system. 

Bastien Ruols, Ludovic Baron, and James Irving

We have developed a drone-based GPR system at the University of Lausanne that allows for the safe and efficient acquisition of large, high-density, 3D and 4D datasets over alpine glaciers. The system is able to record approximately 4 line-km of high-quality GPR data per set of drone batteries in less than 30 minutes of operation which, combined with multiple sets of batteries and/or the possibility of charging at the field site, means that 3D datasets over a large area can be acquired with unprecedented efficiency. The latter performance is possible thanks to (i) a custom-made real-time-sampling GPR controller that has been specifically designed for glaciers studies, (ii) minimization of the total payload weight using custom-built antennas and carbon-fiber components, and (iii) development of an optimized survey methodology. Further, because the drone is equipped with real-time kinematic GPS positioning, survey paths can be repeated with great precision, which opens new opportunities in term of 4D data acquisitions.

In the summer of 2022, we acquired both 3D and 4D data over two Swiss glaciers. On the Otemma glacier, we surveyed a grid of 462 profiles representing a total length of 112 line-km of data in only four days. After 3D binning, the trace spacing intervals in the in-line and crossline directions were respectively 0.4 m and 1 m, making this arguably the largest 3D GPR dataset of such density ever recorded over ice. The interface between the ice and the bedrock, visible on all profiles, extends to 1000 ns which translates into a depth of approximately 80 m. In addition, internal englacial and subglacial 3D structures are clearly detectable.

In parallel, we visited the Rhône glacier on a monthly basis between June and September 2022. A collapse feature, identified by the presence of large circular crevasses, had formed and was evolving close to the snout of the glacier. This represented a great opportunity to test the 4D acquisition capabilities of our system. We collected four high-density 3D datasets on the same survey grid. The repeatability of the trajectories was excellent as the paths differ only by a few centimeters between occurrences. Clear variations in the internal structure of the glacier are visible which will be investigated in the upcoming months.

How to cite: Ruols, B., Baron, L., and Irving, J.: High-density 3D and 4D GPR data acquisitions over alpine glaciers using a newly developed drone-based system., EGU General Assembly 2023, Vienna, Austria, 23–28 Apr 2023, EGU23-9619, https://doi.org/10.5194/egusphere-egu23-9619, 2023.

The Whillans Ice Stream (WIS) is a major outlet of the West Antarctic Ice Sheet. Significantly, the downstream portion of the WIS is presently decelerating, possibly stagnating by the end of this century. Additionally, this downstream region of WIS is unique in that it moves primarily by stick-slip motion. However, both the rate of deceleration as well as the percent of motion accommodated by stick-slip motion is spatially variable. Such spatial variability is potentially linked to associated variability in basal conditions. Active source seismic measurement are capable of providing high-resolution insights into basal conditions, however, they are time-consuming to collect, limiting the spatial extent over which they can be acquired. In this presentation, we will use passive seismic measurements collected at over 50 seismic stations to map sediment thickness and ice-bed conditions across the region. This will be done using the receiver function method which images the depth and physical properties of sediments by modeling the arrival times and amplitudes of seismic waves that interact with subglacial sedimentary structures. We will first map conditions at the ice-bed interface by using relatively high-frequency waveforms (> 2 Hz) as they are sensitive to the physical properties of the shallow (< 20m ) subglacial sediments layers. Across the entirety of the study region, we find that this uppermost layer of sediments is characterized by relatively high porosity sediments.  Second, we will utilize lower frequencies (< 2 Hz) to map the depth basement, finding that the entire region is underlain 100’s of meters of sediments (Gustafson et al., Science, 2022). We will use our maps of sediment properties and thickness to investigate potential mechanisms for the observed variability in deceleration and stick-slip behavior of the WIS.  

How to cite: Winberry, J. P.: Basal Conditions and Sedimentary Structure of the Whillans Ice Stream., EGU General Assembly 2023, Vienna, Austria, 23–28 Apr 2023, EGU23-9621, https://doi.org/10.5194/egusphere-egu23-9621, 2023.

Englacial temperature and water content play critical roles in glacier dynamics, both within ice sheets and mountain glaciers. As radio wave attenuation is sensitive to both of these properties, radio-echo sounding (RES) serves as a useful tool for mapping out their distributions within glaciers. Ground-based bistatic surveys, in which multi-offset measurements are taken, provide a large diversity in bed incidence angles and travel-path lengths. Provided the anomaly of interest is sufficiently sampled, these measurements can be exploited to perform attenuation tomography, thereby recovering the distribution of englacial radio wave attenuation from which englacial temperature can be estimated. Extensive RES surveys have been carried out over Antarctica using airborne radar; however, due to the monostatic geometry, methods for estimation of englacial radio wave attenuation and basal roughness have relied primarily on nadir returns. These estimates are often derived from 2D spatial correlation of basal return power and ice thickness or by employing layer-tracking methods. These techniques are limited in that the former uses echoes from a large spatial footprint, preventing the detection of small-scale anomalies, while the latter assumes a known, spatially invariant reflectivity for tracked layers. However, by considering returns from off-nadir in airborne surveys, techniques from multi-offset surface surveys can be modified and extended to perform airborne attenuation tomography. While not reaching the range of path diversity achievable in surface-based surveys due to limitations imposed by total internal reflection at the ice-air interface, airborne off-nadir returns contain valuable information about subglacial and englacial conditions that is often ignored. Thus, we propose a method for estimating englacial attenuation and basal roughness using the drop in power from the peak to tail of hyperbolic scattering events in unfocussed radargrams associated with the rough bed surface. The travel-paths of the bed returns across a given hyperbolic event vary in both length and bed incidence angle. Thus, the drop in return power across a hyperbolic event gives insight into both the integrated attenuation along a travel-path, as well as the scattering function at the bed. Specular reflections from internal layers with varying dips similarly provide diversity in travel-path lengths, allowing the derivation of a relationship between path length and return power without the complications brought about by diffuse scattering at rough surfaces. Using the diverse path lengths and angles through the ice, a tomographic inversion to map the spatial distribution englacial attenuation anomalies can be implemented. This technique is applied to synthetic data, as well as data collected using the British Antarctic Survey’s Polarimetric-radar Airborne Science Instrument (PASIN), specifically to lines collected over the Eastern Shear Margin of Thwaites Glacier. This location was chosen as constraining bed conditions and identifying expected englacial thermal anomalies are critical to understanding the history and modelling the future of Thwaites.

How to cite: May, D., Schroeder, D., and Young, T. J.: Radar Attenuation Tomography for Mapping Englacial Temperature Distributions Using Off-Nadir Airborne Radio-Echo Sounding, EGU General Assembly 2023, Vienna, Austria, 23–28 Apr 2023, EGU23-9833, https://doi.org/10.5194/egusphere-egu23-9833, 2023.

EGU23-10127 | ECS | PICO | CR2.2

Monitoring lake ice with acoustic sensors 

Christoph Wetter, Cédric Schmelzbach, and Simon C. Stähler

Monitoring of the thickness and elastic parameters of floating ice on lakes and the sea is of interest in understanding the climate change impact on Alpine and Arctic environments, assessing ice safety for recreational and engineering purposes, studying ice shelves as well as exploring possibilities for the future exploration of the icy crusts of ocean worlds in our solar system. A multitude of geophysical methods exist today to monitor sea and lake ice thickness as well as elastic parameters. Mostly, seismic and radar measurements are used. Both methods have in common that they come with significant logistical effort and expensive equipment. In this study, we present a novel low cost approach using acoustic sensors for ice monitoring.

We explored the possibility of using microphones deployed on frozen lakes in the Swiss Alps to monitor the lake ice-thickness using acoustic signals originating from frequently occurring ice quakes. Data were obtained during a three-month-long field campaign at Lake St. Moritz in Switzerland in winter 2021/2022. Three microphone stations were placed on the lake in addition to five conventional seismometers. These seismometers were used to compare the acoustic signals with the seismic ice quake recordings. Additionally, also active-source experiments were conducted using hammer strokes as source, which were used to constrain elastic parameters of the ice.

The acoustic recordings of ice quakes allowed us to exploit the unique characteristics of so-called air-coupled waves to determine time-dependent ice thickness curves of Lake St. Moritz for winter 2021/2022 using acoustic data only. Furthermore, the acoustic data allowed us to gain new insights into the ice/air coupling of seismic waves in ice. 

How to cite: Wetter, C., Schmelzbach, C., and Stähler, S. C.: Monitoring lake ice with acoustic sensors, EGU General Assembly 2023, Vienna, Austria, 23–28 Apr 2023, EGU23-10127, https://doi.org/10.5194/egusphere-egu23-10127, 2023.

EGU23-11787 | ECS | PICO | CR2.2

Validating manual measurements of snow water equivalent against a reference standard 

Alexander Radlherr and Michael Winkler

The snowpack is a key component in several fields like climatology, hydrology, or natural hazards research and mitigation, not least in mountainous regions. One of the most considerable snowpack features is the snow water equivalent (SWE), representing the mass of water stored in the snowpack and – in another perspective – the weight straining objects the snow is settling on (snow load). In comparison to snow depth, measuring SWE is rather complex and prone to errors. Consecutive observations of SWE do not have a long tradition in many regions.

Despite various recent developments in measuring SWE by means of remote sensing or other noninvasive methods, e.g. with scales, GNSS reflectometry, signal attenuation and time delay techniques, cosmic-ray neutron sensing, etc. the standard measuring technique still are snow tubes or gauging cylinders, often in combination with digging pits. Tubing-technique is commonly used as reference for the validation of named modern methods, although studies addressing its accuracy, precision and repeatability are very rare.

This contribution provides results from comparing different types of SWE measurement tubes with reference standard oberservation. Several field tests were executed at different sites in the Austrian Alps covering a great variety of snow conditions (e.g. dry and wet), snow depths and SWEs. For the reference observation 3x4 m rectangular fields were dug snow-free and the respective snow masses have been weighted stepwise using ca. 50-liter-buckets. Due to the large total mass of snow of typically around two tons per rectangular, relative uncertainties are extremely small and the results highly accurate. Additionally, different snow tubes were compared to each other. The cylinder or tube designs vary a lot: from meters long metal coring tubes of typical inner diameters of ca. 4-7 cm (without the need of pits) or PVC cylinders with typical lengths of 0.5 to 1.5 m and diameters ranging from about 5-20 cm to small aluminum tubes holding a maximum of 0.5 liter of snow.  

Many statistical measures like variance and bias vary quite a lot primarily depending on the equipment used, but also on the different snow conditions. A synopsis on the suitability of the various methods depending on the questioning or objective of the observation is provided.

How to cite: Radlherr, A. and Winkler, M.: Validating manual measurements of snow water equivalent against a reference standard, EGU General Assembly 2023, Vienna, Austria, 23–28 Apr 2023, EGU23-11787, https://doi.org/10.5194/egusphere-egu23-11787, 2023.

EGU23-13127 | PICO | CR2.2

Snow depth sensitivity to mean temperature and elevation in the European Alps 

Matthew Switanek, Wolfgang Schöner, and Gernot Resch

Many of the gauged snow depth measurements in the European Alps began in the late 19th and early 20th centuries. We leverage this reasonably long period of record to investigate the historical sensitivity of snow depths as a function of precipitation, mean temperature, and elevation. By controlling for changes in precipitation, we can isolate the influence that different temperature changes have on snow depths at varying elevation bands. This simple, yet effective, approach to defining our historical sensitivity can provide a robust observational framework to evaluate the impact that a range of different future warming scenarios would have on snow depths across the Alps. As a result, adaptation and mitigation measures can be put in place for a variety of end users, such as ski tourism and water resource management. Furthermore, this provides an observational reference by which to evaluate the performance of climate model simulations.

How to cite: Switanek, M., Schöner, W., and Resch, G.: Snow depth sensitivity to mean temperature and elevation in the European Alps, EGU General Assembly 2023, Vienna, Austria, 23–28 Apr 2023, EGU23-13127, https://doi.org/10.5194/egusphere-egu23-13127, 2023.

EGU23-14390 | ECS | PICO | CR2.2

Long-time permafrost evolution in alpine bedrock: quantifying climate change effects with geoelectrical monitoring 

Riccardo Scandroglio, Maike Offer, and Michael Krautblatter

While climate change driven increase in air temperature has been correctly modeled in recent decades, the extent of its consequences is still uncertain. In high alpine environments, especially in steep rock walls, permafrost degradation reduces slope stability with critical consequences for people and infrastructures: to properly assess the risk, the rate of these changes must be monitored. In the last decades, electrical resistivity tomography (ERT) has been used in more than hundred studies to detect permafrost, but there are only limited long-term monitoring cases that mostly do not provide quantitative information. 

Here we compare ERT measurements from two alpine landforms with different altitude and lithology: Steintälli ridge (3160m asl, CH) and Mt. Zugspitze rock wall (2750 m asl, DE/AT). Standard procedures and permanently installed electrodes allow the collection of a unique dataset of consistent measurements since 2006. Supporting information like resistivity-temperature calibration from former studies, rock surface and borehole temperatures as well as active seismic refraction measurements enable an advanced quantitative interpretation of the results. 

Permafrost at both sites is close to disappearing and in both cases resistivity changes are evident and in good agreement with air temperature increase, although with different magnitudes according to the landform. The yearly 3D measurements of the Steintälli ridge show a sudden and conspicuous degradation (~40% of the volume in 15 years), while the monthly 2D monitoring of the north face of Mt. Zugspitze shows slow constant decrease in summer (~15% of the surface in 15 years) and a strong variation in winter in correlation with snow-height. 

For the first time we provide a quantification of alpine permafrost degradation rates in different landforms over 15 years. These datasets help to better understand the different characteristics of the thermal responses to the climate change induced stress on alpine permafrost environments.

How to cite: Scandroglio, R., Offer, M., and Krautblatter, M.: Long-time permafrost evolution in alpine bedrock: quantifying climate change effects with geoelectrical monitoring, EGU General Assembly 2023, Vienna, Austria, 23–28 Apr 2023, EGU23-14390, https://doi.org/10.5194/egusphere-egu23-14390, 2023.

EGU23-16308 | ECS | PICO | CR2.2

Thwaites Glacier Eastern Shear Margin: Insights from two broadband seismic arrays 

Emma C. Smith, Marianne Karplus, Jake Walter, Nori Nakata, Adam D. Booth, Lucia Gonzalez, Andrew Pretorius, Ronan Agnew, Stephen Veitch, Eliza J. Dawson, Daniel May, Paul Summers, Tun Jan Young, Poul Christoffersen, and Slawek Tulaczyk

The stability of Thwaites Glacier, the second largest marine ice stream in West Antarctica, is a major source of uncertainty in future predictions of global sea level rise. Critical to understanding the stability of Thwaites Glacier, is understanding the dynamics of the shear margins, which provide important lateral resistance that counters basal weakening associated with ice flow acceleration and forcing at the grounding line. The eastern shear margin is of interest, as it is poorly topographically constrained, meaning it could migrate rapidly, causing further ice flow acceleration and drawing a larger volume of ice into the fast-flowing ice stream. 

We present initial insights from a 2-year-long seismic record, from two broadband seismic arrays each with 7 stations, deployed across the eastern shear margin of Thwaites Glacier. We have applied a variety of processing methods to these data to detect and locate icequakes from different origins and analyse them in the context of shear-margin dynamics. Preliminary results suggest there is basal seismicity concentrated near the ice-bed interface on the slow-moving side of the margin, as opposed to within the ice-stream itself. Some of the identified seismic events appear to exhibit clear shear-wave splitting, suggesting a strong anisotropy in the ice, which would be consistent with polarization observed in recently published radar studies from the field site. Further analysis of the split shear-waves will allow us to better constrain the region's ice-fabric, infer past shear-margin location, and assess the future stability of this ice rheology.  

With such a large quantity of data, manual event identification is unpractical, and hence we are employing machine-learning approaches to identify and locate icequakes of interest in these data. Our results and forthcoming results from upcoming active-seismic field seasons have important implications for better understanding the stability of glacier and ice stream shear margins. 

How to cite: Smith, E. C., Karplus, M., Walter, J., Nakata, N., Booth, A. D., Gonzalez, L., Pretorius, A., Agnew, R., Veitch, S., Dawson, E. J., May, D., Summers, P., Young, T. J., Christoffersen, P., and Tulaczyk, S.: Thwaites Glacier Eastern Shear Margin: Insights from two broadband seismic arrays, EGU General Assembly 2023, Vienna, Austria, 23–28 Apr 2023, EGU23-16308, https://doi.org/10.5194/egusphere-egu23-16308, 2023.

EGU23-16342 | PICO | CR2.2

Intercomparison of quantification methods for snow microstructure during the SnowAPP experiment 

Anna Kontu, Leena Leppänen, Roberta Pirazzini, Henna-Reetta Hannula, Juha Lemmetyinen, Petri Räisänen, Amy McFarlane, Pedro Espin Lopez, Kati Anttila, Aleksi Rimali, Hanne Suokanerva, Jianwei Yang, Teruo Aoki, Masashi Niwano, Ghislain Picard, Ines Ollivier, Laurent Arnaud, Margaret Matzl, Ioanna Merkouriad, and Martin Schneebeli

Snow microstructure defines the physical, mechanical and electromagnetic properties of snow. Accurate information of snow structure is needed by many applications, including avalanche forecasting (Hirashima et al., 2008) and numerical weather prediction (de Rosnay et al., 2014). The interaction of electromagnetic waves with snow properties can be applied in satellite remote sensing to retrieve, for example, global information of snow mass (Pulliainen et al., 2020). Objective in-situ observations of snow microstructure are needed to validate and develop both physical models and satellite snow retrieval algorithms. Conventional measurements of snow grain size are unsatisfactory in this regard, as the parameter is difficult to measure objectively, and even its definition is ambiguous (Mätzler, 2002). Hence, recent efforts have focused on developing forward models of microwave interactions and snow specific surface area (SSA), which can be objectively measured in field and laboratory conditions using various methods. A recently proposed approach links SSA to microwave scattering properties through another physically defined parameter (Picard et al., 2022).

In the SnowAPP project, three field campaigns were carried out at the Finnish Meteorological Institute Arctic Research Centre in Sodankylä, with the goal of collecting data on snow microstructural properties and establishing the relation of microstructure to both optical reflectance and microwave emission and scattering from snow.  During the spring 2019 campaign, six different methods were used for measuring SSA; and several methods were used for measuring snow density, another important factor affecting especially the extinction of microwave energy. Furthermore, multi-frequency radiometry and a wide-band, high resolution spectrometer were used to measure microwave emission and reflectance. In this study, we compare objectively the SSA and density values obtained by the different methods in a round-robin exercise. The relation of measured snow microstructures to measured spectral properties of snow are discussed.

SnowAPP was funded by the Academy of Finland, with contributions from WSL Institute for Snow and Avalanche Research SLF, Centre Tecnològic de Telecomunicacions de Catalunya, Beijing Normal University, National Institute for Polar Research, Meteorological Research Institute (Japan), and Université Grenoble Alpes.


de Rosnay, P., Balsamo, G., Albergel, C., Muñoz-Sabater, J., & Isaksen, L. (2014). Initialisation of land surface variables for numerical weather prediction. Surveys in Geophysics, 35(3), 607–621. https://doi.org/10.1007/s10712-012-9207-x

Hirashima, H., Nishimura, K., Yamaguchi, S., Sato, A., & Lehning, M. (2008). Avalanche forecasting in a heavy snowfall area using the snowpack model. Cold Regions Science and Technology, 51(2–3), 191–203. https://doi.org/10.1016/j.coldregions.2007.05.013

Mätzler, C., 2002. Relation between grain-size and correlation length of snow. J. Glaciol., (48)162: 461-466.

Picard, G., Löwe, H., Domine, F., Arnaud, L., Larue, F., Favier, V., & Meur, E. le. (2022). The Microwave Snow Grain Size: A New Concept to Predict Satellite Observations Over Snow-Covered Regions. https://doi.org/10.1029/2021AV000630

Pulliainen, J., Luojus, K., Derksen, C., Mudryk, L., Lemmetyinen, J., Salminen, M., Ikonen, J., Takala, M., Cohen, J., Smolander, T., & Norberg, J. (2020). Patterns and trends of Northern Hemisphere snow mass from 1980 to 2018. Nature, 581(7808), 294–298. https://doi.org/10.1038/s41586-020-2258-0


How to cite: Kontu, A., Leppänen, L., Pirazzini, R., Hannula, H.-R., Lemmetyinen, J., Räisänen, P., McFarlane, A., Espin Lopez, P., Anttila, K., Rimali, A., Suokanerva, H., Yang, J., Aoki, T., Niwano, M., Picard, G., Ollivier, I., Arnaud, L., Matzl, M., Merkouriad, I., and Schneebeli, M.: Intercomparison of quantification methods for snow microstructure during the SnowAPP experiment, EGU General Assembly 2023, Vienna, Austria, 23–28 Apr 2023, EGU23-16342, https://doi.org/10.5194/egusphere-egu23-16342, 2023.

EGU23-16522 | ECS | PICO | CR2.2

Resolving ice content heterogeneity within permafrost peatlands using high-frequency induced polarisation. 

Madhuri Gopaldas Sugand, Andreas Hördt, and Andrew Binley

Permafrost peatlands are highly vulnerable ecosystems in a warming climate; their thaw greatly impacts carbon storage capacity and endangers existing landscape morphology. Due to their remoteness and, in some cases, protected status, it is difficult to characterise and monitor the subsurface using invasive methods. Geophysical investigations are useful in such cases allowing relatively rapid and extensive subsurface mapping. We focus here on the emerging high-frequency induced polarisation (HFIP) method, which can be effective in permafrost hydrology research as the geoelectrical properties of frozen water display a characteristic frequency-dependence between ranges of 100 Hz and 100 kHz.

HFIP field measurements were conducted using the Chameleon-II equipment (Radic Research) on two peat permafrost sites located in Abisko, Northern Sweden: Storflaket mire and Heliport mire. The sites have been subject to routine permafrost monitoring since 1978 and are known to have an upper peat layer underlain by a silt-rich subsoil. We present the results of 2D surveys measuring frequencies ranging from 1 Hz to 57 kHz, which capture a high-frequency phase shift peak. Field data are inverted for each measured frequency separately with ResIPy, using an appropriate data error quantification model. The spectral data analysis captures heterogeneity within the subsurface, i.e., layered medium, permafrost mire boundary and ice-rich versus ice-poor regions. Identification of spectrally distinct regions allows the application of an appropriate relaxation model. For this study, we apply a two-component mixture model for ice-content estimation. Our results extend the existing knowledge at this site by quantifying ice content in a 2D plane, thus improving the foundation for further modelling studies.

How to cite: Sugand, M. G., Hördt, A., and Binley, A.: Resolving ice content heterogeneity within permafrost peatlands using high-frequency induced polarisation., EGU General Assembly 2023, Vienna, Austria, 23–28 Apr 2023, EGU23-16522, https://doi.org/10.5194/egusphere-egu23-16522, 2023.

EGU23-1164 | ECS | Orals | SSS6.3

Development of a probability approach to determine water and colloidal pollutant flow behavior in urban heterogeneous soils 

Gersende Fernandes, Simone Di Prima, Gislain Lipeme Kouyi, Rafael Angulo-Jaramillo, Matteo Martini, and Laurent Lassabatere

Nature-based systems are being employed to allow stormwater to infiltrate directly in the soil, which is supposed to capture pollutants. To better track the evolution of such systems performances, in particular the infiltration and filtration performances, and to be able to optimize their management, these systems need to be better known. Currently, there is a lack of knowledge and methods regarding the characterization of the macropores and matrix contributions in infiltration and filtration of urban soils, whereas the quality of groundwater and the capacities of these systems are at stake. 

To tackle these limits, a large infiltrometer of 50 cm in diameter with two water-supply reservoirs of approximately 40 L each, was developed to characterize both hydrodynamic and nanotracers transfer parameters. Cumulative water infiltration was carried out at a constant hydraulic pressure head of 10 cm. Superparamagnetic iron oxide nanoparticles (SPIONs), which mimic both colloidal pollutants and bacteria flow behaviors in soils, were designed to be detectable by ground-penetrating radar (GPR). Fifty volumes of SPIONs solution (i.e., 50 x 5 mL at 3.35g/L) were injected into the ring and the GPR was passed along different survey lines around the ring several times during the infiltration experiment. GPR data was treated with ReflexW (Sandmeier Scientific Software, Karlsruhe, Germany) and Rockware (RockWare, Inc, 2015) to define a 3D block diagram of the infiltration bulb. The probability of presence of the nanoparticles was obtained from comparing the radargrams, before and after nanoparticle injection, by using two methods (Allroggen and Tronicke, 2015; Di Prima et al., 2020) on a R software (https://www.R-project.org/).

The large infiltrometer device, compared with a smaller one (Di Prima et al., 2015), is proved effective for estimating water and transfer parameters. The dispersion of SPIONs gave an idea of the relative importance of the transfer through the soil macropores as compared to the soil matrix. The probability of SPIONs presence gave information on the filtration function of soils. The whole device application will be illustrated and discussed with regard to its use for the assessment of the infiltration and filtration functions of bio-infiltration systems. 


Allroggen, N., Tronicke, J., 2015. Attribute-based analysis of time-lapse ground-penetrating radar data. Geophysics 81, H1–H8. https://doi.org/10.1190/geo2015-0171.1

Di Prima, S., Lassabatere, L., Bagarello, V., Iovino, M., Angulo-Jaramillo, R., 2015. Testing a new automated single ring infiltrometer for Beerkan infiltration experiments. Geoderma 262, 20–34. https://doi.org/10.1016/j.geoderma.2015.08.006

Di Prima, S., Winiarski, T., Angulo-Jaramillo, R., Stewart, R.D., Castellini, M., Abou Najm, M.R., Ventrella, D., Pirastru, M., Giadrossich, F., Capello, G., Biddoccu, M., Lassabatere, L., 2020. Detecting infiltrated water and preferential flow pathways through time-lapse ground-penetrating radar surveys. Sci. Total Environ. 726, 138511. https://doi.org/10.1016/j.scitotenv.2020.138511

How to cite: Fernandes, G., Di Prima, S., Lipeme Kouyi, G., Angulo-Jaramillo, R., Martini, M., and Lassabatere, L.: Development of a probability approach to determine water and colloidal pollutant flow behavior in urban heterogeneous soils, EGU General Assembly 2023, Vienna, Austria, 23–28 Apr 2023, EGU23-1164, https://doi.org/10.5194/egusphere-egu23-1164, 2023.

EGU23-2830 | ECS | Orals | SSS6.3

Evidence of hillslope connectivity on Aleppo pine plantation by artificial stemflow experiments and preferential flow pathways detection using time-lapse ground penetrating radar surveys 

Elisa Marras, Gersende Fernandes, Filippo Giadrossich, Ryan D. Stewart, Majdi R. Abou Najm, Thierry Winiarski, Brice Mourier, Rafael Angulo-Jaramillo, Alessandro Comegna, Antonio del Campo, Laurent Lassabatere, and Simone Di Prima

The hydrological response of steep slopes catchments is strongly conditioned by the connectivity of subsurface preferential flows. The objective of this research is to investigate the role played by stemflow infiltration in subsurface water flow dynamics, focusing on a forested hillslope located in an Aleppo pine Mediterranean forest (Pinus halepensis, Mill.) located at Sierra Calderona, Valencia province, Spain. We combined stemflow artificial experiments with ground-penetrating radar (GPR) techniques as a non-invasive method to investigate stemflow-induced preferential flow paths activated by different trees and the related hydrological connectivity at the hillslope scale. Our observations allowed us to identify different dynamics associated with the initiation of stemflow and then lateral preferential flow, including the activation of connected preferential flow paths in soils that received stemflow water from different trees. These observations provided empirical evidence of the role of stemflow in the formation of lateral preferential flow networks. Our measurements allow estimations of flow velocities and  new insight on the magnitude of stem-induced lateral preferential flow paths. The applied protocol offers a simple, repeatable and non-invasive way to conceptualize hillslope responses to rainstorms.

How to cite: Marras, E., Fernandes, G., Giadrossich, F., Stewart, R. D., Abou Najm, M. R., Winiarski, T., Mourier, B., Angulo-Jaramillo, R., Comegna, A., del Campo, A., Lassabatere, L., and Di Prima, S.: Evidence of hillslope connectivity on Aleppo pine plantation by artificial stemflow experiments and preferential flow pathways detection using time-lapse ground penetrating radar surveys, EGU General Assembly 2023, Vienna, Austria, 23–28 Apr 2023, EGU23-2830, https://doi.org/10.5194/egusphere-egu23-2830, 2023.

EGU23-2879 | ECS | Orals | SSS6.3

Spatio-temporal variation of surface soil hydraulic properties under different tillage and maize-based crop sequences in a Mediterranean area 

Rasendra Talukder, Daniel Plaza-Bonilla, Carlos Cantero-Martínez, Simone Di Prima, and Jorge Lampurlanés

In arid and semi-arid regions, high intensity rainfall and/or irrigation water drop leads to development of surface crust, and it has the potential to alter surface soil hydraulic properties while also accelerating runoff and erosion. However, the temporal variation of soil hydraulic properties under irrigated conditions due to surface crust under different soil management practices has rarely been studied. On a long-term tillage field experiment (26 years), in Agramunt, NE Spain, a study was carried out using Beerkan infiltration tests in conjunction with the inverse optimization algorithms of  the BEST method (Beerkan Estimation of Soil Transfer parameters) to investigate the effects of surface crusting on the spatio-temporal variation of saturated soil hydraulic conductivity (Ks, mm s-1), sorptivity (S, mm s-0.5), mean pore size (r, mm) and number of hydraulically active pores per unit area (N, m-2). Three tillage systems (intensive tillage, IT, reduced tillage, RT; and no-tillage, NT), two crop sequences (short fallow-maize, FM; and legume-maize, LM) and two positions (within the row of crops, W-row, and between the rows of crops, B-row) were assessed to evaluate the crusting effect on the above-mentioned soil hydro-physical properties. In response to autumn tillage, IT increased Ks and S due to higher r and N, but both declined after 60 days. RT, on the other hand, exhibited resilient to crust formation and despite having a lower N value, maintained comparable Ks and S values. After the spring tillage, its effect was immediately lost because of high-frequency water application, and both IT and RT developed crusted layers, resulting in decreased Ks, S and N. Long-term NT was resilient to form crust and an increasing trend of Ks and S was observed over time, except for the last sampling. Spatial variation (i.e., B-row vs. W-row) of Ks and S was found because of crusting, and independently of crop sequence, non-crusted soils (W-row) had consistently higher Ks (0.021 vs. 0.009 mm s-1)and S (0.65 vs. 0.38 mm s-0.5) than crusted soils (B-row) due to their lower bulk density and N. According to the findings of this study, conservation agriculture practices such as RT and NT improve the stability of surface soil structure and steadily reduce the risk of crust development. Further, surface cover by crops may help to prevent crust formation within the row of crops, improving soil hydraulic conductivity. This enhanced water flow path must not be neglected when measuring infiltration.

How to cite: Talukder, R., Plaza-Bonilla, D., Cantero-Martínez, C., Di Prima, S., and Lampurlanés, J.: Spatio-temporal variation of surface soil hydraulic properties under different tillage and maize-based crop sequences in a Mediterranean area, EGU General Assembly 2023, Vienna, Austria, 23–28 Apr 2023, EGU23-2879, https://doi.org/10.5194/egusphere-egu23-2879, 2023.

Homogeneous soil and related darcean approaches are sometimes insufficient to describe flow processes in porous media. For this purpose, the double permeability (DP) approach was proposed by Gerke and van Genuchten (1993) and was then adapted by Lassabatere et al. (2014) to the quasi-exact implicit infiltration model of Haverkamp et al. (1994). The separation into two compartments called fast-flow and matrix regions with related volumetric fractions allows the modeling of preferential flow in soils. The inverting procedure from multiple-tension disc infiltration experiments proposed by Lassabatere et al. (2014) allows the estimation of DP hydraulic soil properties, i.e., the quantification of the volumetric fractions occupied by the two regions and their related hydraulic properties. This approach was applied to the studied experimental green roofs. Green roofs are structures known to play the role of buffer medium by absorbing the peak loads in the stormwater networks (thus reducing the risk of floods) and contributing to the attenuation of the urban heat island. The quantified hydrological contribution of these structures at the urban scale can be approached with the help of numerical modeling. In this study, we investigated the numerical modeling of the flow in vegetated roofs, which remain a challenging topic. In this study, multiple-tension infiltrometry tests were applied to experimental lysimeters simulating a vegetated roof (Yilmaz et al., 2016). These experimental infiltration data were inverted using the DP approach to estimate the properties of the material constitutive of the studied green roofs. Then Hydrus 1-D software was used to model the runoff produced by the experimental roof for several rainfall events. For this purpose, a summer period with three successive rain events was chosen, and the ability of DP to simulate the observed runoff was investigated. The results allow the validation of the proposed characterization and modeling method and provide material for understanding the hydraulic behavior of green roofs and the permanence of preferential flow in these structures. 

Gerke, H.H., van Genuchten, M.T., 1993. A dual‐porosity model for simulating the preferential movement of water and solutes in structured porous media. Water Resources Research 29, 305–319. https://doi.org/10.1029/92WR02339

Haverkamp, R., Ross, P.J., Smettem, K.R.J., Parlange, J.Y., 1994. 3-Dimensional analysis of infiltration from the disc infiltrometer .2. Physically-based infiltration equation. Water Resources Research 30, 2931–2935.

Lassabatere, L., Yilmaz, D., Peyrard, X., Peyneau, P.E., Lenoir, T., Šimůnek, J., Angulo-Jaramillo, R., 2014. New analytical model for cumulative infiltration into dual-permeability soils. Vadose Zone Journal 13, vzj2013.10.0181. https://doi.org/10.2136/vzj2013.10.0181

Yilmaz, D., Sabre, M., Lassabatère, L., Dal, M., Rodriguez, F., 2016. Storm water retention and actual evapotranspiration performances of experimental green roofs in French oceanic climate. European Journal of Environmental and Civil Engineering 20, 344–362. https://doi.org/10.1080/19648189.2015.1036128

How to cite: Yilmaz, D. and Lassabatere, L.: Estimation of dual permeability hydraulic properties and modeling the hydrological response of an experimental green roof, EGU General Assembly 2023, Vienna, Austria, 23–28 Apr 2023, EGU23-2926, https://doi.org/10.5194/egusphere-egu23-2926, 2023.

EGU23-3409 | Posters on site | SSS6.3

Infiltrometer ring-size effects on infiltration and macropore hydraulic activation 

Saint-Martin Saint-Louis, Anthony Traullé, Gersende Fernandes, Simone Di Prima, Rafael Angulo-Jaramillo, and Laurent Lassabatere

Climate and global changes will force cities to adapt to new drastic meteorological and hydrological conditions. Within this context, urban planning has pointed to the need to restore the natural water cycle in urban cities. Restoring the natural water cycle means promoting water infiltration in urban areas to facilitate groundwater recharge and minimize runoff at the soil surface. Several techniques were developed with this goal, including those aimed at infiltrating water in specific drainage works like sustainable urban drainage systems (SUDS). However, the management of SUDS requires monitoring their capability to infiltrate water and its permanence with time. Indeed, several processes may impact the hydraulic characteristics of soils and, consequently, the infiltration capacity of bio-retention. Among others, clogging may reduce the soil's hydraulic conductivity and decrease infiltration. Conversely, plant growth and related development of root systems may promote macropore networks and increase the bulk hydraulic conductivity of soil, resulting in an increase in infiltration.

Infiltration techniques, including single-ring water infiltration experiments, were developed to monitor the soil's hydraulic properties and investigate their evolution with time. Infiltration techniques are based on infiltration tests with rings with radii in the order of 5-10 cm. If the question of the type of condition imposed at the soil surface was already posed (e.g., the question of the value of the water pressure head to impose, the presence of a sand layer for tension infiltrometers, etc.), the question of the ring size has not been investigated in depth.

In this study, we investigate the impact of the ring size on the results of water infiltration experiments, particularly regarding the activation of the soil macropore network and the hydraulic characterization of soils. We then performed infiltration experiments with rings of two contrasting sizes (7.5 cm versus 25 cm for the radius). Water infiltrations were carried out, involving the same total cumulative infiltration depth of 300 mm. BEST methods were then applied to derive the soil hydraulic parameters (Angulo-Jaramillo et al., 2019). The results were then compared between the large and the regular (small) rings. Differences in estimate means and standard deviations were discussed for each hydraulic parameter. Numerical modeling was also performed using HYDRUS (Radcliffe and Simunek, 2018) with synthetic soils to explain the difference in results between ring sizes with the concept of partial activation of the macropore network depending on the ring size. Our results constitute the first step toward understanding the ring effect on soil hydraulic characterization and its optimization with regard to the activation of all types of porosities.

References

Angulo-Jaramillo, R., Bagarello, V., Di Prima, S., Gosset, A., Iovino, M., Lassabatere, L., 2019. Beerkan Estimation of Soil Transfer parameters (BEST) across soils and scales. J. Hydrol. 576, 239–261. https://doi.org/10.1016/j.jhydrol.2019.06.007

Radcliffe, D.E., Simunek, J., 2018. Soil physics with HYDRUS: Modeling and applications. CRC press.

How to cite: Saint-Louis, S.-M., Traullé, A., Fernandes, G., Di Prima, S., Angulo-Jaramillo, R., and Lassabatere, L.: Infiltrometer ring-size effects on infiltration and macropore hydraulic activation, EGU General Assembly 2023, Vienna, Austria, 23–28 Apr 2023, EGU23-3409, https://doi.org/10.5194/egusphere-egu23-3409, 2023.

EGU23-3810 | Posters on site | SSS6.3

Modeling cumulative infiltration into dual-permeability soils 

Laurent Lassabatere, Deniz Yilmaz, Pierre-Emmanuel Peyneau, Simone Di Prima, Majdi Abou Najm, Ryan D. Stewart, Jesús Fernández-Gálvez, Joseph Pollacco, and Rafael Angulo-Jaramillo

Preferential flow is the rule rather than the exception, which questions the applicability of homogeneous models to simulate flows accurately. Gerke and van Genuchten (1993) developed the dual-permeability (DP) approach to account for preferential flow. This approach describes the soil as a combination of the fast-flow and the matrix regions. It defines a set of partial differential equations based on the application of Richards' equation to each region, in combination with an additional equation to govern water exchange between the two regions. In this study, we propose a strategy to model cumulative infiltration into DP soils considering the magnitude of the water exchange between the two regions.

In the absence of water exchange, infiltration can be considered independently in each region (Lassabatere et al., 2014). Consequently, the bulk infiltration at the soil surface equals the sum of the infiltration into the two independent regions weighted by their volumetric fractions. For this reason, the quasi-exact implicit (QEI) analytical model developed by Haverkamp et al. (1994) for single permeability (SP) Darcian soils can be applied to each region, and the two separate infiltrations can be summed to compute the bulk infiltration. The resulting QEI-Σ model was already detailed in Lassabatere et al. (2014). In the case of instantaneous water exchange, the water pressure head equilibrates instantaneously between the two regions. At any water pressure head, the bulk soil water retention and unsaturated hydraulic conductivity equal the combination of these hydraulic functions for the two regions. On a physical basis, the soil behaves as a Darcian soil with bimodal hydraulic functions, and water infiltration can be quantified by solving Richards’ equation considering bimodal hydraulic functions. Consequently, the QEI model can be used with the "bimodal" sorptivity computed from the bimodal hydraulic functions to depict the QEI-S2K model. Between these two limiting scenarios (i.e., zero versus instantaneous water exchange between the two regions), the problem must be solved numerically.

In this study, we modeled water infiltration into DP soils for various scenarios between the two extreme cases of zero and instantaneous water exchange. We used the two limiting models, QEI-Σ and QEI-S2K, to compare the cumulative infiltration for zero versus instantaneous water exchange. We used numerical simulation with HYDRUS-1D to solve the same scenario and compared it with the analytical models. Then, we modeled the cases with intermediate magnitudes of water exchange to characterize the progression from one extreme to the other. We then varied the value of the hydraulic conductivity of the interface between the two regions, with null values corresponding to zero water exchange, and quasi-infinite values corresponding to instantaneous water exchange. Our findings participate in the optimization of direct and inverse modeling procedures for preferential flow and their contributions to water infiltration into soils.

Gerke, H.H., van Genuchten, M.T., 1993. Water Resources Research 29, 305–319.

Haverkamp, R., Ross, P.J., Smettem, K.R.J., Parlange, J.Y., 1994. Water Resources Research 30, 2931–2935.

Lassabatere, L., Yilmaz, D., Peyrard, X., Peyneau, P.E., Lenoir, T., Šimůnek, J., Angulo-Jaramillo, R., 2014. Vadose Zone Journal 13.

How to cite: Lassabatere, L., Yilmaz, D., Peyneau, P.-E., Di Prima, S., Abou Najm, M., Stewart, R. D., Fernández-Gálvez, J., Pollacco, J., and Angulo-Jaramillo, R.: Modeling cumulative infiltration into dual-permeability soils, EGU General Assembly 2023, Vienna, Austria, 23–28 Apr 2023, EGU23-3810, https://doi.org/10.5194/egusphere-egu23-3810, 2023.

EGU23-3977 | ECS | Orals | SSS6.3

The linkage between near-saturated hydraulic conductivity and tritium leaching 

Ping Xin, Charles Pesch, Trine Norgaard, Goswin Heckrath, Kai Zhang, Lis W.de Jonge, and Bo V.Iversen

Macropore flow in structured soils is an important process in relation to the transport of water, contaminants and nutrients in the soil. A close relation exists between hydraulic conductivity K(h) near saturation and the potential of macropore flow. At the same time, tracer breakthrough experiments in the laboratory can determine the degree of macropore flow. In this study, we aim to investigate a direct link between tracer breakthrough characteristics and soil hydraulic properties (SHPs) of structured soils, which may explain spatial variation of solute transport in soils. We used SHPs and tracer breakthrough characteristics for 71 undisturbed topsoil columns (19 cm height, 20 cm diameter) from Denmark. We defined K10 (near-saturated hydraulic conductivity) as K(h) at a matric potential (h) of −10 cm and used logarithmic transformation, logK10. On the same soil columns, we calculated the 5%, 25%, and 50 % arrival times (AT) as the percentage of the cumulative relative mass of tracer percolating through the bottom of the soil column. The regression analyses proved significant positive relation between logK10 and 5% AT, 25% AT, and 50 % AT. The saturated hydraulic conductivity appeared to be less critical for the shape of the tracer breakthrough curves. In addition, the 5% AT, 25% AT, and 5 0%AT correlated with soil pF values at 1.7, 2.0, and 2.5 (volumetric water content at h equal to −100 cm, −300 cm, and −500 cm, respectively) showing significant negative correlations.  Linking SHPs with tracer breakthrough characteristics on large intact columns thus proves highly useful for characterizing soil macropore functions.

How to cite: Xin, P., Pesch, C., Norgaard, T., Heckrath, G., Zhang, K., W.de Jonge, L., and V.Iversen, B.: The linkage between near-saturated hydraulic conductivity and tritium leaching, EGU General Assembly 2023, Vienna, Austria, 23–28 Apr 2023, EGU23-3977, https://doi.org/10.5194/egusphere-egu23-3977, 2023.

EGU23-4078 | Orals | SSS6.3

Assessment of the BEST-WR three-term formulation to estimate water repellent soil hydraulic properties 

Deniz Yilmaz, Simone Di Prima, and Laurent Lassabatere

It’s known that certain soils surfaces may be subjected to water repellence, which prevents immediate water infiltration. With time, the water repellence vanishes and the water infiltration initiates. In such situation, the infiltration models developed for regular soils are not able to describe this early infiltration process. Recently, Abou Najm et al. (2021) proposed a simple corrector factor to deal with this problem and to account for water repellence at the beginning of the infiltration process in water-repellent soils. These authors applied their correction factor to the Philip two-term approximate transient expression. Recently, Di Prima et al. (2021) used this approach to adapt the BEST-slope algorithm (Lassabatere et al., 2006), based on the two terms transient expansion of the quasi-exact implicit (QEI) model for modelling water infiltration into regular soils for the estimation of the initial soil sorptivity (S) and the saturated hydraulic conductivity (Ks) of water repellent soils. The new model for the hydraulic characterization of soils regardless the degree of water-repellence, was named BEST-WR. It was validated using analytically generated data, involving soils with different textures and a dataset that included data from 60 single-ring infiltration tests. However, some points of the BEST-WR method deserved further investigations, especially concerning the validity time of the two-term approximate expansion used to fit the data. Indeed, if this validity time is defined for the BEST-Slope method, this is not the case for the BEST-WR method. To alleviate the issue of the limitation in time, Yilmaz et al. (2022) proposed an extension of the BEST-WR model by increasing the number of terms considered for the approximate expansions of the QEI model. They applied the correction factor to the three-term approximate expansion which is known to have a much wider validity time interval. This new formulation called BEST-WR-3T has the advantage of being valid on a very large time interval, allowing the modelling of the whole experimental datasets, without worrying about time limitations, for most practical applications. In this study, this new more robust formulation is evaluated on several examples using both analytical and field infiltration obtained with different approaches: the regular manual Beerkan method or using the automated infiltrometers developed by Di Prima et al. (2016). The robustness of the new method is observed when the BEST-WR method encounters difficulties in estimating soils parameters.  

References:

Abou Najm et al. (2021). A Simple Correction Term to Model Infiltration in Water‐Repellent Soils. Water Resources Research, 57(2), e2020WR028539.

Di Prima et al. (2016). Testing a new automated single ring infiltrometer for Beerkan infiltration experiments. Geoderma, 262, 20-34.

Di Prima, et al. (2021). BEST-WR: An adapted algorithm for the hydraulic characterization of hydrophilic and water-repellent soils. Journal of Hydrology, 603, 126936.

Lassabatère et al. (2006). Beerkan estimation of soil transfer parameters through infiltration experiments—BEST. Soil Science Society of America Journal, 70(2), 521-532.

Yilmaz et al. (2022). Three-term formulation to describe infiltration in water-repellent soils. Geoderma, 427, 116127.

How to cite: Yilmaz, D., Di Prima, S., and Lassabatere, L.: Assessment of the BEST-WR three-term formulation to estimate water repellent soil hydraulic properties, EGU General Assembly 2023, Vienna, Austria, 23–28 Apr 2023, EGU23-4078, https://doi.org/10.5194/egusphere-egu23-4078, 2023.

EGU23-4174 | ECS | Orals | SSS6.3

Does soil structure affect water infiltration? Global results from a meta-data systematic review 

Christelle Basset, Majdi Abou Najm, Xiaoxiao Hao, and Andre Daccache

Soil structure is a crucial component of soil health and quality that significantly impacts water infiltration. Natural or anthropogenic drivers, such as soil management practices, can drastically alter soil structure, which in turn can affect water infiltration. These changes in soil structure have opposing effects on water infiltration into soils and are often difficult to quantify. Here, we present a narrative systematic review (SR) of the impacts of soil structure on water infiltration. Based on inclusion and exclusion criteria, as well as defined methods for literature search and data extraction, our systematic review led to a total of 153 papers divided into two sets: experimental (131) and theoretical (22) papers. That implied a sizable number of in-situ and field experiments that were conducted to evaluate the effects of soil structure on water infiltration under the influence of different land uses and soil practices. Significant effects of soil structure on water infiltration were inferred from analyzing the metadata extracted from the collected articles. These effects were further linked to land use and management, where we demonstrated the influence of three distinct categories: tillage, crop management, and soil amendments. Additionally, significant correlations between infiltration rate and soil structural characteristics were established, with R2 values ranging from 0.51 to 0.80, as well as between saturated hydraulic conductivity and soil structural characteristics, with R2 values varying from 0.21 to 0.78. Finally, our review emphasized the significant absence of and the need for theoretical frameworks studying the impacts of soil structure on water infiltration.

How to cite: Basset, C., Abou Najm, M., Hao, X., and Daccache, A.: Does soil structure affect water infiltration? Global results from a meta-data systematic review, EGU General Assembly 2023, Vienna, Austria, 23–28 Apr 2023, EGU23-4174, https://doi.org/10.5194/egusphere-egu23-4174, 2023.

EGU23-4362 | Posters on site | SSS6.3

Capturing SUbsurface PREferential transport processes in agricultural HILLslope soils: SUPREHILL CZO 

Lana Filipović, Vedran Krevh, Jasmina Defterdarović, Zoran Kovač, Igor Bogunović, Ivan Mustać, Steffen Beck-Broichsitter, Horst H. Gerke, Jannis Groh, Radka Kodešová, Aleš Klement, Jaromir Dusek, Hailong He, Giuseppe Brunetti, Thomas Baumgartl, and Vilim Filipović

Agricultural hillslopes present particular challenges for estimating vadose zone dynamics due to a variety of processes, such as surface runoff, vertical flow, erosion, subsurface preferential flow affected by soil structure and layering, non-linear chemical behaviour, evapotranspiration, etc. To investigate these processes and complexity, the SUPREHILL critical zone observatory (CZO) was started in 2020, at vineyard hillslope site in Croatia. The observatory is extensively equipped for the soil-water regime and agrochemical fluxes monitoring, and includes an extensive sensor network, lysimeters (weighing and passive wick), suction probes, surface and subsurface flow and precipitation collection instruments. The main objective of the SUPREHILL observatory is to quantify subsurface lateral and local scale preferential flow processes. Local-scale nonlinear processes in eroded agricultural hillslope sites have large significance on water and solute behaviour within the critical zone and thus need to be researched in depth using combined methods and various approaches. First results from the sensor and lysimeter network, soil-water regime monitoring, isotope analysis, and agrochemical concentrations in 2021 supported the hypothesis of the observatory, that the subsurface flow plays a relevant part in the hillslope soil-water dynamics. In the wick lysimeter network, although the highest cumulative outflow values were found at the hilltop, the highest individual measurements were found at the footslope. During high-intensity rainfall events, there were differences in weighing lysimeters, possibly related to subsurface lateral flow. Based on the isotope analysis, wick lysimeters exhibit a greater variation of d-excess values than suction probes. Agrochemical fluxes confirmed the sloping effect on their transport in soil and demonstrated the favourability of Cu transport by subsurface flow. Using the comprehensive database presented herein, future analyses of this hypothesis will be carried out in more detail using model-based analyses.  

How to cite: Filipović, L., Krevh, V., Defterdarović, J., Kovač, Z., Bogunović, I., Mustać, I., Beck-Broichsitter, S., Gerke, H. H., Groh, J., Kodešová, R., Klement, A., Dusek, J., He, H., Brunetti, G., Baumgartl, T., and Filipović, V.: Capturing SUbsurface PREferential transport processes in agricultural HILLslope soils: SUPREHILL CZO, EGU General Assembly 2023, Vienna, Austria, 23–28 Apr 2023, EGU23-4362, https://doi.org/10.5194/egusphere-egu23-4362, 2023.

Treated wastewater (TWW) has gained recognition as an alternative source for freshwater irrigation and is steadily expanding worldwide, particularly under the current climate change. Beyond its many advantages, it has been found that prolonged use of TWW renders the soil water-repellent to certain degrees. The flow in these soils has been known to take place in preferential flow pathways (unstable flow). This lecture presents the results of a study performed in a commercial citrus orchard grown on sandy-loam soil in central Israel that has been irrigated with TWW. Electrical resistivity tomography (ERT) surveys revealed that water flow in the soil profile is occurring along preferential flow paths, leaving behind a considerably nonuniform water-content distribution. The preferential flow in the soil profile led to uneven distribution of salts and nutrients, with substantially high concentrations in the drier spots and lower concentrations in the wetter spots along the preferential flow paths. The chemical's pore concentration, which depends on the local soil water content, is higher than paste-measured concentrations and may even reach toxic values. This could partially explain the negative effect that prolonged TWW irrigation has on soil and trees. The relationship between water-repellent soils and the spatially nonuniform distribution of nutrients and salts in the root zone was verified in a consecutive in-situ study where soil water repellency was eliminated by surfactant application to the soil. Repeated ERT surveys and chemical concentration measurements in disturbed soil samples along transects revealed that the surfactant application diminished the preferential flow pathways and rendered the soil water and dissolved chemicals uniformly distributed. The preferential flow elimination and increased chemical distribution uniformity result in a yield increase compared to the surfactant-untreated soil. The different aspects of the results will be further presented and discussed. 

How to cite: Wallach, R.: The effect of water-repellent soil-induced preferential flow on the spatial distribution of nutrients and salts in the soil profile of a commercial orchard, EGU General Assembly 2023, Vienna, Austria, 23–28 Apr 2023, EGU23-4692, https://doi.org/10.5194/egusphere-egu23-4692, 2023.

The soil water retention curves(SWRCs) were acquired by experiments based on the evaporation method and compared with the result of volumetric pressure plate and chilled mirror tests for five samples in Korean residual soils. Under 100kPa suction, the SWRCs by the evaporation test agreed with those of volumetric pressure plate tests in the axis of effective saturation for five samples. In two samples, initial values of water content have shown 6% of difference, which doesn’t affect the fit of SWRCs. In the higher suction, the SWRCs were measured rapidly by chilled mirror tests. The SWRCs were fit efficiently  from low to high suction by both the evaporation and the chilled mirror tests. It is found that the fit only by low suction data couldn’t the actual SWRC accurately. Using the result of the current SWRCs and other data, the DB has been constructed and the parameters of the van Genuchten fit were interpreted. It was found that Korean residual soils are classified by three soils based on the range of void ratios.

Acknowledgements This research is supported by grant from Korean NRF (2019003604), which are greatly appreciated.

How to cite: Oh, S., Park, G., and Seo, Y.: A comparative study of soil water retention curves by the evaporation test with other experiments for Korean residual soil, EGU General Assembly 2023, Vienna, Austria, 23–28 Apr 2023, EGU23-4893, https://doi.org/10.5194/egusphere-egu23-4893, 2023.

EGU23-5271 | ECS | Orals | SSS6.3

Evaluating stemflow infiltration through time-lapse ground-penetrating radar surveys on a Faidherbia albida tree in Senegal's Sahel 

Saidou Talla, Waly Faye, Gersande Fernandez, Laurent Lassabatere, Rafael Angulo-Jaramillo, Olivier Roupsard, Simone Di Prima, and Frederic C. Do

In the Sahel region, agroforestry is a land-use system widely adopted as a more sustainable agricultural production system. In this type of system, woody perennials that are grown in association with agricultural crops and pastures, constitute spatially disconnected zones where microclimate and soil’s infiltrability, physical, chemical, and biological conditions are assumed locally improved. Particularly the stemflow concentrates a part of the intercepted rainfall from the canopies to the stems. Hence stemflow can induce preferential infiltration around the stem base and promote groundwater recharge.

In the West African Sahel, Faidherbia albida (Delile) A.Chev. is commonly adopted as multi-purpose woody perennial in agroforestry systems. It is a deciduous tree with an inverse phenology as it loses the leaves during the rainy season. Although, the absence of leaves during the rainy season is expected to decrease the interception and to consequently decrease stemflow, evidence of stemflow at the base of F. albida trees were reported in the literature when the stems were partially covered with green leaves (Chinen, 2007).

In this study, we carried out timelapse ground penetrating radar (GPR) surveys in conjunction with a simulated stemflow event to investigate stemflow-induced infiltration by an F. albida tree trunk and root system. We established a survey grid (2.1 m × 2.1 m) around an F. albida, consisting of twelve horizontal and ten vertical parallel survey lines with 0.3 m intervals between them. Two stemflow pulses, each of 20 L, were poured on the tree trunk using a PVC pipe with a 1-mm-diameter hole every 50 mm. The pipe was connected to a plastic funnel and positioned around the tree trunk at 0.4 m from the soil surface. One grid GPR survey was carried out before the stemflow simulation experiment. A total of 40 L of water was used during the experiment. A second survey was carried out after the injection of the first 20 L, while the last survey was carried out after the second stemflow pulse. We collected a total of 66 (3 GPR surveys × 22 survey lines) radargrams using a GSSI (Geophysical Survey System Inc., Salem, NH) SIR 3000 system with a 900-MHz antenna. We therefore obtained for each survey line a pre-wetting and two post-wetting radargrams. Next, we created other forty-four matrixes based on absolute differences between pre- and post-wetting amplitude values. Higher differenced values occurred because of amplitude changes and time shifts related to wave propagation.

The analysis of the differentiated radargrams provided evidence of deep infiltration along the tap roots. The wetted zone extended mainly in-depth providing evidence of the potential role played by the F. albida trees in groundwater recharge processes due to their deep rooting, preferably reaching the groundwater table. Put all together, this study shows a first signal of the importance of accounting for stemflow infiltration in the water balance of agroforestry systems with F. albida trees.

References

Chinen, T., 2007. An observation of surface runoff and erosion caused by acacia albida stemflow in dry savanna, in the south-western republic of Niger 10.

How to cite: Talla, S., Faye, W., Fernandez, G., Lassabatere, L., Angulo-Jaramillo, R., Roupsard, O., Di Prima, S., and Do, F. C.: Evaluating stemflow infiltration through time-lapse ground-penetrating radar surveys on a Faidherbia albida tree in Senegal's Sahel, EGU General Assembly 2023, Vienna, Austria, 23–28 Apr 2023, EGU23-5271, https://doi.org/10.5194/egusphere-egu23-5271, 2023.

EGU23-5608 | ECS | Orals | SSS6.3

INFILTRON-mod, a simplified preferential infiltration model for modeling bioretention systems 

Asra Asry, Gislain Lipeme Kouyi, Jérémie Bonneau, Tim D. Fletcher, and Laurent Lassabatere

The preferential flow and transport through unsaturated zones have received considerable attention in the soil and agricultural fields, particularly in increasing discharge rates and amounts and the subsequent transportation of pollutants to groundwater. Over the past century, traditional stormwater control has been replaced by a new low-impact development (LID) approach called " on-site alternative design strategy", which aims to restore or maintain the hydrological functions of urban watersheds by using the capacity of soil and vegetation to retain and filter wastewater pollution, such as bioretention facilities. Therefore, obtaining an accurate estimation of water Infiltration within Bioretention basins is crucial. The Bioretention modeling usually refers to the implicit reservoir base model, which is based on the mass balance and interaction between all the components of the hydrologic cycle (evapotranspiration, overflow, exfiltration to surrounding soils, infiltration through filter media or non-saturated zone, and underdrain discharge) during the time. Among the existing bioretention models, the unsaturated zone or filter medium is considered a homogeneous medium, and the flow is calculated with conceptual infiltration models, such as the Green-Ampt model, the Horton model, etc. Despite our knowledge that the soil reservoir medium is heterogeneous (e.g., coarse materials, plant root systems), it is, therefore, necessary to use a physics-based infiltration model that considers the impact of non-equilibrium and preferential flow on the hydrological and hydrogeochemical performance of bioretention facilities. The INFILTRON-mod, a generic physics-based package, has been proposed for this aim.

This package consists of infiltration models, including the Green-Ampt model and three other specific custom-made models, for uniform and non-uniform flows in soils based on the Darcian approach and mass balance. Uniform and non-uniform flows are modeled using the single and double permeability approaches, respectively. The dual permeability concept assumes that the soil consists of two reservoirs, i.e., the general matrix and fast flow regions, each obeying the Darcian approach. We assumed instantaneous exchange between the two regions. Consequently, we assumed that the wetting fronts in the two reservoirs advance at the same rate. Then the different sets combined with the single or double permeability approaches were tested against numerically generated data using HYDRUS and real experimental data obtained with INFILTRON-exp, "a specific large ring infiltrometer" deployed at several experimental sites.

The results show that the custom-made models lead to different results, with some being better. In addition, considering the dual permeability models improved the fits of the experimental data acquired with the infiltrometer. Then, the improved model was used to model the observations from the Wicks Reservoir bioretention basin (Melbourne, Australia), including the water head in the filter layer and outflow rates, and this led to satisfactory results. The results obtained from this study will be used to develop the INFILTRON-mod package that can be easily integrated into the LID modeling performance for calculating the infiltration element in the unsaturated filter medium.

How to cite: Asry, A., Lipeme Kouyi, G., Bonneau, J., Fletcher, T. D., and Lassabatere, L.: INFILTRON-mod, a simplified preferential infiltration model for modeling bioretention systems, EGU General Assembly 2023, Vienna, Austria, 23–28 Apr 2023, EGU23-5608, https://doi.org/10.5194/egusphere-egu23-5608, 2023.

EGU23-6752 | ECS | Orals | SSS6.3

Impact of the use of woodchips as drainage material on infiltration in secondary wastewater effluents infiltration trenches 

Pauline Louis, Laura Delgado-Gonzalez, Vivien Dubois, Laurent Lassabatère, and Rémi Clément

Wastewater management and treatment are key points in maintaining the quality and the sustainability of water resources. To preserve receiving water environments, efforts are being conducted to improve the treatment efficiency. Soil infiltration can therefore be used as a nature-based solution tertiary treatment, in some areas without surface water available, or with supplementary water bodies’ protection regulations. Secondary wastewater effluents (SWE) infiltration surfaces  mainly consist of infiltration trenches or flood-meadows. Among the main issues encountered with soil infiltration, two can be highlighted: the possible low hydraulic conductivity induced by soil clogging, on the one hand, and the use of non-renewable draining materials such as pebbles or gravel to ensure the distribution of water in trenches, on the other hand. In France, in order to overcome those issues, stakeholders are now considering the replacement of the gravel with woodchips, a renewable biodegradable material, also prone to biodiversity in soils. If there is no woodchip-filled soil infiltration surfaces downstream wastewater treatment plant in France, woodchips are however used for decentralized wastewater treatment, even though no study has quantified precisely their efficiency. The understanding of the flow processes and the risk of preferential flows in the woodchip-filled infiltration trenches is a prerequisite for a proper management of these works.

Our study aims at investigating flow regimes in woodchip-filled infiltration trenches. Several woodchip-filled infiltration trenches were studied and analyzed with regards to their infiltration capacity in four decentralized wastewater treatment sites, located in South-West of France on silty-clay soil. Measurements of infiltration capacity of the soil below the woodchips-filled trenches were conducted with infiltration tests according to the Beerkan method (Braud et al., 2005). On each site, two tests were conducted on the bottom of the infiltration trenches after extracting woodchips and two others in the soil at a lateral distance of 1 m from the infiltration trench at the same soil depth, in order to sample the same type of soil. The soil hydraulic functions, i.e., water retention and hydraulic conductivity curves, below the woodchips and in the natural soil profiles were then calculated using the BEST method (Angulo-Jaramillo et al., 2019) and compared. Our findings showed that the use of woodchips locally maintains or even enhances the infiltration rate in the soil below. Moreover, the hydraulic conductivity was 5 to 14 times higher (up to 8600 mm.d-1) in soils under woodchip-filled infiltration trenches than in the reference soils. To explain such positive effects, several hypothesis were formulated and discussed against physical, biogeochemical and ecological factors (woodchips organic amendment, suitable moisture conditions, earthworm communities’ activity). Dye tracer experiment, soil pit, and soil samples (chemical tracings and analyses) revealed the presence of preferential pathways induced by macro fauna and roots plants. An earthworm count showed that the majority of earthworms in the woodchips were 10 times higher than in the natural soil profile. Experiments also showed an organic carbon enrichment in woodchip-filled infiltration trenches soils that could lead to an improvement and stabilization of soils structure.

How to cite: Louis, P., Delgado-Gonzalez, L., Dubois, V., Lassabatère, L., and Clément, R.: Impact of the use of woodchips as drainage material on infiltration in secondary wastewater effluents infiltration trenches, EGU General Assembly 2023, Vienna, Austria, 23–28 Apr 2023, EGU23-6752, https://doi.org/10.5194/egusphere-egu23-6752, 2023.

EGU23-7099 | ECS | Orals | SSS6.3

Assessment of long-time series of soil water content through an innovative robust statistical model 

Giada Sannino, Mirko Anello, Marco Riani, Fabrizio Laurini, Marco Bittelli, Massimiliano Bordoni, Claudia Meisina, and Roberto Valentino

The aim of this research is testing a new statistical model able to describe the interaction between soil and atmosphere. The model is based on a robust parametric LTS (Least Trimmed Squares) method and harmonic functions. It has been developed taking into account field measurements of quantities involved in both infiltration and evapo-transpiration phenomena, such as volumetric water content, soil-water potential, air temperature, rainfall amounts and solar radiation. The proposed statistical model allows assessing the volumetric water content at different sites using only time series of daily rainfall amount as input data. The model was applied in different test sites, whose data were assumed by the International Soil Moisture Network (ISMN). In fact, ISMN allows getting free time series of soil and meteorological data from monitoring stations all over the world. This note shows how the proposed model is accurate with respect to field data in estimating the volumetric water content in different soils, climates and depths. Future implications of this research will regard water content predictions, especially in areas where field data are scarce. Since the proposed LTS algorithm is very efficient and the computational workload is rather low, the possibility of coupling it with a slope stability analysis over large areas will be investigated, in order to get a distributed real-time model for shallow landslides susceptibility.

How to cite: Sannino, G., Anello, M., Riani, M., Laurini, F., Bittelli, M., Bordoni, M., Meisina, C., and Valentino, R.: Assessment of long-time series of soil water content through an innovative robust statistical model, EGU General Assembly 2023, Vienna, Austria, 23–28 Apr 2023, EGU23-7099, https://doi.org/10.5194/egusphere-egu23-7099, 2023.

In recent years, scientists & physicists faced a question about the macroscope boundary condition interacting with the capillary pressure related to fluid topology. How to integrate the relationship of mechanics between thermal physical quantities (e.g free energy, entropy, & pressure) and fluid topology variables (e.g surface area, mean curvature, & Euler-Characteristic) play a main role in Continuum Mechanics research on low Reynold number flow in porous media in the future. As well, developing the theory approach is our research purpose. The perspective of Newton's Mechanics can not fit the demand of dealing with multiphase porous media flow with a lot of complex and unknown constraints and cross-scoping variables. To build up the dynamic model containing the topology states for multiphase flow in porous media, we introduced two concepts to cross the barricade of Newton mechanics applying to multiphase porous media flow, the generalized coordination and Lagrangian mechanics based on Hamilton’s Principle (The Least Action Principle). The principle shows that any physical quantity changing path making the “Action” as a function(Lagrangian integration) of generalized coordination is holding the minimum. Lagrangian mechanics is widely used in many other frontal research regions depending on the Lagrangian quantity design and generalized coordination setting, including dynamical Structure Analysis, Automatic control theory, electrodynamic and Standard Models in Particle Physics.

We provide the approach from Lagrangian mechanics to describe the thermodynamic and topology changing path during the multiphase flow process. This study recognized the topology state variable as generalized coordination. Furthermore, the Lagrangian quantity and dissipation terms were designed in this research with the kinetic energy, Landau potential, and Rayleigh dissipation function. We combined Steiner’s formula as fluid geometric constraint, dissipation system, and Lagrangian Mechanics to develop the evolution dynamic equations for fluid topology properties. Then we derive the geometrical conservation equations for the topology state variables during the whole dynamics process. Also, the derivation of Darcy’s law finished from Lagrangian mechanics under saturated and steady conditions.


How to cite: Liu, C. Y. and Hsu, S. Y.: Thermodynamic and Topology path equations, Multiphase flow in porous media with Steiner’s Formula & Lagrangian Mechanics, EGU General Assembly 2023, Vienna, Austria, 23–28 Apr 2023, EGU23-7331, https://doi.org/10.5194/egusphere-egu23-7331, 2023.

EGU23-8089 | ECS | Orals | SSS6.3

Dynamic neutron and X-ray three-dimensional imaging of fluid flow and mixing during mineral precipitation in porous rocks 

Paiman Shafabakhsh, Tanguy Le Borgne, Joachim Mathiesen, Gaute Linga, Benoît Cordonnier, Anne Pluymakers, Anders Kaestner, and François Renard

Flow and mixing processes in porous media control many natural and industrial systems, such as microbial clogging, oil extraction, and effluent disposal. In many systems, the porosity may evolve during mineral precipitation, such as in rocks, and control fluid mixing and fluid transport properties. Here, we use three-dimensional in situ dynamic neutron and X-ray micro-tomography imaging to explore fluid transport into Berea sandstone core samples during in-situ carbonate precipitation. Neutron imaging can track fluid flow inside the rock, whereas X-ray imaging illuminates the regions where mineral precipitation occurs. We control the precipitation of calcium carbonate in the rock through reactive-mixing between solutions containing CaCl2 and Na2CO3. By solving the advection-diffusion equation using the contrast in neutron attenuation from time-lapse images, we derive the 3D velocity field of the injected fluids and characterize the evolution of the permeability field into the rock during mineral precipitation. We also investigate the mixing between heavy water and a cadmium solution under the influence of mineral precipitation. Results show that, under the effect of mineral precipitation, a wide range of local flow velocities develop in the sample, under the same fluid injection rate, and we quantify the distribution of flow velocities in the sample. Moreover, we observe more efficient mixing between heavy water and a cadmium solution after mineral precipitation. The finding of this experimental study is useful in progressing the knowledge in the domain of reactive solute and contaminant transport in the subsurface.

How to cite: Shafabakhsh, P., Le Borgne, T., Mathiesen, J., Linga, G., Cordonnier, B., Pluymakers, A., Kaestner, A., and Renard, F.: Dynamic neutron and X-ray three-dimensional imaging of fluid flow and mixing during mineral precipitation in porous rocks, EGU General Assembly 2023, Vienna, Austria, 23–28 Apr 2023, EGU23-8089, https://doi.org/10.5194/egusphere-egu23-8089, 2023.

EGU23-8263 | Posters on site | SSS6.3

Preferential flow in a long-term no-tillage experiment on a silt loam soil in Mediterranean conditions 

Jorge Lampurlanes, Rasendra Talukder, Daniel Plaza-Bonilla, Carlos Cantero-Martínez, and Ole Wendroth

Water flow throughout the soil allows and regulates life on the Earth's surface. Knowing where this flow mainly takes place (preferential flow) is critical i) to measure it appropriately, ii) to take advantage of it for a more efficient use of water. Soil management has great impact on soil hydrological properties and can have an effect at catchment scale, while knowing within plot variability can improve flow estimations at plot level. On a 22-year-old experiment comparing intensive (IT) and no-tillage (NT), soil hydrological properties were determined within (W-row) and between (B-row) crop rows several times along two cropping years (2018-19 and 2019-20) on undisturbed soil cores. Tillage significantly influenced soil water retention being higher under IT than NT in the wet range above -10 cm soil matric potential. The cause was a larger volume of mesopores (1000 to 300 µm in diameter) in IT. Despite that, hydraulic conductivity was significantly higher in NT in this range, especially because mesopores in NT revealed greater pore continuity than in IT. No differences in soil hydraulic conductivity were found at lower soil matric potentials. These results suggest that, although IT increases soil porosity creating new pores regularly, these pores are less interconnected than the long-standing pores created in NT by the roots and fauna activity. The lower hydraulic conductivity in IT can reduce infiltration and increase runoff losses resulting in less water available for crops.  The position with respect to the crop row (W-row or B-row), did not have an impact on soil water retention but on soil hydraulic conductivity, that was significantly higher under W-row than B-row above -10 cm H2O soil water potential. Although the volume of pores of different size classes did not differ between both row positions, continuity of macropores (>1000 µm) was significantly higher under W-row than B-row and tended to be higher W-row also for the other pore classes. The effect of the sowing slot, the growth of the plant roots, and the protective effect of the plant cover itself can explain the preferential flow pathway found W-row. The differences between flow regimes under different tillage systems found at the small scale highlight the importance of considering the site-specific management impacts on soil structure and pore geometry, as these will affect hydrological flow processes at the catchment scale. Differences between positions with respect to the plant row need to be considered to properly characterize hydrological flow phenomena in soils, even under the same management practices.

How to cite: Lampurlanes, J., Talukder, R., Plaza-Bonilla, D., Cantero-Martínez, C., and Wendroth, O.: Preferential flow in a long-term no-tillage experiment on a silt loam soil in Mediterranean conditions, EGU General Assembly 2023, Vienna, Austria, 23–28 Apr 2023, EGU23-8263, https://doi.org/10.5194/egusphere-egu23-8263, 2023.

The macropore-matrix mass transfer of water and solutes is an important aspect of non-equilibrium-type of preferential flow in structured soils. For a representative soil volume, effective mass transfer parameters depend on heterogeneous local properties of the soil macropore structure, its geometry and shape, and on properties at macropore walls that can differ from those of the matrix with respect to texture, organic matter, bulk density, and porosity. These affect the soil pore system locally with respect to hydraulic, mechanic, bio-geo-chemical, and other processes. Clayey aggregate skins, for example, may be more due to plastic deformation but can restrict water exchange; solutes may become adsorbed along macropore surfaces and released under changing condition. Still relatively little is known about formation of such local biological hotspots in soil, on how to determine the local mass transfer parameters, and how to upscale to the scale of the soil volume, and on the interrelations between all the individual local properties and the combined effect on relevant bulk soil transport processes. The present contribution reviews recent experimental and modeling work including field and lab percolation experiments using the movement of bromide, Brilliant Blue, iodide, and Na-Fluorescein to identify the flow paths and parameter optimization approaches for determining such parameters. It seems that preferential transport of reactive solutes depends even more strongly on the geometry and properties at flow paths surface than the water flow itself or the movement of conservative solutes. The identification and determination of effective mass transfer parameters in two-domain models remains a challenge when considering that local changes in the soil structure are highly dynamic during the vegetation, the seasons, and due to soil management.

How to cite: Gerke, H. H.: Characterization of macropore-matrix mass transfer parameters in two-domain preferential flow models, EGU General Assembly 2023, Vienna, Austria, 23–28 Apr 2023, EGU23-8635, https://doi.org/10.5194/egusphere-egu23-8635, 2023.

EGU23-13041 | ECS | Posters on site | SSS6.3

Coupled surface and subsurface flows for earthen embankments using finite-volume methods 

Nathan Delpierre, Hadrien Rattez, and Sandra Soares-Frazao

The majority of breaching of earthen embankments is triggered by overtopping flows or waves. These phenomena are usually simulated using the shallow-water equations complemented by the Exner equation to reproduce the progressive erosion of the embankment and the growth of the breached area. Such an approach neglects the degree of water saturation in the embankment as well as the flow through the embankment that can alter the stability of this structure by reducing the soil’s mechanical strength. This is enhanced in case of severe droughts, as observed during the summer 2022, when desiccation cracks were observed in several embankments, leading to preferential paths for the water to infiltrate the soil during subsequent rainfalls.

In this paper, we present a combined approach in which the degree of saturation and the flow through the embankment are solved using the Richards equation that is coupled to the system of shallow-water equations for the flow over the embankment. The groundwater flow is simulated by solving the 2D Richards’s equation on an unstructured triangular mesh with an implicit finite volume scheme, based on a direct gradient evaluation. The shallow-water equations are solved in one dimension on a structured mesh using an explicit scheme with Roe’s formulation for the fluxes.

Several tests were performed to demonstrate the capacity of the proposed Richards’s solver to reproduce transient groundwater flows and compared to results from the literature obtained with different numerical approaches. In the same way, the shallow-water’s equation solver was validated by comparison with previous experimental results from the literature.

Then, by coupling both models using a source term, a mass-conservative coupled model was obtained. It became possible to simulate the evolution of the pore water content inside a dike subjected to overtopping for different initial conditions. Further work will focus on the interaction of dike’s related flows with erosion and mechanical failure processes, and on the validation of the model by comparisons with experimental data that will be obtained with medium-scale tests.

How to cite: Delpierre, N., Rattez, H., and Soares-Frazao, S.: Coupled surface and subsurface flows for earthen embankments using finite-volume methods, EGU General Assembly 2023, Vienna, Austria, 23–28 Apr 2023, EGU23-13041, https://doi.org/10.5194/egusphere-egu23-13041, 2023.

EGU23-14883 | ECS | Orals | SSS6.3

Could hydraulic parameters variation affect the vegetation development in treatment wetlands? 

Liviana Sciuto, Alessandro Sacco, Giuseppe L. Cirelli, Antonio C. Barbera, and Feliciana Licciardello

Abstract: Treatment wetlands (TWs) are complex ecosystems due to variable conditions of hydrology, soil hydraulics, plants and microbiological species diversity and mutual interactions. On the one hand, hydraulics plays a vital role on the treatment performance and on the life cycle of TWs, on the other hand, the vegetation substantially contributes to remove and to retain pollutants. As well known, the unavoidable and progressive clogging phenomenon in TWs affects their hydraulics. A lack of knowledge still remains to what extend hydraulic parameters variation can affect the vegetation developments in TWs. To answer to this question, the Phragmites australis development in comparison with hydraulic characteristics was monitored in a 8 years old - horizontal flow (HF) TW located in Mediterranean area (Eastern Sicily, Italy). Data were collected in nine observation points equally distributed along three transects established at 8.5 m (T1), at 17 m (T2) and at 25.5 m (T3) from the inlet. The falling head (FH) test was conducted to assess the hydraulic conductivity (Ks) variation in the HF-unit. Residence time distribution (RTD) analysis was performed to evaluate the real hydraulic retention time (HRT) and the hydraulic efficiency parameter (λ). Finally, the saturation method was applied for substrates porosity (φ) determination. In the HF-TW a morphological and chemical characterization of Phragmites australis above-ground biomass was carried out in 2022. In particular, plants density (in terms of culms number) and height (m) were measured at the end of the growing season (July). In each transect of the HF-TW, fresh weight (g), dry matter (DM, %), ash (%), volatile solids (VS, %), pH, Total Kjeldahl Nitrogen (TKN, % of DM) and fiber content (cellulose, hemicellulose and lignin) were estimated. Preliminary results showed a strong positive regression between DM and both Ks (R2 = 0.78) and porosity values (R2 = 0.97) observed in the HF-TW. This study could contribute to help plant operators to understand hydraulic characteristics effects on the biomass, to improve TWs treatment efficiency, system management and lifespan.

Keywords: Wastewater treatment, Phragmites australis, plants growth, hydraulic characteristics, substrate.

Acknowledgments: This research was funded by the University of Catania-PIAno di inCEntivi per la RIcerca di Ateneo 2020/2022—Linea di Intervento 3 “Starting Grant” and the PhD Course in Agricultural, Food and Environmental Science (Di3A, University of Catania).

How to cite: Sciuto, L., Sacco, A., Cirelli, G. L., Barbera, A. C., and Licciardello, F.: Could hydraulic parameters variation affect the vegetation development in treatment wetlands?, EGU General Assembly 2023, Vienna, Austria, 23–28 Apr 2023, EGU23-14883, https://doi.org/10.5194/egusphere-egu23-14883, 2023.

EGU23-16621 | ECS | Orals | SSS6.3

Spatio-temporal analysis of soil surface hydraulic properties in a semi-arid agroforestry system of the Senegalese groundnut basin 

Waly Faye, Didier Orange, Seydou Talla, Frederic Do, Christophe Jourdan, Olivier Roupsard, Abdoulaye Faty, Awa Niang, Alioune Kane, Simone Di prima, Raphael Angulo-Jaramillo, and Laurent Lassabatere

In Senegal, the groundnut basin is the main agricultural region under a semi-arid climate, heavily cultivated in an agrarian system combining agricultural rotation and agroforestry dominated by Faidherbia albida trees. The soils of the groundnut basin, essentially sandy, have a low water retention capacity. In this area, water is a limiting factor, and the climate variability represents an additional constraint on an already precarious agricultural production system. It is therefore essential to improve knowledge on water saving practices and soil humidity dynamics. The management of water resources in agricultural fields requires reliable information about soil hydraulic properties, which control the partition of rainfall into infiltration and runoff, and their spatio-temporal variability.

To investigate the variability of soil hydraulic parameters we have carried out infiltration measurement in open space without tree and below tree canopies. A total of 24 infiltration measurements were carried out using an automatic single-ring infiltrometer in the nearby of each plot (4 measurements × 6 plots), and after removing the first 10 cm of uncompacted sand. The infiltration tests were carried out in June, October and December, respectively before, during and after the crop season. We used the Beerkan Estimation of Soil Transfer Parameters (BEST) method to retrieve the soil hydraulic parameters from infiltrometer data and field measurements of soil porosity, initial and saturated soil water contents and soil bulk density.

The statistical analysis of the data showed a high variability during the cultivating period, both in time and space, especially of the saturated soil hydraulic conductivity Ks. However, the Ks seems higher under tree cover, around 0.186 mm/s, for 0.167mm/s without any tree canopy influence.  Despite the expected homogeneity of the investigated sandy soil, the presence of the perennials triggered a patchy distribution of soil hydraulic conditions. These preliminary results evidenced the importance of taking into account parameters variability and landscape structure when simulating soil water dynamics in the Senegalese groundnut basin.

How to cite: Faye, W., Orange, D., Talla, S., Do, F., Jourdan, C., Roupsard, O., Faty, A., Niang, A., Kane, A., Di prima, S., Angulo-Jaramillo, R., and Lassabatere, L.: Spatio-temporal analysis of soil surface hydraulic properties in a semi-arid agroforestry system of the Senegalese groundnut basin, EGU General Assembly 2023, Vienna, Austria, 23–28 Apr 2023, EGU23-16621, https://doi.org/10.5194/egusphere-egu23-16621, 2023.

EGU23-16729 | Orals | SSS6.3

Swell ways to measure how plant roots, biological exudates and temporal weathering impact soil structure and infiltration characteristics 

Paul Hallett, Maria Marin, Hannah Balacky, Md Dhin Islam, Annette Raffan, Erika Salas Hernández, and Utibe Utin

Time results in large changes to soil infiltration characteristics due to weather, mechanical stability and the action of biology.  Even as the water status changes in a wetting soil, swelling may alter infiltration characteristics. Our laboratory has developed several novel approaches to measure how soil water infiltration characteristics vary over time and are influenced by biological processes or weathering stresses.  The measurements are often combined with an assessment of mechanical properties and pore structure so that underlying processes driving soil structure dynamics can be disentangled. An overview and a discussion of the benefits and challenges of the approaches will be provided.

A small-scale infiltrometer (sub-mm size) was adapted to allow for measurements of water infiltration and repellency at aggregate or rhizosphere scale.  It has been applied in numerous studies exploring the impacts of biological exudates, plant roots and weathering.  More recent research has compared results from this infiltrometer with X-Ray CT imaging to determine the impacts of soil pore structure on infiltration characteristics.  A challenge with a small-scale infiltrometer is experimental error caused by tip contact with the soil and the shape of the wetting front.  This has been demonstrated from repeated tests on repacked sands and sieved soils.

If soil aggregates, spatial variability or hot spots like the rhizosphere are not of interest, conventional infiltration measurements with flow across the entire surface of a soil core offer less laboratory experimental error.  We used this approach to explore the dynamics of soil wetting and swelling as affected by a range of biological exudates.  Repacked soil discs were wetted by a sintered disc attached to a weighed water reservoir, with swelling measured dynamically in horizontal and vertical directions using infra-red sensors.  Whereas polygalacturonic acid (PGA) had no affect on sorptivity, increasing concentrations of lecithin and actigum decreased sorptivity, likely due to different mechanisms of surface tension and viscosity respectively.  Total swelling was positively correlated with water sorptivity for both lecithin and actigum, suggesting that an expanding pore structure in the unconfined soil discs may enhance water uptake rates.  Biological exudates therefore have dual impacts on decreasing wetting and swelling rates, which will affect soil structural stability.

Current research is exploring soil structural stability impacts on soil hydrological properties over time.  This includes field studies exploring the impacts of soil amendments and management practices, and laboratory studies with controlled structural changes from wetting/drying and mechanical stresses.  In this work, changes in water infiltration due to stresses are explained from pore structure analysis with X-Ray CT imaging and mechanical stability tests.

How to cite: Hallett, P., Marin, M., Balacky, H., Islam, M. D., Raffan, A., Salas Hernández, E., and Utin, U.: Swell ways to measure how plant roots, biological exudates and temporal weathering impact soil structure and infiltration characteristics, EGU General Assembly 2023, Vienna, Austria, 23–28 Apr 2023, EGU23-16729, https://doi.org/10.5194/egusphere-egu23-16729, 2023.

EGU23-17539 | Posters on site | SSS6.3

Subsurface preferential flow occurrence and relevance in agricultural hillslopes: experimental evidence 

Vilim Filipović, Annelie Ehrhardt, and Horst H. Gerke

Preferential flow (PF) has long been discussed as potential cause for unintended contamination of ground and surface waters with agrochemicals. In agricultural soil landscapes, especially along hillslopes, the mostly vertically-directed preferential flow (VPF) of infiltrating water in unsaturated topsoil horizons fosters the formation of water saturated pore regions at less permeable subsoil horizons that can trigger laterally-oriented preferential flow (LPF) along subsurface preferred flow paths. The occurrence of LPF processes depends on complex interrelations between soil properties and subsurface structures, climatic conditions, crop development, and agro-management, among other factors. Field observations in hillslope agricultural soil landscapes to quantify the relevance of LPF are rare. Here we present studies on LSF processes at two contrasting sites. One is the CarboZALF-D, located in northeastern Germany in hummocky arable soil landscape (Luvisol and Regosol soil types). The second (SUPREHILL) is an agricultural vineyard hillslope with Stagnosol soils located in central Croatia. Both sites show erosion and tillage effects in the soils along slopes. An extensive network of soil moisture sensors, suction cups, and lysimeters are installed at both sites. Relevant soil physical, hydraulic, and chemical properties have been determined for running simulation models. The SUPREHILL site has been equipped also with self-constructed subsurface runoff collection system, while at CarboZALF-D site, LPF was captured by a field tracer experiment; and in the laboratory, LSF along a soil horizon boundary was studied on undisturbed soil monoliths. Different subsurface flow processes were identified and captured at the two sites, for SUPREHILL shortly below the topsoil along the lower permeable Btg horizon and for CarboZALF-D at buried topsoil under colluvium and along coarser-textured bands within compact glacial till C-horizon. The collected experimental results revealed the qualitative importance of LPF and transport in the subsurface; the presented experimental data will be used for the model-based quantitative analysis of the LPF related processes.

How to cite: Filipović, V., Ehrhardt, A., and Gerke, H. H.: Subsurface preferential flow occurrence and relevance in agricultural hillslopes: experimental evidence, EGU General Assembly 2023, Vienna, Austria, 23–28 Apr 2023, EGU23-17539, https://doi.org/10.5194/egusphere-egu23-17539, 2023.

EGU23-1098 | PICO | SSS11.3

Playing in the sandbox: An experimental set-up for comparison of soil moisture profile sensors 

Felix Nieberding, Johan Alexander Huisman, Christof Huebner, Ansgar Weuthen, Bernd Schilling, and Heye Reemt Bogena

To enable an efficient and economical use of limited water resources, sensing techniques to determine root zone soil moisture are gaining importance. Because of their easy handling and ability to provide simultaneous measurements in different depths, so-called soil moisture profile sensors (SMPS) exhibit high potential for climate-smart agriculture. However, determining soil moisture with reasonable accuracy is a complex task. Especially clay content and soil temperature influence the soil dielectric permittivity and might thus affect the electromagnetic soil moisture measurement of the SMPS.

To date, an accurate and easy-to-use method for the evaluation of long SMPS is not available. To this end, we designed a laboratory and a field experiment to better discriminate between changes in soil dielectric permittivity and sensor variability due to environmental effects. The tested SMPS are the SoilVUE10 (50 cm) from Campbell Scientific, the Drill&Drop (60 cm) from Sentek, as well as the SMT500 (50 cm), which is an early prototype from TRUEBNER. The following questions were addressed: (1) How high is the measurement variability of the vertical measurement sections of an SMPS? (2) How strong is the sensor response influenced by changes in temperature? (3) What is the SMPS accuracy compared to reference TDR measurements and how high is the sensor-to-sensor variability? We addressed questions 1 and 2 by placing the SMPS into a container filled with well-characterized fine to medium sized sand (type F36, Quarzwerke Frechen). The sand was water saturated and the temperature of the container was stepwise increased from 5 to 40 °C using a water cooling/heating. Question 3 was addressed by setting up a 2 x 2 x 1.5 m sandbox, also filled with F36 sand at a field site. The sandbox is sealed watertight to the sides and to the bottom and provided with a drainage layer of 20 cm gravel. The water level inside the sandbox can be controlled by pumping water in or out using piezometer tubes, which are permeable in the drainage layer. The SMPS were installed into the sandbox and the measurements were compared against reference measurements made using CS610 TDR probes with TDR100 (Campbell Scientific) and against SMT100 (TRUEBNER) TDT measurements.

Preliminary results using factory calibrations indicate that all tested SMPS have their shortcomings regarding the accuracy of soil moisture estimation. The D&D probe shows a high agreement between the measurement depths and a fair temperature stability, but the soil moisture content was underestimated compared to the reference measurements. In comparison, the SoilVUE10 displayed larger variability between different measurement depths, as well as between different sensors. In addition, the soil moisture was overestimated at high soil moisture content and the accuracy declined strongly above a soil temperature of 25°C. The SMT500, albeit a prototype, performed well at low soil moisture but strongly overestimated the soil water content under saturated conditions. Our experimental setup has generally proven useful for the characterization of SMPS. It clearly showed that the accuracy of the soil moisture estimates obtained with the SMPS is quite variable, especially at high soil moisture content.

How to cite: Nieberding, F., Huisman, J. A., Huebner, C., Weuthen, A., Schilling, B., and Bogena, H. R.: Playing in the sandbox: An experimental set-up for comparison of soil moisture profile sensors, EGU General Assembly 2023, Vienna, Austria, 23–28 Apr 2023, EGU23-1098, https://doi.org/10.5194/egusphere-egu23-1098, 2023.

EGU23-5300 | ECS | PICO | SSS11.3

Fast and Reproducible Aggregate Water-Resistance Index Determination Using Laser Diffraction 

Jan-František Kubát, Michal Vrána, David Zumr, and Petr Kavka

Soil aggregate stability is a measure of the resistance of soil aggregates to degradation and breakdown. It is a major factor influencing the soil health and fertility. The aggregates stability also affects soil erosion rates and water retention. Several factors can influence the stability of soil aggregates, including the type and amount of soil organic matter, the presence of soil biota, and the type and intensity of land management practices. Soil management practices that promote the incorporation of organic matter, such as cover cropping and reduced tillage, can increase soil aggregate stability. The aggregate stability is commonly measured using a variety of techniques, such as the water drop penetration test, in which the penetration of a water droplet is used to assess the strength of soil aggregates, and the wetting and drying method, in which the stability of soil aggregates is measured after they have been subjected to alternating wetting and drying cycles. A common method for measuring soil aggregate stability is the wet sieving method. Within this contribution we present a newly developed procedure based on the equation of Kemper & Rosenau that utilizes laser diffraction to estimate the aggregate water resistance index (AWRI). In developing this new method, emphasis was placed on comparability with the standard sieving procedure carried out with the Eijkelkamp wet sieving apparatus. The water resistance of the soil aggregates was tested for five different soil types (Haplic Luvisol, Chernozem, Regosol, Fluvisol, and Cambisol) sampled in the Czech Republic. The AWRI value determined by the laser diffraction procedure is based on an average particle size of the disturbed aggregates recorded for each fictitious sieve size. The results from a limited number of soil samples show promising agreement between the standard wet sieving and the laser diffractometer procedures. The main advantage of the method is the much faster processing of many samples and their replicates with less variability in the results. However, further measurements are needed to validate the procedure.


This study has been supported by Grant of Technology Agency of the Czech Republic QK22020179 and EC H2020 Project 101000224 (TuDi)

How to cite: Kubát, J.-F., Vrána, M., Zumr, D., and Kavka, P.: Fast and Reproducible Aggregate Water-Resistance Index Determination Using Laser Diffraction, EGU General Assembly 2023, Vienna, Austria, 23–28 Apr 2023, EGU23-5300, https://doi.org/10.5194/egusphere-egu23-5300, 2023.

EGU23-5351 | ECS | PICO | SSS11.3

Influence of soil cover on surface runoff, infiltration, and percolation 

Martin Neumann, Petr Kavka, Adam Tejkl, Tomáš Laburda, and Steffen Beck-Broichsitter

The main goal of this study was to determine the effect of surface cover on soil percolation. Many previous papers have focused on reducing soil loss on steep slopes using geotextiles, but not on the intensity of percolation. Reducing surface runoff can help reduce soil loss, but increased infiltration can also increase the risk of slope collapse. For this research, Enkamat 7220 (plastic geotextile) in six different cover variations was used, as well as bare soil for comparison. A laboratory rainfall simulator with variable rainfall intensity and adjustable slope was used for the experiments, which were conducted at rainfall intensities of 60-160 mm/h. The results showed that the lowest soil percolation occurred on the plot with bare soil and on the plot where the entire surface was covered with geotextile and fully backfilled, likely due to soil compaction. The highest percolation was observed on the plot where the geotextile was fixed on top of the surface using ground anchors. The hypothesis that percolation at the foot of the slope is higher than at the top of the slope due to surface and subsurface flow was also confirmed. In future studies on the effectiveness of geotextiles, additional measurements of percolation would be beneficial for a deeper understanding of these processes. This research was supported by the research projects QK22010261, SS05010180 and CTU in Prague, grant No. SGS OHK1-086/23/11143.

How to cite: Neumann, M., Kavka, P., Tejkl, A., Laburda, T., and Beck-Broichsitter, S.: Influence of soil cover on surface runoff, infiltration, and percolation, EGU General Assembly 2023, Vienna, Austria, 23–28 Apr 2023, EGU23-5351, https://doi.org/10.5194/egusphere-egu23-5351, 2023.

EGU23-6524 | ECS | PICO | SSS11.3

Spatio-temporally highly resolved validation of a rill-based soil erosion model with 4D data 

Oliver Grothum, Dave Favis-Mortlock, Petr Kavka, Martin Neumann, Tomáš Laburda, and Anette Eltner

Time-lapse photogrammetry has been proven to be a valuable tool to support the understanding of earth surface processes since it can be used to create 3D models with an unprecedented temporal resolution. Overlapping images are captured simultaneously and structure from motion (SfM) photogrammetry is used to reconstruct 3D point clouds from these images automatically.

We performed one rainfall simulation on an erosion plot in the field covering about 16 square meters and having a slope of 9 degrees and another experiment in the laboratory with a plot of about 4 square meters and a slope of 20 degrees. Rainfall intensities were similar and high in both simulations to ensure rill formation. During the experiment, we measured soil surface changes with a time series of 3D point clouds derived via SfM photogrammetry. We also estimated runoff flow velocities with a tracer and observed the spatial pattern of runoff velocities with particle tracking velocimetry (PTV) applied to videos captured during the field experiment. At the plot outlet, we also measured runoff and sediment yield. These datasets were used as validation data for the soil erosion model.

Soil erosion was simulated with the physically-based model RillGrow and SMODERP, which conceptualizes the formation of erosion rills as a self-organizing dynamic system. We ran several thousand erosion simulations using a Monte Carlo approach. The aim was first to assess the sensitivity of the input parameters of the model, and secondly to automatically find the best fitting set of input parameter values for the given field site conditions and rainfall intensity. We compare the simulation results to global values, such as the sediment yield and runoff, and to local changes, measured by the photogrammetric 4D data.

Our study combines established as well as newly developed data recording and processing methods to create a spatio-temporal high-resolution dataset. This is used to test a soil erosion model with the aim of enhancing understanding of rill erosion processes.

This research was supported by the projects DFG EL926/3-1, SFZP 085320/2022, SS05010180, and SGS OHK1-086/23/11143.

How to cite: Grothum, O., Favis-Mortlock, D., Kavka, P., Neumann, M., Laburda, T., and Eltner, A.: Spatio-temporally highly resolved validation of a rill-based soil erosion model with 4D data, EGU General Assembly 2023, Vienna, Austria, 23–28 Apr 2023, EGU23-6524, https://doi.org/10.5194/egusphere-egu23-6524, 2023.

EGU23-8277 | PICO | SSS11.3

The Influence of Climate Change on Runoff from Headwater Catchments 

Petr Kavka, Martin Neumann, Adam Tejkl, Michal Kuráž, and Martin Hanel

This contribution presented cartographic visualization of project aims.  The goal is to presented the classification the potential utility of irrigation and available water in the Czech Republic territory in the scale of small catchment in square km size. Definition and basic classification of the are presented by Kavka (Kavka, 2021). Classification of the these catchments based on various factors such as terrain morphology, soil characteristics, drought risk, and rainfall variability with final. Main goal of presented are involves the assessing options for retention of the water in the agriculture landscape for the consequence irrigation systems. The research are also focused to the designing and implementing a system for monitoring soil water regimes in irrigated areas as a tool for optimizing irrigation systems and managing water resources.

Water resources are limited by the amount of rainfall and the ways to capture water from extreme precipitation events. To make the most efficient use of these resources, it is important to capture water directly in source catchments and use it for irrigation, rather than relying on technology-intensive infrastructure. Given the changes in climate, which in temperate Central Europe can bring about higher concentrations of extreme precipitation and longer dry periods, it is crucial to adaptation for future changes. From an agricultural perspective, changes in the rapid component of runoff and reduced retention capacity are also key considerations.

In areas that are not near significant watercourses with constant and relative high flow, local sources of water for irrigation may not be relevant. The project includes the identification of areas where it may be possible to store irrigation water at a local scale. The evaluation of the need for hydrological models, local measurements, and balance characteristics of the area. This involves determining the water needs in small catchments, primarily targeted at local irrigation systems, and researching sources of moisture needs. Data on existing and historical small reservoirs and areas with potential water storage for irrigation needs in the source catchments are used for these analyses, considering existing agro-climatic areas and identified historical irrigation systems. The areas with low or zero infiltration (paved road, cities, buildings, etc.) are identified.

 Acknowledgements: This contribution was supported by grant of the The Technology Agency of the Czech Republic – No. SS01020052 - “Utility and risk of irrigation over the Czech Republic in changing climate”. 

How to cite: Kavka, P., Neumann, M., Tejkl, A., Kuráž, M., and Hanel, M.: The Influence of Climate Change on Runoff from Headwater Catchments, EGU General Assembly 2023, Vienna, Austria, 23–28 Apr 2023, EGU23-8277, https://doi.org/10.5194/egusphere-egu23-8277, 2023.

EGU23-12071 | PICO | SSS11.3 | Highlight

Determining the contribution of nitrogen fertilizer and mineralization to volatilized ammonia through the use of nitrogen-15 

Maria Heiling, Rayehe Mirkhani, Christian Resch, Reinhard Pucher, Arsenio Toloza, and Gerd Dercon

Ammonia volatilization (AV) is one of the main pathways of nitrogen fertilizer loss, resulting in reduced crop yields, and a negative impact on the environment. Therefore, reducing AV through proper fertilizer management is essential. We can, however, only provide appropriate management advice when based on accurate measurements, along with understanding the processes involved. For this purpose, the 15N technique has a unique advantage over other methods to precisely identify the sources of ammonia production.

A field experiment was established at the SWMCN laboratory in Seibersdorf on maize with four replications and 120 kg N ha-1 was applied through two equal split applications at 20 DAP (Days After Planting) and 34 DAP. Two 15N microplots inside each main plot were installed. In these microplots, 15N-labeled urea replaced the unlabeled urea according to the time of fertilizer application. Each microplot for 15N-labelled urea was 2.5 m by 2.5 m,and the buffer zone between microplots was 1 m to minimize 15N contamination from adjacent microplot. For these microplots, 15N-labeled urea was used with an enrichment of 5.23 atom% 15N excess. The first microplot received 15N-urea at 20 DAP and unlabeled urea at 34 DAP, the second microplot received 15N-urea at 34 DAP and unlabeled urea at 20 DAP. Ammonia volatilization was measured with semi-static chambers and chambers were installed inside the 15N microplots.

The total cumulative NH3 emissions from urea after the first and second split applications were 13.9 kg N ha-1 and 18.0 kg N ha-1, respectively. This calculation is based on the difference in AV between experimental treatments and control treatment, assuming that AV in control plots indicates the amount of AV from the soil source, whereas AV of the fertilized treatments presents AV from soil and fertilizer sources. It also assumes that all nitrogen transformations, i.e., mineralization, immobilization, and other process in the case of nitrogen, are the same for control and experimental plots. Therefore, the amount of AV in urea treatment was subtracted from the amount of AV in control treatment. The cumulative NH3 emissions from the control treatment (without nitrogen fertilizer) at the same time were 2.7 kg N ha-1 and 3.6 kg N ha-1, respectively. Accordingly, about 20% of the ammonia volatilized from the soil source and the rest could be attributed to the added urea fertilizer.

However, using the 15N labelled fertilizer, it was found that the above assumption shows some flaws. The fraction of nitrogen in the ammonia samples derived from the soil is not constant but changes significantly due to nitrogen fertilizer application. The results show that the nitrogen in the ammonia derived from the fertilizer was 65% and 53% after the first and second split applications, respectively. Therefore, the fraction of nitrogen in the ammonia samples derived from the soil source was 35% and 47% after the first and second split applications. So, the use of the 15N technique shows that adding nitrogen fertilizer likely increased the rate of mineralization by changing the ratio of carbon to nitrogen.

How to cite: Heiling, M., Mirkhani, R., Resch, C., Pucher, R., Toloza, A., and Dercon, G.: Determining the contribution of nitrogen fertilizer and mineralization to volatilized ammonia through the use of nitrogen-15, EGU General Assembly 2023, Vienna, Austria, 23–28 Apr 2023, EGU23-12071, https://doi.org/10.5194/egusphere-egu23-12071, 2023.

EGU23-12154 | ECS | PICO | SSS11.3 | Highlight

Progressing experimental methods for the hydrological characterization of structural soil substrates 

Sebastian Rath, Anna Zeiser, Monika Kumpan, Peter Strauß, and Thomas Weninger

Rising demand for functionality of green infrastructure in urban environments led to the development of combined systems for stormwater retention and infiltration together with urban trees. Frequently, a special type of substrate is used based on coarse gravel or cobbles (ca. 5 – 20 cm) as structure element ensuring load bearing capacity as well as stable pore volume and combine it with a fine growing substrate with a certain storage capacity for water and nutrients. These systems got different names in different parts of the world. They are called structural soils in the US and Singapore, Stockholm systems in Northern and parts of Central Europe, as well as sponge city substrates for urban trees in Austria. Despite progress in technical knowledge about Dos and Don´ts in the installation of structural soils and their stormwater retention functionality, there are no standard lab methods for their hydrological characterization by now.

The main goal was to develop a lab method to determine the retention capacities at different matric potential states and the respective hydraulic conductivity of structural soil substrates. A major challenge therein is to handle the dimensions of the cobbles in lab conditions. For hydrological characterization, the multi-step-outflow method and the evaporation method were combined. The adopted changeable lab setup allows to determine the saturated hydraulic conductivity as well as the total pore volume at the beginning. Afterwards a ceramic pressure plate is used to perform the multistep-outflow method by applying certain negative pressures with a suction pump. In a third step the setup is changed to an evaporation method, which is used to determine the volumetric soil water content at more negative matric potentials.

The first results provide a promising basis for further developments. For example, the available water capacity of structural soil substrates can be narrowed down to around 5 percent by volume, while the air capacity is around 21 percent by volume. This study represents a first step for developing appropriate methodology for a practicable hydrological characterization of structural soils. For the future, the experiment is intended to be extended by observations of wetting front characteristic and to be applied in standard procedures by a wide range of geotechnical or soil science laboratories.

How to cite: Rath, S., Zeiser, A., Kumpan, M., Strauß, P., and Weninger, T.: Progressing experimental methods for the hydrological characterization of structural soil substrates, EGU General Assembly 2023, Vienna, Austria, 23–28 Apr 2023, EGU23-12154, https://doi.org/10.5194/egusphere-egu23-12154, 2023.

Soil is defined in different ways, depending on the scientific discipline and a project’s scope. Understanding these differences is key to facilitate clear communication of subsurface conditions within interdisciplinary project teams and allow a comprehensive presentation of results towards a broader audience. The goal of herein presented research is to find differences and analogies in discipline-dependent definitions of soil, outline resulting challenges and suggest possible solutions.

Definitions of the word soil were reviewed and analyzed in discipline-specific dictionaries of the Oxford reference dictionary series and international standards in regard to soil classifications (i. e. ISO and ASTM). Additionally, a survey was performed among professionals from different disciplines, including, but not limited to pedology, geology, engineering, geomorphology and chemistry. The survey aimed at finding out (i) how the word soil is defined by representatives of different disciplines, (ii) if there are divergent understandings between and within disciplines, (iii) if the various interpretations result in problems in interdisciplinary research and (iv) if and what kind of solutions are needed. The survey was filled out by sixty-two, mostly senior-level professionals from the private sector as well as universities and research institutions.

Together with the results of the analysis of dictionaries and international standards, the answers to the survey showed that there are recognizable differences in the understanding of the word soil and that the majority of the survey participants sees a need to find solutions to how these can be addressed, especially for interdisciplinary projects. It was found that consense among the project team and a clear and comprehensive definition of soil, as it is understood within in a specific project, is required as a minimum from the on-start of a project. Additionally, based on the results of the definitions given in literature as well as in the survey, typical definitions of soil are categorized according to discipline (e. g. soil science, geology, engineering) and a comprehensive summary of terminology and vocabulary is presented in regard to possible synonyms for the word soil. Both approaches aim to assist in defining the word soil by providing a simple terminological framework, in which the project’s detailed definition can be integrated. This framework is flexible enough to be extended to other relevant disciplines (e. g. agricultural science, forestry, law).

How to cite: Kurka, M.: What is Soil? – Addressing challenges due to interdisciplinary differences in the understanding of the word soil, EGU General Assembly 2023, Vienna, Austria, 23–28 Apr 2023, EGU23-12277, https://doi.org/10.5194/egusphere-egu23-12277, 2023.

AbstractThe reservoir-bank collapse has caused soil erosion and bank expansion in the lower Yellow River, which seriously affects the ecological environment and agricultural development. Understanding the processes of mass movement occurred on reservoir-bank is important to predict and control bank expansion. However, little research exists concerning how to accurately quantify the process of bank collapse and trace the source of sediment. In this study, a reservoir-bank model with the gentle slope of 3°, steep slope of 40° and abrupt slope of 70°, was constructed according to geomorphological characteristics of the soil reservoir-bank in Xiaolangdi Reservoir, in which rare earth elements were used to trace the provenance of sediment originated from mass movement on reservoir-bank under different rainfall conditions, and quantify the soil loss from the bank contributed to sediment deposition in reservoir. The results show that the sediment in reservoir mainly comes from steep slope, and the percentage contribution of abrupt slope to the total soil loss increases significantly in rainstorms with the precipitation larger than 60 mm. Under the rainstorms, the contributions of the gentle slope, steep slope and abrupt slope to soil loss were 10%, 55% and 35%, respectively. Without rainstorm, the contributions of the gentle slope, steep slope, and abrupt slope to soil loss were 4%, 72% and 24%, respectively. Meanwhile, sediment deposition in reservoir also mainly derived from steep slope and abrupt slope. The contribution of steep slope and abrupt slope to sediment deposition were 49% and 40% under the rainstorms, and the contribution of steep slope and abrupt slope to sediment deposition without rainfall were 67% and 28%, respectively. In addition, most of the sediment generated from the lower abrupt slope accumulates near the reservoir-bank, while the sediment generated from the steep slope accumulates at a distance from the reservoir-bank. Under the rainstorms, the contribution of upper steep slope to sediment deposition was 54% at 240 cm from the reservoir-bank, while the contribution of lower steep slope to sediment deposition without rainfall was 70% at 180 cm from the reservoir-bank. Whether with or without rainfall, the contribution of lower abrupt slope to sediment deposition was all about 54% at 40 cm from the reservoir-bank. Thus, in the near future, engineering measures such as grid protected slope may be used in the reservoir area to protect the steep slope of reservoir-bank, which can effectively reduce soil erosion and bank expansion in the reservoir area.

Keywords: Bank collapse; Mass movement; Xiaolangdi Reservoir; REEs; Rainstorm

How to cite: Ran, G., Li, T., and Xu, X.: Quantifying provenance of soil originated from mass movement on soil reservoir-bank using rare earth elements, EGU General Assembly 2023, Vienna, Austria, 23–28 Apr 2023, EGU23-16172, https://doi.org/10.5194/egusphere-egu23-16172, 2023.

EGU23-16474 | ECS | PICO | SSS11.3

Development of Geoethics and Sustainable approaches based on Pedological Education 

Hermom Reis Silva, Rosely Aparecida Liguori Imbernon, and Clara Vasconcelos

The rational use of soil has taught in Basic Education in Brazil, in accordance with the National Common Curricular Base (BNCC), from the 2nd year of elementary school. However, for the development of specific skills that involve the interaction between reflective teaching, sustainability, problem solving, among other themes, there are few school projects that promote interdisciplinary strategies for such purposes. In carrying out this pedagogical action, it was necessary to develop methodologies that would integrate the student into the knowledge construction process, from the perspective of environmental education and geoethics.

The project involves directly basic education students, 1st and 5th years of Elementary School level I, and 6th and 9th years of Elementary School level II, and indirectly with participation of high school students, as monitors, in activities in the garden and vegetable garden of School Prof. Francisco de Paula Conceição Junior, a state public school of São Paulo, Brazil.

Based on the Sustainable Development Objective - SDG 15, of the 2030 Agenda, the project developed behavioral changes in students, based on the rational use of land, while developing a teaching methodology in which the student was the protagonist in the learning process. The construction of learning spaces, such as the school's vegetable garden and garden, and the soil laboratory, were strategies in the Interventions adopted in the form of practical, theoretical, and concluding classes.

Built by the students and the teacher in charge, the garden and garden spaces corroborated the development of practical learning within the scope of sustainable development, such as recycling (maintenance of the compost bin for the production of fertilizers from waste produced at school); inclusion of the community in the project (use of sawdust and wood ash donated by traders around the school to correct the soil together with fertilizer); maintenance and planting of garden and garden spaces; implantation/use of the soil laboratory for the application of geoscientific knowledge; holding events at school about soil/planting; conducting thematic theoretical classes, conversation circles for decision-making, among others. In addition to the soil theme, the inclusion of other themes such as water resources, air quality/pollution, types and production of energy were approached, so that the student could discuss geoethics, in the use of resources of the Earth system, and man as a geological agent.

The development of activities allowed the transversality with other curricular components, the inclusion of local environmental problems, since the proposal is based on the construction of knowledge committed to the conservation, preservation, and rational use of resources, regarding geoethics.

The spaces built during the project have become pedagogical instruments for the promotion of environmental, social, cultural, scientific, and intellectual knowledge.

How to cite: Reis Silva, H., Aparecida Liguori Imbernon, R., and Vasconcelos, C.: Development of Geoethics and Sustainable approaches based on Pedological Education, EGU General Assembly 2023, Vienna, Austria, 23–28 Apr 2023, EGU23-16474, https://doi.org/10.5194/egusphere-egu23-16474, 2023.

High levels of geogenic phosphorus (P) in groundwater have been widely found worldwide, posing a potential threat to aquatic environment. Although degradation of P-containing natural organic matter (NOM) is an important process driving the enrichment of geogenic P, the detailed mechanism underlying P enrichment based on dissolved organic matter (DOM) characterization remains unclear. Herein, we chose high-P Quaternary aquifer systems in the central Yangtze River Basin, and used molecular characteristics of P-containing DOM coupled with hydrogeochemistry and carbon isotopes to unravel the detailed mechanisms responsible for the enrichment of geogenic P. The results indicate that P-containing NOM is the most critical factor controlling P enrichment in groundwater. The molecular characterization via Fourier-transform ion cyclotron resonance mass spectrometry (FT-ICR-MS) reveals that a total of 208–1534 P-containing compounds were detected in 10 groundwater samples, and predominantly consisted of one-P-atom (1P) and two-P-atom (2P) compounds. Compared to 1P compounds, 2P compounds have greater numbers of N/S-containing compounds; smaller proportions of highly unsaturated and aliphatic compounds (considered as intermediates or end-products of biodegradation); larger proportions of polyphenols and polycyclic aromatics (considered as sedimentary inputs from terrestrial vascular plants); lower H/C and nominal oxidation state of carbon (NOSC) values; and higher m/z, O/C, P/C, N/C, double bond equivalents (DBE), and aromaticity index (AI) values. We find that, at the molecular level, the degradation of P-containing DOM overall results in an increase in H/C and a decrease in O/C, and a processing gradient is observed from 2P to 1P compounds. To our knowledge, this is the first study to reveal the underlying mechanism for the enrichment of geogenic P from a molecular perspective in alluvial-lacustrine aquifer systems worldwide, which improve our understanding of biogeochemical behavior of P in subsurface environment.

How to cite: Tao, Y., Du, Y., Deng, Y., Ma, T., and Wang, Y.: Degradation of phosphorus-containing natural organic matter facilitates enrichment ofgeogenic phosphorus in Quaternary aquifer systems: A molecular perspective, EGU General Assembly 2023, Vienna, Austria, 23–28 Apr 2023, EGU23-26, https://doi.org/10.5194/egusphere-egu23-26, 2023.

EGU23-786 | ECS | Orals | BG4.3

Are there more than two end-members contributing to storm-events in small head-water catchments? 

Nicolai Brekenfeld, Ophélie Fovet, Solenn Cotel, Mikaël Faucheux, Paul Floury, Colin Fourtet, Sophie Guillon, Yannick Hamon, Hocine Henine, Patrice Petitjean, Anne-Catherine Pierson-Wickman, Marie-Claire Pierret, and Jérôme Gaillardet

Stream water chemistry at catchment outlets is commonly used to infer the flowpaths of water through the catchment and to quantify the relative contributions of various flowpaths and/or end-members during, e.g., storm events. For this purpose, the number and nature of these flowpaths or end-members are commonly defined a priori as part of the experimental design and previous knowledge, and their contributions are calculated based on the dynamics of the stream chemistry, with the inherent assumptions and uncertainties of this approach. Here, we present a methodology, which inverts this classical approach. We use the variability of the stream chemistry data to determine the minimum number of end-members needed and, more specifically, whether two end-members would be sufficient. In this methodology, we analysed the concentration-concentration relationships of several major ion combinations on the storm-event scale for multiple events, using a multi-year, high-frequency (< 60 minutes) timeseries of the major cations and anions from the outlet of two small (0.8 – 5 km²) french catchments with contrasting land-use (forest and mixed farming-cropping productions). The results indicate that a large number of storm-events (up to 92%) could be interpreted as the result of only two end-members, depending on the catchment and the ion combination used. These findings might help to revise some of the perceptual understandings of flowpath or end-member contributions in catchments during storm-events. In addition, they might stimulate the discussion about the definition of end-members or flowpaths in catchments, especially with regard to variable hydrological contributions.

How to cite: Brekenfeld, N., Fovet, O., Cotel, S., Faucheux, M., Floury, P., Fourtet, C., Guillon, S., Hamon, Y., Henine, H., Petitjean, P., Pierson-Wickman, A.-C., Pierret, M.-C., and Gaillardet, J.: Are there more than two end-members contributing to storm-events in small head-water catchments?, EGU General Assembly 2023, Vienna, Austria, 23–28 Apr 2023, EGU23-786, https://doi.org/10.5194/egusphere-egu23-786, 2023.

EGU23-3003 | ECS | Orals | BG4.3

Regulation strategy for nutrient-dependent carbon and nitrogen stoichiometric homeostasis in freshwater phytoplankton 

Wanzhu Li, Meiling Yang, Baoli Wang, and Cong-Qiang Liu

Redfield first reported a carbon: nitrogen (C:N) ratio of approximately 6.6 in marine phytoplankton. However, recent studies show that phytoplankton C:N ratio has a large range (marine: 6.5-9.9; freshwater: 7.8-10.5) and is species-specific.These studies pose a great challenge to phytoplankton stoichiometric homeostasis, which traditionally refers to their ability to maintain relatively stable elemental composition with the variation in external nutrient availability. The underlying mechanisms of the interaction between phytoplankton stoichiometric homeostasis and nutrient availability need further clarification. Therefore, in the field seven reservoirs in Tianjin, North China, were investigated to understand their phytoplankton C:N ratios and the influencing factors, and in the laboratory, Chlamydomonas reinhardtii, as a model organism, was used to investigate its C and N metabolism and relevant physiological parameters under different C and N availability. Transcriptome sequencing, nano-scale secondary ion mass spectrometry, and C stable isotope analysis were used to understand cellular C-N metabolism at the molecular level, cellular C-N compartmentation, and C utilization strategy, respectively, in the culture experiment. The main aim of this study was to understand how C-N availability affects the C:N ratio of freshwater phytoplankton at the molecular level.

The results indicated that CO2 limitation had no significant effect on the phytoplankton C:N ratio in either scene, whereas limitation of dissolved inorganic N induced the ratio to be a 35% higher in the field and a 138% higher in the laboratory, respectively. Under CO2 limitation, algal CO2-concentrating mechanisms were operated to ensure a C supply, and coupled C-N molecular regulation remained the cellular C:N ratio stable. Under nitrate limitation, differentially expressed gene-regulated intensities increase enormously, and their increasing proportion was comparable to that of the algal C:N ratio; cellular metabolism was reorganized to form a “subhealthy” C-N stoichiometric state with high C:N ratios. In addition, the N transport system had a specific role under CO2 and nitrate limitations. This study implies that algal stoichiometric homeostasis depends on the involved limitation element and will help to deepen the understanding of C-N stoichiometric homeostasis in freshwater phytoplankton.

How to cite: Li, W., Yang, M., Wang, B., and Liu, C.-Q.: Regulation strategy for nutrient-dependent carbon and nitrogen stoichiometric homeostasis in freshwater phytoplankton, EGU General Assembly 2023, Vienna, Austria, 23–28 Apr 2023, EGU23-3003, https://doi.org/10.5194/egusphere-egu23-3003, 2023.

EGU23-3052 | ECS | Posters on site | BG4.3

Riverine CO2 and CH4 concentrations and fluxes in the subtropical Pearl River system 

Shuai Chen, Lishan Ran, and Boyi Liu

Subtropical rivers and streams are identified as significant ecosystems of CO2 and CH4 emissions, yet their contribution to the global carbon cycle remains highly uncertain, partly due to field-based data paucity for the subtropics and spatial-temporal heterogeneity of CO2 and CH4 concentrations and fluxes. Here we examine the regional pattern of CO2 and CH4 concentrations and fluxes from headwater catchments (i.e., the Xijiuxi, Xiaojianghe, Liujiang, and Nanshanhe river catchments) and large river basins (i.e., the Xijiang, Beijiang, and Dongjiang river basins) in the subtropical Pearl River basin in south China. The river water CO2 partial pressure (pCO2) ranged from 208 to 3141 μatm and 433 to 4527 μatm during the high flow season and the low flow season, respectively. Positive relationships between CO2 partial pressure (pCO2) and dissolved oxygen (DO) and between pCO2 and the stable carbon isotope of dissolved inorganic carbon (δ13CDIC) demonstrated that aquatic photosynthesis and CO2 exchange at the water-air interface play significant roles in controlling the magnitude of stream water pCO2. The rivers were consistently oversaturated in CH4, ranging from 14 to 11119 μatm during the high flow season and 43 to 9596 μatm during the low flow season. The mean CO2 effluxes showed higher values in the high flow season (97 mmol m-2 d-1) and lower values in the low flow season (28 mmol m-2 d-1). The results also showed that CO2 effluxes in the four headwater streams were much higher than those in the three large rivers during both seasons. This suggested that headwater streams are significant sources of CO2 for the atmosphere. In comparison, the mean CH4 fluxes were 6.3 mmol m-2 d-1 (high flow season) to 0.5 mmol m-2 d-1 (low flow season), and CH4 concentrations and fluxes were higher in high flow season than in low flow season in headwater streams. Additionally, dissolved CH4 concentrations in urban and agricultural rivers are higher than those in forest rivers. This study highlighted the significant role of CH4 emissions from urban and agricultural river systems and CO2 emissions from headwater streams in riverine carbon cycling.

How to cite: Chen, S., Ran, L., and Liu, B.: Riverine CO2 and CH4 concentrations and fluxes in the subtropical Pearl River system, EGU General Assembly 2023, Vienna, Austria, 23–28 Apr 2023, EGU23-3052, https://doi.org/10.5194/egusphere-egu23-3052, 2023.

EGU23-3060 | Orals | BG4.3

Nitrous oxide emissions from streams in agricultural and natural areas 

Joachim Audet, Annelies J. Veraart, Nicole Wrage-Mönnig, and Mette Vodder Carstensen

Streams and rivers have been highlighted as significant but poorly constrained sources of nitrous oxide (N2O), a greenhouse gas ≈300 times more potent than carbon dioxide. A large share of stream N2O emissions arises from the use of nitrogen (N) fertilizers by agriculture and therefore most of the research on N2O emissions from streams has focused on agricultural areas, especially on fertile calcareous soils having near-neutral pH.

However, recent research suggests that streams located in regions having low pH (<5.5) and high iron content in soils may promote disproportionally high N2O emissions. We tested this hypothesis by investigating the drivers of N2O emissions in agricultural and natural streams located in regions of Denmark where soils with low pH and high iron contents are prevalent.

We measured N2O emissions monthly for a year in 10 streams located in agricultural and natural areas. Furthermore, we also measured N2O emissions four times a year in 80 streams covering a broad gradient of land-use and soil properties.

The preliminary results indicate that, within agricultural and natural areas, streams with low pH have higher emissions of N2O than those with higher pH. We will compare our results with the estimates calculated using the IPCC methodology and discuss the implications of our findings for national greenhouse gas inventories.

How to cite: Audet, J., Veraart, A. J., Wrage-Mönnig, N., and Carstensen, M. V.: Nitrous oxide emissions from streams in agricultural and natural areas, EGU General Assembly 2023, Vienna, Austria, 23–28 Apr 2023, EGU23-3060, https://doi.org/10.5194/egusphere-egu23-3060, 2023.

EGU23-3305 | ECS | Orals | BG4.3

Anthropogenic activities significantly increase annual greenhouse gas (GHG) fluxes from temperate streams, rivers, and drainage ditches in Germany 

Ricky Mwanake, Gretchen Gettel, Elizabeth Wangari, Clarissa Glaser, Tobias Houska, Lutz Breuer, Klaus Butterbach-bahl, and Ralf Kiese

Anthropogenic activities increase the contributions of inland waters to global greenhouse gas (GHG; CO2, CH4, and N2O) budgets, yet the mechanisms driving these increases are still not well constrained. In this study, we quantified year-long GHG concentrations and fluxes, as well as water physico-chemical variables from 23 streams, three ditches, and two wastewater inflow sites across five catchments in Germany contrasted by land use. Using mixed-effects models, we determined the overall impact of land use and seasonality on the intra-annual variabilities of these parameters. We found that land use was more significant than seasonality in controlling the intra-annual variability of GHG concentrations and fluxes. Agricultural land use and wastewater inflows in settlement areas resulted in elevated riverine CO2, CH4, and N2O emissions, as substrate inputs by these sources appeared to favor in situ GHG production processes. Dissolved GHG inputs directly from agricultural runoff and waste-water inputs also contributed substantially to the annual emissions from these sites. Drainage ditches were hotspots for CO2 and CH4 fluxes due to high dissolved organic matter concentrations, which appeared to favor in situ production via respiration and methanogensis. Overall, the annual emission from anthropogenic-influenced streams and rivers in CO2-equivalents was up to 20 times higher (~71 kg CO2 m-2 yr-1) than from natural streams (~3 kg CO2 m-2 yr-1). Future studies aiming to estimate the contribution of riverine systems to GHG emissions should therefore focus on anthropogenically perturbed streams, as their GHG emission are much more variable in space and time.

How to cite: Mwanake, R., Gettel, G., Wangari, E., Glaser, C., Houska, T., Breuer, L., Butterbach-bahl, K., and Kiese, R.: Anthropogenic activities significantly increase annual greenhouse gas (GHG) fluxes from temperate streams, rivers, and drainage ditches in Germany, EGU General Assembly 2023, Vienna, Austria, 23–28 Apr 2023, EGU23-3305, https://doi.org/10.5194/egusphere-egu23-3305, 2023.

EGU23-4284 | Posters on site | BG4.3

Nutrient and carbon dynamics along the river-estuary-ocean continuum on Central European scale 

Claudia Schütze, Norbert Kamjunke, Holger Brix, Götz Flöser, Ingeborg Bussmann, Eric Achterberg, Uta Ködel, Philipp Fischer, Louise Rewrie, Tina Sanders, Dietrich Borchardt, and Markus Weitere

Nutrient and carbon dynamics within the river-estuary-coastal water systems are key processes to understand the matter fluxes from the terrestrial environment to the ocean. In a large-scale study we analysed those dynamics with the focus of the prevailing low water conditions by following a sampling approach based on the travel time of water.

We started with a nearly Lagrangian sampling along the River Elbe (German part; 580 km within 8 days travel time). After a subsequent investigation of the estuary, the plume of the river was followed by raster sampling the German Bight (North Sea) using three ships simultaneously. In the river, intensive growth of phytoplankton was determined connected with high oxygen saturation and pH values as well as under-saturation of CO2, whereas concentrations of dissolved nutrients declined. In the estuary, the Elbe shifted from an autotrophic to a heterotrophic system: Phytoplankton died off upstream of the salinity gradient causing minima in oxygen saturation and pH, supersaturation of CO2, and a release of nutrients. In the coastal region, phytoplankton and nutrient concentrations were low, oxygen close to saturation, and pH in a typical marine range. We detected a positive relationship between pH values and oxygen saturation and a negative one between pCO2 and oxygen saturation. Corresponding to the significant particulate nutrient flux via phytoplankton, flux rates of dissolved nutrients from the river into the estuary were low and determined by depleted concentrations. In contrast, fluxes from the estuary to the coastal waters were higher and the pattern was determined by tidal currents.

Overall, the presented observation approach is appropriate to better understand land-ocean fluxes, particularly if it is performed under different hydrological conditions including extremes and seems to be suitable to investigate the impact of such events in freshwater on coastal systems in future.

The study was conducted within the frame of the Helmholtz MOSES initiative (Modular Observation Solutions for Earth Systems) targeting processes and impacts of hydrological extremes.

How to cite: Schütze, C., Kamjunke, N., Brix, H., Flöser, G., Bussmann, I., Achterberg, E., Ködel, U., Fischer, P., Rewrie, L., Sanders, T., Borchardt, D., and Weitere, M.: Nutrient and carbon dynamics along the river-estuary-ocean continuum on Central European scale, EGU General Assembly 2023, Vienna, Austria, 23–28 Apr 2023, EGU23-4284, https://doi.org/10.5194/egusphere-egu23-4284, 2023.

EGU23-4295 | ECS | Orals | BG4.3

Water quality responses under droughts and heatwaves in river basins worldwide 

Duncan Graham, Marc Bierkens, and Michelle van Vliet

River water quality is strongly affected by droughts and heatwaves worldwide. However, these effects have only been studied in a small number of river basins and regions, mainly in the US, Europe, or Australia. In this study, we analyse the large-scale responses in river water quality under droughts, heatwaves and compound events for 300,000+ water quality monitoring stations worldwide between 1980-2021. We include 16 water quality constituents in the analysis, grouped into general constituents (e.g. water temperature, salinity, dissolved oxygen), biological constituents (e.g. faecal coliform, biochemical oxygen demand) and emerging contaminants (e.g. pesticides and pharmaceuticals). Further, we assess the water quality responses to droughts and heatwaves in relation to climate, land use and level of wastewater treatment. We find a general deterioration in river water quality under droughts and heatwaves globally for most types of water quality constituents, with on average higher water temperatures (+27%), increases in salinity (+23%) and lower concentrations of dissolved oxygen (-17%). We also find that climate type, land use and level of wastewater treatment have a significant effect on the magnitude of water quality responses under droughts and heatwaves. The median increase in river temperature under compound drought-heatwaves strongly depends on climate, with for example higher increases in the Polar climate zone (+4.5°C) compared to the Tropical zone (+2.1°C). Increases in salinity under droughts are on average twice as large in irrigated regions compared to non-irrigated regions. Phosphorus and nitrogen concentrations in rivers can either increase or decrease during drought events, depending on the type of nutrient form (dissolved versus particulate) and land use (urban versus rural). Higher levels of wastewater treatment lead to a stronger reduction in faecal coliform (an indicator of pathogens) during droughts and heatwaves. Compared to previous local and regional-scale analyses, this study provides a more consistent and broader understanding of how droughts and heatwaves affect river water quality. In addition, the results from this study could be used to validate large-scale models of river water quality under droughts and heatwaves.

How to cite: Graham, D., Bierkens, M., and van Vliet, M.: Water quality responses under droughts and heatwaves in river basins worldwide, EGU General Assembly 2023, Vienna, Austria, 23–28 Apr 2023, EGU23-4295, https://doi.org/10.5194/egusphere-egu23-4295, 2023.

EGU23-5463 | Orals | BG4.3

Nitrate retention and subsidy in oligotrophic mountain stream-lake networks 

Imke Grefe, Peter Wynn, Eleanor Mackay, Philip Barker, Helen Grant, Gloria Pereira, Stephen Maberly, and Benjamin Surridge

With human activity rapidly accelerating the global nitrogen cycle, aquatic environments are facing increasing eutrophication and ecosystem damage. Oligotrophic headwater streams are particularly susceptible to nutrient pollution, which is affecting biodiversity, ecosystem services and water quality. However, not much in known about biogeochemical nitrogen cycling in these remote environments. This research presents seasonal data for nitrate concentrations and stable isotope signatures from oligotrophic mountain stream-lake networks in the English Lake District, UK. While phosphate concentrations were frequently below detection limit, nitrate was present throughout the year with concentrations ranging from 0.01 to 0.49 mg N L-1. Dual isotope analysis of δ15N-NO3 and δ18O-NO3 identified atmospheric deposition as an important nutrient source to the ecosystem and provided information on the fate of nitrate moving through hydrologically connected stream-lake networks. Some mountain lakes removed up to 69% of nitrate delivered by the inflow stream, while others were substantial sources compared to upstream concentrations. This contrasting lake response was consistent throughout the year, with in-lake nitrate subsidy being observed in systems where concentrations in the inflow stream dropped below 0.25 mg N L-1. These findings suggest that dominant biogeochemical processes may be controlled by nutrient load, and ecosystem response could potentially change with increasing nutrient pollution.

How to cite: Grefe, I., Wynn, P., Mackay, E., Barker, P., Grant, H., Pereira, G., Maberly, S., and Surridge, B.: Nitrate retention and subsidy in oligotrophic mountain stream-lake networks, EGU General Assembly 2023, Vienna, Austria, 23–28 Apr 2023, EGU23-5463, https://doi.org/10.5194/egusphere-egu23-5463, 2023.

EGU23-5565 | Posters on site | BG4.3

Spatio-temporal patterns in carbon distribution in supra-permafrost groundwater at a small-scale site in North-East Siberia 

Sandra Raab, Karel Castro-Morales, Jorien Vonk, Anke Hildebrandt, Martin Heimann, and Mathias Goeckede

Climate warming can influence a variety of landscape processes, including the transformation and transfer  of water, carbon and nutrients. In the Northern Hemisphere, permafrost underlays large parts of the land surface and represents a large reservoir of  organic carbon that is extremely vulnerable to changing climate conditions. Accelerated thaw can decompose permafrost carbon, and lead to modified exchange processes with the atmosphere (vertical pathway) and hydrosphere (lateral pathways). These carbon export rates are highly dependent on soil water conditions, suprapermafrost groundwater table location, and vegetation community. Depending on depth of thaw and dry or wet soil conditions, changes in the production and availability patterns of dissolved organic carbon (DOC), particulate organic carbon (POC) and dissolved inorganic carbon (DIC), the three main carbon components in water, are expected. Shifts in lateral carbon export become more relevant for quantifying the total local carbon budget with predicted future permafrost degradation due to climate warming and resulting drier soil conditions. 

This study focuses on carbon distribution patterns of the three main carbon components (DOC, POC, DIC) within a floodplain tundra site near Chersky, Northeast Siberia. We compared a wet control site with a dry site affected by a drainage ring built in 2004. A network of piezometers was established to continuously monitor water table trends during the summer season (July to September) in 2017. On several key locations within that network, water was sampled to determine carbon concentrations (DOC, POC, DIC) and carbon isotopes (∆14C-DOC, δ13C-DOC, δ13C-DIC) in 2017. Here, we analyze and discuss the spatio-temporal carbon distribution on both sites with linkages to hydrological conditions (e.g. saturated zone) and carbon isotopic observations. 

The highest concentrations throughout both sites were found for DOC, followed by DIC and POC. DIC is relatively higher at wet sites compared to dry sites. Reversely, the organic carbon components, DOC and POC, were higher at dry sites. ∆14C-DOC can be associated with fresh material and decreased at all measurement sites with time of the season. Within that range, ∆14C-DOC decreased more at dry sites, when thaw depths were deepest within that site and where water tables were lower compared to wet sites, indicating the release of older carbon. Our results show that the distribution of carbon and the respective carbon isotopes are directly related to hydrological flow patterns. Understanding the carbon redistribution processes in these ecosystems is of relevance for assessing the carbon budget in disturbed permafrost areas. These findings will therefore be used to compare climate warming induced permafrost degradation at the dry (drained) site with the wet (control) site.

How to cite: Raab, S., Castro-Morales, K., Vonk, J., Hildebrandt, A., Heimann, M., and Goeckede, M.: Spatio-temporal patterns in carbon distribution in supra-permafrost groundwater at a small-scale site in North-East Siberia, EGU General Assembly 2023, Vienna, Austria, 23–28 Apr 2023, EGU23-5565, https://doi.org/10.5194/egusphere-egu23-5565, 2023.

With global warming, a rising amount of people will be affected by water scarcity and droughts. At the same time, precipitation intensities and thus flood risks are projected to increase. Since these extremes often occur in the same location, co-management strategies of floods and droughts may offer a promising solution. The project Smart-SWS, funded by the BMBF as part of the initiative WaX – Hydrological Extreme Events, links drought prevention and flood protection with a concept for infiltrating flood waves into riverine aquifers as decentralized, technically supported underground storage. The two main challenges of the project are ensuring water quality with respect to health and environmental risks and controlling clogging of the system. The temporal asymmetry between very rapid infiltration of a flood wave and long-term storage in the aquifer, coupled with relatively long periods of no infiltration, results in stringent requirements for infiltration system design and materials.

The goal of the infiltration process is to improve retention of undesirable materials while maintaining high infiltration rates. As part of this work, potential materials will be evaluated for their suitability for infiltration of flood waters into the aquifer. For this purpose, river water quality needs to be seasonally monitored. Parameterization and characterization of clogging can be performed in column experiments using different potential materials, at different hydrodynamic and hydrochemical conditions, and with defined infiltration and dry phases. Established concepts for the transport of (bio)colloids as well as the substitution of contaminants by fluorescent tracers with similar sorption properties can be used to demonstrate the efficiency of retention and the local formation of clogging in time and space.

To test potential materials for the infiltration ditches and their contaminant retention behavior during wetting and drying cycles, a transparent column setup with temperature, pressure, electrical conductivity, redox potential, pH, and turbidity probes, as well as visual monitoring was established. This allows to record spatially resolved breakthrough curves, depositions, and reactions. We expect an increase of contaminant retention with an increase of filtered fines from the infiltrated water. Both, inorganic and organic colloids, are tested for this purpose and supplemented by experimental data from field sites. The shear forces in the porous materials are matched to the expected shear forces in the infiltration ditch. The hydrochemical stress due to a reduction in ionic strength during infiltration is also simulated in the experiments.

With this work, the behavior of contaminants and particles in infiltration systems can be predicted and optimized in order to fulfil environmental and legal requirements for the water quality.

How to cite: Augustin, L. and Baumann, T.: Infiltrating flood waves into aquifers: Column experiments on the suitability of filter materials, EGU General Assembly 2023, Vienna, Austria, 23–28 Apr 2023, EGU23-5723, https://doi.org/10.5194/egusphere-egu23-5723, 2023.

EGU23-5890 | ECS | Orals | BG4.3

A Radiocarbon Inventory of Switzerland’s Lakes 

Margot White, Benedict Mittelbach, Timo Rhyner, Negar Haghipour, Thomas Blattmann, Martin Wessels, Nathalie Dubois, and Timothy Eglinton

The Radiocarbon Inventories of Switzerland (RICH) project aims to construct the first national-scale census of (radio)carbon across aquatic, terrestrial, and atmospheric reservoirs. Within the carbon cycle, inland waters play a crucial role with lakes integrating carbon from various sources within their catchments in addition to that fixed by local primary productivity. Here we will present radiocarbon measurements of water-column dissolved inorganic carbon (DIC), dissolved organic carbon (DOC), and particulate organic carbon (POC) from 15 lakes across Switzerland covering a range of sizes, elevations, and trophic states. In addition, a year of monthly water column measurements from Switzerland’s two largest lakes - Lake Constance and Lake Geneva - reveal seasonal trends resulting from changes in productivity and river inflow. Preliminary results show that the average radiocarbon signature of DIC in both Lake Constance and Lake Geneva is depleted in 14C relative to atmospheric CO2, indicating a ca. 15-20% contribution from bedrock weathering (14C-dead carbon). The timeseries at Lake Constance builds on earlier measurements which have shown a decline in DI14C since the late 1960s due to decreasing concentrations of bomb radiocarbon in the atmosphere. DO14C values in Lake Constance are more enriched compared to DI14C, indicating the importance of terrestrial DOC sources. In contrast, DO14C values in Lake Geneva are similar to DI14C, consistent with lake primary productivity as the main source of DOC. Overall, variations in radiocarbon values between different lakes are much greater than seasonal variations observed in either Lake Constance or Lake Geneva. These results form the basis of a radiocarbon inventory of Swiss lakes and provide new insights into carbon cycling in these dynamic aquatic systems.

How to cite: White, M., Mittelbach, B., Rhyner, T., Haghipour, N., Blattmann, T., Wessels, M., Dubois, N., and Eglinton, T.: A Radiocarbon Inventory of Switzerland’s Lakes, EGU General Assembly 2023, Vienna, Austria, 23–28 Apr 2023, EGU23-5890, https://doi.org/10.5194/egusphere-egu23-5890, 2023.

EGU23-6719 | Orals | BG4.3

Analyzing Total Suspended Matter variability at the Ebro-Segre river confluence (North-East Spain) by satellite data 

Teodosio Lacava, Felice Albano, Emanuele Ciancia, Carolina Filizzola, Meriam Lahsaini, Giuseppe Mazzeo, and Carla Pietrapertosa

High-quality inland water is crucial for human life, as well as for preserving the biodiversity of the involved ecosystems and habitats. The implementation of adequate monitoring systems for inland water quality is requested by the EU Water Framework Directive, as well as foreseen within the Sustainable Development Goals of the 2015 Agenda of the United Nations. Ocean-color remote sensing may represent a useful tool to complement ground-based measurements, since it ensures synoptic view as well as a good trade-off between spatial and temporal resolution. Among the water quality parameters that can be retrieved by satellite, Total Suspended Matter (TSM) is one of the most relevant, because its fluctuations can affect light penetration and phytoplankton productivity, thus threatening the ecological status of inland waters. Optical sensors such as OLI (Operational Land Imager) onboard Landsat 8 and 9 and (MSI Multispectral Instrument) on Sentinel 2A and 2B, have already demonstrated their capabilities in providing accurate TSM retrievals with spatial resolution up to 20 and a sub-weekly temporal resolution, especially when jointly used. In this work, the long-term spatiotemporal TSM variability by satellite data has been investigated for a subset of the Segre and Ebro river confluence, just downstream the Mequinenza dam (province of Saragozza, North-East Spain). This area has been studied within the framework of the IDEWA (Irrigation and Drainage monitoring by remote sensing for Ecosystems and Water resources management) project, funded by the EU PRIMA program, to assess the impacts of irrigation activities (including drainage) on water quality within the Algerri Balaguer irrigation district. The assessment of TSM climatology, its inter-annual variability and the identification of potential extreme TSM plumes have been performed also for comparison with river discharge (Q) data (free available by the Confederación Hidrográfica del Ebro), measured close to the Mequinenza dam for the 2015-2022 period and the achieved results will be discussed in this work.

How to cite: Lacava, T., Albano, F., Ciancia, E., Filizzola, C., Lahsaini, M., Mazzeo, G., and Pietrapertosa, C.: Analyzing Total Suspended Matter variability at the Ebro-Segre river confluence (North-East Spain) by satellite data, EGU General Assembly 2023, Vienna, Austria, 23–28 Apr 2023, EGU23-6719, https://doi.org/10.5194/egusphere-egu23-6719, 2023.

EGU23-8295 | ECS | Orals | BG4.3

Estimating the global lateral transfer of nitrogen through river network using a land surface model 

Minna Ma, Haicheng Zhang, Pierre Regnier, Ronny Lauerwald, and Philippe Ciais

Lateral nitrogen (N) transport from land to the ocean through rivers is an important component of global N cycling. In this study, we present the implementation of fluvial transport of nitrogen into ORCHIDEE-CNP (Organising Carbon and Hydrology in Dynamic Ecosystems-CNP), which explicitly simulates N biogeochemistry in terrestrial ecosystems coupled with carbon, water and energy transfers. This new model branch called ORCHIDEE-Nlateral, simulates the lateral transport of water, dissolved inorganic N (DIN), dissolved organic N (DON) and particulate organic N (PON) from land to the ocean through river networks, the decomposition of DON and PON, and the denitrification of DIN in transit. ORCHIDEE-Nlateral was parameterized and evaluated based on global observations of water discharge (Global Runoff and Dara Centre, GRDC) and N concentration in the global river network (Global Water Quality Archive, GRQA). The model reproduces well the observed riverine discharges of water and total nitrogen (TN), and N exports from the land to the ocean.  Globally, the TN flowing into rivers, denitrification of DIN and TN export to the ocean all increased from the year 1901 to 2015. The TN export to the ocean increased from 32 Tg N yr-1 to 37 Tg N yr-1 during 1901–2015, which is in good agreement with the corresponding global fluxes calculated from the well-established Global NEWS 2 model. In this study, we further re-assess the spatial and temporal distribution of global riverine N flows and stocks. Overall, our model approach represents a useful tool for simulating large-scale lateral N transfer and for predicting the future feedbacks between lateral N transfers and climate.

How to cite: Ma, M., Zhang, H., Regnier, P., Lauerwald, R., and Ciais, P.: Estimating the global lateral transfer of nitrogen through river network using a land surface model, EGU General Assembly 2023, Vienna, Austria, 23–28 Apr 2023, EGU23-8295, https://doi.org/10.5194/egusphere-egu23-8295, 2023.

EGU23-9464 | ECS | Orals | BG4.3

Investigating biotic uptake of riverine organic nitrogen using a compound-specific stable-isotope probing approach. 

Charlotte Lloyd, Penny Johnes, Stephen Maberley, Christopher Yates, Leonardo Mena Rivera, Michaela Reay, Francesca Brailsford, Helen Glanville, Mike Clarke, Richard Evershed, and Davey Jones

The flux of nutrients into rivers is rising due largely to inputs from the expansion and intensification of agriculture along with inputs from treatment of human waste. This trend is set to continue due to changing climate and increasing population while we attempt to balance food security and environmental impact. While water quality legislation focuses on inorganic nutrients due to their bioavailability, the proportion of the total nitrogen (N) flux, which is organic in its molecular composition is important in many riverine systems. Despite this, the impact of organic N on ecosystem function is currently poorly understood. Here we address part of this knowledge gap using compound-specific stable isotope probing to investigate the extent to which dissolved organic matter substrates are bioavailable to stream biota and if they can be directly assimilated.

Stable isotope probing was used to identify and quantify the routes of biotic uptake of organic N and carbon (C) into stream biota. Here, we added 15N labelled (nitrate, ammonium, glucosamine, sheep urine) and doubly labelled (15N/13C) substrates (glutamic acid, urea, glycine) to in-stream mesocosms containing water and epilithon, and bryophyte communities from the River Conwy North Wales, UK. Samples of epilithon and bryophyte were removed from the incubations after 2, 6, 12, 24 and 48 h and rates of assimilation of the labelled substrate were determined using bulk 15N/13C, followed by compound-specific 15N/13C analysis of extracted amino acids. This method allowed us to demonstrate the assimilation of labelled organic substrates into newly biosynthesised proteinaceous amino acids and to determine if they were utilised as intact organic molecules.

The findings showed that the majority of the organic N substrates tested were directly bioavailable for utilisation as intact molecules by the stream biota, except for urea where transformation occurred before uptake. The data also showed that there were differences in the rates of assimilation both between the organic substrates added and between the epilithon and bryophyte communities. This work illustrates the analytical power of using doubly labelled 13C, 15N compounds in a stable isotope probing experiment, as the ability to trace the utilisation of both the N and C simultaneously had provided significant new insights in the biotic assimilation of organic-N substrates. Our findings confirm the importance of organic nutrients in ecosystem function and the need for changes to water quality legislation to reflect this.

How to cite: Lloyd, C., Johnes, P., Maberley, S., Yates, C., Mena Rivera, L., Reay, M., Brailsford, F., Glanville, H., Clarke, M., Evershed, R., and Jones, D.: Investigating biotic uptake of riverine organic nitrogen using a compound-specific stable-isotope probing approach., EGU General Assembly 2023, Vienna, Austria, 23–28 Apr 2023, EGU23-9464, https://doi.org/10.5194/egusphere-egu23-9464, 2023.

EGU23-9742 | Posters on site | BG4.3

Seasonal and event-based dynamics of dissolved organic carbon (DOC) concentration in a Mediterranean headwater catchment 

Alfonso Senatore, Giuseppina Corrente, Eugenio Argento, Jessica Castagna, Massimo Micieli, Giuseppe Mendicino, Amerigo Beneduci, and Gianluca Botter

Hydrological factors are known to contribute to regulate the DOC balance at the reach scale. Interannual, intra-annual (seasonal) and event-based hydrological variability, particularly in headwater streams, affects stream-hillslope organic matter exchanges and river network connectivity, leading to significant space and time variations in sources and processes regulating DOC dynamics.

This paper contributes to the ongoing effort to improve understanding of the related dynamics of streamflow and DOC concentration spatial variability across different timescales. Our investigation focused on a Mediterranean headwater catchment (Turbolo River, southern Italy) characterized by dry and hot summer climate enhancing network intermittency. The catchment was equipped with two multi-parameter sondes providing more than two-year (May 2019 to November 2021) continuous high-frequency measurements of several DOC-related parameters (fluorescent dissolved organic matter - fDOM, streamwater temperature and turbidity). The sondes were installed in two nested sections. The upstream sonde was located in a quasi-pristine sub-catchment, while the downstream sonde was placed at the Fitterizzi outlet, where some anthropogenic disturbances on water quality could be observed. Furthermore, streamflow data were acquired at both sites, while weather parameters were monitored at the catchment outlet. DOC estimates were achieved by correcting the fDOM values through an original procedure that did not require extensive laboratory measurements. Then, DOC dynamics at the seasonal and storm event scales were analyzed for both sites.

At the seasonal scale, results confirmed the climate control on DOC production, with background concentrations that increased in hot and dry summer months. The hydrological regulation proved crucial for DOC mobilization and export, with the top 10th percentile of discharge being associated with up to 79% of the total DOC yield. The analysis at the storm scale examined 19 events per site using flushing and hysteresis indices. Our results highlighted substantial differences between the two catchments. In the steeper upstream catchment, the limited capability of preserving hydraulic connection in time with DOC sources determined the prevalence of transport as the limiting factor to DOC export. Downstream, transport- and source-limited processes were observed almost equally. The correlation between the hysteretic behaviour and antecedent precipitation was not linear since the process turned to be transport-limited for high accumulated rainfall values. Overall, the study demonstrated the importance of high-resolution measurements to explain DOC dynamics at multiple time scales with a quantitative approach.

How to cite: Senatore, A., Corrente, G., Argento, E., Castagna, J., Micieli, M., Mendicino, G., Beneduci, A., and Botter, G.: Seasonal and event-based dynamics of dissolved organic carbon (DOC) concentration in a Mediterranean headwater catchment, EGU General Assembly 2023, Vienna, Austria, 23–28 Apr 2023, EGU23-9742, https://doi.org/10.5194/egusphere-egu23-9742, 2023.

EGU23-10848 | ECS | Posters on site | BG4.3

Lost In Transition – aquatic carbon evolution along a headwater stream network 

Brian Wang and Mark Johnson

Large amounts of carbon (C) are transported through Earth’s aquatic conduit every year. While the C transported to freshwater systems as dissolved organic C (DOC) and dissolved inorganic C (DIC) has been investigated for some time, the dynamics controlling how much DIC gets evaded to the atmosphere (as CO2) remains uncertain and an area of active investigation. Recent technological advancement using in-situ dissolved CO2 (pCO2) sensors increased previously established global C evasion estimates but sensor networks that inform this estimate have an inherent spatial bias towards major tributaries. Contributions from headwater streams where pCO2 values tend to be higher are less well constrained and tend to be biased towards daytime measurements. This research seeks to highlight how much C (as DOC and pCO2) is transported at multiple locations along a headwater to 2nd order stream system, along with an investigation of local dynamics controlling DOC and DIC transformation within the stream network.

Headwater monitoring stations were installed in University of British Columbia’s Malcolm Knapp Research Forest in the North American Pacific Coastal temperate rainforest (PCTR) region - an aquatic C hotspot due to its high productivity rainforest ecosystems and steep elevation gradient. This research reports trends of aquatic DOC dynamics and CO2 evasion fluxes where continuous DOC measurements [s::can UV-Vis Spectrolyzer] are validated monthly with the Shimadzu Total Organic Carbon analyzer and time series data obtained from dissolved CO2 probes [Vaisala GMP221] are corrected using gas chromatography [Agilent 7890A]. Monitoring stations (DOC and pCO2) installed over several kilometers in the same stream permitted an investigation into how aquatic carbon evolves between organic and inorganic phases, as well as CO2 transfer between the dissolved phase and the atmosphere.

Preliminary data indicates that over the 2 km reach, pCO2 decreased by an average of 22.8%, while DOC declined by 2.35 mg/L between upstream and downstream sites - a 74.9% reduction in DOC concentration over this distance. Ongoing research seeks to disentangle dilusion vs. aquatic metabolism as controlling factors of the observed DOC concentration reduction. In this presentation I will also discuss temporal dynamics (e.g., high flow vs. low flow conditions and hysteresis behaviour), DOC characterization (as SUVA254 and spectral slopes), and evasion flux calculations at the two locations. Results from this study will help establish transformation pathways that connect DOC and DIC with contributions to biogeochemical understanding of catchment carbon cycle and aid in identifying the role of PCTR headwater streams in the global evasion estimate context.

How to cite: Wang, B. and Johnson, M.: Lost In Transition – aquatic carbon evolution along a headwater stream network, EGU General Assembly 2023, Vienna, Austria, 23–28 Apr 2023, EGU23-10848, https://doi.org/10.5194/egusphere-egu23-10848, 2023.

EGU23-11072 | ECS | Posters virtual | BG4.3

Primary productivity in the northern Indian Ocean: role of nutrients stoichiometry 

Ajayeta Rathi, Deepika Sahoo, Himanshu Saxena, Sipai Nazirahmed, Athiyarath K Sudheer, Arvind Singh, and Sanjeev Kumar

Primary production (PP) is the basis for marine food web, which sustains life in the ocean through photosynthesis by removing carbon dioxide from the atmosphere. The rate of primary production is dependent on several factors such as light and nutrients availability, but clear mechanistic controls on this process remain elusive. Generally, primary production is sustained by a continuous supply of nutrients like nitrogen (N) and phosphorus (P). The molar ratio of ambient inorganic nutrients or stoichiometry (N:P) is supposed to have fixed values, which is Redfield ratio (6:1). However, the observed stoichiometry has been shown to considerably vary from the Redfield values and plays a significant role in affecting PP and changes in phytoplankton ecology in the ocean. The aim of this study was to examine the effects of nutrients stoichiometry (N: P) on the PP. Within this context, a series of manipulation experiments by adding nutrients in different ratios (N: P) at different concentrations level were conducted in the surface waters of the Arabian Sea and the Bay of Bengal during fall intermonsoon (Sept-Nov) 2021 using 13C tracer technique. In our results, PP showed the highest increase at N: P ~ 16:1 at all concentration levels in the Bay of Bengal. Whereas, in the Arabian sea, northern stations showed no difference in PP with changing stoichiometry but southern stations showed increase in PP due to increase in ratio at higher concentration level. 

How to cite: Rathi, A., Sahoo, D., Saxena, H., Nazirahmed, S., Sudheer, A. K., Singh, A., and Kumar, S.: Primary productivity in the northern Indian Ocean: role of nutrients stoichiometry, EGU General Assembly 2023, Vienna, Austria, 23–28 Apr 2023, EGU23-11072, https://doi.org/10.5194/egusphere-egu23-11072, 2023.

EGU23-12777 | ECS | Posters on site | BG4.3

Microbial and mass characteristics following deglaciation and exposure of watersheds in West Greenland 

Justin Ellena, Brent Christner, Jonathan Martin, and Madison Flint

Deglaciation alters chemical compositions of streams and lakes of the arctic tundra. As the Greenland Ice Sheet retreated, watersheds became isolated from glacial meltwaters, with source water derived from precipitation and permafrost and active layer meltwater.  The changes in source water, as well as increased weathering and ecological succession after exposure, alter chemical properties of the streams and lakes. These changes should allow for the development of a more complex aquatic microbial community. However, changes in microbial communities and links to changes in chemical and physical properties of streams and lakes are not fully understood. In this study, we sampled four distinct watersheds in western Greenland, including inlets and outlets of lakes, from start of the melt season in May to around mid-August. Two near-ice watersheds include a glacier melt-water stream and a non-glacially sourced stream that has been exposed for ~7 ky. Two coastal watersheds sampled  ~170 km west of the near-ice watersheds also drain no glacial meltwater and have been exposed for ~11 ky. Sampling was designed to evaluate the net flux of dissolved organic matter, cell abundance and cellular biomass through the system. Differences in these parameters at the inlet and outlet of lakes evaluate how the lakes affect processing of the cells and nutrients. Using epifluorescence microscopy, cells were counted, and the images were used to estimate the approximate biomass of the system. Cell counts and chlorophyll-a were collected from the stream to measure relative primary production and cellular abundance. The measurements for the near-ice watersheds show increased chlorophyll concentration and cell abundance at the outlets and decreases sharply midseason where it then levels off, while the furthest watershed from the ice is much more stable and increases through the melt season. The inlets for each of the watersheds show different patterns as the season progresses. Consistent with previous studies, the lowest cell concentrations occur in the glacial meltwater watershed; however, the cells were larger on average than the other watersheds. At the most upstream site for the glacially fed watershed and the furthest watershed from the ice, the average cell size increased from 0.58 μm2 to 2.04 μm2. Given that the field sites sampled represent the transition from being connected to the glacier to distantly isolated from the glacial meltwaters, these trends could indicate the change in how microbes interact with organic matter within streams as the glacier retreats. The distinction in microbial communities between the watersheds indicate that along with weathering and ecological success these communities respond to changing chemical and physical characteristics of watersheds following exposure after ice sheets retreat.

How to cite: Ellena, J., Christner, B., Martin, J., and Flint, M.: Microbial and mass characteristics following deglaciation and exposure of watersheds in West Greenland, EGU General Assembly 2023, Vienna, Austria, 23–28 Apr 2023, EGU23-12777, https://doi.org/10.5194/egusphere-egu23-12777, 2023.

EGU23-13037 | Posters on site | BG4.3

Denitrification rates measured in streams and inundated meadows 

Anne Hasselholt, Emil Skole Henriksen, Brian Kronvang, Hans Thodsen, Mette V. Carstensen, and Joachim Audet

Denitrification rates measured in streams and inundated meadows

Anne Hasselholt*, Emil S. Henriksen*, Brian Kronvang, Hans Thodsen, Mette V. Carstensen, Joachim Audet

Department of Ecoscience, Aarhus University, Aarhus C, Denmark.

*Shared first authorship


Nitrogen (N) pollution in aquatic environments is a major concern worldwide due its negative effect on water quality and biodiversity. Part of the N applied as fertilizer and manure on agricultural fields is leached to streams and further exported to the sea. To mitigate N losses from agriculture, several mitigation strategies have been implemented in Denmark including field-level measures, constructed wetlands, and restoration of wetlands.

Most of the previous research have therefore focused on investigating the retention and turnover potential of these measures. However, streams and temporarily inundated riparian area also play an important role in retaining and removing N from surface waters but the overall effect at a larger scale such as Denmark (43,100 km2) is yet poorly investigated.

To estimate the significance of N turnover in streams and temporarily flooded riparian areas, we are conducting an in situ investigation of denitrification rates spanning four seasons during 2022-2023. The denitrification rates are measured using the N isotope pairing technique in six replicate measuring chambers in 15 streams and ditches. The study will also include in situ measurements of temporarily inundated riparian areas three times a year at three locations along typical Danish streams.

The results of the present study will contribute to a new update of an existing Danish N model consisting of three sub-models (leaching model, groundwater hydrological model and several surface water sub-models; Højbjerg et al., 2020). Each sub model deals with either calculation of N-leaching from arable fields, hydrological N-transport, and N-turnover in the groundwater zone and lastly N-turnover in surface waters such as streams and temporarily inundated meadows. The model complex has been used to develop national N-retention maps for groundwater and surface waters at a scale of app. 15 km2. The new updated N-model is intended to deliver new N-retention maps on a finer scale.


References

Højberg, A.L., Thodsen, H., Børgesen, C.D., Tornbjerg, H., Nordstrøm, B.O., Troldborg, L., Hoffmann, C.C., Kjeldgaard, A., Holm, H., Audet, j., Ellermann, T., Christensen, J.H., Bach, E.O. & Pedersen, B.F. 2021. National kvælstofmodel – version 2020, Metode rapport. De Nationale Geologiske Undersøgelser for Danmark og Grønland. GEUS Specialrapport.


How to cite: Hasselholt, A., Henriksen, E. S., Kronvang, B., Thodsen, H., Carstensen, M. V., and Audet, J.: Denitrification rates measured in streams and inundated meadows, EGU General Assembly 2023, Vienna, Austria, 23–28 Apr 2023, EGU23-13037, https://doi.org/10.5194/egusphere-egu23-13037, 2023.

The role of rivers in global carbon cycles are important, especially in regard to the dissolved carbon dynamics and its variability for shorter period timescales. The contribution of non - perennial rivers on global carbon cycle has not been understood clearly, where the environmental controls on dissolved carbon in such rivers is not yet defined. Hence, the objective of the present study is to assess the seasonal and spatial variations of dissolved carbon export in a non-perennial river, Cauvery, India. The river water and the adjacent groundwater samples were collected along the river at 28 locations on quarterly basis from 2013 to 2021. The samples were analysed for pH, temperature, major ions, DIC, DOC, nutrients and 13C-DIC. The DIC concentrations were low at the locations near to the origin of the river, whereas it was vice-versa for DOC concentrations. The  source of DIC  was  due to both geogenic and biogenic, where the weathering of rocks majorly influences the DIC concentration. The silicate weathering is significant during the wet periods, whereas carbonate weathering was dominant during dry periods. The soil organic carbon along with microbial process, autrotrophic production influences the DOC concentration. The transport of dissolved carbon was high during monsoon periods and was very less during dry seasons due to lower discharge and damming.  It is estimated that the Cauvery river accounts about 5% of total DIC and 1% of total DOC transported to the Bay of Bengal from the rivers. Hence, the study implies that the seasonal variation of carbon exports in the rivers should be accounted in carbon budgets.

How to cite: Ramesh, R., Keerthan, L., and Lakshmanan, E.: Evaluation of the spatial and seasonal variations in the Dissolved Carbon Export of a non - perennial tropical river, Cauvery, Southern India, EGU General Assembly 2023, Vienna, Austria, 23–28 Apr 2023, EGU23-13049, https://doi.org/10.5194/egusphere-egu23-13049, 2023.

EGU23-13399 | ECS | Orals | BG4.3

Recent inorganic carbon increase in a temperate estuary driven by water quality improvement and enhanced by droughts 

Louise Rewrie, Yoana Voynova, Justus Beusekom, Arne Körtzinger, Gregor Ollesch, and Burkard Baschek

Estuaries are an important component of the global carbon budget as sites of removal and transformation for carbon between land and coastal ocean. Drought conditions can lengthen river and estuarine water residence time, which can extend the retention and alter the cycling of organic carbon and nutrients. To better understand the functioning of an estuary under the current threat of climate change related droughts, we use the Elbe Estuary as an example, examining a period since 1997, when annual mean DIC in the mid to lower Elbe Estuary increased significantly, and with focus on the drought conditions since 2014. 

The recent (1997-2020) significant DIC increase by 6 to 15 µmol L-1 yr-1 we found is due to increase in upper estuary POC content of 8-14 µmol L-1 yr-1 in late spring and summer (May-August). The significant increase in POC was associated with dominating autotrophy (with negative AOU and pH > 9), and an overall improvement in water quality shown in significant (> 50%) decrease in BOD7 since 1997. We found that microbial respiration of organic matter from upstream regions accounted for most of the DIC produced in the mid-estuary, therefore, the increased POC is efficiently remineralized to DIC by the mid-estuary region.

The Elbe River and estuary was subject to significantly lower river discharge between 2014 and 2020 (468 ± 234 m3 s-1), nearly 40% of the long-term average (1960-2020, 690 ± 441 m3 s-1). In addition, May was the only month with a significant negative trend in mean monthly river discharge from 1997, and down to 264 ± 19 m3 s-1 by 2020, a discharge usually observed during summer and early autumn. During the recent drought period (2014-2020), the internal gain in the carbon load as DIC in the mid to lower estuary was significantly higher, by up to 3 times, compared to the non-drought period (1997-2013). This suggests that the drought in the Elbe watershed caused a significant reduction in the average river discharge in May, likely increasing the residence time in the estuary, subsequently permitting a longer period for remineralisation of POC and greatest production of DIC in the mid-lower Elbe Estuary.

How to cite: Rewrie, L., Voynova, Y., Beusekom, J., Körtzinger, A., Ollesch, G., and Baschek, B.: Recent inorganic carbon increase in a temperate estuary driven by water quality improvement and enhanced by droughts, EGU General Assembly 2023, Vienna, Austria, 23–28 Apr 2023, EGU23-13399, https://doi.org/10.5194/egusphere-egu23-13399, 2023.

EGU23-14707 | Orals | BG4.3

A possible nitrogen limitation ahead? Low discharges fuel nitrogen retention in the Elbe estuary 

Gesa Schulz, Tina Sanders, Markus Ankele, Justus van Beusekom, and Kirstin Dähnke

Eutrophication of surface water bodies is an important factor that impairs the chemical quality of surface waters. In consequence, legislation and management efforts have been made over the past decades to reduce the agricultural nutrient input and meet the goals set by the EU Water Framework Directive and, more recently, by the UN Sustainability Goals.  

In this study, we evaluate trends in nitrate concentration and isotope composition at the entrance of the Elbe Estuary, Northern Germany.  We find a distinct seasonality of nitrate isotope composition and nitrate concentration, with high isotope values in summer, pointing towards assimilation and denitrification in the Elbe River and catchment.

Our data indicate that low discharge conditions intensify biological nitrate retention and nitrogen uptake during the growing season, leading to more intense nitrate isotope enrichments and low the water column concentrations. This suggests that recent reduction in Elbe River nutrient loads do not result from successful nutrient management but from a long-lasting drought in the catchment. In consideration of climate change predictions, we anticipate more frequent and extensive periods of low discharges, possibly even leading to a future nitrogen limitation in the lower Elbe River.  


This study was funded by the Deutsche Forschungsgemeinschaft (DFG, German Research Foundation) under Germany‘s Excellence Strategy – EXC 2037 “CLICCS - Climate, Climatic Change, and Society” – Project Number: 390683824, contribution to the Center for Earth System Research and Sustainability (CEN) of Universität Hamburg.

How to cite: Schulz, G., Sanders, T., Ankele, M., van Beusekom, J., and Dähnke, K.: A possible nitrogen limitation ahead? Low discharges fuel nitrogen retention in the Elbe estuary, EGU General Assembly 2023, Vienna, Austria, 23–28 Apr 2023, EGU23-14707, https://doi.org/10.5194/egusphere-egu23-14707, 2023.

EGU23-14745 | Posters on site | BG4.3

Dissolved organic carbon (DOC) analyses: vials, sample filtration and acidification, matrix effects and stability 

Delphine Tisserand, Damien Daval, Alejandro Fernandez-Martinez, Julien Nemery, Geraldine Sarret, Lorenzo Spadini, and Laurent Truche

Despite the presence of an ISO protocol for the determination of dissolved organic carbon (DOC) since 2018, a variety of protocols is used in the literature. The way of sampling and storage is crucial to get reliable results, especially when DOC concentrations are low. This technical note describes experiments first carried out on DOC contribution from several materials: (i) opaque glass vials versus polypropylene (PP) vials, (ii) filter membranes and (iii) acids. The effect of glass vial decontamination, as well as the temperature of storage (4° C versus -18°C) with time were evaluated. The possible matrix effects due to the presence of sulfides (SH2S), sodium (Na) or calcium (Ca) in the samples were tested.

Opaque glass vial decontamination during 3 h at 450 °C and filtering ultra-pure water through 0.45 µm hydrophilic polytetrafluoroethylene (PTFE) filters previously rinsed with 20 mL resulted in the lowest DOC deviation from the baseline with a 2.6-factor and the lowest relative standard deviation (RSD) at 5% on nine replicates. Compared to the background signal, the lowest DOC concentration was obtained when the acidification was realized with puriss analytical grade hydrochloric acid (HCl) (4.8-factor, RSD = 5%, N= 5).

Storage at 4°C ensured minor DOC changes within one month for a 1 mg L-1 DOC solution (factor of increase less than 1.5) whereas for lower concentrations close to the quantification limit (~ 0.5 mg L-1), DOC concentrations in samples filtrated through 0.45 µm PTFE filters varied up to 29% after one-week storage. Even if freezing might intuitively seem to be a reliable way to fix the chemistry of a sample with time, frozen samples showed drastic increases in DOC concentration after one month of storage, which went up to factor of increase from 10 for a 1 mg L-1 DOC acidified solution to 142 for ultra-pure water only.

The presence of sulfides (SH2S) did not induce a significant change in DOC concentration (< 10%) whereas sodium (Na) or calcium (Ca) impacted DOC analyses with underestimations from 53% to 75%.

How to cite: Tisserand, D., Daval, D., Fernandez-Martinez, A., Nemery, J., Sarret, G., Spadini, L., and Truche, L.: Dissolved organic carbon (DOC) analyses: vials, sample filtration and acidification, matrix effects and stability, EGU General Assembly 2023, Vienna, Austria, 23–28 Apr 2023, EGU23-14745, https://doi.org/10.5194/egusphere-egu23-14745, 2023.

EGU23-14805 | ECS | Posters on site | BG4.3

Biogeochemical dynamics of organic carbon fluxes in intermittent spring catchments 

Annika Feld, Christina Fasching, Martin Reiss, and Peter Chifflard

Springs represent a direct interface between groundwater and surface water. They can be classified differently with the main distinctions being the spring type and discharge, which mainly influence their biogeochemistry. However, the investigation of organic matter dynamics in springs previously have been neglected due to the assumption of stable conditions, especially in perennial springs. Contrarily, in intermittent springs higher organic carbon (OC) concentrations are expected due to the temporal interruption of the flow regime and therefore longer accumulation rates and residence times of organic matter in the adjacent soil substrate. In the course of climate change, intermittent springs will become more frequent as a consequence of decreasing groundwater levels during dry periods. Dry falling of springs during the year will therefore affect the quantity and quality of OC exports to the adjacent headwater streams.

Here we investigate 44 springs in four different study areas in Germany (Sauerland, Rhenish Slate Mountains, Ore Mountains, Black Forest) along a gradient of geology and vegetation type. We complement long-term hydrological instrumentation with quarterly biogeochemical and event-based sampling campaigns. Dissolved and particulate organic carbon concentrations (DOC and POC), composition (via absorbance and fluorescence measurements), stable water isotopes (δ2H, δ18O) and nutrient concentrations (PO4, NO3, NH4) of spring samples and additionally of precipitation, soil water and groundwater samples are analyzed.

We aim to unravel seasonal biogeochemical changes, identify drivers of spatial-temporal variability of OC fluxes and to quantify OC export fluxes of springs to the adjacent headwater streams. The results of the first seasonal sampling campaigns point to discharge impacting DOC concentrations and high spatial variability in DOC concentration and composition between the 44 spring sites within the four study catchments.

How to cite: Feld, A., Fasching, C., Reiss, M., and Chifflard, P.: Biogeochemical dynamics of organic carbon fluxes in intermittent spring catchments, EGU General Assembly 2023, Vienna, Austria, 23–28 Apr 2023, EGU23-14805, https://doi.org/10.5194/egusphere-egu23-14805, 2023.

EGU23-15778 | ECS | Orals | BG4.3

Integration of lake modeling and paleolimnological records to perform long-term simulations of water quality in Lake Geneva over 250 years (1850–2100 period) 

Laura Soares, Olivia Desgué-Itier, Isabelle Domaizon, Cecilia Barouillet, and Jean-Philippe Jenny

Lake systems are facing long-term (>150 years) changes around the world acting on multi-decadal to centennial scales. Historic temperature warming at global scales, projected to continue by the end of the century, acting concomitant with eutrophication has modified ecosystem functioning in complex ways. Process-based lake models have emerged as powerful tools to assess the effects of climate and human activities on ecosystems, as well as the responses under future scenarios since they take into account the processes in the boundaries lake-catchment and lake-atmosphere. Most of these models are constrained by short-term monitoring limnological records, traditionally ranging from days to a few decades, potentially limiting the robustness of long-term reconstructions. The integration of lake modeling and paleolimnological records can overcome the short-term monitoring data temporal scale, thereby providing a long-term perspective on lake ecosystem dynamics related to climate variability and human pressures. The present study develops a methodological framework using paleolimnological records from well-dated lake sediment records to constrain, validate and model temporal changes in water quality over a period of 250 years (1850–2100). Lake Geneva (France, Switzerland) was selected as a case study in face of its similarity with other peri-alpine lakes and its representativeness as it is one of the most studied and well-known lentic ecosystems in the world. The 1D hydrodynamic-biogeochemical GLM-AED2 model was applied to simulate dissolved oxygen, nutrients, and chlorophyll-a concentrations along the water column. Pluri-decadal series of limnological data monthly collected by the French Observatoire des LAcs (OLA database) were used to calibrate and validate the model. In addition, model outputs were further validated with published paleolimnological records for the past 170 years. Preliminary results of the calibration procedure show that the GLM-AED2 model accurately predicts the magnitude and seasonal dynamics of the state variables with goodness-of-fit metrics under the literature range (e.g. RMSE = 0.96 mg L–1 and RRMSE = 25% for dissolved oxygen; RMSE = 6.53 ug L–1 and RRMSE = 37% for chlorophyll-a, both in the epilimnion). The integration of a one-dimensional lake model, paleolimnological records, and in situ measurements supports a better understanding of the historical dynamics and provides more robust long-term hindcast/forecast simulations to elucidate the impacts of climate change and critical implications for lake management and planning.

How to cite: Soares, L., Desgué-Itier, O., Domaizon, I., Barouillet, C., and Jenny, J.-P.: Integration of lake modeling and paleolimnological records to perform long-term simulations of water quality in Lake Geneva over 250 years (1850–2100 period), EGU General Assembly 2023, Vienna, Austria, 23–28 Apr 2023, EGU23-15778, https://doi.org/10.5194/egusphere-egu23-15778, 2023.

EGU23-16261 | ECS | Orals | BG4.3

Flood modelling using disaggregated rainfall time series and estimating the probability of cholera infection from post-flood ponds in Accra, Ghana 

Auður Eva Jónsdóttir, Hannes Müller-Thomy, Jorge Leandro, and Jingshui Huang

Extreme weather events magnified by climate change will likely increase the frequency of severe flooding. In this work, we studied the effects of climate change on flooding and cholera infections associated with contaminated floodwater in the Alajo neighbourhood in Accra, Ghana, by considering projected rainfall from different climate scenarios of the GFDL-ESM4 climate model, SSP1-2.6, SSP3-7.0 and SSP5-8.5.

Rainfall of daily resolution projected by the climate scenarios was disaggregated into five-minute resolution time series using a multiplicative microcanonical cascade model, and resulting extreme events were simulated using a 1D SWMM model of the subcatchments coupled with a 2D parallel diffusive wave model (P-DWave) of Alajo. The concentration of V. cholerae in the floodwater was further simulated as coming from open drains in the neihbourhood.  

Following the flood simulation, the post-flood phase was further simulated, where the V. cholerae concentration was estimated using a constant pathogen die-off rate, and infiltration and evaporation of the post-flood ponds.

Using a quantitative microbial risk assessment (QMRA), the probabilities of infection for both adults wading and young children playing or swimming in the post-flood ponds was estimated with a Beta-Poisson dose response model for the El Tor V. Cholera biotype. The QMRA was integrated into the flood risk assessment framework, by replacing the consequence component with infection probability. The expected annual probability of infection (EAPI) for each climate scenario was then found by numerically integrate over the precedence probability.

It was found that the mean estimated EAPI is higher for young children than for adults in the study area, but only differs slightly between climate scenarios. This study highlighted the areas most vulnerable to flooding and associated cholera outbreaks, and further development of these techniques could help with decision making on preventative measures for affected areas.

How to cite: Jónsdóttir, A. E., Müller-Thomy, H., Leandro, J., and Huang, J.: Flood modelling using disaggregated rainfall time series and estimating the probability of cholera infection from post-flood ponds in Accra, Ghana, EGU General Assembly 2023, Vienna, Austria, 23–28 Apr 2023, EGU23-16261, https://doi.org/10.5194/egusphere-egu23-16261, 2023.

EGU23-16452 | ECS | Orals | BG4.3

Increasing oxygen consumption in global inland waters in the Anthropocene 

Junjie Wang, Alexander F. Bouwman, Lauriane Vilmin, Arthur H.W. Beusen, José M. Mogollón, Wim J. van Hoek, Xiaochen Liu, Weili Duan, and Jack Middelburg

The concentration of oxygen in aquatic environments influences redox reactions of chemicals, nutrient biogeochemistry, water quality, biological activities, and ecosystem health. While hypoxia and declining oxygen concentrations in marine environments have been widely reported, oxygen in global inland-water systems and its spatiotemporal changes with the changes in climate, hydrology and human activities remain unknown. To unravel the changing global inland-water oxygen cycle and driving mechanisms, here we quantify the global inland-water oxygen production, consumption, exchange with the atmosphere and transport along the aquatic continuum during 1900-2010 using the spatially-explicit, integrated assessment model IMAGE-DGNM including the mechanistic in-stream biogeochemistry module (DISC). The model keeps track of oxygen and nutrient supply from the land, and describes their coupled transformations and transport from upstream through various waterbodies to downstream. During 1900-2010, global inland-water oxygen production and consumption rapidly increased by over a factor of six and three, respectively, while river oxygen export to oceans stayed around 0.4 Pg yr-1. Despite the increasing ratio of oxygen production to consumption, inland waters overall act as an increasing sink of oxygen in the atmosphere during 1900-2010. Globally, low-order streams contribute the most to the freshwater oxygen sink, followed by lakes and recently important reservoirs, while high-order rivers overall act as an oxygen source to the atmosphere.

How to cite: Wang, J., Bouwman, A. F., Vilmin, L., Beusen, A. H. W., Mogollón, J. M., van Hoek, W. J., Liu, X., Duan, W., and Middelburg, J.: Increasing oxygen consumption in global inland waters in the Anthropocene, EGU General Assembly 2023, Vienna, Austria, 23–28 Apr 2023, EGU23-16452, https://doi.org/10.5194/egusphere-egu23-16452, 2023.

EGU23-16468 | ECS | Orals | BG4.3

Water quality and carbonate chemistry dynamics in an estuarine system impacted by mariculture 

Charissa Ferrera, Raffi Isah, Jherome Co, Rica Allana Tavita, and Jose Nickolo Perez

Cultural eutrophication due to the increasing demand of an expanding population has posed negative impacts on estuarine systems worldwide. In tropical regions, the variability in the inputs of nutrients and organic matter from rivers to coasts is further influenced by the changing monsoon seasons. This study examined the water quality and carbonate chemistry in a semi-enclosed estuary in the northwest Philippines that is used for farming milkfish and other aquaculture species. Data suggests that the mariculture area is a heterotrophic system enriched in dissolved inorganic carbon and pCO2 but depleted of nitrate due to the decomposition of unconsumed and undigested fish feeds from mariculture activities. The different river systems surrounding the estuary act as nitrate sources that could relieve nitrogen limitation during the wet season. Results also show hypoxic conditions not only in mariculture waters but in river systems as well. Accounts of the overflow of hypoxic river waters to the mariculture area could potentially provide a different mechanism of fish kill occurrence and requires further scientific observations. pH data confirm fast rates of coastal acidification in mariculture waters due to organic matter decomposition to levels that are expected to be experienced by the end of this century in open ocean conditions considering the air-sea equilibrium of increasing atmospheric CO2. These results highlight the need for more advanced biogeochemical and transdisciplinary investigations of these transition zones and their implications on climate, biodiversity, and sustainability.  

How to cite: Ferrera, C., Isah, R., Co, J., Tavita, R. A., and Perez, J. N.: Water quality and carbonate chemistry dynamics in an estuarine system impacted by mariculture, EGU General Assembly 2023, Vienna, Austria, 23–28 Apr 2023, EGU23-16468, https://doi.org/10.5194/egusphere-egu23-16468, 2023.

EGU23-16927 | Orals | BG4.3

Carbon delivery to floodplain aquifers in response to water table fluctuations: Observations from soil column experiments 

Maria Scaccia, Rachel Gabor, Fabian Wilbert, Christian Roumelis, Susana Bernal, Susan Welch, Jesús Carrera Ramirez, Albert Folch, Miquel Salgot, Alycia Insalaco, and Audrey H. Sawyer

Water tables in floodplain aquifers rise and fall over a variety of timescales in response to changes in recharge, discharge, floods, and water use. To investigate the effects of water table fluctuations on DOC delivery to groundwater, an experiment was conducted at two Mediterranean sites: a pristine forested stream and an urban coastal floodplain. Groundwater was pumped into and out of the bottom of the soil column at varying rates to simulate water table fluctuations over a period of 16 days. Flooding events were imitated by inundating the top of the column with water sourced from nearby surface water features. The effects of repeated wetting and drying events on carbon mobilization, DOM quality, and geochemical responses were measured. Preliminary analysis reveals strong downward movement of DOC from soil layers after wetting events. SUVA at 254 nm increased with DOC concentrations compounds within pore waters during wetting events. During initial water table fluctuations, redox potential near the soil-aquifer interface was relatively stable but declined after subsequent wettings. Forthcoming analyses will also examine changes in the humification, fluorescence, and freshness indices of DOM from excitation-emission matrices. This study shows the influence of multiple saturation events on carbon mobilization and shallow groundwater biogeochemistry in unique floodplains.

How to cite: Scaccia, M., Gabor, R., Wilbert, F., Roumelis, C., Bernal, S., Welch, S., Carrera Ramirez, J., Folch, A., Salgot, M., Insalaco, A., and H. Sawyer, A.: Carbon delivery to floodplain aquifers in response to water table fluctuations: Observations from soil column experiments, EGU General Assembly 2023, Vienna, Austria, 23–28 Apr 2023, EGU23-16927, https://doi.org/10.5194/egusphere-egu23-16927, 2023.

There are over 76,000 stormwater ponds in Florida, USA, forming 2.7% of total urban land cover in the state. While stormwater ponds are constructed primarily for flood control, they are often expected to perform some level of pollutant removal as well. Urban runoff conveyed to stormwater ponds contains numerous pollutants, including sediments, nutrients, dissolved organic matter, pathogens, and heavy metals. Biogeochemical processes within stormwater ponds play a large role in how these pollutants are stored, transformed, and/or removed. This presentation discusses recent work on transformations of nitrogen, phosphorus, and carbon in small urban ponds, with emphasis on implications for how these ponds can be better managed for protection of downstream waterbodies. Example studies that will be highlighted include research on the molecular characterization and bioavailability of dissolved organic nitrogen in stormwater ponds, research on the utilization of dissolved organic nutrients in stormwater ponds by the harmful algal species Karenia brevis, and a study investigating carbon storage and greenhouse gas emissions from small urban ponds

How to cite: Lusk, M.: Opening the biogeochemistry black box of small urban ponds, EGU General Assembly 2023, Vienna, Austria, 23–28 Apr 2023, EGU23-16999, https://doi.org/10.5194/egusphere-egu23-16999, 2023.

EGU23-946 | ECS | Orals | NP5.1

Combining Bayesian Neural Networks with explainable AI techniques for trustworthy probabilistic post-processing 

Mariana Clare, Zied Ben Bouallegue, Matthew Chantry, Martin Leutbecher, and Thomas Haiden

The large data volumes available in weather forecasting make post-processing an attractive field for applying machine learning. In turn, novel statistical machine learning methods that can be used to generate uncertainty information from a deterministic forecast are of great interest to forecast users, especially given the computational cost of running high resolution ensembles. In this work, we show how one such method, a Bayesian Neural Network (BNN), can be used to post-process a single global high resolution forecast for 2m temperature. This methodology improves both the accuracy of the forecast and adds uncertainty information, by predicting the distribution of the forecast error relative to its own analysis.

Here we assess both model and data uncertainty using two different BNN approaches. In the first approach, the BNN’s parameters are defined to be distributions rather than deterministic parameters, thereby generating an ensemble of models that can be used to quantify model uncertainty. In the second approach, the BNN remains deterministic but predicts a distribution rather than a deterministic output thereby quantifying data uncertainty. Our BNN results are benchmarked against simpler statistical methods, as well as statistics from the ECMWF operational ensemble.

Finally, in order to add trustworthiness to the BNN predictions, we apply an explainable AI technique (Layerwise Relevance Propagation) so as to understand whether the variables on which the BNN bases its prediction are physically reasonable or whether it is instead learning spurious correlations.

How to cite: Clare, M., Ben Bouallegue, Z., Chantry, M., Leutbecher, M., and Haiden, T.: Combining Bayesian Neural Networks with explainable AI techniques for trustworthy probabilistic post-processing, EGU General Assembly 2023, Vienna, Austria, 23–28 Apr 2023, EGU23-946, https://doi.org/10.5194/egusphere-egu23-946, 2023.

EGU23-1365 | Posters virtual | NP5.1

Improving post-processing of East African precipitation forecasts using a generative machine learning model 

Bobby Antonio, Andrew McRae, Dave MacLeod, Fenwick Cooper, John Marsham, Laurence Aitchison, Tim Palmer, and Peter Watson

Existing weather models are known to have poor skill over Africa, where there are regular threats of drought and floods that present significant risks to people's lives and livelihoods. Improved precipitation forecasts could help mitigate the negative effects of these extreme weather events, as well as providing significant financial benefits to the region. Building on work that successfully applied a state-of-the-art machine learning method (a conditional Generative Adversarial Network, cGAN) to postprocess precipitation forecasts in the UK, we present a novel way to improve precipitation forecasts in East Africa. We address the challenge of realistically representing tropical convective rainfall in this region, which is poorly simulated in conventional forecast models. We use a cGAN to postprocess ECMWF high resolution forecasts at 0.1 degree resolution and 6-18h lead times, using the iMERG dataset as ground truth, and investigate how well this model can correct bias, produce reliable probability distributions and create samples of rainfall with realistic spatial structure. We will also present performance in extreme rainfall events. This has the potential to enable cost effective improvements to early warning systems in the affected areas.

How to cite: Antonio, B., McRae, A., MacLeod, D., Cooper, F., Marsham, J., Aitchison, L., Palmer, T., and Watson, P.: Improving post-processing of East African precipitation forecasts using a generative machine learning model, EGU General Assembly 2023, Vienna, Austria, 23–28 Apr 2023, EGU23-1365, https://doi.org/10.5194/egusphere-egu23-1365, 2023.

EGU23-2592 | ECS | Orals | NP5.1

U-Net based Methods for the Postprocessing of Precipitation Ensemble Forecasting 

Romain Pic, Clément Dombry, Maxime Taillardat, and Philippe Naveau

Most Numerical Weather Prediction (NWP) systems use statistical postprocessing methods to correct for bias and underdispersion errors made by ensemble forecasting. This underdispersion leads to an underestimation of extreme events. Thus, many statistical postprocessing methods have been used to take into consideration the extremal behavior of meteorological phenomena such as precipitation. State-of-the-art techniques are based on Machine Learning combined with knowledge from Extreme Value Theory in order to improve forecasts. However, some of the best techniques do not consider the spatial dependency between locations. For example, Taillardat et al. (2019) trains a different Quantile Regression Forest at each location of interest and Rasp & Lerch (2018) uses neural networks with an embedding for the station's information in order to train a global model.
The dataset used corresponds to 3-h precipitation amounts produced by the radar-based observations of ANTILOPE and the 17-members ensemble forecast system called PEAROME. The dataset spans over the south of France with a grid resolution of 0.025 degrees. Our method uses a U-Net-like neural network in order to take into account the spatial structure of the data and the output of our model is a parameterized law at each grid point. Among the choices available in the literature, we focused on the Extended Generalized Pareto Distribution  and the truncated logistic with a point mass in 0. The model is trained by minimizing the scoring rules such as the Continuous Ranked Probability Score, the Log-Score or weighted versions of the aforementioned scoring rules. The method developed here is then compared to the raw ensemble as well as state-of-the-art techniques through scoring rules, skill scores and ROC curves.

References :

  • L. Pacchiardi, R. Adewoyin, P. Dueben, and R. Dutta. Probabilistic forecasting with generative networks via scoring rule minimization. Dec. 2021. arXiv:2112.08217
  • M. Taillardat, A.-L. Fougères, P. Naveau, and O. Mestre. Forest-based and semiparametric methods for the postprocessing of rainfall ensemble forecasting. Weather and Forecasting, 34(3):617–634, jun 2019. doi: 10.1175/waf-d-18-0149.1.

How to cite: Pic, R., Dombry, C., Taillardat, M., and Naveau, P.: U-Net based Methods for the Postprocessing of Precipitation Ensemble Forecasting, EGU General Assembly 2023, Vienna, Austria, 23–28 Apr 2023, EGU23-2592, https://doi.org/10.5194/egusphere-egu23-2592, 2023.

EGU23-2628 | ECS | Posters on site | NP5.1

Seasonal Weather Forecast Biases Dependence on Static and Dynamic Environmental Variables in the Alpine Region 

Sameer Balaji Uttarwar, Anna Napoli, Diego Avesani, and Bruno Majone

Global seasonal weather forecasts have inherent biases compared to observational datasets over mountainous regions. This can be attributed to the model's inaccurate representation of local and global environmental processes on the Earth. In this context, the objective of this study is to assess the variation of seasonal weather forecast biases with respect to static and dynamic environmental variables over the Trentino-South Tyrol region (north-eastern Italian Alps), characterized by complex terrain.

The research employs the latest fifth-generation seasonal weather forecast system (SEAS5) dataset produced by the European Center for Medium-Range Weather Forecast (ECMWF), available at a horizontal grid resolution of 0.125° x 0.125° with 25 ensemble members in a re-forecast period from 1981 to 2016. The reference dataset is a high-resolution gridded observation (250 m x 250 m) over the region of interest. The spatiotemporal variation of monthly weather (i.e., precipitation and temperature) forecast biases over the region is inferred using several statistical indicators at observational dataset grid resolution. The static and dynamic environmental variables (i.e., respectively, terrain characteristics and large-scale atmospheric circulation indices) are used univariately to interpret their relationship with monthly weather forecast biases using the linear regression technique. A statistically significant linear relation between monthly weather forecast biases and terrain characteristics, as well as large-scale atmospheric circulation indices, has been found depending on seasonality and ensemble members.

Given significant univariate linear correlation, a simple linear bias reduction model is developed and assessed by implementing a random subsampling technique in which the regression parameters are simulated by splitting the data into calibration (70%) and validation (30%). The results reveal a reduction in the monthly weather forecast bias over the region.

This study demonstrates that the local and global environmental variables should be explicitly considered in the bias correction and downscaling of the seasonal weather forecasts over complex terrain.

How to cite: Uttarwar, S. B., Napoli, A., Avesani, D., and Majone, B.: Seasonal Weather Forecast Biases Dependence on Static and Dynamic Environmental Variables in the Alpine Region, EGU General Assembly 2023, Vienna, Austria, 23–28 Apr 2023, EGU23-2628, https://doi.org/10.5194/egusphere-egu23-2628, 2023.

This work investigates several statistical tests in the context of probabilistic weather forecasting and ensemble postprocessing. The tests are commonly used for comparing predictive performance of e.g. two statistical postprocessing models.  

In the first part of the analysis a case study is conducted on temperature data consisting of observations and ensemble forecasts. The tests are applied to compare the performance of two probabilistic temperature forecasts at different stations, for different lead times, investigating several standard verification metrics to measure prediction performance. The analysis shows that the tests generally behave consistently in the context of temperature forecasts. However, for certain scenarios some tests might be be preferred over the others. In general, the combination of the original Diebold-Mariano test with the continuous ranked probability score (CRPS) to assess forecast accuracy leads to the most consistent and reliable results.

The second part of the analysis uses simulated data to investigate the general behaviour of the tests in different postprocessing scenarios as well as their size and power properties. Again, the original Diebold-Mariano test appears to perform most reliably and shows no noticeable inconsistent behaviour for different simulation settings.

How to cite: Möller, A. and Grupe, F.: Investigating properties of statistical tests for comparing predictive performance with application to probabilistic weather forecasting, EGU General Assembly 2023, Vienna, Austria, 23–28 Apr 2023, EGU23-2701, https://doi.org/10.5194/egusphere-egu23-2701, 2023.

EGU23-2902 | ECS | Posters virtual | NP5.1

D-Vine Copula based Postprocessing of Wind Speed Ensemble Forecasts 

David Jobst, Annette Möller, and Jürgen Groß

Statistical postprocessing of ensemble forecasts has become a common practice in research to correct biases and errors in calibration. Meanwhile, machine learning methods such as quantile regression forests or neural networks are often suggested as promising candidates in literature. However, interpretation of these methods is not always straightforward. 
Therefore, we propose the D-vine (drawable-vine) copula based postprocessing, where for the construction of a multivariate conditional copula the graphical D-vine model serves as building plan. The conditional copula is based on this tracetable model using bivariate copulas, which allow to describe linear as well as non-linear relationships between the response variable and its covariates. Additionally, our highly data-driven model selects the covariates based on their predictive strength and thus provides a natural variable selection mechanism, facilitating interpretability of the model. Finally, (non-crossing) quantiles from the obtained conditional distribution can be utilized as postprocessed ensemble forecasts. 
In a case study for the postprocessing of 10 m surface wind speed ensemble forecasts with 24 hour lead time we compare local and global D-vine copula based models to the zero-truncated ensemble model output statistics (tEMOS) for different sets of predictor variables at 60 surface weather stations in Germany. Furthermore, we investigate different types of training periods for both methods. We observe that the D-vine based postprocessing yields a comparable performance with respect to tEMOS models if wind speed ensemble variables are included only and a significant improvement if additional meteorological and station specific weather variables are integrated. The case study indicates that training periods capturing seasonal patterns are performing best for both models. Additionally, we provide a criterion for calculating the variable importance in D-vine copulas and utilize it to outline which predictor variables are the most important for the correction of 10 m surface wind speed ensemble forecasts.

How to cite: Jobst, D., Möller, A., and Groß, J.: D-Vine Copula based Postprocessing of Wind Speed Ensemble Forecasts, EGU General Assembly 2023, Vienna, Austria, 23–28 Apr 2023, EGU23-2902, https://doi.org/10.5194/egusphere-egu23-2902, 2023.

EGU23-5821 | ECS | Posters on site | NP5.1

A multivariate approach to combine general circulation models using graph cuts 

Lucas Schmutz, Soulivanh Thao, Mathieu Vrac, and Gregoire Mariethoz

General circulation models (GCMs) are of extreme importance to making future climate projections. Those are used extensively by policymakers to manage responses to anthropogenic global warming and climate change.

To extract a robust global signal and evaluate uncertainties, individual models are often assembled in Multi-Model Ensembles (MMEs). Various approaches to combine individual models have been developed, such as the Multi-Model Mean (MMM) or its weighted variants.

Recently, Thao et al. (2022) proposed a model comparison approach based on graph cuts. Graph cut optimization was developed in the field of computer vision to efficiently approximate a solution for low-level computer vision tasks such as image segmentation (Boykov et al., 2001). Applied to MMEs, it allows selecting for each gridpoint the best-performing model and produces a patchwork of models that maximizes performances while avoiding spatial discontinuities. Thus, it considers the local performance of individual models in contrast with approaches such as MMM or similar methods that use global weights.

Here we propose a new multivariate combination approach of MMEs based on graph cuts. Compared to the existing univariate method, our approach ensures that the relationships between variables, that are present in GCMs, are locally preserved while providing coherent spatial fields. Moreover, we measure the local performance of models using the Hellinger distance between multi-decadal distributions. This allows a combination of models that is not only indicative of the average behavior (e.g. mean temperature or mean precipitation) but of the entire multivariate distribution, including more extreme values that have a high societal and environmental impact.

REFERENCES 

Boykov, Y., Veksler, O., & Zabih, R. (2001). Fast approximate energy minimization via graph cuts. IEEE Transactions on Pattern Analysis and Machine Intelligence, 23(11), 1222–1239. https://doi.org/10.1109/34.969114

Thao, S., Garvik, M., Mariethoz, G., & Vrac, M. (2022). Combining global climate models using graph cuts. Climate Dynamics, February. https://doi.org/10.1007/s00382-022-06213-4

How to cite: Schmutz, L., Thao, S., Vrac, M., and Mariethoz, G.: A multivariate approach to combine general circulation models using graph cuts, EGU General Assembly 2023, Vienna, Austria, 23–28 Apr 2023, EGU23-5821, https://doi.org/10.5194/egusphere-egu23-5821, 2023.

EGU23-8594 | ECS | Posters on site | NP5.1

Joint Generalized Neural Models and Censored Spatial Copulas for Probabilistic Rainfall Forecasting 

David Huk, Rilwan Adewoyin, and Ritabrata Dutta

This work develops a novel method for generating conditional probabilistic rainfall forecasts with temporal and spatial dependence. A two-step procedure is employed. Firstly, marginal location-specific distributions are modelled independently of one another. Secondly, a spatial dependency structure is learned in order to make these marginal distributions spatially coherent.
To learn marginal distributions over rainfall values, we propose a class of models termed Joint Generalised Neural Models (JGNMs). These models expand the linear part of generalised linear models with a deep neural network allowing them to take into account non-linear trends of the data while learning the parameters for a distribution over the outcome space.
In order to understand the spatial dependency structure of the data, a model based on censored copulas is presented. It is designed for the particularities of rainfall data and incorporates the spatial aspect into our approach. Uniting our two contributions, namely the JGNM and the Censored Spatial Copulas into a single model, we get a probabilistic model capable of generating possible scenarios on short to long-term timescales, able to be evaluated at any given location, seen or unseen. We show an application of it to a precipitation downscaling problem on a large UK rainfall dataset and compare it to existing methods.

How to cite: Huk, D., Adewoyin, R., and Dutta, R.: Joint Generalized Neural Models and Censored Spatial Copulas for Probabilistic Rainfall Forecasting, EGU General Assembly 2023, Vienna, Austria, 23–28 Apr 2023, EGU23-8594, https://doi.org/10.5194/egusphere-egu23-8594, 2023.

EGU23-8824 | ECS | Posters on site | NP5.1

Evaluating probabilistic forecasts of extremes using continuous ranked probability score distributions 

Maxime Taillardat, Anne-Laure Fougères, Philippe Naveau, and Raphaël De Fondeville

Verifying probabilistic forecasts for extreme events is a highly active research area because popular media and public opinions are naturally focused on extreme events, and biased conclusions are readily made. In this context, classical verification methods tailored for extreme events, such as thresholded and weighted scoring rules, have undesirable properties that cannot be mitigated, and the well-known continuous ranked probability score (CRPS) is no exception.

Here, we define a formal framework for assessing the behavior of forecast evaluation procedures with respect to extreme events, which we use to demonstrate that assessment based on the expectation of a proper score is not suitable for extremes. Alternatively, we propose studying the properties of the CRPS as a random variable by using extreme value theory to address extreme event verification. An index is introduced to compare calibrated forecasts, which summarizes the ability of probabilistic forecasts for predicting extremes. The strengths and limitations of this method are discussed using both theoretical arguments and simulations.

How to cite: Taillardat, M., Fougères, A.-L., Naveau, P., and De Fondeville, R.: Evaluating probabilistic forecasts of extremes using continuous ranked probability score distributions, EGU General Assembly 2023, Vienna, Austria, 23–28 Apr 2023, EGU23-8824, https://doi.org/10.5194/egusphere-egu23-8824, 2023.

The ERA5 global reanalysis has been compared against a high-resolution regional reanalysis (COSMO-REA6) by means of scale-separation diagnostics based on 2d Haar discrete wavelet transforms. The presented method builds upon existing methods and enables the assessment of bias, error and skill for individual spatial scales, separately. A new skill score (evaluated against random chance) and the Symmetric Bounded Efficiency are introduced. These are compared to the Nash-Sutcliffe and the Kling-Gupta Efficiencies, evaluated on different scales, and the benefits of symmetric statistics are illustrated. As expected, the wavelet statistics show that the coarser resolution ERA5 products underestimate small-to-medium scale precipitation compared to COSMO-REA6. The newly introduced skill score shows that the ERA5 control member (EA-HRES), despite its higher variability, exhibits better skill in representing small-to-medium scales with respect to the smoother ensemble members. The Symmetric Bounded Efficiency is suitable for the intercomparison of reanalyses, since it is invariant with respect to the order of comparison.

How to cite: Casati, B., Lussana, C., and Crespi, A.: Scale-separation diagnostics and the Symmetric Bounded Efficiency for the inter-comparison of precipitation reanalyses, EGU General Assembly 2023, Vienna, Austria, 23–28 Apr 2023, EGU23-9083, https://doi.org/10.5194/egusphere-egu23-9083, 2023.

EGU23-9328 | Orals | NP5.1

The EUPPBench postprocessing benchmark 

Jonas Bhend, Jonathan Demaeyer, Sebastian Lerch, Cristina Primo, Bert Van Schaeybroeck, Aitor Atencia, Zied Ben Bouallègue, Jieyu Chen, Markus Dabernig, Gavin Evans, Jana Faganeli Pucer, Ben Hooper, Nina Horat, David Jobst, Janko Merše, Peter Mlakar, Annette Möller, Olivier Mestre, Maxime Taillardat, and Stéphane Vannitsem

Statistical postprocessing of forecasts from numerical weather prediction systems is an important component of modern weather forecasting systems. A growing variety of postprocessing methods has been proposed, but a comprehensive, community-driven comparison of their relative performance is yet to be established. Important reasons for this lack include the absence of a fair intercomparison protocol, and, the difficulty of constructing a common comprehensive dataset that can be used to perform such intercomparison. Here we introduce the first version of the EUPPBench, a dataset of time-aligned medium-range forecasts and observations over Central Europe, with the aim to facilitate and standardize the intercomparison of postprocessing methods. This dataset is publicly available [1], includes station and gridded data, ensemble forecasts for training (20 years) and validation (2 years) based on the ECMWF system. The initial dataset is the basis of an ongoing activity to establish a benchmarking platform for postprocessing of medium-range weather forecasts. We showcase a first benchmark of several methods for the adjustment of near-surface temperature forecasts and outline the future plans for the benchmark activity. 


[1] https://github.com/EUPP-benchmark/climetlab-eumetnet-postprocessing-benchmark

How to cite: Bhend, J., Demaeyer, J., Lerch, S., Primo, C., Van Schaeybroeck, B., Atencia, A., Ben Bouallègue, Z., Chen, J., Dabernig, M., Evans, G., Faganeli Pucer, J., Hooper, B., Horat, N., Jobst, D., Merše, J., Mlakar, P., Möller, A., Mestre, O., Taillardat, M., and Vannitsem, S.: The EUPPBench postprocessing benchmark, EGU General Assembly 2023, Vienna, Austria, 23–28 Apr 2023, EGU23-9328, https://doi.org/10.5194/egusphere-egu23-9328, 2023.

The established benefits of post-processing the results of multi-model ensembles, even by simple averaging, suggest a more radical approach: The models should be combined more frequently in run-time so as to form a single “supermodel”.  Simple nudging of models to one another, as frequently as the models might assimilate data from observations, combines model fusion with a reasonable degree of model autonomy.

Key to the success of the supermodeling approach is the phenomenon of chaos synchronization, known in the field of nonlinear dynamics, wherein two chaotic systems synchronize when connected through only a few of their variables, despite sensitive dependence on initial conditions. Synchronization gives rise to consensus among models. The nudging coefficients can be trained so that that consensus agrees with observations, because the effective dynamics of the trained supermodel, regarded as a single dynamical system, matches the dynamics of nature. Yet the number of independent nudging coefficients that must be trained is far less than the number of trainable parameters in a typical climate model.

It is expected that supermodeling will be especially useful for improving the representation of localized structures, such as blocking patterns, which will wash out if de-synchronized output fields of different models are combined by averaging.  We confirm a hypothesis that such coherent structures will synchronize even when the underlying fields do not, because the internal synchronization within each structure re-enforces synchronization between models: A configuration of CAM4 and CAM5 models, of different resolution, connected by nudging, exhibits correlated blocking activity even when the flows do not otherwise synchronize.  

We further explore the basis for correlated blocking activity in a pair of coupled quasi-geostrophic channel models. The local synchronization error is lower in a region of the channels where blocks form than elsewhere in the channels. Blocking correlations emerge as a vestige of “chimera synchronization”, the phenomenon in which complete synchronization of two spatially extended systems is intermittent in space as well as time. Such partial synchronization of different models in the regions of blocks - and of other structures such as jets, fronts, and large-scale convection - would be particularly useful for projecting climate-change patterns in extreme events associated with those structures.

How to cite: Duane, G., Schevenhoven, F., and Weiss, J.: Synchronization of Blocking Patterns in Diifferent Models, Connected So As to Form a “Supermodel” of Future Climate, EGU General Assembly 2023, Vienna, Austria, 23–28 Apr 2023, EGU23-10153, https://doi.org/10.5194/egusphere-egu23-10153, 2023.

EGU23-11230 | Posters on site | NP5.1

Mathematical Properties of Continuous Ranked Probability Score Forecasting 

Clément Dombry, Romain Pic, Philippe Naveau, and Maxime Taillardat

The theoretical advances on the properties of scoring rules over the past decades have broaden the use of scoring rules in probabilistic forecasting. In meteorological forecasting, statistical postprocessing techniques are essential to improve the forecasts made by deterministic physical models. Numerous state-of-the-art statistical postprocessing techniques are based on distributional regression evaluated with the Continuous Ranked Probability Score (CRPS). However, theoretical properties of such minimization of the CRPS have mostly considered the unconditional framework (i.e. without covariables) and infinite sample sizes. We circumvent these limitations and study the rate of convergence in terms of CRPS of distributional regression methods. We find the optimal minimax rate of convergence for a given class of distributions. Moreover, we show that the nearest neighbor method and the kernel method for distributional regression reach the optimal rate of convergence in dimension larger than 2 and in any dimension, respectively.
Associated article: https://doi.org/10.1016/j.ijforecast.2022.11.001

How to cite: Dombry, C., Pic, R., Naveau, P., and Taillardat, M.: Mathematical Properties of Continuous Ranked Probability Score Forecasting, EGU General Assembly 2023, Vienna, Austria, 23–28 Apr 2023, EGU23-11230, https://doi.org/10.5194/egusphere-egu23-11230, 2023.

It is often stated that the goal of probabilistic forecasting is to issue predictive distributions that are as sharp as possible, subject to being calibrated. To assess the calibration of ensemble forecasts, it is customary to employ rank histograms. Rank histograms not only assess whether or not an ensemble prediction system is calibrated, but they also reveal what (if any) systematic biases are present in the forecasts. This information can readily be relayed back to forecasters, helping to improve future predictions. Such is the utility of rank histograms, several extensions have been proposed to evaluate the calibration of probabilistic forecasts for multivariate outcomes. These extensions typically introduce a so-called pre-rank function that condenses the multivariate forecasts and observations into univariate objects, from which a standard rank histogram can be constructed. Several different approaches to construct multivariate rank histograms have been proposed, each of which differs in the choice of pre-rank function. Existing pre-rank functions typically aim to preserve as much information as possible when condensing the multivariate forecasts and observations into univariate objects. Although this is sensible when testing for multivariate calibration, the resulting rank histograms are often difficult to interpret, and are therefore rarely used in practice.        
We argue that the principal utility of these histogram-based diagnostic tools is that they provide forecasters with additional information regarding the deficiencies that exist in their forecasts, in turn allowing them to address these shortcomings more readily; interpretation is therefore a key requirement. We demonstrate that there are very few restrictions on the choice of pre-rank function when constructing multivariate rank histograms, meaning forecasters need not restrict themselves to the few proposed already, but can instead choose a pre-rank function on a case-by-case basis, depending on what information they want to extract from their forecasts. We illustrate this by introducing a range of possible pre-rank functions when assessing the calibration of probabilistic spatial field forecasts. The pre-rank functions that we introduce are easy to interpret, easy to implement, and they provide complementary information. Several pre-rank functions can therefore be employed to achieve a more complete understanding of the multivariate forecast performance. Finally, having chosen suitable pre-rank functions, tests for univariate calibration based on rank histograms can readily be applied to the multivariate rank histograms. We illustrate this here using e-values, which provide a theoretically attractive way to sequentially test for the calibration of probabilistic forecasts.

How to cite: Allen, S. and Ziegel, J.: Assessing the calibration of multivariate ensemble forecasts: E-values and the choice of pre-rank function, EGU General Assembly 2023, Vienna, Austria, 23–28 Apr 2023, EGU23-11660, https://doi.org/10.5194/egusphere-egu23-11660, 2023.

EGU23-12232 | ECS | Posters on site | NP5.1

Impacts of uni- and multivariate bias adjustment methods on simulations of hydrological signatures in high latitude catchments 

Faranak Tootoonchi, Andrijana Todorović, Thomas Grabs, and Claudia Teutschbein

Climate models are used to generate future hydroclimatic projections for exploring how climate change may affect water resources. Their outputs, however, feature systematic errors due to parametrization and simplification of processes at the spatiotemporal scales required for impact studies. To minimize the adverse effects of such biases, an additional bias adjustment step is typically required.

Over the past decade, adjustment methods with different levels of complexity have been developed that consider one or several variables at a time, consequently adjusting one or multiple features of climate model simulations. Despite attempts in developing such methods and the growing use of some, the selection of methods for accurate simulation of streamflow remains subjective and still highly debated. In this study, we seek to answer whether sophisticated multivariate bias adjustment methods outperform simple univariate methods in the simulation of streamflow signatures.

To this end, we systematically investigated the ability of two simple univariate and two advanced multivariate methods to accurately represent various hydrological signatures relevant for water resources management in high latitudes. We offer practical guidelines for choosing the most suitable bias adjustment methods based on the objective of each study (i.e., hydrologic signatures of interest) and the hydroclimatic regime of the study catchments.

How to cite: Tootoonchi, F., Todorović, A., Grabs, T., and Teutschbein, C.: Impacts of uni- and multivariate bias adjustment methods on simulations of hydrological signatures in high latitude catchments, EGU General Assembly 2023, Vienna, Austria, 23–28 Apr 2023, EGU23-12232, https://doi.org/10.5194/egusphere-egu23-12232, 2023.

Spatial sampling remains a conundrum for verification. The observations that are required are rarely on a grid, nor are they homogenously spaced. They are often located where there are people, easy access and do not sample the variable in a representative way. In an aggregate sense, scores derived from such observation locations, will give areas with greater observation density more weight in the aggregate if the variations in network density are not accounted for. Furthermore the performance in some parts of the domain may not be represented at all if there are no observations there. Gridded analyses on the other hand often provide complete coverage, and offer great ease of use, but adjacent grid boxes are not independent. Given this relative wealth of coverage and uniform sampling, we tend to use all available grid points for computing aggregate scores for an area or region, despite knowing that this is likely to produce too-narrow confidence intervals and inflate any statistical significance that may be present. 

In this presentation a variety of approaches, both empirical and statistical, are explored to establish what we ought to include when computing aggregate scores. Three different empirical sampling approaches are compared to selections from statistical coverage or network design algorithms. The empirical options include what is termed “strict” sub-sampling, whereby a sample is taken from the full grid and the reduction in sample size is explored by systematically continually taking a sub-sample from the sub-sample. The second is a systematic reduction in sample size from the original grid whereby each sample is drawn from the original grid, taken every other grid point, then every 3rd grid point, every 4th etc. The third is a mean computed from N random draws of reducing sample size. These empirical options do not respect land or sea locations. They are purely intended at looking at the behaviour and stability of the sample score. The coverage design algorithms provide a methodology for deriving homogeneous samples for irregularly spaced surface networks over land, and regularly spaced sampling of grids over the ocean, to achieve an optimal blend of sampling for regions that cover both land and sea.  These sample sizes and sample scores are compared to a statistically computed effective sample size. 

Some interesting and surprising results emerge. One of which is that as little as 1% of the total number of grid points may be sufficient for measuring the performance of the forecast on a grid, though the proportion of the total will always be dependent on (to varying degrees) the variable, the threshold or event of interest, the metric or score, and the characteristics of the geographical region of interest. 

How to cite: Mittermaier, M. and Gilleland, E.: Exploring empirical and statistical approaches for determining an appropriate sample size for aggregate scores, EGU General Assembly 2023, Vienna, Austria, 23–28 Apr 2023, EGU23-12242, https://doi.org/10.5194/egusphere-egu23-12242, 2023.

EGU23-12316 | Posters on site | NP5.1

On the reliability of bivariate forecasts 

Zied Ben Bouallegue

Reliability is a key attribute of an ensemble forecast. Typically, this means that one expects that the ensemble spread reflects the potential error of the corresponding ensemble mean forecast. In the realistic case of an unperfect forecast, reliability deficiencies can be diagnosed with tools such as the reliability diagram and the rank histogram. Along with the computation of scores, the use of these diagnostic tools is common practice in ensemble forecast verification when assessing univariate forecasts. But what does reliability mean in practical terms when assessing multivariate forecasts? Here the concept of reliability is revisited in the simplest of the multivariate cases: the bivariate forecast. As a result, we propose a set of new diagnostic tools with an emphasis on the cross-variable reliability aspect. Real case examples are used for illustration and discussion.

How to cite: Ben Bouallegue, Z.: On the reliability of bivariate forecasts, EGU General Assembly 2023, Vienna, Austria, 23–28 Apr 2023, EGU23-12316, https://doi.org/10.5194/egusphere-egu23-12316, 2023.

EGU23-13327 | ECS | Posters on site | NP5.1

Towards a machine learning based multimodel for precipitation forecast over the italian peninsula 

Luca Monaco, Roberto Cremonini, and Francesco Laio

Direct model output forecasts by Numerical Weather Prediction models (NWPs) present some limitations caused by errors mostly due to sensitivity to initial conditions, sensitivity to boundary conditions and deficiencies in parametrization schemes (i.e. orography).
These sources of error are unavoidable, and atmospheric chaotic dynamics make prediction errors spread rapidly in time in the course of the forecast, inducing both systematic and random errors.
Nonetheless, in the last 50 years, NWPs had a significant decrease in the impact of these sources of errors, even in the long-term forecast, thanks for instance to an ever-increasing computational capability, but their relevance is still not neglectable.
Moreover, different NWPs present specific different pros and cons which are findable empirically. For instance, in the case of precipitation forecast in north-west Italy, low-resolution models (e.g. ECMWF-IFS) are more reliable in terms of space and time in predicting the average precipitation, while high-resolution models (e.g. COSMO-2I) tend to forecast better the maximum precipitation. Research purposes apart, actual limitations must be seen in an operational context, where weather forecasts’ skillfulness and associated uncertainty are information of the utmost importance to the forecaster and in general to the user of a certain forecasts system.

To tackle these limitations of NWPs and the need for an uncertainty-quantified meteorological forecast, we propose a machine learning-based multimodel post-processing technique for precipitation forecast. We focus on precipitation since it is the most important variable in the issue of spatially localized weather alert notice by the Italian Civil Protection system and at the same time it is one of the most challenging variables to forecast. 
We use a Convolutional Neural Network (CNN) to obtain deterministic and probabilistic forecast grids over 24h up to 48h focusing on North-West Italy, using several high and low-resolution deterministic NWPs as input and using high-resolution rain-gauge corrected radar observations for the training. The effect of the usage of different convolutional parameters (e.g. stride, padding) is taken into account. The deterministic output grid is chosen as the grid with the lowest mean square error obtained during the training, and it is compared with the linear regression of the input NWPs and with every single model. The probabilistic output grid is generated by considering the statistical ensemble of the twenty grids with the lowest mean square error obtained during the training, and it is compared with the logistic regression of the input NWPs and with ECMWF-EPS as a benchmark, both at different precipitation thresholds.

How to cite: Monaco, L., Cremonini, R., and Laio, F.: Towards a machine learning based multimodel for precipitation forecast over the italian peninsula, EGU General Assembly 2023, Vienna, Austria, 23–28 Apr 2023, EGU23-13327, https://doi.org/10.5194/egusphere-egu23-13327, 2023.

In recent years neural networks have successfully been applied to probabilistic post-processing of numerical weather prediction forecasts. In the Bernstein Quantile Networks (BQN) method predictive quantile distributions are specified by Bernstein polynomials and their coefficients linked to input features through flexible neural networks. However, precipitation presents an additional challenge due to its mixed distributed nature with a considerable proportion of dry events for short accumulation periods. In this presentation, it is demonstrated how the BQN method can be modified to mixed distributed variables like precipitation by introducing a latent variable and treating zero precipitation cases as censored data. The method is tested on both synthetic and real precipitation forecast data and compared to an approach where a model of the probability of precipitation is combined with a model of precipitation amounts using the laws of probability.


How to cite: Bremnes, J. B.: Censored Bernstein quantile networks for probabilistic precipitation forecasting, EGU General Assembly 2023, Vienna, Austria, 23–28 Apr 2023, EGU23-13849, https://doi.org/10.5194/egusphere-egu23-13849, 2023.

EGU23-14425 | ECS | Posters on site | NP5.1

Lead time continuous statistical post-processing of ensemble weather forecasts 

Jakob Wessel, Chris Ferro, and Frank Kwasniok

Numerical weather prediction (NWP) models usually output their forecasts at a multiplicity of different lead times. For example, the Met Office ensemble prediction system for the UK (MOGREPS-UK) predicts atmospheric variables on a 2.2km grid for up 126h on hourly and sub-hourly timesteps. Even though for applications, information is often required on this range of lead times, many post-processing methods in the literature are either applied at fixed lead time or by fitting individual models for each lead time. This is also the case in systems used in practice such as the Met Office IMPROVER system. However, this is 1) computationally expensive because it requires the training of multiple models if users are interested in information at multiple lead times and 2) prohibitive because it restricts the training data used for training post-processing models and the usability of fitted models.

In this work we investigate lead time dependence of ensemble post-processing methods by looking at ensemble forecasts in an idealized Lorenz96 system as well as temperature forecast data from the Met Office MOGREPS-UK system. First, we investigate the lead time dependence of estimated model parameters in non-homogenous Gaussian regression (NGR -- a standard ensemble post-processing technique) and find substantial smoothness. Secondly, we look at the usability of models fitted for one lead time and employed at another to then thirdly fit models that are “lead time continuous”, meaning they work for multiple lead times simultaneously by including lead time as a covariate using spline regression. We show that these models can achieve similar performance to the classical “lead time separated” models, whilst saving substantial computation time. Fourthly and finally we make first steps towards the development of a cheap computational model including seasonality and working continuously over the lead time, needing to be fit only once.

How to cite: Wessel, J., Ferro, C., and Kwasniok, F.: Lead time continuous statistical post-processing of ensemble weather forecasts, EGU General Assembly 2023, Vienna, Austria, 23–28 Apr 2023, EGU23-14425, https://doi.org/10.5194/egusphere-egu23-14425, 2023.

EGU23-14560 | ECS | Posters on site | NP5.1

Quantile regression forests for post-processing ECWMF ensemble precipitation forecasts: hyperparameter optimization and comparison to EMOS 

Eva van der Kooij, Antonello Squintu, Kirien Whan, and Maurice Schmeits

Ensemble forecasts are important due to their ability to characterize forecast uncertainty, which is fundamental when forecasting extreme weather. Ensemble forecasts are however often biased and underdispersed and thus need to be post-processed.

A common approach for this is the use of ensemble model output statistics (EMOS), where a parametric distribution is fitted with a limited number of predictors. With recent advances in computer science and increased amounts of data available, machine learning techniques, like random forests, are becoming more popular for high dimensional regression problems. In this research, we explore the use of the quantile regression forest (QRF), a random forest adapted for conditional quantile estimation, applied to medium range gridded probabilistic precipitation forecasts. QRFs are non-parametric and allow for a larger number of predictors, which means they can possibly consider more dependencies that might otherwise not be captured with a simple EMOS.

A QRF takes several hyperparameters that influence the way the decision trees in the forest are constructed. We explore the minimum number of samples needed in a leaf to split it (minimum node size) and the number of predictors explored in each split (mtry). A hyperparameter space is constructed by setting ranges for both minimum node size and mtry, and the optimal hyperparameter set is determined by performing a cross validated grid search. Here, each model is assessed based on the continuous ranked probability skill score (CRPSS). For comparison, EMOS is applied with a zero-adjusted gamma (ZAGA) distribution, using a limited number of predictors that are physically correlated to precipitation. Both methods are verified on a separate testing data set and evaluated using several scores, including CRPSS and Brier skills score (BSS).

We consider 4 years (November 2018 – October 2022) of archived operational ECMWF-IFS ensemble forecasts for the Netherlands. The data is split into November 2018 – October 2021 for training and cross-validation, and October 2021 – October 2022 for testing, separating data for season, initialization time and lead-time. Forecasts are post-processed up to +10 days. Ensemble statistics on 60+ forecast variables are used as predictors. Spatially and temporally aggregated, gauge-adjusted radar observations are used as predictand. The raw ensemble is considered as the benchmark.

The results of this research will determine what method will be used to post-process the ensemble precipitation forecasts in the context of the early warning center (EWC) of the Royal Netherlands Meteorological Institute. The most suitable method could differ between shorter and longer lead times.

How to cite: van der Kooij, E., Squintu, A., Whan, K., and Schmeits, M.: Quantile regression forests for post-processing ECWMF ensemble precipitation forecasts: hyperparameter optimization and comparison to EMOS, EGU General Assembly 2023, Vienna, Austria, 23–28 Apr 2023, EGU23-14560, https://doi.org/10.5194/egusphere-egu23-14560, 2023.

EGU23-14712 | ECS | Orals | NP5.1

NWP model updates and post-processing: a strategy for an EMOS model on ECMWF wind gusts forecasts 

Antonello A. Squintu, Eva van der Kooij, Kirien Whan, and Maurice Schmeits

In the framework of KNMI’s Early Warning Center (EWC), ECMWF ensemble (ENS) predictions are used to issue medium-range forecasts of severe weather. Timely forecasts of wind gusts extremes are important to prevent potential damage. However, ensemble forecasts are affected by biases and under- or over-dispersion. These errors lead to a reduction in the skill of the forecasts, especially for long lead-times and for extreme cases, such as windstorms and deep convective episodes. Hence, statistical post-processing is a fundamental step in the establishment of a skillful weather alert system for extreme wind gust events.     

However, weather models like ECMWF-IFS are subject to frequent updates, which include changes in the calculation of certain diagnostic variables and by consequence in statistical features of their ensemble distribution. This is the case for ECMWF wind gusts forecasts, whose bias has been reduced with the last update in October 2021. Therefore, the use of pre-update wind gusts forecasts in the training of the post-processing model must be considered with care.

In the context of the development of an Ensemble Model Output Statistics (EMOS) model, this limitation has been tackled by reconstructing wind-gusts forecasts with a preliminary EMOS model. This step has been performed by including in the regression those variables that are used by ECMWF for the calculation of wind gusts, which were less affected by the update.

The reconstructed wind gusts forecasts have been added to a set of summary statistics of the ensemble distribution of variables physically related to wind gusts. A process of forward selection has been applied to identify the most relevant contributions to the general EMOS model, highlighting reconstructed wind gusts as the most important predictor for all lead-times.

The post-processed forecasts obtained with this experimental EMOS model have been verified and compared to those calculated with a conventional EMOS model (performed ignoring the above caveats) and with the results of a non-parametric Quantile Regression Forest. These models have been trained on the same period (2018-2021) and tested on the period that has followed the update (2021-2022), including only grid-points and stations that cover the territory of the Netherlands and distinguishing between summer and winter half-years. The method showing the best performance will be employed operationally for the post-processing of ECMWF-ENS wind gust forecasts over the Netherlands and will be used in the EWC weather alert system.

How to cite: Squintu, A. A., van der Kooij, E., Whan, K., and Schmeits, M.: NWP model updates and post-processing: a strategy for an EMOS model on ECMWF wind gusts forecasts, EGU General Assembly 2023, Vienna, Austria, 23–28 Apr 2023, EGU23-14712, https://doi.org/10.5194/egusphere-egu23-14712, 2023.

EGU23-15152 | ECS | Posters on site | NP5.1

Towards sub-kilometer resolution probabilistic analysis of surface wind in complex terrain 

Francesco Zanetta, Daniele Nerini, Matteo Buzzi, and Mark A. Liniger

Correctly representing surface wind is critical for applications such as renewable energy, snow modelling or warning systems. However, numerical weather prediction models with their limited resolution cannot fully represent the strong variability due to complex topography. Downscaling techniques – functionally equivalent to postprocessing when the ground truth is given by observational data - can achieve remarkable results in reducing systematic biases of raw models and can be calibrated to yield accurate probabilistic information at any point in space. 

These techniques can be further improved at analysis time by including real-time measurements, allowing to produce a probabilistic sub-grid resolution analysis of surface wind. Such a product would enable other interesting applications, such as detailed climatologies or nowcasting, and could serve as a ground truth for training deep learning-based postprocessing models with generative approaches, allowing to model spatially and temporally consistent ensembles.  

The first important challenge is to integrate measurements in a statistically optimized and efficient way. Here, we share our ongoing work and preliminary results in a comparative analysis of different approaches, from naïve interpolations to geostatistical techniques or novel approaches based on neural networks. The analysis is based on a multi-year archive of hourly wind observations and NWP analyses from the operational COSMO-1E model over Switzerland. 

How to cite: Zanetta, F., Nerini, D., Buzzi, M., and Liniger, M. A.: Towards sub-kilometer resolution probabilistic analysis of surface wind in complex terrain, EGU General Assembly 2023, Vienna, Austria, 23–28 Apr 2023, EGU23-15152, https://doi.org/10.5194/egusphere-egu23-15152, 2023.

EGU23-17348 | Orals | NP5.1

Postprocessing of ensemble precipitation forecasts over India using weather types 

Martin Widmann, Noemi Gonczol, Michael Angus, and Robert Neal

Accurate predictions of heavy precipitation in India are vital for impact-orientated forecasting, and an essential requirement for mitigating the impact of damaging flood events. Operational forecasts from non-convection-permitting models can have large biases in the intensities of heavy precipitation, and while convection-permitting models can perform better, their operational use over large areas is not yet feasible. Statistical postprocessing can reduce these biases for relatively little computational cost, but few studies have focused on postprocessing forecasts of monsoonal rainfall.

We present a postprocessing method for operational precipitation forecasts based on local precipitation distributions for 30 Indian weather types. It is applied to ensemble forecasts for daily precipitation with 12km spatial resolution and lead times of up to 10 days from the Indian National Centre for Medium Range Weather Forecasting (NCMRWF) Ensemble Prediction System (NEPS). The method yields local probabilistic forecasts that are the weighted mean of the observed local precipitation distributions for each weather type, with weights given by the relative frequency of the weather types in the forecast ensemble.

The general forecast skill is determined through the Continuous Ranked Probability Skill Score (CRPSS) and the skill for predicting the exceedance of the local 90th percentile is quantified through the Brier Skill Score (BSS). The CRPSS shows moderate improvement over most of India for forecasts with one day lead time, and substantial improvements almost everywhere for longer lead times. The BSS for one day forecasts indicates a spatially complex pattern of higher and lower performance, while for longer lead times the forecasts for heavy precipitation are improved almost everywhere. The improvements with respect to both measures are particularly high over mountainous or wet regions. We will also present reliability diagrams for the raw and postprocessed forecasts of threshold exceedances.


How to cite: Widmann, M., Gonczol, N., Angus, M., and Neal, R.: Postprocessing of ensemble precipitation forecasts over India using weather types, EGU General Assembly 2023, Vienna, Austria, 23–28 Apr 2023, EGU23-17348, https://doi.org/10.5194/egusphere-egu23-17348, 2023.

EGU23-1095 | Orals | NP5.2

Recent offline land data assimilation results and future steps towards coupled DA at Meteo-France 

Jean-Christophe Calvet, Bertrand Bonan, and Yiwen Xu

Land data assimilation aims to monitor the evolution of soil and vegetation variables. These variables are driven by climatic conditions and by anthropogenic factors such as agricultural practices. Monitoring terrestrial surfaces involves a number of variables of the soil-plant system such as land cover, snow, surface albedo, soil water content and leaf area index. These variables can be monitored by integrating satellite observations into models. This process is called data assimilation. Integrating observations into land surface models is particularly important in changing climate conditions because environmental conditions and trends never experienced before are emerging. Because data assimilation is able to weight the information coming from contrasting sources of information and to account for uncertainties, it can produce an analysis of terrestrial variables that is the best possible estimation. In this work, data assimilation is implemented at a global scale by regularly updating the model state variables of the ISBA land surface model within the SURFEX modelling platform: the LDAS-Monde sequential assimilation approach. Model-state variable analysis is done for initializing weather forecast atmospheric models. Weather forecast relies on observations to a large extent because of the chaotic nature of the atmosphere. Land variables are not chaotic per se but rapid and complex processes impacting the land carbon budget such as forest management (thinning, deforestation, ...), forest fires and agricultural practices are not easily predictable with a good temporal precision. They cannot be monitored without integrating observations as soon as they are available. We focus on the assimilation of leaf area index (LAI), using land surface temperature (LST) for verification. We show that (1) analyzing LAI together with root-zone soil moisture is needed to monitor the impact of irrigation and heat waves on the vegetation, (2) LAI can be forecasted after properly initializing ISBA. This paves the way to more interactive assimilation of land variables into numerical weather forecast and seasonal forecast models, as well as in atmospheric chemistry models.


How to cite: Calvet, J.-C., Bonan, B., and Xu, Y.: Recent offline land data assimilation results and future steps towards coupled DA at Meteo-France, EGU General Assembly 2023, Vienna, Austria, 23–28 Apr 2023, EGU23-1095, https://doi.org/10.5194/egusphere-egu23-1095, 2023.

EGU23-1846 | Posters on site | NP5.2 | Highlight

Hybrid covariance super-resolution data assimilation 

Sébastien Barthélémy, Julien Brajard, Laurent Bertino, and François Counillon

This work extends the concept of "Super-resolution data assimilation" (SRDA, Barthélémy et al. 2022)) to the case of mixed-resolution ensembles pursuing two goals: (1) emulate the Ensemble Kalman Filter while (2) benefit from high-resolution observations. The forecast step is performed by two ensembles at two different resolutions, high and low-resolution. Before the assimilation step the low-resolution ensemble is downscaled to the high-resolution space, then both ensembles are updated with high-resolution observations. After the assimilation step, the low-resolution ensemble is upscaled back to its low-resolution grid for the next forecast. The downscaling step before the data assimilation step is performed either with a neural network, or with a simple cubic spline interpolation operator. The background error covariance matrix used for the update of both ensembles is a hybrid matrix between the high and low resolution background error covariance matrices. This flavor of the SRDA is called "Hybrid covariance super-resolution data assimilation" (Hybrid SRDA). We test the method with a quasi-geostrophic model in the context of twin-experiments with the low-resolution model being twice and four times coarser than the high-resolution one. The Hybrid SRDA with neural network performs equally or better than its counterpart with cubic spline interpolation, and drastically reduces the errors of the low-resolution ensemble. At equivalent computational cost, the Hybrid SRDA outperforms both the SRDA (8.4%) and the standard EnKF (14%). Conversely, for a given value of the error, the Hybrid SRDA requires as little as  50% of the computational resources of  the EnKF. Finally, the Hybrid SRDA can be formulated as a low-resolution scheme, in the sense that the assimilation is performed in the low-resolution space, encouraging the application of the scheme with realistic ocean models.

How to cite: Barthélémy, S., Brajard, J., Bertino, L., and Counillon, F.: Hybrid covariance super-resolution data assimilation, EGU General Assembly 2023, Vienna, Austria, 23–28 Apr 2023, EGU23-1846, https://doi.org/10.5194/egusphere-egu23-1846, 2023.

All-sky radiance assimilation often has non-Gaussian observation error distributions, which can be exacerbated by high model spatial resolutions due to better resolved nonlinear physical processes. For ensemble Kalman filters, observation ensemble perturbations can be approximated by linearized observation operator (LinHx) that uses the observation operator Jacobian of ensemble mean rather than full observation operator (FullHx). The impact of observation operator on infrared radiance data assimilation is examined here by assimilating synthetic radiance observations from channel 1025 of GIIRS with increased model spatial resolutions from 7.5 km to 300 m. A tropical cyclone is used, while the findings are expected to be generally applied. Compared to FullHx, LinHx provides larger magnitudes of correlations and stronger corrections around observation locations, especially when all-sky radiances are assimilated at fine model resolutions. For assimilating clear-sky radiances with increasing model resolutions, LinHx has smaller errors and improved vortex intensity and structure than FullHx. But when all-sky radiances are assimilated, FullHx has advantages over LinHx. Thus for regimes with more linearity, LinHx provides stronger correlations and imposes more corrections than FullHx; but for regimes with more nonlinearity, LinHx provides detrimental non-Gaussian prior error distributions in observation space, unrealistic correlations and overestimated corrections, compared to FullHx.

How to cite: Lei, L.: Impacts of Observation Forward Operator on Infrared Radiance Data Assimilation with Fine Model Resolutions, EGU General Assembly 2023, Vienna, Austria, 23–28 Apr 2023, EGU23-3011, https://doi.org/10.5194/egusphere-egu23-3011, 2023.

EGU23-3086 | Posters on site | NP5.2

Comparison of optimization methods for the maximum likelihood ensemble filter 

Takeshi Enomoto and Saori Nakashita

The Newton method, which requires the Hessian matrix, is prohibitively expensive in adjoint-based variational data assimilation (VAR). It may be rather attractive for ensemble-based VAR because the ensemble size is usually several orders of magnitude smaller than that of the state size. In the present paper the Newton method is compared against the conjugate-gradient (CG) method, which is one of the most popular choices in adjoint-based VAR. To make comparisons, the maximum likelihood ensemble filter (MLEF) is used as a framework for data assimilation experiments. The Hessian preconditioning is used with CG as formulated in the original MLEF. Alternatively we propose to use the Hessian in the Newton method. In the exact Newton (EN) method, the Newton equation is solved exactly, i.e. the step size is fixed to unity avoiding a line search. In the 1000-member wind-speed assimilation test, CG is stagnated early in iteration and terminated due to a line search error while EN converges quadratically. This behaviour is consistent with the workings of the EN and CG in the minimization of the Rosenbrock function. In the repetitive cycled experiments using the Korteweg-de Vries-Burgers (KdVB) model with a quadratic observation operator, EN performs competitively in accuracy to CG with significantly enhanced stability. These idealized experiments indicate the benefit of adopting EN for the optimization in MLEF.

How to cite: Enomoto, T. and Nakashita, S.: Comparison of optimization methods for the maximum likelihood ensemble filter, EGU General Assembly 2023, Vienna, Austria, 23–28 Apr 2023, EGU23-3086, https://doi.org/10.5194/egusphere-egu23-3086, 2023.

EGU23-3761 | ECS | Posters on site | NP5.2

Observation space localizations for the maximum likelihood ensemble filter 

Saori Nakashita and Takeshi Enomoto

The maximum likelihood ensemble filter (MLEF) can handle nonlinearity of observation operators more appropriately than conventional ensemble Kalman filters. Here we consider the observation space localization method for MLEF to enable application to large-scale problems in the atmosphere. Optimization of the cost function in MLEF, however, impedes local analysis, suitable for massive parallel computers, in the same manner as the local ensemble transform Kalman filter (LETKF). In this study two approaches to observation space localization for MLEF (LMLEF) are compared. The first method introduces local gradients to minimize the global cost function (Yokota et al. 2016). An alternative approach, proposed here, defines a local cost function for each grid assuming a constant ensemble weight in the local domain to enable embarrassingly parallel analysis. The two approaches are compared to LETKF in cycled data assimilation experiments using the Lorenz-96 and the SPEEDY models. LMLEFs are found to be more accurate and stable than LETKF when nonlinear observations are assimilated into each model. Our proposed method is comparable to Yokota's global optimization method when dense observations are assimilated into the Lorenz-96 model. This result is consistent with the fact that ensemble weights have high spatial correlations with those at neighboring grids. Although our method also yields similar analysis in the SPEEDY experiments with a more realistic observation network, Yokota’s global optimization method shows faster error convergence in the earlier cycles. The error convergence rate seems to be related to the difference between global and local optimization and the validity of the assumption of constant weights, which depends strongly on the observation density.

How to cite: Nakashita, S. and Enomoto, T.: Observation space localizations for the maximum likelihood ensemble filter, EGU General Assembly 2023, Vienna, Austria, 23–28 Apr 2023, EGU23-3761, https://doi.org/10.5194/egusphere-egu23-3761, 2023.

EGU23-4668 | ECS | Posters virtual | NP5.2 | Highlight

A particle filter based target observation method and its application to two types of El Niño events 

Meiyi Hou and Youmin Tang

The optimal observational array for improving the El Niño-Southern Oscillation (ENSO) prediction is investigated by exploring sensitive areas for target observations of two types of El Niño events in the Pacific. A target observation method based on the particle filter and pre-industrial control runs from six coupled model outputs in Coupled Model Intercomparison Project Phase 5 (CMIP5) experiments are used to quantify the relative importance of the initial accuracy of sea surface temperature (SST) in different Pacific areas. The initial accuracy of the tropical Pacific, subtropical Pacific, and extratropical Pacific can influence both types of El Niño predictions. The relative importance of different areas changes along with different lead times of predictions. Tropical Pacific observations are crucial for decreasing the root mean square error of predictions of all lead times. Subtropical and extratropical observations play an important role in reducing the prediction uncertainty, especially when the prediction is made before and throughout the boreal spring. To consider different El Niño types and different start months for predictions, a quantitative frequency method based on frequency distribution is applied to determine the optimal observations of ENSO predictions. The final optimal observational array contains 31 grid points, including 21 grid points in the equatorial Pacific and 10 grid points in the North Pacific, suggesting the importance of the initial SST conditions for ENSO predictions in the tropical Pacific and also in the area outside the tropics. Furthermore, the predictions made by assimilating SST in sensitive areas have better prediction skills in the verification experiment, which can indicate the validity of the optimal observational array designed in this study. This result provided guidance on how to initialize models in predictions of El Niño types. 

How to cite: Hou, M. and Tang, Y.: A particle filter based target observation method and its application to two types of El Niño events, EGU General Assembly 2023, Vienna, Austria, 23–28 Apr 2023, EGU23-4668, https://doi.org/10.5194/egusphere-egu23-4668, 2023.

EGU23-5421 | ECS | Posters on site | NP5.2

Estimation of Spatially and Temporally Varying Biogeochemical Parameters in a Global Ocean Model 

Nabir Mamnun, Christoph Völker, Mihalis Vrekoussis, and Lars Nerger

Ocean biogeochemical (BGC) models are, in addition to measurements, the primary tools for investigating ocean biogeochemistry, marine ecosystem functioning, and the global carbon cycle. These models contain a large number of not precisely known parameters and are highly uncertain regarding those parametrizations.  The values of these parameters depend on the physical and biogeochemical context, but in practice values derived from limited field measurements or laboratory experiments are used in the model keeping them constant in space and time. This study aims to estimate spatially and temporally varying parameters in a global ocean BGC model and to assess the effect of those estimated parameters on model fields and dynamics. Utilizing the BGC model Regulated Ecosystem Model 2 (REcoM2), we estimate ten selected BGC parameters with heterogeneity in parameter values both across space and over time using an ensemble data assimilation technique. We assimilate satellite ocean color and BGC-ARGO data using an ensemble Kalman filter provided by the Parallel Data Assimilation Framework (PDAF) to simultaneously estimate the BGC model states and parameters. We assess the improvement in the model predictions with space and time-dependent parameters in reference to the simulation with globally constant parameters against both assimilative and independent data. We quantify the spatiotemporal uncertainties regarding the parameter estimation and the prediction uncertainties induced by those parameters. We study the effect of estimated parameters on the biogeochemical fields and dynamics to get deeper insights into modeling processes and discuss insights from spatially and temporally varying parameters beyond parameter values.

How to cite: Mamnun, N., Völker, C., Vrekoussis, M., and Nerger, L.: Estimation of Spatially and Temporally Varying Biogeochemical Parameters in a Global Ocean Model, EGU General Assembly 2023, Vienna, Austria, 23–28 Apr 2023, EGU23-5421, https://doi.org/10.5194/egusphere-egu23-5421, 2023.

EGU23-5506 | ECS | Posters on site | NP5.2

Empirical optimal vertical localization derived from large ensembles 

Tobias Necker, Philipp Griewank, Takemasa Miyoshi, and Martin Weissmann

Ensemble-based estimates of error covariances suffer from limited ensemble size due to computational restrictions in data assimilation systems for numerical weather prediction. Localization of error covariances can mitigate sampling errors and is crucial for ensemble-based data assimilation. However, finding optimal localization methods, functions, or scales is challenging. We present a new approach to derive an empirical optimal localization (EOL) from a large ensemble dataset. The EOL allows for a better understanding of localization requirements and can guide toward improved localization.

Our study presents EOL estimates using 40-member subsamples assuming a 1000-member ensemble covariance as truth. The EOL is derived from a 5-day training period. In the presentation, we cover both model and observation space vertical localization and discuss:

  • vertical error correlations and EOL estimates for different variables and settings;

  • the effect of the EOL compared to common localization approaches, such as distance-dependent localization with a Gaspari-Cohn function;

  • and vertical localization of infrared and visible satellite observations in the context of observation space localization.

Proper observation space localization of error covariances between non-local satellite observations and state space is non-trivial and still an open research question. First, we evaluate requirements for optimal localization for different variables and spectral channels. And secondly, we investigate the situation dependence of vertical localization in convection-permitting NWP simulations, which suggests an advantage of using adaptive situation-dependent localization approaches.

How to cite: Necker, T., Griewank, P., Miyoshi, T., and Weissmann, M.: Empirical optimal vertical localization derived from large ensembles, EGU General Assembly 2023, Vienna, Austria, 23–28 Apr 2023, EGU23-5506, https://doi.org/10.5194/egusphere-egu23-5506, 2023.

EGU23-6050 | ECS | Posters on site | NP5.2 | Highlight

Unbalanced emission reductions of different species and sectors in China during COVID-19 lockdown derived by multi-species surface observation assimilation 

Lei Kong, Xiao Tang, Jiang Zhu, Zifa Wang, Yele Sun, Pingqing Fu, Meng Gao, Huangjian Wu, Jie Li, Xiaole Pan, Lin Wu, Hajime Akimoto, and Gregory R. Carmichael

The unprecedented lockdown of human activities during the COVID-19 pandemic have significantly influenced the social life in China. However, understanding of the impact of this unique event on the emissions of different species is still insufficient, prohibiting the proper assessment of the environmental impacts of COVID-19 restrictions. Here we developed a multi-air pollutant inversion system to simultaneously estimate the emissions of NOx, SO2, CO, PM2.5 and PM10 in China during COVID-19 restrictions with high temporal (daily) and horizontal (15km) resolutions. Subsequently, contributions of emission changes versus meteorology variations during COVID-19 lockdown were separated and quantified. The results demonstrated that the inversion system effectively reproduced the actual emission variations of multi-air pollutants in China during different periods of COVID-19 lockdown, which indicate that the lockdown is largely a nationwide road traffic control measurement with NOx emissions decreased substantially by ~40%. However, emissions of other air pollutants were found only decreased by ~10%, both because power generation and heavy industrial processes were not halted during lockdown, and residential activities may actually have increased due to the stay-at-home orders. Consequently, although obvious reductions of PM2.5 concentrations occurred over North China Plain (NCP) during lockdown period, the emission change only accounted for 8.6% of PM2.5 reductions, and even led to substantial increases of O3. The meteorological variation instead dominated the changes in PM2.5 concentrations over NCP, which contributed 90% of the PM2.5 reductions over most parts of NCP region. Meanwhile, our results also suggest that the local stagnant meteorological conditions together with inefficient reductions in PM2.5 emissions were the main drivers of the unexpected COVID-19 haze in Beijing. These results highlighted that traffic control as a separate pollution control measure has limited effects on the coordinated control of O3 and PM2.5 concentrations under current complex air pollution conditions in China. More comprehensive and balanced regulations for multiple precursors from different sectors are required to address O3 and PM2.5 pollution in China.

How to cite: Kong, L., Tang, X., Zhu, J., Wang, Z., Sun, Y., Fu, P., Gao, M., Wu, H., Li, J., Pan, X., Wu, L., Akimoto, H., and Carmichael, G. R.: Unbalanced emission reductions of different species and sectors in China during COVID-19 lockdown derived by multi-species surface observation assimilation, EGU General Assembly 2023, Vienna, Austria, 23–28 Apr 2023, EGU23-6050, https://doi.org/10.5194/egusphere-egu23-6050, 2023.

EGU23-7480 | ECS | Orals | NP5.2 | Highlight

Supermodelling: synchronising models to further improve predictions 

Francine Schevenhoven, Mao-Lin Shen, Noel Keenlyside, Jeffrey B. Weiss, and Gregory S. Duane

Instead of combining data from an ensemble of different models after the simulations are already performed, as in a standard multi-model ensemble, we let the models interact with each other during their simulation. This ensemble of interacting models is called a supermodel. By exchanging information, models can compensate for each other's errors before the errors grow and spread to other regions or variables. Effectively, we create a new dynamical system. The exchange between the models is frequent enough such that the models synchronize, in order to prevent loss of variance when the models are combined. In previous work, we experimented successfully with combining atmospheric models of intermediate complexity in the context of parametric error. Here we will show results of combining two different AGCMs, NorESM1-ATM and CESM1-ATM. The models have different horizontal and vertical resolutions. To combine states from the different grids, we convert the individual model states to a ‘common state space’ with interpolation techniques. The weighted superposition of different model states is called a ‘pseudo-observation’. The pseudo-observations are assimilated back into the individual models, after which the models continue their run. We apply recently developed methods to train the weights determining the superposition of the model states, in order to obtain a supermodel that will outperform the individual models and any weighted average of their outputs.

How to cite: Schevenhoven, F., Shen, M.-L., Keenlyside, N., Weiss, J. B., and Duane, G. S.: Supermodelling: synchronising models to further improve predictions, EGU General Assembly 2023, Vienna, Austria, 23–28 Apr 2023, EGU23-7480, https://doi.org/10.5194/egusphere-egu23-7480, 2023.

EGU23-7719 | ECS | Orals | NP5.2

The role of anchor observations in disentangling observation and model bias corrections in 4DVar 

Devon Francis, Alison Fowler, Amos Lawless, Stefano Migliorini, and John Eyre

Data assimilation theory relies on the assumption that the background, model, and observations are unbiased. However, this is often not the case and, if biases are left uncorrected, this can cause significant systematic errors in the analysis. When bias is only present in the observations, Variational Bias Correction (VarBC) can correct for observation bias, and when bias is only present in the model, Weak-Constraint 4D Variational Assimilation (WC4DVar) can correct for model bias. However, when both observation and model biases are present, it can be very difficult to understand how the different bias correction methods interact, and the role of anchor (unbiased) observations becomes crucial for providing a frame of reference from which the biases may be estimated. This work presents a systematic study of the properties of the network of anchor observations needed to disentangle between model and observation biases when correcting for one or both types of bias in 4DVar.

We extend the theory of VarBC and WC4DVar to include both biased and anchor observations, to find that the precision and timing of the anchor observations are important in reducing the contamination of model/observation bias in the correction of observation/model bias. We show that anchor observations have the biggest impact in reducing the contamination of bias when they are later in the assimilation window than the biased observations, as such, operational systems that rely on anchor observations that are earlier in the window will be more susceptible to the contamination of model and/or observation biases. We also compare the role of anchor observations when VarBC/WC4DVar/both are used in the presence of both observation and model biases. We find that the ability of VarBC to effectively correct for observation bias when model bias is present, is very dependent on precise anchor observations, whereas correcting model bias with WC4DVar or correcting for both biases performs reasonably well regardless of the precision of anchor observations (although more precise anchor observations reduces the bias in the state analysis compared with less precise anchor observations for all three cases). This demonstrates that, when it is not possible to use anchor observations, it may be better to correct for both observation and model biases, rather than relying on only one bias correction technique.

We demonstrate these results in a series of idealised numerical experiments that use the Lorenz 96 model as a simplified model of the atmosphere.

How to cite: Francis, D., Fowler, A., Lawless, A., Migliorini, S., and Eyre, J.: The role of anchor observations in disentangling observation and model bias corrections in 4DVar, EGU General Assembly 2023, Vienna, Austria, 23–28 Apr 2023, EGU23-7719, https://doi.org/10.5194/egusphere-egu23-7719, 2023.

EGU23-8030 | Posters on site | NP5.2

Assessment of short-range forecast atmosphere-ocean cross-covariances from the Met Office coupled NWP system 

Amos Lawless, Maria Valdivieso, Nancy Nichols, Daniel Lea, and Matthew Martin

As part of the design of future coupled forecasting systems, operational centres such as the Met Office are starting to include interactions between the atmosphere and the ocean within the data assimilation system. This requires an improved understanding and representation of the correlations between short-range forecast errors in different variables. To understand the potential benefit of further coupling in the data assimilation scheme it is important to understand the significance of any cross-correlations between atmosphere and ocean short-range forecast errors as well as their temporal and spatial variability. In this work we examine atmosphere-ocean cross-covariances from an ensemble of the Met Office coupled NWP system for December 2019, with particular focus on short-range forecast errors that evolve at lead times up to 6 hours.

We find that significant correlations exist between atmosphere and ocean forecast errors on these timescales, and that these vary diurnally, from day to day, spatially and synoptically. Negative correlations between errors in sea-surface temperature (SST) and 10m wind correlations strengthen as the solar radiation varies from zero at night (local time) to a maximum insolation around midday (local time). In addition, there are significant variations in correlation intensities and structures in response to synoptic-timescale forcing. Significant positive correlations between SST and 10m wind errors appear in the western North Atlantic in early December and are associated with variations in low surface pressures and their associated high wind speeds, that advect cold, dry continental air eastward over the warmer Atlantic ocean. Negative correlations across the Indo-Pacific Warm Pool are instead associated with light wind conditions on these short timescales.

When we consider the spatial extent of cross-correlations, we find that in the Gulf Stream region positive correlations between wind speed and sub-surface ocean temperatures are generally vertically coherent down to a depth of about 100m, consistent with the mixing depth; however, in the tropical Indian and West Pacific oceans, negative correlations break down just below the surface layer. This is likely due to the presence of surface freshwater layers that form from heavy precipitation on the tropical oceans, manifested by the presence of salinity-stratified barrier layers within deeper isothermal layers that can effectively limit turbulent mixing of heat between the ocean surface and the deeper thermocline.

How to cite: Lawless, A., Valdivieso, M., Nichols, N., Lea, D., and Martin, M.: Assessment of short-range forecast atmosphere-ocean cross-covariances from the Met Office coupled NWP system, EGU General Assembly 2023, Vienna, Austria, 23–28 Apr 2023, EGU23-8030, https://doi.org/10.5194/egusphere-egu23-8030, 2023.

EGU23-8640 | Orals | NP5.2

Forecast error growth: A stochastic differential equation model 

Michael Ghil, Eviatar Bach, and Dan Crisan

There is a history of simple error growth models designed to capture the key properties of error growth in operational numerical weather prediction models. We propose here such a scalar model that relies on the previous ones, but captures the effect of small scales on the error growth via additive noise in a nonlinear stochastic differential equation (SDE). We nondimensionalize the equation and study its behavior with respect to the error saturation value, the growth rate of small errors, and the magnitude of noise. We show that the addition of noise can change the curvature of the error growth curve. The SDE model seems to improve substantially the fit to operational error growth curves, compared to the deterministic counterparts.

How to cite: Ghil, M., Bach, E., and Crisan, D.: Forecast error growth: A stochastic differential equation model, EGU General Assembly 2023, Vienna, Austria, 23–28 Apr 2023, EGU23-8640, https://doi.org/10.5194/egusphere-egu23-8640, 2023.

EGU23-9529 | Orals | NP5.2

Nonlinear Data Assimilation for State and Parameter Estimation in Earthquake Simulation 

Femke Vossepoel, Arundhuti Banerjee, Hamed Diab Montero, Meng Li, Celine Marsman, Rob Govers, and Ylona van Dinther

The highly nonlinear dynamics of earthquake sequences and the limited availability of stress observations near subsurface faults make it very difficult, if not impossible, to forecast earthquakes. Ensemble data-assimilation methods provide a means to estimate state variables and parameters of earthquake sequences that may lead to a better understanding of the associated fault-slip process and contribute to the forecastability of earthquakes. We illustrate the challenges of data assimilation in earthquake simulation with an overview of three studies, each with different objectives and experiments.

In the first study, by reconstructing a laboratory experiment with an advanced numerical simulator we perform synthetic twin experiments to test the performance of an ensemble Kalman Filter (EnKF) and its ability to reconstruct fault slip behaviour in 1D and 3D simulations. The data assimilation estimates and forecasts earthquakes, even when having highly uncertain observations of the stress field. In these experiments, we assume the friction parameters to be perfectly known, which is typically not the case in reality.

A bias in a friction parameter can cause a significant change in earthquake dynamics, which will complicate the application of data assimilation in realistic cases. The second study addresses how well state estimation and state-parameter estimation can account for friction-parameter bias. For this, we use a 0D model for earthquake recurrence with a particle filter with sequential importance resampling. This shows that in case of intermediate to large uncertainty in friction parameters, combined state-and-parameter estimation is critical to correctly estimate earthquake sequences. The study also highlights the advantage of a particle filter over an EnKF for this nonlinear system.

The post- and inter-seismic deformations following an earthquake are rather gradual and do not pose the same challenges for data assimilation as the deformation during an earthquake event. To estimate the model parameters of surface displacements during these phases, a third study illustrates the application of the Ensemble Smoother-Multiple Data Assimilation and the particle filter with actual GPS data of the Tohoku 2011 earthquake.

Based on the comparison of the various experiments, we discuss the choice of data-assimilation method and -approach in earthquake simulation and suggest directions for future research.

How to cite: Vossepoel, F., Banerjee, A., Diab Montero, H., Li, M., Marsman, C., Govers, R., and van Dinther, Y.: Nonlinear Data Assimilation for State and Parameter Estimation in Earthquake Simulation, EGU General Assembly 2023, Vienna, Austria, 23–28 Apr 2023, EGU23-9529, https://doi.org/10.5194/egusphere-egu23-9529, 2023.

EGU23-11889 | ECS | Posters on site | NP5.2

Data Assimilation and Subsurface Flow Modeling: Interactions between Groundwater and the Vadose Zone 

Bastian Waldowski, Insa Neuweiler, and Natascha Brandhorst

Reliable estimates of soil water content and groundwater levels are essential in evaluating water availability for plants and as drinking water and thus both subsurface components (vadose zone and groundwater) are commonly monitored. Such measurements can be used for data assimilation in order to improve predictions of numerical subsurface flow models. Within this work, we investigate to what extent measurements from one subsurface component are able to improve predictions in the other one.
For this purpose, we utilize idealized test cases at a subcatchment scale using a Localized Ensemble Kalman Filter to update the water table height and soil moisture at certain depths with measurements taken from a numerical reference model. We do joint, as well as single component updates. We test strongly coupled data assimilation, which implies utilizing correlations between the subsurface components for updating the ensemble and compare it to weakly coupled data assimilation. We also update soil hydraulic parameters and examine the role of their heterogeneity with respect to data assimilation. We run simulations with both a complex 3D model (using TSMP-PDAF) as well as a more simplified and computationally efficient 2.5D model, which consists of multiple 1D vadose-zone columns coupled iteratively with a 2D groundwater-flow model. In idealized settings, such as homogeneous subsurface structures, we find that predictions in one component consistently benefit from updating the other component.

How to cite: Waldowski, B., Neuweiler, I., and Brandhorst, N.: Data Assimilation and Subsurface Flow Modeling: Interactions between Groundwater and the Vadose Zone, EGU General Assembly 2023, Vienna, Austria, 23–28 Apr 2023, EGU23-11889, https://doi.org/10.5194/egusphere-egu23-11889, 2023.

EGU23-12304 | ECS | Posters on site | NP5.2

Analysis of airborne-derived sea ice emissivities up to 340 GHz in preparation for future satellite missions 

Nils Risse, Mario Mech, Catherine Prigent, Gunnar Spreen, and Susanne Crewell

Passive microwave radiometers onboard polar-orbiting satellites provide global information on the atmospheric state. The underlying retrievals require accurate knowledge of the surface radiative properties to distinguish atmospheric from surface contributions to the measured radiance. Polar surfaces such as sea ice contribute up to 400 GHz to the measured radiance due to the high atmospheric transmissivity under cold and dry conditions. Currently, we lack an understanding of sea ice parameters driving the variability in its radiative properties, i.e., its emissivity, at frequencies above 200 GHz due to limited field data and the heterogeneous sea ice structure. This will limit the use of future satellite missions such as the Ice Cloud Imager (ICI) onboard Metop-SG and the Arctic Weather Satellite (AWS) in polar regions.

To better understand sea ice emission, we analyze unique airborne measurements from 89 to 340 GHz obtained during the ACLOUD (summer 2017) and AFLUX (spring 2019) airborne campaigns and co-located satellite observations in the Fram Strait. The Polar 5 aircraft carried the Microwave Radar/radiometer for Arctic Clouds (MiRAC) cloud radar MiRAC-A with an 89 GHz passive channel and MiRAC-P with six double-sideband channels at 183.31 GHz and two window channels at 243 and 340 GHz. We calculate the emissivity with the non-scattering radiative transfer equation from observed upwelling radiation at 25° (MiRAC-A) and 0° (MiRAC-P) and Passive and Active Microwave radiative TRAnsfer (PAMTRA) simulations. The PAMTRA simulations are based on atmospheric profiles from dropsondes and surface temperatures from an infrared radiometer.

The airborne-derived sea ice emissivity (O(0.1km)) varies on small spatial scales (O(1km)), which align with sea ice properties identified by visual imagery. High-resolution airborne-derived emissivities vary more than emissivities from co-located overflights of the GPM constellation due to the smaller footprint size, which resolve sea ice variations. The emissivity of frozen and snow-free leads separates clearly from more compact and snow-covered ice flows at all frequencies. The comparison of summer and spring emissivities reveals an emissivity reduction due to melting. We will also conduct evaluations of emissivity parameterizations (e.g. TELSEM²) and provide insights into observations at ICI and AWS frequencies over Arctic sea ice. Findings based on the field data may be useful for the assimilation of radiances from existing and future microwave radiometers into weather prediction models in polar regions.

How to cite: Risse, N., Mech, M., Prigent, C., Spreen, G., and Crewell, S.: Analysis of airborne-derived sea ice emissivities up to 340 GHz in preparation for future satellite missions, EGU General Assembly 2023, Vienna, Austria, 23–28 Apr 2023, EGU23-12304, https://doi.org/10.5194/egusphere-egu23-12304, 2023.

EGU23-14227 | Orals | NP5.2

Combining sea-ice and ocean data assimilation with nudging atmospheric circulation in the AWI Coupled Prediction System 

Svetlana N. Losa, Longjiang Mu, Marylou Athanase, Jan Streffing, Miguel Andrés-Martínez, Lars Nerger, Tido Semmler, Dmitry Sidorenko, and Helge F. Goessling

Assimilation of sea ice and ocean observational data into coupled sea-ice, ocean and atmosphere models is known as an efficient approach for providing a reliable sea-ice prediction (Mu et al. 2022). However, implementations of the data assimilation in the coupled systems still remain a challenge. This challenge is partly originated from the chaoticity possessed in the atmospheric module, which leads to biases and, therefore, to divergence of predictive characteristics. An additional constrain of the atmosphere is proposed as a tool to tackle the aforementioned problem. To test this approach, we use the recently developed AWI Coupled Prediction System (AWI-CPS). The system is built upon the AWI climate model AWI-CM-3 (Streffing et al. 2022) that includes FESOM2.0 as a sea-ice ocean component and the Integrated Forecasting System (OpenIFS) as an atmospheric component. An Ensemble-type Kalman filter within the Parallel Data Assimilation Framework (PDAF; Nerger and Hiller, 2013) is used to assimilate sea ice concentration, sea ice thickness, sea ice drift, sea surface height, sea surface temperature and salinity, as well as temperature and salinity vertical profiles. The additional constrain of the atmosphere is introduced by relaxing, or “nudging”, the AWI-CPS large-scale atmospheric dynamics to the ERA5 reanalysis data. This nudging of the large scale atmospheric circulation towards reanalysis has allowed to reduce biases in the atmospheric state, and, therefore, to reduce the analysis increments. The most prominent improvement has been achieved for the predicted sea ice drift. Comprehensive analyses will be presented based upon the new system’s performance over the time period 2003 – 2022.

Mu, L., Nerger, L., Streffing, J., Tang, Q., Niraula, B., Zampieri, L., Loza, S. N. and H. F. Goessling, Sea-ice forecasts with an upgraded AWI Coupled Prediction System (Journal of Advances in Modeling Earth Systems, 14, e2022MS003176. doi: 10.1029/2022MS003176.

Nerger, L. and Hiller, W., 2013. Software for ensemble-based data assimilation systems—Implementation strategies and scalability. Computers & Geosciences, 55, pp.110-118.

Streffing, J., Sidorenko, D., Semmler, T., Zampieri, L., Scholz, P., Andrés-Martínez, M., Koldunov, N., Rackow, T., Kjellsson, J., Goessling, H., Athanase, M., Wang, Q., Sein, D., Mu, L., Fladrich, U., Barbi, D., Gierz, P., Danilov, S.,  Juricke, S., Lohmann, G. and Jung, T. (2022) AWI-CM3 coupled climate model: Description and evaluation experiments for a prototype post-CMIP6 model, EGUsphere, 2022, 1—37, doi: 10.5194/egusphere-2022-32

How to cite: Losa, S. N., Mu, L., Athanase, M., Streffing, J., Andrés-Martínez, M., Nerger, L., Semmler, T., Sidorenko, D., and Goessling, H. F.: Combining sea-ice and ocean data assimilation with nudging atmospheric circulation in the AWI Coupled Prediction System, EGU General Assembly 2023, Vienna, Austria, 23–28 Apr 2023, EGU23-14227, https://doi.org/10.5194/egusphere-egu23-14227, 2023.

EGU23-14826 | Posters virtual | NP5.2 | Highlight

Inverse modelling for trace gas surface flux estimation, impact of a non-diagonal B-matrix 

Ross Bannister
One of the most appealing uses of data assimilation is to infer useful information about a dynamical system that is not observed directly. This is the case for the estimation of surface fluxes of trace gases (like methane). Such fluxes are not easy to measure directly on a global scale, but it is possible to measure the trace gas itself as it is transported around the globe. This is the purpose of INVICAT (the inverse modelling system of the chemical transport model TOMCAT), which has been developed here. INVICAT interprets observations of (e.g.) methane over a time window to estimate the initial conditions (ICs) and surface fluxes (SFs) of the TOMCAT model.
This talk will show how INVICAT has been expanded from a diagonal background error covariance matrix (B-matrix, DB) to allow an efficient representation of a non-diagonal B-matrix (NDB). The results of this process are mixed. A NDB-matrix for the SF field improves the analysis against independent data, but a NDB-matrix for the IC field appears to degrade the analysis. This paper presents these results and suggests that a possible reason for the degraded analyses is the presence of a possible bias in the system.

How to cite: Bannister, R.: Inverse modelling for trace gas surface flux estimation, impact of a non-diagonal B-matrix, EGU General Assembly 2023, Vienna, Austria, 23–28 Apr 2023, EGU23-14826, https://doi.org/10.5194/egusphere-egu23-14826, 2023.

EGU23-14985 | ECS | Orals | NP5.2

Reconstructing North Atlantic Ocean Heat Content Using Convolutional Neural Networks 

Simon Lentz, Dr. Sebastian Brune, Dr. Christopher Kadow, and Prof. Dr. Johanna Baehr

Slowly varying ocean heat content is one of the most important variables when describing cli-
mate variability on interannual to decadal time scales. Since observation-based estimates of
ocean heat content require extensive observational coverage, incomplete observations are often
combined with numerical models via data assimilation to simulate the evolution of oceanic heat.
However, incomplete observations, particularly in the subsurface ocean, lead to large uncertain-
ties in the resulting model-based estimate. As an alternative approach, Kadow et al (2020) have
proven that artificial intelligence can successfully be utilized to reconstruct missing climate in-
formation for surface temperatures. In the following, we investigate the possibility to train their
three-dimensional convolutional neural network to reconstruct missing subsurface temperatures
to obtain ocean heat content estimates with a focus on the North Atlantic ocean.
The network is trained and tested to reconstruct a 16 member Ensemble Kalman Filter assimi-
lation ensemble constructed with the Max-Planck Institute Earth System Model for the period
from 1958 to 2020. Specifically, we examine whether the partial convolutional U-net represents
a valid alternative to the Ensemble Kalman Filter assimilation to estimate North Atlantic sub-
polar gyre ocean heat content.
The neural network is capable of reproducing the assimilation reduced to datapoints with ob-
servational coverages within its ensemble spread with a correlation coefficient of 0.93 over the
entire time period and of 0.99 over 2004 – 2020 (the Argo-Era). Additionally, the network is
able to reconstruct the observed ocean heat content directly from observations for 12 additional
months with a correlation of 0.97, essentially replacing the assimilation experiment by an extrap-
olation. When reconstructing the pre-Argo-Era, the network is only trained with assimilations
from the Argo-Era. The lower correlation in the resulting reconstruction indicates higher un-
certainties in the assimilation outside of its ensemble spread at times with low observational
density. These uncertainties are highlighted by inconsistencies in the assimilation’s represen-
tations of the North Atlantic Current at times and grid points without observations detected
by the neural network. Our results demonstrate that a neural network is not only capable of
reproducing the observed ocean heat content over the training period, but also before and after
making the neural network a suitable candidate to step-wise extend or replace data assimilation.

How to cite: Lentz, S., Brune, Dr. S., Kadow, Dr. C., and Baehr, P. Dr. J.: Reconstructing North Atlantic Ocean Heat Content Using Convolutional Neural Networks, EGU General Assembly 2023, Vienna, Austria, 23–28 Apr 2023, EGU23-14985, https://doi.org/10.5194/egusphere-egu23-14985, 2023.

EGU23-15189 | ECS | Orals | NP5.2

A coupled data assimilation framework with an integrated surface and subsurface hydrological model 

Qi Tang, Hugo Delottier, Oliver S. Schilling, Wolfgang Kurtz, and Philip Brunner

We developed an ensemble based data assimilation (DA) system for an integrated hydrological model to facilitate real-time operational simulations of water quantity and quality. The integrated surface and subsurface hydrologic model HydroGeoSphere (HGS) (Brunner & Simmons, 2012) which simulates surface water and variably saturated groundwater flow as well as solute transport, was coupled with the Parallel Data Assimilation Framework (PDAF) (Nerger et al., 2005). The developed DA system allows joint assimilation of multiple types of observations such as piezometric heads, streamflow, and tracer concentrations. By explicitly considering tracer and streamflow data we substantially expand the hydrologic information which can be used to constrain the simulations.    Both the model states and the parameters can be separately or jointly updated by the assimilation algorithm.  

A synthetic alluvial plain model set up by Delottier et al., (2022) was used as an example to test the performance of our DA system.  For flow simulations, piezometric head observations were assimilated, while for transport simulations, noble gas concentrations (222Rn, 37Ar, and 4He) were assimilated. Both model states (e.g., hydraulic head or noble gas concentrations) and parameters (e.g. hydraulic conductivities and porosity) are jointly updated by the DA. Results were evaluated by comparing the estimated model variables with independent observation data between the assimilation runs and the free run where no data assimilation was conducted. In a further evaluation step, a real-world, field scale model featuring realistic forcing functions and material properties was set up for a site in Switzerland and carried out for numerical simulations with the developed DA system. The synthetic and real-world examples demonstrate the significant potential in combing state of the art numerical models, data assimilation and novel tracer observations such as noble gases or Radon.

How to cite: Tang, Q., Delottier, H., Schilling, O. S., Kurtz, W., and Brunner, P.: A coupled data assimilation framework with an integrated surface and subsurface hydrological model, EGU General Assembly 2023, Vienna, Austria, 23–28 Apr 2023, EGU23-15189, https://doi.org/10.5194/egusphere-egu23-15189, 2023.

EGU23-16806 | Orals | NP5.2

Coupled data assimilation for numerical weather prediction at ECMWF 

Patricia de Rosnay, Phil browne, Eric de Boisséson, David Fairbairn, Sébastien Garrigues, Christoph Herbert, Kenta Ochi, Dinand Schepers, Pete Weston, and Hao Zuo

In this presentation we introduce coupled assimilation activities conducted in support of seamless Earth system approach developments for Numerical Weather Prediction and climate reanalysis at the European Centre for Medium-Range Weather Forecasts (ECMWF). For operational applications coupled assimilation requires to have reliable and timely access to observations in all the Earth system components and it relies on consistent acquisition and monitoring approaches across the components. We show recent and future infrastructure developments and implementations to support consistent observations acquisition and monitoring for land and ocean at ECMWF. We discuss challenges of surface sensitive observations assimilation and we show ongoing forward operator and coupling developments to enhance the exploitation of interface observations over land and ocean surfaces. We present plans to use new and future observation types from future observing systems such as the Copernicus Expansion missions.

How to cite: de Rosnay, P., browne, P., de Boisséson, E., Fairbairn, D., Garrigues, S., Herbert, C., Ochi, K., Schepers, D., Weston, P., and Zuo, H.: Coupled data assimilation for numerical weather prediction at ECMWF, EGU General Assembly 2023, Vienna, Austria, 23–28 Apr 2023, EGU23-16806, https://doi.org/10.5194/egusphere-egu23-16806, 2023.

EGU23-1422 | Orals | BG3.14 | Highlight

Increasing water limitation of global ecosystems in a changing climate 

Rene Orth, Jasper M.C. Denissen, Wantong Li, and Sungmin Oh

The ongoing and projected climate change involves changes in temperatures and precipitation in many regions. These changes in turn affect terrestrial ecosystems that require sufficient water and energy to provide essential services such as food security and the uptake of human-caused CO2 emissions.

This presentation will introduce the concept of ecosystem water and energy limitation, and identify areas where each limitation prevails. These areas are characterised by different sensitivities of evapotranspiration and vegetation productivity to long-term changes in temperature and precipitation. A special focus will be on the global trends of ecosystem water limitation through time, where our results show increased water sensitivity across recent and future decades in many regions. This implies an increasing ecosystem vulnerability to water availability which can lead to reductions in vegetation carbon uptake in the future, consequently amplifying climate change. In this context, near-surface soil moisture is found to be the most relevant water reservoir for vegetation functioning, while deeper soil moisture is less relevant for the investigated multi-decadal time periods.

The presentation will also illustrate that the increasing water limitation can affect the consequences of droughts in related regions. These ecosystems become more vulnerable to droughts such that disruptions in vegetation functioning are more pronounced. Also evaporative cooling will decrease more strongly which promotes hotter temperatures during drought. At the same time, decreased vegetation productivity could lead to reduced availability of fuel for wildfires.

These analyses are based on (i) observation-based data including reanalyses, satellite-based datasets and gridded data derived from upscaling in-situ observations, and (ii) simulations from land surface and Earth system models. Building upon this, the presentation will discuss the related model performance as well as opportunities for model development to more accurately capture and predict ecosystem water limitation. 

How to cite: Orth, R., Denissen, J. M. C., Li, W., and Oh, S.: Increasing water limitation of global ecosystems in a changing climate, EGU General Assembly 2023, Vienna, Austria, 23–28 Apr 2023, EGU23-1422, https://doi.org/10.5194/egusphere-egu23-1422, 2023.

Recent decades have been characterized by increasing temperatures worldwide, resulting in an exponential climb in vapor pressure deficit (VPD). Heat and VPD have been identified as increasingly important drivers of plant functioning in terrestrial biomes and are significant contributors to recent drought-induced tree mortality. Despite this, few studies have isolated the physiological response of plants to high VPD, heat, and soil drought, thus limiting our understanding and ability to predict future impacts on terrestrial ecosystems. I will present diverse experimental approaches to disentangle atmospheric and soil drivers of plant functions across scales. I will further discuss recent findings suggesting that high temperature and VPD can lead to a cascade of impacts, including reduced photosynthesis, foliar overheating, and higher risks of hydraulic failure, independently of soil moisture changes.

How to cite: Grossiord, C.: Disentangling the impact of co-varying changes in soil moisture, vapor pressure deficit, and temperature on plant carbon and water relations, EGU General Assembly 2023, Vienna, Austria, 23–28 Apr 2023, EGU23-1952, https://doi.org/10.5194/egusphere-egu23-1952, 2023.

EGU23-2596 | ECS | Orals | BG3.14

Improving stomatal optimization models for accurate prediction of photosynthesis under drought conditions. 

Victor Flo, Jaideep Joshi, Manon Sabot, David Sandoval, and Iain Colin Prentice

Accurate estimation of stomatal regulation is crucial for understanding how plants respond to changing environmental conditions, particularly under climate change. While stomatal optimization models have made significant progress in predicting instantaneous plants' carbon and water exchange, they often do not account for biochemical acclimation to drought over long time scales. In this study, we investigated the impact of incorporating photosynthetic acclimation on the accuracy of six stomatal optimization models in predicting carbon and water exchange in terrestrial C3 plants. By introducing the cost of maintaining a certain level of photosynthetic capacity into the stomatal optimization process, we incorporated photosynthetic acclimation to the previous seven days of environmental conditions. Using experimental data from 37 plant species, we found that accounting for photosynthetic acclimation improved the prediction of carbon assimilation in most of the tested models. Additionally, we found that non-stomatal mechanisms significantly contributed to photosynthesis limitation under drought conditions compared to well-watered conditions in all tested models. The hydraulic impairment functions of the stomatal models were unable to accurately account for drought effects on photosynthesis, indicating the need to consider photosynthetic acclimation to improve estimates of carbon assimilation under drought conditions.

How to cite: Flo, V., Joshi, J., Sabot, M., Sandoval, D., and Prentice, I. C.: Improving stomatal optimization models for accurate prediction of photosynthesis under drought conditions., EGU General Assembly 2023, Vienna, Austria, 23–28 Apr 2023, EGU23-2596, https://doi.org/10.5194/egusphere-egu23-2596, 2023.

EGU23-3491 | Posters on site | BG3.14 | Highlight

Discrepant decadal trends in global land-surface and air temperatures controlled by vegetation biophysical feedbacks 

Fei Kan, Xu Lian, Jiangpeng Cui, Anping Chen, Jiafu Mao, Mingzhu He, Hao Xu, and Shilong Piao

Satellite-based land surface temperature (Ts) with continuous global coverage is increasingly used as a complementary measure for air temperature (Ta), yet whether they observe similar decadal trends remains unknown. Here, we systematically analyzed the trend of the difference between satellite-based Ts and station-based Ta (Ts–Ta) over 2003–2018. We found the global land warming rate based on Ts was on average 56.7% slower than that on Ta (Ts–Ta trend: -0.0166℃ yr-1, p<0.01) during daytime of boreal summer. This slower Ts-based warming was attributed to recent Earth greening, which effectively cooled canopy surface through higher evapotranspiration and turbulent heat transfer. However, Ts showed faster warming than Ta during boreal summer nighttime (0.0159℃ yr-1, p<0.01) and boreal winter daytime (0.011℃ yr-1, p=0.14), when vegetation activity is limited by temperature and radiation. Our results indicate potential biases when using Ts in assessments of atmospheric warming and the vegetation-air temperature feedbacks.

How to cite: Kan, F., Lian, X., Cui, J., Chen, A., Mao, J., He, M., Xu, H., and Piao, S.: Discrepant decadal trends in global land-surface and air temperatures controlled by vegetation biophysical feedbacks, EGU General Assembly 2023, Vienna, Austria, 23–28 Apr 2023, EGU23-3491, https://doi.org/10.5194/egusphere-egu23-3491, 2023.

EGU23-3554 | ECS | Orals | BG3.14

Land-cover and management modulation of ecosystem resistance to drought stress 

Chenwei Xiao, Sönke Zaehle, Jean-Pierre Wigneron, Hui Yang, Christiane Schmullius, and Ana Bastos

Drought events are projected to become more severe and frequent across many regions in the future, but their impacts will likely differ among ecosystems depending on the capability of ecosystem to maintain functioning during droughts, i.e., the ecosystem resistance. Different plant species have diverse strategies to cope with drought. As a result, responses of different vegetation types have been found to be divergent for similar levels of drought severity. However, it remains unclear whether such divergence is also caused by different drought duration, climatological settings, or co-occurring compound events, etc.

Here, we evaluate vegetation resistance using different proxies for vegetation condition, namely the Vegetation Optical Depth (SMOS L-VOD) data from ESA’s Soil Moisture and Ocean Salinity (SMOS) passive L-band mission and EVI and kNDVI from NASA MODIS. L-VOD has the advantage over more commonly used vegetation indices (such as kNDVI, EVI) in that it provides more information on vegetation structure and biomass and suffers from less saturation over dense forests compared (Wigneron et al., 2020). We apply a linear autoregressive model accounting for drought, temperature and memory effects to characterize ecosystem resistance by their sensitivity to drought duration and temperature anomalies. We analyze how ecosystem resistance varies with land cover across the globe and investigate the modulation effect of forest management and irrigation. Furthermore, estimates of ecosystem resistance obtained from a similar methodology are compared between L-VOD, kNDVI and EVI.

We find that regions with higher forest fraction show stronger ecosystem resistance to extreme droughts than cropland for all three vegetation proxies. L-VOD indicates that primary forests tend to be more resistant to drought events than secondary forests, but this phenomenon cannot be detected in EVI and kNDVI. This is possibly related to their saturation in dense forests. In tropical evergreen deciduous forests, old-growth trees tend to be more resistant to drought than young trees from L-VOD and kNDVI. Irrigation increases the drought resistance of cropland substantially.

These results suggest that ecosystem resistance can be better monitored using L-VOD in dense forests and highlight the role of forest cover, forest management and irrigation in determining ecosystem resistance to droughts.


Wigneron, J.-P., Fan, L., Ciais, P., Bastos, A., Brandt, M., Chave, J., Saatchi, S., Baccini, A., and Fensholt, R.: Tropical forests did not recover from the strong 2015–2016 El Niño event, Science Advances, 6, eaay4603, https://doi.org/10.1126/sciadv.aay4603, 2020.

How to cite: Xiao, C., Zaehle, S., Wigneron, J.-P., Yang, H., Schmullius, C., and Bastos, A.: Land-cover and management modulation of ecosystem resistance to drought stress, EGU General Assembly 2023, Vienna, Austria, 23–28 Apr 2023, EGU23-3554, https://doi.org/10.5194/egusphere-egu23-3554, 2023.

EGU23-3651 | ECS | Orals | BG3.14

Observed Global Photosynthesis Response to Changing Storm Frequency and Magnitude 

Andrew Feldman, Benjamin Poulter, Joanna Joiner, Mitra Asadollahi, Joel Biederman, Abhishek Chatterjee, Pierre Gentine, Alexandra Konings, William Smith, and Lixin Wang

Rain events are becoming less frequent, but stronger in many global locations under a changing climate. These intra-seasonal rainfall features have received less attention than changes in mean temperature and total annual rainfall in their influence on the global carbon cycle. Field rainfall manipulation experiments consistently show non-negligible changes to annual photosynthesis in response to rainfall frequency alterations while holding total annual rainfall constant. However, field and modeling experiments show little consensus on the sign and magnitude of change of annual photosynthesis due to changing storm frequency and magnitude. In this study, we ask: based on satellite observations, how is global photosynthesis changing due to shifts in storm frequency and magnitude? What are the soil-plant-atmosphere drivers of the response?

Using several global satellite-based photosynthesis proxies, we find that the annual photosynthesis response to storm frequency is as high in magnitude and global spatial extent as its response to total annual rainfall. The satellite-based photosynthesis proxies and field tower sites indicate that years with fewer, stronger storms tend to show decreased photosynthesis in humid ecosystems and increased photosynthesis in drylands. The absolute magnitudes of annual photosynthesis trends show 10-20% per century changes due to rainfall frequency trends over nearly half of vegetated surfaces, which is consistent with the magnitude and extent of total annual rainfall trend effects. The contrasting responses observed in humid locations and drylands are shown to be driven by patterns of plant pulse response, soil texture, and mean atmospheric aridity response to rain frequency. Ultimately, our results indicate that intra-seasonal rainfall variability drives global photosynthesis interannual variability similarly to interannual rainfall variability.

How to cite: Feldman, A., Poulter, B., Joiner, J., Asadollahi, M., Biederman, J., Chatterjee, A., Gentine, P., Konings, A., Smith, W., and Wang, L.: Observed Global Photosynthesis Response to Changing Storm Frequency and Magnitude, EGU General Assembly 2023, Vienna, Austria, 23–28 Apr 2023, EGU23-3651, https://doi.org/10.5194/egusphere-egu23-3651, 2023.

EGU23-4319 | Posters on site | BG3.14 | Highlight

Compound drought slow down the greening of the Earth 

Xianfeng Liu, Gaopeng Sun, Zheng Fu, Philippe Ciais, Xiaoming Feng, Jing Li, and Bojie Fu

Vegetation response to soil and atmospheric drought has raised extensively controversy, however, the relative contributions of soil drought, atmospheric drought and their compound drought on global vegetation growth remain unclear. Combining the changes in soil moisture (SM), vapor pressure deficit (VPD) and vegetation growth (NDVI) during 1982-2015, here we evaluated the trends of these three drought types and quantified their impacts on global NDVI. We found that global VPD has increased 0.22±0.05 kPa·decade-1 during 1982-2015, and this trend was doubled after 1996 (0.32±0.16 kPa·decade-1) than before 1996 (0.16±0.15 kPa·decade-1). Regions with large increase in VPD trend generally accompanied with decreasing trend in SM, leading to a widespread increasing trend in compound drought across 37.62% land areas. We further found compound drought dominated the vegetation browning since late 1990s. Earth system models agree with the dominant role of compound drought on vegetation growth, but their negative magnitudes are considerably underestimated, with half of the observed results (34.48%). Our results provided the evidence of compound drought induced global vegetation browning, highlighting the importance of correctly simulating the ecosystem-scale response to the under-appreciated exposure to compound drought as it will increase with climate change.

How to cite: Liu, X., Sun, G., Fu, Z., Ciais, P., Feng, X., Li, J., and Fu, B.: Compound drought slow down the greening of the Earth, EGU General Assembly 2023, Vienna, Austria, 23–28 Apr 2023, EGU23-4319, https://doi.org/10.5194/egusphere-egu23-4319, 2023.

EGU23-4622 | ECS | Posters on site | BG3.14

Significant drought legacy effects on gross primary productivity detected in terrestrial ecosystems across the globe 

Xin Yu, René Orth, Markus Reichstein, Michael Bahn, Ulisse Gomarasca, Mirco Migliavacca, Dario Papale, Christian Reimers, and Ana Bastos

The frequency, intensity, and duration of drought are expected to increase in many regions under climate change. A large number of studies have shown that droughts influence terrestrial ecosystems. Yet, assessments of drought impacts on ecosystem carbon cycling usually focus on instantaneous effects during drought, while legacy effects following drought can be important as well. 

Here, we provide the first synthesis about drought legacy effects on gross primary productivity (GPP) based on 90 long-term (>=7 years) eddy covariance sites across the globe. We predict the ‘potential’ GPP in the 2 years following drought (considered legacy years) based on a random forest model trained by data in non-legacy time periods. Legacy effects are inferred based on the difference between actual and ‘potential’ GPP in legacy periods. Results show widespread drought legacy effects on GPP across the globe. The change in GPP due to legacy effects is of the same order of magnitude as instantaneous effects. Furthermore, using the unconditional dependence test on many different potential factors, we find legacy effects unconditionally depend on aridity, instantaneous impact intensity, and species richness in forests. The conditional dependence test further reveals aridity primarily modulates legacy effects in forests.  These findings highlight the significance of drought legacy effects on ecosystem carbon cycling across the globe. We find a dominant role of climatic controls on drought legacy effects, while species diversity effects did not explain variability in drought legacy effects. 

How to cite: Yu, X., Orth, R., Reichstein, M., Bahn, M., Gomarasca, U., Migliavacca, M., Papale, D., Reimers, C., and Bastos, A.: Significant drought legacy effects on gross primary productivity detected in terrestrial ecosystems across the globe, EGU General Assembly 2023, Vienna, Austria, 23–28 Apr 2023, EGU23-4622, https://doi.org/10.5194/egusphere-egu23-4622, 2023.

EGU23-6416 | ECS | Posters on site | BG3.14

Accelerating the understanding of plant response to drought stress 

Fakhereh Alidoost, Yang Liu, Bart Schilperoort, Zhongbo Su, and Yijian Zeng

Climate extremes like droughts and heatwaves impact how water, energy, and carbon move through ecosystems. Soil-water-plant-energy interactions can be represented by SCOPE (vegetation photosynthesis model) and STEMMUS (soil water and heat model). SCOPE simulates the radiative transfer of incident light and thermal and fluorescence radiation emitted by soil and plants, temperatures of leaves and soil in the sun and shade, photosynthesis and turbulent heat exchange whereas STEMMUS traces soil moisture and soil heat dynamics and root water uptake.  

The integrated model, “STEMMUS-SCOPE”, thus links vegetation dynamics to soil moisture and soil temperature variability. This helps to simulate evaporation, transpiration and carbon fluxes better, especially under water stress conditions. With STEMMUS-SCOPE, we can model variables like moisture levels in deeper soil (root-zone-soil moisture) and the amount of carbon that is stored underground (carbon sequestration) at a global scale.  

However, applying STEMMUS-SCOPE across ecosystems at a global scale faces numerical problems and computational challenges, such as numerical convergency of the model, optimization issues in calibration, and expensive computational cost. To overcome the challenges, we are developing tools for efficient computing and data handling within the context of EcoExtreML project. The project aims to improve the coupling of STEMMUS and SCOPE models, approximate the integrated model by a machine learning approach, and estimate uncertain model states and parameters using data assimilation techniques. The results of STEMMUS-SCOPE are currently prepared for 170 flux tower sites representing 1040 site-years of data with a half-hour time step across most of the world’s climate zones and representative biomes. 

In this talk, we will give you an overview of STEMMUS-SCOPE, show how the model can be used, and introduce EcoExtreML project. 

References:  

SCOPE: https://doi.org/10.5194/bg-6-3109-2009,  https://github.com/Christiaanvandertol/SCOPE 

STEMMUS: https://doi.org/10.1007/978-3-642-34073-4, https://github.com/yijianzeng/STEMMUS 

STEMMUS–SCOPE : Integrated modeling of canopy photosynthesis, fluorescence, and the transfer of energy, mass, and momentum in the soil–plant–atmosphere continuum (STEMMUS–SCOPE v1.0.0), https://doi.org/10.5194/gmd-14-1379-2021  

EcoExtreML project: Accelerating process understanding for ecosystem functioning under extreme climates with Physics-aware machine learning, https://research-software-directory.org/projects/ecoextreml, https://github.com/EcoExtreML  

How to cite: Alidoost, F., Liu, Y., Schilperoort, B., Su, Z., and Zeng, Y.: Accelerating the understanding of plant response to drought stress, EGU General Assembly 2023, Vienna, Austria, 23–28 Apr 2023, EGU23-6416, https://doi.org/10.5194/egusphere-egu23-6416, 2023.

EGU23-6909 | ECS | Posters on site | BG3.14

The role of stream heterogeneity in gas emissions from headwater streams 

Nicola Durighetto, Anna Carozzani, Paolo Peruzzo, and Gianluca Botter

Headwater streams as hotspots of carbon dioxide evasion from surface water, and therefore represent a key component of the global carbon cycle. The gas transfer velocity at the water-air interface, k, modulates gas emissions from rivers and streams and is physically related to the energy dissipated by the flow field, ε. Here, we developed mathematical tools for quantifying the fraction of carbon emissions that can be related to localized height drops in the riverbed (e.g. in steps or step-pool formations, which constitute localized energy losses). Direct measures of stream CO2 outgassing in an Italian headwater catchment and numerical simulations are also part of the study. Our results show that high energy heterogeneous streams are characterized by significantly higher gas transfer velocities than that of an homogeneous stream. The empirical data also suggests the presence of a pronounced heterogeneity of outgassing along a river network. In particular, in many settings the total gas evasion may be dominated by localized gas emissions in correspondence of hydraulic discontinuities. These results offer a clue for the interpretation of empirical data about stream outgassing in heterogeneous reaches, and provides insight into the development of more advanced models for the large-scale estimation of CO2 outgassing from mountain rivers.

How to cite: Durighetto, N., Carozzani, A., Peruzzo, P., and Botter, G.: The role of stream heterogeneity in gas emissions from headwater streams, EGU General Assembly 2023, Vienna, Austria, 23–28 Apr 2023, EGU23-6909, https://doi.org/10.5194/egusphere-egu23-6909, 2023.

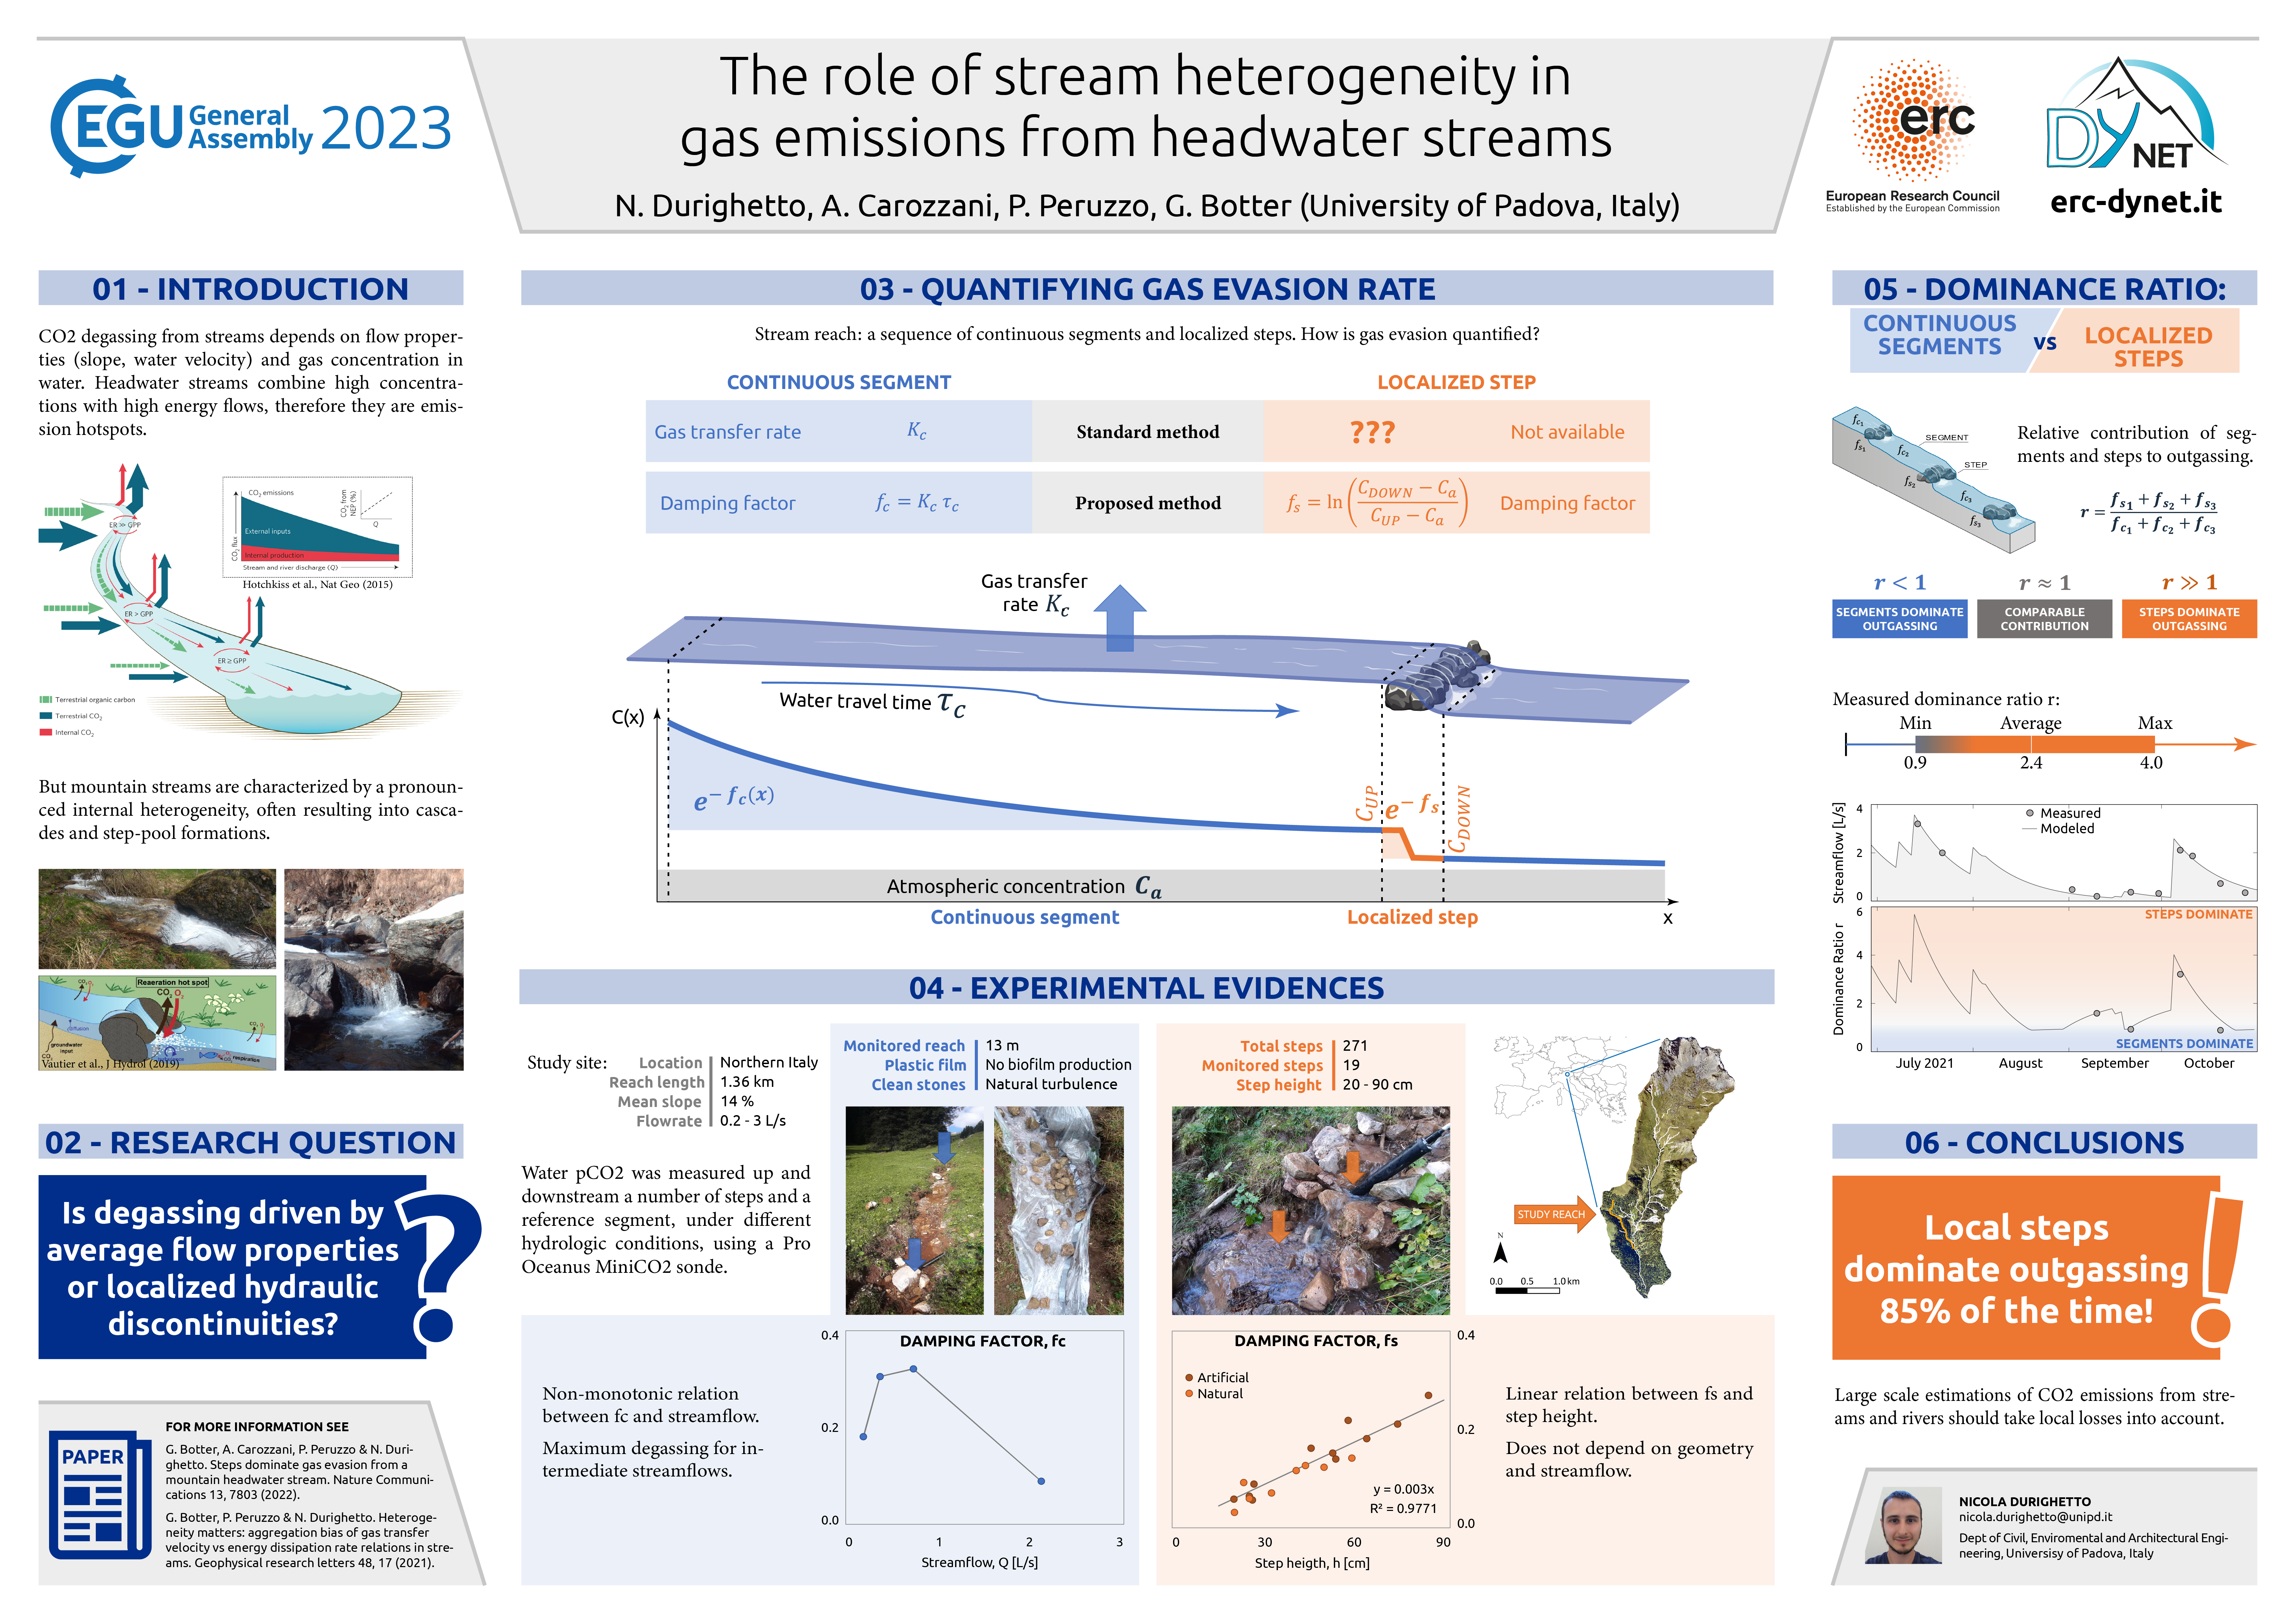
EGU23-7670 | Posters on site | BG3.14

Near-surface vs. sub-surface soil moisture impacts on vegetation functioning 

Prajwal Khanal, Anne Hoek van Dijke, Yijan Zeng, and René Orth

Soil water availability is a critical requirement for vegetation functioning in a water-limited regime. Vegetation takes up water from varying soil depths depending on their rooting location and soil moisture availability. The uptake depth varies spatially across climate regimes and vegetation types and temporally between seasons. Yet, a scientific consensus on the global relevance of near-surface and sub-surface soil moisture for vegetation functioning is still lacking and is the focus of this study. 

In particular, we calculate the correlation between the Near-Infrared Reflectance of Vegetation (NIRv) with both satellite-derived near-surface soil moisture from ESA-CCI and terrestrial water storage from GRACE. This is done globally and with monthly data during the growing season at each grid cell and accounting for the confounding effects of temperature and radiation. We analyze how these correlations vary spatially across varying vegetation types and climatic regimes, and temporally between all growing season months and particularly dry months. Finally, we repeat the analyses using Sun-induced fluorescence (SIF) data instead of NIRv. 

We find that NIRv and SIF correlate more strongly with near-surface soil moisture compared to terrestrial water storage in semi-arid regions with low tree cover. This suggests that the vegetation preferentially takes up water from near-surface soil moisture whenever available to meet its transpiration demand.   In contrast, in regions with more tree cover and in drier regions, the correlation with terrestrial water storage is comparable to or even higher than with near-surface soil moisture. This indicates that trees can make use of their deep rooting systems to access deeper soil moisture resources, similar to vegetation in arid regions. In particularly dry months, correlations with near-surface soil moisture increase while this is even more the case with terrestrial water storage, highlighting the relevance of deeper water resources during rain-scarce periods.

Overall, while direct observations of sub-surface soil moisture are scarce, this study employs different satellite-based data streams in order to estimate the relevance of near-surface versus sub-surface soil moisture for vegetation functioning. This can inform the representation of vegetation-water interactions in land surface models to support more accurate climate change projections.


How to cite: Khanal, P., van Dijke, A. H., Zeng, Y., and Orth, R.: Near-surface vs. sub-surface soil moisture impacts on vegetation functioning, EGU General Assembly 2023, Vienna, Austria, 23–28 Apr 2023, EGU23-7670, https://doi.org/10.5194/egusphere-egu23-7670, 2023.

EGU23-7820 | Orals | BG3.14

When do plant hydraulics matter in ecosystem modelling? 

Athanasios Paschalis, Simone Fatichi, Manon Sabot, and Martin de Kauwe

 The dynamics of the ascent of water from the soil to the leaves of vascular plants determine ecosystem responses to environmental forcing and their recovery from periods of water stress. Recently several models that describe the dynamics of plant hydraulics have been proposed. In this study we introduce four different configurations of a plant hydraulics model in an existing terrestrial biosphere model T&C. The model configurations in increasing order of complexity introduce the basics of the cohesion-tension theory, plant water storage dynamics and long-term damage and repair of the plant's water conducting system. Using the model configurations at six case studies spanning semi-arid to tropical ecosystems we quantify how plant hydraulics can modulate overall ecosystem responses to environmental forcing. As droughts develop, models with plant hydraulics predict a slower onset of plant water stress and can reproduce diurnal patterns of water and carbon fluxes that models that incorporate empirical stomatal conductance only cannot capture. However, when the complex variability of the environmental forcing (i.e., observed hourly meteorological forcing driving the models) is considered, plant hydraulics alone cannot significantly improve model performance. Models that only have simple empirical stomatal conductance models can adequately capture most of the variability of the observed ecosystem responses without explicitly simulating plant hydraulics. Most of the time, the gain from introducing plant hydraulics in ecosystem modelling is limited compared to the possible model improvements from correct representation of other processes such as plant phenology. Nevertheless, during periods of water stress, only models that explicitly simulate plant hydraulics can reproduce observed ecosystem responses to stress and the dynamics of ecosystem recovery. Finally, sensitivity analyses highlight that accurately modelling plant hydraulics relies on good knowledge of plant hydraulics traits, particularly at the leaf level, as stomata are usually the hydraulic bottleneck in the water flow from the soil to the atmosphere.

How to cite: Paschalis, A., Fatichi, S., Sabot, M., and de Kauwe, M.: When do plant hydraulics matter in ecosystem modelling?, EGU General Assembly 2023, Vienna, Austria, 23–28 Apr 2023, EGU23-7820, https://doi.org/10.5194/egusphere-egu23-7820, 2023.

EGU23-8013 | ECS | Orals | BG3.14

Contrasting responses of vegetation to intraseasonal rainfall in Earth System Models 

Bethan L. Harris, Christopher M. Taylor, Tristan Quaife, and Phil P. Harris

The response of vegetation productivity to water availability provides a key link between the carbon and water cycles. Correctly representing this response in Earth System Models (ESMs) is essential for accurate modelling of the terrestrial carbon cycle and the evolution of the climate system. To investigate how well models capture this relationship at intraseasonal timescales, we use global datasets based on satellite observations to assess the land surface response to intraseasonal precipitation events, and evaluate the performance of CMIP6 ESMs in representing this response in the recent historical period. Whereas models are able to capture the observed surface soil moisture (SSM) response with reasonable agreement, there are large inter-model discrepancies in the response of Gross Primary Productivity (GPP), both in magnitude and timing, even in regions where land cover is similar between models. In particular, ACCESS-ESM and NorESM produce much lower-amplitude GPP responses to rainfall than UKESM and CNRM-ESM. All the models studied are able to represent that the regional amplitude of the GPP response is positively correlated with the amplitude of the SSM response, and negatively correlated with the amplitude of the vapour pressure deficit (VPD) response. All models except NorESM also capture that stronger SSM responses are associated with faster GPP responses. However, the models differ in their sensitivity to these drivers, and can produce very different GPP responses from similar variations in SSM and VPD, particularly in climatologically dry regions. This highlights the need for a better understanding of the uncertainties in the representation of water-vegetation relationships in ESMs, such as the effect of atmospheric vapour pressure deficit on stomatal conductance and the control of soil moisture stress on GPP.

How to cite: L. Harris, B., M. Taylor, C., Quaife, T., and P. Harris, P.: Contrasting responses of vegetation to intraseasonal rainfall in Earth System Models, EGU General Assembly 2023, Vienna, Austria, 23–28 Apr 2023, EGU23-8013, https://doi.org/10.5194/egusphere-egu23-8013, 2023.

EGU23-8747 | ECS | Orals | BG3.14

Modeling global vegetation processes and hyperspectral canopy radiative transfer using CliMA Land 

Yujie Wang, Renato Braghiere, Anthony Bloom, and Christian Frankenberg

Recent progress in satellite observations has provided unprecedented opportunities to monitor vegetation activity at global scale. However, a major challenge in fully utilizing remotely sensed data to constrain land surface models (LSMs) lies in inconsistencies between simulated and observed quantities. For example, gross primary productivity (GPP) and transpiration (T) that traditional LSMs simulate are not directly measurable from space, although they can be inferred from spaceborne observations using assumptions that are inconsistent with those LSMs. In comparison, canopy reflectance and fluorescence spectra that satellites can detect are not modeled by traditional LSMs. To bridge these quantities, we presented an overview of the next generation land model developed within the Climate Modeling Alliance (CliMA), and simulated global GPP, T, and hyperspectral canopy radiative transfer (RT; 400--2500 nm for reflectance, 640--850 nm for fluorescence) at hourly time step and 1 degree spatially resolution using CliMA Land. CliMA Land predicts vegetation indices and outgoing radiances, including solar-induced chlorophyll fluorescence (SIF), normalized difference vegetation index (NDVI), enhanced vegetation index (EVI), and near infrared reflectance of vegetation (NIRv) for any given sun-sensor geometry. The modeled spatial patterns of CliMA Land GPP, T, SIF, NDVI, EVI, and NIRv correlate significantly with existing data-driven products (mean R2 = 0.777 for 9 products). CliMA Land would be also useful in high temporal resolution simulations, e.g., providing insights into when GPP, SIF, and NIRv diverge.

How to cite: Wang, Y., Braghiere, R., Bloom, A., and Frankenberg, C.: Modeling global vegetation processes and hyperspectral canopy radiative transfer using CliMA Land, EGU General Assembly 2023, Vienna, Austria, 23–28 Apr 2023, EGU23-8747, https://doi.org/10.5194/egusphere-egu23-8747, 2023.

Expanding access to remotely sensed Earth observations provides us with an opportunity to examine the underlying spatiotemporal coupling between vegetation, both natural and managed, and the hydroclimate. Applying approximately 20 years of satellite records, we demonstrate a method to quantify the sensitivity and stability of land-atmosphere interactions. Here we evaluate the predictability of vegetation via the Normalized Difference Vegetation Index (NDVI) across croplands, shrublands, grasslands, and woodlands of East Africa as it relates to fluctuations in precipitation, soil moisture, evapotranspiration, and land surfaced temperature. In this study, we detect the strength of state dependency among these variables at the dekadal (10-day) to monthly scale using a data-driven approach known as Empirical Dynamic Modeling (EDM). There is notable spatial variability in NDVI predictability, with equatorial areas generally expressing the poorest skill, which can be attributed to the inconsistent rainfall seasonality and high aridity. Woodlands exhibit strong predictability throughout the region while vegetation response to environmental drivers in grasslands is less reliable. Our results suggest water availability, uptake and storage are important factors influencing the NDVI cycle. For a one-month lead time, high predictive skill can be retrieved from the time series, though skill weakens by a four- to sixth-month lead, at which point the overall seasonality appears to play a dominant role. One contribution to highlight is the advancement in our understanding of the relationship between vegetation and land surface temperature, which is particularly valuable in drought-prone East Africa. In this presentation, we introduce an application of EDM for biogeosciences, assess how historical seasonal information of the hydroclimate and vegetation across various land use and land covers can inform future environmental patterns, and identify critical areas of inquiry with a changing climate and extending agricultural production.

How to cite: Green, R. and Caylor, K.: Measuring the Sensitivity and Stability of Vegetation in Response to the Hydroclimate Across East Africa with an Empirical Dynamic Modeling Approach, EGU General Assembly 2023, Vienna, Austria, 23–28 Apr 2023, EGU23-9480, https://doi.org/10.5194/egusphere-egu23-9480, 2023.

EGU23-10417 | ECS | Orals | BG3.14

Disentangling the influence of vegetation structure and physiology on land-atmosphere coupling 

Wantong Li, Mirco Migliavacca, Alexandra G. Konings, Gregory Duveiller, Markus Reichstein, and René Orth

Terrestrial vegetation is a key component of the Earth system as it mediates the exchange of carbon, water and energy between the land and the atmosphere. Thereby, the vegetation affects the climate through changes in its structure (such as leaf area index, LAI) and its physiology (such as stomatal conductance); However, their relative contributions and respective processes on the land-atmosphere coupling are not yet understood. For instance, increased LAI, referred to as structural changes, promotes transpiration and vegetation productivity, and increases the surface albedo in most cases. In contrast, decreased surface conductance, referred to as physiological changes, could reduce transpiration and productivity. Therefore, the overall feedback of vegetation to climate change via water, carbon and energy exchange will depend on the relative importance of structural and physiological responses. Here we study to what extent dynamic changes in global vegetation structure and physiology modulate land-atmosphere coupling using satellite remote-sensing, data-driven, and earth system modelled vegetation data, as well ashydro-meteorological reanalysis. The land-atmosphere coupling is quantified through the correlation between soil moisture and lagged vapor pressure deficit determined with a moving time window. We employ random forests to quantify vegetation physiology by accounting for functional variability (e.g. GPP and ET) explained by hydro-meteorological data but not by the vegetation structure. Then using an explainable machine learning approach (SHAP), we determine the contributions of vegetation structure and physiology where we find overall larger contributions of structure on regulating land-atmosphere coupling during the growing season. The relative importance of vegetation structure differs across ecosystems, with stronger contributions in dry ecosystems. Furthermore, we analyze the variations of the relevance of vegetation structure over time and in particular during warm and dry periods. The results are partially backed up by using in-situ measurements of physiological traits to interpret the large-scale observed physiological patterns.

How to cite: Li, W., Migliavacca, M., Konings, A. G., Duveiller, G., Reichstein, M., and Orth, R.: Disentangling the influence of vegetation structure and physiology on land-atmosphere coupling, EGU General Assembly 2023, Vienna, Austria, 23–28 Apr 2023, EGU23-10417, https://doi.org/10.5194/egusphere-egu23-10417, 2023.

EGU23-10949 | ECS | Orals | BG3.14

Understanding vegetation drought legacy effects on carbon cycling using observations from multiple platforms 

Yitong Yao, Yujie Wang, Yi Yin, and Christian Frankenberg

Drought legacy effects refer to the lasting impacts on the carbon cycle from droughts, being a prime uncertainty in predicting future land carbon sink in a changing climate. While previous studies have been focusing on the drought legacy effects on tree growth using tree ring chronologies, the rapid developments of site and satellite observations over the past decades provide us new opportunities to investigate the effects with improved temporal and spatial coverage. For example, retrievals of canopy structure, photosynthesis, evapotranspiration, and vegetation water content would allow for evaluating the differences in recovery processes in magnitude, timing and duration of the legacy effects. Potential asynchrony and divergence among these multiple legacy indicators result in large uncertainties in understanding the full range of vegetation responses to drought. To address this issue, this study aims to leverage the development of a new generation Earth system model (CliMA) in combination with site and satellite observations to understand the various legacy effects on carbon sink responses from site to regional scales. Through investigating the temporal and spatial patterns of legacy effects, our work will gain a comprehensive understanding of drought related carbon cycle feedback and benefit science-based decision making facing changing climate, especially extreme events. 

How to cite: Yao, Y., Wang, Y., Yin, Y., and Frankenberg, C.: Understanding vegetation drought legacy effects on carbon cycling using observations from multiple platforms, EGU General Assembly 2023, Vienna, Austria, 23–28 Apr 2023, EGU23-10949, https://doi.org/10.5194/egusphere-egu23-10949, 2023.

EGU23-11271 | ECS | Posters on site | BG3.14

Water use efficiency differs for mixed and monospecific boreal forests in Sweden 

Alisa Krasnova, Peng Zhao, Anne Klosterhalfen, Jinshu Chi, Tim Schacherl, Mats B. Nilsson, and Matthias Peichl

Ecosystem water use efficiency (WUE) is a key characteristic that describes the coupling of carbon and water exchange and can be used as an indicator of a forest's adaptability to varying climatic conditions. Mixed forests, characterized by the coexistence of two or more dominant tree species, may potentially exhibit higher productivity and greater resistance to extreme weather events due to possible niche differentiation among dominant species, leading to more efficient nutrient utilization. However, the increased productivity may also result in higher evapotranspiration demand, resulting in lower WUE compared to monospecific forests. 
In this study, we aim to assess the variation in WUE of mixed and monospecific boreal forests in response to different environmental factors using eddy-covariance measurements. The two study sites are represented by forest stands of similar age, growing under the same climatic conditions and located in close proximity (~10km distance) in Northern Sweden. The Rosinedalsheden site is a ~100-year-old monospecific pine (Pinus sylvestris) forest stand with sandy soils. The Svartberget site is a mixed ~110-year-old forest featuring pine (Pinus sylvestris, 61%), spruce (Picea abies, 34%), and birch (Betula sp., 5%) species, with soils dominated by till and sorted sediments. Our study spans a period of seven years (2014-2020) and covers a wide range of weather conditions, including the 2018 heatwave.

How to cite: Krasnova, A., Zhao, P., Klosterhalfen, A., Chi, J., Schacherl, T., B. Nilsson, M., and Peichl, M.: Water use efficiency differs for mixed and monospecific boreal forests in Sweden, EGU General Assembly 2023, Vienna, Austria, 23–28 Apr 2023, EGU23-11271, https://doi.org/10.5194/egusphere-egu23-11271, 2023.

EGU23-11564 | ECS | Orals | BG3.14

Vegetation optical depth reveals changes in ecosystem-level water stress for global forests 

Samuli Junttila, Adrià Descals, Iolanda Filella, Josep Peñuelas, Martin Brandt, Jean-Pierre Wigneron, and Mikko Vastaranta

Plant water stress due to climate change is posing a threat to various ecosystem services such as carbon sequestration, food and wood production, and climate regulation. To address this issue, methods are needed to assess and monitor plant water stress at various spatial and temporal scales. Passive microwave emission observations from satellites have proven useful in monitoring changes in vegetation water content and assessing plant water stress at a low spatial resolution (> 9 km). In this study, we used vegetation optical depth (VOD) and measurements of hydraulic vulnerability to create a novel model for assessing ecosystem-level water stress. We used L-band VOD and global measurements of xylem water potential at 88% loss of stem hydraulic conductivity (P88) from the TRY database (including 1103 measurements of P88 from 463 species and nine different vegetation biomes) to create a linear regression model between L-band VOD and biome-level P88. We used monthly mean values of L-band VOD and calculated ratios of yearly minimum and maximum VOD (L-VODmin/max) for each pixel to describe average variability in ecosystem-level water content. The developed L-VODmin/max metric explained 75% of the variation in P88 at the biome level (R2=0.75) indicating that the novel L-VODmin/max metric is capable of capturing changes in plant water status. We then used the L-VODmin/max metric and daily climate data from the ERA5 to see if water stress has increased over time in the world's forests that are more water limited (aridity index below 1.5). For these areas, we found a positive trend in maximum daily vapour pressure deficit, which correlated negatively (p<0.05) with L-VODmin/max trend for the same time period further confirming that L-VODmin/max is capable of explaining differences in plant water status. Additionally, we examined the trend in L-VODmin/max for global forests for the same 2011-2020 period and found a significant negative trend (increasing water stress, p<0.05) for forests in central Africa, southeast Asia, and eastern Australia, and a positive trend (decreasing water stress) for boreal forests in North America and rainforests in Indonesia. Further studies are required to confirm our results suggesting that some of the world's largest carbon sinks are experiencing rapid changes in water stress as a result of climate change.

How to cite: Junttila, S., Descals, A., Filella, I., Peñuelas, J., Brandt, M., Wigneron, J.-P., and Vastaranta, M.: Vegetation optical depth reveals changes in ecosystem-level water stress for global forests, EGU General Assembly 2023, Vienna, Austria, 23–28 Apr 2023, EGU23-11564, https://doi.org/10.5194/egusphere-egu23-11564, 2023.

EGU23-11630 | Posters on site | BG3.14

Optimal stomatal control in the presence of leaf-atmosphere coupling 

Stan Schymanski, Milan Milenovic, and Gitanjali Thakur

Plant leaves absorb solar radiation and carbon dioxide (CO2) from the atmosphere while releasing water vapour, oxygen and heat to the atmosphere. The leaf-atmosphere interface is hence the primary determinant of water-carbon interactions, where stomata control transpiration according to soil water availability, but at the cost of reducing carbon uptake by photosynthesis. It has been proposed that stomata not only respond to water stress, but function in a way to maximise a plant's long-term carbon gain by dynamically economising plant available water according to varying environmental conditions (Cowan and Farquhar, 1977). While the search for the relevant costs of stomatal opening focuses more and more on the costs of the infrastructure needed to supply water to the leaves, the consequences of opening stomata in the presence of leaf-atmosphere feedbacks, potentially resulting in a cooling and humidification of the air at the diurnal scale, hence reducing evaporative demand (Cowan, 1978), and/or depletion of atmospheric CO2, hence reducing CO2 uptake, have so far not been considered in stomatal optimality modelling. It has been shown that optimal response of vegetation to even small long-term variations in atmospheric CO2 can lead to substantial changes in land-atmosphere exchange (Schymanski et al., 2015), while the effect of trends in atmospheric vapour pressure concentration and temperature has also been documented widely. However, little research has been conducted on the optimal behaviour of plants in the presence of land-atmosphere feedbacks.

Here we present a theoretical analysis and preliminary experimental results of (optimal) stomatal control in the presence of leaf-atmosphere coupling. The coupling strength is represented theoretically by adding an additional control volume representing the leaf boundary layer or canopy air space, and experimentally by varying the flow rate of dry and CO2-rich air into a leaf cuvette. We discuss the positive and negative effects of a de-coupled canopy air space for leaf gas and energy exchange, and present experimental and mathematical methods to put them into relation to each other.

Literature:

Cowan, I. R.: Water use in higher plants, in: Water: planets, plants and people, edited by: McIntyre, A. K., Australian Academy of Science, Canberra, 71–107, 1978.

Cowan, I. R. and Farquhar, G. D.: Stomatal Function in Relation to Leaf Metabolism and Environment, in: Integration of activity in the higher plant, edited by: Jennings, D. H., Cambridge University Press, Cambridge, 471–505, 1977.

Schymanski, S. J., Roderick, M. L., and Sivapalan, M.: Using an optimality model to understand medium and long-term responses of vegetation water use to elevated atmospheric CO2 concentrations, AoB Plants, 7, plv060, https://doi.org/10.1093/aobpla/plv060, 2015.

How to cite: Schymanski, S., Milenovic, M., and Thakur, G.: Optimal stomatal control in the presence of leaf-atmosphere coupling, EGU General Assembly 2023, Vienna, Austria, 23–28 Apr 2023, EGU23-11630, https://doi.org/10.5194/egusphere-egu23-11630, 2023.

EGU23-12444 | Orals | BG3.14

Using machine learning to quantify multi-scale soil moisture controls on water and carbon fluxes at the land surface 

Rafael Rosolem, Daniel Power, Miguel Rico-Ramirez, Pierre Gentine, David McJannet, Humberto da Rocha, Martin Schrön, and Corinna Rebmann

Knowledge of fluxes of water vapor and carbon at the land surface are paramount to our understanding of the Earth system. Large-scale network initiatives such as the Fluxnet allow us to better understand the environmental controls on the evapotranspiration and gross primary productivity. An important aspect of such initiatives is that its large number of sites allow for localized knowledge to be upscaled to a region or even globally. This can be either done by employing physics-based global land models or empirically, via data-driven approaches. Particularly, we have seen a significant increase of data-driven approaches with the use of machine learning techniques more recently. Here, we use a similar structure employed in the FLUXCOM initiative to focus particularly on the role of soil moisture information in predicting evapotranspiration and gross primary productivity at several flux sites encompassing a wide range of hydroclimates and biomes around the globe. Our analyses employ a machine learning method to a predictive model of evapotranspiration and gross primary productivity, while focusing primarily on how changes in the way soil moisture is incorporated into the methodology affects such predictions. First, we evaluate the predictive power of this model when soil moisture is directly estimated via observations against more indirect estimates via bucket-type models. Secondly, we evaluate the role of the spatial resolution of different soil moisture estimates in predicting both fluxes. We do this by using three sets of direct estimates covering distinct spatial footprints co-located at all flux sites: (1) point-scale time-domain reflectometers, (2) field-scale cosmic-ray neutron sensors, and (3) regional-scale satellite remote sensing products. In this talk, we summarize which hydroclimatic regions benefit from having direct estimate of soil moisture for evapotranspiration and gross primary productivity, while also providing some insights on the possible role of spatial scale mismatches between the fluxes and soil moisture.

How to cite: Rosolem, R., Power, D., Rico-Ramirez, M., Gentine, P., McJannet, D., da Rocha, H., Schrön, M., and Rebmann, C.: Using machine learning to quantify multi-scale soil moisture controls on water and carbon fluxes at the land surface, EGU General Assembly 2023, Vienna, Austria, 23–28 Apr 2023, EGU23-12444, https://doi.org/10.5194/egusphere-egu23-12444, 2023.

EGU23-12507 | Orals | BG3.14

A review of Water Use Efficiency across space and time 

Simone Fatichi, Athanasios Paschalis, Sara Bonetti, Gabriele Manoli, and Christoforos Pappas

Water Use Efficiency (WUE) is the variable linking assimilation and storage of carbon in plants with the release of water through transpiration. In this study, we combine multiple datasets including global scale leaf-level gas exchange measurements, tree-ring isotopes, flux-tower observations, and remote sensing products with mechanistic terrestrial biosphere modeling to evaluate whether WUE depends on precipitation or aridity levels and how changes in vapor pressure deficit affect ecosystem scale WUE and intrinsic water use efficiency (IWUE). A constrained range of WUE values across ecosystems and climates are observed with few noticeable exceptions. Observations and model simulations converge towards a weak WUE dependency on precipitation or aridity conditions.

Numerical simulations with a mechanistic model reveal two distinct signatures of VPD on site level WUE and IWUE, with high VPD resulting in increased IWUE, but decreased WUE. Relations with soil moisture are instead more complex and non-monotonic. Multiple data sources in combination with mechanistic modeling offer new insights on WUE variability across spatial and temporal scales and provide reference WUE values for future comparisons.

How to cite: Fatichi, S., Paschalis, A., Bonetti, S., Manoli, G., and Pappas, C.: A review of Water Use Efficiency across space and time, EGU General Assembly 2023, Vienna, Austria, 23–28 Apr 2023, EGU23-12507, https://doi.org/10.5194/egusphere-egu23-12507, 2023.

EGU23-12846 | ECS | Posters on site | BG3.14

The role of water table depth and plant functional type in energy partitioning 

Francesco Giardina, Sonia I. Seneviratne, Benjamin D. Stocker, Jiangong Liu, and Pierre Gentine

Energy partitioning between surface latent (LE) and sensible (H) heat fluxes is a key factor in the development of the boundary layer and the regulation of the hydrological cycle. Climate factors and surface cover are commonly considered the major controlling effects on energy partitioning. However, the influence of other drivers such as water table depth and groundwater convergence has rarely been considered.

Here, we use an extensive dataset of eddy covariance and global remote-sensing data to show that not only climate, but also water table depth and plant functional type (PFT) play an important role in energy partitioning across different biomes. Our findings illuminate the understanding of plant water stress in terrestrial ecosystems.

How to cite: Giardina, F., Seneviratne, S. I., Stocker, B. D., Liu, J., and Gentine, P.: The role of water table depth and plant functional type in energy partitioning, EGU General Assembly 2023, Vienna, Austria, 23–28 Apr 2023, EGU23-12846, https://doi.org/10.5194/egusphere-egu23-12846, 2023.

EGU23-13093 | ECS | Orals | BG3.14

Peatlands methane origin and fluxes to the atmosphere: towards an integrative conceptual model of a temperate French peatland 

Alexandre Lhosmot, Adrien Jacotot, Marc Steinmann, Laure Gandois, Philippe Binet, Marie-Laure Toussaint, Sébastien Gogo, Daniel Gilbert, Jean-Sébastien Moquet, Sarah Coffinet, Anne Boetsch, Christophe Loup, Fatima Laggoun-Défarge, and Guillaume Bertrand

Peatlands cover only 3 % of emerged lands, but their carbon stock represents about 30 % of the global soil organic carbon. Climate change and local anthropogenic disturbances deeply affect the hydrological functioning of peatlands. This may trigger carbon fluxes to surface waters and the atmosphere, thus leading to a positive feedback for global warming. It is therefore crucial to better estimate carbon fluxes between peatlands and the atmosphere and to delineate their major controlling constraints. To achieve this goal, we studied the functioning of a temperate mid-mountain peatland located in the French Jura Mountains, named the Frasne peatland.

The methane (CH4) dynamics of the Frasne peatland appear to be constrained by a range of hydrological, physical, biogeochemical, and biotic factors. From a hydrological point of view, the system is fed by local rainwater and injection of carbonated groundwater at the bottom of the peatland, which provides a major input of dissolved inorganic carbon (DIC) to the system. Values of the δ13CDIC were high (even reaching positive values up to 8.1 ‰) compared to the expected values in a limestone and C3 plant-dominated area such as the Jura Mountains, supporting biotic CH4 production within the peatland. Consistently, high-frequency eddy-covariance monitoring during 2.5 years allowed us to show that the site acted as a source of CH4 to the atmosphere (23.9 ± 0.6 g C m-2 year-1) with interannual, seasonal, and diurnal time scale dynamics. In particular, we found an outstanding diurnal cycle for CH4 with the highest fluxes at night and lower ones at mid-day. In addition, the mid-day fluxes were negative in spring, highlighting larger oxidative processes than CH4 production attributed to photosynthesis activity (i.e., soil oxygen penetration and endosymbiotic methanotrophs of Sphagnum). The range of CH4 emissions was also controlled by the interannual variation in precipitation amounts and by the seasonal temperature variation.

This conceptual production-emission model highlights that water-carbon interactions in the peatland depend on local biotic and abiotic factors but also on hydrological processes at the watershed scale. This also highlights the need to further constrain carbon transfers between the production and the emission zones (i.e., peatland-atmosphere interface and surface water exports). For this purpose, we will soon carry out a field campaign to measure the concentrations and isotopic values of dissolved gases in peat pore water along with an upstream downstream and a vertical gradient.

How to cite: Lhosmot, A., Jacotot, A., Steinmann, M., Gandois, L., Binet, P., Toussaint, M.-L., Gogo, S., Gilbert, D., Moquet, J.-S., Coffinet, S., Boetsch, A., Loup, C., Laggoun-Défarge, F., and Bertrand, G.: Peatlands methane origin and fluxes to the atmosphere: towards an integrative conceptual model of a temperate French peatland, EGU General Assembly 2023, Vienna, Austria, 23–28 Apr 2023, EGU23-13093, https://doi.org/10.5194/egusphere-egu23-13093, 2023.

EGU23-13401 | Posters on site | BG3.14

Drought effect on urban plane tree ecophysiology and its isoprene emissions 

Ruben Puga Freitas, Alice Claude, Alice Maison, Luis Leitao, Anne Repellin, Paul Nadam, Carmen Kalalian, Christophe Boissard, Valérie Gros, Karine Sartelet, Andrée Tuzet, and Juliette Leymarie

Urban trees emit a wide range of biogenic Volatile Organic Compounds (bVOC). Some of these bVOC, like isoprene can react with atmospheric oxidants to form secondary compounds, such as ozone (O3) and secondary organic aerosols (SOA), which have impacts on air quality and climate. In addition, isoprene emissions are strongly influenced by environmental factors and urban sites are known as stressful environment, characterized for example by water scarcity. However, little is known on the contribution of urban trees to air quality, notably during drought periods. In a semi-controlled experiment, fourteen young plane trees (Platanus x hispanica, known as a strong isoprene emitter) were grown in containers, in an urban site (at Vitry-sur-Seine, near Paris), since 2020. In June 2022, half the trees were subjected to drought by total rainfall exclusion and by withholding watering. A comprehensive characterization of tree response to drought, including plant morphology (leaf density and area), water status (i.e., leaf water potential, δ13C isotopic composition) and physiology (stomatal conductance, net photosynthesis, leaf pigment contents, stress molecular markers, chlorophyll fluorescence) analyses, was undertaken along with the characterization of bVOC emissions by an original leaf scale method (portable GC-MS coupled to a leaf chamber). All together, these parameters provided relevant information on the relation between bVOC emissions and plant morphology, its water use efficiency and photosynthetic energy conversion.

Shortly after the onset of drought, the isoprene emissions of the plane trees remained unchanged even though typical responses to drought stress were observed, such as partial stomatal closure leading to a decrease in carbon assimilation. With the progression of drought stress, progressive leaf shedding occurred. When almost completely defoliated, the trees emitted lower amounts of isoprene emissions likely due to disruption of the photosynthetic energy conversion process. Despite the moderate decrease in absolute isoprene emissions rates (as expressed per dry leaf mass) induced by the drought treatment on plane trees with nearly zero gas exchange, total emissions were strongly affected because defoliation significantly reduced the total leaf area. We emphasize that this phenomenon should be taken into account in atmospheric models especially in species highly subjected to drought induced defoliation. Here, a simple parameterisation of this effect on plane tree-bVOC emissions is proposed.

How to cite: Puga Freitas, R., Claude, A., Maison, A., Leitao, L., Repellin, A., Nadam, P., Kalalian, C., Boissard, C., Gros, V., Sartelet, K., Tuzet, A., and Leymarie, J.: Drought effect on urban plane tree ecophysiology and its isoprene emissions, EGU General Assembly 2023, Vienna, Austria, 23–28 Apr 2023, EGU23-13401, https://doi.org/10.5194/egusphere-egu23-13401, 2023.

EGU23-13448 | ECS | Posters on site | BG3.14

Shifting consensus in moisture modifier of decomposition towards the optimum in well-drained mineral soils instead of mid- or high- moisture levels of organic soils in boreal forest 

Boris Tupek, Aleksi Lehtonen, Alla Yurova, Rose Abramoff, Stefano Manzoni, Bertrand Guenet, Samuli Launiainen, Mikko Peltoniemi, Kari Minkkinen, and Raisa Mäkipää

The lack of consensus of functional dependency of soil respiration on moisture among the Earth system models (ESMs) contributes significantly to uncertainties in their projections.

Based on data of soil organic C stocks and CO2 emissions from the boreal ecotone between mineral soil forests and adjacent peatlands with organic soils in Finland, we derived the field-based moisture response of respiration in a maximum range of moisture conditions (extending from xeric and mesic forests to water saturated mires). Using Bayesian data assimilation technique, we coupled Yasso07 soil carbon model with the heuristic bell shape moisture function, approximating the enzyme and oxygen limitations. As expected, the Yasso07 model fitted with the revised moisture modifier on data from catena of organic-mineral soils outperformed the previous model version in peatlands.

Unlike the most found optimum of decomposition in ESM in mid- or high- moisture levels, our optimum or the highest rate of decomposition correspond to well-drained conditions of mineral soils.

We speculated that the reason for the shift in the moisture optimum of the functional form was its accounting for long-term processes leading to a larger C mineralization in mineral soils related to extreme events, such as prolonged elevated moisture or rewetting after droughts, which enhance microbial access to previously protected or labile C pools and may not be detected in short-term incubation studies.

Although, the moisture modifier derived here improved the match between the modelled and measured SOCs of peatlands, a shift in consensus from current decomposition rate modifiers used in ESMs requires further evaluation before it can be largely applied for the landscape level semiempirical processed-based modelling of the mineral and organic soil C stocks and CO2 emissions.

How to cite: Tupek, B., Lehtonen, A., Yurova, A., Abramoff, R., Manzoni, S., Guenet, B., Launiainen, S., Peltoniemi, M., Minkkinen, K., and Mäkipää, R.: Shifting consensus in moisture modifier of decomposition towards the optimum in well-drained mineral soils instead of mid- or high- moisture levels of organic soils in boreal forest, EGU General Assembly 2023, Vienna, Austria, 23–28 Apr 2023, EGU23-13448, https://doi.org/10.5194/egusphere-egu23-13448, 2023.

EGU23-14027 | Orals | BG3.14

Variability of the photosynthetic and fluorescence response of high mountain plants to climate change. 

Salvador Aljazairi, M.-Teresa Sebastià, Daniel Agea, Enrique P. Sánchez-Cañete, Andrew Kowalski, Regino Zamora, and Penelope Serrano-Ortiz

Alpine ecosystems have a high ecological value, high biodiversity, and provide important ecosystem services. However, alpine communities are highly vulnerable to climate changes. Changes in biodiversity and its distribution will affect the goods and services that these ecosystems provide. Also, it can affect climate regulation by altering the exchanges of greenhouse gases (GHG) and the cycles of carbon (C) and nitrogen (N), in feedback processes. Due to their ecological importance and vulnerability, alpine meadows deserve special attention. In this regard, the main objective of the IBERALP project is the analysis of the interactions between components of biodiversity, mainly plant and soil microbial diversity, and their relationship with GHG fluxes; and how these interactions are affected by climate change.


IBERALP is focused on the alpine communities of five Iberian mountain National Parks: Picos de Europa, Ordesa and Monte Perdido, Aigüestortes i Estany de Sant Maurici, Sierra Nevada, and Sierra de Guadarrama. In each National Park, we selected two different altitudes and two different alpine community types based on soil conditions (mesic and xeric). Here we study leaf physiological and fluorescence parameters assimilation, respiration, the quantum yield of photosystem II (PhiPSII), maximum quantum efficiency (Fv`/Fm`) and photochemical quenching (qP) in two representative plant species (a legume (Trifolium repens) and a grass (Nardus strita)) present in each National Park. In addition, we recorded altitude and humidity soil condition using a portable photosyntheic system (Li-cor 6800; Li-Cor Inc.) with an integrated fluorescence chamber head.


Multiple factors affect the ability of plants to assimilate CO2 and photoprotect themselves from solar radiation excess, so there was no common pattern for all Parks. However, in general, plants at higher altitudes showed a greater photosynthetic and photoprotection capacity against high irradiances compare to those at lower altitudes. Similar behaviour was found in mesic versus xeric communities. Exceptions were found, such as, for example, in Picos de Europa National Park, where the intense fog and grazing (with continuous contribution of N to the soil) modified these patterns of photosynthesis and photoprotection. 

This work was supported by the OAPN through the project PN2021-2820s (IBERALP).

How to cite: Aljazairi, S., Sebastià, M.-T., Agea, D., Sánchez-Cañete, E. P., Kowalski, A., Zamora, R., and Serrano-Ortiz, P.: Variability of the photosynthetic and fluorescence response of high mountain plants to climate change., EGU General Assembly 2023, Vienna, Austria, 23–28 Apr 2023, EGU23-14027, https://doi.org/10.5194/egusphere-egu23-14027, 2023.

EGU23-15472 | Orals | BG3.14

Soil hydraulic conductivity defines minimum Root:Shoot surface ratio in moisture-limited environments 

Mathieu Javaux, Andrea Cecere, Louis Delval, Fabian Wankmüller, and Andrea Carminati

In drying soils, root water uptake is limited by the low soil hydraulic conductance. The magnitude of this conductance drop and its temporal dynamics are function of soil texture, soil water status, root hydraulic architecture, atmospheric demand and canopy conductance.  Under dry climates, in order to survive, plants can adapt their carbon allocation by maximizing their root:shoot surface ratio, thereby decreasing their transpiration surface while increasing their root surface.

Thanks to a simple soil-plant hydraulic model, we show that soil hydraulic conductivity controls the minimum root:shoot surface ratio. A meta-analysis of shoot:root surface ratio is combined with a database of soil hydraulic properties to demonstrate how the minimum root:shoot surface value changes with soil conductivity across soil textural classes for dry biomes. We discuss the mechanisms by which plants can control their carbon allocation in such conditions and investigate the sensitivity of this minimum root:shoot surface ratio to future shifts in evaporative demand.

How to cite: Javaux, M., Cecere, A., Delval, L., Wankmüller, F., and Carminati, A.: Soil hydraulic conductivity defines minimum Root:Shoot surface ratio in moisture-limited environments, EGU General Assembly 2023, Vienna, Austria, 23–28 Apr 2023, EGU23-15472, https://doi.org/10.5194/egusphere-egu23-15472, 2023.

EGU23-15565 | ECS | Orals | BG3.14

Reducing uncertainty in extreme weather vegetation stress modeling using satellite-model approach at high resolution 

Arpita Verma, Louis Francois, Ingrid Jacquemin, Benjamin Lanssens, Alain Hambuckers, Alessandro Ugolotti, Merja Tölle, and Eric Hallot

Vegetation is a key driver for carbon uptake from the atmosphere to the land. Yet episodes of plant stress and mortality associated with drought and heat waves due to persistent lack of precipitation have been reported over the last decades and are expected to increase under ongoing climate change. It is presumed that climate-related vegetation stress results in progressively worsening plant health and rising mortality. However, the mechanisms driving such mortality are still up for debate because of the complex interconnections between the processes and the factors. Monitoring plant stress and mortality at the ecosystem level remains challenging to quantify since long-term, tree-individual, reliable observations are uncertain. For this reason, here we adapted a satellite-model approach to work on regional forests, before up scaling the results to the global forest.

In Belgium, the Wallonia region is covered by 30% forests which are the highest among all the three regions. While with the consecutive recent extreme events especially the droughts and heat waves of 2018, 2019, 2020, and 2022 caused water stress and bark beetle attack. According to the 35 years (1985-2022), land use land cover change extracted by LANDSAT 5,7, and 8 satellites, there is no significant change in forest land in Wallonia, Belgium. Meanwhile, in the current years 2021-2022, there is a decrease in the tree canopy with intensive forest management due to tree plant stress. On the other hand, in Wallonia, the forest is distributed in a significant patch of broadleaves, coniferous leaves, and mixed forest. However, we found that consecutive drought events cause water stress on specific plant species like Norway spruce which are in vulnerable states. For example: in a mixed forest when bark beetle or Scolytinae attacked the spruce tree it is more attracted to the other trees and in this consequence tree species –like  birch and oak –are now also in premature death or deteriorating tree health. In this study, we are using a high spatial resolution (25cm) remote sensing images using Artificial Intelligence and machine learning techniques to find out pixel-based individual plant stress or mortality. In addition, the high-resolution tree mortality extracted data will be used to calibrate CARAIB dynamic vegetation model and analyze the impact of extreme events on trees during the recent past and the future (until 2070). In conclusion, from this study, we plan to improve our model regarding the implementation of plant traits and species mortality aspects towards a better prediction of forest tree species' vulnerability to future extreme weather events.

How to cite: Verma, A., Francois, L., Jacquemin, I., Lanssens, B., Hambuckers, A., Ugolotti, A., Tölle, M., and Hallot, E.: Reducing uncertainty in extreme weather vegetation stress modeling using satellite-model approach at high resolution, EGU General Assembly 2023, Vienna, Austria, 23–28 Apr 2023, EGU23-15565, https://doi.org/10.5194/egusphere-egu23-15565, 2023.

EGU23-16495 | ECS | Posters on site | BG3.14

Development of a portable, distance-based paper analytical sensor for carbonate detection. 

Zakia Tebetyo, Samantha Richardson, Leigh Madden, Mark Lorch, and Nicole Pamme

Development of a portable, distance-based paper analytical sensor
for carbonate detection.


Zakia Tebetyo1, Samantha Richardson1, Leigh Madden2, Mark Lorch1, Nicole Pamme1,3

1Schoolof Natural Sciences, University of Hull.

2 Centre for Biomedicine, Hull York Medical School, University of Hull, UK

3Department of Materials and Environmental Chemistry, Stockholm University, Sweden

In this study we transferred a laboratory-based titration reaction for carbonate determination onto a portable paper-based analytical device (PAD). The carbonate quantity can be read out by measuring the distance of a colour change along a paper-based reaction channel. Device dimensions and detection reagent constituents were optimized to enable detection of carbonate ions in the range of 0 – 1000 mg L-1. The PAD featured a reaction channel in hydrophilic filter paper defined by a hydrophobic wax barrier. The detection reagent consisted of citric acid/citrate buffer (0.5 M, pH 2.5), bromocresol green (BCG) indicator (0.10% w/v) and PDADMAC (5.0 % v/v) dissolved in 20% ethanol. The base of the device was sealed with tape to prevent reagents leaking. Sixty microlitres of carbonate sample were added to the base of the channel and the liquid was allowed to wick up the channel. Colour development occurred as the carbonate ions reacted with the hydronium ions in the detection reagent resulting in a colour change of the BCG indicator from yellow to blue.

To optimise the reaction channel, two dimensions were compared, 1 mm x 30 mm and 2 mm x 30 mm. The device with the wider channel gave a higher colour intensity between carbonate concentrations 0 – 200 mg L-1. In this range the sensor gave a linear response. The effect of filter paper pore size was investigated to study wicking time. Whatman 4 paper (pore size 23 µm) had a six times faster wicking rate of 7 min compared to Whatman 1 (11 µm) with 42 min. Reproducibility studies (100, 200, 400, 500, 600, 800 and 1000 ppm carbonate, n = 6) gave a maximum RSD of 2.4% showing consistency across the range of samples tested. Interference tests were conducted with 500 ppm  with additional environmentally occurring ions, i.e. 250 ppm , 250 ppm  or 50 ppm of  (F=1.924<Fcrit=3.411, no significant difference). There was no significant interference found from these ions.

Future work will focus on packaging and sealing the devices for on-site use, benchmarking with real environmental samples and in-the-field use with by minimally trained personnel.

How to cite: Tebetyo, Z., Richardson, S., Madden, L., Lorch, M., and Pamme, N.: Development of a portable, distance-based paper analytical sensor for carbonate detection., EGU General Assembly 2023, Vienna, Austria, 23–28 Apr 2023, EGU23-16495, https://doi.org/10.5194/egusphere-egu23-16495, 2023.

EGU23-16633 | Orals | BG3.14

STEMMUS-SCOPE for PLUMBER2: Understanding Water-Energy-Carbon Fluxes with a Physically Consistent Dataset Across the Soil-Plant-Atmosphere (SPAC) Continuum 

Yunfei Wang, Yijian Zeng, Fakhereh (Sarah) Alidoost, Zengjing Song, Danyang Yu, Enting Tang, Qianqian Han, Retsios Bas, Girgi Serkan, Christiaan van der Tol, and Zhongbo (Bob) Su

High-quality and long-term measurements of water, energy, and carbon fluxes between the land and atmosphere are critical for eco-hydrological monitoring and land surface model (LSM) benchmarking. Eddy Covariance has become the most widely used method for theory development and LSM evaluation. On the other hand, flux tower data as measured (even after site post-processing and gap-filling based on empirical formulation) cannot be used directly for validating LSMs, and most of time, lacking physically-consistent measurement across the soil-plant-atmosphere continuum (SPAC) (e.g., other than surface fluxes, lacking the measurement of soil moisture, soil water potential, leaf water potential, fluorescence, and reflectance). Here we present high-quality and long-term fluxes and corresponding above/below-ground hydrological, physiological, photosynthetic data derived from the STEMMUS-SCOPE model simulations for PLUMBER2 project with 170 FLUXNET sites. Fluxes data from PLUMBER2 and SM data from FLUXNET2015 are used to further validate the effectiveness of the STEMMUS-SCOPE dataset. Results show that the simulated fluxes and SM dataset have reasonable agreements with the in-situ measurements, using the available global input/forcing datasets without any model tunning. This dataset adds to the existing ecosystem flux and SM network to help increase our understanding of ecosystem responses to extreme events.

How to cite: Wang, Y., Zeng, Y., Alidoost, F. (., Song, Z., Yu, D., Tang, E., Han, Q., Bas, R., Serkan, G., van der Tol, C., and Su, Z. (.: STEMMUS-SCOPE for PLUMBER2: Understanding Water-Energy-Carbon Fluxes with a Physically Consistent Dataset Across the Soil-Plant-Atmosphere (SPAC) Continuum, EGU General Assembly 2023, Vienna, Austria, 23–28 Apr 2023, EGU23-16633, https://doi.org/10.5194/egusphere-egu23-16633, 2023.

EGU23-741 | ECS | Posters on site | ERE1.8

Trade-driven relocation of Greenhouse gas emission in India 

Shekhar Goyal and Udit Bhatia

The green revolution enhances crop yield, significantly contributing to many low-income countries' socio-economic development. However, increasing crop yields might raise crop residue burning, leading to adverse human health and environmental consequences. Recent studies show that international trade affects the global distribution of Agricultural Greenhouse Gas (AGHG) emissions, air pollution, and public health. Domestic Interstate Trade (DIT) has similar effects on AGHG within the country but has yet to be comprehensively investigated. Large-scale open burning of crop residue further contributes to severe haze pollution in Indian cities, affecting national climate goals. Given the critical importance of food security, further reducing AGHG remains challenging. While there has been an increasing focus on AGHG, limited attention has been paid to its consumption-based drivers. We found that DIT exacerbates the health burdens of air pollution in Indian states based on regional wind patterns. Here, by tracing the consumption-based accounting of emissions, we evaluated the consequences of agricultural DIT on the emission potential of India. Our preliminary results show that though residual crop burning pollutes nearby regions, it is driven by consumption-based demands. These results suggest that DIT structure readjustment according to emission losses is needed for India while targeting trade intensification strategies. Our findings are relevant to national efforts to reduce emission losses in India. 


How to cite: Goyal, S. and Bhatia, U.: Trade-driven relocation of Greenhouse gas emission in India, EGU General Assembly 2023, Vienna, Austria, 23–28 Apr 2023, EGU23-741, https://doi.org/10.5194/egusphere-egu23-741, 2023.

EGU23-1556 | ECS | Orals | ERE1.8

Key trends and opportunities in water footprints of crop production 

Oleksandr Mialyk, Martijn J. Booij, Rick J. Hogeboom, and Markus Berger

Crops consume the majority of green and blue water worldwide which, in many areas, affects water availability and state of ecosystems. Hence, it is important to understand the recent dynamics in crop water footprints (WF, m3 t-1). Here, we analyse the global WF of more than 150 crops during 1990–2019 simulated with a global gridded crop model ACEA at 5 x 5 arc minute resolution. Our results indicate the overall decreasing trends in unit WF across all crop groups. However, these reductions are insufficient to curb the increase in total water consumption, which is mostly driven by the growing demand for oil crops. The WF dynamics vary among regions due to a combination of multiple environmental and socio-economic factors. Thus, it is possible to identify key challenges and opportunities in WFs of crop production. Addressing them may benefit water and food security while making the global food system more sustainable.

How to cite: Mialyk, O., Booij, M. J., Hogeboom, R. J., and Berger, M.: Key trends and opportunities in water footprints of crop production, EGU General Assembly 2023, Vienna, Austria, 23–28 Apr 2023, EGU23-1556, https://doi.org/10.5194/egusphere-egu23-1556, 2023.

EGU23-2393 | ECS | Orals | ERE1.8

Efficiency of dietary sustainability and its global transition 

Pan He, Zhu Liu, Klaus Hubacek, Giovanni Baiocchi, and Dabo Guan

Global diets consume tremendous natural resources while causing multiple environmental and health issues. As the world faces challenges of adequate nutrition security with concomitant climate and environmental crises requiring urgent action, policies need to improve the efficiency of devoting environmental input of the food systems for health benefits. Here we evaluate the global transition of such efficiency in the past two decades represented by health benefits obtained by per unit of 4 key environmental inputs (GHG emissions, stress-weighted water withdrawal, acidifying emissions, and eutrophying emissions) in 195 countries. We find that the efficiency of each environmental input follows an N-shaped curve along the Socio-Demographic Index (SDI) gradient representing different development levels. The efficiency first increases by benefiting from the eliminated stunting with a larger abundance of food supply, then decreases driven by climbing environmental impacts from a shift to animal products, and finally starts to slowly grow again as countries shift toward a healthier diet. Our efficiency indicator offers an improved understanding of nutritional transitions in terms of environmental impacts and a useful way to monitor the transition of dietary patterns, set up policy targets, and evaluate the effectiveness of specific interventions.

How to cite: He, P., Liu, Z., Hubacek, K., Baiocchi, G., and Guan, D.: Efficiency of dietary sustainability and its global transition, EGU General Assembly 2023, Vienna, Austria, 23–28 Apr 2023, EGU23-2393, https://doi.org/10.5194/egusphere-egu23-2393, 2023.

EGU23-3940 | ECS | Orals | ERE1.8 | Highlight

Sustainability trade-offs for equity and climate interventions in global food systems: The case of cocoa in Ghana 

Sophia Carodenuto and Marshall Adams

Despite widespread attempts to ‘eat local,’ many of the lifestyle factors in the Global North rely on the production of agrifood commodities that can only be grown in tropical ecosystems, far from the dominant geographies of consumption. Chocolate, coffee, and palm oil represent a handful of consumer goods that are described as ‘tropical forest risk commodities,’  whose production threatens some of the last remaining biodiversity hotspots and stable carbon sinks. This research assesses the trade-offs between dominant approaches to poverty reduction in tropical forest landscapes – regions where global land use change is concentrated as forests are converted to agrifood commodity production areas to produce consumer goods that are core to global food systems. After Côte d’Ivoire, Ghana is the second largest exporter of cocoa (the main ingredient in chocolate). Ghana’s economy is highly cocoa-dependent, and cocoa provides livelihoods for about a quarter of the population, especially in rural areas where alternative incomes are limited. Although the cocoa sector contributed an estimated US$2.71 billion in government revenues in 2017, many cocoa producers live below the national poverty line.

Policy responses to balance the trade-offs between global food production, climate change, and socioeconomic development have recently come to the fore in Ghana – the world’s second largest producer of cocoa. In 2019, the Government of Ghana introduced the Living Income Differential (LID), which requires buyers to pay an additional US$400 per ton of cocoa on top of the floor price. With low farmer incomes identified as a critical driver of multiple sustainability issues in Ghana’s cocoa sector, this differential is meant to be directly transferred to cocoa farmers in response to the persistent challenge of poverty in cocoa farming communities. Using the Q methodology, we engaged over 50 stakeholders from various levels (international policy experts, cocoa sector stakeholders in Ghana, and cocoa farmers) to understand how LID is perceived, including its potential to transform the rural poverty complex embedded in Ghana’s cocoa supply chain. While the LID is lauded for increasing producer price across the board, our findings indicate that the lack of regard for farmer diversity (i.e., tenure rights, sharecroppers, and caretakers), farm size, and land management strategies (agroforestry versus clearing forest to establish farms) risks undermining the ability of this pricing mechanism to reduce farmer poverty as a way to foster sustainability in the sector. Further, the LID is siloed from on-going sustainability governance efforts in the sector, such as zero deforestation cocoa. If the LID is delivered to farmers across the board without any quid pro quo for how cocoa is produced, the policy’s unintended consequences may include increasing deforestation in the short term, while lowering the world market price of cocoa in the long term as cocoa supply increases. We conclude with policy implications on why different perspectives matter in managing sustainability trade-offs in deforestation frontiers. This study provides important insights for understanding how to achieve multiple sustainability goals together.

How to cite: Carodenuto, S. and Adams, M.: Sustainability trade-offs for equity and climate interventions in global food systems: The case of cocoa in Ghana, EGU General Assembly 2023, Vienna, Austria, 23–28 Apr 2023, EGU23-3940, https://doi.org/10.5194/egusphere-egu23-3940, 2023.

EGU23-4584 | ECS | Posters on site | ERE1.8

Enhanced excreta-based biochar: a novel source of organic fertilizer in the Guatemalan highlands 

Benjamin Wilde, Mona Mijthab, Raluca Anisie, Federico La Blasca, Estefani Gonzalez, and Johan Six

Communities in the highlands of Guatemala are currently struggling with insufficient access to effective sanitation. Water born solutions, often referred to as the “flush and forget model” of human excreta management, cannot be adequately delivered to the rapidly growing peri-urban regions growing across the area. The consequences of the insufficient collection and treatment of this waste are worsening human and environmental health outcomes. Concurrently, smallholder farmers in the region struggle to supply their soil with sufficient quantities of plant nutrients to avoid growing yield gaps. Even when capable of utilizing required amounts of chemical fertilizers, there is no clear option available to maintain soil organic carbon; typically relied upon organic inputs such as animal manure are available in only insufficient quantities.

To deal with the sanitation challenge facing communities in the region, Mosan, an NGO based in the Lake Atitlan region of Guatemala has, for the last several years, piloted a novel approach to sanitation provision. Utilizing an on-site urine diversion system that focuses on the capture, processing, and valorization of excreta, this resource-oriented approach, in addition to providing households with the means to safely manage generated excreta, yields a novel organic fertilizer. Using two treatment processes, alkaline dehydration for urine and pyrolysis for the feces, Mosan can produce an enhanced biochar product that could have the potential to sustainably improve soil health and fertility for small holder highland farmers in the region. Working in partnership with Mosan and Vivamos Mejor, and agricultural development organization based in Guatemala, the Sustainable Agroecosystems group at ETH Zurich has been testing the potential of this novel source of organic fertilizer.

Over the last eighteen months, this interdisciplinary team of researchers, community activists, and farmers has managed two experimental sites in the region. The first focused on the incorporation of enhanced biochar into a potting mix used to grow tree seedlings used for reforestation efforts in the region. The second, a participatory farmer field trial, was designed to compare the yield increases of maize fertilized with enhanced biochar to that grown with chemical fertilizer (urea). In addition to observing no significant differences in the growth performance of the seedlings, or the yield increases of the maize grown with the excreta-based biochar compared to the standard alternatives, our team also observed positive changes to several soil physical and chemical properties in the field trial. Given these results, we argue that a socio-technical transition towards a circular rural-urban system, one predicated on nutrient capture and reuse of currently underutilized organic waste sources such as human excreta, would simultaneously improve human and environmental health outcomes in urban areas, while also increasing long term soil health and fertility in outlying rural ones.

How to cite: Wilde, B., Mijthab, M., Anisie, R., La Blasca, F., Gonzalez, E., and Six, J.: Enhanced excreta-based biochar: a novel source of organic fertilizer in the Guatemalan highlands, EGU General Assembly 2023, Vienna, Austria, 23–28 Apr 2023, EGU23-4584, https://doi.org/10.5194/egusphere-egu23-4584, 2023.

EGU23-5975 | ECS | Orals | ERE1.8

Restructuring the Indian agricultural system toward sustainability and lower environmental costs 

Udit Bhatia, Shekhar Goyal, and Rohini Kumar

The evolving international conflicts have a rippling effect on global food security, forcing nations to impose new trade laws to increase their domestic supply at reduced prices and promote the need to develop local and regional food systems to reduce transboundary dependence. While aiming to become a major global food supplier, India faces significant domestic food security risks. India has achieved food security through injudicious fertilizer application on the domestic front. Past agricultural policies, while primarily focusing on maximizing production, paid less attention to their environmental consequences. India feeds 17.1% of the world's population, with 10.7% of the world's arable land: this will further increase with increasing national and international food trade. Sustainably feeding the growing population has garnered considerable attention; however, its national implementation still needs to be improved. The current intensive agricultural practices operate at low water, nutrient, and nutritional efficiencies, demanding high input for high output. As a result, Nitrogen, Phosphorus losses are high, and groundwater resources are depleting in some areas. The vexing question is how to produce sufficient food in the existing regions with minimum inputs and reduced environmental impact. For this, India must reconfigure its current cereal crop production and interstate crop distribution system by reducing nutrient pollution losses, greenhouse gas emissions, and water consumption while sufficing its increasing nutritional demand. Using a state-of-the-art framework from agricultural sciences, network, and resource optimization, our study provided ways toward national assessment of Indian staple crop system redesign for future sustainable intensification.  Further, by incorporating interstate trade within this restructured system, we try to understand how India's cereal crop redistribution will impact domestic food security. Thus to limit the environmental burden of the growing consumer demand, we optimized crop distribution and domestic trade patterns within the parameters of minimizing nitrogen and phosphorus losses. This realistic multi-dimensional framework will help India and other nations identify sustainable food security solutions. 

How to cite: Bhatia, U., Goyal, S., and Kumar, R.: Restructuring the Indian agricultural system toward sustainability and lower environmental costs, EGU General Assembly 2023, Vienna, Austria, 23–28 Apr 2023, EGU23-5975, https://doi.org/10.5194/egusphere-egu23-5975, 2023.

EGU23-6115 | ECS | Posters on site | ERE1.8

Climate change alters the global diversity of food crops 

Sara Heikonen, Matias Heino, Mika Jalava, and Matti Kummu

Climate change has already impacted the productivity of important food crops. The projected increasing temperatures and changing precipitation patterns affect the climatic suitability of food production areas. Changes in climatic suitability require adaptive actions on farms and will likely alter the potential volume and diversity of food crop production globally.

Existing research has mostly analysed the impacts of climate change on the four staple crops: wheat, rice, maize, and soybean. However, other food crops contribute more than 50% to the global calorie and protein supply and therefore constitute a crucial element of food security. Moreover, these crops might succeed in more diverse climate conditions than the staple crops. If climate change narrows the production potential of the staple food crops, other food crops could become even more important for global food security in the future. Therefore, to comprehensively understand the implications of climate change on food crop production, there is need for analysis on a diverse set of food crops.

In this study, we delineate suitable climate conditions for 27 major food crops using historical climatic data and examine the effect of future changes in climate suitability on food crop production volume and diversity. We define the crop-specific suitable climate conditions utilizing the Safe Climatic Space concept, based on global gridded datasets on biotemperature, precipitation, and aridity in 1970–2000 as well as crop production in 2010. Then, using future climate parameter data, we project changes in global climate suitability for the 27 food crops. The analyses cover five global warming scenarios from +1.5 °C to +5 °C.

The preliminary results indicate that the global food crop production potential on the current croplands will decrease for most crops in all five global warming scenarios. Furthermore, the potential diversity of food crops will decrease significantly at low latitudes but increase in other areas. In all five scenarios, areas near the equator will become unsuitable for most studied crops. On the other hand, on the current extent of cropland, the potential production area of especially oil crops and starchy roots will expand in the northern hemisphere.

For many crops, there is distinct difference in the magnitude of lost production and diversity potential between global warming of +2 °C and +3 °C, highlighting that it is important to restrict global warming at the very maximum to +2 °C. The results of this study could provide insights for agricultural adaptation to climate change by illustrating opportunities for geographically shifting or expanding production in regions where climate suitability is projected to change. Further, the results could identify potential substitute crops for regions where climate conditions might become unsuitable for the currently cultivated food crops.

How to cite: Heikonen, S., Heino, M., Jalava, M., and Kummu, M.: Climate change alters the global diversity of food crops, EGU General Assembly 2023, Vienna, Austria, 23–28 Apr 2023, EGU23-6115, https://doi.org/10.5194/egusphere-egu23-6115, 2023.

EGU23-6434 | Orals | ERE1.8

Energy and fertiliser price rises are more damaging than food export curtailment from Ukraine and Russia for food prices, health and the environment 

Peter Alexander, Almut Arneth, Roslyn Henry, Juliette Maire, Sam Rabin, and Mark Rounsevell

Higher food prices arising from restrictions on exports from Russia or Ukraine have been exacerbated by energy price rises, leading to higher costs for agricultural inputs such as fertiliser. Using a scenario approach with a global land use and food system model (LandSyMM), we quantify the potential outcomes of increasing agricultural input costs and the curtailment of exports from Russia and Ukraine on human health and the environment.  We show that, combined, agricultural inputs costs and food export restrictions could increase food costs by 60-100% from 2021 levels, potentially leading to undernourishment of 60-110 million people and annual additional deaths of 400 thousand to 1 million people if the associated dietary patterns are maintained. In additional to lower yields, reduced land use intensification arising from higher input costs would lead to agricultural land expansion of 130-349 Mha by 2030, with associated carbon and biodiversity loss. The impact of agricultural input costs on food prices is larger than that from curtailment of Russian and Ukrainian exports. Restoring food trade from Ukraine and Russia alone is therefore insufficient to avoid food insecurity problem from higher energy and fertiliser prices. While the Black Sea Grain Initiative has been a welcome development and has largely allowed Ukraine food exports to be re-established, the immediacy of these issues appears to have diverted attention away from the impacts of fertiliser prices. While fertiliser prices at the start of 2023 have come down from the peaks of mid-2022, they remain at historically high levels.  Our results suggest the costs and lower crop yields achieved through reduced fertiliser use will drive high food price inflation in 2023 and beyond. More needs to be done to break the link between higher food prices and harm to human health and the environment.  

This study demonstrates how modelling can be used to explore the complexity and interlinked nature of the globalised food system and to quantifying the trade-offs and synergies for health and environmental outcomes of difference scenarios.

How to cite: Alexander, P., Arneth, A., Henry, R., Maire, J., Rabin, S., and Rounsevell, M.: Energy and fertiliser price rises are more damaging than food export curtailment from Ukraine and Russia for food prices, health and the environment, EGU General Assembly 2023, Vienna, Austria, 23–28 Apr 2023, EGU23-6434, https://doi.org/10.5194/egusphere-egu23-6434, 2023.

Extreme weather often causes crop losses with sharp fluctuations in agricultural prices, which imposes negative impacts on sustainable agricultural development. Greenhouse farming is regarded as an effective measure against extreme weather. Thus, it requires a better understanding of the growing complexity of agri-food systems involving greenhouse environmental and societal tradeoffs under climate variations. Considering high energy consumption of greenhouses, this study aims at adopting machine learning with IoT-big data mining to innovatively develop a smart greenhouse environmental control service model under the nexus between meteorology, water, energy, food, and greenhouse environmental control while exploring pathways to low-carbon greenhouse cultivation. The proposed model will be applied to greenhouses in Taiwan for evaluating cross-sectoral synergies and environmental benefits. The results are expected to support greenhouse owners and authorities to make the best use of resources of water, energy, and food through the optimal environmental operation on greenhouse cultivation under extreme climatic events for achieving sustainable development goals (SDGs) and move towards green economy.

How to cite: Hsia, I.-W. and Chang, F.-J.: Machine Learning-Enabled Smart Greenhouse Environmental Control Service Model, EGU General Assembly 2023, Vienna, Austria, 23–28 Apr 2023, EGU23-6494, https://doi.org/10.5194/egusphere-egu23-6494, 2023.

Agriculture is a key to the Zambian economy, contributing 20% to the country’s GDP and 12% to the national export earnings. However, climate change has a negative impact on Zambian agriculture production. In line with its Vision 2030 to have an efficient, competitive, sustainable and export-led agriculture sector, Zambia is aiming to improve irrigated agriculture through large investment in irrigation. Considering climate change and variability, it is important to adopt best water and nutrient management practices for sustainable use of agricultural resources. Maize being the major staple crop of Zambia, a study was carried out to improve irrigation management by optimizing water and nitrogen use efficiency for maximum maize productivity at field level under varying water and fertilizer applications. To achieve this goal, our study used and adapted nuclear (neutron probe) and isotope (15N and 13C) techniques to the Zambian agro-ecological conditions. Drip irrigation was used as the targeted system. The experiment was implemented based on three water application levels, i.e., deficit (50% and 75% Evapotranspiration) versus optimal (100% Evapotranspiration)and three nitrogen (N) levels (140 kg.ha-1, 112 kg.ha-1 and 84 kg.ha-1, widely practiced being 112 kg.ha-1). Maize was grown as a sole crop, under drip irrigation, in rotation with a legume over the dry season of Zambia in 2021 and 2022. For both years, maize yield was ranging between 2 and 7 ton.ha-1. Results showed that deficit irrigation can be practiced without a significant negative impact on yield (with higher N levels showing significantly higher yields under deficit irrigation) and nitrogen use efficiency. The total N yield and agronomic water use efficiency were significantly higher, up to 1.5 and 3 times respectively, under deficit irrigation as compared to the optimal. Intrinsic water stress (d 13C results) was higher, though not statistically significant, under deficit irrigation. Thus, considering climate change and sustainable use of resources, deficit irrigation should be considered as the option to achieve higher yield and food security.

How to cite: Mwape, M., Said, H., Phiri, E., Heiling, M., Dercon, G., and Resch, C.: Understanding the interaction between maize water use efficiency and nutrient uptake in irrigated cropping systems, a basis for predicting and improving Zambia’s productivity in a changing climate, EGU General Assembly 2023, Vienna, Austria, 23–28 Apr 2023, EGU23-6729, https://doi.org/10.5194/egusphere-egu23-6729, 2023.

EGU23-7963 * | ECS | Orals | ERE1.8 | Highlight

Healthier diets, healthier planet? Quantifying the biodiversity pressure of fruit and vegetable consumption in South Africa, India, and the UK 

Abbie Chapman, Carole Dalin, Sara Bonetti, Rosemary Green, Genevieve Hadida, Tafadzwa Mabhaudhi, and Pauline Scheelbeek

Eating more fruits and vegetables lowers risk of non-communicable diseases. Globally, people are not eating the recommended amounts of these foods; consumption must increase to improve human health. However, in general, areas of cropland are associated with lower biodiversity than natural land (e.g., forests and grasslands). Converting natural land to cropland for agriculture therefore risks biodiversity loss which, in turn, risks lowering crop yields because biodiversity supports food production via pollination and pest control. Herein lies a trade-off. As the world seeks to eat more healthily, more fruits and vegetables will be produced to meet demand. Here, we share our research into this trade-off between healthy diets and biodiversity conservation.

To quantify the biodiversity pressure associated with healthy fruit and vegetable crops, we made use of freely available data on: species distributions (IUCN, 2013); fruit and vegetable production, yield, and harvested area (Monfreda et al., 2008); and international trade of fruits and vegetables (FAOSTAT; Dalin et al., 2017). Previous research into cropland-biodiversity relationships has typically grouped land-cover types into ‘cropland’ and ‘natural land’, without considering the impacts of specific crops on biodiversity (except for major commodities, like cocoa, and staples, like maize). We have developed a new suite of biodiversity-pressure metrics for specific crops which can be measured globally. These metrics enable us to quantify the species potentially impacted for each unit of crop in both a consumer country and its trade-partner countries. The new measures facilitate quantitative comparisons among specific crops and countries for the first time. Using these new measures, we compared the biodiversity pressures associated with the production and consumption of 54 different fruits and vegetables. We mapped the origin of crops consumed in the UK, South Africa, and India, and quantified associated biodiversity pressures relative to food produced and imported.

Contrary to previous research considering the relative impacts of food crops on climate change and water resources, biodiversity pressure due to fruit production is not always higher than that due to vegetables. The most important factors associated with increased biodiversity pressures include the country of production and the amounts being produced. We did not identify a single suite of crops standing out as particularly unsustainable across all three focal countries. This is significant, as it emphasizes the importance of trade in influencing sustainability. For some crops, domestic production would have a lower biodiversity pressure than importing from trade partners (e.g., UK-grown tomatoes). In such cases, the domestic production of fruits and vegetables should be promoted in conjunction with biodiversity-friendly farming practices. In other cases, domestic production of a crop is associated with a higher biodiversity pressure than the crop’s biodiversity pressure when produced overseas (e.g., UK-grown cherries). Our findings are particularly important in the context of changing trade patterns since the early 2000s, where countries like the UK have been increasingly sourcing fruits and vegetables from abroad. Our results could therefore inform policies aimed at tracing the environmental impacts of food-supply chains in the UK, India, and South Africa.

How to cite: Chapman, A., Dalin, C., Bonetti, S., Green, R., Hadida, G., Mabhaudhi, T., and Scheelbeek, P.: Healthier diets, healthier planet? Quantifying the biodiversity pressure of fruit and vegetable consumption in South Africa, India, and the UK, EGU General Assembly 2023, Vienna, Austria, 23–28 Apr 2023, EGU23-7963, https://doi.org/10.5194/egusphere-egu23-7963, 2023.

EGU23-10063 | Orals | ERE1.8

Risk of deforestation and potential greenhouse gas emissions from vegetable oils’ expansions for food use 

Maria Vincenza Chiriacò, Nikolas Galli, Monia Santini, and Maria Cristina Rulli

The global production of vegetable oils exceeds 200 million tonnes per year, with almost 40% for food use, and around 330 M hectares occupied by oil crops. The most produced is palm (40% if palm kernel oil is included), followed by soybean oil (28%), rapeseed oil (12%) and sunflower oil (9%). Some of these oil crops, particularly oil palm plantations and soy cultivations, are among the main drivers of global land use changes (LUC) and deforestation. In particular palm oil has been one of the most highly criticized due to the link between oil palm cultivation expansion and the loss of primary tropical forests, observed in recent decades. This issue has generated two different responses in the food sector: some players decided to produce and/or use deforestation-free palm oil. Other actors chosen to replace palm oil with other vegetable oils, such as soybean, rapeseed and sunflower oil.

Considering the importance of a proper land management in view of the food-ecosystems-resources nexus, this study assesses the potential LUC and the related GHG emissions that can occur by using sustainable palm oil or replacing it with the other oils for food use. 

A methodology was developed to assess the potential GHG emissions from the LUC due to alternative oil crops expansion at detrimental of high carbon content areas, such as forests or perennial croplands, and the GHG emissions from the production process though a Life Cycle Assessment (LCA).

Under the scenario of 100% replacement of palm and palm kernel oil globally, the extra-land needed to produce the additional alternative oils was determined in their three top producer countries using yield data from literature. An expansion algorithm considering suitability and distance from roads and existing oil crops was developed to determine the potential LUC which may occur in the selected countries. The potential GHG emissions from deforestation and other LUC were calculated from the carbon stock data of the FAO Forest Resource Assessment and IPCC; the field production of the four oils was reconstructed to calculate anthropogenic GHG emissions using relevant LCA existing databases. 

Results show that deforestation-free palm oil is the less impacting in terms of GHG emissions per oil ton thanks to its far highest oil yield. Replacing sustainable palm oil with any other alternative oil is never a favourable solution (Fig. 1), entailing a potential GHG emissions increase from 0.94-0.96 Mg CO2  per ton of palm oil replaced by sunflower oil produced in Ukraine or in Russia (where deforestation is unlikely), to 4.38 Mg CO2 per ton of palm oil replaced by soybean oil produced in Brazil, up to 13.65 Mg CO2 per ton of palm oil replaced by soybean oil produced in Argentina.


Figure 1. GHG emissions in Mg CO2eq t-1 from LCA (blue bars) and LUC (green bars) with 100% palm oil replacement. Based on national trends and forest policies, potential deforestation can be likely (full green), likely with limitation (dense dots), likely with offset (oblique lines), unlikely (scattered dots). Vertical lines for palm oil include deforestation.


How to cite: Chiriacò, M. V., Galli, N., Santini, M., and Rulli, M. C.: Risk of deforestation and potential greenhouse gas emissions from vegetable oils’ expansions for food use, EGU General Assembly 2023, Vienna, Austria, 23–28 Apr 2023, EGU23-10063, https://doi.org/10.5194/egusphere-egu23-10063, 2023.

EGU23-11242 | ECS | Posters on site | ERE1.8

Effect of urease inhibitor and biofertilizer on nitrous oxide emission 

Rayehe Mirkhani, Christian Resch, Georg Weltin, Lee Kheng Heng, Jason Mitchell, Rebecca Clare Hood-Nowotny, and Gerd Dercon

Conventional agricultural practices are heavily dependent on nitrogen fertilizers, which can have negative impacts on the environment through ammonia volatilization and nitrous oxide emission. Previous studies have shown that the use of urease inhibitors or biofertilizers may help reduce such impacts.

A field experiment was established by the Joint FAO/IAEA Centre at the experimental station of the University of Natural Resources and Life Sciences (BOKU) located east of Vienna (Austria) to determine the effect of urease inhibitor and biofertilizer on nitrous oxide (N2O) emission, in wheat cropping systems. A randomized complete block design including five treatments and four replicates was used in this study. The treatments were: T1 (control treatment - without N fertilizer), T2 (Urea only), T3 (Urea+Urease Inhibitor (UI)), T4 (Urea+Biofertilizer), T5 (Urea+UI+Biofertilizer). All treatments received 50 kg N ha-1 at tillering stage (GS 31), except T1. In this study N-(n-butyl) thiophosphoric triamide (nBTPT) or “Agrotain” was used as UI and Azotobacter chroococcum (“AZOTOHELP”) was applied as biofertilizer.

Soil N2O gas fluxes were measured using the static chamber method, eight times between 3 to 84 days after fertilizer application. Gas sampling was performed at the same time each day of measurement, between 8:00 and 10:00 h, to minimize diurnal variation and better represent the mean daily fluxes. A PVC chamber (24 cm height and 24 cm diameter) was inserted into the soil 5 cm deep. The chamber was composed of two separate parts joined together with an airtight rubber. Gas samples were taken at 0 and 30 minutes after closing the chambers using a 500 mL syringe. The gas sample was then immediately transferred from the syringe to a pre-evacuated 1L gas sampling bag with multi-layer foil. Nitrous oxide in the gas samples was analysed using off-axis integrated cavity output spectroscopy (ICOS, Los Gatos).

The statistical analysis showed that UI and biofertilizer had a clear and significant effect on nitrous oxide emission. However, this effect was only observed during the first week after the fertilizer application. Further, the results showed that the highest N2O emission, within this week after adding urea fertilizer, was under the U+UI treatment, which was significantly higher by about 139, 91,79% compared to the Urea+Biofertilizer, Urea, Urea+UI+Biofertilizer treatments, respectively. No significant difference was observed between the other Urea, Urea+Biofertilizer and Urea+UI+Biofertilizer treatments in this period. Although not significantly (p < 0.05), N2O emission was higher in Urea+UI+Biofertilizer treatment compared to the Urea+Biofertilizer treatment.

Due to the ability of UI to reduce ammonia volatilization, we assume that pollution swapping from ammonia volatilization to nitrous oxide emission occurred, explaining the stimulus of UI on nitrous oxide emission. The lower N2O emission in the treatments receiving biofertilizer, compared to the one with no biofertilizer, may be caused by the ability of Azotobacter to reduce N2O emission by N2O-fixation, N2 fixation and reduction of N2O to N2.  

How to cite: Mirkhani, R., Resch, C., Weltin, G., Heng, L. K., Mitchell, J., Clare Hood-Nowotny, R., and Dercon, G.: Effect of urease inhibitor and biofertilizer on nitrous oxide emission, EGU General Assembly 2023, Vienna, Austria, 23–28 Apr 2023, EGU23-11242, https://doi.org/10.5194/egusphere-egu23-11242, 2023.

EGU23-11440 | ECS | Orals | ERE1.8

The potential to increase resilience by replacing feed imports with domestic food system by-products 

Vilma Sandström, Matti Kummu, and Florian Schwarzmueller

Many of the key feedstuff, such as oilseed meals or fishmeal, used in livestock and aquaculture production are highly traded commodities in global agricultural markets. The dependence on these imported inputs creates vulnerabilities to the production countries when disturbances on global trade flows occur. Increasing the feed use of the available food system by-products offers a solution to decrease the dependency and increase food system circularity and resilience. In this global study we combine trade data from various sources of the material flows in feed trade and estimate for the first time the potential to replace the imported feeds with a more efficient use of food system by-products from domestic production. The results highlight the materials and areas with most potential to guide and inform decisions when looking for solutions in the transition towards more sustainable food systems.

How to cite: Sandström, V., Kummu, M., and Schwarzmueller, F.: The potential to increase resilience by replacing feed imports with domestic food system by-products, EGU General Assembly 2023, Vienna, Austria, 23–28 Apr 2023, EGU23-11440, https://doi.org/10.5194/egusphere-egu23-11440, 2023.

EGU23-12259 | ECS | Posters on site | ERE1.8

Effect of urease inhibitor and biofertilizer on wheat yield and related crop parameters 

Corinna Eichinger, Rayehe Mirkhani, Lee Kheng Heng, Jason Mitchell, Rebecca Clare Hood-Nowotny, and Gerd Dercon

Agricultural production must increase by 50% to support about 9 billion people by 2050. Previous studies show that integrated crop-soil management strategies can improve cereal yield by 30% without increasing nitrogen use. Sustainable practices and the application of environmentally friendly technologies can help to reach this point by improving resource use efficiency and increasing yield. For this purpose, the effect of urease inhibitor and biofertilizer were evaluated in this study as environmentally friendly technologies that can increase cereal grain yield.

In the spring of 2022, a field experiment was established at the experimental station of the University of Natural Resources and Life Sciences (BOKU), located in the east of Vienna, to determine the effect of urease inhibitor and biofertilizer on wheat production. A randomized complete block design including five treatments and four replicates was used in this study. Each main plot was 9 by 9 meters, and a buffer zone of 1.5 meters was implemented between each of the individual main plots. The treatments were: T1 (control treatment - without N fertilizer), T2 (Urea only), T3 (Urea+Urease Inhibitor (UI)), T4 (Urea+Biofertilizer), T5 (Urea+UI+Biofertilizer). All treatments received 50 kg N ha-1 at tillering stage (GS 31), except T1. In this study N-(n-butyl) thiophosphoric triamide (nBTPT) or “Agrotain” was used as UI and Azotobacter chroococcum or “AZOTOHELP” was applied as biofertilizer. To determine wheat yield (grain and straw), a 1.5 by 8 meter area was harvested in each main plot (9 by 9 meters). To measure other parameters including the number of tillers per square meter, 1000-grain weight (g), plant height (cm), spike length (cm) and numbers of grains per spike, a 1m-by-1m area was harvested within each main plot for all treatments.

The highest grain and straw yields were observed in the Urea+UI+Biofertilizer treatment, with a grain yield of about 20, 11, 8% higher, compared to the Urea, Urea+UI and Urea+Biofertilizer treatments, respectively. However, a significant difference in grain and straw yields was only observed between Urea and Urea+UI+Biofertilizer treatments. The grain and straw yields in the Urea+UI and Urea+Biofertilizer treatments were not significantly different from both Urea and Urea+UI+Biofertilizer treatments. The number of grains per spike and the weight of 1000-grain in the Urea+UI+Biofertilizer treatment showed an increase of about 20 and 11% respectively, compared to the Urea treatment, but these increases were not significant. Plant height in treatments that received nitrogen fertilizer was not affected by fertilization treatments, but spike length was affected. This study suggests that the use of urea fertilizer coated with urease inhibitor in combination with biofertilizer is a promising way for sustainable crop production in the lowlands of Austria.

How to cite: Eichinger, C., Mirkhani, R., Kheng Heng, L., Mitchell, J., Hood-Nowotny, R. C., and Dercon, G.: Effect of urease inhibitor and biofertilizer on wheat yield and related crop parameters, EGU General Assembly 2023, Vienna, Austria, 23–28 Apr 2023, EGU23-12259, https://doi.org/10.5194/egusphere-egu23-12259, 2023.

EGU23-12478 | ECS | Orals | ERE1.8

Tracing the water footprint of food losses the in trade network: the case of wheat 

Francesco Semeria, Francesco Laio, Luca Ridolfi, and Marta Tuninetti

Food loss and waste is increasingly becoming a topic of great public concern: in 2011, FAO presented the estimate that around one third of the world’s food was lost or wasted every year and SDG 12 (“Sustainable consumption and production”) from Agenda 2030 includes among its targets to “halve per capita global food waste” and to “reduce food losses”. The impact on environmental resources is significant: in particular, 24% of total freshwater resources used in food crop production are lost in the different stages of food loss and waste. While in high-income countries food is mainly wasted at the consumer level, low-income ones record losses concentrated in the agricultural and post-harvest stages. Globally, food markets are telecoupled and globalized, so wasted food has effects on water resources in the whole supply chain, propagating along the trade network up to the countries of initial production, where water resources have been utilized, often through irrigation, altering the local hydrological cycle. The reconstruction of such network is one of the most challenging aspects of tracing the impact of food waste on water resources. The difficulties are due to the numerous food re-exports and nested supply chains, to the different origins of food waste (from production to distribution and consumption), and to the marked variability of the country-specific unit water footprints. As a key hypothesis, we assumed that in each country the ratio between imports and domestic production would be the same in both domestic consumption and exports, to cope with re-export feedbacks in the network. Focusing on the emblematic case of wheat and its derivatives (e.g., flour, bread, pasta), we were able to reconstruct the complex global network that connects losses and wastes at any stage along the supply chain with the corresponding wasted water resources.

Our results show that, for most countries, the network is very extensive and involves many states around the world. For example, in 2016 over 20 foreign countries employed their water resources to produce wheat which in turn was wasted as bread in Italy at the consumer level, accounting for around 15% of the bread’s water footprint (870 m3/t).  This highlights how much water resources are now globalized and that the waste of food in a country can impact even very distant water resources. We also quantify the contribution of each waste component, from agriculture’s field losses to consumers’ household wastes. For Italy, 54% of losses related to bread are at the consumption stage, while only 6% occur at the agricultural stage. Eventually, we present how the relative importance of each component varies, depending on the network of countries involved in the production, storing, processing, distribution and consumption of food.

How to cite: Semeria, F., Laio, F., Ridolfi, L., and Tuninetti, M.: Tracing the water footprint of food losses the in trade network: the case of wheat, EGU General Assembly 2023, Vienna, Austria, 23–28 Apr 2023, EGU23-12478, https://doi.org/10.5194/egusphere-egu23-12478, 2023.

EGU23-12940 | Posters on site | ERE1.8

An evaluation of smartphone applications for LAI estimation to facilitate canopy state assessment in vineyards 

Georgios Ovakoglou, Ioannis Navrozidis, Vasileios Pyrgiotis, Nikos Kalatzis, and Thomas Alexandridis

Crop development and foliar density as expressed with Leaf Area Index (LAI) is an important source of information for disease prevention. Canopy density in vineyards has been correlated with disease incidence, mainly concerning the impact of high density on intra-canopy ventilation and levels of humidity. LAI data can be used together with other data sources, such as temperature, humidity, rainfall etc., to enhance disease predictive models and continuous monitoring of crops. To improve the crowdsourcing aspect of data collection from farmers and agronomists capturing in-field observations, this study was implemented aiming to evaluate LAI smartphone applications. The applications selected for testing and evaluation were smart fLAIr (https://sys.cs.uos.de/smartflair) and VitiCanopy (https://viticanopy.com.au), selected based on their applicability, subscription pricing, user-friendliness and continued support from the developers among all available Android applications. The smartphone applications were evaluated against LiCOR 2200C plant canopy analyzer (https://www.licor.com/env/products/leaf_area/LAI-2200C) to demonstrate the measurement accuracy of each. Sampling for this experiment was carried out in four plots (25 points/plot, 100 total) applying gaiasense smart farming services (https://www.gaiasense.gr/en/gaiasense-smart-farming), located in two irrigated commercial vineyards in Stimagka, southern Greece. The collected samples were representing various canopy states considering foliar density. Sampling took place during early morning hours (after sunrise) for the first two plots, while the remaining two plots were sampled after midday to early afternoon hours (before sunset). All sampling locations were recorded with geo-tagged photographs. A cap-view of 45o under clear-sky conditions was used for LiCOR2200C measurements and atmospheric scattering correction was applied, following a 4A measurement sequence protocol as described in the instruction manual (https://licor.app.boxenterprise.net/s/fqjn5mlu8c1a7zir5qel). FV2200 software (https://www.licor.com/env/support/LAI-2200C/software.html) was used to process the LiCOR dataset. Statistical analyses were performed after excluding 10% of total acquired samples as outliers. The results show that VitiCanopy has greater accuracy compared to fLAIr with a correlation coefficient of 0.65 over 0.25, while producing overestimated LAI values (mean diff = 0.74, p<0.0001). On contrast, fLAIr generated slightly underestimated LAI values (mean diff=-0.24, F=0.0155). Per plot analysis showed that measurements acquired earlier during the day (first two plots) provided higher correlation values (0.39<r<0.64), while those acquired after midday scored lower (r<0.12). This comes in agreement with relevant literature, suggesting that the ideal light conditions for accurate LAI measurements (under clear-sky conditions) is the earliest possible after sunrise. Although correlation values remained low to moderate (0.07<r<0.64), findings indicate that VitiCanopy performs more accurately than fLAIr and can be used as an alternative to costly and sophisticated equipment, however caution should be taken while standardising the optimal atmospheric/lighting conditions. This insight can be useful for disease predictive models, as well as farmers and agronomists who seek an accessible way to monitor LAI, potentially leading to spatially variable spraying applications. Future plans include the integration of LAI measurements as an additional parameter within the gaiasense’s Smart Farming solution aiming to enhance information richness of the existing operational pest infestation risk index calculation algorithms for vineyards.

This work was supported by EU-H2020 project ‘Resilient farming by adaptive microclimate management’ (STARGATE – 818187).

How to cite: Ovakoglou, G., Navrozidis, I., Pyrgiotis, V., Kalatzis, N., and Alexandridis, T.: An evaluation of smartphone applications for LAI estimation to facilitate canopy state assessment in vineyards, EGU General Assembly 2023, Vienna, Austria, 23–28 Apr 2023, EGU23-12940, https://doi.org/10.5194/egusphere-egu23-12940, 2023.

EGU23-15016 | Orals | ERE1.8

A novel tool implementation to estimate the Land Use Sustainability for crops production under different climate change scenarios 

Joan Miquel Galve, Jesús Garrido-Rubio, José González-Piqueras, Anna Osann, Alfonso Calera, Maria Llanos López, Esteban Henao, David Sánchez, Jesús Puchades, Antonio Jesús Molina, Christina Papadaskalopoulou, Marina Antoniadou, and Dimitris Tassopoulos

The sustainability of crop production regarding different climate change scenarios will compromise actors and activities involved in agri-food systems. Furthermore, sustainable development was defined by the World Commission on Environment and Development as the ability to meet present demands without compromising the needs of future generations. In parallel, according to the Food and Agriculture Organization (FAO), land evaluation is the process of projecting land use potential based on its characteristics, and it has been the principal approach used worldwide to manage land use planning. Its use today is required due to changing needs and pressures from decision-making policies or agricultural market tendencies among others, so a rational use of natural land is a crucial goal for economic development. However, future climate change scenarios will modify the actual crop development conditions and must be tackled.

This paper presents two case studies at the river basin scale to determine the Land Use Suitability (LUS) analysis that is performed according to the FAO framework, thus, areas that are the most suitable for crops using GIS and multicriteria methodology that involves actual and future climatic conditions under different climate change scenarios, crop management practices and edaphological conditions for different crops. The tool developed generates a product that classifies areas suitable for a particular crop from a collection of maps and their corresponding thresholds. The approach involves standardizing the suitability maps, assigning relative importance weights to the suitability maps, and then combining the weights and the standardized suitability maps to obtain a suitability score.

In this paper, the wheat crop LUS at the Júcar River Basin (42,735 Km2, located in Spain) and the cotton LUS at the Pinios River Basin 11,000 km2, located in Greece) are evaluated. Once the LUS is estimated, a collection of yearly thematic maps over both river basins is ready for use by local stakeholders, regarding different climate change scenarios (RCP 4.5 and RCP 8.5).

These results are part of the EU Horizon 2020 project REXUS (Managing Resilient Nexus Systems Through Participatory Systems Dynamics Modelling), in which local stakeholders, from farmers to land use managers, are collecting and evaluating the information. Our final goal is to provide spatial information for future climate change scenarios that increase land-use knowledge and enhance decision-making policies.

How to cite: Galve, J. M., Garrido-Rubio, J., González-Piqueras, J., Osann, A., Calera, A., López, M. L., Henao, E., Sánchez, D., Puchades, J., Molina, A. J., Papadaskalopoulou, C., Antoniadou, M., and Tassopoulos, D.: A novel tool implementation to estimate the Land Use Sustainability for crops production under different climate change scenarios, EGU General Assembly 2023, Vienna, Austria, 23–28 Apr 2023, EGU23-15016, https://doi.org/10.5194/egusphere-egu23-15016, 2023.

EGU23-15056 | ECS | Orals | ERE1.8

Usage of by-products and residues of the food system in livestock diets leads to savings in global land and water resources 

Camilla Govoni, Paolo D'Odorico, Luciano Pinotti, and Maria Cristina Rulli

Animal foods play an important role in human nutrition providing essential micro and macronutrients. In addition, animal-source foods cover 16% of the global food supply, so contribute to global food security. However, livestock consumes about 70% of the global agricultural land and one-third of the freshwater available for agriculture, thus fueling the debate on the competition between the food and the feed sector for the use of increasingly scarce natural resources. Several studies suggest that more efficient management in the food system can reduce competition and increase the global food supply without further pressure on resources. Here we propose a strategy consisting in the replacement of energy-rich food-competing feeds, such as cereals and tubers, with agricultural by-products and residues. Thus, we analyze both the current impact on land and water use for animal-source foods and the natural resources (i.e. land and water) saving associated with the replacement. To this aim, we collected data on regional feed use and the potential replacement of these feeds with actually available by-products and residues. Then, the collected data are combined with countries-specific crop yields and a dynamic spatially distributed and physically based agro-hydrological model to analyze the difference in the land and water use between the current baseline condition and the substitution scenario. Considering the replacement of five major cereals and cassava estimated to range between 11% to 16% of their feed use, the potential amount of fertile land and green water volume that could be saved ranges from 10% to 14%, while from 11% to 17% for the blue water volume. While Eastern Asia and North America would reduce their energy-rich feed crop consumption the most, would be Southern, Eastern, and South-Eastern Asia, and Eastern Europe that would benefit the most from the use of agricultural by-products and residues to save land and green water resources. As far as blue water is concerned, the highest savings are expected to occur in Asia, where cereal production is traditionally irrigated, although linked to unsustainable water withdrawals. Furthermore, the effect of trade on the consumption of natural resources, namely virtual land and water trade, is also explored, with feed crop production relocated through virtual resource flows. While Eastern Europe, Northern America, and South America appear as net land and green water exporters, Eastern and Western Asia and Southern Europe appear as net importers, and Western Europe, instead, as both an importer and exporter region through feed trade. On the other hand, Asia and Northern America appear to be net freshwater exporters. As the demand for livestock products grows over the next half-century, any strategy aimed at curbing the demand for primary commodities and making the food system more resilient has the benefit of reducing environmental impacts on both local and distant areas of the world but also the trade dependency of countries, in a time where global food security is threatened by several factors.

How to cite: Govoni, C., D'Odorico, P., Pinotti, L., and Rulli, M. C.: Usage of by-products and residues of the food system in livestock diets leads to savings in global land and water resources, EGU General Assembly 2023, Vienna, Austria, 23–28 Apr 2023, EGU23-15056, https://doi.org/10.5194/egusphere-egu23-15056, 2023.

EGU23-15211 | ECS | Posters on site | ERE1.8

SEDIMENT REUSE FROM TROPICAL RESERVOIRS: assessing the suitability of sediment material for soil improvements and impacts of the practice on plant growth 

Braga Brennda, Arlena Bronsinsky, Saskia Foerster, and Pedro Medeiros

Due to the high rainfall variability in the Brazilian semi-arid region and the occurrence of long periods without rain, society has adopted techniques to cope with drought, with focus on the construction of surface reservoirs. However, silting is causing a decrease in the water storage capacity of those structures, reducing their depth, increasing water losses by evaporation and contributing to the degradation of water quality by adsorbed pollutants. In a context where mitigating solutions are necessary, removal of the nutrient-enriched sediment from the reservoirs’ beds and their subsequent reuse for soil fertilization have been proposed. To assess the potential of the sediment as fertilizer, maize plants were grown under controlled conditions in a greenhouse, considering: i) soil from the region where the sediment was collected with no amendments, ii) soil with 100% of the nitrogen recommendation provided by mineral fertilizer (iii) soil with sediment from São Nicolau reservoir (iii), soil with sediment from São Joaquim reservoir (iv). We observed higher relative chlorophyll content, plant growth and biomass production of maize plants from the soil with added sediment, with a similar behavior to plants growing in the soil with chemical fertilizer. We also found that the silt improves soil structure by increasing the water retention capacity of the soil. We have previously evaluated that this technique is economically feasible and can present savings of up to 30% in relation to traditional fertilization, depending on the characteristics of the sediment. However, sediments from the same hydrographic region may present high spatial variability in their physicochemical characteristics. Therefore, it is relevant to map the spatial distribution of the sediment characteristics. Recently, we demonstrated that diffuse reflectance spectroscopy might be useful to characterize sediments at lower costs and efforts than by laboratory analyses: for instance, regression models for electrical conductivity and clay content performed in the range of good to very good in the study region. A further promising approach is the application of spaceborne imaging spectroscopy to estimate the concentration of elements such as sodium, the electrical conductivity, the content of clay and organic matter in the sediment. The derived information can be used for informed decisions in the application of sediment reuse practice. For example, if the electrical conductivity of the sediment is higher than 4 dS/m, addition of sediment to the soil may prevent plant growth and, therefore, its reuse is not recommended. Thereby, sediment reuse can also potentially promote de-silting of reservoirs, reducing the carbon footprint associated with traditional fertilization and improving the water quality of small reservoirs, the main source of water supply for rural families, by removing nutrients that could return to the water column. In addition, the use of sediments may represent an alternative to increase agricultural production, being less susceptible to market price variation than commercial fertilizers. The CAPES/PROBRAL and the Deutscher Akademischer Austauschdienst (DAAD) are acknowledged for the financial support.

How to cite: Brennda, B., Bronsinsky, A., Foerster, S., and Medeiros, P.: SEDIMENT REUSE FROM TROPICAL RESERVOIRS: assessing the suitability of sediment material for soil improvements and impacts of the practice on plant growth, EGU General Assembly 2023, Vienna, Austria, 23–28 Apr 2023, EGU23-15211, https://doi.org/10.5194/egusphere-egu23-15211, 2023.

EGU23-15582 | ECS | Orals | ERE1.8

Sustainable agricultural strategies to address limited freshwater availability and meet food demand in the Nile River Basin 

Martina Sardo, Maria Cristina Rulli, and Davide Danilo Chiarelli

Providing healthy food from a sustainable food system, while satisfying the demand of a growing population, is one of the major challenges of the century.  The limited agricultural land and water represent the main boundaries to meet the food demand of a growing population (Davis et al., 2014, 2017). Moreover, availability of natural freshwater is expected to furtherly decline in future due to climate change (Rodell et al., 2018) – especially in arid regions – and, thus, there is an urgent need to reshape the agricultural system to sustainably feed a global population approaching 9 billion people in the next century (Godfray et al., 2010).

Food security in the Nile Basin is strictly related to the availability of freshwater resources, which are increasingly threatened by climate change and future demographic trends. Currently, food production is insufficient to meet the population food demand, and all Nile countries are currently net food importers. Healthy food is also needed to address malnutrition within the poorest rural communities in the Nile countries. Countries in the Basin are highly affected by undernourishment - linked low dietary energy - iron-deficiency-induced anemia and diabetes. The agricultural sector is the largest consumer of the Nile waters and, thus, the state of the food system has profound implications for attaining water security in the Nile Basin (NBI, 2020).

In this study we suggest a sustainable agricultural strategy to enhance sustainable a food system within the Nile River Basin. We couple the WATNEEDS hydro-agrological (Chiarelli et al., 2020) model with a linear optimization algorithm to reshape the current cropland with the aim of producing more healthy food, with several benefits for the ecosystem (e.g., reduced irrigation water consumption) and human health. Cropland redistribution can be coupled with agricultural intensification and diet shift generating, at the meso-scale, benefits in terms of irrigation water savings and increase in food self-sufficiency. We first evaluated the amount of irrigation water and the crop production related to the current crop distribution and second, we identified potential differences in food production and water consumption between the current and optimized crop distributions. We use the WATNEEDS model to quantify spatially distributed crop water requirements, - namely blue and green water requirements - which are the volumes of water needed to compensate crop water losses through evapotranspiration. Our results show that crop redistribution increases food availability and, thus, the percentage of population sustained sustainably with the local agricultural production, reducing the pressure on the currently available renewable freshwater resources of the Nile.

How to cite: Sardo, M., Rulli, M. C., and Chiarelli, D. D.: Sustainable agricultural strategies to address limited freshwater availability and meet food demand in the Nile River Basin, EGU General Assembly 2023, Vienna, Austria, 23–28 Apr 2023, EGU23-15582, https://doi.org/10.5194/egusphere-egu23-15582, 2023.

EGU23-15681 | Orals | ERE1.8

Coffee Agrosystems and Climate Change 

Raniero Della Peruta, Valentina Mereu, Donatella Spano, Serena Marras, and Antonio Trabucco

Coffee is one of the most important agri-food systems from a global economic point of view. Most of the production takes place on small and medium-sized farms and is the main source of income for many rural families in several developing countries. Areas suitable for coffee production are very biodiverse and ecologically important, thus negative impacts should be minimized.
Coffee production requires special environmental and climatic conditions. Current and future climate changes could cause problems for a sustainable production and result in lower yields. To overcome these problems, it is necessary to investigate the effectiveness of possible adaptation measures, such as intercropping with other tree species that can provide more shade to coffee plants and favour environmental sustainability. 
In order to study how such modifications could improve the resilience and sustainability of coffee production, the use of process-based models can be very useful. The DynACof model was developed specifically to simulate coffee farming systems, including phenological development, physiological processes related to flower and fruit production, carbon allocation, the effect of water availability, light and temperature, as well as management. We tested the DynACof model on some study areas in Mexico, Brasil and Rwanda and verified that the yield predictions were in line with the observations. We then developed a modelling tool where the model can be applied to entire geographical areas in a spatially explicit manner, using global climatic and soil datasets.
We used this tool to simulate yields in Latin America and Africa, both for the period 1985-2014 and for the period 2036-2065 using climate projections. Comparing the two periods, the model predicts a decrease in yields of about 28% in Latin America and about 12% in Africa. We then simulated specific management options (e.g. agroforestry shading vs intensive monocropping) to assess their efficacy in enhancing environmental sustainability and resilience to climate risks. These impact analyses will be crossed with socio-economic indicators for a more comprehensive climate risk assessment to support adaptation recommendations.

How to cite: Della Peruta, R., Mereu, V., Spano, D., Marras, S., and Trabucco, A.: Coffee Agrosystems and Climate Change, EGU General Assembly 2023, Vienna, Austria, 23–28 Apr 2023, EGU23-15681, https://doi.org/10.5194/egusphere-egu23-15681, 2023.

EGU23-15686 | Orals | ERE1.8

Elucidating climate change adaptation potential of improved maize (Zea mays L.) varieties with crop modelling 

Abel Chemura, Ponraj Arumugum, Eresi Kutesa Awori, and Christoph Gornott

The threats to crop yields are projected to increase under climate change and one of the most promising adaptation measures is for farmers to adjust their crop varieties over time to minimize climate risk. An improved or modern variety is a new variety of a plant species which produces higher yields, higher quality or provides better resistance to plant pests and diseases while minimizing the pressure on the natural environment. Selecting best maize varieties for various sites is also a good agricultural practice that can increase current yields in many low-productivity areas.  In this study, we aimed at identifying the climate change buffering potential of improved maize varieties using a spatialized DSSAT model using a case study across Uganda. We calibrate the model with observed weather data and then replace the weather files with climate projections from the ISIMIP3b. Model evaluation showed that the model performance was satisfactory with a correlation  coefficient (r) of 0.89, coefficient of determination (R2) of 0.79, index agreement (d) of 0.83 with observed yields. The impact of climate change on maize yield show spatial and temporal disparities with general trends showing that they worsen with time (2030 to 2090) and scenario (SSP1-RCP2.6 to SSP3-RCP7.0). At the national level, we project a yield loss of 6.2% (SSP1-RCP2.6) and 4.4% (SSP3-RCP7.0), by around 2030, 8.6% (SSP1-RCP2.6) and 14.3% (SSP3-RCP7.0) by around 2050, and 8.8% (SSP1-RCP2.6) and 26.8% (SSP1-RCP7.0) by around 2090. Switching to an improved variety results in at least double the maize yield under current climatic conditions (113.2%) compared to the current varieties, with maize yield exceeding 10 t/ha in the south-western, western and eastern parts of the country.  This positive yield effect was realized across all grids but substantially varied from around 10% to 500% yield change. Comparing the effect of climate change with an improved variety versus with a conventional variety shows it is always better to use an improved variety under climate change (positive effect), especially under worse case climatic conditions(2.9% and  8% yield buffering by 2090 under  SSP1:RCP2.6 and SSP3:RCP7.0 respectively) at national level. We therefore conclude that improved maize varieties offer a more durable solution to adapt to climate change and seed systems should therefore be strengthened to increase access to improved maize varieties for farmers.

How to cite: Chemura, A., Arumugum, P., Awori, E. K., and Gornott, C.: Elucidating climate change adaptation potential of improved maize (Zea mays L.) varieties with crop modelling, EGU General Assembly 2023, Vienna, Austria, 23–28 Apr 2023, EGU23-15686, https://doi.org/10.5194/egusphere-egu23-15686, 2023.

EGU23-16211 | ECS | Posters on site | ERE1.8

Management Options to Improve Drought Resilience in Sugar Beet 

Sabrina Santos Pires, Gernot Bodner, and Christine Stumpp

Weather-extreme events are increasingly common due to climate change, with longer periods of drought and periods of strong rainfall. Drought periods are a problem in agriculture with several crops suffering from qualitative and quantitative yield reduction depending on the crop growth stage. Sugar beet (Beta Vulgaris) makes up 20% of sugar production worldwide and is the main source of sugar in temperate regions, with a recent increase in its use for biofuel production. The search for drought-resistant varieties of sugar beet with lower water requirements is expanding, however substantial variability in drought resistance regarding yield and quality has not been found so far. The goal of this study was to develop strategies to improve yield security in sugar beet cultivation under low water availability conditions. Therefore, two field experiments were established at sites representative of Austrian sugar beet production (Oberhausen, Marchfeld; Guntersdorf, Weinviertel) over the course of two years, 2020 and 2021. The experiments involved combining breeding strategies (variety selection) with agronomic approaches (soil management, land cover, irrigation, fertilization) to investigate the sugar beet's response to water stress and assess the performance of different sugar beet varieties, leading to a more climate-resilient sugar beet crop. Direct methods of measuring soil hydraulic properties (e.g. via soil moisture sensors) and plant properties (e.g. stomata density and conductance) with stable isotope analysis for carbon and water were combined. As a result, a significant yield increase was found in irrigated plots. Nitrogen fertilization had a detrimental effect when applied extensively. A yield increase was obtained by soil coverage with wooden chips in both years and sites. Furthermore, the choice of variety also played an essential role, especially regarding the trade-off between drought resistance and yield.

How to cite: Santos Pires, S., Bodner, G., and Stumpp, C.: Management Options to Improve Drought Resilience in Sugar Beet, EGU General Assembly 2023, Vienna, Austria, 23–28 Apr 2023, EGU23-16211, https://doi.org/10.5194/egusphere-egu23-16211, 2023.

EGU23-16316 | Orals | ERE1.8 | Highlight

Cross-border environmental impacts of agri-food systems and potential solutions towards sustainability: a case study of trade between Europe and Africa. 

Ertug Ercin, Brecht D’Haeyer, Corjan Nolet, Emrah Alkaya, Didem Mahsunlar, Tolga Pilevneli, and Goksen Capar

Some nations and regions, such as the European Union (EU), use food ingredients and agri-food products that are not produced within their borders while being essential for their food security and food systems. This product flow through international trade means that these regions are connected to water resources outside their borders. It also means they create subsequent environmental and social effects in the original production locations, a phenomenon called ‘cross-border impacts”.  For example, these imports can be a substantial part of existing problems of water depletion and pollution in producing regions since every step in the food system such as growing, harvesting, transportation, production, packaging, and retail consume and pollute water. Furthermore, agricultural production in exporting regions provides the lion’s share of greenhouse-gas emissions from the food systems.

This study first maps the cross-border environmental footprints of agri-food systems in Europe (water and carbon footprints) along the supply chain of major imported agri-food products from Africa. Second, it determines the vulnerability of these agri-food systems to climate change. Third, it identifies potential solutions to minimize the vulnerabilities and environmental impacts of the agri-food systems that are connecting Europe and Africa.

The study shows that the cross-border environmental impact of European agri-food systems on Africa is largely related to imports of oranges, potatoes, grapes, tangerines, and tomatoes. For example, the water footprint of this trade is approximately 5 km3 per year.  These products originate from water-scarce areas such as North Africa (Egypt, Morocco) and South Africa. Furthermore, climate change will reduce water availability in these regions, e.g., 20% less water is expected in North African countries by 2050.

Minimization of food loss and waste along the supply chain of the Europe-Africa trade is investigated as a potential solution to reduce the environmental footprint of this trade. It is found that around a 30% reduction in water footprint can be achieved by eliminating food waste at the consumer level in Europe. Further reductions in environmental impacts can be achieved if manufacturing and transportation losses are minimized as well, up to 10% and 20% reductions in the water footprint and carbon footprint, respectively. Another solution to reduce the footprint of agri-food systems is to source relevant products locally instead of importing from Africa. This option significantly reduces carbon footprints (up to 60%) but not much for water footprints (around 10% reduction). For some food items such as oranges, more water can be saved if they are imported from Africa rather than locally produced in Europe.

This study concludes that the sustainability of agri-food systems has a cross-border dimension, which is mostly neglected in national policies of sustainable production and consumption. The sustainability of such imported agri-food products can be understood by assessing their environmental impacts at production locations. Improving production efficiencies at exporting regions (e.g., reduction of production losses and waste) and minimizing waste of these products at consumer levels can help reduce the environmental consequences of this trade and help achieve our sustainability goals.

How to cite: Ercin, E., D’Haeyer, B., Nolet, C., Alkaya, E., Mahsunlar, D., Pilevneli, T., and Capar, G.: Cross-border environmental impacts of agri-food systems and potential solutions towards sustainability: a case study of trade between Europe and Africa., EGU General Assembly 2023, Vienna, Austria, 23–28 Apr 2023, EGU23-16316, https://doi.org/10.5194/egusphere-egu23-16316, 2023.

EGU23-2395 | ECS | PICO | GI3.2

Performance of water indices using large-scale sentinel-2 data in Google Earth Engine Computing 

Mathias Tesfaye Abebe and Lutz Breuer

Evaluating the performance of water indices and quantifying the spatial distribution of water-related ecosystems are important for monitoring surface water resources of our study area since there is a limited study available to compute water indices using high-resolution and multi-temporal sentinel-2 data on a large scale. In addition, a comparative performance analysis of water indices methods using the aforementioned dataset on a country scale, showing their strengths and weaknesses, was missing too. To address these problems, this paper evaluated the performance of water indices for surface water extraction in Ethiopia. For this purpose, high spatial and multi-temporal resolution large-scale sentinel-2 data were employed and processed using the Google Earth Engine cloud computing system. In this study, seven indices, namely water index (WI) and automatic water extraction index (AWEI) with shadow and no shadow, normalized difference water index (NDWI), modified normalized difference water index (MNDWI), sentinel water index (SWI), and land surface water index (LSWI) were evaluated with overall accuracy, producer’s accuracy, user’s accuracy, and Kappa coefficient. The result revealed that the WI and AWEIshadow were the most accurate to extract the surface water compared to other indices in qualitative and quantitative evaluation of accuracy indicators obtained with a kappa coefficient of 0.96 and 0.95, respectively, and with overall accuracy for both in 0.98. In addition, the AWEIshadow index was also relatively better at suppressing shadow and urban areas. The accuracy difference between LSWI and other indices was significant which performed the worst with overall accuracy and kappa coefficients of 0.82 and 0.31, respectively. Using best-performing indices of WI and AWEIshadow, 82650 and 86530 square km of surface water fractions were extracted, respectively. Therefore, our result confirmed that WI and AWEIshadow indices generated better water extraction outputs using a high spatial and multi-temporal resolution of sentinel-2 data under a wide range of environmental conditions and water body types on the country scale.

How to cite: Abebe, M. T. and Breuer, L.: Performance of water indices using large-scale sentinel-2 data in Google Earth Engine Computing, EGU General Assembly 2023, Vienna, Austria, 23–28 Apr 2023, EGU23-2395, https://doi.org/10.5194/egusphere-egu23-2395, 2023.

EGU23-5297 | PICO | GI3.2

DC and FDEM salt wedge monitoring of the Po di Goro river (Italy). 

Enzo Rizzo, Paola Boldrin, Alessandro Bondesan, Francesco Droghetti, Luigi Capozzoli, Gregory De MArtino, Enrico Ferrari, Giacomo Fornasari, Valeria Giampaolo, and Federica Neri

The global warming is affecting the rising seas, which increase the saltwater contamination of the coastal zone in terms of intrusion and penetration in the delta system. The delta systems are characterized by complex dynamic between freshwater coming from continent and saltwater. The hydrodynamic system is greatly affected by the problem of climate change producing a scarce recharge of the aquifers and an increase of the upstream of the mixing zone in the surface waters. These conditions can hinder the water use for irrigation purpose leading to salinization of soils. This summer the Po River underwent a large saltwater intrusion crisis endangering the sustainability of the freshwater resources. The saline wedge in the Po Delta area defined salinisation of groundwater and the soil. These phenomena allow for the active ingression of seawater from the east because the hydraulic head is not sufficient to avoid water to flow inland from the sea. In order to define the water quality, the electrical conductivity (EC) is one of the typical used chemical-physical parameters. However, a common probe defines a punctual acquisition and, therefore, it is time consuming to make a monitor along a long river (> 50km), such as the Po di Goro, that is one of the Po River branches. The research group defined two fast geophysical approach for the monitoring of the saltwater penetration and intrusion. The FDEM method was used to detect the saline wedge in the river and the Electrical Resistivity Tomography was applied to monitor the hydrodynamic iteration between the river and the subsoil around the riverbanks. Two geophysical field activities were planned before and after the salt penetration crisis in the Po River, defined in the last summer. In detail, two ERTs and two long FDEM profiles were carried out along the Po di Goro river. Moreover, a “moving boat” approach with a multilevel EC probe was applied to join the acquired geophysical data set. The ERT sections highlighted how the salty water in the river contaminated the surrounding subsoil. The FDEM data sets defined the hydrodynamic of the saltwater wedge in the river detecting the salty plume front. These results highlight the great potential of the proposed geophysical approach to monitor the saline plume during crisis periods.

How to cite: Rizzo, E., Boldrin, P., Bondesan, A., Droghetti, F., Capozzoli, L., De MArtino, G., Ferrari, E., Fornasari, G., Giampaolo, V., and Neri, F.: DC and FDEM salt wedge monitoring of the Po di Goro river (Italy)., EGU General Assembly 2023, Vienna, Austria, 23–28 Apr 2023, EGU23-5297, https://doi.org/10.5194/egusphere-egu23-5297, 2023.

The first recorded environmental protests in Bor, Serbia, began in 1906, only 3 years after the mining and smelting of copper ores started. In 1931, one of the first results of chemical analysis of river water were issued, stating that the content of free acid (as H2SO4) in Bor River just after the mine was 0.0168 %. Another report from 1935 stated that the pH value of Bor River was 4.5, the concentration of Fe was 81 mg/L, and the concentration of Cu was 22 mg/L. At that time, sampling and analysis of river water were initiated by the rebellious local community who wanted compensation for the damage made to their agricultural fields. Throughout the years, the pollution of Bor River became a norm, and researchers from Serbia and the world investigated the pollution from the physical, chemical, mineralogical, and microbiological aspects. From 2015 to 2021, the pH value of Bor River ranged from 2.1 to 6.3, the concentration of Fe ranged from 66 to 355 mg/L, and the concentration of Cu ranged from 4 to 116 mg/L, depending on the intensity of mining and smelting activities. These more recent results are not so different from those about a century before. However, since the mining and smelting combine Bor changed its ownership in 2018, the monitoring of the pollution became more advanced, and there are more reclamation activities. Several automatic monitoring stations with inductively coupled plasma optical emission spectrometers or mass spectrometers (ICP-OES or ICP-MS) were installed in the field by the polluted rivers for the purpose of monitoring. Water from the largest acid mine drainage accumulation, the Robule Lake, was treated, drained, and in 2023. the Robule Lake does not exist anymore. Additional monitoring and reclamation activities are expected which could reduce the pollution of Bor River in the future.

How to cite: Stefan, D.: Past and present monitoring results of acid mine drainage around copper mines and smelter in Bor, Serbia, EGU General Assembly 2023, Vienna, Austria, 23–28 Apr 2023, EGU23-9667, https://doi.org/10.5194/egusphere-egu23-9667, 2023.

EGU23-9701 | ECS | PICO | GI3.2

Applicability of remote sensing evapotranspiration products in reducing uncertainty and equifinality in hydrological model calibration of Oued El Abid watershed. 

Soufiane Taia, Lamia Erraioui, Jamal Chao, Bouabid El Mansouri, and Andrea Scozzari

Typically, hydrological models are calibrated using observed streamflow at the outlet of the watershed. This approach may fail to mimic landscape characteristics, which significantly impact runoff generation because the streamflow incorporates contributions from several hydrological components. However, remotely sensed evapotranspiration (AET) products are commonly used as additional data with streamflow to better constrain model parameters. Several researchers demonstrated the efficacy of AET products in reducing the degree of equifinality and predictive uncertainty, resulting in a significant enhancement in hydrological modelling. Due to the variety of publicly available AET datasets, which vary in their methods, parameterization, and spatiotemporal resolution, selecting an appropriate AET for hydrological modelling is of great importance. The purpose of this study is to investigate the difference in simulated hydrologic responses resulting from the inclusion of different remotely sensed AET products in a single and multi-objective calibration with observed streamflow data. The GLEAM_3.6a, GLEAM_3.6b, MOD16A2, GLDAS, PML_V2, TerraClimate, FLDAS, and SSEBop datasets were downloaded and incorporated into the calibration of the SWAT hydrological model. The findings indicate that the incorporation of remotely sensed AET data in multi-objective calibration tends to improve model performance and decrease predictive uncertainty, as well as significantly improves parameter identification. Furthermore, AET single-variable calibration results show that the model would have performed well in simulating streamflow even without streamflow data. Moreover, each dataset included in this investigation responded differently. GLEAM_3.6b and GLEAM_3.6a performed the best, followed by FLDAS and PML_V2, while MOD16A2 was the least performing dataset. Thus, this research supports the use of remotely sensed AET in the calibration of hydrological models as a best practice.


How to cite: Taia, S., Erraioui, L., Chao, J., El Mansouri, B., and Scozzari, A.: Applicability of remote sensing evapotranspiration products in reducing uncertainty and equifinality in hydrological model calibration of Oued El Abid watershed., EGU General Assembly 2023, Vienna, Austria, 23–28 Apr 2023, EGU23-9701, https://doi.org/10.5194/egusphere-egu23-9701, 2023.

EGU23-10657 | PICO | GI3.2 | Highlight

Evaluating the applicability of transient electromagnetic (TEM) data to characterize aquifer geometry in urban areas 

Adrián Flores Orozco, Lukas Aigner, and Josef Ferk

Understanding subsurface properties within urban areas is critical for an adequate management of groundwater, for instance to delineate the migration of pollutants, artificial recharge systems or geothermal collectors. Information is available from extraction wells, yet the resolution of the information is limited to the locations where wells are available. Geophysical methods offer an alternative to gain subsurface information. However, asphalted roads and limited accessibility might reduce the applicability of electrical methods for investigations beyond a few meters, whereas vibrations due to traffic and railroads might hinder the application of seismic methods. In this work, we investigate the use of the transient electromagnetic (TEM) method to resolve the geometry of aquifers in urban areas. We propose the use of relative small loops to gain separation from buried structures and increase data quality in late times as required to reach a depth of investigations of ca. 40 m. Measurements were conducted in gardens located within cities deploying single-loop as well as in-loop geometries using two different instruments. Additionally, we evaluate our small loop configuration in a quasi noise-free site through comparison to larger loops and electrical methods. Analysis of the data demonstrate that relative small loops (12.5 m x 12.5 m) may be a possible solution to gain information in urban areas down to a depth of 30 m, yet a minimal separation to anthropogenic structures of ca. 5 m is required. Information at such depth can not be easily gain with refraction seismic or electrical resistivity tomographic measurements in such small areas. Moreover, our results reveal the possibility to gain similar information with smaller loops (6.25 m x 6.25 m), offering the possibility to increase the separation to sources of noise (i.e., buried infrastructure) and increase the data quality. The inversion of TEM measurements collected along a 100 m profile permitted to obtain vertical and lateral variations in aquifer geometry with a maximal depth of investigation of ca. 40 m, while DC-resistivity measurements in the same profile were limited to less than 10 m depth. Stochastic inversion of the data permitted to investigate the uncertainty in the obtained model parameters (resistivity and thickness of the resolved layers, i.e., aquifer).

How to cite: Flores Orozco, A., Aigner, L., and Ferk, J.: Evaluating the applicability of transient electromagnetic (TEM) data to characterize aquifer geometry in urban areas, EGU General Assembly 2023, Vienna, Austria, 23–28 Apr 2023, EGU23-10657, https://doi.org/10.5194/egusphere-egu23-10657, 2023.

EGU23-11724 | PICO | GI3.2

The IceWorm: an improved low-cost, low-power sensor for measuring dissolved CH4 in water bodies 

Jesper Christiansen, Sarah Elise Sapper, and Christian Juncher Jørgensen

Recent studies show emissions of dissolved methane (CH4) in the meltwater from the Greenland Ice Sheet. To better understand the phenomenon and evaluate its potential significance for the Arctic CH4 budget, continuous long-term measurements of dissolved CH4 concentrations are needed. Commercially available dissolved CH4 analyzers (DGEU-UGGA (LGR), CONTROS HydroC CH4 (Kongsberg) and Mini CH4 (pro-Oceanus)) generally have high power consumption and are very costly, limiting their operation in remote off-grid locations.

Here we present calibrations and field tests of a low-cost, low-power alternative – the "IceWorm" - for long-term monitoring of dissolved CH4. The IceWorm uses a Figaro TGS2611-E00 metal oxide sensor (MOS). While MOS are cheap and power efficient, a known drawback is the sensitivity of the sensor's resistance to changes in humidity and temperature. In a previous prototype, we showed that by encasing the MOS in a hydrophobic and gas-permeable silicone membrane, a constant humidity in the headspace around the sensor can be achieved, yielding consistent results when deployed in glacial meltwater at constant temperature (0.0 – 0.1˚C)1. In this updated version, the sensor was encased in a hydrophobic and gas-permeable Teflon membrane allowing for fast (~1 min) equilibrium between the water and headspace around the sensor and hence a rapid detection of changes in dissolved CH4 concentrations.

The first calibration was performed by exposing the IceWorm to stepwise increasing Two field calibrations of the sensor performance in meltwater at 0.0˚C were done: Afterwards, the sensors remained in the field for several weeks in the subglacial meltwater stream and the sensors were recalibrated in lab air under the same conditions to check for long-term sensor drift. Initially, field calibrated to measure dissolved CH4 in glacial meltwater at 0.0˚C, the IceWorm was also tested in a freshwater surface stream at temperatures between 1.6 – 15.7˚C. To account for the temperature difference, we compared the laboratory and field calibrations allowing us to correct the sensor output to temperature variations in the stream.

We will present time series of long-term measurements of dissolved CH4 in two different types of water bodies and discuss the promising performance of the sensor at temperatures different to stable 0˚C as well as the usability of in-air calibrations compared to the field calibrations with discrete samples.

1. Sapper et al. (2022) DOI:10.5194/egusphere-egu22-9972

How to cite: Christiansen, J., Sapper, S. E., and Juncher Jørgensen, C.: The IceWorm: an improved low-cost, low-power sensor for measuring dissolved CH4 in water bodies, EGU General Assembly 2023, Vienna, Austria, 23–28 Apr 2023, EGU23-11724, https://doi.org/10.5194/egusphere-egu23-11724, 2023.

EGU23-12141 | PICO | GI3.2

A framework for cost-effective enrichment of water demand records at fine spatio-temporal scales 

Panagiotis Kossieris, Ioannis Tsoukalas, and Christos Makropoulos

Residential water demand is a key element of urban water systems, and hence its analysis, modelling and simulation is of paramount importance to feed modelling applications. During the last decades, the advent of smart metering technologies has released new streams of high-resolution water demand data, allowing the modelling of demand process at fine spatial (down to appliance level) and temporal (down to 1 sec) scales. However, high-resolution data (i.e., lower than 1 min) remains limited, while longer series at coarser resolution (e.g., 5 min or 15 min) do exist and are becoming increasingly more available, while the metering devices with such sampling capabilities have potential for a wider deployment in the near future. This work attempts to enrich the information at fine scales addressing the issue of data unavailability in a cost-effective way. Specifically, we present a novel framework that enables the generation of synthetic (yet statistically and stochastically consistent) water demand records at fine time scales, taking advantage of coarser-resolution measurements. The framework couples: a) lower-scale extrapolation methodologies to provide estimations of the essential statistics (i.e., probability of no demand and second-order properties) for model’s setup at fine scales, and b) stochastic disaggregation approaches for the generation of synthetic series that resamples the regime of the process at multiple temporal scales. The framework, and individual modules, are demonstrated in the generation of 1-min synthetic water demands at the household level, using 15 min data from the available smart meter.

How to cite: Kossieris, P., Tsoukalas, I., and Makropoulos, C.: A framework for cost-effective enrichment of water demand records at fine spatio-temporal scales, EGU General Assembly 2023, Vienna, Austria, 23–28 Apr 2023, EGU23-12141, https://doi.org/10.5194/egusphere-egu23-12141, 2023.

EGU23-14097 | PICO | GI3.2

Geofluids inferences using deep electrical resistivity tomography for a sustainable energy transition 

Valeria Giampaolo, Luigi Capozzoli, Gregory De Martino, Vincenzo Lapenna, Giacomo Prosser, Fabio Olita, Paola Boldrin, and Enzo Rizzo

In the last years, the use of Deep Electrical Resistivity Tomography (DERT) has become more common for the investigation of areas with complex geological setting. The considerable resolution obtained through such a technique makes it possible to discriminate much more effectively the resistivity contrasts existing in the shallower crustal levels, thus providing more reliable information on the physical conditions of the rocks, the presence of structural discontinuity surfaces, on the presence and trend in the subsoil of aquifers and/or fluids of various origins.

For these reasons, some DERT investigations were carried out in a structurally complex area located close to Tramutola village, in the western side of the Agri Valley, where the largest onshore hydrocarbon reservoir in west Europe is present.

The Tramutola site represented a key sector for the early petroleum exploration and exploitation of the area. Natural oil spills were historically known since the 19th century in the investigated area, and these helped the national oil company to identify the first shallower hydrocarbon traces. Furthermore, a considerable amount of sulphureous hypothermal water (~28 °C with a flow rate of 10 l/s) with associated gases (mainly CH4 and CO2) was found during the drilling of the “Tramutola2” well (404.4 m) in 1936. From a geological point of view, the study area, is characterized by the presence of a complete section of the tectonic units of the southern Apennines and a complex structural framework, not yet fully clarified, which affect fluids circulation.

To foster the efficient and sustainable use of the geothermal resource in Tramutola area, surface and subsurface geological, hydrogeological and new geophysical data were combined in order deepen our knowledges about the reservoir of the hypothermal fluids and their circulation.

The municipality of Tramutola is interested in the rehabilitation of the abandoned oil wells, both in terms of exploitation of the geothermal resource and for the realisation of a tourist “Park of energy”. The aim is to provide a wide audience with strategies, models, and technical skills capable of making visitors more active and critical towards the sustainable use of energy resources. Furthermore, the possible exploitation of geothermal resources of the Tramutola site represents a strategic action in the Basilicata region as a prototype of energy transition from fossil fuels to more environmentally friendly energy resources. This is also essential to satisfy the increased demand for clean energy in the area (no. 7 affordable and clean energy United Nations’ SDGs) and also contribute to climate change mitigation through the reduction of CO2 emissions (13 climate action).

How to cite: Giampaolo, V., Capozzoli, L., De Martino, G., Lapenna, V., Prosser, G., Olita, F., Boldrin, P., and Rizzo, E.: Geofluids inferences using deep electrical resistivity tomography for a sustainable energy transition, EGU General Assembly 2023, Vienna, Austria, 23–28 Apr 2023, EGU23-14097, https://doi.org/10.5194/egusphere-egu23-14097, 2023.

EGU23-14977 | PICO | GI3.2

A low-cost novel optical sensor for water quality monitoring 

Sean Power, Louis Free, Chloe Richards, Ciprian Briciu-Burghina, Adrian Delgado Ollero, Ruth Clinton, and Fiona Regan

With increasing environmental pressure due to global climate change, increases in global
population and the need for sustainable obtained resources, water resources management
is critical. In-situ sensors are fundamental to the management of water systems by providing
early warning, forecasting and baseline data to stakeholders. To be fit-for-purpose,
monitoring using in-situ sensors has to be carried out in a cost effective way and allow
implementation at larger spatial scales. If networks of sensors are to become not only a
reality but common place, it is necessary to produce reliable, inexpensive, rugged sensors
integrated with data analytics.


In this context, the aim of this project was to design and develop a low cost, robust and
reliable optical sensor which capable of continuous measurement of chemical and physical
parameters in aquatic environments. An iterative engineering design method cycling
between sensor design, prototyping and testing was used for the realisation and optimisation
of the sensor. The sensor can provide absorption, scatter, and fluorescence readings over a
broad spectral range (280nm to 850nm) and temperature readings in real-time using a suite
of optical sensors (CMOS Spectrometers and photodiode detector), custom designed LED
array light source and a digital temperature probe. Custom electronics and firmware were
developed to control the sensor and facilitate data transmission to an external network.
Sensor electronics are housed in a marine grade watertight housing; the optical components
are mounted inside a custom designed 3D-printed optical head which joins with the sensor
housing. The sensor is capable of measuring a range of optical parameters and temperature
in a single measurement cycle. Sensor analytical performance was demonstrated in the
laboratory, for detection and quantification of turbidity using analytical standards and in the
field by comparison with a commercially available multi- parameter probe (YSI, EXO 2).
The laboratory and field trials demonstrate that the sensor is fit-for-purpose and an excellent
tool for early warning monitoring by providing high frequency time-series data, operate
unattended in-situ for extended periods of times and capture pollution events.

Acknowledgement - This research is carried out with the support of Project Ireland’s 2040’s
Disruptive Technologies Innovation Fund.

How to cite: Power, S., Free, L., Richards, C., Briciu-Burghina, C., Delgado Ollero, A., Clinton, R., and Regan, F.: A low-cost novel optical sensor for water quality monitoring, EGU General Assembly 2023, Vienna, Austria, 23–28 Apr 2023, EGU23-14977, https://doi.org/10.5194/egusphere-egu23-14977, 2023.

EGU23-15083 | PICO | GI3.2

Gedi Data Within Google Earth Engine: Potentials And Analysis For Inland Surface Water Monitoring 

Alireza Hamoudzadeh, Roberta Ravanelli, and Mattia Crespi

Inland surface water is the source of about 60% and a key component of the hydrological cycle. The monitoring of inland surface water is fundamental to understanding the effects of climate change on this key resource and preventing water stresses. Water levels traditionally measured by ground instruments like gauge stations are expensive and have high maintenance costs. Conversely, Earth Observation technologies can nowadays collect frequent and regular data with continuous monitoring of water reservoirs, reducing monitoring costs.


With the availability of new data, the need for a capable computation tool is crucial. Google Earth Engine (GEE), a cloud-based computation platform capable of integrating a high variety of datasets with powerful analysis tools [1], has recently added the Global Ecosystem Dynamics Investigation (GEDI) [4] to its wide archive. 


The GEDI [2] instrument, hosted onboard the International Space Station,  is a geodetic-class, light detection and ranging (LiDAR) system, having a 25 m spot (footprint) on the surface over which 3D structure is measured. The footprints are separated by 60 m along-track, with an across-track distance of about 600 m. The measurements are made over the Earth's surface nominally between the latitudes of 51.6° and -51.6°. GEDI was originally developed to enable radically improved quantification and understanding of the Earth’s carbon cycle and biodiversity. 


The available literature highlights that the quality of GEDI data is variable and impacted by several factors (e.g., latitude, orbit). Our preliminary analysis is focused on the accuracy assessment of the GEDI data, at first addressing the problem of outliers detection and removal, and secondly comparing the water levels measured by GEDI with reference ground truth; thus, we considered four lakes in Northern Italy for which level measurements from gauge stations are available.

The proposed outlier detection consists of two steps for each GEDI passage over water surfaces.

The first step is based on two flags implanted within GEDI bands. Specifically, the “quality_flag” indicates if the considered footprint has valid waveforms (1=valid, 0=invalid), due to anomalies in the energy, sensitivity, and amplitude of signals; the “degrade_flag” indicates the degraded state of pointing (saturation intensity of returned photons might reduce the accuracy of measurements) and/or positioning information (GPS data gap, GPS receiver clock drift).

The second step relies on the robust version of the standard 3σ test, implemented considering the NMAD (Normalized Median Absolute Deviation): every GEDI measurement not within -/+3*NMAD from the median is removed as outlier.

To assess the outlier detection procedure and to preliminarily evaluate the accuracy of the GEDI data, we compared the water levels inferred from the median of GEDI measurements after outlier removal with the contemporary water levels from hydrometric stations at four major lakes (Como, Garda, Iseo, Maggiore) in Northern Italy [3]. The comparison is ongoing over the period from GEDI activation until June 2022, for 3 years.

References

[1] Cardille, et al., 2022. Cloud-Based Remote Sensing with Google Earth Engine.

[2] Dubayah, et al., 2021. GEDI L3 gridded land surface metrics, version 1

[3] Enti Regolatori dei Grandi Laghi, 2022. Home Page - Laghi. www.laghi.net.

[4] University of Maryland, 2022. GEDI ecosystem lidar

How to cite: Hamoudzadeh, A., Ravanelli, R., and Crespi, M.: Gedi Data Within Google Earth Engine: Potentials And Analysis For Inland Surface Water Monitoring, EGU General Assembly 2023, Vienna, Austria, 23–28 Apr 2023, EGU23-15083, https://doi.org/10.5194/egusphere-egu23-15083, 2023.

EGU23-15274 | PICO | GI3.2 | Highlight

Cost-effective full monitoring system for long-term measurements in lake ecosystems 

Daniele Strigaro, Massimiliano Cannata, Camilla Capelli, and Fabio Lepori

The concomitance of climate changes and human activities effects is a mix of co-factors that can induce unknown dynamics and feedbacks which need to be studied and monitored. Lakes are one of the most affected natural resources. Due to their importance for economy, water supply, tourism it is essential to safeguard their health. Unfortunately, lake monitoring is dominated by very high costs of materials and by proprietary solutions that are a barrier for data interoperability. To this end, an integrated system which uses as much open source licensed technology as possible and is open source itself will be presented. The main idea is to create a complete pipeline that can integrate different data sources by means of processes that can make the time series organized and accessible and then be served via standard services. Data integration allows further analysis of the data to produce new time series either by manual or automatic processes. This proposition also includes the creation of an Automatic High-Frequency Monitoring (AHFM) system built using cost-effective principles and meeting open design requirements. The preliminary results and the applications of this solution will be described such as the calculation of the primary production and the quasi real-time detection of algal blooms. The study area where this system has been developed and tested is Lake Lugano in the southern part of Switzerland, which is a very productive lake affected by climate changes effects. The developed system permits the integration of the historical data measured with the traditional campaigns on the lake with new datasets collected with innovative technologies so that the comparison and validation of datasets can be more easily performed. In this way it is possible to detect biases and create automatic data pipelines to calculate indicators and notify alerts. 

How to cite: Strigaro, D., Cannata, M., Capelli, C., and Lepori, F.: Cost-effective full monitoring system for long-term measurements in lake ecosystems, EGU General Assembly 2023, Vienna, Austria, 23–28 Apr 2023, EGU23-15274, https://doi.org/10.5194/egusphere-egu23-15274, 2023.

EGU23-15814 | ECS | PICO | GI3.2 | Highlight

Low-cost in-situ sensor networks for soil moisture and water table measurements: experiences and recommendations. 

Ciprian Briciu-Burgina, Jiang Zhou, Muhammad Intizar Ali, and Fiona Regan

Soil moisture is an essential parameter for irrigation management, transport of pollutants and estimation of energy, heat, and water balances. Soil moisture is one of the most important soil spatial-temporal variables due to the highly heterogeneous nature of soils which in turn drives water fluxes, evapotranspiration, air temperature, precipitation, and soil erosion. Recent developments have seen an increasing number of electromagnetic sensors available commercially for soil volumetric water content (θ) and their use is expanding providing decision support and high-resolution data for models and machine learning algorithms.

In this context, two demonstrations of in-situ LoRaWAN sensor networks are presented. The 1st one is from a grassland site, Johnstown Castle, Wexford Ireland where a network of 10 low-cost soil moisture (SM) sensors has been operating for 12 months. The 2nd network has been operating for 6 months at a peatland site (Cavemount Bog, Offaly, Ireland) which is currently undergoing a rehabilitation process through re-wetting. At this site, in addition to SM sensors, ultrasonic sensors are used for continuous measurement of the water table at 7 locations. For both sites, the analytical performance of the SM sensors has been determined in the laboratory, through calibrations in liquids of known dielectric permittivity and through field validation via sample collection or time domain-reflectometry instrumentation (TDR). Experiences and recommendations in deploying, maintaining, and servicing the sensor networks, and data management (cleaning, validation, analysis) will be presented and discussed. Emphasis will be placed on the key learnings to date and the performance of the low-cost sensor networks in terms of collected data.

Small-scale sensor networks like these are expected to bridge the gap between the low spatial resolution provided by the satellite-derived products and the single point/field measurements. Within the project, the sensor network will provide spatial observations to complement existing fixed point measurements. It will allow researchers to investigate SM dynamics at field scale in response to different soil types, soil density, elevation, and land cover.

How to cite: Briciu-Burgina, C., Zhou, J., Ali, M. I., and Regan, F.: Low-cost in-situ sensor networks for soil moisture and water table measurements: experiences and recommendations., EGU General Assembly 2023, Vienna, Austria, 23–28 Apr 2023, EGU23-15814, https://doi.org/10.5194/egusphere-egu23-15814, 2023.

EGU23-16053 | ECS | PICO | GI3.2 | Highlight

Multiparametric water quality sensor based on carbon nanotubes: Performance assessment in realistic environment 

Balakumara Vignesh M, Stéphane Laporte, Yan Ulanowski, Senthilmurugan Subbiah, and Bérengère Lebental

Good quality water is crucial to most developing nations' sustainability. However, there is a clear lack of affordable and reliable solutions to monitor water quality. According to the WHO 2022 Sustainable Development Goals report, about 3 billion people do not have information on their water quality. While off-line measurements are commonly practiced, the availability of in-situ monitoring solutions is considered critical to the generalization of water monitoring, but current technologies are bulky, expensive and usually do not target  a sufficient number of quality parameters. [1]

To meet this challenge, the LOTUS project (https://www.lotus-india.eu/) brings forward a low-cost, compact, versatile multiparametric chemical sensor aiming at real-time monitoring of chlorine, pH, temperature and conductivity in potable water. The proposed solution –a tube of 21.2 cm in length by 3.5 cm in diameter – is composed of a replaceable sensor head incorporating the sensing elements and a sensor body containing the acquisition and communication electronics. The sensor head integrates a 1cm² silicon chip with 2 temperature sensors (serpentine-shaped thermistors), 3 conductivity sensors (parallel electrodes in a 4-probe configuration) and a 10x2 sensor array of multi-walled carbon nanotube (CNT) chemistors. The CNT are arranged in random networks between interdigitated electrodes and are either non-functionalized or functionalized with a dedicated polymer. [1]

We evaluated the performance of 7 units of this solution in Sense-city facility (located at University Gustave Eiffel, France - https://sense-city.ifsttar.fr/ ),  exploiting its 44m potable water loop with 93.8-mm PVC pipes. The system was operated at 25 m3/h and 1 bar, at temperature ranging between 15°C and 20°C, conductivity between 870 µS/cm and 1270 µS/cm; and chlorine between 0 and 5 mg/L. Because of the high-level of electromagnetic interferences in Sense-City and limited shielding of the acquisition system, the sensor signal is severely noisy and various steps of denoising are required. From the initial dataset were extracted a small number of devices and time periods with both sufficient variations in the target parameters and manageable level of signal-over-noise ratio. 

For chip 141, over 150hours of testing, CNT-based chemistors showed sensitivity to pH and active chlorine (HClO) with differentiated response between functionalized and non-functionalized devices. However, pH and chlorine can only be estimated with MAE respectively 0.17 and 0.18mg/L due to the high noise level. Over 400h, with chip 141, the real-time temperature of the water can be estimated with an MAE of 0.4°C in flowing water and 0.1°C  in static water. The chip 141 dataset did not feature enough conductivity variation to assess performances. This was achieved on chip AS001 with an MAE of 176.2 µS/cm over 80 hours.

Overall, these results provide a preliminary proof of operation of the solution in realistic environment, with the high noise level being a major limitation. A new version of system is being designed to reduce the noise, to be tested in Sense-City in 2023.

[1] Cousin, P. et al. (2022). Improving Water Quality and Security with Advanced Sensors and Indirect Water Sensing Methods. Springer Water. https://doi.org/10.1007/978-3-031-08262-7_11

How to cite: Vignesh M, B., Laporte, S., Ulanowski, Y., Subbiah, S., and Lebental, B.: Multiparametric water quality sensor based on carbon nanotubes: Performance assessment in realistic environment, EGU General Assembly 2023, Vienna, Austria, 23–28 Apr 2023, EGU23-16053, https://doi.org/10.5194/egusphere-egu23-16053, 2023.

EGU23-16460 | PICO | GI3.2

Using hard and soft data from direct and indirect methods to develop a model for the investigation of a metamorphic aquifer 

Salvatore Straface, Francesco Chidichimo, Michele De Biase, and Francesco Muto

In Italy, despite large areas of the country being covered by metamorphic rocks, the hydrogeological properties of these formations are not yet well known. The productivity of metamorphic aquifers is generally lower than the more common ones such as alluvial or carbonates. However, in some Mediterranean areas such as in Calabria region the scarcity of water resources and their considerable extension (metamorphic aquifers make up 39% of the total) determines a request for further studies either on their hydrodynamic properties and their hydraulic behaviour in order to achieve their sustainable exploitation. Interest in these metamorphic aquifers becomes ever greater if climate changes are considered. The purpose of this study is to provide the geological-structural and hydrogeological modeling of a metamorphic aquifer, through the measurement of direct and indirect data and the application of a numerical model, in a large area of the Sila Piccola, in Calabria. To recognize and characterize the geometries of the aquifer in metamorphic rocks in a complex geological setting, data on springs, wells and piezometers installed in boreholes and located at various depths were collected. These surveys were implemented by geoelectric tomography profiles and by geognostic investigations. The recognition of the geometries and above all the stratigraphic relationships between the various outcropping rocks and lithological units have been accompanied by macrostructural and meso-structural analysis to better evaluate the state of fracturing of the rock mass. The characterization of hydrodynamic properties in crystalline-metamorphic aquifers, that is constituted by granite and metamorphic rocks, is extremely complex given the lateral-vertical anisotropies. Among the main fractures there is a network of secondary connections of different order and degree which determines a continuous variation of these properties at different scales and defines the modality and direction of the groundwater flow. The MODFLOW-2005 groundwater model was used to simulate the flow phenomena in the aquifer, obtaining hydraulic conductivity values of 2.7 × 10⁻⁶ m / s, corresponding to two orders of magnitude higher than that calculated with the slug-tests inside the slope. In summary, the mathematical model was able to estimate the equivalent permeability of the aquifer and the presence of a lateral recharge from a neighboring deep aquifer that materializes a significant water supply.

How to cite: Straface, S., Chidichimo, F., De Biase, M., and Muto, F.: Using hard and soft data from direct and indirect methods to develop a model for the investigation of a metamorphic aquifer, EGU General Assembly 2023, Vienna, Austria, 23–28 Apr 2023, EGU23-16460, https://doi.org/10.5194/egusphere-egu23-16460, 2023.

Currents transport the sediment discharge of the Amazon River as far as the Orinoco Delta (Venezuela).  The combined actions of waves (predominately from the NE) and the Guiana Current create mud banks of 30 km in width.  A continuous process of mud erosion and accretion propagates the mud banks westward  

The talk demonstrates tracking the mud banks with satellite-derived bathymetry (SDB).  The SDB method used here is not the familiar Lyzenga bottom radiance to depth inversion which works only in clear waters.  Here there is no bottom visibility.  Instead, the SDB uses the interaction of ocean waves with the bottom.  Ocean waves exhibit refraction, slower celerity, and reduced wavelength as they ‘feel’ the bottom.   These phenomena are observable regardless of water turbidity.

WKB has been successfully implemented with X-band radars on coastal towers and ships (by German and UK researcher groups); and with the WorldView and Pleiades satellites (by this author and others).  However, all these sensor modalities have small ground footprints (~10 km2 to 100 km2).

The European Sentinel-2 satellites have dramatically increased WKB coverage to a regional scale.  This talk presents a Sentinel-2 view of the 1500 km muddy coastline, extending up to 50 km offshore (a total area of 75,000 km2).    

The leap in WKB possibilities was made possible by a 220 km image swath, repeat visits every five days, and the free distribution of the images from the Copernicus portal.

How to cite: Abileah, R.: Tracking mud banks on the 1500 km coastline from the Amazon to the Orinoco Delta, EGU General Assembly 2023, Vienna, Austria, 23–28 Apr 2023, EGU23-16881, https://doi.org/10.5194/egusphere-egu23-16881, 2023.

EGU23-428 | ECS | Posters on site | CL3.2.8

Is Argentina hotter? Understanding heatwaves temporal and spatial behavior using the ERA5-LAND dataset (1950-2022)  

Caterina Cimolai, Enric Aguilar, Benito Zaragozí, Jon Olano Pozo, and Anna Boqué Ciurana

Climate strongly impacts socio-ecologic systems. Increasing the intensity and frequency of heatwaves is one of its major consequences. Heatwaves are periods of consecutive days when temperatures are much hotter than normal. Cities are especially affected because their impact is usually aggravated by the Urban Heat Island (UHI), an intrinsic phenomenon that increases urban temperatures compared to surrounding rural areas. Extreme hot temperatures affect urban areas causing health problems, increasing energy requirements, and altering water supplies, among others.  

Heatwaves have been studied in Argentina but this has not been updated for the whole country recently. Due to these impacts on people’s well-being, infrastructure, and ecosystem functioning, this work proposes to study changes in spatial distribution and frequency of heatwaves in Argentina.  

We use the ERA5 LAND dataset and the HeatWaver R package to identify heatwaves over mainland Argentina. For the purpose of this study, we define heatwaves as periods where maximum and/or minimum temperatures are above the 90th percentile of the WMO standard reference period (1961-1990) during five or more consecutive days. We inspect the temporal and spatial extent of the phenome and monitor its changes over time. In agreement with global warming tendencies, heatwaves are more frequent, and a larger portion of the country has been under stress in recent years. We also inspect the heterogeneous impact over the territory and large cities.  

To understand the impact of heatwaves in cities, it is crucial to evaluate the risk, which is the conjunction of hazards, exposure and vulnerability. As a first step, this work studies heatwaves as hazards while those other aspects will be incorporated into future research. Our final objective is to reach an urban heatwave risk index, combining meteorological, environmental, urban, and social aspects. This indicator would liaise climate science with local and regional policies and offer information for adaptation and mitigation policies to face climate variability and change.  

Keywords: heatwaves, cities, climate change, Argentina. 

How to cite: Cimolai, C., Aguilar, E., Zaragozí, B., Olano Pozo, J., and Boqué Ciurana, A.: Is Argentina hotter? Understanding heatwaves temporal and spatial behavior using the ERA5-LAND dataset (1950-2022) , EGU General Assembly 2023, Vienna, Austria, 23–28 Apr 2023, EGU23-428, https://doi.org/10.5194/egusphere-egu23-428, 2023.

EGU23-862 | Posters on site | CL3.2.8

The hunter-gatherers of Abra del Toro rock shelter, northwestern Argentina, suffered the effects of the large 4.2 ka Cerro Blanco eruption 

Jose-Luis Fernandez-Turiel, Juan Pablo Carbonelli, and Carlos Belotti López de Medina

There is a dearth of information regarding prehistoric foraging societies from the intermontane longitudinal valleys of the South-Central Andes. Due to the intense anthropization of the landscape or the scarce research efforts on prehistoric populations of hunter-gatherers in the intermontane valleys of the Andes, occupation sites have been found on very few occasions. However, new perspectives in the Abra del Toro rock shelter in the Yocavil Valley (Catamarca province, Argentina) have opened up from recent and ongoing excavations. This rock shelter is the first archaeological case in which it is possible to analyze the relationship between a large-scale natural catastrophe and the prehistoric populations living in the Andean intermontane valleys of the southern Central Andes. This rock shelter's stratigraphy and archaeological remains contain the record of interactions between human communities and volcanism. The stratigraphic record of the rock shelter shows a 1-m-thick volcanic ash deposit formed by aeolian transport from primary outer ashfall deposits. Geomorphological and sedimentological context, texture, glass and mineral content, whole-rock chemical composition, and radiocarbon dating prove that the tephra was derived from the 4.2 ka BP eruption of the Cerro Blanco Volcanic Complex in southern Puna (NW Argentina). This volcanic eruption is the largest documented in the world in the last five thousand years and covered the surroundings of the archaeological site with an ash layer of approximately 1 meter thick. The stratigraphic sequence of the Abra del Toro rock shelter allows us to hypothesize that there were three main occupational moments: two hunter-gatherer moments, separated by the record of the large volcanic eruption, and a subsequent agro-pottery period (Carbonelli et al. 2022. J. Archaeol. Sci. Rep. 45, 103629). The rock shelter after the eruption remained in the memory of the hunter-gatherer groups. Good visibility, accessibility, and proximity to water were attributes of this space that made it possible for it to be re-occupied after the eruptive event. Our next objective is to reconstruct, using proxy analysis, how the paleoenvironment was in the intermontane valleys before and after the eruption. The evidence of this Mid-Holocene catastrophic volcanic event in the Abra del Toro rock shelter opens the possibility of knowing its impact on the contemporary hunter-gatherer community and drawing conclusions for similar future volcanic crises.

This work was supported by the National Scientific and Technical Research Council (Grant PIP 112-201301-00178), the University of Buenos Aires (Grant UBACyt 20020170100318BA) (University of Buenos Aires), the National Agency for the Promotion of Research, Technological Development and Innovation (Grant 2019-01229) and the QUECA Project (MINECO, Grant CGL2011-23307).

How to cite: Fernandez-Turiel, J.-L., Carbonelli, J. P., and Belotti López de Medina, C.: The hunter-gatherers of Abra del Toro rock shelter, northwestern Argentina, suffered the effects of the large 4.2 ka Cerro Blanco eruption, EGU General Assembly 2023, Vienna, Austria, 23–28 Apr 2023, EGU23-862, https://doi.org/10.5194/egusphere-egu23-862, 2023.

EGU23-1212 | Orals | CL3.2.8 | Highlight

Storylines of the impacts in the Netherlands of alternative realizations of the Western Europe July 2021 floods 

Bart Van Den Hurk, Karin de Bruijn, Kymo Slager, mark Hegnauer, and Guus Rongen

The 2021 summer flooding was an extremely rare event, driven by precipitation extremes that exceed Dutch design levels for flood protection in regions away from the main rivers and coastline. However, similar events in neighboring locations cannot be ruled out even in the near future. The implications of such extreme rainfall amounts will vary by region, subject to local topography, hydraulic flow patterns, water management, and societal exposure. We explore the geographic distribution of potential flood impacts induced by a similar event by constructing impact-oriented event storylines for different subregions in the Netherlands. The plausibility of the storylines is underlined by using physical evidence, proven impact-modelling concepts, and expert judgment successfully assessing the (sometimes unexpected) outcomes. The approach supports impact assessment for extraordinary events.

The presentation will illustrate the development of the storylines, and its uptake and interpretation by governing authorities responsible for water safety, civil protection and water management.

How to cite: Van Den Hurk, B., de Bruijn, K., Slager, K., Hegnauer, M., and Rongen, G.: Storylines of the impacts in the Netherlands of alternative realizations of the Western Europe July 2021 floods, EGU General Assembly 2023, Vienna, Austria, 23–28 Apr 2023, EGU23-1212, https://doi.org/10.5194/egusphere-egu23-1212, 2023.

EGU23-2330 | ECS | Orals | CL3.2.8 | Highlight

Increasing chances of summer wildfires in the UK? 

Vikki Thompson, Dann Mitchell, Hannah Bloomfield, Nick Dunstone, and Gillian Kay

In the summer of 2022 unprecedented weather conditions in the UK lead to wildfires in many regions. Record breaking temperatures – above 40 °C for the first time - and prolonged dry conditions led to exceptional fire weather severity. On July 19th London Fire Brigade declared a major incident as firefighters battled several significant wildfires across the city. We investigate if climate change is enhancing summertime wildfire risk in the UK. 

We use reanalysis data from 1960 to the present day to analysis trends in the climatic indicators that influence the fire weather index. A large ensemble of initialised climate model simulations from the same time period are used to support the findings and identify as-yet-unrealised possible fire weather index situations in the UK. 

In the UK the term ‘wildfire’ is not limited to fires in wildland, but to any uncontrolled vegetation fire which requires action regarding suppression. Wildfires in the UK are considered a semi-natural hazard due to their close link with human activity. Though we investigate only meteorological influences, these are not the sole cause of wildfires – for example fuel availability plays a large role. 

Better understanding of the trends in the fire weather severity and chance of exceptional conditions for the UK will enable improved understanding of the risks. This information can feed into relevant policy and contingency planning, allowing society to become better prepared for the future as the planet continues to warm. 

How to cite: Thompson, V., Mitchell, D., Bloomfield, H., Dunstone, N., and Kay, G.: Increasing chances of summer wildfires in the UK?, EGU General Assembly 2023, Vienna, Austria, 23–28 Apr 2023, EGU23-2330, https://doi.org/10.5194/egusphere-egu23-2330, 2023.

EGU23-2376 | ECS | Orals | CL3.2.8

Advancing research on compound weather and climate events via large ensemble model simulations 

Emanuele Bevacqua, Laura Suarez-Gutierrez, Aglae Jezequel, Flavio Lehner, Mathieu Vrac, Pascal Yiou, Giuseppe Zappa, and Jakob Zscheischler

Societally relevant weather impacts typically result from compound events, which are rare combinations of weather and climate drivers. For example, compound hot-dry events frequently cause damage to human and natural systems, often exceeding separate impacts from heatwaves and droughts. Focussing on four event types arising from different combinations of climate variables across space and time, we illustrate that robust analyses of compound events – such as frequency and uncertainty analysis under present-day and future conditions, event attribution, and exploration of low-probability-high-impact events – require very large sample sizes. In particular, the required sample is much larger than that needed for routinely considered univariate extremes. We demonstrate how large ensemble simulations from multiple climate models are crucial for advancing our assessments of compound events and for constructing robust model projections. For example, among the case studies, we focus on compound hot-dry events and show that large ensemble model simulations allow for identifying plausible extremely dry climates that, if occurring in a warmer world, would be associated with high risk from compound hot-dry events. Overall, combining large ensemble simulations with an improved physical understanding of compound events will ultimately provide practitioners and stakeholders with the best available information on climate risks.

How to cite: Bevacqua, E., Suarez-Gutierrez, L., Jezequel, A., Lehner, F., Vrac, M., Yiou, P., Zappa, G., and Zscheischler, J.: Advancing research on compound weather and climate events via large ensemble model simulations, EGU General Assembly 2023, Vienna, Austria, 23–28 Apr 2023, EGU23-2376, https://doi.org/10.5194/egusphere-egu23-2376, 2023.

Historical extreme flooding events in Central European river catchments caused high socioeconomic impacts. Previous studies investigated single events in detail but did not focus on an analysis of the underlying extreme precipitation events in general as historical events are too rare for a robust assessment of their generic dynamical causes. This study attempts to fill this gap by analyzing a set of realistic daily 100-year large-scale precipitation events over five major European river catchments with the help of operational ensemble prediction data from the ECMWF. The dynamical conditions during such extreme events are investigated and compared to those of more moderate extreme events (20- to 50-year). 100-year precipitation events are generally associated with an upper-level cut-off low over Central Europe in combination with a surface cyclone southeast of the specific river catchment. The 24 hours before the event are decisive for the exact location of this surface cyclone, depending on the location and velocity of the upper-level low over Western Europe. The differences between 100-year and more moderate extreme events vary from catchment to catchment. Dynamical mechanisms such as an intensified upper-level cut-off low and surface cyclone are the main drivers distinguishing 100-year events in the Oder and Danube catchments, whereas thermodynamic mechanisms such as a higher moisture supply in the lower troposphere east of the specific river catchment are more relevant in the Elbe and Rhine catchments. For the Weser/Ems catchment, differences appear in both dynamical and thermodynamic mechanisms.

How to cite: Pfahl, S. and Ruff, F.: What distinguishes 100-year precipitation extremes over Central European river catchments from more moderate extreme events?, EGU General Assembly 2023, Vienna, Austria, 23–28 Apr 2023, EGU23-2390, https://doi.org/10.5194/egusphere-egu23-2390, 2023.

EGU23-3277 | ECS | Posters on site | CL3.2.8

Future socio-ecosystem productivity threatened by compound drought-heatwave events 

Jiabo Yin, Pierre Gentine, Louise Slater, Lei Gu, Yadu Pokhrel, and Shenglian Guo

Compound drought-heatwave (CDHW) events are one of the worst climatic stressors for global sustainable development. However, the physical mechanisms behind CDHW and their impacts on socio-ecosystem productivity remain poorly understood. Here, by combining satellite observations, field measurements and reanalysis, we show that terrestrial water storage and temperature are negatively coupled, likely driven by similar atmospheric conditions (e.g., water vapor deficit and energy demand). Using simulations from a large climate-hydrology model ensemble of 111 members, we demonstrate that the frequency of extreme CDHWs is projected to increase by ten-fold globally under the highest emissions scenario, along with a disproportionate negative impact on vegetation and socioeconomic productivity by the late 21st century. Limits on water availability are likely to play a more important role in constraining the terrestrial carbon sink than temperature extremes, and over 90% of the global population and GDP could be exposed to increasing CDHW risks in the future, with more severe impacts in poorer or rural areas. Our results provide crucial insights towards assessing and mitigating adverse effects of compound hazards on ecosystems and human well-being.

How to cite: Yin, J., Gentine, P., Slater, L., Gu, L., Pokhrel, Y., and Guo, S.: Future socio-ecosystem productivity threatened by compound drought-heatwave events, EGU General Assembly 2023, Vienna, Austria, 23–28 Apr 2023, EGU23-3277, https://doi.org/10.5194/egusphere-egu23-3277, 2023.

EGU23-3832 | ECS | Posters on site | CL3.2.8

Understanding the origins of climate anomalies during low-yield years in Australia’s largest breadbasket 

Hao Li, Jessica Keune, Qiqi Gou, Chiara Holgate, and Diego Miralles

Wheat yield in Australia is highly dependent on year-to-year climate variability. Prolonged droughts and anomalously high temperatures have been considered as causes of agricultural failures in recent years. However, the origins of these climate extremes and their impacts on yield remain under study. Here, we use a Lagrangian trajectory model driven by atmospheric reanalysis data to delineate the source regions of moisture and heat over Australia’s largest rainfed agricultural region. In particular, we focus on extreme crop failure years (1994, 2002, 2006) and analyze the impact of upwind droughts on heat and moisture imports into the region. Our results indicate that low-yield years are often associated with stable high-pressure systems that lead to a decreased import of moisture from the surrounding oceans. Within the breadbasket, however, this caused higher-than-usual surface sensible heating. Moreover, the analyzed low-yield years coincide with widespread droughts over the Australian continent. We find that upwind droughts can further influence moisture and heat imports to the region. During the initial phase of the Millennium Drought in 2002, crop failure over the breadbasket exceeded 50% and only around 9% of the precipitation over the region originated from (upwind) land — this constitutes a decrease of 5.0% compared to the climatological average. Simultaneously, the heat import from remote land regions increased from an average of 22.8% to 24.7% in 2002. While our findings suggest that upwind droughts played only a minor role for Australia's largest breadbasket due to the influence of oceanic contributions in the region, other agricultural areas that show a larger dependency on moisture and heat imports from the land would be more susceptible to upwind climate anomalies. 

How to cite: Li, H., Keune, J., Gou, Q., Holgate, C., and Miralles, D.: Understanding the origins of climate anomalies during low-yield years in Australia’s largest breadbasket, EGU General Assembly 2023, Vienna, Austria, 23–28 Apr 2023, EGU23-3832, https://doi.org/10.5194/egusphere-egu23-3832, 2023.

The intensity and frequency of extreme storms have been increasing over time due to climate change, challenging sustainable stormwater management. This study examines the impacts of climate change on the precipitation patterns and extremes across the Cedar River Watershed in the Pacific Northwest under the Shared Socio-economic Scenario (SSP-585) obtained from CMIP6 models. Two global climate models (GCMs), namely MIROC6 and CMCC-ESM2, are considered in this study. Prior to generating future extreme storms for the selected GCMs and scenarios, the GCM simulated precipitation data was bias corrected relative to in-situ daily precipitation data. Precipitation data was bias corrected using three different statistical methods (please Named three method); among those Equidistant Quantile Mapping performed best. Bias corrected precipitation from the MIROC6 showed better performance compared to the CMCC-ESM2 in reproducing the observed precipitation statistics. Finally, the bias-corrected precipitation data from MIROC6 was used to develop non-stationary Intensity-Duration-Frequency curves (IDF) to identify the extreme storm events and their return periods. The results indicate that the storm intensities increase (ranging from 2.5% to 30%) over the future periods for all selected return periods, with relatively larger increase for higher return periods i.e., 50-year and 100-year storms. Further, we use the bias corrected precipitation projections and generate mean monthly perception maps of the Cedar River Watershed for the periods of 2020–2039 and 2040–2059.


How to cite: Salem, A. and Abduljaleel, Y.: Assessing the impact of climate change scenario for simulating nonstationary rainfall intensity and duration, EGU General Assembly 2023, Vienna, Austria, 23–28 Apr 2023, EGU23-4309, https://doi.org/10.5194/egusphere-egu23-4309, 2023.

EGU23-4544 | Orals | CL3.2.8 | Highlight

Climate change contributes to the record-shattering 2022 Pakistan rainfall 

Yujia You and Mingfang Ting

From mid-June until the end of August 2022, a sequence of torrential rains and deluges pummeled Pakistan, displacing more than 30 million residents with a death toll of near 2000. The accumulated amount exceeds the centennial average of 126 mm by about 7 standard deviations (50 mm), reaching a value of 487 mm and breaking its record over a century. The extraordinary extremity underscores the urgency for understanding the physical drivers of the event and the relations with human-induced climate change.

Here, we find that distinctive from the historical floods which tend to occur over the relatively wet northern mountains, the 2022 rainfall took place over arid southern Pakistan. Unlike the floods over northern mountains which had closer associations with extratropical westerly troughs, the heavy downpours in 2022 were primarily initiated by the synoptic low-pressure systems (LPS). The longevity and intensity of LPS were sustained and enhanced by the cross-equatorial monsoon flow, which has trended upward since the 1970s and is at a historical high. In combination with the zonal inflow of moisture induced by La Niña, a corridor of heavy rainfall extending from the Bay of Bengal toward southern Pakistan formed.

The signal of greenhouse-gas-forced changes in the heavy rainfall over Pakistan and the cross-equatorial monsoon flow is detectable in climate models, confirming that the likelihood of such extreme events would increase under future warming.

How to cite: You, Y. and Ting, M.: Climate change contributes to the record-shattering 2022 Pakistan rainfall, EGU General Assembly 2023, Vienna, Austria, 23–28 Apr 2023, EGU23-4544, https://doi.org/10.5194/egusphere-egu23-4544, 2023.

EGU23-4681 | Orals | CL3.2.8

Reduced moisture sources contributed to the 2017-2019 southeast Australian drought 

Andréa S. Taschetto, Milica Stojanovic, Chiara Holgate, Anita Drumond, Jason Evans, Luis Gimeno, and Raquel Nieto

The Murray Darling Basin, located in southeast Australia, is an agriculturally rich area, providing one-third of the country’ food supply. In 2017-2019 the region experienced one of its worst droughts since 1900. Rainfall in the Murray Darling Basin was consistently below average for three consecutive cool seasons, an unprecedented event on record. The drought set the extreme conditions that led later to the 2019-2020 Black Summer Bushfires. Previous studies suggest that the strong 2019 positive Indian Ocean Dipole intensified the conditions of the drought, however the state of the climate drivers cannot fully explain the onset and development of the Murray Darling Basin drought. In this study, we investigate processes other than remote climate drivers that may have triggered the drought. Using a Lagrangian model to backtrack moisture sources to southeast Australia, we show that local processes were crucial in explaining the onset and development of the drought. We identify the sources of moisture to the cool season precipitation over the Murray Darling Basin and show for the first time that the moisture supply from the Tasman Sea declined in 2017 and 2018. We further show that the expected moisture was instead transported northward by an anomalous anticyclonic circulation. Our results provide an explanation for the moisture and rainfall deficit that caused the 2017-19 drought. Understanding the processes that led to the 2017-2019 Murray Darling Basin drought is important for predicting and planning future multi-year droughts in Australia.

How to cite: Taschetto, A. S., Stojanovic, M., Holgate, C., Drumond, A., Evans, J., Gimeno, L., and Nieto, R.: Reduced moisture sources contributed to the 2017-2019 southeast Australian drought, EGU General Assembly 2023, Vienna, Austria, 23–28 Apr 2023, EGU23-4681, https://doi.org/10.5194/egusphere-egu23-4681, 2023.

Under the context of global warming, climate and weather extremes (e.g., droughts, high temperature extremes) take a heavy toll on natural and human systems. It has been reported that the concurrence of droughts and hot extremes (CDHEs) in summer 2022 in the Northern Hemisphere (NH) have led to reduced water resources/crop yield and increased health risks. While assessments of droughts and heatwaves in summer 2022 have been noted, the assessment of these extremes from a compound event perspective is still limited. In this study, we analyzed the rarity of CDHEs in summer 2022 across the NH, detected anthropogenic influence on CDHEs area, and projected the likelihood under different warming levels based on observations from ERA5 and simulations from the Sixth Phase of the Coupled Model Intercomparison Project (CMIP6). Our results illustrate that severe CDHEs in summer 2022 across the NH mainly occur in central North America, Europe, and south China. Event attribution analysis shows that CDHEs area in summer 2022 in the NH would not have occurred without anthropogenic global warming. The CDHEs area like 2022 is projected to occur more likely, particularly under SSP585 in a 4°C warming world. This study provides useful insights for advancing our understanding of compound extremes during summer 2022 across the NH.

How to cite: Meng, Y. and Hao, Z.: Attribution and projection of the summer 2022 compound dry and hot extreme in the Northern Hemisphere, EGU General Assembly 2023, Vienna, Austria, 23–28 Apr 2023, EGU23-4705, https://doi.org/10.5194/egusphere-egu23-4705, 2023.

EGU23-7134 | ECS | Posters on site | CL3.2.8

Developing storylines for unprecedented extreme events using ensemble boosting 

Luna Bloin-Wibe, Erich Fischer, and Reto Knutti

Recent extreme temperature and precipitation events such as the dry and heat events in summer 2022 in Europe and China, the New Year’s warm spell 2022/23 across Europe, the 2021 heavy rainfall extremes in northwestern Germany, Belgium and the Netherlands and the 2021 Pacific Northwest heatwave broke previous observed record levels by large margins. The probability of such unprecedented record-shattering extremes increases with the rapid rate of warming. Thus, there is a crucial need for analyzing the underlying processes leading to these events and quantifying potential intensities of events possible in the coming decades.

Here, we evaluate how ensemble boosting (Gessner et al. 2021 and Gessner et al. 2022) can help assess the tail of climate distributions and generate climate model-based storylines more resource-efficiently. In ensemble boosting the most extreme simulated events in an intermediate-size initial condition ensembles are re-initialized in targeted experiments in order to efficiently sample very extreme states of the model climatology. Here, we evaluate different ensemble design choices including lead time, ensemble size and potential iteration choices to most efficiently allocate computational resources to simulate events of very extreme intensity.

The resulting boosted events are analyzed through a storyline approach, thus helping to interpret the underlying mechanisms of each physically consistent unfolding extreme event and its consequences. The Pacific Northwest heatwave in June 2021 will be used as a starting point; but ensemble boosting and storylines can be powerful tools for understanding extremes beyond heat. We further discuss how ensemble boosting can also be applied to compound extremes and future climate scenarios.

How to cite: Bloin-Wibe, L., Fischer, E., and Knutti, R.: Developing storylines for unprecedented extreme events using ensemble boosting, EGU General Assembly 2023, Vienna, Austria, 23–28 Apr 2023, EGU23-7134, https://doi.org/10.5194/egusphere-egu23-7134, 2023.

EGU23-7329 | ECS | Posters on site | CL3.2.8

Increases in Extreme Precipitation over the Northeast United States using High-resolution Climate Model Simulations 

Bor-Ting Jong, Thomas Delworth, and Hiroyuki Murakami

The Northeast United States (NEUS) has faced the most rapidly increasing occurrences of extreme precipitation within the US in the past few decades. Understanding the physics leading to long-term trends in regional extreme precipitation is essential to adaptation and mitigation planning. Simulating regional extreme precipitation, however, remains challenging, partially limited by climate models’ horizontal resolution. Our recent work shows that a model with 25 km horizontal resolution facilitates a much more realistic simulation of extreme precipitation than comparable models with 50 or 100 km resolution, including frequency, amplitude, and temporal variability, based on ensembles generated by GFDL (Geophysical Fluid Dynamics Laboratory) SPEAR (Seamless System for Prediction and EArth System Research) models. The 25-km GFDL-SPEAR ensemble also simulates the trend of NEUS extreme precipitation quantitatively consistent with observed trend over recent decades, as the observed trend is within the ensemble spread. We therefore leverage multiple ensembles and various simulations (with historical radiative forcing and projected forcing following the SSP2-4.5 and SSP5-8.5 scenarios) to detect and project the trend of extreme precipitation. The 10-ensemble member GFDL-SPEAR 25-km simulations project unprecedented rainfall events over the NEUS, driven by increasing anthropogenic radiative forcing and distinguishable from natural variability, by the mid-21st century. Furthermore, very extreme events (99.9th percentile events) may be six times more likely by 2100 than in the early 21st century.


We further conduct a process-oriented study, assessing the physical factors that have contributed to the increasing extreme precipitation over the NEUS. We categorize September to November extreme precipitation days based on daily cumulative precipitation over the NEUS into weather types, including atmospheric river (AR), tropical cyclone (TC), and others. In observations, the most precipitation days were AR days or/and TC days. The number of extreme precipitation days related to pure AR events (without any TC-related event in the vicinity) had increased slightly from 1959 to 2020. The greater contribution to the increasing extreme precipitation was caused by TC-related events, especially the influences from extratropical transitions. The extreme precipitation days related to extratropical transitions were 2.5 times more frequent for the 1990 to 2020 period compared to the 1959 to 1989 period. We apply the same analysis to the GFDL-SPEAR 25-km simulations. Similar to observations, the increasing extreme precipitation days were mainly caused by TC-related events, with a smaller influence from pure AR events. However, the increasing number of TC-related days was dominated by hurricane and tropical storm events, while the number of extratropical transitions near the NEUS changed very little from 1959 to 2020. These results are different from the observational results. Ongoing work focuses on the discrepancy between observations and SPEAR simulations. For example, we are assessing whether the prominent increasing extratropical transitions since the 1990s in observations were the results of limited sample size or caused by decadal variability.

How to cite: Jong, B.-T., Delworth, T., and Murakami, H.: Increases in Extreme Precipitation over the Northeast United States using High-resolution Climate Model Simulations, EGU General Assembly 2023, Vienna, Austria, 23–28 Apr 2023, EGU23-7329, https://doi.org/10.5194/egusphere-egu23-7329, 2023.

EGU23-9277 | Posters on site | CL3.2.8

Estimating compounding heat waves and rainfall extremes under projected climate change over the island of Sicily, Italy 

Armelle Remedio, Jeewanthi Sirisena, and Laurens Bouwer

According to the IPCC AR6 report, the frequency and intensity of high temperatures and precipitation extremes, such as heat waves, and extreme rainfall events that can lead to flash floods have increased in recent decades and are projected to keep increasing. These extreme events, which can occur in separate or as compound events can lead to droughts and flooding, causing severe economic and health impacts including loss of lives. Especially when such events occur shortly or directly in sequence, they can cause more severe impacts than in isolation. Understanding their compound behavior and timing in current and future climates can help to better estimate associated risks and require protection and adaptation planning.

In this study, the frequency and intensity of the compound events of heat waves and extreme precipitation over Sicily, Italy were analyzed and characterized for the present (1980-2010) and near future (2030-2050) periods. We used high resolution gridded datasets from observations (E-OBS) and from the EURO-CORDEX ensemble of regional climate change simulations. Heat waves were defined using a daily maximum temperature threshold persistent for at least three consecutive days while the extreme precipitation events were defined using the 95th percentile threshold of daily data. Results showed that the highest frequency of heat waves occured near the coastal regions of Sicily, while the extreme rainfalls were located in the west of Sicily.  We identified the areas where heat waves and extreme rainfall events have occurred in the past and we demonstrate how they are expected to change in the future, separately and as compound events. The results of this study will be used to develop a workflow for estimating climate risks in the region, which is part of the “risk workflow for CAScading and COmpounding hazards in COastal urban areas” (CASCO) project, and can be combined with other workflows on geophysical risks (earthquakes and tsunamis) to characterize overall natural hazard risks for the island of Sicily.

How to cite: Remedio, A., Sirisena, J., and Bouwer, L.: Estimating compounding heat waves and rainfall extremes under projected climate change over the island of Sicily, Italy, EGU General Assembly 2023, Vienna, Austria, 23–28 Apr 2023, EGU23-9277, https://doi.org/10.5194/egusphere-egu23-9277, 2023.

EGU23-9290 | Orals | CL3.2.8 | Highlight

Quantifying windstorm risks by translating historical extreme events into the future 

Ed Hawkins, Philip Brohan, Samantha Burgess, Stephen Burt, Gilbert Compo, Suzanne Gray, Ivan Haigh, Hans Hersbach, Kiki Kuijjer, Oscar Martinez-Alvarado, Chesley McColl, Andrew Schurer, Laura Slivinski, and Joanne Williams

Extreme wind events are among the costliest natural disasters in Europe. Significant effort is dedicated to understanding the risk of such events, usually analysing observed storms in the modern era. However, it is likely that some historical windstorms were more extreme and/or followed different tracks from those in the modern era. Producing plausible reanalyses of such events would improve the quantification of current and future windstorm risks.

Billions of historical climatological observations remain unavailable to science as they exist only on paper, stored in numerous archives around the world. We demonstrate how the rescue of such paper observations has improved our understanding of an extreme windstorm that occurred in February 1903 and its significant impacts. By assimilating newly rescued atmospheric pressure observations into the 20th Century Reanalysis system, the storm is now credibly represented in an improved reanalysis of the event. In some locations this storm produced stronger winds than any event during the modern era. As a result, estimates of risk from severe storms, based on modern period data, may need to be revised. Simulations of the storm surge resulting from this storm show a large coastal surge of around 2.5m, comparing favourably with newly rescued tide gauge observations and increasing our confidence in the quality of the reconstruction.

In addition, we use novel reanalysis experiments to translate this windstorm into a warmer world to quantify how it might be different both in the present and in the future. We find that the same storm produces more intense rainfall and stronger winds in a warmer climate, providing a new approach to quantifying how extreme weather events will change as the world is warming.

How to cite: Hawkins, E., Brohan, P., Burgess, S., Burt, S., Compo, G., Gray, S., Haigh, I., Hersbach, H., Kuijjer, K., Martinez-Alvarado, O., McColl, C., Schurer, A., Slivinski, L., and Williams, J.: Quantifying windstorm risks by translating historical extreme events into the future, EGU General Assembly 2023, Vienna, Austria, 23–28 Apr 2023, EGU23-9290, https://doi.org/10.5194/egusphere-egu23-9290, 2023.

EGU23-10709 | Orals | CL3.2.8

The Unprecedented Pacific Northwest Heatwave of June 2021: Causes and Impacts 

Rachel White, Sam Anderson, James F. Booth, Ginni Braich, Christina Draeger, Cuiyi Fei, Christopher D. G. Harley, Sarah B. Henderson, Matthias Jakob, Carie-Ann Lau, Lualawi Mareshet Admasu, Veeshan Narinesingh, Christopher Rodell, Eliott Roocroft, Kate R. Weinberger, and Greg West

In late June 2021 a heatwave of unprecedented magnitude impacted the Pacific Northwest (PNW) region of Canada and the United States. Many locations broke all-time maximum temperature records by more than 5°C, and the Canadian national temperature record was broken by 4.6°C, with the highest recorded temperature 49.6°C. Local records were broken by large margins, even when compared to local records broken during the infamous heatwaves in Europe 2003, and Russian in 2010. A region of high pressure that became stationary over the region (an atmospheric block) was the dominant cause of this heatwave; however, trajectory analysis finds that upstream diabatic heating played a key role in the magnitude of the temperature anomalies. Weather forecasts provided advanced notice of the event, while sub-seasonal forecasts showed an increased likelihood of a heat extreme with 10-20 day lead times, with an increased likelihood of a blocking event seen in forecasts initialized 3 weeks prior to the heatwave peak. The impacts of this event were catastrophic. We provide a summary of some of these impacts, including estimates of hundreds of attributable deaths across the PNW, mass-mortalities of marine life, reduced crop and fruit yields, river flooding from rapid snow and glacier melt, and a substantial increase in wildfires—the latter contributing to devastating landslides in the months following. These impacts provide examples we can learn from, and a vivid depiction of how climate change can be so devastating.

How to cite: White, R., Anderson, S., Booth, J. F., Braich, G., Draeger, C., Fei, C., Harley, C. D. G., Henderson, S. B., Jakob, M., Lau, C.-A., Mareshet Admasu, L., Narinesingh, V., Rodell, C., Roocroft, E., Weinberger, K. R., and West, G.: The Unprecedented Pacific Northwest Heatwave of June 2021: Causes and Impacts, EGU General Assembly 2023, Vienna, Austria, 23–28 Apr 2023, EGU23-10709, https://doi.org/10.5194/egusphere-egu23-10709, 2023.

EGU23-11435 | Posters on site | CL3.2.8 | Highlight

How to prepare for record-shattering hot events 

Lisette Klok, Timo Kelder, Elske van Vessem, and Laurens Severijn Hondema

The heat dome that Portland experienced in 2021 with temperatures up to 46 °C was unprecedented and unexpectedly severe, leading to the death of dozens of people. What if such an exceptional event were to occur somewhere else?  

The Netherlands seems to be sensitive to such 'record-shattering' hot events, but luckily has not yet experienced them. Here, we show how to qualitatively connect the increasing scientific understanding of plausible record-shattering hot events with potential impacts and necessary responses for the city of Amsterdam. The expected impacts and potential responses of record-shattering hot events are identified through expert judgement with professionals from various disciplines. 

We asked what could possibly happen in Amsterdam if the temperature rises to 45 degrees, in particular what kind of problems and bottlenecks are expected and what possible solutions are. The results of this exercise provided additional insights to heat plans based on lived experiences. As such, this case study may prove a useful example for governments and private sectors wishing to prepare for future exceptional heat waves.

How to cite: Klok, L., Kelder, T., van Vessem, E., and Hondema, L. S.: How to prepare for record-shattering hot events, EGU General Assembly 2023, Vienna, Austria, 23–28 Apr 2023, EGU23-11435, https://doi.org/10.5194/egusphere-egu23-11435, 2023.

EGU23-13309 | Orals | CL3.2.8

Variability in North Sea wind energy and the potential for prolonged winter wind drought 

Gillian Kay, Nick Dunstone, Anna Maidens, Adam Scaife, Doug Smith, Hazel Thornton, Laura Dawkins, and Stephen Belcher

The UK is committed to substantially increasing offshore wind capacity in its drive to decarbonise electricity production and achieve net zero. If low wind episodes – or “wind drought” events – occur during high energy demand periods, energy security may be threatened without alternative supply. To ensure resilience of the power system now and in the coming years as offshore wind generation grows, better understanding of the severity, frequency and duration of low wind episodes would be useful. Variability in winds is likely to dominate over trends in the next few decades, and hence having improved information on present day characteristics of wind drought is valuable.

Here we focus our attention on the North Sea as a centre of current and planned offshore wind resource for the UK and a number of other European countries, and on the winter season, given the occurrence of weather patterns that risk security of supply. We use a large ensemble of initialised climate model simulations to provide a synthetic but realistic event set that greatly increases the sample size of extreme events compared with that available from reanalysis data, and gives more robust information about their likelihood and properties. Using the basic unit of a week of low winds as the timescale of analysis, we report on the frequency and duration of wind drought events. In addition, we examine the wider conditions associated with wind drought events to investigate what remote factors may contribute to prolonged wind drought.

How to cite: Kay, G., Dunstone, N., Maidens, A., Scaife, A., Smith, D., Thornton, H., Dawkins, L., and Belcher, S.: Variability in North Sea wind energy and the potential for prolonged winter wind drought, EGU General Assembly 2023, Vienna, Austria, 23–28 Apr 2023, EGU23-13309, https://doi.org/10.5194/egusphere-egu23-13309, 2023.

EGU23-14539 | ECS | Orals | CL3.2.8

Increasing probability of extreme records in heavy precipitation 

Iris de Vries, Sebastian Sippel, Erich Fischer, Joel Zeder, Vincent Humphrey, and Reto Knutti

It comes as no surprise that the future holds record-breaking weather and climate events. As global warming continues, temperature records will continue to be broken. Also heavy precipitation records are likely to be broken due to the increased water holding capacity of the atmosphere, in combination with changing atmospheric stability and circulation patterns. Improved estimates on the range of possible record-breaking precipitation events – now and in the future – are a first step to inform adequate adaptation policies for heavy precipitation. Of particular interest are events that break records by large margins – record-shattering events –, since these are likely to incur most damage and losses. 

In order to improve estimates of record shattering precipitation events in the present and future climate we use initial condition large ensemble simulation data (CESM2, SSP370) and statistical models. We evaluate record-shattering events in Rx1d (day with most precipitation per chosen time period (year or season)). In a stationary climate, the probability of Rx1d record-breaking is known to decrease with the number of data points since the start of measurements (inversely proportional). We find, however, that in our nonstationary climate, the decay in Rx1d record breaking and shattering probability is slowed down and even reversed in most world regions. Regional changes in record shattering probability are attributable to a changing underlying probability distribution of Rx1d, which also is region specific. We elucidate the contributions of changes in mean (distribution shift), and in variability (distribution widening/narrowing) to increasing record shattering probability by using a statistical model to create counterfactual realities representative of the regions of interest.

We focus on regions of a size relevant for national and cross-border policy that show differently driven changes in record shattering precipitation probabilities. For example, the annual probability of a record shattering precipitation event somewhere in the Benelux-Germany region which was hit by severe floods in summer 2021 increases from ~2% now to ~4.5% at the end of the century in CESM2. This increase results from a non-linear interaction between mean and variability increases, and is primarily driven by increasing variability. At lower latitudes, for example in Central America, the effect of variability is even stronger, where we find increasing record shattering probability despite a negative long-term trend in Rx1d levels.

Very unlikely events are, paradoxically, arguably the most important to know about, since their unimaginability often means that critical infrastructure is not sized to withstand these events. Our results may thus prove invaluable for regional policy. 

How to cite: de Vries, I., Sippel, S., Fischer, E., Zeder, J., Humphrey, V., and Knutti, R.: Increasing probability of extreme records in heavy precipitation, EGU General Assembly 2023, Vienna, Austria, 23–28 Apr 2023, EGU23-14539, https://doi.org/10.5194/egusphere-egu23-14539, 2023.

EGU23-14556 | ECS | Posters on site | CL3.2.8

A new Max Planck Institute-Grand Ensemble with CMIP6 forcing and high-frequency model output 

Dirk Olonscheck, Sebastian Brune, Laura Suarez-Gutierrez, Goratz Beobide-Arsuaga, Johanna Baehr, Friederike Fröb, Lara Hellmich, Tatiana Ilyina, Christopher Kadow, Daniel Krieger, Hongmei Li, Jochem Marotzke, Étienne Plésiat, Martin Schupfner, Fabian Wachsmann, Karl-Hermann Wieners, and Sebastian Milinski

We present the CMIP6 version of the Max Planck Institute-Grand Ensemble (MPI-GE CMIP6) with 30 realisations for the historical period and five emission scenarios. The power of MPI-GE CMIP6 goes beyond its predecessor ensemble MPI-GE by providing high-frequency model output, the full range of emission scenarios including the highly policy relevant scenarios SSP1-1.9 and SSP1-2.6, and the opportunity to compare the ensemble to high resolution simulations of the same model version. We demonstrate with six novel application examples how to use the power of MPI-GE CMIP6 to better quantify and understand present and future extreme events in the Earth system, to inform about uncertainty in approaching Paris Agreement global warming limits, and to combine large ensembles and artificial intelligence. For instance, MPI-GE CMIP6 allows us to show that the recently observed Siberian and Pacific North American heat waves are projected to occur every year in 2071-2100 in high-emission scenarios, that the storm activity in most tropical to mid-latitude oceans is projected to decrease, and that the ensemble is sufficiently large to be used for infilling surface temperature observations with artificial intelligence.

How to cite: Olonscheck, D., Brune, S., Suarez-Gutierrez, L., Beobide-Arsuaga, G., Baehr, J., Fröb, F., Hellmich, L., Ilyina, T., Kadow, C., Krieger, D., Li, H., Marotzke, J., Plésiat, É., Schupfner, M., Wachsmann, F., Wieners, K.-H., and Milinski, S.: A new Max Planck Institute-Grand Ensemble with CMIP6 forcing and high-frequency model output, EGU General Assembly 2023, Vienna, Austria, 23–28 Apr 2023, EGU23-14556, https://doi.org/10.5194/egusphere-egu23-14556, 2023.

Managing extreme weather events of unprecedented magnitude is one of the main challenges facing climate risk management and climate adaptation. Because of the unprecedented nature of these events, some authors have questioned the use of probabilistic approaches in this context. As an alternative, they introduced the so-called climate storylines approach. Climate storylines do not aim at predicting system states; rather, their focus is on revealing plausible chains of events whose impact might undermine the performance of the system.

Conceptually, climate storylines relate to - but are separate from – downward counterfactual histories. Downward counterfactual histories are plausible alternative realizations of historical events that could have turned to the worse. By constructing downward counterfactual histories in a disaster risk reduction context, some authors showed that many disasters that took societies by surprise could have in fact been anticipated.

This talk will introduce a decision-support framework to build climate storylines based on downward counterfactual histories. The framework is event-oriented, it focuses on impact and it is designed to be applied in a participatory fashion. By following the framework, the user first constructs climate storylines based on an iterative analysis of what (combinations of) counterfactuals are deemed critical (i.e., downward). Then, the user analyzes the future impact of the constructed storylines under climatic and socio-economic scenarios. Finally, the user explores the effects on the estimated impacts of the value-laden choices involved in the construction of the storylines.

The framework is applied to study the impact of tropical cyclones hitting the European Union’s outermost regions on the stability of the European Union Solidarity Fund (EUSF), a public fund that provides financial relief to Member States affected by large disasters. Contrary to what historic evidence would suggest, it is found that extreme - yet plausible - tropical cyclones might deplete the EUSF capital if they happen concurrently with large events in mainland Europe, and that a substantial recapitalization of the fund might be required to cope with future climatic and socio-economic changes.

How to cite: Ciullo, A.: A decision-support framework to construct climate impact storylines using downward counterfactuals, EGU General Assembly 2023, Vienna, Austria, 23–28 Apr 2023, EGU23-15450, https://doi.org/10.5194/egusphere-egu23-15450, 2023.

EGU23-16457 | Posters on site | CL3.2.8

Emulator-enhanced extreme event attribution for data scarce developing countries 

Fahad Saeed, Shruti Nath, Pierre Candela, Quentin Lejeune, Lukas Gudmundsson, Mathias Hauser, Dominik Schumacher, Sonia Seneviratne, and Carl Schleussner

Attribution of extreme events in developing countries poses a significant challenge. A primary hindrance is the lack of historical observations, which not only limits the appraisal of the extent of an extreme event, but also restricts benchmarking of climate models for the region. A secondary hindrance is that tropical climates, characteristic of developing countries, contain large uncertainties due to natural climate variability, which many climate models struggle to represent. As it is those countries and world regions where some of the most severe consequences of climate impacts emerge, addressing these challenges to robust climate attribution is critical to improve prospects of climate litigation in developing countries. In this study, we present a novel method for attribution using the Earth System Model (ESM) emulator for spatially resolved monthly temperatures, MESMER-M (Nath et al. 2022). We use a bootstrap method in calibrating MESMER-M, so as to also characterize its intrinsic parametric uncertainty. Attribution using MESMER-M is then demonstrated on the prolonged heat conditions of March/April 2022 over the Indo-Pakistani region. The outcomes of this study are twofold. Firstly, by calibrating MESMER-M on the BEST observational dataset, we are able to inflate observational records with observationally consistent natural climate variability estimates, enabling exploration of “possible pasts” and insofar characterization of the event and its likelihood under rising Global Mean Temperatures (GMTs). Secondly, by exploring the parametric uncertainty space of MESMER-M calibrated on both BEST and ESM data, we systematically disentangle the uncertainty surrounding the mean response of monthly temperatures to GMT from that surrounding the natural climate variability. Such allows robust appraisal of the uncertainty surrounding natural climate variability as present within ESMs/Observations for the region, so as to not over/understate the event’s likelihood under rising GMTs.


Nath, S., Lejeune, Q., Beusch, L., Seneviratne, S. I., & Schleussner, C. F. (2022) MESMER-M: an Earth system model emulator for spatially resolved monthly temperature. Earth System Dynamics, 13 (2), 851–877. doi: 10.5194/esd-13-851-2022

How to cite: Saeed, F., Nath, S., Candela, P., Lejeune, Q., Gudmundsson, L., Hauser, M., Schumacher, D., Seneviratne, S., and Schleussner, C.: Emulator-enhanced extreme event attribution for data scarce developing countries, EGU General Assembly 2023, Vienna, Austria, 23–28 Apr 2023, EGU23-16457, https://doi.org/10.5194/egusphere-egu23-16457, 2023.

EGU23-17463 | ECS | Posters on site | CL3.2.8

Future Extreme Weather: a Data and AI driven approach to Understand Future Coastal Flooding 

Tudor Suciu, Emily Shuckburgh, and Nicholas Lane

Coastal flooding can be regarded as the most damaging extreme weather event. Careful
planning of mitigation and adaptation strategies requires a deep understanding of the event’s
likelihood and intensity.
This project provides a framework for assessing those changing statistics of coastal floods in
the future. We use historical records of coastal floods on the coasts of the UK historical
weather variables data (sea surface temperature, sea-level pressure, zonal and meridional
wind speeds and daily precipitations) from remote sensing sources, reanalysis data and
global climate models and future predictions of those weather variables from global climate
models. The method consists of using machine learning models to classify days as being
either ‘flooded’ (i.e. containing a coastal flood event) or ‘non-flooded’, at tide gauge
locations in the past 2 decades; both ‘out-of-the-box’ and more complex machine learning
models are trained on historical data. The models are then further used to assess the future
statistics of coastal flooding, by classifying days with or without flooding in the future
decades, from global climate models data. Currently, the method is showing promising
results on predicting the future number of ‘flooding days’, while the models used and trained
still show gradual improvement.
Using the same intensity scale as in the dataset of historical records of floods, it can be
assessed whether those events are becoming stronger or not. As well, the frequency, or the
return period, for the upcoming decades can be inferred from this project. This framework
produces an actionable set of information, that can be used by policy-makers, businesses,
governments and people, to plan accordingly for future floods.

How to cite: Suciu, T., Shuckburgh, E., and Lane, N.: Future Extreme Weather: a Data and AI driven approach to Understand Future Coastal Flooding, EGU General Assembly 2023, Vienna, Austria, 23–28 Apr 2023, EGU23-17463, https://doi.org/10.5194/egusphere-egu23-17463, 2023.

EGU23-181 | ECS | Posters on site | CL3.1.6

Monitoring of agricultural drought using Crop Moisture Stress index and the estimation of resulting maize yield reduction 

Bransilav Živaljević, Gordan Mimić, Dragana Blagojević, Oskar Marko, and Sanja Brdar

The drought in south-eastern Europe in the summer of 2017 heavily affected agricultural production, subsequently decreasing yields of maize. The European Drought Observatory provides Combined Drought Indicator for a 10-day period with coarse spatial resolution of 5 km, which is not localized on field level. It is derived from the combination of Standardized Precipitation Index (SPI), the Soil Moisture Index Anomaly (SMA), and the anomaly of the fraction of absorbed photosynthetically active radiation (FAPAR). Monitoring moisture levels in crops can provide timely information about the presence of abiotic stress in plants and improper development within a growing season. Heat stress and low levels of moisture in maize during summer can thereafter have detrimental consequences on yield. For that reason, in this study, the crop moisture level was estimated at specific parcels by calculating the normalized difference moisture index (NDMI) from Sentinel-2 multispectral imagery during summer months (June–July–August) and the time-series of NDMI were analyzed. Based on the average NDMI value in July, the crop moisture stress (CMS) index was calculated and divided into six classes. Maize yield data on parcel level were provided by an agricultural company for the period 2017 – 2021 in the Backa region of Vojvodina province, Serbia. Yield data for the period 2017-2020 were used to calculate average yield for each class of CMS, whereas yield data from 2021 were used for validation. Mean absolute error (MAE) and root-mean-square error (RMSE) were calculated and were around 1 t/ha. The results showed that the CMS values at a specific parcel could be used for within-season estimation of maize yield and the assessment of drought effects. Also, the CMS index was tested for the 2022 growing season which had drought hazard conditions in south-eastern Europe according to the European Drought Observatory. Expected maize yield reduction estimated for specific scouted fields showed substantial and below average yield values.

How to cite: Živaljević, B., Mimić, G., Blagojević, D., Marko, O., and Brdar, S.: Monitoring of agricultural drought using Crop Moisture Stress index and the estimation of resulting maize yield reduction, EGU General Assembly 2023, Vienna, Austria, 23–28 Apr 2023, EGU23-181, https://doi.org/10.5194/egusphere-egu23-181, 2023.

EGU23-450 | Posters on site | CL3.1.6

Spatial patterns of droughts in the Northeastern Carpathians 

Dariia Kholiavchuk

Hydroclimatic extremes like droughts are among the main indicators of climate change in the mountains. They are often associated with elevation-dependent warming. However, terrain features and regional circulation patterns shape local spatial patterns of droughts in the midlatitude mountains. The northeastern area in the Carpathians is suggested to have a less prominent elevation-dependent warming signal in the recent investigations of climate change. Thus, the research aims at identifying the drought distribution response to the features mentioned in the Northeastern Carpathians based on Standardized Precipitation-Evapotranspiration Index (SPEI) and Standardized Precipitation Index (SPI). For the calculation of SPEI and SPI, a newly available homogenized dataset of long gridded time series of essential climate variables for Ukraine, covering the period of 1946–2020 at 0.1°×0.1° spatial resolution is tested. The comparison of both indicators at 3-, 6- at 12-month time scales within the defined period is provided. The interplay effect of the North Atlantic, Mediterranean, and Polar atmospheric circulations is found in different spatial drought patterns throughout the year on southeastern and northwestern macroslopes. Preliminary results confirm that the low-mountain areas with broad-leaf and mixed forests are most exposed to drought intensification especially in the closed inner valleys and on the border of the Western and Eastern Carpathians. The continentality is revealed in the insignificant drying of the low-mountain areas of the Northeastern Carpathians towards the east over time. 

How to cite: Kholiavchuk, D.: Spatial patterns of droughts in the Northeastern Carpathians, EGU General Assembly 2023, Vienna, Austria, 23–28 Apr 2023, EGU23-450, https://doi.org/10.5194/egusphere-egu23-450, 2023.

EGU23-762 | ECS | Posters on site | CL3.1.6

The surface runoff response to land use changes in border watersheds of the Central Serbia 

Ana Petrović and Stanimir Kostadinov

The anthropogenic impact on natural processes changing their intensity and even trends is evident and confirmed in many researches. The continuous population urban-to-rural and rural-to-urban movements bring a series of the other changes in the environment. This research estimates the impact of the changes of land use and land cover in a time interval of the last almost three decades (1990–2018) on the extreme runoff in more than 40 watersheds with a torrential water regime. Extreme rainfall episodes and watershed characteristics (steep slopes combined with the geology and soil cover of lower water infiltration as well as sparse vegetation cover and artificial and agricultural land use) are the triggers of occurrence of the torrential floods as the most frequent natural hazards in the Central Serbia. The focus is on the border regions of the Central Serbia, so the observed watersheds belong to the Drina river basin in the Western Serbia, the Timok and the Danube river basin in the Eastern Serbia and the Južna Morava river basin and the Egej basin in the Southern Serbia. The observed watersheds are selected according to the physical-geographical characteristics as well as their mentioning in the Inventory of the torrential floods in Serbia.

The main hydrological indicator whose changes are examined is the curve number that is used for the assessment of the hydrological response of the ungauged watershed in an event of extreme rainfall episode. The usage of curve number together with the watershed morphometric parameters (including rainfall data) enables the assessment of the maximal discharges in the flood event. The curve number is a core parameter of the Soil Conservation Service (SCS, today Natural Resources Conservation Service – NRCS) method whose value is in the defined range (0<CN<100) depending on land use. The lower CN, the lower runoff and the higher CN, the higher runoff.

The results revealed consequences of population movements, especially emigration in the last decades from the border regions in terms of changing the land use patterns, and consequently changing the curve number of watershed – its decline, CNIID or growth, CNIIG. The dominant decline of the curve numbers is recorded in more than 20 watersheds of the border Eastern and Southern Serbia known for its continuous depopulation processes in last several decades. This led to the abandonment of arable lands that turned to the transitional woodland-shrub and forest areas in the course of time which finally results in lowering of the peak discharges in the torrential flood events. The minor changes of the curve numbers of more than 10 watersheds are dominant in the Drina river basin. For the selected watersheds the changes (decrease/increase) of the maximal discharges of 100- and 200-year return period are calculated according to the land use in 1990 and 2018 and rainfall data up to 1990 and 2018. In the torrential flood mitigation, findings related to these spontaneous positive anthropogenic influence on declining the surface runoff should be followed by the implementation of a set of preventive measures in erosion and torrent control.

How to cite: Petrović, A. and Kostadinov, S.: The surface runoff response to land use changes in border watersheds of the Central Serbia, EGU General Assembly 2023, Vienna, Austria, 23–28 Apr 2023, EGU23-762, https://doi.org/10.5194/egusphere-egu23-762, 2023.

EGU23-4482 | Posters on site | CL3.1.6

Application of the Self-calibrated Palmer Drought Severity Index for Estimation of Drought Impact on Maize Grain Yield in Pannonian Part of Croatia 

Krešo Pandžić, Tanja Likso, Ivan Pejić, and Hrvoje Šarčević

Ten-day self-calibrating Palmer Drought Severity Index (scPDSI) has been computed, based on observed 10-day mean air temperature, relative humidity and precipitation totals, as a parameter of drought impact on grain yield of 32 marketleading maize hybrids in 2017 and 2018 over 8 experimental locations in Pannonian part of Croatia. In addition, time series of the same climate variables for the closest “official” weather stations of Croatian Meteorological and Hydrological Service (DHMZ) for the period 1981-2018 have been used for scPDSI calibration and calculation. According to 10-day scPDSI, 2018 showed to be a „regular year“ while 2017 had a „moderate drought“ causing a maize grain yield reduction of 13%, compared to 2018. In spite some differences in climate aridity of central and eastern Croatia, a significant correlation between summer months’10-day scPDSI and maize grain yield has been determined. The highest average correlation coefficients across all maize hybrids for three summer months were determined for the last decade (10-day period) of July and consecutive three decades in August. The dependence of grain yield on scPDSI value is not the same for all hybrids indicating various tolerances of different hybrids to drought stress. The grain yield reduction was primarily affected by insufficient grain filling (smaller 1000-kernel weight) and to some extent by reduction of number of grains. For practical use, within the set of given 32 tested hybrids, the level of determined drought tolerance of a hybrid has to be considered along with its relative grain yield performance.

How to cite: Pandžić, K., Likso, T., Pejić, I., and Šarčević, H.: Application of the Self-calibrated Palmer Drought Severity Index for Estimation of Drought Impact on Maize Grain Yield in Pannonian Part of Croatia, EGU General Assembly 2023, Vienna, Austria, 23–28 Apr 2023, EGU23-4482, https://doi.org/10.5194/egusphere-egu23-4482, 2023.

EGU23-5430 | ECS | Posters on site | CL3.1.6

The effects of the temperature increase on the rainfall regimes in north-central Italy 

Marco Luppichini, Monica Bini, Roberto Giannecchini, and Giovanni Zanchetta

In the last few years, several works have studied rainfall regime changes with the increase of temperature as a result of global warming. These changes, documented mainly in northern Europe, still need to be clarified in the Mediterranean area. Many studies have identified sometimes contradictory trends according to the type of data used, the methodology, and the daily or subdaily types of events. Therefore, an in-depth investigation of the Mediterranean area is required for the definition of more certain future scenarios.

In this study, we examined a database with more than 1,000 raingauges and thermometers in northern and central Italy to analyze the rapid extreme precipitation events (EPEs) in relation to temperature. This large database covers a low rainfall accumulation period (RAP) that allowed us to study the relationship between temperature and rainfall and to distinguish rapid from long events related to rainfall intensity. 

The results show different relationships between rainfall and temperature regarding seasons, RAPs, rainfall intensity, and geographical factors. The high spatial density of the database made it possible to identify spatial clusters with homogenous characteristics influenced mainly by geographical factors. With an increase in temperature, the wet season is characterized by a general increase in rainfall with a higher surge for intense and fast events. Instead, the dry season shows a general rainfall decrease for less intense and longer events, but an increase in rapid and more intensive rainfall events. This outcome has further implications involving a future decrease in water availability and an increase of the EPEs, causing an extremization of the climate during the dry season for northern and central Italy.

How to cite: Luppichini, M., Bini, M., Giannecchini, R., and Zanchetta, G.: The effects of the temperature increase on the rainfall regimes in north-central Italy, EGU General Assembly 2023, Vienna, Austria, 23–28 Apr 2023, EGU23-5430, https://doi.org/10.5194/egusphere-egu23-5430, 2023.

EGU23-6031 | Posters on site | CL3.1.6

Is the flood occurrence rate decreasing in Southeast Europe? 

Igor Leščešen, Biljana Basarin, Manfred Mudelsee, and Robert L. Wilby

Floods are natural phenomena, which can turn into disasters and cause widespread damage, health problems and deaths. This is particularly the case where rivers have been denied from their natural floodplains and are limited by embankments, and where housing and industrial buildings have been constructed in areas that are naturally liable to flooding. However, during the last few decades, flood observations from different parts of Europe do not show a clear increase in flood occurrence rate (Blöschl et al., 2019). In the present paper we present longer-term records of winter and summer floods in one of the largest river of Southeast Europe, the Sava River for the 1926-2021 period. We analysed three group of events that were based on three flood protection levels in Republic of Serbia defined for Sremska Mitrovica station. Regular protection level is set at 4120 m3/s and emergency flood defense level which is set at 5120 m3/s, that is, minor events are up to the regular protection level, strong events are up to the emergency level and extreme events are above emergency flood defense level. For the past 95 years, we find a decrease in both summer and winter flood occurrence rates. The reduction in winter flood occurrence can partly be attributed to reduced amount of precipitation during this period of the year. Further, on the basis of these data and methods, we find that for the Sava River can be stated the following: (1) downward but not significant trends in winter flood risk during the observed period, (2) Downward trends of summer floods was also observed, with only strong events being statistically significant. This decrease can be partially due to a projected decrease in cyclone frequency in the Mediterranean region. Presented results clearly demonstrate decreasing flood occurrence rate of the Sava River, as a consequence of decreasing precipitation and increasing evaporation (due to increasing temperature). 

References

Blöschl, G., Hall, J., Parajka, J., Perdigão, A. P. R., Merz, B., Arheimer, B., Aronica, T. G., Bilibashi, A., Bonacci, O., Borga, M., Čanjevac, I., Castellarin, A., Chirico, B. G., Claps, P., Fiala, K., Frolova, N., Gorbachova, L., Gül, A., Hannaford, J., Harrigan, S., Kireeva, M., Kiss, A., Kjeldsen, R. T., Kohnová, S., Koskela, J. J., Ledvinka, O., Macdonald, N., Mavrova-Guirguinova, M., Mediero, L., Merz, R., Molnar, P., Montanari, A., Murphy, C., Osuch, M., Ovcharuk, V., Radevski, I., Rogger, M., Salinas, L. J., Sauquet, E., Šraj, M., Szolgay, J., Viglione, A., Volpi, E., Wilson, D., Zaimi, K. & Živković, N. (2019). Changing climate both increases and decreases European river floods. Nature 573 (7772), 108–111. https://doi.org/10.1038/s41586-019-1495-6.

Acknowledgements

This research was supported by ExtremeClimTwin project, which has received funding from the European Union’s Horizon 2020 research and innovation programme under grant agreement No 952384.

How to cite: Leščešen, I., Basarin, B., Mudelsee, M., and Wilby, R. L.: Is the flood occurrence rate decreasing in Southeast Europe?, EGU General Assembly 2023, Vienna, Austria, 23–28 Apr 2023, EGU23-6031, https://doi.org/10.5194/egusphere-egu23-6031, 2023.

EGU23-6044 | Posters virtual | CL3.1.6

On external and internal drivers of extreme discharges in the Danube Lower Basin 

Constantin Mares, Ileana Mares, Venera Dobrica, and Crisan Demetrescu

The extreme discharges in the Danube Lower Basin, highlighted by the Generalized Extreme Value theory, were analyzed by their internal and external drivers. For the former, some large and regional scales climate indices, such as the North Atlantic Oscillation (NAO), the Greenland-Balkan Oscillation (GBO), and the Palmer type drought indices, respectively, were used. For the latter the sunspot number (SSN) time series was considered.

Wavelet coherence for multiple variables, different types of filters and regression models were applied.

The results obtained in this study depend on the season, and can be beneficial for different decision-makers for a good management of water resources in case of extreme events.

How to cite: Mares, C., Mares, I., Dobrica, V., and Demetrescu, C.: On external and internal drivers of extreme discharges in the Danube Lower Basin, EGU General Assembly 2023, Vienna, Austria, 23–28 Apr 2023, EGU23-6044, https://doi.org/10.5194/egusphere-egu23-6044, 2023.

EGU23-6942 | ECS | Posters on site | CL3.1.6

Trends and characteristics of warm and dry extreme compound event in Southeastern Europe 

Maja Orihan and Branislav Živaljević

Extreme compound events defined as the simultaneous occurrence of multiple natural hazards such as floods, droughts, and heatwaves, have become increasingly frequent in South East Europe in recent years. These events can have significant impacts on the region's social, economic, and environmental systems and can lead to significant human losses. Because South East is identified as a climate hot spot for future climate change and occurrence of extreme compound events, it is very important to identify and study these hot spots. This information could be useful for decision-makers and practitioners in the water management and agriculture sector, especially in the Balkan region. Here we present the first results of the study of the compound warm and dry over the Western Balkan area since compound events have not been studied over the territory of Eastern Europe since 1950 until today. Using daily data on maximum temperature and precipitation, we calculated the frequency and trends of the warm/dry (WD) indices. Trends were calculated using the Mann-Kendall trend test in R and the resolution that was used is ERA5 1950-now. Presented results are annual and also seasonal variations. The index that we used shows cold and dry events per year or season, the results indicate the rising trend over the whole territory of South East Europe, where trends were statistically significant by over 95 percent. We investigated years with recorded heat waves and the most severe droughts in the observed region in the years: 2007, 2012, 2015, and 2017. In 2007 there were more than 140 warm and dry events in the Western Balkans area, in 2012 there were between 160 and 200 warm and dry events, in 2015 more than 140 and in 2017 around 140 warm and dry events. 

Studying extreme compound events is very important because it helps us to better understand the underlying causes of extreme weather and other natural disasters, especially in this area of high agricultural potential. This knowledge can help farmers to make informed decisions about how to identify potential risks and develop strategies to mitigate them to maximize their yields and minimize losses.

Our results highlight the need for targeted and effective risk management strategies to reduce the negative impacts of extreme compound events in South East Europe.


KEY WORDS

Compound events, temperature, precipitation, Eastern Europe, trends


Funding: This research was supported by the EXtremeClimTwin project, which has received funding from the European Union’s Horizon 2020 research and innovation program under grant agreement No952384.

How to cite: Orihan, M. and Živaljević, B.: Trends and characteristics of warm and dry extreme compound event in Southeastern Europe, EGU General Assembly 2023, Vienna, Austria, 23–28 Apr 2023, EGU23-6942, https://doi.org/10.5194/egusphere-egu23-6942, 2023.

EGU23-11863 | Posters on site | CL3.1.6

Attribution of extreme rainfall associated with the Balkans floods of May 2014 

Zorica Podraščanin, Biljana Basarin, Carley Iles, and Anne Sophie Daloz

In May 2014, the Balkan Region experienced exceptionally heavy rainfall. Between May 14 and May 19, 2014, there was a devastating flood in Serbia, Croatia, and Bosnia & Herzegovina. The event shattered a number of historical records and seriously endangered economies across the region. The close proximity of human settlements, infrastructure (houses, buildings, bridges), and agricultural land to flood plains further amplified the destructive effects. Although atmospheric thermodynamic and dynamic processes were used to describe this exceptional rainfall event, there was no mention of how climate change may have contributed to it. We show that the probability of this brief and powerful event occurring without human-caused climate change were incredibly low. Our research aims to demonstrate how climate change may have affected the likelihood that this extreme rainfall event will occur as well as to outline the difficulties in doing so. This was accomplished using the methods recommended by the World Weather Attribution (WWA) group. We examine whether and how much human-caused climate change has affected the likelihood and intensity of the rainfall over the Balkans as well as the peak 5-day precipitation in order to achieve this. We consider both historical weather data and climate models with and without anthropogenic forcing. The findings suggested that one of the key elements in determining event likelihood calculations is domain selection. Given the current situation and the possibility for further excessive rainfall over the Balkans, it is critical to enhance water management and lessen vulnerability to extreme rainfall.


Acknowledgement:
This research was supported by ExtremeClimTwin project, which has received funding from the
European Union’s Horizon 2020 research and innovation programme under grant agreement No 952384.

How to cite: Podraščanin, Z., Basarin, B., Iles, C., and Daloz, A. S.: Attribution of extreme rainfall associated with the Balkans floods of May 2014, EGU General Assembly 2023, Vienna, Austria, 23–28 Apr 2023, EGU23-11863, https://doi.org/10.5194/egusphere-egu23-11863, 2023.

EGU23-14880 | Posters on site | CL3.1.6

Effects of changing atmospheric circulation patterns on waterlogging potential in Southeast Europe 

Minučer Mesaroš, Dragoslav Pavić, and Igor Leščešen

Waterlogging or inland flooding occurs when excess water accumulates in the soil, leading to saturated conditions and reduced oxygen levels. Waterlogging affects lowlands, flat terrain and alluvial plains with limited runoff and increased water accumulation, which is typical for large parts of the Pannonian and Peripannonian regions of Hungary, Serbia and Croatia. These inundations cause substantial problems, primarily in agriculture trough crop loss, soil degradation and pollution, as well as damage to infrastructure and various socio-economic challenges.

Precipitation is the primary climatic factor that affects waterlogging, in combination with air temperature, humidity, evaporation, and other local hydrogeological, pedological, geomorphological and anthropogenic factors.

Changes in atmospheric circulation patterns influence the amount, intensity, and seasonality of precipitation which determine the extent and duration and subsequent negative impact of inland flooding.

Based on climate reanalysis data (ERA5) and regional climate models we examined precipitation trends in the period from 1950 to 2022 and from 2023 to 2070. Having the most significant effect on waterlogging the amount and intensity of precipitation in winter and spring season were assessed in detail. While the models indicate generally less rainfall in the future, the seasonal distribution and the increase in frequency of extreme precipitation events will favor the periodic occurrence of waterlogging in the region in the comming decades. The results of this study can be implemented in planning agricultural and water management activities.

Acknowledgements:

This research was supported by ExtremeClimTwin project, which has received funding from the European Union’s Horizon 2020 research and innovation programme under grant agreement No 952384.

How to cite: Mesaroš, M., Pavić, D., and Leščešen, I.: Effects of changing atmospheric circulation patterns on waterlogging potential in Southeast Europe, EGU General Assembly 2023, Vienna, Austria, 23–28 Apr 2023, EGU23-14880, https://doi.org/10.5194/egusphere-egu23-14880, 2023.

EGU23-15519 | Posters on site | CL3.1.6

Maize and wheat yield forecasting in the Pannonian Basin using extreme gradient boosting and its performance in years of severe drought 

Emanuel Bueechi, Milan Fischer, Laura Crocetti, Miroslav Trnka, Luca Zappa, Ales Grlj, and Wouter Dorigo

The increasing frequency and intensity of severe droughts over recent decades have significantly impacted crop production in the Pannonian Basin in southeastern Europe. Related crop yield losses can be substantial and require logistic compensation on an international level. To plan such compensations, seasonal crop yield forecasts have proven to be a valuable tool to support decision-makers in taking timely action. However, the impact of severe droughts on crop yields is often underestimated by such forecasts. To address this issue, we developed a maize and wheat yield forecasting system based on extreme-gradient-boosting machine learning for 42 regions in the Pannonian Basin. The used predictors describe vegetation state, weather, and soil moisture conditions derived from Earth observation, reanalysis, in-situ data, and seasonal weather forecasts. The wide range of predictors was selected to represent the state of the crops and the conditions they are facing and are expected to face. We expected it to be crucial, especially during severe drought years, to provide the model with sufficient information about the drought and its impacts. Afterwards, the model was validated, with a focus on drought years. 

Our results show that crop yield anomaly estimates in the two months preceding harvest have better performance than earlier in the year (relative root mean square errors below 17%) in all years. The models have their clear strength in forecasting interannual variabilities but struggle to forecast differences between regions within individual years. This is related to spatial autocorrelations and a lower spatial than temporal variability of crop yields. In years of severe droughts, there is a clear improvement in the forecasts with a 2-month lead time over longer forecasts too. The crop yield losses remain underestimated, but the wheat model performs in drought years better than for average years with errors below 12%. The errors of the maize forecasts in drought years are larger than for non-drought years: 30% two months ahead and 20% one month ahead. The feature importance analysis shows that in general wheat yield anomalies are controlled by temperature and maize by water availability during the last two months before harvest. In severe drought years, soil moisture is the most important predictor for the maize model and the seasonal temperature forecast becomes key for wheat forecasts two months before harvest. Going forward, a finer spatial resolution of the predictors will be tested to better distinguish the yields between the different regions. In addition, longer time-series of crop yield data, including more data during severe drought years, will help to test the findings of this study. 

How to cite: Bueechi, E., Fischer, M., Crocetti, L., Trnka, M., Zappa, L., Grlj, A., and Dorigo, W.: Maize and wheat yield forecasting in the Pannonian Basin using extreme gradient boosting and its performance in years of severe drought, EGU General Assembly 2023, Vienna, Austria, 23–28 Apr 2023, EGU23-15519, https://doi.org/10.5194/egusphere-egu23-15519, 2023.

EGU23-286 | ECS | Orals | NH9.2

Drought impact profiles: Analyzing multivariate socio-economic drought impacts using nonlinear dimensionality reduction 

Jan Sodoge, Christian Kuhlicke, Miguel Mahecha, and Mariana de Brito

Socio-economic drought impacts often occur concomitantly across multiple sectors, leading to more severe consequences than if they affected single sectors. Improved management of such disasters requires cross-sectoral impact assessments and analyses. As such, analyzing how regions are affected by multiple impacts can provide crucial information for mitigating their consequences. Here, we characterize the multivariate distributions of socio-economic drought impacts. Our aim is to understand patterns by which diverse drought impacts co-occur. We introduce the concept of drought impact profiles, which describe characteristic distributions of co-occurring impacts. To this end, we use a unique spatio-temporal dataset generated with text mining and machine learning applied to newspaper articles. This dataset describes reported socio-economic drought impacts along seven categories (agriculture, forestry, fires,  social, aquaculture, livestock, waterways) in Germany between 2000-2022. We combine several dimensionality reduction algorithms (PCA, ISOmap, self-organizing maps) to generate robust and interpretable representations of the drought impacts. Our results show characteristic patterns for both particular drought events and regions. Also, the applied methods provide a low-dimensional representation of the multivariate socio-economic drought impacts. This research provides a methodological contribution to the holistic, empirical investigation of co-occurring drought impacts. The proposed methods can inform risk models, and policy-makers on the urgency of cross-sectoral governance approaches. Also, the proposed method could apply to other hazards or compound events.

How to cite: Sodoge, J., Kuhlicke, C., Mahecha, M., and de Brito, M.: Drought impact profiles: Analyzing multivariate socio-economic drought impacts using nonlinear dimensionality reduction, EGU General Assembly 2023, Vienna, Austria, 23–28 Apr 2023, EGU23-286, https://doi.org/10.5194/egusphere-egu23-286, 2023.

EGU23-567 | ECS | Orals | NH9.2

Managing the co-occurrence of natural hazards and pandemics with a new parallel phases DRM model 

Silvia De Angeli, Stefano Terzi, Davide Miozzo, Lorenzo Stefano Massucchielli, Joerg Szarzynski, Fabio Carturan, and Giorgio Boni

The Disaster Risk Management Cycle (DRMC) is a common reference for the international Disaster Risk Management (DRM) community to describe the management of catastrophic anthropogenic and natural events worldwide. Implementing this approach, disaster management is described by a series of separate and consecutive phases (e.g., preparedness, response, and recovery). However, the current DRMC is not able to successfully cover the dynamics of multi-hazard risk scenarios, particularly those involving both sudden- (e.g., earthquakes or flash floods) and slow-onset hazards (e.g., pandemics or  droughts).

Starting from such a complex scenario we propose a ‘parallel phases’ DRM model accounting for the management of interacting sudden- and slow-onset hazards. The framed ‘parallel phases’ model allows to overcome the limitations of the existing models when dealing with complex multi-hazard risk conditions. We supported the identified limitations analysing Italian Red Cross data dealing with past and ongoing emergencies including the COVID-19 pandemic. Key findings from the analysis involve: (i) the spatial-temporal differences between sudden-onset events and pandemic disaster management; (ii) the high demand for emergency response resources during pandemics in comparison to other emergencies; (iii) the need for the DRM system to adjust the response to cope with the pandemic seasonality; (iv) the system over-exposure to pandemic response activities reducing the number of resources for preparedness and entering the system into an unpreparedness negative loop.

Overall, the combination of the key findings that emerged from the management of the COVID-19 pandemic in Italy brought out three main guidelines for advancing multi-hazard DRM by applying our ‘parallel phases’ model:

  • Managing the system with parallel phases. A ‘parallel phases’ DRM allows the system to exploit the low emergency intensity of the slow-onset hazards seasonality for preparedness actions while also preparing for any other hazard that can have relevant impacts on the system. Such an approach allows the DRM system to escape from an unpreparedness negative loop. 
  • Keeping the DRM system capacity far from depletion. The DRM system can learn how to efficiently deploy the available resources keeping its capacity far from total depletion. If the DRM system is able to save part of its capacity, it can continue with the increase of internal resources while also making them available for international mutual support in case of multi-hazard risk. Such a condition triggers a positive loop in the increase of the DRM capacity.
  • Impact-based forecasting for multi-hazard disaster risk management. The implementation of multi-hazard seasonal impact-based forecasts fosters the planning of appropriate anticipatory actions, combining the prediction of slow-onsets waves with the seasonality of sudden-onsets.

Overall, the proposed ‘parallel phases’ model is able to capture the complex management dynamics to deal with the increasingly frequent slow-onset and multi-hazard events, introducing a change of perspective from the cyclic, consecutive-phases, and single-hazard DRM approach. For this reason, the ‘parallel phases’ model can strengthen and boost current and future international policies on multi-hazard DRM towards an effective implementation at a local scale.

How to cite: De Angeli, S., Terzi, S., Miozzo, D., Massucchielli, L. S., Szarzynski, J., Carturan, F., and Boni, G.: Managing the co-occurrence of natural hazards and pandemics with a new parallel phases DRM model, EGU General Assembly 2023, Vienna, Austria, 23–28 Apr 2023, EGU23-567, https://doi.org/10.5194/egusphere-egu23-567, 2023.

Between 2020 and 2022, when South Korea experienced Covid-19, it suffered from multiple natural disasters, including typhoons, forest fires, and earthquakes, as well as infectious diseases. Recently, not only in Korea but also worldwide due to climate change, the number and scale of natural disasters are increasing every year, and the damage caused by them is becoming more and more serious. We analyzed big data on disasters in South Korea to identify trends in disasters caused by climate change. So, between 2012 and 2022, we downloaded over 100,000 open data on emergency disaster alert messages (by mobile network Cell Broadcasting Service) provided by the central government and local governments to the general public through Public data portal (https://www.data.go.kr/) open API(Application Programming Interface). And we visualized the collected raw big data based on GIS after refinement, classification((Natural and social disasters, disaster type, disaster level, CBS msg type, emergency disaster message sending agency, etc.), and subdivision by city (we call it Si, Gun, Gu) unit area. Then, it was displayed based on GIS according to the type of disaster. We performed visualization work to derive the results of climate change trends in South Korea by disaster type and by region(Si, Gun, Gu).
Through this, it was possible to identify the types of disasters that are becoming more severe in South Korea according to climate change. Also, based on these results, we were able to identify which disasters each region would be vulnerable to. In addition, based on these results, we were able to identify which disasters are particularly vulnerable according to the characteristics of each region and which disasters it is best to strengthen preparation for in the future.
The results of analyzing the past history big data of our emergency disaster messages can be usefully used to present preventive and prepared plans for future disasters by central and local governments.
This research was supported by a grant (20008820) of Disaster-Safety Inter-Miniterial Cooperation Program funded by Ministry of Interior and Safety (MOIS, Korea)

How to cite: Oh, S.-H., Kang, H., and Ju, S.-L.: Analysis of natural disaster vulnerability by region through the use of big data of emergency disaster message history, EGU General Assembly 2023, Vienna, Austria, 23–28 Apr 2023, EGU23-3031, https://doi.org/10.5194/egusphere-egu23-3031, 2023.

EGU23-3422 | Orals | NH9.2

Feedbacks between City Development and Coastal Flood Risk Management: A Systems Thinking Approach 

Anna Lea Eggert, Karsten Arnbjerg-Nielsen, and Roland Löwe

Human activities have a profound impact on climate and hydrological processes, contributing to changes in the frequency and severity of hydrological extremes and, consequently, growing socioeconomic vulnerability [1]. Rising sea levels, continuous urban development in low-lying coastal areas, and corresponding changes in flood risk have resulted in devastating flood impacts. Different Flood Risk Management (FRM) strategies have been adopted in various socioeconomic contexts and spatiotemporal scales, the most prevalent being structural protection. In recent years, numerous scholars have raised concerns about this approach, as studies have shown that increasing protection levels can increase socioeconomic vulnerabilities e.g., [2]. FRM strategies alter the dynamics of risk manifested in sociohydrological systems, which must be disentangled to avoid unintended consequences.
In the “Cities and rising sea levels” project, scientists from different research disciplines, including hydrology, architecture, landscape architecture, and urban planning, collaborate to tackle these challenges. Combining multidisciplinary knowledge has been central to exploring the cross-sectoral processes involved in FRM. In the present study, we focused on (1) uncovering the cascading effects, including unintended consequences of FRM, as well as (2) highlighting the potentials for holistic assessments of FRM strategies.
Our methods include the development of a Causal Loop Diagram (CLD) model describing critical sociohydrological processes of coastal cities operating at different spatial and temporal scales. We identified dynamic feedbacks between (1) flood risk, urban development and economic wealth, (2) flood risk, urban development and social equity, and (3) flood risk, trust in authorities, and institutional capacity, among others. . Based on the CLD, we analyzed key feedback mechanisms and their manifestation in theory and practice. Further, we explored the impacts of different FRM strategies on these feedback mechanisms to uncover differences in impacts on socioeconomic vulnerabilities and wider cross-sectoral impacts. The presentation will present and explore the conceptual model through semiquantitative analyses (Fuzzy Cognitive Maps (FCMs)) and spatiotemporal assessments using a specific case study. We aim at (1) getting case-specific insights into the dynamics produced by the local interplay of flooding events and socioeconomic processes influencing vulnerabilities, and (2) suggesting pathways for new integrated ways of FRM.

References
[1] IPCC, Climate Change 2022: Impacts, Adaptation, and Vulnerability. Contribution of Working Group II to the Sixth Assessment Report of the Intergovernmental Panel on Climate Change. Cambridge University Press. In Press., 2022.
[2] R. W. Kates, C. E. Colten, S. Laska, and S. P. Leatherman, “Reconstruction of New Orleans after Hurricane Katrina: A research perspective,” Proc. Natl. Acad. Sci. U. S. A., vol. 103, no. 40, pp. 14653–14660, Oct. 2006, doi: 10.1073/PNAS.0605726103/ASSET/C486E9DB-5923-43C0-9881-2B57734F2A7C/ASSETS/GRAPHIC/ZPQ0410637570002.JPEG.

How to cite: Eggert, A. L., Arnbjerg-Nielsen, K., and Löwe, R.: Feedbacks between City Development and Coastal Flood Risk Management: A Systems Thinking Approach, EGU General Assembly 2023, Vienna, Austria, 23–28 Apr 2023, EGU23-3422, https://doi.org/10.5194/egusphere-egu23-3422, 2023.

EGU23-4821 | ECS | Orals | NH9.2

A Study on the Monitoring of Complex Disaster Using Crowd Source Data 

Jeongha Lee and Seokhwan Hwang

As industrialization and urbanization progress around the world, more complex and large-scale complex disasters are occurring, causing numerous casualties and property damage every year. As climate change gradually accelerates and its impact grows, such as recent cold waves and heavy snow in the United States and abnormal temperatures in Europe, it is difficult to predict with existing physical modeling alone. Recently, disasters are gradually expanding in the form of covering not only natural disasters but also various social disasters. Social disasters cover disasters such as fires, infectious diseases, and fine dust caused by human activities. Unlike natural disasters, it is difficult to measure numerical values and predict occurrence patterns in real time, so it is very important to respond quickly through information sharing. There is a limit to establishing the same response system globally to respond to disasters that may occur worldwide, so it is necessary to develop a platform that can quickly share cases while being economical. With the recent development of communication technology, about 70% of the world's population uses smartphones, and various unstructured data are being generated in real time through various social media channels. Individuals act as a sensor and can share their location or current situation in real time. Therefore, the purpose of this study is to develop crowd sourcing technology using social media, analyze the collected data, and present ways to use it in the event of a disaster. In this study, a platform was established to collect and analyze disaster-related SNS data such as floods, fine dust, and forest fires, and it was designed so that users could receive information through websites and apps. As a result of application to various disaster cases in Korea, the temporal and spatial correlation between disaster occurrence patterns and social media data was high, and the possibility of using initial monitoring methods was proved. This result can be applied to all disaster disasters or crimes, and it is expected to be highly useful as it can quickly verify disaster thoughts and share cases in real time.


How to cite: Lee, J. and Hwang, S.: A Study on the Monitoring of Complex Disaster Using Crowd Source Data, EGU General Assembly 2023, Vienna, Austria, 23–28 Apr 2023, EGU23-4821, https://doi.org/10.5194/egusphere-egu23-4821, 2023.

EGU23-5148 | Orals | NH9.2

Bridge the gap: Linking social vulnerability and adaptive behaviour 

Sungju Han, Torsten Masson, Sabrina Köhler, and Christian Kuhlicke

Individual adaptation is essential for achieving community resilience as well as coping with residual risks that have not been addressed by current structural schemes for reducing flood risks. At the same time, it also implies that individuals should have the resources and capacity to protect themselves. So far, this has been interpreted in the social vulnerability concept as accounting only for income, wealth, or other materially relevant factors, showing how much vulnerable people are exposed to more risk. However, individual behavioural adaptability has hardly been included in the current vulnerability assessment.

In light of this, this study proposes a novel way to expand and link social classes using well-established social vulnerability indicators (i.e. income, education, and job status) with socio-psychological and lifestyle elements theoretically and empirically known to influence individual protective behaviour. We conducted a bias-adjusted three-step Latent Class Analysis (LCA) with covariates (socio-psychological and lifestyle elements) and distal outcomes (adaptive behaviour). A household survey (n = 1,753) conducted between June and July 2020 in 11 cities in Saxony, Germany, was used.

The preliminary result shows that socio-psychological and cultural factors that influence individual decision-making on proactive adaptive behaviour co-vary with social classes based on their resource endowment. It also revealed that the lower class tends to have less implementation of costly adaptation methods, for example, structural measures on housing, while less costly measures did not make a significant difference. As a result, we recommend that, in addition to the lack of material endowment, which can be associated with an increased risk of exposure, individual inaction of protective behaviour motivated by socio-psychological traits be considered for social vulnerability.

How to cite: Han, S., Masson, T., Köhler, S., and Kuhlicke, C.: Bridge the gap: Linking social vulnerability and adaptive behaviour, EGU General Assembly 2023, Vienna, Austria, 23–28 Apr 2023, EGU23-5148, https://doi.org/10.5194/egusphere-egu23-5148, 2023.

EGU23-5611 | ECS | Posters on site | NH9.2

A traffic prediction framework under extreme weather combined disaster knowledge and deep learning 

Jiting Tang and Saini Yang

Studying the spatiotemporal patterns of urban road traffic under extreme weather is a key step to building a climate-resilient city. Although existing researches model and simulate traffic states from different perspectives, the traffic forecasting of the urban road networks under extreme weather is seldom addressed. In this paper, a novel Knowledge-driven Attribute-augmented Attention Spatiotemporal Graph Convolutional Network framework is proposed to predict urban road traffic under wind and rain especially in tropical cyclone disasters. Considering the disaster conditions, we model the external dynamic hazard attributes and static environment attributes, and designed an attribute-augmented unit to encode and integrate these factors into the deep learning model. The model is combined with the graph convolutional network (GCN), the gated recurrent unit (GRU), and the attention mechanism. Experiments demonstrate that the predictability of traffic speed can be greatly increased by supplementing the disaster-related factors, the prediction accuracy reaches 0.79. The proposed approach outperforms baselines by 12.16%-31.67% on real-world Shenzhen’s traffic datasets. The model also performs robustly on different road vulnerabilities and hazard intensities. The model errors are mainly occurred in the early peak with extreme wind and rain and the coastal area in the southeast of Shenzhen because of the greater uncertainty. The framework and findings provide a valuable reference for the decision-making of traffic management and control prior to a disaster to alleviate traffic congestion and reduce the negative impact of disasters.

How to cite: Tang, J. and Yang, S.: A traffic prediction framework under extreme weather combined disaster knowledge and deep learning, EGU General Assembly 2023, Vienna, Austria, 23–28 Apr 2023, EGU23-5611, https://doi.org/10.5194/egusphere-egu23-5611, 2023.

EGU23-6810 | ECS | Posters on site | NH9.2

Conceptualizing the long-term interactions between climate services and adaptation to hydrometeorological extremes 

Riccardo Biella, Sina Khatami, Luigia Brandimarte, Maurizio Mazzoleni, and Giuliano Di Baldassarre

Climate services are expected to deliver better climate adaptation by providing decision-makers with timely, salient, credible, legitimate, and accessible climate information. Nonetheless, climate services’ impact on long-term adaptation remains poorly understood due to their ambiguous protocols, quality standards, and inadequate monitoring and evaluation processes.

The aim of this study is to present the underpinnings of a framework representing the causal mechanisms and feedback interactions between adaptation to hydrometeorological extremes, i.e. floods and droughts, and climate services among the partner living labs of the I-CISK project (https://icisk.eu). To this end, a qualitative investigation based on interviews and surveys of the living labs’ stakeholders is performed. Following, the findings from the qualitative analysis are iteratively discussed with the stakeholders and presented as a causal loop diagram, highlighting feedback loops in the coupled human-climate system. Finally, the emerging dynamics are described using system archetypes.

This research offers a systemic tool for evaluating the long-term dynamics of adaptation to hydrometeorological extremes while building the bases for further research in the living labs. Moreover, it shows the efficacy of system dynamics tools for informing adaptive policy-making.

How to cite: Biella, R., Khatami, S., Brandimarte, L., Mazzoleni, M., and Di Baldassarre, G.: Conceptualizing the long-term interactions between climate services and adaptation to hydrometeorological extremes, EGU General Assembly 2023, Vienna, Austria, 23–28 Apr 2023, EGU23-6810, https://doi.org/10.5194/egusphere-egu23-6810, 2023.

EGU23-7967 | Posters on site | NH9.2

Social media, vulnerability, and risk perception: three main points for geological disaster management 

Olga Nardini, Stefano Morelli, Veronica Pazzi, and Sara Bonati

Social media have the potential to significantly influence the disaster risk understanding of natural events of climatic and geological origin, e.g., earthquakes, volcanic eruptions and landslides. Given their considerable diffusion, nowadays they represent a valid support during emergency management processes thanks to their multiple uses in all the different phases of the disaster cycle. The presented results have been achieved carrying out a literature review in the framework of the European H2020 project LINKS ('Strengthening links between technologies and society for European disaster resilience') which aims to strengthen the link between technology and society to improve resilience in four European countries associated with five different risk scenarios. The aim of this research was to investigate how social media influence and impact vulnerability and risk perception and how the increased use of social media as a communication tool during a disaster is shaped by the way the two concepts interact and are conceptualised. The main results are that through social media, it is possible to raise people's awareness of the disaster, also by working on each individual's trust in those who provide information, but also to disseminate useful information and alerts to the population to keep abreast of real-time events, to connect citizens with each other in order to reduce distances and provide psychological support, and to create a social network for those in need. Additionally, social media can be used to manage an emergency and coordinate volunteer actions. The concepts of vulnerability and risk perception are extremely important to be considered when talking about geological hazards and disasters. They are two interconnected concepts that need to be pursued hand in hand in emergency management. The main challenges and factors impacting the use of social media concern access, quality and reliability of information, trust, and awareness of the news being provided, but also personal experience and geographical, social and demographic factors that may influence the way information is perceived and understood. The perception of geological risks directly influences people's preparedness and the way they act, helping anyone to understand the scope of the event and the potential risks that could occur, in order to make informed decisions on how to react. Furthermore, a real understanding of vulnerability influences the resilience of local communities in relation to disasters and can in turn be influenced using social media. Social media can also amplify public fear and concern about the disaster, especially if there is a lot of misinformation or sensationalism about the event. This can lead to an overestimation of risks and an increased sense of vulnerability among the population. These results could be helpful in identifying possible methods and approaches to study these issues in the future.  

How to cite: Nardini, O., Morelli, S., Pazzi, V., and Bonati, S.: Social media, vulnerability, and risk perception: three main points for geological disaster management, EGU General Assembly 2023, Vienna, Austria, 23–28 Apr 2023, EGU23-7967, https://doi.org/10.5194/egusphere-egu23-7967, 2023.

Despite major advancements in climate modeling, weather forecasting, and emergency preparedness, deadly floods continue to have a global reach, impacting Eastern Kentucky, USA (July 2022), Assam, India (2022), Cape Town, South Africa (2022), and Insul, Germany (July 2021) to name just a few. The goal of this work is to quantify and forecast in near-real time a flood’s impact at high spatial resolution by estimating how a household’s accessibility to critical infrastructure changes during and immediately after a storm. Our approach consists of a static transportation assignment cost function that solves for the user equilibrium traffic solution. By overlaying the road network with a near-real-time pluvial and fluvial inundation estimate, we estimate the degree to which flooding impacts households’ likely travel patterns to critical resources. The output consists of demand information on both the road and resource infrastructure networks, which we translate into resiliency and redundancy metrics. Our goal for this model is for it to be able to be rapidly deployed across the USA and potentially abroad to better serve communities who would otherwise not have access to such research and information tools. We present a case-study for Austin, Texas as a proof of concept and to highlight the critical decision-making information our approach can provide to those who need it most including emergency responders, flood managers, and residents themselves. Through this network approach, we can estimate who loses access to critical resources completely, whose access has diminished, how resource distribution is or isn’t equitable, hot spot nodes to prioritize remediation, and more. Our approach uses only open-source information including infrastructure, Earth observation, and point measurement data in our multilayer network. This data requirement allows our model to potentially be applicable in numerous regions across the globe. Our future work will explore using the network insights from this model in a dynamic model of adaptive capacity and human infrastructure. This will provide further insights on socio-hydrological interactions and how varying emergency response policies, government interventions, and human trends might impact the recovery trajectories of different communities.

How to cite: Preisser, M., Passalacqua, P., and Bixler, R. P.: A network-based disaster resilience metric for estimating individuals’ loss of access to critical resources during flooding, EGU General Assembly 2023, Vienna, Austria, 23–28 Apr 2023, EGU23-9923, https://doi.org/10.5194/egusphere-egu23-9923, 2023.

EGU23-10110 | Posters on site | NH9.2

Testing Spatial Out-of-Sample Area of Influence for Grain Forecasting Models:  How does out of Spatial Out-of-Sample AoI Change through the Season?  

Frank Davenport, Shrad Shukla, Donghoon Lee, Patrese Anderson, Greg Husak, and Chris Funk

The potential for predictive models based on earth observations (EO) and survey data to assist in famine early warning and other development applications is rapidly growing. However, while the spatial-temporal extent of EO data is complete, high quality survey data is generally limited in spatial and temporal scope. The perennial question in all predictive analysis, and especially when trying to move from research to operational application in the developing world is: If we create a forecast model from region A (based on observed outcomes) can we apply the same model in region B, where we do not observe or have limited observations of those outcomes? Prior research has proposed examining the Area of Influence (AoI) based on structurally similar characteristics in the EO predictors. We expand on and evaluate this approach in the context of grain yield forecasting in Sub-Saharan Africa (SSA). Specifically, we evaluate an AoI methodology established for generating raster surfaces and apply it to vector supported grain data.  We ask the following questions: What are the key characteristics that make a forecast fit for one country work in another country? Can pooling models across multiple countries provide more accurate out-of-sample estimates than a model fit to one country or district? Does AoI change through the season? Does a model fit for in early season have the same AoI as a model fit late in the season.


How to cite: Davenport, F., Shukla, S., Lee, D., Anderson, P., Husak, G., and Funk, C.: Testing Spatial Out-of-Sample Area of Influence for Grain Forecasting Models:  How does out of Spatial Out-of-Sample AoI Change through the Season? , EGU General Assembly 2023, Vienna, Austria, 23–28 Apr 2023, EGU23-10110, https://doi.org/10.5194/egusphere-egu23-10110, 2023.

EGU23-14314 | ECS | Orals | NH9.2

Current and future evolution of drought risk in Ethiopia: A framework to inform disaster risk reduction and climate change adaptation policies 

Domenico Bovienzo, Sepehr Marzi, Letizia Monteleone, Jaroslav Mysiak, and Jeremy Pal

Climate change is projected to increase the frequency and intensity of future droughts particularly affecting the most low-income countries directly dependent on local rainfed food security and livelihoods. Drought risk and its related impacts depend on the drought hazard, the exposure and the vulnerability of the different socioeconomic sectors and/or ecosystems as well as the adaptive capacity of affected locations. The Horn of Africa, which includes Ethiopia, is currently experiencing one of the most severe droughts in the last 40 years. This study applies a storyline approach to investigate changes in drought risk for Ethiopia combining vulnerability, hazard and adaptive capacity information for current and future projected climatic and socio-economic conditions using a subnational level composite indicator. For our analysis, we define drought based on the Standardised Precipitation-Evapotranspiration Index (SPEI) which characterises the deficits in local water availability based on the precipitation and potential evapotranspiration. SPEI is computed using bias corrected Inter-Sectoral Impact Model Intercomparison Project (ISIMIP) project based on the Coupled Model Intercomparison Project Phase 6 (CMIP6). The Drought vulnerability assessment is carried out combining exposure, adaptive capacity and sensitivity indicators, using INFORM index developed by the Joint Research Centre of the European Commission to support humanitarian crisis and disaster decision-making. The analysis shows that future drought will increase people in need of food assistance both under current population and future population projections. If humanitarian aid and assistance are maintained at recent historical levels, these findings show a substantial increase in the required amounts. These conditions are exasperated when humanitarian access is impeded by local conditions such as the current conflict in Ethiopia, when imports are reduced by crises such as those associated with the Russian invasion of the Ukraine, and by pandemics such as COVID-19. Climate change mitigation is shown to reduce the vulnerability of Ethiopia through a reduction in drought hazard frequency and intensity. The framework presented in this study can be used as a policymaking tool to provide information on how to better prioritize future loss and damage funds and adaptation and mitigation investments to reduce population vulnerability and exposure.

How to cite: Bovienzo, D., Marzi, S., Monteleone, L., Mysiak, J., and Pal, J.: Current and future evolution of drought risk in Ethiopia: A framework to inform disaster risk reduction and climate change adaptation policies, EGU General Assembly 2023, Vienna, Austria, 23–28 Apr 2023, EGU23-14314, https://doi.org/10.5194/egusphere-egu23-14314, 2023.

EGU23-16045 | Posters on site | NH9.2

Compound events from the databases 

Carlo De Michele, Fabiola Banfi, and Viola Meroni

Compound climate-related (or weather-related) events are complex events characterized by the interactions between various physical processes across multiple spatial and temporal scales, generated by meteorological variables, and provoking extreme impacts. Compound climate-related events often include the joint occurrence of multi-hazards like landslides and floods, or heatwaves, droughts and wildfires.

In literature, databases of natural hazards are in general single hazard, like databases of floods (European Flood Database, AVI database), landslides (Global Fatal Landslide Database , AVI database), droughts (European Drought Observatory).

The assessment and understanding of compound events requires an integrated perspective, with the integration of data from multiple variables, combining multiple databases.

In this presentation, we try to address this emerging need, illustrating a possibility of building a compound events database, and presenting some examples.

How to cite: De Michele, C., Banfi, F., and Meroni, V.: Compound events from the databases, EGU General Assembly 2023, Vienna, Austria, 23–28 Apr 2023, EGU23-16045, https://doi.org/10.5194/egusphere-egu23-16045, 2023.

EGU23-16481 | ECS | Orals | NH9.2

Limits of adaptation to climate-related risks in the Peruvian Andes: A case study in the Río Santa and Salkantay catchments 

Isabel Hagen, Sanne Schnyder, Inés Yanac León, Sirkku Juhola, Veruska Muccione, and Christian Huggel

The highly populated Peruvian Andes is impacted by a multitude of climate-related risks. Comprehensive climate risk management and adaptation measures can bring risks down to an acceptable level, as determined by the local population. However, increased magnitude and frequency of risks, together with the possibility of reaching adaptation limits, are hindering risk reduction. Adaptation limits are reached due to a complex interplay between socio-economic, cultural, political, institutional, technical and bio-physical factors. Whilst there is an emerging conceptual understanding of adaptation limits, there is little empirical research investigating limits in real-world settings.

The aim of this study is to identify and define the limits of adaptation on a local scale, which limits are approaching and which have already been reached. We investigate the limits of adaptation in two catchments in the Peruvian Andes. The most prevalent climate-related risks in these two regions are from glacial lake outburst floods, landslides, shifts in precipitation patterns, and glacier retreat. We use a conceptual framework developed by Juhola et al. (unpublished), and determine adaptation limits and the intolerable risks space through investigating human wellbeing, governance systems, ecosystem functions and climate hazards in the two localities. The data was collected through a thorough literature review, together with 50 semi-structured interviews conducted in May-July 2022; 28 with local residents in the Río Santa and Salkantay catchments, and 22 interviews with experts from 14 different local and national institutions and NGOs. The interviews were analysed in Atlas.ti using a content analysis approach. We emphasize the focus on basic needs and wellbeing, to encompass not only what are obvious losses from climate impacts, such as loss of life or livelihood, but also more intangible losses, such as limited mobility, loss of a social network, or loss of local knowledge. The conclusions of this study can help decision makers and practitioners improve the positive impact of future risk management and adaptation projects in the two regions.

How to cite: Hagen, I., Schnyder, S., Yanac León, I., Juhola, S., Muccione, V., and Huggel, C.: Limits of adaptation to climate-related risks in the Peruvian Andes: A case study in the Río Santa and Salkantay catchments, EGU General Assembly 2023, Vienna, Austria, 23–28 Apr 2023, EGU23-16481, https://doi.org/10.5194/egusphere-egu23-16481, 2023.

Societal resilience is built upon effective risk transfer strategies. For most developed countries in the world, insurance and reinsurance continues to be the most effective method of sharing this burden and reducing the need for state intervention. However, it’s becoming increasingly clear that the probabilistic (CAT) models used to price natural hazard risk are struggling to capture the increasingly dynamic changes of the climate and our level of interconnection.

The Gallagher Research Centre (GRC) was established recently to support reinsurance stakeholders navigate an increasingly complex risk management landscape. Though probabilistic and deterministic natural catastrophe models were first pioneered in the early 1960’s (Friedman, 1984) it wasn’t until the 1990’s, and the combined losses from Hurricane Andrew ($27.3 billion USD) and the Northridge Earthquake ($25 billion USD) that such models began to be fully embraced by the mainstream reinsurance industry (Reinsurance News, 2023).

While significant and continued progress has been made in the precision and scalability of these models in the last 30 years, climate change and an increasingly globalized world mean the relative impacts of natural hazards are becoming far more complex and diverse than most models successfully capture. This leads to an increasing basis risk and potentially less utility of the models. This session will outline the growing research concerns of focus for the GRC, including how can stochastic models built around historical periods truly capture the non-stationarity of risk we see occurring for wind and flood perils? Should models capture the seasonal dependencies between perils to more accurately price aggregate insurance risk? Should future model development focus on the compounded scenarios? 


Friedman, D. G. (1984). Natural hazard risk assessment for an insurance program. Geneva Papers on Risk and Insurance, 57-128.

Reinsurance News (2023). Last accessed 10/01/2023. https://www.reinsurancene.ws/insurance-industry-losses-events-data/

How to cite: Willis, I. and Papaspiliou, M.: The urgency for (re)insurance probabilistic (CAT) models to capture the dynamics of an increasingly interconnected world, EGU General Assembly 2023, Vienna, Austria, 23–28 Apr 2023, EGU23-17449, https://doi.org/10.5194/egusphere-egu23-17449, 2023.

Hail is a severe meteorological hazard that can cause significant damage to both buildings and cars. Here, we present the first-ever open-source risk model for hail damages, provided within the CLIMADA framework. The availability of high-resolution radar-based hail intensity measures and detailed damage and exposure data from local insurance companies in Switzerland allows for a spatially explicit calibration of vulnerability functions for buildings and cars. The model is able to provide climatological evaluations of hail risk and real-time hail damage estimates based on any user-provided exposure data. Furthermore, combined with crowd-sourced hail reports, the detailed damage data allows for an evaluation and uncertainty quantification of different radar-based hail intensity measures. In a second step, the model will be expanded to use high-resolution convection-resolving simulations with the hail growth module HAILCAST as hazard variable. This enables the assessment of hail risk under climate change, as well as the prototyping of an impact-based warning system based on ensemble weather forecasts. The open-source nature of the model allows for easy access and modification by any interested party, including insurance companies, government agencies, and the general public, making it a valuable tool for assessing hail risk and implementing effective mitigation strategies.

How to cite: Schmid, T. and Bresch, D. N.: Open-source Risk Model for Hail Damages to Buildings and Cars: From Climatological Evaluation to Impact-based Warnings, EGU General Assembly 2023, Vienna, Austria, 23–28 Apr 2023, EGU23-3264, https://doi.org/10.5194/egusphere-egu23-3264, 2023.

EGU23-4659 | ECS | Orals | NH9.17

Beyond agriculture? A review of cross-sectoral drought risk and impacts research in Europe over the past two decades 

Davide Cotti, Anne-Sophie Sabino Siemons, Gustavo Naumann, Marthe Wens, Hans de Moel, Veit Blauhut, Kerstin Stahl, Lauro Rossi, Willem Maetens, Andrea Toreti, and Michael Hagenlocher

The impacts of drought events can be diverse, far-reaching and encompass multiple sectors and systems. This became particularly evident in recent droughts in Europe (e.g. 2018 and 2022), when, together with extensive damages to agriculture across the whole continent, severe impacts on public water supply, energy production and riverine transportation were also registered. However, while the scientific community has called for the study of these events in their multi-sectoral complexity, research on drought risk and impacts still tends to be conducted in sectoral and disciplinary silos, with different conceptualizations, terminology and methodologies evolving in relative isolation. In order to assess the state of multi-sectoral drought risk research in the European Union, we have completed a systematic literature review (n=168) aimed at understanding how different sectors and systems are represented in drought impacts and risk assessment research in the 27 countries of the European Union (EU27). The analysis focused on peer-reviewed publications and conference proceedings from 2000 to 2022, sourced through the Scopus database, and returned a research landscape where agricultural applications are predominant across the period considered, but in which the representation of other sectors and systems (e.g. energy, ecosystems) is steadily increasing throughout the years. However, only a minority of the studies tackle more than one sector or system (e.g. agriculture and ecosystems), and in most cases the multi-sectoral perspective is not accompanied by a fully integrated assessment of risk in its hazard, exposure and vulnerability components. Another trend of interest is the progressive, albeit still limited, increase in the representation of different geographical clusters among the studies analysed: in particular, while Southern European countries (e.g. Spain, Italy, Portugal) lead in number of case studies, applications to Western European countries (e.g. Germany, France, Austria) have become more frequent. These results can be interpreted as a general improvement towards a more unified understanding and characterization of drought events, but also point at a still high compartmentalization across sectoral fields. Because of the complexity of droughts, this persisting separation may hinder progress towards a common conceptualization of drought events as systemic and multi-sectoral events with multiple direct, indirect and cascading impacts. In particular, a stronger focus on multi-sectoral risk analysis could provide actionable information to support the identification of solutions capable of tackling multiple issues, thus expanding the policy space into which drought risk management can operate.

How to cite: Cotti, D., Sabino Siemons, A.-S., Naumann, G., Wens, M., de Moel, H., Blauhut, V., Stahl, K., Rossi, L., Maetens, W., Toreti, A., and Hagenlocher, M.: Beyond agriculture? A review of cross-sectoral drought risk and impacts research in Europe over the past two decades, EGU General Assembly 2023, Vienna, Austria, 23–28 Apr 2023, EGU23-4659, https://doi.org/10.5194/egusphere-egu23-4659, 2023.

EGU23-4936 | Orals | NH9.17 | Highlight

Droughts in a human-dominated world: Feedbacks, legacies and inequalities 

Giuliano Di Baldassarre

Societies have increasingly influenced the frequency and severity of hydrological drought over the past centuries by: i) building dams and reservoirs to secure water supply; ii) diverting water flows to supply cities, industries and agriculture; and iii) changing river basin characteristics through deforestation, urbanization and drainage of wetlands. While societies influence hydrological droughts, drought occurrences (and risks) influence societies. Adaptive responses include migration from drought-affected areas or changes in water allocation and governance. In this talk, I present case studies, global analyses and models to show how these sociohydrological feedbacks can generate legacy risks or social inequalities and thus challenge the development of sustainable policies of disaster risk reduction and water management.


How to cite: Di Baldassarre, G.: Droughts in a human-dominated world: Feedbacks, legacies and inequalities, EGU General Assembly 2023, Vienna, Austria, 23–28 Apr 2023, EGU23-4936, https://doi.org/10.5194/egusphere-egu23-4936, 2023.

EGU23-5634 | ECS | Orals | NH9.17

Snow droughts as a precursor of water conflicts 

Francesca Munerol, Francesco Avanzi, Marina Morando, Marco Altamura, Simone Gabellani, Marta Galvagno, Edoardo Cremonese, and Luca Ferraris

Water conflicts generally stem from an imbalance between water demand and availability; as such, they are often studied as a result of meteorological droughts – that is, a lack of precipitation or streamflow. By shifting water availability from wet winters to dry summers, when demand peaks, we hypothesized that snow water resources represent a crucial precursor of this imbalance, and thus play an important, but unexplored role in escalating drought-related water crises and conflict. To shed light on the nexus between snow droughts and increased water challenges, we draw lessons from the extraordinarily warm, dry, and prolonged 2021-2022 snow drought in the Italian Alps, from the consequent spring-to-summer water deficit, and from the relative seeds of conflict. To this end, we compared the spatial distribution of snow water resources deficit with the distribution and type of municipal mandatory water restrictions, under the assumption that the former are proxies of a future deficit in availability, while the latter are proxies of an imbalance between this availability and needs. We found initial evidence that the location and magnitude of the deficit in snow water resources observed across the Italian Alps in winter 2022 (-60% or more at peak accumulation) did result in seeds of institutional conflicts later in spring and summer. These findings can aid institutions and policymakers in understanding the mechanisms behind emerging water conflicts and their implications, and so design ad-hoc water policies, especially in a warming climate.


How to cite: Munerol, F., Avanzi, F., Morando, M., Altamura, M., Gabellani, S., Galvagno, M., Cremonese, E., and Ferraris, L.: Snow droughts as a precursor of water conflicts, EGU General Assembly 2023, Vienna, Austria, 23–28 Apr 2023, EGU23-5634, https://doi.org/10.5194/egusphere-egu23-5634, 2023.

EGU23-5948 | Orals | NH9.17

The EDORA project: Towards a multi-sectoral drought risk assessment in Europe 

Lauro Rossi, Monika Bláhová, Veit Blauhut, Hans De Moel, Davide Cotti, Michael Hagenlocher, Irene Kohn, Anne Van Loon, Willem Maetens, Dario Masante, Roberto Rudari, Anne-Sophie Sabino Siemons, Kerstin Stahl, Ruth Stephan, Kathrin Szillat, Andrea Toreti, Marthe Wens, and Gustavo Naumann

Drought affects almost every aspect of the environment and society. However, specific sectoral drought impact and risk assessments are often excluded from loss estimates because they are difficult to quantify and/or model. Effectively assessing and managing drought risk requires a multi-scale and multi-sectoral approach to understand the different dimensions of drought. 

The European Drought Observatory for Resilience and Adaptation (EDORA) project addresses the study of drought risk in a multi-system perspective in the European Union. The sectors and systems included in the assessment are agriculture, energy production, water supply, water transport and ecosystems. 

A proper collection and classification of past drought impact data is essential for risk assessment. To this end, we are developing a database of recorded impacts for each system, which can be fed by semi-automated media monitoring, official reports and manual data entries from potential observers. The collection and systematisation of sector specific impacts of drought aims at filling an important gap at the European scale.

Drought risk is assessed in two complementary ways. Risk drivers, root causes of risk and cascading effects are identified and mapped through system-specific impact chains informed by a systematic literature review and expert consultation (including validation workshops). An integrated, cross-system model unveils the interconnections and complexity of drought risk. Also, a modelling tool to quantitatively assess drought risk  was developed for different systems and different regions using machine learning techniques. This data-driven technique uncovers the vulnerability-specific interactions between hazard and impact under present and projected climate conditions. The outcomes of the risk assessments are collected into an atlas showing European multisectoral drought risk at subnational level.

How to cite: Rossi, L., Bláhová, M., Blauhut, V., De Moel, H., Cotti, D., Hagenlocher, M., Kohn, I., Van Loon, A., Maetens, W., Masante, D., Rudari, R., Sabino Siemons, A.-S., Stahl, K., Stephan, R., Szillat, K., Toreti, A., Wens, M., and Naumann, G.: The EDORA project: Towards a multi-sectoral drought risk assessment in Europe, EGU General Assembly 2023, Vienna, Austria, 23–28 Apr 2023, EGU23-5948, https://doi.org/10.5194/egusphere-egu23-5948, 2023.

EGU23-6038 | ECS | Posters on site | NH9.17 | Highlight

A Transformer-Based Analysis of Tweets in Germany to Investigate the Appearance and Evolution of the 2021 Eifel Flood in Social Media 

Nadja Veigel, Heidi Kreibich, Jens A. de Bruijn, Jeroen C.J.H. Aerts, and Andrea Cominola

In July 2021 several European countries were hit by severe floods. Estimates by SwissRe indicate that a flood event caused by the low-pressure area “Bernd” caused 227 deaths and economic losses of 41 billion USD in Central and Western Europe, with hotspots in Germany, Belgium, and the Netherlands. An increasing number of studies focus on understanding and modelling the causes and evolution of this event, developing reliable estimates of the losses it caused, and recommending improved disaster management strategies. However, risk communication and flood-related citizens’ behaviors, attitudes, and perceptions before, during, and after the flood are currently understudied.

Here, we develop an analytical framework to extract information on these human-related elements based on social media data. We ultimately aim to understand how flood warnings, intensity and impact are reflected in social media topics. To this extent, we analyze differences between topics arising on social media for an event like the 2021 flood compared to less devastating floods that occurred in the past. This requires homogeneous automatic assessment of Twitter data over time. We analyse the content of 42,000 tweets containing selected keywords related to flooding posted in Germany since 2014. Keywords refer to both fluvial and flash floods. Bidirectional Encoder Representations from Transformers (BERT) in combination with unsupervised clustering techniques are implemented to classify the tweets in different topic groups (BERTopic). Further, we extract the temporal evolution of topic patterns for different flood types and phases of flooding. Our analysis contributes to understanding the patterns of key topics, reflecting behaviors before, during and after the flooding event - thus how these topics change over time. Using the new framework and understanding these dynamics supports (i) modelling risk communication, behavioral drivers, and social interactions in relation to different types of floods with different intensities, and (ii) identifying indirect flood impacts that are not reported in traditional flood documentation. Finally, our approach can be extended for analysis of other natural hazards as well as compound events.

How to cite: Veigel, N., Kreibich, H., de Bruijn, J. A., Aerts, J. C. J. H., and Cominola, A.: A Transformer-Based Analysis of Tweets in Germany to Investigate the Appearance and Evolution of the 2021 Eifel Flood in Social Media, EGU General Assembly 2023, Vienna, Austria, 23–28 Apr 2023, EGU23-6038, https://doi.org/10.5194/egusphere-egu23-6038, 2023.

EGU23-6201 | Posters on site | NH9.17

Pluvial flood depth mapping in urban areas using data fusion 

Kai Schröter, Max Steinhausen, Lars Salgmann, Henning Müller, Levente Huszti, and Martin Drews

Inundations of urban areas induced by extreme rainfall are an increasingly important driver of loss and damage. With climate change, locally heavy precipitation will occur more frequently and with greater intensity. For efficiently reducing flood impacts and informing precautionary measures rapid and reliable information on affected areas is essential. Increasing amounts of data are available from a growing diversity of sensors and data sources. The Increasing volume and velocity of data are auspicious but require improved capabilities of extracting and integrating knowledge from this wide variety of data. Using recent pluvial flood events in Budapest (Hungary), Dresden (Germany), and Braunschweig (Germany) we investigate whether the combination of data from multiple sources (remote sensing, simulation models, online media, VGI) provides more reliable and more accurate inundation depths maps to better inform the assessment and management of pluvial floods. We combine data with geospatial analysis methods and fuse the different datasets using statistical and ML-based approaches. The results indicate that the combined data sources help to close gaps in individual data sources. Further, we note a compensatory effect, which results in more reliable and accurate inundation maps.

How to cite: Schröter, K., Steinhausen, M., Salgmann, L., Müller, H., Huszti, L., and Drews, M.: Pluvial flood depth mapping in urban areas using data fusion, EGU General Assembly 2023, Vienna, Austria, 23–28 Apr 2023, EGU23-6201, https://doi.org/10.5194/egusphere-egu23-6201, 2023.

EGU23-8349 | ECS | Orals | NH9.17

Water management assessment with text mining 

Taís Maria Nunes Carvalho, Francisco de Assis de Souza Filho, and Mariana Madruga de Brito

Water allocation during droughts is a challenge for policymakers, often addressed through participatory approaches. The implications of this governance mode are understudied as long-term records of the decision-making processes are often unavailable. We use natural language processing (NLP) and network analysis to extract information on water allocation decisions and climate-related issues from meeting minutes of river basin stakeholders. To test this approach, we considered the minutes of 1100 meetings held between 1997 and 2021 in the twelve basin committees of Ceará, Brazil. This region has a long history of droughts, which have strongly influenced water policies and politics. The river basin committee is currently composed of representatives of governmental and non-governmental institutions and deliberates on the water management process. To identify conflicts and relevant issues discussed during the meetings, we created a topic modeling approach consisting of: (1) sentence embedding using SBERT, (2) dimensionality reduction using UMAP, and (3) sentence clustering using K-means. Based on this, we calculated the topic frequency in each committee over time and normalized it by the number of documents registered each year. We also detected the topics mentioned in the same document to build network graphs of co-occurring topics. By using named entity recognition and dependency parsing, we identified the main actors involved during these meetings. Findings indicate that the most common topics were related to 'organic farming', 'fish mortality in reservoirs' and 'structural problems in water infrastructure'. The enhancement of water use monitoring - to identify potential water right violations - seems to be the preferred strategy to cope with droughts. During droughts, stakeholders appear to be more concerned about urban water supply than agriculture demand. We use historical data on water permit granting and water use charging to validate this finding. We also see an increase in climate-informed decisions over time, which became more frequent as new droughts affected the region. In summary, the proposed approach allows exploiting existing text data in order to identify the spatio-temporal patterns of topics related to water allocation. These data are often underexplored due to difficulties in analysing large amounts of text using conventional tools. Hence, text analysis offer exciting new opportunities for research in the field of water management.

How to cite: Nunes Carvalho, T. M., de Souza Filho, F. D. A., and Madruga de Brito, M.: Water management assessment with text mining, EGU General Assembly 2023, Vienna, Austria, 23–28 Apr 2023, EGU23-8349, https://doi.org/10.5194/egusphere-egu23-8349, 2023.

EGU23-8511 | Posters on site | NH9.17

Combination of crop models and machine learning techniques for agricultural parametric insurance 

Beatrice Monteleone, Luigi Cesarini, Marcello Arosio, and Mario Martina

Agriculture is highly exposed to the effects of weather and extreme events play a crucial role in lowering crop yields. Low crop production has devastating effects on farmers from the economic point of view and undermines food security. Thus, crop insurance constitutes an ex-ante formal tool adopted in many countries to secure farmers’ income.

The interest in index-based (or parametric) insurance in the agricultural sector has grown in recent years and many different parametric products are nowadays available for farmers both in high and low-income countries. While traditional insurance evaluates the claims assessing crop losses in the field after an event, index-based insurance calculates indemnities based on an independent proxy for yield losses, as for example a weather index.

Index-based insurance exhibits many advantages with respect to traditional; it overcomes the issues of moral hazard and adverse selection, farmers receive payouts quickly since there is no need of in-situ inspections, administrative costs are lower with respect of the ones of traditional insurance, etc.

However, parametric products are subjected to high basis risk since the relationship between the weather index and farmers losses is imperfect and affected by high uncertainty. The minimization of basis risk is the main challenge of parametric products and could be obtained by developing indices that reproduce as accurately as possible the relationship between climate and yield.

Nowadays, in parametric insurance products the use of rainfall and temperature-based indices is prevalent with respect to the application of drought, floods, or soil moisture-based indices, even if the latter are more accurate in reproducing farmers losses. The reason behind this choice is that farmers prefer products based on variables easy to understand and measure.

In addition, the major part of parametric insurance products estimates the yield-index relationship through the use of statistical methods, such as regression, correlation, copulas or probability distribution. The use of mechanistic methods as crop modelling, and machine learning techniques deserves to be further explored since preliminary studies have demonstrated their potential in producing accurate yield-index relationships, even if a huge amount of data is required to successfully set up the models.

This study explores the use of a combination of crop models and machine learning methods to establish an accurate yield-index relationship. At the same time the proposed index should be directly related to a simple weather variable (such as rainfall or temperature) through tables or functions easy to understand for farmers.

Various crop models, such as APSIM, WOFOST and AquaCrop were tested, together with different machine learning techniques, namely CNN and random forest, explaining the outcome with the aid of SHAP values, creating an output transparent and easier to understand for farmers.

The case study area is Northern Italy, given the availability of observed yield data Weather data have been retrieved from various sources, such as satellite products (CHIRPS), reanalysis (ERA-5, SPHERA, etc.) and weather stations, while soil data (soil texture and water content) derive from the SoilGrids database and the FAO harmonized soil database.

Preliminary results have shown good correlations between maize and wheat yields simulated with crop models and observed yields.  

How to cite: Monteleone, B., Cesarini, L., Arosio, M., and Martina, M.: Combination of crop models and machine learning techniques for agricultural parametric insurance, EGU General Assembly 2023, Vienna, Austria, 23–28 Apr 2023, EGU23-8511, https://doi.org/10.5194/egusphere-egu23-8511, 2023.

EGU23-11984 | Orals | NH9.17

Using automated web data mining for natural hazard assessment 

Ascanio Rosi, Rachele Franceschini, Nicola Casagli, and Filippo Catani

Landslides and floods in Italy are the most frequent and diffuse natural hazards causing fatalities and damages to urban areas. Traditional methods as photo-interpretation, remote sensing or retrieval data from technical reports are the most common to set up event inventories. These systems rarely rely on automated or real-time updates. The retrieval of data, using specific data mining algorithms, from newspapers allows continuous feedback from real world and can further extend the exploitable data. Exploiting the data from mass media allows to get information about disaster situations with a relatively high temporal and spatial resolution to map natural hazards across various locations. Several techniques have been developed to mine data for different natural hazard, but rarely applied about landslide and flood news. The algorithm Semantic Engine to Classification and Geotagging News (SECaGN), based on a semantic engine, automatically retrieves information from online newspaper. 184.322 newspaper articles have been harvested from 2010 to 2019, referred to 32.525 landslide news and to 34.560 floods news in Italy. In this work, the data harvested by SECaGN underwent to a manual classification based on news relevance, localization accuracy and time of publication. Most of the news referred to recent events or are generically referred to landslide or floods (remediation work, hazard scenarios) and only a minimum part it was made up by wrong news. This classification allowed to identify the “true news” and to reject the data not appropriate, reducing the uncertainties.

The harvested data have been used to identify the media impact of the events (both landslides or floods), their temporal distribution and those areas where more events happened, allowing a fast hazard estimation of the Country.

The retrieved news data have been then compared with traditional sensors (e.g. rain gauges) and official reports about victims, damages, funds for soil protection and risk maps. Results did not show any clear correlation between the distribution of news and the other parameters, but it resulted that the regions that experienced a relevant number of events recorded lower funds for soil protection and vice versa.

In conclusion, this work allowed to demonstrate the possibility of using automatically retrieved data from newspaper to create a reliable landslide (and flood) inventory, to be used as a proxy for hazard assessment over wide areas and to investigate the distribution of the phenomena and their correlation with other parameters, providing a powerful tool for a rapid hazard assessment in support of public authorities and decision makers.

How to cite: Rosi, A., Franceschini, R., Casagli, N., and Catani, F.: Using automated web data mining for natural hazard assessment, EGU General Assembly 2023, Vienna, Austria, 23–28 Apr 2023, EGU23-11984, https://doi.org/10.5194/egusphere-egu23-11984, 2023.

EGU23-11993 | Orals | NH9.17

Sinkhole risk assessment by using machine learning model: the case study of Guidonia-Bagni di Tivoli plain (Rome), Italy 

Silvia Bianchini, Pierluigi Confuorto, Emanuele Intrieri, Paolo Sbarra, Diego Di Martire, Domenico Calcaterra, and Riccardo Fanti

Sinkholes that occur in settled carbonate lands can be a critical source of risk for human properties and activities since they can abruptly produce serious damage to property and people in densely populated flat areas. This work presents a sinkhole susceptibility and risk assessment mapping in Guidonia-Bagni di Tivoli plain (Central Italy), which is a carbonate sinkhole-prone study area where sudden occurrences of sinkholes have happened in past and recent times. We consider a point-like sinkhole inventory and a series of environmental sinkhole-controlling factors on the study area, related to its geo-litho-hydrological asset, i.e. travertine thickness, and to its terrain deformational scenario, i.e. ground motion rates derived from InSAR COSMO-SkyMed imagery. A sinkhole susceptibility map was generated by means of maximum entropy algorithm  - MaxEnt model – and it was then combined with data on vulnerability and elements-at-risk economic exposure derived from cadastral inventories and market and income values, in order to provide a final sinkhole risk map of the Guidonia-Bagni di Tivoli area. The results show that areas at higher risk covers about 2% of the total study area and primarily relies on the zoning of the main urban fabric. In particular, it is worth to highlight that 5% of the whole road-network pavement and 27% of all the residential buildings fall into higher risk classes. Outcomes of this work reveal the potential of MaxEnt model to assess sinkhole susceptibility for predicting sinkhole areas, either provide a sinkhole risk map as a useful tool for geohazard risk and urban planning management strategies.

How to cite: Bianchini, S., Confuorto, P., Intrieri, E., Sbarra, P., Di Martire, D., Calcaterra, D., and Fanti, R.: Sinkhole risk assessment by using machine learning model: the case study of Guidonia-Bagni di Tivoli plain (Rome), Italy, EGU General Assembly 2023, Vienna, Austria, 23–28 Apr 2023, EGU23-11993, https://doi.org/10.5194/egusphere-egu23-11993, 2023.

EGU23-12036 | ECS | Posters on site | NH9.17

Projection of Snow droughts under climate change scenarios in the Urmia Lake basin 

Maral Habibi, Iman Babaeian, and Wolfgang Schöner

Abstract

Mountains are a crucial water source, especially for the mountainous catchments in arid and semiarid regions. Climate Change is a severe hazard to mountain regions as global temperatures rise and snowpack melt. Snowmelt more effectively infiltrates the subsurface than rainfall. So, more rain, less snow, and early snow melting could significantly impact the groundwater levels in mountainous systems. In arid and semiarid mountainous regions, surface water resources are generally limited, and groundwater is critical for water supply due to local accessibility and high reliability during drought.

Urmia lake as a mountainous catchment has recently faced extreme droughts, and since snow is a significant part of the precipitation in this region, understanding the impact of climate change on snow changes and spatiotemporal projection of the snow-covered surface and the impact of these changes is vital.

For this purpose, in our study, snow drought index of SMRI (Snow-Melt Runoff Index) over ULB were projected using the statistically downscaled runoff output of CMIP6 global climate models under the SSPs scenarios of SSP1-2.6, SSP2-4.5, SSP5-8.5. To remove model bias over the catchment, historical runoff retrieved from CMIP6 models have been compared with ERA5 runoff Output. Based on our results, more frequent, longer lasting, and stronger drought events are projected in the catchment. The findings of this study could be further used for future water management in the catchment.

Keywords: Urmia Lake, Mountainous catchments, CMIP6, SSP scenarios, Snow drought projection

How to cite: Habibi, M., Babaeian, I., and Schöner, W.: Projection of Snow droughts under climate change scenarios in the Urmia Lake basin, EGU General Assembly 2023, Vienna, Austria, 23–28 Apr 2023, EGU23-12036, https://doi.org/10.5194/egusphere-egu23-12036, 2023.

For several seismic-prone countries, current earthquake insurance solutions cover only a small part of the economic loss. Innovative insurance products like parametric insurance are emerging for which the compensation is calculated upon a trigger instead of a claim amount, covering more people but with drawbacks due to probable difference between the insurance compensation and the actual loss. In this paper, new insurance model is proposed, covering earthquake risk for residential houses. Its main characteristics are: (1) the compensation is to rebuild the insured house, instead of paying a financial amount; (2) the model leverages both on long-term financial investment and seismic retrofitting of the insured buildings to make the premium amount affordable; and (3) joint participation of the public authorities and the homebuilder companies in this insurance model are expected since the first ones are the key player in risk prevention plans and the second ones are the beneficiary of this new market (incentivizing repairs/reconstruction and retrofitting works). Results show that in most cases the price (i.e. premium amount and retrofitting costs) for this earthquake insurance model is lower than the premium amount considering the traditional earthquake insurance. For the optimal deductible amount, the decrease can even be three times lower than for classical model, by assuming a contribution from both the public authorities and the homebuilder companies. Such a decrease could raise the rate of California homeowners insured against earthquake risk from 15% up to 50%.


How to cite: pothon, A.: A long-term property earthquake insurance: illustration with the housing sector in California, EGU General Assembly 2023, Vienna, Austria, 23–28 Apr 2023, EGU23-13009, https://doi.org/10.5194/egusphere-egu23-13009, 2023.

EGU23-13541 | ECS | Posters on site | NH9.17

DIRECTED – Disaster Resilience for Extreme Climate Events providing Interoperable Data, Models, Communication and Governance 

Max Steinhausen, Kai Schröter, Martin Drews, Lydia Cumiskey, Heiko Apel, Stefano Bagli, Sukaina Bharwani, Julian Struck, Daniel Bittner, Tobias Conradt, Benedikt Gräler, Christopher Genillard, Stefan Hochrainer-Stigler, Levente Huszti, Tracy Irvine, Chahan M. Kropf, Emilie Rønde Nielsen, Pia-Johanna Schweizer, Valeria Pancioli, and Analia Rutili and the DIRECTED project team

The recent droughts and unprecedented floods in Central Europe have revealed our vulnerability to extreme weather events. Besides climate change as a driver of more frequent and intensifying extreme events, demographic change and socio-economic development exacerbate severe impacts. International frameworks for disaster risk reduction (DRR) and climate change adaptation (e.g. Sendai framework for DRR, EU Strategy on adaptation to climate change) acknowledge the critical need for integrating risk governance, communication and operational mechanisms for coping with extreme climate events throughout the entire Disaster Risk Management cycle.

DIRECTED aspires to foster disaster-resilient European societies by expanding our capabilities to communicate, utilise and exchange state-of-the-art data, information and knowledge between different actors. The project strives to boost the integration, accessibility and interoperability of models, facilitating knowledge sharing and improving dialogue and cooperation on all levels of Disaster Risk Management cycle. Four regional and municipal Real World Labs in the Capital Region of Denmark, the Danube Region, Emilia Romagna Region, Italy and the Rhine-Erft District, Germany, are at the centre of the bottom-up, value-driven co-development approach. The Real World Labs ensure the project continuously and actively involves key stakeholders in the development process and address topical problems of multi-hazard risk management and climate change adaptation to maximise the impacts of the DIRECTED project. Key to supporting interoperability will be the establishment of the DATA-FABRIC, an innovative, federated cloud platform that enables secure, flexible, discovery and sharing of all structured and unstructured data. DIRECTED is committed to promote the power of open data and open science in all of its research efforts.

Through an interdisciplinary approach that brings together natural and social scientists, with data experts, local stakeholders as well as first and second responders DIRECTED builds lasting real world partnerships and leverages synergies for Disaster Risk Reduction and Climate Change Adaptation efforts in Europe.

How to cite: Steinhausen, M., Schröter, K., Drews, M., Cumiskey, L., Apel, H., Bagli, S., Bharwani, S., Struck, J., Bittner, D., Conradt, T., Gräler, B., Genillard, C., Hochrainer-Stigler, S., Huszti, L., Irvine, T., Kropf, C. M., Rønde Nielsen, E., Schweizer, P.-J., Pancioli, V., and Rutili, A. and the DIRECTED project team: DIRECTED – Disaster Resilience for Extreme Climate Events providing Interoperable Data, Models, Communication and Governance, EGU General Assembly 2023, Vienna, Austria, 23–28 Apr 2023, EGU23-13541, https://doi.org/10.5194/egusphere-egu23-13541, 2023.

EGU23-15402 | Posters on site | NH9.17

Drought hazards and stakeholder perception: Unraveling the interlinkages between drought severity, perceived impacts, preparedness and management 

Claudia Teutschbein, Frederike Albrecht, Malgorzata Blicharska, Faranak Tootoonchi, Elin Stenfors, and Thomas Grabs

The future risk for droughts and water shortages calls for substantial efforts by authorities to adapt at local levels. Understanding their perception of drought hazards, risk and vulnerability can help to identify drivers of and barriers to drought risk planning and management in a changing climate at the local level. We present a novel interdisciplinary drought case study in a Nordic country that integrates soft data from a nation-wide survey among more than 100 local practitioners and hard data based on hydrological measurements to provide a holistic assessment of the links between drought severity and the perceived levels of drought severity, impacts, preparedness and management for two consecutive drought events. We highlight challenges for drought risk planning and management in a changing climate at the local level and elaborate on how improved understanding of local practitioners to plan for climate change adaptation can be achieved.

How to cite: Teutschbein, C., Albrecht, F., Blicharska, M., Tootoonchi, F., Stenfors, E., and Grabs, T.: Drought hazards and stakeholder perception: Unraveling the interlinkages between drought severity, perceived impacts, preparedness and management, EGU General Assembly 2023, Vienna, Austria, 23–28 Apr 2023, EGU23-15402, https://doi.org/10.5194/egusphere-egu23-15402, 2023.

EGU23-17566 | ECS | Orals | NH9.17

Drought effects on inland water transport and impacts on local communities of the Amazon Basin 

Leticia Santos De Lima, Evandro Landulfo Teixeira Paradela Cunha, Paula Rossana Dório Anastácio, Mariane Stéfany Resende Menezes, Ana Carolina Pires Pereira, Marina Marcela de Paula Kolanski, and Marcia Nunes Macedo

Keywords: Hydrological drought; inland water transport; sensitivity; local communities; climate extremes; climate change

The Amazon River Basin has long been under threat due to climate change. Hydroclimatic records show an increase in both the duration and intensity of recent droughts (e.g., 2005 and 2010) and projections indicate a higher frequency of weather extremes such as droughts and floods in the future. Droughts change river conditions, hence impacting navigation via small and mid-size vessels. Impacts include the total or partial isolation of entire rural communities for weeks or months. With this work we aim to partially answer the following research questions: how have hydrological droughts affected inland water transport in the Amazon basin in recent decades? What were the impacts on local communities associated with constrained accessibility in the region? For that, we used a collection of articles for the period of 2000-2020 from digital media outlets, that is: magazines, newspapers, and other news sources that regularly public their content on the web. The digital media data collection was performed using Google Search engine. To collect the results, we employed the software platform Apify. We set the scraper to return search results for the queries “Amazon”, “drought”, “navigability”; and “Amazon”, “drought”, “isolated” (in Portuguese). News collected from digital media outlets were listed in a spreadsheet and manually processed. We adopted a sequency of exclusion criteria to filter results and produced a table of results with each statement, that is, a text extract from the media items. One digital media news piece can have more than one statement, and whenever that was the case, they were treated separately. We adopted a categorization scheme based on the economic activities/sectors affected by the droughts.

After applying exclusion criteria, the digital media database returned 145 unique entries of statements reporting effects of droughts and/or direct impact on communities from a total of 71 digital media items. Among the 145 unique entries, 119 statements reported impacts of droughts on the lives of local communities. The years of 2005, 2009-2010, 2015-2016 were the most expressive in terms of the number of media pieces reporting effects of droughts according to our analysis. However, localized drier conditions were also registered via media outlets in other years such as 2013, 2018, 2019 and 2020. October was the month with the highest number of news pieces reporting droughts (n = 19), followed by September (n = 15), and August (n = 11). Inland water transport became deeply affected, as reflected by the 97 statements (66.9%). In total, there were 31 statements (21.4%) mentioning impacts on the food supply chain, including wholesale food trade, food retail, grain trade. Logistic issues due to low water levels increased food prices. Impacts on fuel supply were mentioned in 21 statements (14.5%), including impacts on wholesale trade and automotive fuel retail market. Electric power generation and/or distribution were mentioned 6 times in the statements. Due to isolation of communities, many services became affected, such as medical care, access to schools, leisure activities, post service, immunization and pest control.

How to cite: Santos De Lima, L., Teixeira Paradela Cunha, E. L., Dório Anastácio, P. R., Resende Menezes, M. S., Pires Pereira, A. C., de Paula Kolanski, M. M., and Nunes Macedo, M.: Drought effects on inland water transport and impacts on local communities of the Amazon Basin, EGU General Assembly 2023, Vienna, Austria, 23–28 Apr 2023, EGU23-17566, https://doi.org/10.5194/egusphere-egu23-17566, 2023.

EGU23-495 | ECS | Orals | ERE2.6 | Highlight

Comparison of optimization approaches for the well placement of groundwater heat pumps 

Smajil Halilovic, Fabian Böttcher, Kai Zosseder, and Thomas Hamacher

Groundwater heat pumps (GWHP) use the thermal energy stored in groundwater. Therefore, GWHP systems extract groundwater via extraction wells and, after heat exchange, return it to the same aquifer via injection wells. The returned water has a lower temperature than the pumped water since the GWHP extracts heat for domestic heating. This causes the development of so-called thermal plumes in the aquifer. The thermal plume dissipates downstream according to the local groundwater flow direction and can reach the extraction wells of neighboring systems. Depending on their mode of operation, this altered water can significantly reduce their efficiency. To ensure optimal use of geothermal potential, such negative interactions between neighboring systems must be avoided and are legally constrained to a maximum temperature change of 1K in downstream extraction wells. One way to avoid the negative interactions and to maximize the spatial utilization is the optimal placement of GWHPs and their wells. In addition, the optimal placement of wells is important within a system to avoid significant thermal recycling. To determine the optimal placement of wells, estimations of thermal plumes are required. These calculations can be performed using analytical or numerical (PDE-based) models.

In this contribution, we compare two different optimization approaches for the placement of GWHP wells. The first approach is based on the linear advective heat transport model (LAHM), which is an analytical model, and integer linear programming. The second approach is based on numerical simulation of groundwater flow and heat transport and the adjoint optimization method. We first present these two recently developed optimization approaches and then analyze their potential applications (optimal management of the geothermal resource, optimal system design, urban energy planning, etc.), limitations, and future possibilities. We use real case studies to analyze and compare the approaches.

How to cite: Halilovic, S., Böttcher, F., Zosseder, K., and Hamacher, T.: Comparison of optimization approaches for the well placement of groundwater heat pumps, EGU General Assembly 2023, Vienna, Austria, 23–28 Apr 2023, EGU23-495, https://doi.org/10.5194/egusphere-egu23-495, 2023.

This study presents the performance evaluation of ATES-GSHP system based on long term monitoring since 2016. It consists of two office buildings with a combined net heated floor area of 18000 m2. ATES-GSHP system is in operation since 2016. The aim evaluate the performance as well as propose KPIs that take into account both the building HVAC system and ATES long term sustainable operation. 
The system is equipped with comprehensive instrumentation in HAVC system, heatpumps and aquifer including a unique and continuous installation of high resolution distributed temperature sensing using fiber optic cables throughout the aquifer.

The system is connected to district heating and has two heat pumps with a total nominal cooling and heating capacity of 1.5 MW and 1.8MW. Allowable groundwater extraction and injection is 50 l/sec. with undisturbed groundwater temperature of 9.5 ◦C.  The monitoring period analyzed for the HVAC system is March 2019 - March 2020 (for ATES from March 2016- March 2020). For the year 2019/2020, the total heating load (including domestic hot water) and cooling load was 456 and 381 MWh respectively. The total average heating and cooling used from the ATES are 673 MWh and 743 MWh respectively during the first 3 annual storage cycles of operation. Over the first three storage cycles, the average injection and extraction temperatures in the warm and cold ATES sides range between 7.6◦C and 13.3◦C. The average temperature differences across the main heat exchanger for ATES are 4.5-2.8 K which is 4-5 degrees lower than the optimum value. The average thermal recovery efficiency over the first 3 storage cycles were 47 % and 60 % for warm and cold storages respectively. The seasonal performance factors SPF for the system ranged between 5-54 depending on the boundary levels 0, 1 and 2 according to Annex 52 boundary definition. Furthermore, it discusses possible improvements to be implemented regarding the system boundary definition and GSHP-ATES coupled operation. The data analysis indicated annual energy and hydraulic imbalances which results into undesirable thermal breakthrough between the warm and cold side of the aquifer. Despite having favorable conditions from aquifer point of view, this was mainly due to suboptimal operation of the building energy system which led to insufficient heat recovery from the warm side, and subsequently insufficient cold injection in the cold wells, despite the building heating demand and the available suitable temperatures in the ATES. The cause of the suboptimal operation is attributed to oversizing of the heat pumps. As a result, the heat pumps could not be operated during small-medium loads. Additionally, the limitations of currently used energy and thermal KPIs for ATES are discussed and additional thermal KPI named heat exchanger efficiency balance (βHEX) that connects and evaluate the optimum operational point of temperature differences from both the building and ATES prospective is proposed to contribute in providing more complete picture on the ATES-building interaction performance and highlights the losses in energy recovery from ATES are due to the subsurface processes or building energy system operation.

How to cite: Abuasbeh, M.: Long term performance monitoring and KPIs’ evaluation of Large Scale ATES-GSPH system: Case study in Stockholm, EGU General Assembly 2023, Vienna, Austria, 23–28 Apr 2023, EGU23-875, https://doi.org/10.5194/egusphere-egu23-875, 2023.

Ground-coupled heat pump systems can help reducing energy consumption and electrical peak power demand while contributing to reduce greenhouse gas emissions. A key element of these systems is the ground heat exchanger that links the mechanical equipments to the underground geological materials. Although most ground heat exchangers are composed of closed-loop wells, standing column wells (SCW) represent a transformative opportunity in dense urban areas where aquifer productivity is limited. Based on a decade of research conducted in the area of Montreal in Canada, this conference will illustrate the potential of SCWs, present the preliminary results of two demonstration projects, discuss the impact of hydrogeological and hydrogeochemichal conditions on system design and discuss some recent advances related to field testing and modeling of SCWs. The challenges that remain to be overcome will also be discussed.

How to cite: Pasquier, P.: Standing Column Wells: A transformative opportunity to provide heating to buildings in dense urban areas., EGU General Assembly 2023, Vienna, Austria, 23–28 Apr 2023, EGU23-1318, https://doi.org/10.5194/egusphere-egu23-1318, 2023.

EGU23-1781 | Orals | ERE2.6 | Highlight

Heat accumulation in shallow aquifers: managing a growing resource 

Peter Bayer, Guillaume Attard, Philipp Blum, Hannes Hemmerle, Barret L. Kurylyk, Kathrin Menberg, Maximilian Noethen, and Susanne Benz

Heat loss from buildings, infrastructure and enhanced heat flow from sealed surfaces increase the temperatures of shallow groundwater often more than global warming. A worldwide analysis of thousands of wells reveals that the temperature at every second location is higher than expected, and local anthropogenic heat sources that exist for decades contribute to subsurface waste heat accumulation down to a depth of around 100 m. At some places, such as in the city centre of Cologne, heating of groundwater by several degrees of Celsius appears to have even reached a maximum. Here, long-term temperature records reveal stabilizing thermal conditions in the shallow aquifer. This also means that the geothermal potential has increased significantly, possibly to a critical level for maximum stored heat in place. Still, the natural geothermal resources together with the artificially stored resources are often overlooked. In many regions, recycling only the energy lost to the subsurface could (1) fulfil a substantial part of the heat demand of buildings, and (2) increase the efficiency of heat pumps with a more favourable thermal regime during the heating period. This resource is growing.  On the global scale, by the end of this century nearly 75% of the heat demand could be covered by recycling the heat that accumulates in the subsurface from anthropogenic heat loss and in response to climate change. Especially in densely populated areas, continued heat accumulation mitigates the risk of overexploiting the geothermal potential of shallow aquifers. Sustainable thermal management of aquifers must integrate concepts of heat recycling to avoid long-term warming of groundwater. For this, integrated spatial planning is needed. Shallow geothermal systems such as groundwater heat-pump installations have to be spatially organized in urban districts to achieve optimal use of the geothermal resource. They can maintain controlled cooling of the groundwater while benefitting from enhanced waste heat flux. As an example, we discuss the thermal interference of urban infrastructure and geothermal wells for the city of Lyon, which are spatially arranged based on hydraulic and thermal criteria to benefit from urban groundwater heating.

How to cite: Bayer, P., Attard, G., Blum, P., Hemmerle, H., Kurylyk, B. L., Menberg, K., Noethen, M., and Benz, S.: Heat accumulation in shallow aquifers: managing a growing resource, EGU General Assembly 2023, Vienna, Austria, 23–28 Apr 2023, EGU23-1781, https://doi.org/10.5194/egusphere-egu23-1781, 2023.

EGU23-2940 | Posters on site | ERE2.6

Borehole Heat Exchangers: a potential trigger for aquifer cross-contamination? 

Alessandro Casasso, Natalia Ferrantello, Simone Pescarmona, and Rajandrea Sethi

The number of Ground Source Heat Pumps (GSHPs) has been growing steadily in the last 20 years, and so has the number of Borehole Heat Exchangers (BHEs), which perform the heat exchange between the ground and the heat pump. BHEs are generally about 100 m deep and, hence, they can cross different aquifers. Concerns have been raised about the possible preferential flow of contaminants that can occur through boreholes, also known as cross-contamination. The strength of such phenomenon depends on the vertical hydraulic gradient between the aquifers and the hydraulic conductivity of the grout filling. Therefore, we developed a numerical flow and solute transport model in severe conditions to assess to which extent a BHE can induce cross-contamination between a shallow contaminated aquifer and a deep uncontaminated one, separated by an aquiclude. The results show that the leakage flow and the contaminant spatial distribution in the deep aquifer are well reproduced with analytical formulae, which can therefore be used to assess the potential impact of cross-contamination. Results also confirm that the geothermal grouts available in the market, with hydraulic conductivities well below 10-6 m/s, guarantee a sufficient protection from preferential flow through borehole heat exchangers.

How to cite: Casasso, A., Ferrantello, N., Pescarmona, S., and Sethi, R.: Borehole Heat Exchangers: a potential trigger for aquifer cross-contamination?, EGU General Assembly 2023, Vienna, Austria, 23–28 Apr 2023, EGU23-2940, https://doi.org/10.5194/egusphere-egu23-2940, 2023.

EGU23-5558 | ECS | Orals | ERE2.6

High-Resolution Spatiotemporal Monitoring Data During Groundwater Heat Pump System Operation 

Ji-Young Baek, Hae-Rim Oh, Seung-Wook Ha, and Kang-Kun Lee

Sustainability is one of the points in the design stage of the groundwater heat pump (GWHP) system. Thermal impacts on the surrounding environments should be accurately configured to ensure system sustainability. To achieve that goal, a sophisticated characterization of the target aquifer is required. So far, considering heterogeneity of subsurface environment in system design is challenging because there is lack of case studies provided high-resolution monitoring data enough to catch the heterogeneity. In this study, to detect the hydraulic and thermal responses to the GWHP operation, 12 monitoring wells were densely constructed between two geothermal wells at Eum-Seong, Republic of Korea. During the system operation, the high-resolution spatiotemporal changes in hydraulic pressure and temperature were detected by pressure sensors and fiber optic-distributed temperature sensing (FO-DTS). Monitored results were interpreted by time-series analysis to derive the thermal front velocity between monitoring wells. During the GWHP system operation, groundwater level monitoring results showed that a dynamic flow condition was generated especially near the geothermal wells up to 20 times of background flow. The estimated effective thermal velocities were comparable with the theoretically calculated velocities, but the higher velocity randomly appeared at the specific depths. From this case study, we confirmed FO-DTS was applicable to monitor the GWHP system. Those three-dimensional high-resolution monitoring data enabled to prove the existence of horizontal and vertical heterogeneity, indicating the need for accurate characterization of aquifer properties.


Acknowledgements

This work was supported by the National Research Foundation of Korea (NRF) grant funded by the Korea government (MSIP) (No. 2022R1A2C1006696). This work was also supported by the National Research Foundation of Korea (NRF) grant funded by the Korea government(MSIT) (No. 2022R1A5A1085103).


How to cite: Baek, J.-Y., Oh, H.-R., Ha, S.-W., and Lee, K.-K.: High-Resolution Spatiotemporal Monitoring Data During Groundwater Heat Pump System Operation, EGU General Assembly 2023, Vienna, Austria, 23–28 Apr 2023, EGU23-5558, https://doi.org/10.5194/egusphere-egu23-5558, 2023.

EGU23-5989 | ECS | Orals | ERE2.6

Monitoring responses to mine water geothermal use in a highly characterised and instrumented groundwater system 

Andres Gonzalez Quiros, David Boon, Donald John MacAllister, Alan MacDonald, Barbara Palumbo-Roe, Brighid Ó Dochartaigh, Kyle Walker-Verkuil, and Alison Monaghan

Mine water geothermal has great potential to provide low carbon heating, cooling and energy storage. Some successful examples have shown that a flooded mine is a reliable, low carbon heat source and could contribute to a new green energy future for many European post-mining regions. To date, however, this potential has been hindered by scientific and technical challenges that have resulted in delay, cost overrun, or even abandonment of some mine water geothermal projects. Key sources of uncertainty that present challenges for developers, operators and regulators are groundwater flow behaviour and temperature distribution in abandoned mines under abstraction/reinjection cycles, the long-term sustainability of the geothermal system, and its interactions and impacts in the surrounding environment. 

The UK Geoenergy Observatory (UKGEOS) in Glasgow, Scotland, is an at-scale research facility with exceptional levels of hydrogeological and thermal characterisation and downhole instrumentation designed to monitor and quantify subsurface change and provide data to address challenges and risks associated with mine water geothermal systems design and operation. The Observatory includes four mine water boreholes connected in an open loop configuration with pumps for abstraction/reinjection, a heat pump-chiller and three different heat exchangers to enable testing of multiple modes of heat pump operation (heating and cooling) and component performance. A further two boreholes intercepting mine workings are equipped with downhole electrical resistivity tomography (ERT) and hybrid fibre-optic cables for distributed temperature sensing (Passive and Active DTS). Together with five environmental monitoring boreholes, a seismic monitoring borehole and ten hydrogeological downhole data loggers for continuous pressure, temperature, and electrical conductivity monitoring, the dedicated Observatory, which is not connected to any customers, is well equipped to examine the interaction and impacts of geothermal energy systems.

In this work we present a comprehensive set of initial hydrogeological and thermal observations collected during the construction and commissioning stages of the Observatory, including long term baseline monitoring, results of initial well pumping and heat abstraction/reinjection tests. These observations include evidence for the general groundwater flow circulation in the system, groundwater level response to recharge events, different transmissivities in different mined zones, and limited connectivity between mine workings at different depths, the surrounding aquifers and the River Clyde. We have integrated hydrogeological, thermal, and other information to develop an initial conceptual hydrogeological model of the system. Using the conceptual model and field data we have developed flow and heat numerical models to evaluate alternative scenarios of heating and cooling. Modelling results indicate variable flow paths and response times for thermal breakthrough for different geothermal operational configurations. Academic and commercial researchers are encouraged to get in touch to discuss using the Observatory’s unique capability for future mine water geothermal energy investigations, including investigating the behaviour, sustainability and impacts of groundwater flow and temperature under geothermal abstraction/reinjection cycles. 

How to cite: Gonzalez Quiros, A., Boon, D., MacAllister, D. J., MacDonald, A., Palumbo-Roe, B., Ó Dochartaigh, B., Walker-Verkuil, K., and Monaghan, A.: Monitoring responses to mine water geothermal use in a highly characterised and instrumented groundwater system, EGU General Assembly 2023, Vienna, Austria, 23–28 Apr 2023, EGU23-5989, https://doi.org/10.5194/egusphere-egu23-5989, 2023.

EGU23-10285 | ECS | Posters on site | ERE2.6

Groundwater mixing and pollution induced by the geothermal system operations in shallow groundwater 

Jaeyeon Kim, Jiyoung Baek, Hye-na Ko, Dugin Kaown, Haerim Oh, and Kang-Kun Lee

Groundwater, one of the environmental tools to achieve carbon neutrality, can be a sustainable thermal resource for a geothermal system. This study aims to investigate the groundwater system characteristics related to the thermal use of groundwater from the view of groundwater mixing and pollution for sustainable water resource management. Investigations have been conducted using hydrogeochemistry, multiple isotopes (O, H, Sr, and Rn), and microbial community structure data, around an open loop groundwater heat pump (GWHP) system. Continuous data of groundwater level and temperature showed the thermal plume propagation characteristics depending on the system operations. Multiple isotopes also revealed the specific characteristics accompanying the thermal use of groundwater. Especially, radon tracer quantitatively showed that the horizontal and vertical mixing occurred along main groundwater flow direction by mixing ratio calculations. In contrast, the clogging effects were observed in the wells located near the main flow direction by PHREEQC geochemical modeling and microbial diversity data, suggesting intensive management in these wells. A lot of time for recovery is needed in these wells. Overall results confirmed that combined analysis of hydrogeochemistry, multiple isotopes, and microbial community structure data can be effectively used to identify the impacts of geothermal system on shallow groundwater and to suggest effective management plan.

How to cite: Kim, J., Baek, J., Ko, H., Kaown, D., Oh, H., and Lee, K.-K.: Groundwater mixing and pollution induced by the geothermal system operations in shallow groundwater, EGU General Assembly 2023, Vienna, Austria, 23–28 Apr 2023, EGU23-10285, https://doi.org/10.5194/egusphere-egu23-10285, 2023.

EGU23-12110 | ECS | Orals | ERE2.6

City-wide groundwater temperature profiles reveal underground urban heat islands in Vienna 

Cornelia Steiner, Christian Griebler, Eva Kaminsky, Constanze Englisch, Christine Stumpp, and Gregor Goetzl

Summer periods of warm weather become longer and hotter causing “Urban Heat Islands” in large cities. Rising temperatures do not stop at the surface, but migrate into the underground, where infrastructure – such as sewage and district heating systems, buildings and shallow geothermal energy systems for cooling – amplifies the increase of groundwater temperatures. In order to be able to quantify this ongoing process and predict future temperature developments, a sound data basis is necessary. As of now, only groundwater temperature measurements have been available for different depth (one-point or multiple depth measurements) and time intervals (varying from two weeks to months) at a limited number of wells within the shallow urban aquifers in Vienna. To increase the spatial information content, the goal of this study was to measure groundwater temperature and level within the urban shallow aquifers of Vienna in two extensive field campaigns for more than 800 wells and to analyze those data statistically

To document the warmest and coldest conditions, measurements took place in one week each in October (2021) and April (2022). In total, groundwater temperatures in 1 m depth intervals and groundwater level were measured at 812 locations. Out of these ones, at 150 wells, water temperature was measured in pumped water. The average value of the profile equals best the pumped groundwater and thus represents the average aquifer temperature. According to our data analysis, the groundwater temperatures in Vienna vary between 6.9 °C and 30.6 °C. The highest temperatures were detected in close proximity to possible heat sources and a rapid drop in temperature with increasing distance could be demonstrated.

Based on the collected data, temperature maps for both measurement dates and for different depth-intervals were derived, and display the underground urban heat islands in Vienna. The temperature maps enable the estimation of the potential for sustainable heating and cooling with groundwater in the capital of Austria.

Together with historic long-term temperature data, trend analyses will be performed to allow a prognosis of thermal changes in the groundwater. The results, together with an extensive analysis of the groundwater chemistry and ecology, will feed into the development of a catalogue of measures for authorities and policymakers. Intention of the included recommendations is to counteract further groundwater warming and to ensure an efficient and sustainable use of groundwater for heating and cooling. The guidelines will therefore not only contribute to cooling the groundwater, but also to decarbonize the heating and cooling supply of Vienna.

How to cite: Steiner, C., Griebler, C., Kaminsky, E., Englisch, C., Stumpp, C., and Goetzl, G.: City-wide groundwater temperature profiles reveal underground urban heat islands in Vienna, EGU General Assembly 2023, Vienna, Austria, 23–28 Apr 2023, EGU23-12110, https://doi.org/10.5194/egusphere-egu23-12110, 2023.

EGU23-12148 | ECS | Posters on site | ERE2.6

Investigating the impact of different ground sealing types upon shallow subsurface temperatures 

Nele Hastreiter and Thomas Vienken

The monitoring of soil and groundwater temperatures is usually performed to estimate the environmental and economical sustainability of large scale shallow geothermal installations. The difference between the measured up- and downstream temperatures is mostly attributed to the impact of the shallow geothermal usage. However, especially in densely settled urban areas there are multiple other potential impacts on the subsurface temperature regime. The individual drivers are hard to distinguish and therefore mostly not considered when temperature monitoring data is evaluated.

In the presented study empirical temperature data in varying depths up to three meters has been collected below typical kinds of ground sealing in the urban environment, such as tarmac, different types of gravel and lawn. For that purpose, test sites have been installed artificially at a similar time and location. After a measurement period of 18 months, first results reveal clear effects on the very surface near underground temperatures. In a depth of 5 cm, measured temperatures show differences up to 8 K between different types of ground sealing. Depending on the degree and type of the ground sealing, temperature differences are measurable up to a depth of one meter.

The obtained data advance knowledge to quantify the impacts of different ground sealing types on underground and groundwater temperatures in urban areas. Furthermore, it contributes to a more reliable assessment of temperature monitoring data in the context of shallow geothermal applications as the effect of ground sealing on measured temperatures may be considered.

How to cite: Hastreiter, N. and Vienken, T.: Investigating the impact of different ground sealing types upon shallow subsurface temperatures, EGU General Assembly 2023, Vienna, Austria, 23–28 Apr 2023, EGU23-12148, https://doi.org/10.5194/egusphere-egu23-12148, 2023.

In 2013 we started a spatial and temporal high-resolution groundwater temperature monitoring campaign at a residential neighborhood under intensive shallow geothermal energy use in the western outskirts of the city of Cologne, Germany. The monitoring was conducted with the aim to identify effects of the intensive thermal use upon groundwater temperatures. Although individual systems sizes in the neighborhood are small, the installed 47 borehole heat exchanger systems sum up to a total borehole heat exchanger length of 11,009 m within a confined area of 0,12 km2 to satisfy, together with three open systems, a total heat demand of 506 kW.

With almost ten years of groundwater temperature monitoring we created a valuable data set. Our results show a reduction of overall groundwater temperatures when comparing upstream and downstream groundwater temperatures during the first years of geothermal operation as an effect of the intensive use of shallow geothermal energy for heating and warm water provision. However, monitoring results depend on the measurement location in our study and it is known that urban subsurface and groundwater temperatures are influenced by several factors. In this contribution, the monitoring concept, results as well as pitfalls of the monitoring campaign are illustrated on our way to untangle urban groundwater temperature changes as a response to the intensive shallow geothermal energy use.

How to cite: Vienken, T.: Ten years of groundwater temperature monitoring at a residential neighborhood under intensive shallow geothermal energy use – insights and lessons learned, EGU General Assembly 2023, Vienna, Austria, 23–28 Apr 2023, EGU23-13777, https://doi.org/10.5194/egusphere-egu23-13777, 2023.

EGU23-15158 | ECS | Posters on site | ERE2.6

The key to previous hydrogeological knowledge when determining the best solution in shallow geothermal systems. The case of a karstic aquifer in the city of Girona (Catalonia, NE Spain). 

Ignasi Herms, Georgina Arnó, Marta Picó, Jordi Ferrer, Victor Camps, and Montse Colomer

The European energy market must move quickly to achieve the decarbonization objectives of the economy in 2030-2050, including the domestic and tertiary sectors. In this context, the market for Surface Geothermal Energy (SGE) is growing rapidly due to its applicability in almost any geological and climatic conditions. The area of city of Girona (Catalonia, NE of Spain), is one of the urban areas in Catalonia where the SGE is progressing more rapidly, but is mainly focused on closed-loop (CL) geothermal heat pump systems despite the existing potential in the area for open-loop systems (OL). The urban area of Girona sits on Paleozoic rocks followed by Paleogene series with limestones, sandstones, and marls, configuring a Neogene basin full filled by continental alluvial deposits and Quaternary fluvial sediments, whose aquifers are being mainly used for water supply. Within the Paleogene series, there is the fractured and karstified Girona limestone aquifer (GLA). These materials outcrop in the upper part of the city and dip to the West, positioning themselves below the Neogene basin. The groundwater temperature in the karst aquifer ranges between 14ºC and 15ºC and the average annual temperature in the urban area of Girona is 14.7ºC. This contribution will present a case of a shallow geothermal installation for heating and cooling spaces for a private leisure building with a demand of 33 kWt whose initial solution was proposed with a classical CL system with about 7 BHE 100m depth. The initial project was carried out without conducting any prior hydrogeological assessment or conducting any preliminary drilling investigation to execute a TRT which could have been useful in verifying the issues that were later encountered. The implementation of the drilling campaign during works made it possible to verify the difficulty of drilling the fractured and karstic limestone aquifer and cementing its annulus for the installation of the geothermal single-U probes. The emergency solution taken directly on site - and indeed the most suitable, economical, and efficient solution considering the hydrogeological settings of the site- was to drastically change the chosen solution (CL) for an OL system and drill groundwater wells. Finally, a triplet of wells 20, 30, and 70m deep was executed (two injection and one production well) and a water well test was done and interpreted to acquire the corresponding permits. The case shows that having prior hydrogeological knowledge is essential when choosing the best solution for the client.

How to cite: Herms, I., Arnó, G., Picó, M., Ferrer, J., Camps, V., and Colomer, M.: The key to previous hydrogeological knowledge when determining the best solution in shallow geothermal systems. The case of a karstic aquifer in the city of Girona (Catalonia, NE Spain)., EGU General Assembly 2023, Vienna, Austria, 23–28 Apr 2023, EGU23-15158, https://doi.org/10.5194/egusphere-egu23-15158, 2023.

EGU23-15422 | ECS | Posters on site | ERE2.6

A surrogate model to investigate the geothermal potential with variable groundwater flow velocity 

Alberto Previati, Valerio Silvestri, Alberto Presta Asciutto, Paolo Frattini, and Giovanni Crosta

Many cities worldwide extend upon alluvial aquifers which have a great potential for low temperature geothermal installations. Typically, the geothermal potential describes the ability to exchange heat with the subsurface and the relative sustainability.

To estimate the geothermal potential of shallow aquifers many techniques have been adopted such as analytical solutions and numerical methods considering aquifer thermal parameters (e.g. porosity, thermal diffusivity) and the system configuration (e.g. diameter of pipes, borehole thermal resistance). Analytical methods are typically fast and easy to implement in a GIS environment but commonly neglect the effects of groundwater advection on heat transfer mechanisms. On the other hand, physically based numerical methods can handle conductive and advective transport and complex 3D geometries but have the limitation of domain size/resolution that makes modeling unfeasible at scales greater than city districts or cities.

Hence, a new solution based on a surrogate model is presented to estimate the geothermal potential of aquifers at large scale covering a great variability of Darcy flow velocity. The model is based on the response of a synthetic transient-state 3D FEM model reproducing the infinite line source (ILS) configuration. The simulated thermal perturbation over a representative volume at different time stages was then used to calculate the thermal resistance of the aquifer and the corresponding (energy replenishment) potential combining the most relevant variables that affect the heat transport in porous media: thermal conductivity, specific heat capacity, saturation, porosity and flow velocity.

Then, a machine learning regression-based surrogate model was generated by fitting the calculated response (thermal potential) for all possible combinations of input variables. The proposed model well replicates the ASHRAE analytical solution which is based on the ILS method for no groundwater flow, and goes beyond including the effects of thermal transport by groundwater.

Finally, the model response was implemented in a GIS to obtain large scale geothermal potential maps in areas with highly variable groundwater flow velocity (between 10-5 to 10 m/d) highlighting an expected increase of the geothermal potential due to the advective transport. Field experiments are necessary to verify the numerical findings aiming to reconsider the commonly adopted temperature delta thresholds in areas where the energy replenishment potential is high due to groundwater advection.

How to cite: Previati, A., Silvestri, V., Presta Asciutto, A., Frattini, P., and Crosta, G.: A surrogate model to investigate the geothermal potential with variable groundwater flow velocity, EGU General Assembly 2023, Vienna, Austria, 23–28 Apr 2023, EGU23-15422, https://doi.org/10.5194/egusphere-egu23-15422, 2023.

EGU23-16094 | ECS | Posters on site | ERE2.6

Possible effects of shallow geothermal systems installed at coastal zones 

Rotman Criollo Manjarrez, Víctor Vilarrasa, Alejandro Orfila, and Angels Fernández-Mora

Coastal areas are more densely populated than inland areas and present faster rates of population increase and urbanization. This trend is expected to continue in the coming decades, and thus, the demand of natural resources in coastal areas, such as water and energy resources, increasing the pressure and impact on the environment, superposed to the effects of climate change. Currently, in Europe, the demand for heating in buildings and businesses outnumbers the demand for cooling. However, the latter is gradually catching up due to rising demand for air cooling or refrigeration for industry such as food, technological and medical supplies. The energy required to cool buildings in Europe is expected to increase by more than 70% by 2030, while energy used to heat buildings may decrease by 30% (UE, 2018). Low Temperature Geothermal Energy (LTGE) is most likely the green energy production method for heating and cooling with the highest potential to provide affordable and clean energy and meet the CO2-emissions reduction goals of the Green Deal. Despite advances on LTGE technologies, the efficiency of these systems remains inherently sensitive to changes in hydrodynamics and the media (e.g., changes in the groundwater thermal regime). Groundwater, on the other hand, is the world's largest freshwater resource, and it is especially important in coastal areas because interactions between aquifer systems and sea water may lead to salinization and resource loss. Because geothermal systems and coastal aquifers interact directly, specially at groundwater discharge areas, it is clear that a better understanding of the potential interactions of geothermal systems with current and prospective coastal aquifer processes is essential for their design and foreseeing potential environmental effects. To address these issues, we model variable-density groundwater coupled with heat transport to simulate the long-term evolution of groundwater salinity and aquifer thermal energy discharge. We find that the heating/cooling-induced water density variations affect the seawater intrusion. Understanding the behavior of the groundwater system is required to ensure sustainable water, energy, and coastal ecosystem management.

How to cite: Criollo Manjarrez, R., Vilarrasa, V., Orfila, A., and Fernández-Mora, A.: Possible effects of shallow geothermal systems installed at coastal zones, EGU General Assembly 2023, Vienna, Austria, 23–28 Apr 2023, EGU23-16094, https://doi.org/10.5194/egusphere-egu23-16094, 2023.

EGU23-16562 | ECS | Orals | ERE2.6 | Highlight

Experimental Investigation of Groundwater Heat Pump Usage for District Heating and Cooling 

Taha Sezer, Abubakar Kawuwa Sani, Liang Cui, and Rao Martand Singh

Nearly half of Europe’s total energy consumption is dedicated to buildings. Heating and cooling consist of a significant part of this consumption. Groundwater heat pumps (GWHPs) are highly efficient, environmentally friendly and low-carbon technology that can supply heating and cooling to buildings on small to large scale. Northern Gateway Heat Network is an ongoing project based on GWHP, located in Colchester, UK. The planned project will probably be the largest GWHP system using the confined chalk aquifer to date. It will provide district heating and domestic hot water to healthcare buildings, around 300 dwellings, and offices. The system is designed as part-load to cover 75% of the annual heating demand of the planned development with an 800 kW output heat pump which will benefit from the open-loop groundwater extracted at around 12.5°C.

A laboratory-scale sandbox model having external dimensions of 1.178 m × 0.721 m × 0.715 m (L × W × H) with two acrylic tubes acting as injection and abstraction wells was built to investigate the impact of GWHP operation on the system performance and sustainability. The setup was designed to perform different groundwater flow rates by changing the water levels in the hydraulic head tanks on the left and right sides of the sandbox. Several experiments were conducted considering different scenarios: heating, cooling, heating and cooling, and thermal energy storage to examine their impact on thermal plume development and system performance. The study also aims at investigating the effects of groundwater flow velocity, injection and abstraction rates on thermal plume development.

The experimental results show that the thermal plume reaches the abstraction well in each scenario, causing a change in the abstraction temperature. This phenomenon, called thermal recycling, reduces the thermal energy abstraction from the groundwater. The results also illustrate that groundwater flow velocity, injection, and abstraction rates significantly impact thermal plume development. Higher injection and abstraction rates create a larger thermal plume. However, groundwater flow prevents heat development around the well by dispersing the heat in the groundwater flow direction. The results show that it is important to consider groundwater flow velocity, injection and abstraction rate when designing a GWHP system. The distance between injection and abstraction wells is another significant parameter that should be carefully considered. However, it could not be investigated in the current study as the sandbox model was not suitable for changing the distance between injection and abstraction well. Further studies need to be carried out using large-scale field test and/or numerical simulations.

How to cite: Sezer, T., Sani, A. K., Cui, L., and Singh, R. M.: Experimental Investigation of Groundwater Heat Pump Usage for District Heating and Cooling, EGU General Assembly 2023, Vienna, Austria, 23–28 Apr 2023, EGU23-16562, https://doi.org/10.5194/egusphere-egu23-16562, 2023.

EGU23-17433 | ECS | Orals | ERE2.6

Thermohydrochemical Model to Identify the Impact of Bleed Flow on Calcite Scaling in a Standing Column Well 

Léo Cerclet, Benoît Courcelles, and Philippe Pasquier

The interest towards standing column well (SCW) is increasing due to their higher thermal efficiency and a lower initial construction cost compared to conventional vertical ground heat exchangers. The SCW pumps and reinjects the groundwater inside the same well. They are usually coupled with an injected well to discharge a portion of the pumped groundwater, an operation called “bleed”, to increase punctually the thermal capacity of the system. Since groundwater is the heat carrier fluid, clogging issues can develop if detrimental conditions are locally present. The most common issue for hard water is calcite scaling. The impact of SCW on calcite precipitation had already been studied with a thermohydrochemical model and field experiments. However, it still lacks a reactive thermohydrochemical model calibrated with field acquired data. Once calibrated, this model could help defining the best strategy to avoid calcite precipitation.
A full-scale SCW was operated with a geothermal mobile laboratory for 70 consecutive days. A fractured zone intersects the SCW close to the surface. The operation corresponded to a heat injection with different flow rate sequences. In addition, a groundwater treatment unit installed in the laboratory was used to test different treatment sequences. During this experiment, 20 groundwater samples were collected and analyzed. Those analyses focused on the physico-chemical parameters and the major ions. A reactive thermohydrochermical model was developed in the Comsol Multiphysics environment. This model includes a complex geometry, groundwater flow, heat transfer, and reactive solute transport. The reactive solute transport is composed of two parts; the transport and kinetics model for three primary species and the chemical equilibrium of nine secondary species of calcite reaction. The calibration is achieved by imposing operational parameters as input variables for hydraulic and thermal model as well as the initial concentration.
The calibration identified the presence of CO2 degassing. The parameter with more influence on ion calcium concentration is bleed flow. In fact, bleed operation generates a groundwater flow of native groundwater toward the SCW. During this operation, the fracture contributed up to 33 % of the total calcium flux coming to the SCW. This flux is a convective flux. The concentration of total calcium transported by the fracture is closed to the initial concentration. As a consequence, the ion calcium concentration stabilized near the initial state. Thus, the groundwater treatment performance is minimized. The saturated index of the calcite is above zero. On the opposite side, when bleed is not activated, the groundwater is recycled is the SCW. As a results, the treatment unit is responsible of the observed decreases of the ion calcium concentration. The saturated index decreases below zero after five days. Also, when the total calcium concentration decreases in the SCW, a diffusive flux emerged into the fracture.
In conclusion, this study highlights the alteration of the solute transport as a function of the bleed operation. The type of flux depends on bleed and the treatment. In addition, the treatment of groundwater is unnecessary when bleed is activated.

How to cite: Cerclet, L., Courcelles, B., and Pasquier, P.: Thermohydrochemical Model to Identify the Impact of Bleed Flow on Calcite Scaling in a Standing Column Well, EGU General Assembly 2023, Vienna, Austria, 23–28 Apr 2023, EGU23-17433, https://doi.org/10.5194/egusphere-egu23-17433, 2023.

EGU23-388 | ECS | Orals | SSS9.10 | Highlight

Macroscopic root water uptake modelling using High-Throughput Screening (HTS) systems: Design and Validation 

Angela Puig Sirera, Lorenzo Bonzi, Fatma Hamouda, Andrea Sbrana, Damiano Remorini, Lorenzo Cotrozzi, and Giovanni Rallo

Climate change and intensive agriculture are responsible for the increasing frequency and intensity of abiotic stresses generating conditions of water scarcity. Currently, there is the need to select and release, in a short time, plants adaptable to the current and future environmental conditions and resistant to biotic and/or abiotic stress. This study presents the design and validation of a High-Throughput Screening (HTS) system for the continuous and simultaneous monitoring of the plant stress response to drought in a semi-controlled environment.

Structurally, the HTS-system is formed by three hardware segments to detect with high-frequency the agrometeorological variables (i.e., atmometry), the weights (i.e., gravimetry), and the soil water content (SWC) (i.e., time domain reflectometry, TDR) of sixteen pots in which the medicinal crop Salvia officinalis L (sage) was grown. Two irrigation treatments, one based on full irrigation and the second on soil water deficit conditions, were applied following a feedback control irrigation scheduling protocol, and an automated micro-irrigation system was designed to manage them.

The system was able to model the sage water stress function following the root water uptake (RWU) macroscopic approach. The threshold of soil water status below which crop water stress occurred was also identified. The gravimetric-based daily evapotranspiration (ETc act) and the time domain reflectometry (TDR) -based RWU rates showed a high correlation, which allowed validating the RWU indicators based on soil moisture sensors to estimate the ETc act fluxes.

Keywords. Agro-hydrological modelling, high-throughput systems; root water uptake; sage; water stress function

How to cite: Puig Sirera, A., Bonzi, L., Hamouda, F., Sbrana, A., Remorini, D., Cotrozzi, L., and Rallo, G.: Macroscopic root water uptake modelling using High-Throughput Screening (HTS) systems: Design and Validation, EGU General Assembly 2023, Vienna, Austria, 23–28 Apr 2023, EGU23-388, https://doi.org/10.5194/egusphere-egu23-388, 2023.

EGU23-389 | ECS | Posters on site | SSS9.10

Analysis of the Feasibility of a low-cost DAQ for EM-38Detection and Mapping 

Fatma Hamouda, Lorenzo Bonzi, Giuseppe Provenzano, Àngela Puig-Sirera, Andrea Sbrana, Damiano Remorini, and Giovanni Rallo

Abstract. The EM-38 is a Handheld Electrical Magnetic Induction (EMI) device, non-invasive and commonly used for monitoring salinity, mapping bulk soil properties, and evaluating soil nutrient status. The measured data is an electrical conductivity, [mS/m], which was referred to a representative soil volume of 1.0-1.5 m depth and 2.0 m width.

The Data AcQuisition (DAQ) system for EM-38 (Geonics Inc.) conductivity meter, used for recording the spatial variability of the soil bulk electrical conductivity (EC), is expensive, according to the proprietary software, and do not provide detailed, modifiable circuit schematics.

To address these issues, we developed an easy-to-use, modifiable, and inexpensive data acquisition (DAQ) system for EC data recording and spatializing. In particular, this work investigates the feasibility of using a low-cost open-source DAQ system to be installed on an EM-38 conductivity meter (Geonics Inc.). This DAQ system is based on Raspberry Pi and allows collecting speed and position of the EM-38 device by carrying it on a specific designed sled system.

The EM-38 data (± 200mV) were acquired by A/D converter 24 bit and GPS data ($GPGGA, $GPRMC [NMEA 0183]) were obtained by serial input RS232. The Data logger (Raspberry Pi 4) stored the acquired data and transferred it to the server using an internet connection (Router 4G). The control Firmware has been written in Python language. To ensure the accuracy and reliability of the collected data, the system has been evaluated and tested in well-known open-filed (CIRAAA-a reserch center of the University of Pisa), where the spatial variability of the main soil physical properties (i.e. soil texture, organic matter, electrical conductivity) are known.

The performance has been evaluated by comparing the data string with the one generated by a professional DAQ system. The latter includes a CR1000 data logger (Campbell Scientific) to control and store the EC data and integrats a GPS receiver (GPS16X-HVS, Garmin Inc.) which provides the position, velocity, and timing information.

First results allowed to approve the possibility to extract the analogical signal from the device, which is strongly responsive to the variation of the physical properties of the soil environment. Moreover, the device is able to estimate accurately the spatial patterns of the investigated soil physical properties.


Keywords: Precision farming, Zoning, EMI sensors, soil bulk electrical conductivity, open source DAQ

How to cite: Hamouda, F., Bonzi, L., Provenzano, G., Puig-Sirera, À., Sbrana, A., Remorini, D., and Rallo, G.: Analysis of the Feasibility of a low-cost DAQ for EM-38Detection and Mapping, EGU General Assembly 2023, Vienna, Austria, 23–28 Apr 2023, EGU23-389, https://doi.org/10.5194/egusphere-egu23-389, 2023.

EGU23-525 | ECS | Orals | SSS9.10 | Highlight

Using unmanned aircraft system to estimate crop water stress index in a citrus orchard under different irrigation systems 

Matteo Ippolito, Dario De Caro, and Giuseppe Provenzano

Optical and thermal sensors installed on Unmanned Aircraft Systems (UAS) can be considered a technological innovation for precision farming. The visible and thermal regions of the electromagnetic (EM) spectrum provide useful information to assess the quality of crop growth and monitor plant water status. Accurate measurements of plant water status with high-resolution thermal images associated with high-efficiency irrigation systems can be a suitable solution to improve energy and water saving.

The objective of this work was to estimate and compare the Crop Water Stress Index (CWSI) obtained in a citrus orchard irrigated with two different irrigation systems, by using a UAS equipped with a thermal camera.

The experiment was carried out in a commercial citrus orchard located in the Northwest of Sicily, Italy, during the irrigation season of 2022. Optical and thermal high-resolution images were acquired at noon on August 23 and 25, and September 2 over two plots, the first of which was irrigated with a subsurface drip irrigation (SDI) and the second with a micro-sprinkler (MSI). Hourly crop reference evapotranspiration, ETo, and Vapour Pressure Deficit (VPD) were calculated by using the weather variables measured by a standard weather station installed in the field, while the plant water status was monitored at an hourly time scale, through three microtensiometers (FloraPulse, Davis, CA) embedded into the woody tissue of trees considered representative of the two irrigation systems. For each thermal image, characterized by a thermal spatial resolution of 15 cm,  soil pixels were initially removed; then, the dry and wet reference temperatures, Tdry and Twet, were estimated as the 0.5 and 99.5 percentiles of the canopy temperature. The values of CWSI were finally calculated based on the maximum Tdry and minimum Twet obtained in the two plots during the examined days.

Vapor pressure deficit and crop reference evapotranspiration resulted in quite similar values in the three days, with hourly VPD and ETo at noon ranging between 1.49 and 1.65 kPa, and between 0.50 and 0.62 mm, respectively. Irrigation heights provided in the examined period resulted equal to 65 mm in a single application in the MSI plot and 48 mm, equally distributed in eight irrigation events, in the SDI plot. In the latter plot, the values of daily stem water potential ranged between -0.5 and -1.1 MPa during the entire period with values of the corresponding CWSI between 0.22 and 0.28; on the other hand, in the plot irrigated with the MSI system the values tended to decline to a daily range between -1.1 and -1.3 MPa as a consequence of the soil drying between consecutive waterings with values of CWSI ranging between 0.30 and 0.34. The analysis showed that both plots were characterized by low water stress levels. However, despite the lower irrigation volume supplied by the SDI system, the values of CWSI resulted always lower than those obtained under the MSI system, confirming the potential of the SDI system to improve water use efficiency. 

How to cite: Ippolito, M., De Caro, D., and Provenzano, G.: Using unmanned aircraft system to estimate crop water stress index in a citrus orchard under different irrigation systems, EGU General Assembly 2023, Vienna, Austria, 23–28 Apr 2023, EGU23-525, https://doi.org/10.5194/egusphere-egu23-525, 2023.

EGU23-3383 | Orals | SSS9.10 | Highlight

Towards improved TDR soil water sensing for optimizing irrigation water management 

Robert Schwartz, Hans Klopp, and Alfonso Domínguez

Decreasing water resources available for irrigation will require a thorough reconsideration of how water is allocated and managed for crop production. Electromagnetic (EM) soil water sensing is an important tool that can facilitate spatial and temporal allocation decisions to increase crop water productivity. Accuracy of volumetric water content measurements in the field, however, is problematic with EM sensors, especially in soils with high clay contents and pronounced horizonation. Under many circumstances, measurement uncertainties are large compared with the range of managed allowed depletion. Soil specific calibrations can improve accuracy although the procedures required to achieve this are normally impractical for routine field deployment of sensors. Herein we present our current efforts in improving the accuracy of TDR soil water sensing and their utility in irrigation management, especially under conditions of limited water availability.

Earlier work using a quasi-theoretical model to describe the complex permittivity of soil demonstrated that bound water near clay surfaces and high frequency filtering of the broadband signal were major sources of error for TDR water content estimation. The specific surface area of the soil is partly responsible for these effects, which can also vary in the field because of the dependency of volumetric bound water on bulk density. Although theory can describe how soil apparent permittivity changes with respect specific surface area and bulk electrical conductivity; this does not necessarily reflect how these properties influence the measured travel time. Bound water polarization and dc losses result in signal attenuation of the high frequency components thereby increasing travel time greater than that expected from changes in apparent permittivity.

To circumvent these difficulties, we are currently using a supervised machine learning approach to develop an empirical soil water content calibration based on measured travel time, measured state properties (temperature and bulk electrical conductivity), and inferred properties based on TDR waveform features (specific surface area). For example, at a given water content, the shape of the waveform reflection for a soil dominated by kaolinite is distinct from the reflection of a soil dominated by 2:1 phyllosilicates. Essentially the bulk density x specific surface area modifies the waveform features which in turn can be used to develop in essence an in-situ soil specific calibration.

Introduction of measured soil water contents into crop models provides a way to facilitate real-time yield predictions of alternative water allocation decisions. The Richards Equation will necessarily be incorporated into crop models to permit a mechanistic basis of redistributing soil water in the profile. Soil water sensing can permit the accurate determination of both irrigation application efficiency and infiltration. Incorporation of measured soil water into crop models allows for “course corrections” of simulated profile water and potentially improvements in the estimation of evapotranspiration and yields.

How to cite: Schwartz, R., Klopp, H., and Domínguez, A.: Towards improved TDR soil water sensing for optimizing irrigation water management, EGU General Assembly 2023, Vienna, Austria, 23–28 Apr 2023, EGU23-3383, https://doi.org/10.5194/egusphere-egu23-3383, 2023.

EGU23-7169 | ECS | Orals | SSS9.10

Identification of water scarcity hotspots for the 21st century – the case study of irrigation demands in Germany 

Ian McNamara, Martina Flörke, Thorben Uschan, and Frank Herrmann

In many temperate regions globally, sufficient precipitation and moderate temperatures have meant that green water has sufficed for agriculture. However, the effects of climate change demonstrate that additional crop water is now more frequently required in many of these areas, particularly for dry summer years, with irrigation demands expected to continue increasing. In Germany, this effect has become noticeable over previous years, exemplified by the reduced crop yields in the recent summer droughts of 2018 and 2020.

Our study, performed within the scope of the WADKlim project, identifies critical hotspots for water stress through high-resolution hydrological modelling and statistical analyses to determine groundwater recharge and theoretical irrigation requirements from now until 2100. We set up and calibrated the mGROWA hydrological model over a historical period (1961-2020) at a high spatial (100 m) and temporal (daily) resolution. The calibrated model was then run until 2100 for three climate scenarios (1 x RCP2.6; 2 x RCP8.5), which were selected as a stress test for the system. As model outputs, we derived the spatio-temporal patterns of groundwater recharge as well as crop water requirements, through the application of irrigation rules typical for Germany and accounting for the spatial distribution of different crop types. We converted the theoretical crop water requirements into requirements only for areas that are equipped for irrigation, incorporating multiple scenarios for the rate at which irrigation infrastructure could expand in Germany.

Our results demonstrate the large spatial and interannual variations in irrigation demands throughout Germany. We quantify how the multiplicative effect of warmer and drier summers in combination with increased areas equipped for irrigation is expected to strain water resources in the future. For example, we estimate that mean annual irrigation demands in Germany could increase by as much as 700% by 2075-2100, considering the “worst-case” scenario of climate projection and increase in irrigated areas. Regarding groundwater availability, owing to the expected increase in winter precipitation in Germany, our modelling results show pronounced regional variations in whether or not annual groundwater recharge is expected to increase in the future. Finally, we included estimates of other water requirements and aggregated the results to determine overall water demands at the district level and calculate ratios of water use to groundwater recharge per district. Our results highlight the hotspots in Germany where water stress is expected to increase the most throughout the 21st century, which could likely lead to conflict between different water users (agricultural, industry, public supply).

Determining the spatio-temporal characteristics of how water stress will change requires comprehensive assessments of water availability, crop water requirements, areas equipped for irrigation infrastructure, and other water uses. In addition, the large variability in climate projections means that results from such assessments provide large ranges of expected water stress conditions. We have developed and tested a comprehensive methodology for identifying and mapping water hotspots, which we implemented for Germany using three climate projections. Our methodology is transferable to similar (data-rich) regions, and can also be applied for a complete ensemble of climate projections.

How to cite: McNamara, I., Flörke, M., Uschan, T., and Herrmann, F.: Identification of water scarcity hotspots for the 21st century – the case study of irrigation demands in Germany, EGU General Assembly 2023, Vienna, Austria, 23–28 Apr 2023, EGU23-7169, https://doi.org/10.5194/egusphere-egu23-7169, 2023.

EGU23-8516 | Posters on site | SSS9.10

Optimized regulated deficit irrigation for limited volumes of irrigation water and simultaneous crops. The ORDILS methodology 

Alfonso Domínguez, Robert C Schwartz, Higinio Martínez-López, and José J Pardo

In regions with scarce water resources, as is the case of most of Spain and other Mediterranean countries, a commonly used methodology to regulate the use of irrigation water by farmers is for the regulatory authority to establish a maximum volume, which is controlled through meters installed on farms. Producers of extensive annual crops in these areas have to tackle two significant problems, among others. The first is to decide which crops to grow and the total area to devote to each one for the next crop year, depending on the availability of irrigation water and cropping area. This is complicated by the uncertainty of future weather conditions, especially in the current climate change scenario. The second challenge is to distribute, as efficiently as possible, across the season, the available amount of water in order to achieve maximum crop yields/returns, while avoiding at least the most profitable crops suffering water deficit if adverse climate conditions increase the need to irrigate beyond expected levels and the water resources available. To solve such problems, our research team proposes the development of an optimization algorithm called ORDILS (Optimized Regulated Deficit Irrigation for Limited volumes of irrigation water and Simultaneous crops), which is the result of experience accumulated in national Spanish projects, and other previous European projects. This algorithm, using an initial reference situation, and depending on the water available, as well as the expected crop yields and profitability according to the amount of irrigation water applied, will be able to adapt irrigation scheduling, and even determine the optimum area to be cultivated, with the intention of maximising the farm’s profitability. To demonstrate the applicability of ORDILS a 2-year field experiment with three crops (purple garlic, barley and maize) is being carried out in Albacete (Spain). Thus, three experimental strategies are considered: a) non-deficit irrigation conditions (control); b) the strategy followed by a typical farmer (who attempts to apply non-deficit irrigation and, if water is short, uses the water destined to the least profitable crops to satisfy the water demands of the most profitable; garlic, in this case); and c) the methodology proposed by ORDILS. The aim of the experiments is also to analyse the effect of ORDILS on crop yield, harvest quality and physiological response, the agricultural and economic productivity of the irrigation water and the water footprint, and the profitability of a typical farm managed by this regulation system. The results of the first year were promising but the increase on the final profitability was lower than expected (2%). This resulted from a beneficial distribution of precipitation throughout the growing season that permitted the avoidance of water deficit by garlic and barley during the Spring, the most sensitive period for these crops. Consequently, during this first year the effect of ORDILS was highly conditioned by good climatic conditions for the objectives of the farmer. Nevertheless, under drought conditions it is expected ORDILS can significantly increase the profitability of the farms compared with the profitability obtained by the typical farmer.

How to cite: Domínguez, A., Schwartz, R. C., Martínez-López, H., and Pardo, J. J.: Optimized regulated deficit irrigation for limited volumes of irrigation water and simultaneous crops. The ORDILS methodology, EGU General Assembly 2023, Vienna, Austria, 23–28 Apr 2023, EGU23-8516, https://doi.org/10.5194/egusphere-egu23-8516, 2023.

EGU23-8885 | ECS | Posters on site | SSS9.10

Towards a dynamic representation of irrigation in land surface models 

Wanxue Zhu and Stefan Siebert

Water use for irrigation has a critical impact on hydrology, ecology, and agricultural productivity. The irrigation water use is determined by (1) the irrigation water volume required per unit irrigated area and (2) the extent of irrigated land. At large scales, the required water volume per unit irrigated area is usually estimated by calculating soil water balances and quantifying the volume of water supply needed to ensure that crop evapotranspiration is at the potential level or at a level minimizing drought impacts on crop yield. Little information is available about the dynamics in the extent of irrigated land, mainly due to the limited observations and investigations at large scales. To fill the above research gap and to test for factors impacting interannual variability in irrigation extent, this study is going to develop a database with 1990-2020 annual irrigated cropland extent for Europe/Eurasia, a region with relatively well data availability, at sub-national resolution. Relationships between annual irrigation extent and factors potentially impacting variabilities in the irrigated area will be tested by using process-based models. The new annual irrigation database will be applied in Community Land Model to quantify differences in dynamics and trends of irrigation water use across the region compared to the use of the current static data products. Consequently, we will analyze the impact of climate variability on the extent of irrigated crops, irrigation water requirements, and irrigation water use. This study will be fundamental for better understanding and qualifying the human impacts on the natural environment and society under climate change, so as to support future scenario forecasts and decision systems, particularly in improving irrigation management.

How to cite: Zhu, W. and Siebert, S.: Towards a dynamic representation of irrigation in land surface models, EGU General Assembly 2023, Vienna, Austria, 23–28 Apr 2023, EGU23-8885, https://doi.org/10.5194/egusphere-egu23-8885, 2023.

EGU23-9004 | Posters virtual | SSS9.10

Are ongoing SUDS design and management routines considering public perception? 

Sergio Zubelzu, Blanca Cuevas, Carlota Bernal, Paloma Esteve, María Teresa Gómez, Jesús López, and Leonor Rodríguez

SUDS were initially conceived for mimicking hydrological original conditions of urban catchments. SUDS have been strongly promoted by public and private decision-makers around the world. Public perception has been previously addressed by different studies many studies in a disconnected manner and at different planes. Similarly, the social benefits have also been studied from different perspectives mostly enhancing local perspectives not clearly comparable between territories. In this work we present the initial literature review on SUDS social aspects and public perception. We find from the previous studies that a general method for both making society aware of SUDS aims and roles and providing designers and planners with public perception is clearly lacking. We seek to highlight the gaps to be filled with further analysis and studies so public society can be completely engaged in SUDS design and operation.

How to cite: Zubelzu, S., Cuevas, B., Bernal, C., Esteve, P., Gómez, M. T., López, J., and Rodríguez, L.: Are ongoing SUDS design and management routines considering public perception?, EGU General Assembly 2023, Vienna, Austria, 23–28 Apr 2023, EGU23-9004, https://doi.org/10.5194/egusphere-egu23-9004, 2023.

EGU23-10383 | ECS | Posters virtual | SSS9.10

Modified Irrigation Sustainability Index for the evaluation of irrigation systems in low-impact agricultural basins, case study in the upper Tarqui river basin, Ecuador 

Elizabeth Moreno-Contreras, Rolando Celleri-Alvear, and David Rivas-Tabares

Sustainable irrigation systems promote soil and water conservation, without degrading the environment, being economically viable and socially acceptable. Consequently, this study aims to calculate a novel approach to modify the current method to calculate the irrigation sustainability index (ISI) for efficient use and management of natural resources. The current method to estimate ISI require large surveying of historical data associated with intensive irrigation areas. In most cases limiting the application of the index for countries or regions with scarce data about irrigation technology, management, and traditional irrigation systems. A new methodology has been proposed to overcome these limitations, adjusting the index for the study area in Southern Ecuador. The modified irrigation sustainability index (MISI) evaluated in the Tarqui river basin, comprises three main components: biogeographic, sociodemographic and institutional, each component is integrated by a set of correlated parameters and some modifications were proposed. Thus, the index can be universally used, this modification changes the weights in the calculation expression, making it more relevant and therefore the index can be adjusted easily to a low-impact agricultural basin. The MISI index is presented as a useful alternative for diverse types of irrigation systems using the weighted method and its adjustment. The results support decision-making by showing the value of the irrigation sustainability index to understand the intermediate evaluated parameters to improve the system. The preliminary results show that MISI can support the SDG in terms of global comparison since can be adaptable to local/regional scales, allowing comparisons with the diverse classification of irrigation technologies. Besides, MISI is a valuable tool for tracking and tackling current and future irrigation problems in irrigation districts.

Acknowledgements

The authors acknowledge the support of the Master in Hydrology  (major in Ecohydrology) of Universidad de Cuenca, co-funded by SDGnexus Network of the DAAD program. The authors also acknowledge support from the European Union NextGenerationEU and RD 289/2021 and the support of Project No. PGC2018-093854-B-I00 of the Ministerio de Ciencia, Innovación y Universidades of Spain.

References

  • David Rivas-Tabares, Ana M. Tarquis, Ángel de Miguel, Anne Gobin, Bárbara Willaarts. Enhancing LULC scenarios impact assessment in hydrological dynamics using participatory mapping protocols in semiarid regions. Sci. Total Environ., 803, 149906, 2022. https://doi.org/10.1016/j.scitotenv.2021.149906
  • Rivas-Tabares, A. de Miguel, B. Willarts and A.M. Tarquis. Self-organising map of soil properties in the context of hydrological modeling. Applied Mathematical Modelling, 88,175-189, 2020. https://doi.org/10.1016/j.apm.2020.06.044
  • Rivas-Tabares, D. A., Saa-Requejo, A., Martín-Sotoca, J. J., & Tarquis, A. M. (2021). Multiscaling NDVI Series Analysis of Rainfed Cereal in Central Spain. Remote Sensing13(4), 568.

How to cite: Moreno-Contreras, E., Celleri-Alvear, R., and Rivas-Tabares, D.: Modified Irrigation Sustainability Index for the evaluation of irrigation systems in low-impact agricultural basins, case study in the upper Tarqui river basin, Ecuador, EGU General Assembly 2023, Vienna, Austria, 23–28 Apr 2023, EGU23-10383, https://doi.org/10.5194/egusphere-egu23-10383, 2023.

EGU23-11522 | ECS | Posters on site | SSS9.10

Tapered drip laterals and manifolds in flat and rectangular irrigation units 

Salvatore Samuel Palermo and Giorgio Baiamonte

Multiple-diameter laterals and manifolds reduce the total cost in microirrigation systems, however, the length of each sublateral should be determined carefully to assure appropriate performance and uniformity of emitter flow rates. The most accurate method is numerical trial and error, which is time-consuming. Many research efforts have been made to propose simple analytical design procedures. By using the power-law form of the Darcy-Weisbach formula, and equal emitters spacing for the sublaterals, Sadeghi et al. (2016) extended a previously introduced design solution for one-diameter laterals to tapered laterals. Recently, a simplified procedure to design dual-diameter drip laterals has been introduced (Baiamonte and Palermo, 2022), providing relative errors in pressure heads less than 0.5%, and allowing to set different Hazen-Williams coefficients, flow rates, and emitter interspaces for each sublateral. Moreover, this analytical procedure easily allows the detection of the required commercial emitter characteristics. The objective of this work is to extend the aforementioned solution to rectangular irrigation units laid on flat fields. 

How to cite: Palermo, S. S. and Baiamonte, G.: Tapered drip laterals and manifolds in flat and rectangular irrigation units, EGU General Assembly 2023, Vienna, Austria, 23–28 Apr 2023, EGU23-11522, https://doi.org/10.5194/egusphere-egu23-11522, 2023.

EGU23-12977 | ECS | Posters virtual | SSS9.10

How did DANA event affect water status and thermal response of fruit crops? 

María R. Conesa, Wenceslao Conejero, Ana B. Mira-García, Juan Vera, and Mª Carmen Ruiz-Sánchez

In recent years, associated extreme events to climate change are being experienced more frequently and with greater intensity, worldwide but particularly affecting to Mediterranean basin countries. The DANA phenomenon (Spanish acronym for depresión aislada en niveles altos, meaning upper-level isolated atmospheric depression) occurs normally in autumn due to convective storms generated by the existence of cold air in the upper layers of the atmosphere combined with warm winds coming from the Mediterranean Sea. Its effects are devastating, provoking storms of great intensity that cause violent flash-flooding and run-off with a huge capacity for soil erosion. This field experiment focuses on the effects of DANA event of 12-13 September 2019 in Southern Spain on plant water status and thermal response of nectarine trees. Two irrigation treatments were applied during the summer-autumn postharvest (DOY, Day of the year, 158-329): well-irrigated (CTL) and non-irrigated (DRY). Volumetric soil water content (θv), air temperature (Ta) and canopy temperature (Tc) were real-time monitored and the crop water stress index (CWSI) was calculated. Stem water potential (Ψstem) and leaf gas exchange were measured on representative days of the experimental period. The effects of DANA forced to disconnect the soil water content sensors, precluding to measure Ψstem and leaf gas exchange from DOY 255 to 275. Before DANA, withholding irrigation caused a gradual decline in soil and plant water status in the DRY treatment. Minimum values of Ψstem = -2.63 MPa and θv = 13% were obtained at DOY 246. Significant differences were obtained in the Tc, Tc-Ta, and CWSI between treatments. CWSI in the DRY treatment was maximum (0.94) at DOY 232. The effects of DANA reduced the differences between treatments in thermal data, what required to establish different baselines for CWSI calculation. In this sense, the relationship Tc-Ta vs. VPD improved the coefficient of determination after DANA (from R2=0.71*** to 0.83***) in well-irrigated trees. Similar values of Ψstem and leaf gas exchange were found in both treatments after DANA. Only thermal indices showed significant differences between treatments. Furthermore, the strong relationship found between Tc-Ta vs. Ψstem worsened after DANA event (from R2=0.81*** to 0.32*). This work underlined the robustness of infra-red thermography to continuously monitor plant water status under this type of natural weather disaster.  


Acknowledgements: This work was funded by Spanish Agencia Estatal de Investigación (PID2019-106226RB-C21/AEI/10.13039/501100011033). MR. Conesa thanks to the Spanish Juan de la Cierva programme (IJC2020-045450-I) funded by MCIN/AEI/10.13039/501100011033 and European Union NextGenerationEU/PRTR.


How to cite: Conesa, M. R., Conejero, W., Mira-García, A. B., Vera, J., and Ruiz-Sánchez, M. C.: How did DANA event affect water status and thermal response of fruit crops?, EGU General Assembly 2023, Vienna, Austria, 23–28 Apr 2023, EGU23-12977, https://doi.org/10.5194/egusphere-egu23-12977, 2023.

EGU23-13469 | ECS | Orals | SSS9.10

Effect of high saline irrigation water on the sustainability of barley cultivated in a Mediterranean climate 

Pablo Berríos, Raúl Pérez-López, Abdelmalek Temnani, Susana Zapata-García, Francisco J. Caballero, José A. Franco, and Alejandro Pérez-Pastor

The Mediterranean agrosystem 'Campo de Cartagena' (Murcia, Spain) faces a complex challenge, due to almost permanent water scarcity and high diffuse nitrate contamination of the groundwater. The electrical conductivity (EC) of groundwater can reach ≈6.5 dS m-1 and ≈96 mg L-1 of N (NO3-). In contrast, the EC of water from the Tajo-Segura water transfer is ≈1.5 dS m-1 and contains <≈5 mg L-1 of NO3-. Therefore, groundwater quality limits this resource only for tolerant or resistant crops, among them, barley is considered a salinity resistant crop with low nutritional requirements. Thus, the objective of our work was to evaluate the agronomic response of barley 'Shakira' (Hordeum vulgare L.) irrigated with saline water and with the incorporation of continuous monitoring sensors of soil water status and remote sensing. The crop was established during 2022 winter with a seeding rate of 200 kg ha-1 and a drip irrigation system. A completely randomized block design was established with 3 treatments with three blocks and each experimental unit corresponded to 150 m2. The treatments were: (i) "Control", irrigated with 100% water from the water transfer with an EC of 1.46 dS m-1; (ii) "High salinity", irrigated with a mixture of 40% water from the water transfer and 60% groundwater to reach an EC of 4.5 dS m-1, and (iii) "Very high salinity", irrigated with 100% groundwater with an EC of 6.5 dS m-1 and with a total N input of 36.2 kg ha-1 from irrigation water. In the rest of the treatments, fertilizer units were adjusted by proportional fertigation with ammonium-nitrate. Irrigation was scheduled to allow a 30% depletion of field capacity in the active root zone. At the end of the irrigation period, the soil EC1:5 between 0.05 and 0.4 m was significantly higher in proportion to the groundwater treatments. However, no differences were detected in soil EC1:5 or nitrate concentration up to 0.6 m depth. No differences were detected in the yield parameters, reaching an average of 3.5 t ha-1, 16.6 grains per spike, and a 1000-grain weight of 52.2 g. Likewise, the caliber distribution was not affected and the proportion of grains larger than 2.8 mm reached an average of 89.4%. Regarding grain quality, germination capacity (>99%) and dry protein were not affected (10.4%). NDVI and GCI vegetation indices were calculated to evaluate the treatments effect on chlorophyll content and crop vigor, when plants reached 30 and 100% cover and pre-harvest. NDVI ranged from 0.3-0.71 and CGI from 1.5-3.37, both reaching maximum when the crop was fully covered, but no differences between treatments were detected. The results obtained validate the economic viability of barley cultivation irrigated with highly saline water and, from an environmental point of view, highlight the importance of incorporating quantitative and objective methods for irrigation scheduling to minimize water and nutrient leaching.

Acknowledgments: The authors would like to thank the ‘Estrella de Levante’ Foundation for funding this experiment through the agreement “6699/21IA-C” with the UPCT. In addition, we thank to Laura Soria-López for the technical support in the laboratory evaluations.

How to cite: Berríos, P., Pérez-López, R., Temnani, A., Zapata-García, S., Caballero, F. J., Franco, J. A., and Pérez-Pastor, A.: Effect of high saline irrigation water on the sustainability of barley cultivated in a Mediterranean climate, EGU General Assembly 2023, Vienna, Austria, 23–28 Apr 2023, EGU23-13469, https://doi.org/10.5194/egusphere-egu23-13469, 2023.

EGU23-14385 | ECS | Orals | SSS9.10

Optimization of deficit irrigation through monitoring the plant and soil water status in adult lemon trees 

Abdelmalek Temnani, Raúl Pérez-López, Pablo Berríos, Giorgio Fioretti, Susana Zapata-García, and Alejandro Pérez-Pastor

Agriculture located in arid-conditions is under high pressure for water resources, due to scarcity and poor quality of water resources to a large extent. Under these conditions, this sector may need up to 70% of the available water, and there is a high level of competition with other economic sectors. The Region of Murcia (Spain) is one of the main productive areas of the country and has the largest irrigated area in relation to its extension. The SE Spain is characterized by a robust hydraulic infrastructure, efficient irrigation systems and a high incorporation of technology for irrigation scheduling. Also, a significant decrease in water resources due to climate change is projected, so it is necessary to maximize irrigation water use efficiency (iWUE) to ensure the economic and environmental sustainability of the sector. Therefore, the main objective of the study was to increase the iWUE and nutrient use to maximize the sustainability of the lemon trees ‘Fino 95’ (Citrus limon L.) in Campo de Cartagena by monitoring the plant and soil water status, during two consecutive seasons. The orchard was established in a 6.5 × 4.5 m planting frame in 2010 with a drip irrigation. A randomized experimental design was established with 12 trees as an experimental unit. Two treatments with four replicates were tested: (i) a control (CTL) irrigated to satisfy the 110% of the crop evapotranspiration (ETc) during the entire crop cycle according to FAO; and (ii) a precision irrigation treatment (PI), irrigated in both seasons as CTL until the start of the fruit-phase II in which the irrigation was reduced by 40%. Several multispectral vegetation indices over canopy were calculated monthly to evaluate the irrigation effect on chlorophyll content and crop vigor. NDVI ranged from 0.8-0.87 and CGI from 4.3-8.7, both reaching maximum values in December, but no differences between treatments were detected. The results confirm the possibility of applying regulated deficit irrigation strategies on lemon trees, achieving a 34% increase in iWUE, and a water saving of around 25% with respect to the CTL treatment. However, the water deficit period should be better delimited according to the trunk growth in this period, as has recently been proven in other citrus fruits, in order not to affect the earliness of the harvest and to obtain a higher percentage of irrigation water savings.

Acknowledgments: The authors would like to thank the ‘Sindicato Central de Regantes del Acueducto Tajo-Segura’ for funding this experiment through the agreement “6217/20IA-C” with the UPCT.

How to cite: Temnani, A., Pérez-López, R., Berríos, P., Fioretti, G., Zapata-García, S., and Pérez-Pastor, A.: Optimization of deficit irrigation through monitoring the plant and soil water status in adult lemon trees, EGU General Assembly 2023, Vienna, Austria, 23–28 Apr 2023, EGU23-14385, https://doi.org/10.5194/egusphere-egu23-14385, 2023.

EGU23-15163 | Orals | SSS9.10 | Highlight

Hydrological modeling to support co-designed NEXUS management strategies 

Maria Cristina Rulli, Nikolas Galli, and Davide Danilo Chiarelli

The introduction of participatory processes directly and actively involving stakeholders has been steadily gaining importance also in the definition of water management policies. Moreover, for policies to be sustainable, the decision-making process has to keep a multisectorial vision of water management, for instance taking into account the mutual interactions between water, agriculture and energy production, while being careful to move within the limits of the ecosystem. This inclusive approach to the water-energy-food-ecosystem nexus (WEFE Nexus) is the way in which a community of practice made by both technicians and stakeholders can make conscious and sustainable decisions. In this context, the use of hydrological models takes on a key role, not only to describe the current state of resources use, but also to evaluate the impact on resources of different management strategies. However, it is fundamental to properly structure the information pathway from the stakeholders to the model, as well as the return pathway of model results to the stakeholders. On this depends the successful creation of a fruitful and transparent interaction between technicians and stakeholders. An instance of how models can be applied to this context is the use, within the PRIMA NEXUS-NESS project, of the spatially distributed hydrological model WATNEEDS, developed at Politecnico di Milano,. The project aims at co-creating WEFE Nexus management strategies in 4 different case studies, defined as Nexus Ecosystem Labs (NELs) in 4 different countries of the Mediterranean area: Spain, Italy, Tunisia, and Egypt. The 4 NELs are very different from each other in terms of characterizations and problématiques, but they all present major sustainability challenges that can be conceptualized in terms of WEFE Nexus. In the context of NEXUS NESS, WATNEEDS has been enhanced in terms of spatial ductility and range of possible model scenarios, with the aim to describe the current status of water resources in each NEL and to evaluate the management alternatives proposed by the different stakeholders. Among the alternatives the model can analyse, we report changing the crop calendar, implementing new crops or redistributing the existing crops in the territory, changing or modernizing the irrigation systems, and moving towards indoor cultivation techniques. As an example, we report the results relative to some of the interventions proposed by the stakeholders during the first set of project Workshops, held between May and June 2022. The final results will be provided to the stakeholders in November, to illustrate the different impacts that each choice can lead to, not only in terms of water use, but also of WEFE Nexus in general. In this way, using hydrological models in the evaluation of co-created and participatory policy decisions demonstrates its crucial role in the definition of shared and sustainable management strategies.

How to cite: Rulli, M. C., Galli, N., and Chiarelli, D. D.: Hydrological modeling to support co-designed NEXUS management strategies, EGU General Assembly 2023, Vienna, Austria, 23–28 Apr 2023, EGU23-15163, https://doi.org/10.5194/egusphere-egu23-15163, 2023.

EGU23-15370 | ECS | Posters on site | SSS9.10

Assessing soil water thresholds for irrigation of maize in north-eastern Austria 

Christian Faller and Reinhard Nolz

The consequences of climate change will affect irrigation also in areas that have so far been little affected by water shortages. In the north-eastern part of Austria with predominantly sub-humid conditions (550 mm mean annual rainfall, 11°C mean annual temperature), water demand is expected to double by 2050. With regard to irrigation, this means both increased crop water requirements and reduced water availability. Improving water use efficiency is one way to sustain agricultural productivity and water resources in the long term. This poses a future challenge also for farmers who have had little to do with the requirements of highly efficient irrigation management so far. In this regard, a potential on-farm strategy is to monitor soil water status and control irrigation based on the plant available soil water. On the technical side, sensors and telemetry networks are available that regularly collect and transmit data. However, the appropriate thresholds for irrigation control must also be known. These depend on the crop, the root development, the soil type and the installation depth of the sensors. Last but not least, farmers need to trust the decision support and use the information appropriately. The aim of this study was to determine threshold values ​​for the irrigation of maize at a location in north-eastern Austria (in the country's largest arable farming area, approx. 35 km east of Vienna) and to subject them to a practical test in the field.

The irrigation system used was a hose reel with an irrigation boom with rotating nozzles (BAUER GmbH). HydraProbe (Stevens Water Monitoring Systems Inc.) and Watermark (Irrometer Company Inc.) sensors were used to measure soil water content and matric potential, respectively. The sensors were integrated into a telemetry network (ADCON by OTT HydroMet GmbH); data were available via a web-application. For practical reasons, the installation depth of the sensors was set at 20 cm. Soil was a sandy loam. A target value for the maximum allowed depletion under optimal to slightly stressed conditions was calculated using a water balance model. Based on HYDRUS-1D (PC-Progress s.r.o.) simulations, the corresponding matric potential at 20 cm depth was −100 kPa. This value should serve as the target value for irrigation. The soil water content data served as a control for the simulation using the FAO AquaCrop model. The latter was used to evaluate the irrigation carried out by the farmer.

The soil water data revealed that the specified threshold was not reached in the practical test. It seems that farmers experience was oriented towards a more sufficient water supply. The simulation showed that water use efficiency could have been improved by using less water; however, in this case a reduction in yield of a few percent would have to be expected. Measuring with only one sensor at a depth of 20 cm proved to be a viable procedure; however, data interpretability could be improved by sensors at several depths.

How to cite: Faller, C. and Nolz, R.: Assessing soil water thresholds for irrigation of maize in north-eastern Austria, EGU General Assembly 2023, Vienna, Austria, 23–28 Apr 2023, EGU23-15370, https://doi.org/10.5194/egusphere-egu23-15370, 2023.

EGU23-16082 | ECS | Orals | SSS9.10 | Highlight

Assessing plant water status in Merlot vineyards using Worldview-3 multispectral images in central Spain 

Juan Claudio Nowack, Luz Karime Atencia, María Gómez del Campo, and Ana María Tarquis

Water status in vineyards is a determining factor, given its relationship with productive and physiological parameters such as vegetative growth, berry ripening, yield and overall wine quality. In-field measurements, through a pressure chamber, provide very accurate and reliable measurements of midday stem water potential (Ψstem), a direct method for determining a plant’s water status by quantifying the tension with which water is retained in the leaf. Despite the robustness of this method, it is not practically applied to extensive commercial vineyards as it is a labour-intensive practice which can narrowly evaluate the significant intra-field variability. Remote sensing offers large-scale information at a single point in time without the need to be physically present in the field. This study aims to assess the use of multispectral imagery from Worldview-3, a commercial satellite, as a tool to indirectly estimate water status in the vineyard through different Vegetation Indexes (VI).

This research was carried out in a commercial Merlot vineyard in Yepes (Toledo), an arid area in central Spain where rainfall and irrigation water availability is scarce. The vines were established in 2002 and arranged on a trellis with a plantation spacing of 2.6 x 1.1 m. Five different irrigation doses were tested to obtain variability in vine water status. Drip irrigation emitters were identical in all treatments ( 2 l h-1), but distances between emitters were adjusted to modify irrigation levels. Treatments were designed as follows: T1 (100% dose) emitters every 0.25 m, T2 (50%) emitters every 0.5 m, T3 (25%) emitters every 1.0 m, T4 (0%) no emitters and T5 (25%) underground emitters every 1.0 m. The results will be discussed in the context of deficit irrigation.

How to cite: Nowack, J. C., Atencia, L. K., Gómez del Campo, M., and Tarquis, A. M.: Assessing plant water status in Merlot vineyards using Worldview-3 multispectral images in central Spain, EGU General Assembly 2023, Vienna, Austria, 23–28 Apr 2023, EGU23-16082, https://doi.org/10.5194/egusphere-egu23-16082, 2023.

EGU23-16111 | ECS | Posters virtual | SSS9.10

Detection of plant water stress in Merlot vineyard using thermal sensors onboard UAVs 

Luz Karime Atencia, María Victoria del Campo, Juan Claudio Nowack Yruretagoyena, Ana María Tarquis Alonso, and Roberto Hermoso Peralo

Knowledge of the water status in commercial vineyards is of great importance when defining the production objectives and the composition of the grape must. Determining the appropriate irrigation doses allows for adjusting the balance between vigour and productive capacity of the vineyard. However, to accurately know the hydration status of the vines, it is necessary to use equipment such as pressure chambers that are hardly replicable. Much effort has been invested in finding a more straightforward simpler methodology that allows knowing the hydration of plants. In this respect, remote sensing technology is presented as an appropriate tool to obtain information from large areas quickly and efficiently. This work aimed to evaluate the accuracy of water stress detection based on thermal sensors onboard UAVs.

The study was carried out in the Merlot vineyard located in Toledo-Spain; arranged on a trellis with a 2.60 x 1.10 m planting frame and established in 2002. High-resolution thermal images were obtained on different dates during the 2021 and 2022 irrigation campaign and at two intervals of the day (9:00 and 12:00 solar hours). Stem water potential (Ψm) and chlorophyll were measured at the same time.

The results indicate that there are statistically significant differences between the different irrigation treatments. These differences were mainly observed in the water-steam potential measurements made in the morning.

References

Acevedo-Opazo, C., Tisseyre, B., Guillaume, S., & Ojeda, H. (2008). The potential of high spatial resolution information to define within-vineyard zones related to vine water status. Precision Agriculture, 9(5), 285–302. https://doi.org/10.1007/s11119-008-9073-1.

Jackson, R. D. (1982). Canopy Temperature and Crop Water Stress. 1, 43–85. https://doi.org/10.1016/b978-0-12-024301-3.50009-5.

Poblete-Echeverría, C., Sepulveda-Reyes, D., Ortega-Farias, S., Zuñiga, M., & Fuentes, S. (2016). Plant water stress detection based on aerial and terrestrial infrared thermography: A study case from vineyard and olive orchard. Acta Horticulturae, 1112, 141–146. https://doi.org/10.17660/ActaHortic.2016.1112.20.


Acknowledgements:

The authors want to thank Bodegas y Viñas Casa del Valle for allowing us to work in their vineyards and the company UTW for supply the drone images. Financial support provided by Comunidad de Madrid through calls for grants for the completion of Industrial Doctorates IND2020/AMB-17341 is greatly appreciated.

How to cite: Atencia, L. K., del Campo, M. V., Nowack Yruretagoyena, J. C., Tarquis Alonso, A. M., and Hermoso Peralo, R.: Detection of plant water stress in Merlot vineyard using thermal sensors onboard UAVs, EGU General Assembly 2023, Vienna, Austria, 23–28 Apr 2023, EGU23-16111, https://doi.org/10.5194/egusphere-egu23-16111, 2023.

EGU23-16225 | ECS | Posters virtual | SSS9.10

Experimental analisys of depending on temperature and solar radiation evapotranspiration empirical models at Republic of Ecuador. 

Ángel del Vigo, Javier Ezequiel Colimba-Limaico, and Leonor Rodríguez-Sinobas

Evapotranspiration is a phenomenon highly involved for water infiltration and redistribution among the soil. It is also an important factor that determines the amount of water available for crops. In this article, evaporation data collected by an evaporimeter tank in a greenhouse at Imbabura province (north of Ecuador) are presented. Based on these experimental results, the validity of five evapotranspiration reference models that depends exclusively on temperature and solar radiation has been tested for this area. It was seen that, there is a good correlation (Pearson-coefficient around 80%) between the observed data and the prediction of these five models, being the Irmak model (2003) what suits better with the observed data for this region. At the end of the article, a new empirical model that was inferred by these experimental data is presented, with the goal to improve the evaporation prediction in this area of South-America.

How to cite: del Vigo, Á., Colimba-Limaico, J. E., and Rodríguez-Sinobas, L.: Experimental analisys of depending on temperature and solar radiation evapotranspiration empirical models at Republic of Ecuador., EGU General Assembly 2023, Vienna, Austria, 23–28 Apr 2023, EGU23-16225, https://doi.org/10.5194/egusphere-egu23-16225, 2023.

EGU23-16607 | Posters on site | SSS9.10

Can soil moisture sensors support smart irrigation decision making in mountain terrace agriculture? 

Adriana Bruggeman, Marinos Eliades, Hakan Djuma, Melpo Siakou, Ioannis Sofokleous, and Christos Zoumides

While our planet is heating up, mountain terraces may be able to maintain agricultural production systems in a cooler environment than the agricultural plains. Mountain terraces are, however, characterised by diverse growing environments, with highly variable, stony soils, variable plant spacing and canopy cover. This limits the effectiveness of sensor-based technologies for efficient agricultural resource management. The objective of this research is to provide guidelines for informed irrigation decision making in mountain terrace orchards. Over the past four years, we have cooperated with four farmers with irrigated fruit trees on traditional dry-stone terraces in the Troodos Mountains of Cyprus. We installed soil moisture sensors at a different number of locations and soil depths, depending on the soil and terrace characteristics. In the stony soils of the apple terraces we installed sensors 3 locations and 2 depths (10 and 30 cm). In the cherry terraces, we installed 12 sensors at 4 locations and 3 depths (10, 30 and 45 cm) and 2 additional sensors at 10 cm. In the deep soils of the nectarine terraces, we installed sensors at 2 locations and 7 depths (10-70-cm depth). In the stony plum terraces, we installed sensors at 2 locations and 3 depths (10, 25 and 50 cm). We analysed the variability of the soil moisture observations and the effect of the uncertainty of the soil moisture observations on irrigation decision making. In the cherry terrace, results of more than 3600 hourly observations for 14 sensors showed that the average difference between the driest and wettest sensors amounted to 11.6% volumetric soil moisture at 10-cm depth, 6.7% at 30-cm depth and 7.6% at 45-cm depth. The maximum difference between the soil moisture sensors was observed immediately after one of the irrigation events (12 May 2022), showing a difference of 187 mm water in the rootzone between the driest and wettest set of sensors at the 3 depths. Based on the depth-weighted average of all 14 sensors, this event showed a drainage loss of approximately 38 mm of the 55-mm applied irrigation, below the 55-cm rootzone. The sensor-based irrigation advice would have suggested that the farmer should have irrigated maximum 17 mm. If the driest set of sensors at the 3 depths would have been used, the irrigation advice would have been the same, whereas based on the the wettest set of 3 sensors, the advice would have been to irrigate maximum 22 mm. This indicates that even though the the irrigation advice can have a 29% error, 33-mm drainage loss could have been saved with sensor-based irrigation scheduling for this event.   

How to cite: Bruggeman, A., Eliades, M., Djuma, H., Siakou, M., Sofokleous, I., and Zoumides, C.: Can soil moisture sensors support smart irrigation decision making in mountain terrace agriculture?, EGU General Assembly 2023, Vienna, Austria, 23–28 Apr 2023, EGU23-16607, https://doi.org/10.5194/egusphere-egu23-16607, 2023.

EGU23-17393 | ECS | Posters on site | SSS9.10

Trade-off between irrigation demands and environmental flows requirements in Spain 

Sandra Paola Bianucci, Álvaro Sordo-Ward, María Dolores Bejarano, and Luis Garrote

Providing adequate water supply following the development of society and ensuring the good status of water-dependent ecosystems is becoming increasingly complex. This is particularly relevant in areas characterized by water scarcity and with unfavourable projections due to climate change, such as the Iberian Peninsula. Water is fully allocated in many water resources systems, while environmental water requirements are intensified. Consequently, it is fairly probable that in the medium and long term water demands will not be satisfied with the current reliability. This fact may particularly affect to irrigation water supply, as the most important consumptive water use. We are developing a National Research Project entitled: Climate scenarios and adaptation of water resources systems (SECA-SRH). The main purpose is to generate knowledge that contributes to the design and implementation of climate change adaptation policies that consider simultaneously technical, economic, social and environmental aspects. The increase of the comprehension of water system behaviour allows decisions making and prioritizing water uses. This would help to achieve the sustainability of the management of water resources systems in the medium and long term. In this study, as part of the mentioned project, we analyse the effect of different criteria for the allocation of environmental flows on the sustainability of the water resources systems in Spain, in the current situation (1989-2019). The availability of water is estimated as the maximum water demand for population and agriculture (irrigation) that can be supplied with a given reliability in a given location of the river network and satisfying environmental flow restrictions. The methodology is based on the use of the high resolution WAAPA model. 720 dams with a reservoir greater than 1 hm3 and 1948 sub-basins are considered. The calculation is made at each dam, at the confluences of the main rivers and for the aggregate set of each sub-basin. The results show that the availability of water in a system is very sensitive to changes in environmental flow regimes. The relationship between reduction in water availability and environmental flows is unevenly distributed in Spain. This result may suggest that the implications of increasing the allocation of water to environmental flows may vary, depending on the hydrological regime and storage availability.

How to cite: Bianucci, S. P., Sordo-Ward, Á., Bejarano, M. D., and Garrote, L.: Trade-off between irrigation demands and environmental flows requirements in Spain, EGU General Assembly 2023, Vienna, Austria, 23–28 Apr 2023, EGU23-17393, https://doi.org/10.5194/egusphere-egu23-17393, 2023.

EGU23-17443 | Orals | SSS9.10

Water retention potentials of Italian soils and physiological responses of potted yellow kiwifruit 

Moreno Toselli, Elena Baldi, Maurizio Quartieri, Giacomo Chiarelli, Greta Nicla Larocca, Evangelos Xylogiannis, and Marco Mastroleo

Correct water management of yellow kiwifruit vines is essential for reaching high yield and fruit quality, to keep plants healthy and avoid useless water loss. The aim of the present experiment was to evaluate the physiological responses of potted Zezy002 (Actinidia chinensis var chinensis) plants to decrease of soil moisture to the wilting point, and to assess the retention curves of 5 typical soil substrates for the kiwifruit production in Italy. The 5 soils were collected from 4 Italian regions named: Basilicata, Calabria, Emilia-Romagna and Lazio (2 soils: Folie and Rosini). Plants from each soil were divided in three groups: 3 plants were irrigated maintaining soil moisture at field capacity (CONTROL); 4 plants were subjected to water stress (STRESS plants), after 48 h of water suspension, two of the four plants were irrigated as for the control plants (RECOVERY). Each pot was provided with a chalk potentiometric probe to monitor soil matric potential (Ym). In addition, soil moisture was evaluated by weight of a soil sample oven-dried, finally daily pot evapotranspiration rate was evaluated gravimetrically by pot weight at 24-h-interval. Leaf gas exchange and stem water potential (Yw) were measured daily. After irrigation suspension, plants rapidly (48 h) reached the wilting point evidenced by the stop of CO2 fixation. This corresponded to stem Yw lower than -1.75 MPa in all soils but the one from Emilia-Romagna which had the higher percentage of loam (42%) that also maintained a positive CO2 assimilation rate longer than the other soils. In this lapse of time, the rate of leaf CO2 assimilation, stomatal conductance and transpiration sharply decreased while intercellular CO2 concentration increased. Similarly stem Yw responded quickly to the suspension and re-start of irrigation, reaching values as low as – 1,9 MPa 2 days after the quit of irrigation. At wilting points soil Ym was: -0.96 MPa for Emilia-Romagna, -0.5 MPa for Basilicata, -1.6 MPa for Calabria, -1.8 MPa for Lazio Folie and -2.3 MPa for Lazio Rosini. CO2 assimilation was better correlated to stem Yw than soil Ym.

Key words: soil water moisture, chalk potentiometric probe, leaf gas exchange, stem water potential, soil matric potential

How to cite: Toselli, M., Baldi, E., Quartieri, M., Chiarelli, G., Larocca, G. N., Xylogiannis, E., and Mastroleo, M.: Water retention potentials of Italian soils and physiological responses of potted yellow kiwifruit, EGU General Assembly 2023, Vienna, Austria, 23–28 Apr 2023, EGU23-17443, https://doi.org/10.5194/egusphere-egu23-17443, 2023.

EGU23-454 | ECS | Posters on site | GM11.2

The Balta Alba Kurgan loess-paleosol sequence - Chronology and paleoclimate in the northern Lower Danube Basin, Romania 

Janina J. (Bösken) Nett, Stephan Pötter, Ulrich Hambach, Stephanie Scheidt, Sonja Berg, Christian Zeeden, Frank Lehmkuhl, and Daniel Veres

Loess-paleosol sequences are widely spread across central and southeastern Europe and are studied intensively, as they are important terrestrial archives that preserve paleoenvironmental and paleoclimatic information. In the Lower Danube Basin large areas are covered by loess, loess derivates, sandy loess, and sand dunes (Lehmkuhl et al., 2021). The exposed loess deposits reach several decameters in thickness. In contrast to other well-studied sites in the Lower Danube area, the investigated Balta Alba Kurgan (BAK) sequence is located close to the forelands of the Eastern Carpathians, an area that is largely underrepresented in loess research. High-resolution geochemical analyses identified the Eastern Carpathians as a main source region of the loess at this site (Pötter et al., 2021). The BAK sequence consists of loess with several intercalated paleosols and weaker pedogenetic horizons, reflecting Late Pleistocene environmental conditions. Furthermore, the Campanian Ignimbrite/Y-5 tephra is preserved that serves as a chronological marker horizon and which had severe ecological impact in southeastern Europe. A robust age model was established for the upper 10 m using a multi-method approach (luminescence dating, radiocarbon dating, magnetic stratigraphy, and tephrochronology) which shows that this part of the sequence covers the MIS 3/2 transition up to present (Scheidt et al., 2021). Here, we present further geochronological data obtained from luminescence dating and more detailed paleoenvironmental proxy data, widening our understanding of Late Pleistocene climate and environmental conditions in the northern Lower Danube Basin.


References

Lehmkuhl, F., Nett, J.J., Pötter, S., Schulte, P., Sprafke, T., Jary, Z., Antoine, P., Wacha, L., Wolf, D., Zerboni, A., Hošek, J., Marković, S.B., Obreht, I., Sümegi, P., Veres, D., Zeeden, C., Boemke, B., Schaubert, V., Viehweger, J., Hambach, U., 2021. Loess landscapes of Europe – Mapping, geomorphology, and zonal differentiation. Earth-Science Reviews 215, 103496. doi:10.1016/j.earscirev.2020.103496

Pötter, S., Veres, D., Baykal, Y., Nett, J.J., Schulte, P., Hambach, U., Lehmkuhl, F., 2021. Disentangling sedimentary pathways for the Pleniglacial Lower Danube loess based on geochemical signatures. Frontiers in Earth Science 9, 1–25. doi:10.3389/feart.2021.600010

Scheidt, S., Berg, S., Hambach, U., Klasen, N., Pötter, S., Stolz, A., Veres, D., Zeeden, C., Brill, D., Brückner, H., Kusch, S., Laag, C., Lehmkuhl, F., Melles, M., Monnens, F., Oppermann, L., Rethemeyer, J., Nett, J.J., 2021. Chronological Assessment of the Balta Alba Kurgan Loess-Paleosol Section (Romania) – A Comparative Study on Different Dating Methods for a Robust and Precise Age Model. Frontiers in Earth Science 8, 598448. doi:10.3389/feart.2020.598448

How to cite: Nett, J. J. (., Pötter, S., Hambach, U., Scheidt, S., Berg, S., Zeeden, C., Lehmkuhl, F., and Veres, D.: The Balta Alba Kurgan loess-paleosol sequence - Chronology and paleoclimate in the northern Lower Danube Basin, Romania, EGU General Assembly 2023, Vienna, Austria, 23–28 Apr 2023, EGU23-454, https://doi.org/10.5194/egusphere-egu23-454, 2023.

EGU23-1104 | ECS | Orals | GM11.2

Imprints of large-scale oscillations on river flow in selected Canadian river catchments 

Adeyemi Olusola, Samuel Ogunjo, and Christiana Olusegun

Rivers within sub-tropical and temperate regions serve several purposes, including agricultural irrigation, hydro-power generation, and drivers of civilization. The impacts of six large-scale oscillation indices on river flow at three stations within Humber catchments (Ontario and Labrador) between 1970 and 2020 were investigated using sensitivity and wavelet analyses. Results showed that the discharge at East Humber River near Pine has the highest statistically significant sensitivity of 0.304 and 0.394 units per month to the Dipole Mode Index (DMI) and Tropical North Atlantic (TNA), respectively. Monthly significance analysis also showed the varied influence of large-scale oscillations on the river flow at these locations. Wavelet analysis reveals significant active multidecadal oscillations for the North Atlantic Oscillation (NAO) at East Humber River near Pine with high spectral power. This study has identified the contributions of different climatic indices to river flow within the Humber catchments. The results will be helpful in environmental planning and effective water management within the basin.

How to cite: Olusola, A., Ogunjo, S., and Olusegun, C.: Imprints of large-scale oscillations on river flow in selected Canadian river catchments, EGU General Assembly 2023, Vienna, Austria, 23–28 Apr 2023, EGU23-1104, https://doi.org/10.5194/egusphere-egu23-1104, 2023.

Dune field landscape patterns serve as an important signs of aeolian processes, such as wind conditions, sediment supply, and so on. A novel framework was proposed and evaluated for automatic dune detection and classification with remotely sensed images. The framework consists of two main steps: (1) The first step is to detect sand dunes from remote sensing images by SandUnet, which is firstly proposed in this paper. SandUnet, a Convolutional Neural Network (CNN), has a similar network structure with Attention U-net but modifies its attention gate module. In SandUnet, the input signals' information is not compressed as in the Attention U-net, therefore, the nuanced color and texture information of dunes are preserved. This paper demonstrated that SandUnet has better detection accuracy than other popular CNNs such as FCN, U-net, U-net++, and Attention U-net. (2) The second step is to compute the image similarity scores through MobileNet between each dune detection result image and the representative images of 6 different types of dunes. Then, each dune detection result image is classified into a dune type automatically. This paper applied the proposed framework to Taklimkan Desert in China. The average classification accuracy rate is around 80%, which proves the usefulness of this framework in automatic, no-cost, and accurate sand dune classification.

How to cite: Tang, Y. and Wang, Z.: Automatic Sand Dune Detection and Classification Framework Using Remote Sensing Images, EGU General Assembly 2023, Vienna, Austria, 23–28 Apr 2023, EGU23-2232, https://doi.org/10.5194/egusphere-egu23-2232, 2023.

EGU23-3684 | ECS | Orals | GM11.2 | Highlight

Are spatial and temporal patterns of landslide triggering events reflected in topography and sediment dynamics? 

Benjamin Campforts, Alison Duvall, Charles Shobe, Gregory Tucker, and Irina Overeem

Landslides alter the morphology and sediment dynamics of mountainous terrain. Here, we evaluate how the spatial and temporal variability of landslide triggering events adjust this footprint. We use the HyLands landscape evolution model that explicitly simulates the occurrence of landslide events as well as fluvial incision and sediment dynamics. Both existing landscapes as well as synthetically produced landscapes that evolve over geological timescales are considered. This enables us to identify the required magnitude and frequency of extreme events for them to be recorded in landscape morphology. Moreover, we compare the relative contribution of long-term tectonic processes versus spatially clustered extreme events in shaping mountainous terrain. Finally, we evaluate if and how the temporal occurrence of landslide-triggering events alter morphology. Here we compare two scenarios: a first one evaluates how a landslide-prone landscape responds to events that are uniformly spread through time, a second one tests how such a landscape responds to regionally synchronous events. This contribution aims to clarify the distinctive role of landsliding in shaping mountainous terrain, which will in turn contribute to understanding how landslide prone regions respond to spatial and temporal changes in extreme events.

How to cite: Campforts, B., Duvall, A., Shobe, C., Tucker, G., and Overeem, I.: Are spatial and temporal patterns of landslide triggering events reflected in topography and sediment dynamics?, EGU General Assembly 2023, Vienna, Austria, 23–28 Apr 2023, EGU23-3684, https://doi.org/10.5194/egusphere-egu23-3684, 2023.

EGU23-4321 | ECS | Posters on site | GM11.2

An intermontane desert system: Sedimentology, mechanism, and provenance in Southeast China during the Late Cretaceous 

Shuo Cao, Laiming Zhang, Nigel Mountney, and Chengshan Wang

Along with the intensification of global warming, severe desertification has already impaired human sustainable development. In a near-future greenhouse world, the total area of the desert will increase, and new types of deserts may emerge. During the “greenhouse” Cretaceous, conventional large paleo-deserts developed in broad topographic basins, and many possible deserts developed in small-scale intermontane basins, which are unusual in near-modern times and less studied. A comprehensive study of their sedimentology, mechanisms, and provenance would refine our interpretation of desertification and improve our understanding of the potential impact of future climate in arid and semi-arid regions in a near-future “greenhouse” world. The Xinjiang Basin is a typical intermontane basin in Southeast China that formed >300 m of successive aeolian deposits during the early Late Cretaceous, making it an ideal place to investigate the Sedimentological characteristics and formation mechanisms of intermontane deserts. In this study, we applied detailed sedimentary analyses to the aeolian deposits throughout the Xinjiang Basin and reconstructed a three-dimensional sedimentary model for the intermontane deserts. We confirmed the existence of the typical intermontane paleo-desert and summarized in detail the differences between intermontane deserts and broad topographic deserts. We noticed that the “greenhouse” state during the Late Cretaceous seems to have been suitable for the development of deserts in intermontane basins due to the hot, arid climate conditions and penetrating winds with sufficient transport capacity. In addition, the provenance analysis of the intermontane desert proved the ultra-long-distance aeolian sediment transport, and it may enable by the strengthening of intermittent westerly winds during short-lived glacial episodes and the presence of a low-relief corridor that served as a transport pathway from source to sink. Therefore, we suggest the emergence and development of intermontane deserts in a near-future “greenhouse” world would contribute to the global desert expansion and massive desertification.

How to cite: Cao, S., Zhang, L., Mountney, N., and Wang, C.: An intermontane desert system: Sedimentology, mechanism, and provenance in Southeast China during the Late Cretaceous, EGU General Assembly 2023, Vienna, Austria, 23–28 Apr 2023, EGU23-4321, https://doi.org/10.5194/egusphere-egu23-4321, 2023.

EGU23-7184 | Orals | GM11.2

Characteristics of the landslides triggered by the extraordinary rainfall event occurred in Central Italy on September 15, 2022 

Federica Fiorucci, Marco Donnini, Michele Santangelo, Stefano Gariano, Francesco Bucci, Mauro Cardinali, Francesca Ardizzone, Ivan Marchesini, Massimo Melillo, Txomin Bornaetxea, Paola Salvati, Massimiliano Alvioli, Silvia Peruccacci, Maria Teresa Brunetti, Giuseppe Esposito, Omar Althuwaynee, Mina Yazdani, Bianchi Cinzia, and Susanna Grita

Timely and systematic collection of landslide information after a triggering event is essential for the definition of landslide trends in response to climate change. On September 15, 2022 Marche and Umbria regions, in Central Italy, were struck by an anomalous rainfall event that showed characteristics of a persistent convective system. An extraordinary cumulated rainfall of 419 mm was recorded by a rain gauge in the area in only 9 hours. It was carried out a systematic reconnaissance field survey to prepare an event landslide inventory map in an area of 550 km2 that includes a large neighbourhood of the area that recorded the highest rainfall intensity. The rainfall triggered 1687 landslides in the area affected by the peak rainfall intensity. Landslide area spans from a few tens of square meters to 105 m2, with a median value of 87 m2. We describe the characteristics of the landslides identified during a field survey conducted immediately after the event. Most of the mass movements are shallow, many are rapid (i.e., debris flows, earth flows) and widely affecting the road network. Many national and local roads were interrupted, mostly by earth and rock slides; national and local railways were interrupted at several points; extensive damage was registered to structures and infrastructures. Furthermore, field evidence revealed that a vast proportion of landslides occurred in the immediate vicinity of roads, mostly affecting road embankments and that a large number of landslides initiated within natural and semi-natural areas and hit the road network and, locally, affected houses and activities. Field surveys also revealed diffuse residual risk conditions, being a large proportion of landslides located in the immediate vicinity of infrastructures. Besides reporting the spatial distribution of landslides triggered by an extreme rainfall event, the data collected on landslides can be used to make comparisons with the distribution of landslides in the past, validation of landslide susceptibility models, definition of the general interaction between landslides and structures/infrastructures.

How to cite: Fiorucci, F., Donnini, M., Santangelo, M., Gariano, S., Bucci, F., Cardinali, M., Ardizzone, F., Marchesini, I., Melillo, M., Bornaetxea, T., Salvati, P., Alvioli, M., Peruccacci, S., Brunetti, M. T., Esposito, G., Althuwaynee, O., Yazdani, M., Cinzia, B., and Grita, S.: Characteristics of the landslides triggered by the extraordinary rainfall event occurred in Central Italy on September 15, 2022, EGU General Assembly 2023, Vienna, Austria, 23–28 Apr 2023, EGU23-7184, https://doi.org/10.5194/egusphere-egu23-7184, 2023.

EGU23-8005 | Posters on site | GM11.2

Modelling multi-decadal sediment delivery to rivers by debris flows and lahars with SedCas 

Georgina Bennett, James Christie, Jacob Hirschberg, Andrew Nicholas, Ellie Vahidi, and EvoFlood Team

Debris flows and lahars convey large quantities of sediment through fluvial systems in mountainous and volcanic regions. Constraining decadal to centennial patterns of sediment transport by these potentially destructive flows is crucial for understanding their drivers and subsequently modelling the evolution of downstream hazard and channel morphology with time. Relatively few modelling frameworks have been designed to capture sediment transport dynamics at these timescales. Existing models instead tend to either 1) simulate the runout of individual debris flow events or 2) forecast landscape evolution over longer millennial timescales. Our work seeks to address this research gap by developing SedCas. SedCas is a spatially lumped sediment cascade model developed to simulate decadal patterns of sediment transport by debris flows from the Illgraben, an Alpine catchment in Switzerland, into the Rhône River. Its relatively simple structure is computationally inexpensive and has enabled its use in forecasting debris flow hazard and sediment yield from the Illgraben over the 21st century in response to a range of climate change scenarios. Here, we present the first application and adaptation of the SedCas model framework to non-alpine catchments. Firstly, we simulate sediment transport by lahars in a catchment on the island of Montserrat which has been disturbed episodically by explosive volcanism between 1995 - present. In this model iteration, SedCas_Volcano, we account for variations in vegetation cover induced by eruptive events, in addition to water and sediment supply. The model results capture the first-order patterns (aggregate magnitude-frequency) of the largest observed lahars, and the timing and relative order of magnitude of fluctuations in sediment yield. Seasonal and interannual variations in lahar activity are not fully captured, however. We attribute these shortfalls to limitations of available data and the model not accounting for important dynamic hydrological processes that alter runoff generation on evolving volcanic deposits. These limitations in turn provide avenues of further research and development. Secondly, we present preliminary experiments to simulate bedload sediment delivery as input into a new global flood model that accounts for evolving channel geometry.

How to cite: Bennett, G., Christie, J., Hirschberg, J., Nicholas, A., Vahidi, E., and Team, E.: Modelling multi-decadal sediment delivery to rivers by debris flows and lahars with SedCas, EGU General Assembly 2023, Vienna, Austria, 23–28 Apr 2023, EGU23-8005, https://doi.org/10.5194/egusphere-egu23-8005, 2023.

EGU23-8219 | Orals | GM11.2

Runoff controls on stream network branching 

Hansjoerg Seybold, Minhui Li, and James Kirchner

The geometry of stream networks varies systematically with climate [1,2]. In humid regions diffusive processes seem to dominate the branching geometry of stream networks, resulting in wider branching angles close to 72 degrees, which is the theoretical angle for growth in a diffusive field [1,3]. In arid climates, on the other hand, channel networks display much narrower angles [1,2].

Here we show that the narrower angles in arid regions can be related to the higher frequency of extreme runoff events, which are more common in arid landscapes than in humid ones [4]. Erosion due to overland flow leads to incision which is more focused in the direction of regional topographic gradients and thus resulting in narrower branching angles as the influence of diffusive processes becomes weaker and weaker. Our analysis is based on flow frequency distributions derived from USGS gauging stations across the United States [4] and branching angles obtained from the USGS medium resolution National Hydrographic Dataset [1]. Our measurements show, that the tails of the flow frequency distributions become systematically heavier with aridity in the same way as branching angles become narrower.

This result suggests that the relative impact of diffusive network growth systematically decreases with increasing aridity as the landscape's Peclet number changes across a landscape with varying climate.


References:

[1] H. J. Seybold et al., Climate's watermark in the geometry of stream networks, GRL (2017)

[2]  A. Getraer & A. C. Maloof, Climate-Driven Variability in Runoff Erosion Encoded in Stream Network Geometry, GRL (2021)

[3] O. Devauchelle et al., Ramification of stream networks, PNAS (2012)

[4] M. W. Rossi et al., Precipitation and evapotranspiration controls on daily runoff variability in the contiguous United States and Puerto Rico, JGR (2016)


How to cite: Seybold, H., Li, M., and Kirchner, J.: Runoff controls on stream network branching, EGU General Assembly 2023, Vienna, Austria, 23–28 Apr 2023, EGU23-8219, https://doi.org/10.5194/egusphere-egu23-8219, 2023.

EGU23-9028 | ECS | Orals | GM11.2

Climate change effects on flooding at Lurin river basin, Peru 

Henry Asencios, Waldo Lavado, Evelin Sabino, Jonathan Qquenta, and Oscar Felipe

The magnitude and frequency of extreme precipitation events are expected to increase in central Peruvian Andes for this century, which will pose a significant challenge on water resources management and flood risk mitigation. The present study focuses on assessing the possible flood hazard under two different climate change scenarios (SSP 4.5 and SSP 8.5) in the lower part of the Lurin River watershed (~ 1642.5 Km2) by using a distributed physically-based hydrologic and erosional model (e.g. TREX) and a 2-D depth-averaged hydraulic and sediment transport model (e.g. BASEMENT-2D). The models were calibrated using hydrometeorological data corresponding to the extreme flood events of 2015 and 2017 and satellite-based and UAV-derived inundation maps. Future climate scenarios are going to be constructed from bias-corrected outputs of CMIP6 global climate models, while the rainfall temporal patterns for different return periods will be obtained from observed precipitation events corresponding to extreme flood events of El Niño 2017. Results are expected to provide important data needed to make policy changes to mitigate the negative impacts of climate change in the Lurin River basin. 

How to cite: Asencios, H., Lavado, W., Sabino, E., Qquenta, J., and Felipe, O.: Climate change effects on flooding at Lurin river basin, Peru, EGU General Assembly 2023, Vienna, Austria, 23–28 Apr 2023, EGU23-9028, https://doi.org/10.5194/egusphere-egu23-9028, 2023.

EGU23-9185 | ECS | Posters on site | GM11.2

Simulating dryland cliffs evolution in response to extreme rainstorms 

Yuval Shmilovitz, Matthew Rossi, Gregory Tucker, Benjamin Campforts, Joel Pederson, Efrat Morin, Moshe Armon, Yehouda Enzel, and Itai Haviv

Cliff bands are common in drylands and their evolution is often influenced by hydrogeomorphic processes. It has been previously suggested that cliff retreat patterns and morphology are affected by the properties and frequency-magnitude relations of rainstorms. However, basic questions on this topic persist because landscape evolution models typically do not account for the surface processes like runoff generation and sediment transport that occur under short-duration (sub-hourly) intense rainfall. Here we test the hypothesis that changes in rainstorm properties can systematically alter cliff retreat patterns and morphology. We developed a novel numerical model that simulates the response of cliffs and associated sub-cliff slopes to various rainstorm regimes to (1) identify dominant cliff morphologies, and (2) examine if extreme rainstorm properties are encoded in the topography. The new model utilizes the Landlab modeling toolkit and includes an explicit novel representation of surface processes that occur during short-duration rainstorms, including cliff-weathering, infiltration, runoff generation, clast fragmentation, and size-dependent sediment transport. Using a suite of numerical experiments, we vary model parameters and rainfall types and simulate changes in cliff retreat patterns and morphology. Our model results agree well with analytical predictions for cliff morphology under a control case of no transport on the sub-cliff slope, indicating a good representation of processes. Furthermore, sensitivity analyses on cases where sediment transport is explicitly included show that cliff evolution is highly dependent on both the grain size of sediment derived from the cliff and the rainfall intensities. These two factors can alter retreat patterns and determine whether and how fast the cliff can be buried under its own sediment. Numerical experiments based on rainfall and field measurements from the central Negev desert (eastern Mediterranean) demonstrate that including the dynamics of high-intensity rainfall and sediment grain size can help explain observed topographic trends. In addition, for a given imposed storm depth, we find that the rainstorm intensities pattern strongly influences both the cliff retreat and its morphology. Short rainstorms with higher intensities are much more erosive than longer storms with lower intensities. This latter case frequently triggers cliff burying. Taken as a whole, our results demonstrate that cliff evolution and morphology are significantly affected by storm-scale sediment transport dynamics and thus highlight the importance of incorporating high-resolution rainfall forcing into landscape evolution models of dryland landforms.

How to cite: Shmilovitz, Y., Rossi, M., Tucker, G., Campforts, B., Pederson, J., Morin, E., Armon, M., Enzel, Y., and Haviv, I.: Simulating dryland cliffs evolution in response to extreme rainstorms, EGU General Assembly 2023, Vienna, Austria, 23–28 Apr 2023, EGU23-9185, https://doi.org/10.5194/egusphere-egu23-9185, 2023.

EGU23-10832 | ECS | Orals | GM11.2

Decoupling of Rub’ al Khali Quaternary dune record and paleoclimate 

Andrew Gunn, Ryan Ewing, and Josephine Brown

The climate history of wind-blown dune fields is commonly determined by dune morphology, stratigraphy and age. These properties in the Rub’ al Khali have been used to interpret climate history relevant to human dispersal and monsoon variability during the glacial cycles. An underlying assumption of some of these interpretations is that the time it takes dunes to respond to a change in climate is shorter than the time over which climate changes. Here we show that this assumption does not always hold. We do this by comparing the bedform reconstitution time Tr (i.e., the time taken for sand to be completely reworked within a dune) to a climate persistence time Tc (i.e., how long dune-relevant wind properties stay the same). Tr is found using modern wind reanalysis and topography data, and Tc using paleoclimate simulations. Where Tr>Tc, climate varies too fast to be recorded in dune properties. In some areas of the Rub’ al Khali, Tr is longer than the time between glacial cycles, so dune properties and modern climate are decoupled. We extend this case study to a general theory to assess if wind-blown dunes properties can be used to interpret past climate.

How to cite: Gunn, A., Ewing, R., and Brown, J.: Decoupling of Rub’ al Khali Quaternary dune record and paleoclimate, EGU General Assembly 2023, Vienna, Austria, 23–28 Apr 2023, EGU23-10832, https://doi.org/10.5194/egusphere-egu23-10832, 2023.

EGU23-11075 | ECS | Posters on site | GM11.2

A USLE and SCS-CN coupled approach for design sediment yield prediction 

Ishan Sharma, Surendra Kumar Mishra, Ashish Pandey, Henok Mekonnen Aragaw, and Vijay P Singh

Knowledge of sediment yield is essential for predicting and mitigating the impact of natural disasters such as floods and landslides as well as for managing water resources and ecosystems of a region. It has been found that a considerable portion of sediment yield is sometimes generated from extreme rainfall events of high magnitude and intensity compared to that from myriad small rain events. Therefore, it is vital to accurately predict sediment yield resulting from extreme storms of varying durations, especially from data-scarce regions. This study proposes an empirical approach based on the Universal Soil Loss Equation (USLE) and Soil Conservation Service-Curve Number (SCS-CN) methods integrated with a sediment yield model to predict sediment yield resulting from a storm of desired duration (d) and recurrence interval (T). To this end, the potential erosion (A) is empirically related to ‘d’ and ‘T’ and the empirical relation is calibrated and validated on the data of ten sub-watersheds of Ashti catchment, India, involving annual maximum rainfall (observed), runoff (daily observed) and sediment (daily SWAT simulated). The model performance is evaluated using Nash-Sutcliffe Efficiency (NSE), Coefficient of Determination (R2), Percent Bias (PBIAS), Normalized Root Mean Square Error (nRMSE), and visually by scatter plots. The model was calibrated with high NSE, low nRMSE and PBIAS values in all the sub-watersheds (NSE>0.85, PBIAS< ±10% and 0.156< nRMSE <0.216). In validation, the performance was also excellent (0.77≤ NSE ≤0.98 mean value = 0.86, PBIAS ≤ ±20%, and 0.86≤ R2≤ 0.99 mean value = 0.95) in 9 out of 10 sub-watersheds. Additionally, a correlation matrix between catchment physiographic characteristics (terrain slope, stream length and size) and calibrated empirical parameters (‘α’, ‘β’, ‘m’ and ‘n’) was developed, indicating stream length influences these parameters more than size and slope.

How to cite: Sharma, I., Mishra, S. K., Pandey, A., Aragaw, H. M., and Singh, V. P.: A USLE and SCS-CN coupled approach for design sediment yield prediction, EGU General Assembly 2023, Vienna, Austria, 23–28 Apr 2023, EGU23-11075, https://doi.org/10.5194/egusphere-egu23-11075, 2023.

EGU23-14068 | Posters on site | GM11.2

18O Analyses of bulk lipids as a novel palaeoclimate tool in loess research - a pilot study 

Michael Zech, Jakob Labahn, Lucas Bittner, Christopher Roettig, Diana Burghardt, Slobodan Markovic, and Bruno Glaser

The analysis of the stable oxygen isotopes 18O and 16O has revolutionised palaeoclimate research since the middle of the last century. Particularly, 18O of ice cores from Greenland and Antarctica is used as a palaeotemperature proxy and 18O of deep-sea sediments is used as a proxy for global ice volume. Important terrestrial archives to which 18O as palaeoclimate proxy is successfully applied are speleothems, lake sediments or tree rings. By contrast, 18O applications to loess-palaeosol sequences (LPSs) are scarce, despite for instance a compound-specific 18O analytical tool for sugar biomarkers was developed and presented already years ago (Zech et al., 2014). Here we present a first continuous 18O record (n=50) for the LPS Crvenka in Serbia, SE Europe, spanning the last glacial-interglacial cycle. From a methodological point of view, we took advantage of a recently proposed palaeoclimate/-hydrological tool/proxy based on bulk 18O analyses of plant-derived lipids. The 18O lipid values range between −10.2‰ and +23.0‰ and are systematically more positive in the interglacial and interstadial (paleo-)soils compared to the loess layers. In our presentation, we compare our 18O lipid record from the LPS Crvenka with the marine oxygen-isotope stages as well as with the Greenland 18O ice core records revealing the famous Dansgaard-Oeschger events (stadials and interstadials). Concerning the interpretation of our LPS 18O lipid record, we will discuss several influencing factors, such as temperature-control on 18O, evaporative leaf water enrichment, post-sedimentary effects and pool-effects.

References

Labahn, J., Bittner, L., Hirschmann, P., Roettig, C., Burghardt, D., Glaser, B., Marković, S. and Zech, M., 2022. 18O analyses of bulk lipids as novel paleoclimate tool in loess research – a pilot study. E&G Quaternary Science Journal 71, 83-90.

Zech, M., Mayr, C., Tuthorn, M., Leiber-Sauheitl, K. and Glaser, B., 2014. Reply to the comment of Sternberg on "Zech et al. (2014) Oxygen isotope ratios (18O/16O) of hemicellulose-derived sugar biomarkers in plants, soils and sediments as paleoclimate proxy I: Insight from a climate chamber experiment”. GCA 126, 614-623. Geochimica et Cosmochimica Acta 141, 680-682.

How to cite: Zech, M., Labahn, J., Bittner, L., Roettig, C., Burghardt, D., Markovic, S., and Glaser, B.: 18O Analyses of bulk lipids as a novel palaeoclimate tool in loess research - a pilot study, EGU General Assembly 2023, Vienna, Austria, 23–28 Apr 2023, EGU23-14068, https://doi.org/10.5194/egusphere-egu23-14068, 2023.

EGU23-14873 | Orals | GM11.2

Lithology, mineralogy, geochemistry and chronostratigraphy of heavy-mineral bearing dune sands in the Podravina, northeastern Croatia 

Koen Beerten, Nina Hećej, Mihajlo Pandurov, Branko Kordić, Petar Stejić, Rodoljub Gajić, Ajka Šorša, and Lidija Galović

The Đurđevac Sands constitute a wide area of extraordinary small-scale dune relief in the Podravina (northeastern Croatia), along the central part of the southern Drava river valley. They are thought to have been formed by reworking of fluvial material due to strong northern winds. Their significance is evident from the geometry of the dunes (shape, orientation, thickness), and the presence of intra- and post-formational alteration (pedogenesis). In addition, the elevated heavy mineral content puts the sands in the position of potential ore deposit.

The objective of this study is to explore this aeolian archive in an attempt to extract relevant palaeo-environmental information and to compare it with similar landscapes across Europe. The lithology (grain-size) and intra-formational alteration (palaeosoils) as well as geochemical signatures are investigated from outcrops in an abandoned sand pit to define phases of sand movement and landscape stability. Radiocarbon dating of charcoal, optically stimulated luminescence (OSL) dating of quartz, and historical archives are used to develop a geochronological framework. The heavy and light mineral fractions of the sands are used to determine their composition, provenance and detailed sedimentological context at the time of deposition. A digital elevation model of the region is used to gain insight into the geometry of the dunes, while geo-electric soundings and mechanical coring are applied to investigate the vertical and lateral variations in sand lithology and thickness, as well as intraformational soils.

At first sight, the dune landscape seems to have a chaotic nature, showing an irregular alignment of smaller parabolic, linear and domal shaped dunes. Although, larger structures may also be classified as complex long-walled transgressive dunes or compound en-echelon parabolic dunes. The thickness of the dune sand can clearly be traced on geo-electrical profiles, where the dry dune sand appears to generate a different signal than the underlying water-saturated fluvial material. Furthermore, the results show that phases of sand movement occurred before and after the Bølling-Allerød (B-A) interstadial, as well as during the early Holocene and up to the 19th century. Phases of stability are witnessed by the presence of slightly altered parent material (presence of organic carbon, slightly finer grain size, and decalcified) and are dated to the B-A interstadial, and several episodes in the Holocene. The heavy mineral content is dominated by garnet, while muscovite is strikingly more present in the Holocene sediments. This may be due to either a change in source material (new Holocene Drava river sediment) and/or changing aeolian dynamics. Overall, these new findings obtained from the Đurđevac Sands area correlate rather well with other regions in the Pannonian Basin as well as the North European Plain, especially in terms of the timing of events.

How to cite: Beerten, K., Hećej, N., Pandurov, M., Kordić, B., Stejić, P., Gajić, R., Šorša, A., and Galović, L.: Lithology, mineralogy, geochemistry and chronostratigraphy of heavy-mineral bearing dune sands in the Podravina, northeastern Croatia, EGU General Assembly 2023, Vienna, Austria, 23–28 Apr 2023, EGU23-14873, https://doi.org/10.5194/egusphere-egu23-14873, 2023.

EGU23-15175 | ECS | Posters on site | GM11.2 | Highlight

Calcium sulphate-wedge formation in deposits from the Aroma alluvial fan as indicator for haloturbation in the Atacama Desert 

Aline Zinelabedin, Benedikt Ritter, Joel Mohren, and Tibor J. Dunai

Polygonal patterned grounds on the Earth’s surface are typically associated with subsurface-wedge structures in periglacial environments. The presence of such wedges is usually taken as an indicator for cryogenic processes in the subsurface, which form a characteristic vertically laminated sequence. However, similar structures can be found in the subsurface of the Aroma fan in the Central Depression of the Atacama Desert in northern Chile. Within the salt-bearing deposits of the alluvial fan, the calcium-sulphate wedges appear to be preliminary formed by haloturbation and may represent the hyperarid equivalent to periglacial wedge structures. The characteristic vertical lamination of the wedges contains calcium-sulphate phases accompanied by clastic minerals, as found by X-ray diffraction and X-ray fluorescence analyses. Hence, the calcium-sulphate phases in the wedges are assumed to be potential drivers for salt dynamics causing subsurface wedge-growth and surface polygonal patterned ground formation. Due to varying water availability in a generally extremely water-limited environment, these salt dynamics possibly led to significant volumetric changes in the deposits induced by dissolution and (re)precipitation of salts from infiltrating solutions and phase transitions of calcium-sulphate phases.

The subsurface-wedge network of the Aroma-fan outcrop is covered by a ~ 20 cm thick calcium sulphate-bearing surface crust, which potentially covered a polygonal patterned ground. The formation and preservation of the surface crust might indicate an amplification of arid conditions leading to the inhibition of wedge growth in the subsurface. To unravel the mechanisms and governing environmental conditions of calcium-sulphate wedge and crust formation at the Aroma site, we present various mineralogical, geochemical, and sedimentological data of wedge and crust material.

Furthermore, we applied geochronological methods to resolve wedge-growth phases and episodes of local moisture supply. We tested meteoric 10Be dating and post-infrared infrared stimulated luminescence (post-IR IRSL) dating on wedge material to gain information on the evolution and activity of wedge growth under arid to hyperarid conditions. Such geochronological data is indispensable for using the wedges as terrestrial proxy record for the palaeoclimate in the northern Atacama Desert.

How to cite: Zinelabedin, A., Ritter, B., Mohren, J., and Dunai, T. J.: Calcium sulphate-wedge formation in deposits from the Aroma alluvial fan as indicator for haloturbation in the Atacama Desert, EGU General Assembly 2023, Vienna, Austria, 23–28 Apr 2023, EGU23-15175, https://doi.org/10.5194/egusphere-egu23-15175, 2023.

EGU23-15791 | Orals | GM11.2

Long-term hydrologic connectivity on the Australian dryland margins: evidence from the Willandra Lakes World Heritage Area over the last 60 ky 

Kathryn Fitzsimmons, Markus Fischer, Maike Nowatzki, Tobias Lauer, Kanchan Mishra, and Nicola Stern

The recent catastrophic flooding across the world’s driest inhabited continent – Australia – has highlighted an urgent need to understand the climatic (atmospheric) and hydrological (land surface) mechanisms comprising hydroclimate. Records of past hydrologic change may help in this endeavor by informing us about different hydroclimate states and their manifestation on the land surface. By virtue of its antiquity, aridity and relative paucity of available sediment, however, the Australian continent preserves few records of long-term hydroclimate. As a result, we know little about long-term water availability and the drivers of surface hydrology and climate circulation, particularly for the dry inland regions where water resources and sensitive land surfaces need to be carefully managed.


One of the few areas in dryland Australia which preserves semi-continuous deposition of hydrologic change is the Willandra Lakes system. The Willandra Lakes are located on the semi-arid desert margin of southeastern Australia, yet its headwaters lie in the temperate eastern highlands. Long-term lake filling and drying is consequently driven by rainfall in the headwaters and hydrologic connectivity both across the catchment and between the lakes. These environmental changes – both long and short in duration – are recorded in the sediments of the downwind transverse dunes (lunettes). In this study we investigate long-term hydrologic connectivity across the catchment and between the lakes. Our approach uses a novel integration of both classical lake-level reconstruction based on lunette sedimentology, stratigraphy and luminescence geochronology, with hydrologic modelling of key event time slices over the last 60 ky, fed into a palaeoclimate model. We characterize the land-surface response to various hydroclimate states, so improving our understanding of dryland atmosphere-hydrosphere interactions.


How to cite: Fitzsimmons, K., Fischer, M., Nowatzki, M., Lauer, T., Mishra, K., and Stern, N.: Long-term hydrologic connectivity on the Australian dryland margins: evidence from the Willandra Lakes World Heritage Area over the last 60 ky, EGU General Assembly 2023, Vienna, Austria, 23–28 Apr 2023, EGU23-15791, https://doi.org/10.5194/egusphere-egu23-15791, 2023.

EGU23-16209 | Orals | GM11.2

Application of a deep learning framework to explore transfer learning for dune mapping across regions 

Maike Nowatzki, David Thomas, and Richard Bailey

Dune mapping is a traditional task for aeolian geomorphologists and has made use of satellite imagery since the 1970s (Breed & Grow, 1979). Labour-intensive manual mapping approaches are increasingly substituted by (semi-)automated ones that apply progressive Machine Learning algorithms (Zheng et al., 2022). Advanced techniques such as neural networks enable the creation of powerful computational models to automatically map dune fields (Shumack et al., 2020; Rubanenko et al., 2021). Globally available satellite imagery datasets and the progression of computational infrastructure and power facilitate the operation of increasingly elaborate models and their application to spatially extensive regions. A lack of training and validation datasets for such dune mapping models and the subjective and time-consuming nature of their creation, however, remains a challenge.

We present a framework that uses Deep Learning and different types of satellite imagery to map dune crests. It comprises automated modules to (1) retrieve and pre-process training and prediction data, (2) train a neural network (U-Net; Ronneberger et al., 2015), and (3) identify dune crests in unlabelled target areas applying the trained model. The framework has shown good performance mapping linear dunefields in the Kalahari Desert using a small training and validation dataset (130 labelled 960mx960m tiles).

Addressing the lack of global training data, we use our model to explore the possibilities of transfer learning and the universality of regional training datasets. In our main case study, we assess whether a model trained on satellite data of linear dunes in the Kalahari can be applied to map linear dunes in regions containing morphologically similar dunes in the Australian deserts.


Breed, C. S., & Grow, T. (1979). Morphology and distribution of dunes in sand seas observed by remote sensing. A study of global sand seas, 1052, 253-302.

Ronneberger, O., Fischer, P., & Brox, T. (2015, October). U-net: Convolutional networks for biomedical image segmentation. In International Conference on Medical image computing and computer-assisted intervention (pp. 234-241). Springer, Cham.

Rubanenko, L., Pérez-López, S., Schull, J., & Lapôtre, M. G. (2021). Automatic Detection and Segmentation of Barchan Dunes on Mars and Earth Using a Convolutional Neural Network. IEEE Journal of Selected Topics in Applied Earth Observations and Remote Sensing, 14, 9364-9371.

Shumack, S., Hesse, P., & Farebrother, W. (2020). Deep learning for dune pattern mapping with the AW3D30 global surface model. Earth Surface Processes and Landforms, 45(11), 2417-2431.

Zheng, Z., Du, S., Taubenböck, H., & Zhang, X. (2022). Remote sensing techniques in the investigation of aeolian sand dunes: A review of recent advances. Remote Sensing of Environment, 271, 112913.

How to cite: Nowatzki, M., Thomas, D., and Bailey, R.: Application of a deep learning framework to explore transfer learning for dune mapping across regions, EGU General Assembly 2023, Vienna, Austria, 23–28 Apr 2023, EGU23-16209, https://doi.org/10.5194/egusphere-egu23-16209, 2023.

EGU23-154 | ECS | Posters virtual | NH10.1

Challenges for assessing the risk of compound extremes 

Ravi Kumar Guntu, Bruno Merz, and Ankit Agarwal

The effects of compound extremes (for example, Compound dry hot extremes (CDHE)) in a region simultaneously are more adverse than those of individual dry or hot events. The likelihood of such events depends on the marginal distribution of drivers and their dependence. An approach to assess CDHE probability is urgent because of their frequent occurrence caused by global warming. This study shows how CDHE probability changes with the selection of reference period. We considered the WMO recommended period 1961-1990 and a recent climate normal 1991-2020 to show the effect of the reference period on the likelihood. We applied the framework to homogenous regions of India during the monsoon season. Insights show that CDHE is more likely to occur in arid regions than in other climatic regions. The results of this study are useful for further exploration and provide new insights into the emerging changes in CDHE.


How to cite: Guntu, R. K., Merz, B., and Agarwal, A.: Challenges for assessing the risk of compound extremes, EGU General Assembly 2023, Vienna, Austria, 23–28 Apr 2023, EGU23-154, https://doi.org/10.5194/egusphere-egu23-154, 2023.

EGU23-717 * | ECS | Posters on site | NH10.1 | Highlight

A continental-scale multi-hazard analysis of economic recovery using nighttime light satellite data 

Sophie L. Buijs, Marleen C. de Ruiter, and Philip J. Ward

Risk assessments and disaster management are generally approached from a single-hazard perspective, ignoring the spatial and temporal connections and feedback loops that are involved when consecutive disasters occur. Not only can the total impact of a multi-hazard event differ from the sum of the impacts of the individual events, but the response and recovery process can also be more challenging for multi-hazard events when compared to a single-hazard disaster. Depletion of financial and human resources after a first hazard may for instance increase people’s vulnerability at the time of a second event. This was demonstrated in northern Mozambique, where tropical cyclones Idai and Kenneth made landfall only six weeks apart, early 2019. Despite continued high needs and dependence on humanitarian aid after the second event, UN agencies and partners struggled to provide additional support, due to exhausted stocks and funds after their initial response efforts to Idai. 

This study (that is part of the MYRIAD-EU project), focuses on post-disaster recovery, which is an often overlooked and misunderstood component of the disaster management cycle. A single-hazard approach to understanding recovery does not sufficiently reflect the complexity that is involved in multi-hazard events due to the potential feedbacks and interactions between hazards and their effects. While several recent studies have made efforts to improve our understanding of the relationships between single natural hazards and the recovery thereafter, recovery dynamics after multi-hazard events are still poorly understood. Additionally, the studies that have looked into recovery after natural disasters are often focussed on a single hazard type or limited set of extreme events in a specific region. To address this knowledge gap, this study sets out to compare economic recovery after multi-hazard events and single-hazard events on a continental scale.

Visible Infrared Imaging Radiometer Suite Nighttime Light (VIIRS NTL) data (2013-2022) are used as a proxy for economic recovery. To characterize recovery after different single- and consecutive events, accounting for geological, meteorological, and hydrological hazards, monthly changes in night light intensity are computed. A comparison of the recovery profiles of single- and multi-hazard events will then result in an improved understanding of the different trends and dynamics that are involved with economic recovery after multi-hazard events. The results of this study can be used by policy-makers and aid organizations to improve their disaster management strategies. Moreover, the resulting characterisation of economic recovery after single- and multi-hazard events will support future research into the identification of socio-economic factors that affect the recovery in a multi-hazard context.

How to cite: Buijs, S. L., de Ruiter, M. C., and Ward, P. J.: A continental-scale multi-hazard analysis of economic recovery using nighttime light satellite data, EGU General Assembly 2023, Vienna, Austria, 23–28 Apr 2023, EGU23-717, https://doi.org/10.5194/egusphere-egu23-717, 2023.

EGU23-800 | ECS | Orals | NH10.1

A Novel Method to Generate Global Multi-Hazard Event Sets 

Judith Claassen, Philip Ward, Elco Koks, James Daniell, Timothy Tiggeloven, and Marleen De Ruiter

While the last decade saw substantial scientific advances in studies aimed at improving our understanding of natural hazard risk, research and policy commonly address risk from a single-hazard, single-sector perspective. Thus, not considering the spatial and temporal interconnections of these events. Single-hazards risk analyses are often inaccurate and incomplete when multi-hazard disasters occur, as the interaction between them may lead to a different impact than summing the impacts of single events.

A key first step to reduce this inaccuracy is to create greater understanding of realistic multi-hazard event sets that better examines statistical dependencies between hazard types. Therefore, it is important to understand the spatial and temporal aspects of each individual hazard in order to evaluate when multiple coinciding hazards are a multi-hazard event. To do so, single hazards datasets for meteorological, geological, hydrological and climatological events are explored with the use of a decision tree. The decision tree accounts for varying intensities and time-lags between hazards to better address the dynamics of vulnerability. This paper provides a decision tree that enables realistic multi-hazard event sets to be created based on varying assumptions (such as, the time-lag, the time between two individual hazards). By generating a, first of its kind, global multi-hazard event set database, spanning from 2004 to 2016, we achieve a greater knowledge of the different types of multi-hazards, such as triggering, amplifying, compound and consecutive events, as well as their interconnections. This global dataset provides practitioners and other stakeholders with insights on the frequency of different multi-hazard events and their hotspots. The methods provided in this paper is opensource and can be used by other researchers to conduct a more comprehensive multi-risk assessment.

How to cite: Claassen, J., Ward, P., Koks, E., Daniell, J., Tiggeloven, T., and De Ruiter, M.: A Novel Method to Generate Global Multi-Hazard Event Sets, EGU General Assembly 2023, Vienna, Austria, 23–28 Apr 2023, EGU23-800, https://doi.org/10.5194/egusphere-egu23-800, 2023.

EGU23-892 | ECS | Posters on site | NH10.1

A spatiotemporal indicator-based method to assess the drought and heat risks for urban green infrastructure 

Raghid Shehayeb, Regine Ortlepp, and Jochen Schanze

Given the significance of urban green infrastructure (UGI) and their ecosystem services (ES) towards urban climate resilience and sustainable development, a practical method to assess the drought and heat risks for UGI is needed for understanding the risks, selecting reduction alternatives and protecting the benefits of UGI. Hence, this study develops a spatiotemporal indicator-based method, based on a conceptual drought and heat risk assessment framework, which supports decision makers in analyzing and evaluating risks under changing conditions, and selecting risk-reduction alternatives. The UGI types of parks, creeks, and lakes are selected as representative UGI for this study for developing the assessment method. Subsequently, endpoints as variables of the biophysical risk system are derived considering the processes of drought and heat hazards, exposed UGI entities, ecosystem functions and ES. The biophysical endpoints such as biota, soil-water dynamics, and UGI’s cultural uses, are then translated into information with descriptors explaining their vulnerability aspects following a multi-layer approach and interpreted over three dimensions of provisioning, regulating, and cultural. The multi-layer approach states that the layers of descriptors are accompanied with layers of indicators as a mean to operationalize these characteristics. A two-stage literature review is applied to identify vulnerability indicators for the defined descriptors, whereas a lane-based approach is followed to interrelate these indicators based on their qualities we refer to as attributes. Using the attributes of the drought and heat hazards, the vulnerability indicators are linked with the hazards to derive risk indicators. By introducing these vulnerability and risk indicators, we pave the road for the analysis and evaluation of compound risks to support the decision makers in planning and managing UGI and protecting their ES under these risks. 

How to cite: Shehayeb, R., Ortlepp, R., and Schanze, J.: A spatiotemporal indicator-based method to assess the drought and heat risks for urban green infrastructure, EGU General Assembly 2023, Vienna, Austria, 23–28 Apr 2023, EGU23-892, https://doi.org/10.5194/egusphere-egu23-892, 2023.

EGU23-1658 | ECS | Orals | NH10.1

Exploring disaster risk management pathways in complex, multi-risk systems using DAPP-MR 

Julius Schlumberger, Marjolijn Haasnoot, Jeroen Aerts, and Marleen de Ruiter

Climate change and socioeconomic developments are driving risks from natural hazards and thus determine the effectiveness and efficiency for disaster risk management strategies. With DAPP-MR, an approach to apply a decision-focused lens, and a longer-term planning perspective in multi-risk systems has been recently developed. DAPP-MR  guides the exploration of disaster risk management pathways under uncertainty while explicitly accounting for trade-offs and synergies of policy measures across (interconnected) sectors, hazards, and time.

This work provides a first insight into the utility of the DAPP-MR framework to support disaster risk management decision making in the complex context of multi-hazard, multi-stakeholder settings. We used an integrated impact assessment modelling environment to assess (multi-)hazard impacts in a synthetic river basin, capturing interests and dynamics of three sectors (agriculture, inland shipping, residential housing) exposed to interacting flood and drought-hazards. We showcase (interactive) methods and metrics for the analysis and evaluation of potential risk management pathways. They were selected to deal with the increasingly multi-objective set-up in multi-risk systems  explicitly capturing and explore effects from integrating measures directed towards different hazards and sectors.

How to cite: Schlumberger, J., Haasnoot, M., Aerts, J., and de Ruiter, M.: Exploring disaster risk management pathways in complex, multi-risk systems using DAPP-MR, EGU General Assembly 2023, Vienna, Austria, 23–28 Apr 2023, EGU23-1658, https://doi.org/10.5194/egusphere-egu23-1658, 2023.

EGU23-2155 | ECS | Posters on site | NH10.1

EroCA: a new tool for simulating constructed landform erosion 

Shahla Yavari, Neil McIntyre, Qi Shao, and Thomas Baumgartl

Extensive disturbances during the mining and rehabilitation process can include removal of vegetation, removal and storage of soils hence their modification, changes in topography, and planting of new vegetation. A main goal of mine rehabilitation is to produce a post-mining landscape that is resistant to geotechnical failure and to surface erosion processes. To achieve this, hydrology and erosion models are required to determine erosion rates under alternative landscape designs, including landscape form and cover options.

By critical review of the relevant literature, it was found that most previous erosion modelling studies have concentrated on surface hydrology in agricultural, forestry, and other natural systems, while disturbed ecosystems like mining regions have received little attention. Landscape evolution models have been developed for mined landform applications but modelling over long time-scales compromises the temporal and spatial resolution.

The main objectives of this research therefore were:

  • Extend an existing plot-scale hydrological model to plot-scale erosion model.
  • To improve knowledge of the errors and uncertainty in applying a high-resolution erosion model to mined landforms and to conclude on the potential applicability and limitations of EroCA.

The experimental data used in the research were from a 30 m × 30 m field plot on a mine waste rock dump in the wet tropical environment of the Ranger mine (north-east Australia) from the period 2009 to 2014. The new EroCA model is an extension to the RunCA model, which was developed to provide high resolution simulation of runoff and infiltration in constructed landforms. The extended model uses mass balance principles and established erosion and sediment transport models, covering both suspended and bedload, and solves the equations using the cellular automata approach. Code verification against analytical solutions of runoff and sediment illustrated small errors, which were partly due to approximations used in the analytical solutions. The EroCA model was then applied to the Ranger experimental plot data to assess the suspended and bedload erosion performance. EroCA was able to reasonably represent the observed flows and turbidity profiles. Although an arbitrary reduction in the erodibility parameter value of 20% per year was needed to simulate the bedload depletion.

How to cite: Yavari, S., McIntyre, N., Shao, Q., and Baumgartl, T.: EroCA: a new tool for simulating constructed landform erosion, EGU General Assembly 2023, Vienna, Austria, 23–28 Apr 2023, EGU23-2155, https://doi.org/10.5194/egusphere-egu23-2155, 2023.

EGU23-2413 | Posters on site | NH10.1

An operational tool for geo-hydrological scenario risk assessment and cascading effects evaluation 

Daniela Biondi, Graziella Emanuela Scarcella, and Pasquale Versace

Building multiple, complex risk scenarios is a priority for the improvement of the effectiveness of early warning systems and technical countermeasure designs to detect phenomena associated with severe weather events, such as floods and landslides.

This study introduces CERCA (Cascading Effects in Risk Consequences Assessment), a methodology for the characterisation of event scenarios that is consistent with the current Italian Civil Protection Guidelines on the national warning system for weather-related geo-hydrological and hydraulic risks.

The aim is to propose a simple, effective, multiscale operational tool that can be adapted to multiple purposes. Specifically, the methodology frames the problem as a typical scenario analysis through the assessment of possible cascading effects and consequences characterised by a cause/effect relationship produced by a triggering event. The proposed conceptual framework for ‘cascade scenario’ assessment consists of four stages, referring to the characterization of:

  • Triggering Events,
  • cascading effects in terms of Representative Elementary Phenomena,
  • cascading effects in terms of Damaged Elements at Risk,
  • Fatalities Circumstances.

The CERCA approach can be effective:

  • in processing post-disaster information at the local level to identify site-specific dependencies based on local hazard proneness and exposure and vulnerability conditions as well as to prioritize countermeasures;
  • in supporting efficient surveillance of the real-time evolution of critical situations, helping operative structures of civil protection to update the picture of occurring phenomena;
  • in providing general dependency matrices to be used in the ‘ex-ante’ definition of scenarios and recurring cascading event trees, through analysis of several past events.

The methodology was assessed using a case study concerning a local event occurred in 2015 in the north-east of Calabria (Italy) and a back-analysis on 152 events in warning zones of the Italian territory that occurred during the period 2004–2021.

The first application aimed at illustrating CERCA functionality in describing cascading effects based on a post-disaster survey at a local level for a heavy rainfall event that caused flooding of various streams and widespread shallow landslides.

The national-scale back-analysis offered an overview of the chains generated by triggering events. The analysis showed that in over 50% of investigated cases, more than one triggering event was observed (most of the time floods accompanied by landslides), confirming the necessity for multi-risk analysis. ‘Pluvial flood’, particularly affecting urban areas, was the most frequent triggering event with 30%, mainly causing damage to basement or ground floor/yards of public and private buildings and to transport infrastructure. A detailed characterisation of the circumstances of death for 52 fatalities, further specified that the majority were flood-related fatalities (82%). Numerous people were affected outdoors along roads (35%) and travelling in vehicles (37%). Dependency matrices based on a frequency analysis, provided an overall picture of relations between different elements of the chain that, although limited to the number and type of investigated events, offers a preliminary assessment for further studies that could explore also the dependency from the severity of the forcing rainfall.

How to cite: Biondi, D., Scarcella, G. E., and Versace, P.: An operational tool for geo-hydrological scenario risk assessment and cascading effects evaluation, EGU General Assembly 2023, Vienna, Austria, 23–28 Apr 2023, EGU23-2413, https://doi.org/10.5194/egusphere-egu23-2413, 2023.

EGU23-2514 | Posters on site | NH10.1

The multi-hazard risk perception of young professionals and students in Geography and Tourism amid the Covid-19 pandemic 

Mihai Ciprian Margarint, Sanja Kovačić, Andra-Cosmina Albulescu, and Đurđa Miljković

Multi-hazard risk perception represents a research subject that has been gaining momentum in the context of the Covid-19 pandemic, based on the interaction between management practices aiming to reduce infection rates and to reduce the impact of other co-occurring natural hazards. The concurrent hazards proved to be the source of many hurtful, high-cost, but still invaluable lessons that should be capitalised on by the new generations to progress towards improved multi-hazard management strategies, and to a more sustainable, resilient and equitable society, as proposed by the 2030 Agenda for Sustainable Development. However, such high-level orders cannot be obtained without an adequate understanding of the new challenges posed by multi-hazard risks.

This paper aims to investigate the multi-hazard risk perception of young professionals or students who follow education programmes that aim to develop knowledge and skills related to the very subject of perception (i.e., natural hazards and risks). Zooming in, the paper focuses on the specialization and study level-dependent differences concerning multi-hazard risk perception and hazard-related education insights of future potential specialists in natural hazard-induced risk management and tourism reconstruction. The most prominent research questions (What is the perception of the students and graduates regarding the extent to which the Covid-19 pandemic has amplified the impact of other risks ?, Are there differences in the perception of Geography/ Tourism students and graduates about the impact of different natural hazards on social and economic activities?), as well as secondary aspects of the inquiry were addressed by applying a multi-level questionnaire on 547 students and graduates of Geography and Tourism specializations from two universities in Iași City (Romania) and Novi Sad (Serbia).

The implementation of the t-test pointed out that the main specialization-dependent differences concerned the perception level of certain natural hazards at different sales, the estimation of the impact of different hazards on socio-economic activities (including tourism), and the estimation of the positive effects of hazard-related education. These differences are complemented by the ones that depend on the level of study, which were analyzed through ANOVA and referred the scale of the impact specific to biophysical hazards, the amplification effect of the pandemic on different hazard and vulnerability types, and the different education cycles that the Curriculum upgrade should be performed at. It should be noted that no statistically significant differences emerged between Geography and Tourism students and graduates regarding the impact of the Covid-19 pandemic on training / career. On the other hand, Bachelor and Master level participants reported to be more affected by the pandemic than respondents from the highest tire of university education.

This study represents the first of its type, as it offers valuable insights on the multi-hazard risk perception of students and graduates that may acquire future decision-making, hazard-related research or teaching jobs. Understanding the opinions formed in their training years or in early-career stages provides important cues about tomorrow’s hazard management, and tourism reconstruction practices.

How to cite: Margarint, M. C., Kovačić, S., Albulescu, A.-C., and Miljković, Đ.: The multi-hazard risk perception of young professionals and students in Geography and Tourism amid the Covid-19 pandemic, EGU General Assembly 2023, Vienna, Austria, 23–28 Apr 2023, EGU23-2514, https://doi.org/10.5194/egusphere-egu23-2514, 2023.

The third decade of the century started with a major epidemiological disturbance that favoured the increase in the co-occurrence of hazards in both developed and developing countries. This translated into a multi-hazard research boost, aiming to explore the interactions between concurrent or cascading hazards, but also to propose improved multi-hazard management strategies.

Since floods represent frequent and impactful natural hazards, their spatial and temporal overlap with the Covid-19 pandemic resulted in compounded negative effects that are difficult to mitigate applying classical flood management plans. In return, the efforts of curbing SARS-CoV-2 infection rates become even more of a tall order during flood events. Therefore, both flood and pandemic management practices need to be amended considering each other’s aims, priorities, limitations, and strengths; which cannot be achieved without a proper understanding of the ways the two hazards interact.

This study questions whether the river flood events that occurred during the Covid-19 pandemic in Romania, and the way that they were managed, had an impact on the infection with the SARS-CoV-2 virus at county scale. The challenge of data scarcity was addressed by identifying the flood events of 2020-August 2022 based on the hydrological warnings issued by the National Institute of Hydrology and Water Management. In addition, hazard management data were extracted from autochthonous online press. Only flood events that were severe enough to impose the evacuation of population were corroborated with the Covid-19 confirmed cases dataset, and also with milestones of the Covid-19 preventive legal framework.

The flood events under analysis were followed by an increase in the total confirmed cases at the end of the Covid-19 incubation time range at county level, with only one exception. Infection rates varied in size, most of the counties registering under 50 new Covid-19 confirmed cases after 2 weeks since flood events. The viral load increased by a maximum of 208 new cases of Covid-19. These increases correspond to the late spring and summer months, defined by climatic conditions that hinder the spread of the virus, simultaneously allowing the relaxation of Covid-19 preventive measures. Consequently, low-level local and national viral loads prevented a post-flood spike in the Covid-19 positive cases, which explains the prevalence of increases under 50 new cases. In counties where the infection rate exceeded 150 additional cases, local-scale particularities should be considered. Thus, it is difficult to establish a definite link between flood events and the dynamics of the Covid-19 infection rates recorded in the selected counties.

This research work contributes to the multi-hazard research field by adding important insights on i) the impact of flood events on the number of Covid-19 confirmed cases in a country with high flood risk, and ii) the interactions between the Covid-19 and flood management practices, also providing an example on how to tackle the data scarcity problem through an adapted data collection procedure. The findings may be used to ground decision-making aiming to address the present-day multi-hazard riddle: natural hazard management requires collaboration, while Covid-19 management practices hold social distancing to the core.

How to cite: Albulescu, C. and Larion, D.: Unfolding multi-hazard interactions: Zooming in on the links between flood events and the Covid-19 infection rate in Romania, EGU General Assembly 2023, Vienna, Austria, 23–28 Apr 2023, EGU23-2797, https://doi.org/10.5194/egusphere-egu23-2797, 2023.

EGU23-2811 | ECS | Posters virtual | NH10.1

Assessment of flooding impact on water supply systems: a comprehensive approach based on DSS 

Bianca Bonaccorsi, Silvia Barbetta, Stavroula Tsitsifli, Ivana Boljat, Papakonstantinou Argiris, Jasmina Lukač Reberski, Christian Massari, and Emanuele Romano

The assessment of flood impact on a Water Supply System (WSS) requires a comprehensive approach including several scales of analysis and models and should be managed in the Water Safety Plans (WSP), as recommended in the EU Water Directive 2020/2184. Flooding can affect the quality of groundwater and surface water resources and can cause supply service interruption due to damaged infrastructures. A complete approach to address flood impact on WSS is required but is not yet available, while only specific aspects were investigated in details.

In this context, the MUHA project, funded by the European INTERREG V-B Adriatic-Ionian ADRION Programme 2014-2020, developed a comprehensive tool named WAter Safety Planning Procedures Decision Support System (WASPP–DSS). The tool is mainly addressed to small water utilities (WU) for supporting WSP development and is based on two main premises: 1) a correct approach for WSS risk analysis requires a multi-hazard perspective encompassing all the system components and different hazards; 2) other institutions in addition to WUs have to be involved in WSS risk analyses to harmonize monitoring and response procedures.

The tool was tested on six pilot areas of the ADRION region considering four hazards: drought, flooding, accidental pollution and damage to infrastructure due to earthquakes. In this work, the tool is demonstrated for flooding impact analysis in three pilot areas: the Ridracoli reservoir in Italy and two municipalities, Larissa in Greece and Zadar in Croatia. The WASPP–DSS, tested by eight WUs, was found a potentially valid support for small WUs that must start drafting the WSP in a comprehensive way and can provide a common shared scheme.

Improvements are desirable, as including a specific section to consider the issue of loss of water resources from reservoirs due to overflow.

How to cite: Bonaccorsi, B., Barbetta, S., Tsitsifli, S., Boljat, I., Argiris, P., Lukač Reberski, J., Massari, C., and Romano, E.: Assessment of flooding impact on water supply systems: a comprehensive approach based on DSS, EGU General Assembly 2023, Vienna, Austria, 23–28 Apr 2023, EGU23-2811, https://doi.org/10.5194/egusphere-egu23-2811, 2023.

EGU23-3461 | Orals | NH10.1

Impact webs: a novel approach for characterising and assessing multi-risk in complex systems 

Edward Sparkes, Davide Cotti, Himanshu Shekhar, Saskia E. Werners, Angel A. Valdiviezo-Ajila, Sumana Banerjee, Gusti Ayu Ketut Surtiari, Anthony J. Masys, and Michael Hagenlocher

Characterising and assessing multi-risk in complex systems is vital to realise the expected outcome of the Sendai Framework for Disaster Risk Reduction. As sectors and systems are increasingly interconnected, the space in which impacts cascade is expanding. This became apparent throughout the COVID-19 pandemic, but can also be seen in the compounding and cross-border effects of climate change and connected extreme events, or from global ripple effects of armed conflicts such as the aggression committed by Russia against Ukraine. Single-hazard and single-risk approaches, while useful in certain contexts, are becoming increasingly insufficient for comprehensively managing risk due to cross-sector and cross-system interactions. There is therefore a need to develop tools that can account for how multiple hazards interact with multiple vulnerabilities of interdependent systems and sectors, which requires a systemic perspective for assessing risks.

To this aim, we developed a novel analytical tool to characterise the interconnections between risks, their underlying hazards, risk drivers, root causes and responses to risks and impacts across different systems. The tool draws on the impact chains approach (i.e. conceptual models for climate risk assessment), expanding its linear and sectoral focus towards a system-oriented view. We follow the recommendation of Zebisch et al (2021) and name this tool ‘Impact Webs'. 

We applied the tool to five case studies in Bangladesh, Ecuador, India, Indonesia and Togo to characterise and assess cascading risks linked to COVID-19, responses to it (e.g. restriction measures) and other hazards that co-occurred during the pandemic (e.g. hydrological, geophysical, climatological). The participatory co-development of the Impact Webs was led by local case study experts and involved desk research, stakeholder workshops and expert/community consultations.

These diverse applications at multiple scales showed that Impact Webs are useful to conceptualise and visualise networks of interconnected elements across sectors. Because of the tools suitability to simultaneously analyse the interactions of multiple hazards with multiple pre-existing vulnerabilities, it provided a representation of the multi-risk space in the case studies. This is promising to identify critical elements for further investigation, such as feedback effects, trade-offs and key agents that can influence risks in systems. To this aim, the tool not only accounts for negative impacts, but also how policy responses and societal reactions to policies can lead to additional positive outcomes, as well as unintended consequences, i.e. risks arising from responses. However, given the complexity of systems and system boundaries, it is not possible to characterise all interconnections using Impact Webs. While this simplification of reality is useful for communication purposes, only the most prominent outcomes of the tool are derivable, and although the participatory approach aims to reduce this, results can be influenced by inherent biases. Despite these challenges, we find that Impact Webs are a promising new approach to characterise and assess multi-risk, thereby supporting comprehensive disaster risk management. 

How to cite: Sparkes, E., Cotti, D., Shekhar, H., Werners, S. E., Valdiviezo-Ajila, A. A., Banerjee, S., Surtiari, G. A. K., Masys, A. J., and Hagenlocher, M.: Impact webs: a novel approach for characterising and assessing multi-risk in complex systems, EGU General Assembly 2023, Vienna, Austria, 23–28 Apr 2023, EGU23-3461, https://doi.org/10.5194/egusphere-egu23-3461, 2023.

EGU23-4277 | ECS | Orals | NH10.1

Systems-level geohazard risk assessment in southwestern British Columbia, Canada 

Jack Park and D. Jean Hutchinson

In Western Canada, geohazards can be related to tectonic events, such as earthquakes and volcanoes, but many are weather-driven events, such as floods, landslides, rockfalls, and snow avalanches. Anthropogenic activities, such as residential development, infrastructure, and climate change also contribute to and increase the overall risk from, geohazards. A recent example is the atmospheric river event that devastated much of the southern British Columbia (BC) province in November 2021. Between November 14 and 15, 2021, a 2,500 km long plume of moisture (atmospheric river) hit the west coast of BC and accumulated significant rainfall breaking 20 rainfall records across the province. This intense rainfall event resulted in regional flooding and triggered numerous landslides across the southern province. The impact included closures of all major transportation corridors, severed rail lines, with no rail connections between Kamloops and Vancouver, and evacuation of close to 15,000 residents.

In Western Canada, many geohazards risk assessments are performed within the risk management framework outlined by the Canadian Standards Association. Though guidelines exist, such as the Canadian Technical Guidelines on Landslides, there is no national or provincial standard for managing risk associated with geohazards. Furthermore, BC’s Municipalities Act, which allows individual municipality jurisdictions to manage their own risk, results in uneven distribution of funding and almost always results in emergency response. The insured losses from the November 2021 atmospheric river event are estimated to be $500 million CAD ($370 million USD) and uninsured losses are $9 billion CAD ($6.7 billion USD) and counting. These losses do not account for economic losses due to the closure of major transportation infrastructure networks.

Immediate efforts following the November 2021 atmospheric river event focused on opening the major highway routes. However, the rebuilding of failed bridge and highway embankments is considered a temporary solution and further upgrades in designs are needed to account for the increasing frequency and magnitude of future atmospheric river events. With limited resources at all levels of government, the risk associated with regional-level geohazard triggers needs to be better understood in order to prioritize road infrastructure capacity. Keeping the critical highway arteries open is important not only for economic benefits but to allow for emergency access for communities.

This research looks to help prioritize road infrastructure capacity based on its vulnerability to atmospheric river-triggered geohazard events. Information related to road closures, geohazard events, and infrastructure damages is compiled and related to preconditions of weather trends and infrastructure capacity leading up to the November 2021 event. Road network analysis is performed by defining consequence assessment parameters, such as average daily traffic, associated economic revenue, availability of safety stopping zones, and infrastructure redundancy. Then the risk is assessed based on the vulnerability assignment of different segments of the road network which is presented in a criticality map.

How to cite: Park, J. and Hutchinson, D. J.: Systems-level geohazard risk assessment in southwestern British Columbia, Canada, EGU General Assembly 2023, Vienna, Austria, 23–28 Apr 2023, EGU23-4277, https://doi.org/10.5194/egusphere-egu23-4277, 2023.

EGU23-4825 | Posters on site | NH10.1

Compound Vulnerabilities in an Urban Setting: Impact of Floods on the Transportation Network in Istanbul 

Irem Daloglu Cetinkaya and Özge Naz Pala

Urban areas, the core of socio-economic activity with high population density, are considered highly vulnerable to flood hazards. Istanbul, Turkey's most populated city with around 16 million inhabitants, and at the same time commercial, cultural, and social capital, was chosen as the study area. Istanbul is a metropolis that has grown under unplanned growth, particularly with rural to urban migration in the 1950s. A significant portion of the city's natural areas, stream basins and valleys have been replaced by concrete surfaces. This transformation not only brought societal challenges, but increased urban vulnerability to extreme events and hazards. As a coastal city that consists of two peninsulas, Istanbul is highly prone to flash floods from heavy rainfalls. Flood events intensely impair the municipal services (e.g., public transportation, water and sanitation, electricity distribution), consequently affect the operation of businesses and public services, and cause high economic losses as well as even deaths and casualties. Many of the highly vulnerable zones for floods already endure inadequate housing and transport access. This study aims to build a flood vulnerability index to identify the districts vulnerable to floods in the metropolitan area and assess the impacts of floods on households and transportation infrastructure. The developed vulnerability index incorporates socioeconomic and physical vulnerability components, while also closely examining key transportation infrastructure in highly vulnerable locations. Using the multi-criteria decision making approach, 9 different indicators of flood vulnerability were evaluated, then weighted by stakeholders and experts using the Analytical Hierarchy Process (AHP) method. This methodology is implemented to 100 year flood zones and 500 year flood zones to represent the potential impact of future climate change. The proposed assessment disclosed that 22% of the basin has low urban flood vulnerability while the extremely vulnerable and vulnerable zones together constituted approximately 40% of the total area.  Approximately 75% of the road length (i.e., highways, main arteries, boulevards) and 20% of the public transportation lines (i.e., stations, railways, bus lines) across the basin are located in the vulnerable areas. The findings of the study have the potential to provide policymakers with up-to-date and detailed flood vulnerability assessments to serve as the foundation for their decision-making processes under flooding hazards.

How to cite: Daloglu Cetinkaya, I. and Pala, Ö. N.: Compound Vulnerabilities in an Urban Setting: Impact of Floods on the Transportation Network in Istanbul, EGU General Assembly 2023, Vienna, Austria, 23–28 Apr 2023, EGU23-4825, https://doi.org/10.5194/egusphere-egu23-4825, 2023.

EGU23-5301 | ECS | Posters on site | NH10.1

Multi-risk assessment due to global warming under the SSP climate scenario in the Republic of Korea 

Insang Yu, Huicheul Jung, Dong-Kun Lee, Sung-Hun Lee, and Sung-Il Hong

Assuming that greenhouse gas emissions continue to increase as the current trend, the global average temperature is expected to rise by about 5.7°C by the end of the 21st century. High temperatures and heat waves will increase across East Asia, including in Republic of Korea, and extreme weather events, such as heavy rains and floods, will intensify and become more frequent. Even if carbon neutrality is achieved, losses may still occur due to the limited ability of humans and natural systems to adapt to higher global average temperatures. According to CMIP6 (Coupled Model Intercomparison Project Phase 6), the global average temperature is projected to rise by 2℃ in 2036 (2022-2051, SSP126), by 3℃ in 2065 (2051-2080, SSP245), and it is forecasted to rise by 5.38℃ from 2070 to 2099 (SSP585). When the global average temperature rises by 1.5℃, Republic of Korea's average temperature rises by 0.34℃~0.75℃, a 2℃ increase by 0.82℃~1.01℃, and a 3℃ increase by 1.08℃~1.42℃. As global warming continues, it is analyzed that the difference between Korea and the global average temperature will become larger. Global warming in Republic of Korea is progressing faster than global warming, this will have serious repercussions in various sectors. It is necessary to comprehensively assess risks in various sectors and use the results to establish adaptation policy in order to prepare for damage caused by climate change in advance. This study provides information for comprehensive decision-making support by assessing and integrating climate change risks under the 2℃, 3℃, and end of the 21st century (Bau) scenario in health, energy, traffic, agriculture, forest, and water sectors. Key findings show the current (1985–2014) average annual number of days with heat wave warnings issued by the Korean Meteorological Administration is 6 days. This number is expected to increase to 29 days (+23 days) under 2℃ global warming and to 47 days (+41 days) under 3℃ global warming; it is expected to increase by a factor of 5-15 to 92 days (+85 days) by the end of the 21st century (BaU). The current average period of severe agricultural drought is 0.38 months per year. It will increase to 1.0 month (+0.64 months) under 2℃ global warming and to 0.8 months (+0.43 months) under 3℃ global warming; it is expected to increase to 1.6 months (+1.24 months) by the end of the 21st century (BaU), for a 1.1-4.3-fold increase. The results of the study is expected to contribute to the revitalization of global warming impact and risk assessment research by presenting the global warming period for each SSP scenario. It contributes to the establishment of scientific countermeasures linked to climate risks by predicting the risks of local governments due to global warming and analyzing the current status and characteristics of local governments' adaptation measures.

 [Acknowledgement] This paper is based on the findings of the environmental technology development project for the new climate regime conducted by the Korea Environment Institute (2022-070(R)) and funded by the Korea Environmental Industry & Technology Institute (2022003570004).

How to cite: Yu, I., Jung, H., Lee, D.-K., Lee, S.-H., and Hong, S.-I.: Multi-risk assessment due to global warming under the SSP climate scenario in the Republic of Korea, EGU General Assembly 2023, Vienna, Austria, 23–28 Apr 2023, EGU23-5301, https://doi.org/10.5194/egusphere-egu23-5301, 2023.

EGU23-5815 | Orals | NH10.1

Promoting disaster preparedness and resilience by co-developing stakeholder support tools for managing the systemic risk of compounding disasters 

Cees van Westen, Funda Atun, Silvia Cocuccioni, Marcel Hurlimann, Bettina Koelle, Philipp Marr, Iuliana Armas, Seda Kundak, Elske de Zeeuw-van Dalfsen, Marc van den Homberg, and Jon Hall

Stakeholders in disaster risk management are faced with the challenge to adapt their risk reduction policies and emergency plans to cascading and compounding events, but often lack the tools to account for the cross-sectoral impacts and dynamic nature of the risks involved. The EU Horizon Europe PARATUS project, which started in October 2022 and will run to October 2026, aims to fill this gap by developing an open-source online platform for dynamic risk assessment that allows to analyze and evaluate multi-hazard impact chains, dynamic risk reduction measures, and disaster response scenarios in the light of systemic vulnerabilities and uncertainties. These services will be co-developed within a transdisciplinary consortium of 19 partners, consisting of research organizations, NGOs, SMEs, first and second responders, and local and regional authorities. To gain a deeper understanding of multi-hazard impact chains, PARATUS conducts forensic analysis of historical disaster events, based on a database of learning case studies, augments historical disaster databases with hazard interactions and sectorial impacts, and exploits remote sensing data with artificial intelligence methods. Building on these insights, PARATUS will then develop new exposure and vulnerability analysis methods that enable systemic risk assessment across sectors (e.g. humanitarian, transportation, communication) and geographic settings (e.g. islands, mountains, megacities). These methods will be used to analyze risk changes across space and time and to develop new scenarios and risk mitigation options together with stakeholders, using innovative serious games and social simulations.
The methods developed in PARATUS have been applied in four application case studies. The first one is related to Small Island Developing States (SIDS) in the Caribbean. This case study considers the cross-border impacts of tropical storms, tsunamis, volcanic eruptions, and space weather, and focuses on the development of impact-based forecasting, directed at humanitarian response planning, the telecommunication sector, and tourism. The second case study deals with the local and regional economic impact of hazardous events such as extreme wind, floods, rockfall, mudflow, landslides, and snow avalanches on cross-border transportation in the Alps. The third case study relates to the multi-hazard impact of large earthquakes in the Bucharest Metropolitan Region and focuses on systemic vulnerabilities of the city and emergency response. The fourth application case study is the Megacity of Istanbul which is prone to earthquake hazard chains, such as liquefaction, landslides, and tsunami, as well as to hydrometeorological hazards (extreme temperatures, fires, and flooding). Population growth rates, urban expansion speed, composition, and integration of new migrants (native, foreign, and refugees from countries like Syria and Afghanistan) contribute to the increasing disaster risk. 
The project results will be hosted on two stakeholder hubs related to crisis management and humanitarian relief, and provide stakeholders with a set of tools for risk reduction planning in dynamic multi-hazard environments. The service-oriented approach with active stakeholder involvement will maximize the uptake and impact of the project, and help to increase Europe’s resilience to compounding disasters.

How to cite: van Westen, C., Atun, F., Cocuccioni, S., Hurlimann, M., Koelle, B., Marr, P., Armas, I., Kundak, S., de Zeeuw-van Dalfsen, E., van den Homberg, M., and Hall, J.: Promoting disaster preparedness and resilience by co-developing stakeholder support tools for managing the systemic risk of compounding disasters, EGU General Assembly 2023, Vienna, Austria, 23–28 Apr 2023, EGU23-5815, https://doi.org/10.5194/egusphere-egu23-5815, 2023.

EGU23-6275 | Posters on site | NH10.1

Multi-hazard system of a high Alpine valley: construction of an event chronology from different sources 

Louise Dallons, Florie Giacona, Nicolas Eckert, and Philippe Frey

Mountain regions are subject to highly damaging hydrological and gravitational hazards. This exposure is due to their biophysical and societal characteristics. It is essential for a sustainable management of these risks to consider the natural risk as the result of complex interactions within the risk system, which is composed of a natural and a societal subsystem. In this way, it is possible to adopt a dynamic approach to the risk system by placing the phenomenon in an evolutionary context. We can therefore consider its trajectory according to the socio-environmental dynamics that influence it.

Studying these risk systems over the long term is necessary to understand their evolution and to anticipate future ones in order to guarantee the sustainability of mountain socio-ecosystems, and requires an interdisciplinary approach between geography and history.

The study of the trajectory of a multi-hazard system is being carried out in the Commune of Vallouise-Pelvoux, a high Alpine valley in the Écrins massif, France. This territory was chosen because it is subject to various risks that occur over a wide range of altitudes, its recent socio-economic development is mainly based on tourism, and it is marked by glacial recession, but also because we were aware of the availability of several sources allowing the production of event and multirisk chronologies.

The first stage of the research consisted in the production of a multi-hazard event chronology over 420 years (1600-2020). This database was built from various resources. On the one hand, from existing databases produced by public services and organizations such as the French Forest Office (ONF) specifically the mountain land restoration service (RTM) or the departmental councils. On the other hand, archival research was carried out in the municipal archives of Vallouise-Pelvoux and the departmental archives of the Hautes-Alpes.

After analysis of all available sources, the data collected was processed in various ways. Indeed, sources of different forms and origins requires standardization of the information to make it comparable and usable. The chronology was also subjected to a critical analysis : are the sources authentic? Reliable? What factors might influence them? 

Once this chronology of events in Vallouise-Pelvoux has been contextualized (changes in the natural and societal systems of the Commune), a first statistical analysis of the risks identified and the damage caused will be presented. In the future the data will be used to analyze the trajectory of the system.

How to cite: Dallons, L., Giacona, F., Eckert, N., and Frey, P.: Multi-hazard system of a high Alpine valley: construction of an event chronology from different sources, EGU General Assembly 2023, Vienna, Austria, 23–28 Apr 2023, EGU23-6275, https://doi.org/10.5194/egusphere-egu23-6275, 2023.

EGU23-7106 | ECS | Posters on site | NH10.1

Training risk managers in the climate change and energy transition narrative to avoid maladaptation to the emerging 21st century paradigm. 

Jonathan Mille, Danielle Charlton, Marleen De Ruiter, Muki Haklay, and Stephen Edwards

As the effects of climate change intensify and energy supply issues become more prominent (ie: tackling the rise of CO2 emissions, conflict in Ukraine), the potential impacts of climate and energy variability on anthropogenic systems and question the ability of organisations to maintain their vital services and supply chains in the future.

However, there are many uncertainties surrounding climate change and the energy transition. As risk management is directly dependent on environmental conditions and energy supplies, it is necessary for risk managers to understand how these intertwined phenomena may alter current risk management strategies.

Although climate change is discussed and highlighted amongst the Disaster Risk Reduction community, the issue around the functioning of the energy system is not yet widely discussed and integrated into risk reduction strategies. This research focuses on assessing the perception of risk managers on environmental and energy risks in order to help them integrate climate change and the energy transition into risk management strategies. Our objective is to paint a picture of the global energy system and to integrate its future developments and limitations in order to prepare risk managers for the systemic changes of the 21st century.

How to cite: Mille, J., Charlton, D., De Ruiter, M., Haklay, M., and Edwards, S.: Training risk managers in the climate change and energy transition narrative to avoid maladaptation to the emerging 21st century paradigm., EGU General Assembly 2023, Vienna, Austria, 23–28 Apr 2023, EGU23-7106, https://doi.org/10.5194/egusphere-egu23-7106, 2023.

EGU23-7499 | Posters on site | NH10.1

SIGALE: An online early warning system for gravitational hazard (Savoie, France) 

Héloïse Cadet, David Rouquet, and Anne Lescurier

The SIGALE (System of Information Geographic for grAvitational hazard vigiLancE assessment) project aims at developing an experimental early-warning system of gravitational hazard (landslides and rockfalls) over the road infrastructure network of Savoie (France). This network is about 3 300 km long.

We propose a new approach based on machine learning to predict a vigilance  degree. The vigilance degree is a combination of susceptibility model and trigger model.

The landslide susceptibility model is based on topographical data, landcover and lithology. The rockfall susceptibility model is based on statistical results of propagation using Flow-R.

The trigger models have been trained on an event database of 863 landslides and 481 rockfalls events from 2008 to 2020. The database covers 13 years, so about 4 745 days, over about 6 000 sectors. The thousand events are spread over 28 millions of spatio-temporal sectors. The dataset is thus highly unbalanced and specific machine learning has been deployed. The trigger models features are based on rainfalls and temperatures.

Our results show that, in spite of the high class imbalance issues of such database, the trigger models provide recall values of about 75%, with about 60% of precision.

Our prototype is a web-service showing vigilance degree model for both landslide and rockfall with different zooming information for decision support.

How to cite: Cadet, H., Rouquet, D., and Lescurier, A.: SIGALE: An online early warning system for gravitational hazard (Savoie, France), EGU General Assembly 2023, Vienna, Austria, 23–28 Apr 2023, EGU23-7499, https://doi.org/10.5194/egusphere-egu23-7499, 2023.

EGU23-7782 | ECS | Posters on site | NH10.1

Multi-hazard risk assessment of extreme weather events in a changing climate 

Zélie Stalhandske, Carmen Steinmann, David N. Bresch, and Chahan Kropf

Extreme weather events are among the most destructive natural hazards, affecting a large number of people and causing significant monetary damage globally each year. The impact of these events is increasing due to climate change and socio-economic development. While traditional approaches to risk assessment have focused on the impacts of single hazards, the combined risk of multiple hazards may be different from their sum. Their spatial and temporal co-occurrence may also be influenced by climate change. In this study, we develop a framework for modelling the combined risk of multiple climatic hazards, where risk is defined as the combination of hazard, exposure and vulnerability. We illustrate this method based on globally consistent river floods and tropical cyclones and their impacts on both population and assets. Both hazards are driven by global climate models to investigate their risk at current and future levels of warming. The combined impacts are evaluated by aggregating single hazard models on an event basis, where events are driven by the same climate model outputs. This allows us to not only consider the average annual impact, but also for example to assess combined extreme events or return periods. Additionally, spatially and temporally compounding events can be analysed. This framework is implemented in the open-source climate risk platform CLIMADA and can be applied to different climate risks, providing a more comprehensive approach to understanding and managing the risks posed by extreme weather events in a changing climate.

How to cite: Stalhandske, Z., Steinmann, C., Bresch, D. N., and Kropf, C.: Multi-hazard risk assessment of extreme weather events in a changing climate, EGU General Assembly 2023, Vienna, Austria, 23–28 Apr 2023, EGU23-7782, https://doi.org/10.5194/egusphere-egu23-7782, 2023.

EGU23-8120 | ECS | Orals | NH10.1

A Machine Learning approach to support multi-risk assessment and climate adaptation planning in the Veneto region 

Maria Katherina Dal Barco, Davide Mauro Ferrario, Margherita Maraschini, Ngoc Diep Nguyen, Remi Harris, Stefania Gottardo, Emma Tosarin, Sebastiano Vascon, Silvia Torresan, and Andrea Critto

The analysis of extreme events that occurred in the last decades shows that these are often generated by multiple hazards, whose interactions are still to be fully understood. Moreover, the observation of their temporal trend suggests that their frequency and entity may be related to climate change. The growing impact that natural disasters and climate change have on people and ecosystems makes the ability to model and predict the relationships between multiple risks and their evolution over time a critical expertise.

The use of Artificial Intelligence for climate change adaptation can leverage advanced understanding of multi-risk dynamics, in order to support forward looking disaster risk management and system resilience thinking. Specifically, Machine Learning (ML) algorithms offer a new path to address the analysis of multiple risks due to their ability to model complex and non-linear interactions between different factors, without the need for an explicit modelling.

Here we present the design and development of a ML approach called INTELLIGENT multi-risk (i.e., InNovaTive machinE Learning methodoLogy to assess multi-rIsk dynamics under climate chanGe futurE coNdiTions), aimed at evaluating the impacts of multi-risk events at the regional (sub-national) scale, and predicting risk scenarios based on future climate change projections.

Taking as input hazard, exposure and vulnerability features from both historical observations and future projections, the INTELLIGENT multi-risk allows to: analyse the multi-hazard footprint at different spatio-temporal scales; identify the most influencing factors triggering multiple risks; estimate the effect of climate change on risks scenarios.

An initial application was developed in the frame of the Interreg ITA-CRO AdriaClim project to assess the risks of extreme weather events along the coastal municipalities of the Veneto region. The ML algorithm was trained, validated and tested with local impact records over the 2009-2020 baseline timeframe, and then used to project future climate risk for the timeframe 2021-2050, under the high-emission RCP8.5 climate change scenario. The results of the analysis for the training dataset show a F1-score value of 74% on balanced data, identifying sea surface height, temperature, precipitation, and wind parameters as the most important factors triggering risks in the Veneto coastal area. Nevertheless, the model has the potential to identify which are the coastal municipalities more exposed to multi-hazard events, both in the baseline and future scenarios, in order to support the definition of coastal adaptation strategies.

Future developments of the INTELLIGENT multi-risk approach are foreseen within the H2020 MYRIAD-EU project, where the analysis will be extended to the whole Veneto region, in order to consider additional hazards (e.g., heat waves, drought, wildfires), and analyze multi-risk dynamics across different landscapes (mountains, plains and coastal area), and sectors (finance, tourism, natural ecosystems). At the same time, the ML-based methodology will be used to better identify spatial and temporal footprints of the multi-hazard events and to model the impact of natural hazards and climate change on environmental quality indicators (i.e., water, air, and soil quality).

How to cite: Dal Barco, M. K., Ferrario, D. M., Maraschini, M., Nguyen, N. D., Harris, R., Gottardo, S., Tosarin, E., Vascon, S., Torresan, S., and Critto, A.: A Machine Learning approach to support multi-risk assessment and climate adaptation planning in the Veneto region, EGU General Assembly 2023, Vienna, Austria, 23–28 Apr 2023, EGU23-8120, https://doi.org/10.5194/egusphere-egu23-8120, 2023.

EGU23-11160 | ECS | Posters on site | NH10.1

Can we be precautionary with respect to all risks? A natural and health hazards perspective 

Elena Raffetti and Giuliano Di Baldassarre

Understanding how individuals perceive risk of natural and health hazards can help policymakers, scientists, and clinicians to communicate risks. We show that individuals (as well as communities and institutions) cannot apply the precautionary principle to all threats, and thus we challenge the binary categorizations of risk takers vs. risk avoidersTo illustrate, we compared how people perceive the risk associated with natural and biological hazards in relation to the main preventable health-related risk factor – i.e. tobacco smoking by analyzing the results of nationwide surveys carried out in Italy and Sweden in August 2021. In particular, we compared smokers and non-smokers considering two domains of risk perception (likelihood and individual impact) for seven threats (epidemic, climate change, floods, droughts, wildfires, earthquakes and air pollution). Preliminary results show that: i) the risk perception of some threats is higher in smokers compared to non-smokers; and ii) this difference is mainly observed in a permissive tobacco environment. These results and their implications show the importance of integrating multi-risk components into risk communication, along with promoting policies that simultaneously address health and natural risks.

How to cite: Raffetti, E. and Di Baldassarre, G.: Can we be precautionary with respect to all risks? A natural and health hazards perspective, EGU General Assembly 2023, Vienna, Austria, 23–28 Apr 2023, EGU23-11160, https://doi.org/10.5194/egusphere-egu23-11160, 2023.

EGU23-11291 | ECS | Posters on site | NH10.1

Evaluating Environmental Impacts of Flood-Induced Tank Failures: A Risk Chain Model for Soil and Groundwater Contamination in NaTech context 

Riccardo Giusti, Marcello Arosio, Roberto Nascimbene, and Mario Martina

The European "Floods Directive" requires European River district authorities to create flood damage and risk maps, but the process of assessing flood damage is complex and lacks established methods. Flood risk assessment also requires an understanding of how industrial equipment is vulnerable to flood events and the potential for toxic releases in such scenarios. In this study a practical case is presented regarding multicomponent flood risks in the Secchia River catchment, a tributary of the Po River, and proposes a new risk chain model for evaluating the environmental impact of soil and groundwater contamination in the event of a flood caused by the failure of storage tanks containing hazardous materials. The model is demonstrated using an illustrative case and shown to be a useful tool for managing the risk of such events. Our methodology presents a multi-component model for assessing environmental risk resulting from technological accidents triggered by natural disasters. In particular, we focus on the failure of storage tanks containing hazardous materials due to flooding. The proposed method first evaluates the probability of tank failure under defined flood conditions, including flood height, velocity, and probability of occurrence. To simplify the analysis, we consider all tanks to be unanchored atmospheric storage tanks. The final output of the method for each tank is a monetary estimation of the hypothetical costs for environmental remediation after tank failure, including the contamination of soil and groundwater by the spilled liquid. Our methodology proposed a conservative approach by assuming that all stored liquids are contaminants and by using a fixed value for the density of the stored liquid.

To evaluate the probability of tank failure, it has been considered four types of failure dynamics: buckling, displacement, floating and overturning. The tank failure assessment is based on our recent study that developed vulnerability different dynamic models for unanchored steel atmospheric tanks. Our methodology not only evaluates the probability of tank failure during flood events, but also analyses the potential consequences of failure, including direct damages to the tank and costs associated with recovering the spilled product and mitigating contamination in the affected area. The results of this study can be used to develop strategies for minimizing the risks of tank collapse during flood events and to increase awareness of potential NaTech risks. The ultimate goal of this study is to create a comprehensive procedure for evaluating and comparing the dynamics of tank collapse during flood events, including the potential environmental consequences, and providing risk managers with a full understanding of the risks associated with tank failure during flooding, including potential NaTech risks.


How to cite: Giusti, R., Arosio, M., Nascimbene, R., and Martina, M.: Evaluating Environmental Impacts of Flood-Induced Tank Failures: A Risk Chain Model for Soil and Groundwater Contamination in NaTech context, EGU General Assembly 2023, Vienna, Austria, 23–28 Apr 2023, EGU23-11291, https://doi.org/10.5194/egusphere-egu23-11291, 2023.

EGU23-12813 | ECS | Posters on site | NH10.1

Compound events of drought and salt intrusion in the Greater Bay Area and adaptation countermeasures 

Xudong Li, Fang Yang, Huazhi Zou, and Sen Wang

Dongjiang River drains into the Pearl River Delta in China and waterworks near the delta serves as the main water supply source for cities in the Guangdong-Hong Kong-Macao Greater Bay Area, including Shenzhen, Guangzhou and Hongkong. The basin experienced a severe drought in 2021, with the average streamflow in the downstream gauge reaching its lowest value since 1956. Meanwhile, the most important upstream reservoir, Xinfengjiang Reservoir, experienced a low water level operation period, with the water level declined below its dead water level in Jan. 2022. Coupling with weak river discharge, astronomical tides led to severe salt intrusion in the delta area. The compound events of drought and salt intrusion threatened the urban domestic water supply. According to scenario analysis, the water supply for about 20 million people would have been affected during Nov. 2021 and Jan. 2022 if no countermeasures had been adopted. Comprehensive countermeasures were carried out to prevent the extreme impacts from the compound events, which include engineering and non-engineering ones. The engineering ones include blocking the salt water with temporary batardeau and soft purdah into the water. And non-engineering ones include chlorinity monitoring and forecasting on the strength of in-situ gauges measurements and a three-dimensional baroclinic saltwater intrusion model. The model provided real-time chlorinity forecasting for the waterworks. The bias of peak chlorinity was less than 20%, and the bias of the peaking time was less than 2 h. The forecasting results supported decision making on timing of water intaking for the waterworks and other local water storage infrastructure. In addition, the water authorities carried out tiered prices and imposed limitations to high water use of some industrial water users. With all these strategies, the domestic water supply was well maintained across the compound events, which ended in Mar. 2022. The river basin authority played an important role in communicating the necessary information and coordinating all the countermeasures among associated stakeholders.

How to cite: Li, X., Yang, F., Zou, H., and Wang, S.: Compound events of drought and salt intrusion in the Greater Bay Area and adaptation countermeasures, EGU General Assembly 2023, Vienna, Austria, 23–28 Apr 2023, EGU23-12813, https://doi.org/10.5194/egusphere-egu23-12813, 2023.

EGU23-13325 | Posters virtual | NH10.1

Multi-hazard analysis of abandoned coal-mines 

AL Heib Marwan

Nowadays, most of the coal mines in Europe are already closed or are in a state of liquidation. However, the problem of abandoned coal mines and their influence on the environment remains central for the mining industry and coal regions in transition. After the end of the exploitation, many disturbances can occur. Mines operators, local authorities and decision makers are confronted with multi-hazard and risks related to mine closure. Land use planning and adequate site rehabilitation requires better tools to deal with the multiple hazards and constraints.

The objective of the study is to improve risk assessment by establishing a new methodology to assess the interaction between hazards related to old mines, and no longer treat them separately.

Mining hazards concern: ground movements, hydrological hazards, self-heating, soil and water pollution. One hazard can trigger another one. Different tools are presented such as a global matrix, a fault tree, etc. for identifying the hazards interaction. The hazard interaction matrix has been constructed, figure 1 shows in particular the interactions that the phenomena in the columns (source phenomenon) can have with the phenomena in the rows (target phenomenon). The matrix also provides information on the levels of interaction: no known case of interaction between phenomena (white colour), Low (yellow), Medium (green) and High (red). These assessments are based on feedback and in-depth discussion between experts. This approach is a first tool to help mining and development actors to understand these interactions and improve mitigation and management measures.


How to cite: Marwan, A. H.: Multi-hazard analysis of abandoned coal-mines, EGU General Assembly 2023, Vienna, Austria, 23–28 Apr 2023, EGU23-13325, https://doi.org/10.5194/egusphere-egu23-13325, 2023.

EGU23-13897 | Orals | NH10.1

Development and use of an integrated modelling approach to simulate dynamic risk profiles and support risk reduction strategies 

Hedwig van Delden, Roel Vanhout, Amelie Jeanneau, Douglas Radford, Holger R. Maier, and Aaron C. Zecchin

Natural hazards pose a significant risk to societies across the world. This risk will likely increase in the future, due to climate change, urban development and changing demographics. Understanding the range of potential future conditions, and the associated key uncertainties, is essential in designing disaster risk management strategies that holistically account for these drivers.

For this purpose, we have developed a spatially explicit, dynamic, multi-hazard decision support system called UNHaRMED, which calculates dynamic risk profiles as a combination of hazard, exposure and vulnerability. The aim of UNHaRMED is to better understand current and future risk, and assess the impact of (a combination) of risk reduction options under various  future conditions. In order to do so, UNHaRMED consists of coupled models integrated into a policy support system. It allows the user to understand the impact of climate change, socio-economic developments and risk reduction options on the future evolution of exposure, hazard and vulnerability and hence the resulting risk.

Use of the system will be illustrated through an application to a region in Australia for wildfire and flood risk, for which we simulated a range of futures using different climate and socio-economic scenarios. We found that in a rapidly growing area, the impact of socio-economic development exceeds the impact of climate change, and well thought out spatial planning strategies can substantially reduce future wildfire and flood risk.

The application of UNHaRMED showcases its potential in better understanding future uncertainties and leveraging this information to assess the impact of risk reduction options under a range of conditions. Lessons learned from this can then be incorporated in the design of robust and/or adaptive risk management strategies.

How to cite: van Delden, H., Vanhout, R., Jeanneau, A., Radford, D., Maier, H. R., and Zecchin, A. C.: Development and use of an integrated modelling approach to simulate dynamic risk profiles and support risk reduction strategies, EGU General Assembly 2023, Vienna, Austria, 23–28 Apr 2023, EGU23-13897, https://doi.org/10.5194/egusphere-egu23-13897, 2023.

EGU23-13915 | Orals | NH10.1

An impact-based extreme event catalogue on southwest Germany: Overview, Clustering and Triggers 

Katharina Küpfer, Susanna Mohr, and Michael Kunz

Multiple hazards of different types, such as heat waves, floods, or storms, occurring either simultaneously or in serial clusters can significantly enhance adverse effects on society, economy, and the environment compared to single events. The disastrous flood in Western Europe in 2021 once again showed that natural hazards can lead to severe building damage and thus pointed to the importance of insurance coverage against such events.

To better understand how multiple hazards translate into impact, we propose an economic approach using a unique residential building insurance dataset for southwest Germany ranging from 1986 to 2020. This dataset includes both the number of damage claims reported to a building insurance company and insured losses on a daily resolution, aggregated over the federal state of Baden-Wuerttemberg. This study area is chosen because of the high insurance coverage and therefore high reliability of the data to capture the most important events compared to other states in Germany. In the first step, an event catalogue regarding serially clustered events was elaborated using different methods and statistics. Only convective storms, winter storms and floods are taken into account as these events cause most of the economic damage compared to other events, such as heat waves. To filter smaller events with limited impact and to remove high-frequency clustering, various methods to aggregate the loss events over several days are applied and compared, such as runs declustering using the Peak-Over-Threshold method and an aggregation method considering a fixed number of days, which is common in the insurance industry. After further separating the events according to the relevant seasons, we apply and compare three different clustering methods to the filtered economic dataset: (a) the Poisson regression method, (b) Ripley’s K, and (c) the counting method.

Results show that a high percentile (e.g., 95th or 99th) is needed to analyse the dataset with regard to the most damaging events. This is because the dataset shows a strongly right-skewed distribution. Furthermore, it is found that a small number of high-impact events dominate the overall damage. We show that different hazard types exhibit different behaviours regarding economic metrics (e.g., average loss or correlation between damage claims and insured loss). It is also found and discussed that the degree of clustering depends on the method chosen. For this reason, we performed sensitivity tests and applied different methods to estimate the reliability of the results. To better differentiate between the meteorological event types (e.g., pluvial vs. fluvial floods and convective gusts vs. windstorms), the dataset is further filtered with precipitation data and a dataset on turbulent wind gusts. Building on the final event set with the different event types, the time frames identified by the analyses above are combined with large-scale weather patterns that were dominant at the times when the loss events occurred. This is done to identify relevant relationships of extreme events and their clusters to large-scale processes and mechanisms (e.g., weather regimes or teleconnection patterns).

How to cite: Küpfer, K., Mohr, S., and Kunz, M.: An impact-based extreme event catalogue on southwest Germany: Overview, Clustering and Triggers, EGU General Assembly 2023, Vienna, Austria, 23–28 Apr 2023, EGU23-13915, https://doi.org/10.5194/egusphere-egu23-13915, 2023.

EGU23-14233 | Posters on site | NH10.1

Mapping and characterisation of compound events in Sweden 

Johanna Mård, Örjan Bodin, and Daniel Nohrstedt

Compound events have significant environmental and societal impacts and bring new challenges to decision-making, planning, and management. Meanwhile, knowledge about compound events and their impacts are limited. Sweden, while being prone to various climate-related natural hazards (e.g., storms, floods, wildfires) have no coherent information on where these events and their impacts have occurred in the past, and less so on compound events. Here we present a new cohesive natural hazards impact database for Sweden, including compound events, to advance our understanding of how these events have unfold during the last 50 years. The impact database consists of available data from multiple sources on past climate-related natural hazard events (e.g., databases and reports from governmental organizations, county boards, and scientific reports). These data have further been geocoded using a Geographic Information System (GIS) to generate an integrated natural hazards map. These two products will help provide knowledge on the spatiotemporal distribution of natural hazard events, including compound events in Sweden, and further advance our understanding of their underlying drivers, and aid ongoing work to effectively plan and prepare for these events.

How to cite: Mård, J., Bodin, Ö., and Nohrstedt, D.: Mapping and characterisation of compound events in Sweden, EGU General Assembly 2023, Vienna, Austria, 23–28 Apr 2023, EGU23-14233, https://doi.org/10.5194/egusphere-egu23-14233, 2023.

EGU23-14325 | Posters on site | NH10.1

Operational assessment of landslide risks in the sprawling city of Bukavu (DR Congo) 

Olivier Dewitte, Caroline Michellier, Toussaint Mugaruka Bibentyo, Sylvain Kulimushi Matabaro, Innocent Kadekere, Charles Nzolang, and François Kervyn

The expansion of informal and uncontrolled urban landscapes commonly overlooks the natural constraints from the environment. This is particularly true for urban environments affected by landslides. Landslide risk assessment relevant for urban planning and disaster risk reduction (DRR) strategy requires highly spatially-resolved datasets and approaches. It also requires that both physical and social local aspects of risk are studied in an interdisciplinary manner. Such assessment of hazard risk remains challenging and under-researched in many regions, especially in low- and lower-middle-income countries in the tropics, as it usually requires large and diverse datasets that are frequently unavailable or unreliable. In addition, specifically in urban contexts, human-induced environmental change impacts slope stability. Under these conditions of data-scarcity and land transformation, reliable and detailed landslide risk assessment encompassing the physical and societal aspects in an operational approach strongly relies on expert knowledge.

In this research, we assess the risks associated with landslides in Bukavu, a city located in the eastern DR Congo where urban sprawling is high and the problem of landsliding is particularly acute. Firstly, we compiled a comprehensive multi-temporal landslide inventory covering several decades using remote sensing, archives, field survey and interviews with key informants. From this inventory, we derived three hazard zonations with multiple scenarios that allow to consider the interactions between various landslide processes and the role of human activities. Secondly, we obtained detailed socio-economic data from a sample population survey in morphological areas determined by remote sensing. Within two months, 10 specifically-trained local interviewers counted and located nearly 44,000 inhabitants living in about 6,580 households, and collected socio-economic baseline data over 10,880 people from 1,614 households. These demographic data were used to determine the variations in population density (exposure) in the city. These data were also key for the vulnerability assessment. For this, we designed a contextualised vulnerability index capturing the various dimensions of vulnerability with a set of selected indicators aimed at facilitating understanding, replicability and updating of the data collection. By combining hazard, exposure and vulnerability, we produced three risk zonation maps at a very high spatial resolution with the potential to be used operationally: one for shallow landslides, another for deformation within landslides and one for reactivation of deep-seated landslides. The development of these maps, as well as the collection of field-based information were carried out in close interaction with the city authorities and various stakeholders (e.g. civil protection, local community leaders) involved in DRR. A specific effort of awareness raising was also made through the organisation of dedicated workshops and radio programmes, and the implementation of a disaster risk information centre in Bukavu.

How to cite: Dewitte, O., Michellier, C., Mugaruka Bibentyo, T., Kulimushi Matabaro, S., Kadekere, I., Nzolang, C., and Kervyn, F.: Operational assessment of landslide risks in the sprawling city of Bukavu (DR Congo), EGU General Assembly 2023, Vienna, Austria, 23–28 Apr 2023, EGU23-14325, https://doi.org/10.5194/egusphere-egu23-14325, 2023.

EGU23-16226 | Posters on site | NH10.1

Multihazard Analysis: Istanbul Microzonation Projects 

Sema Kara, Kemal Duran, Deniz Yılmaz, Evrens Rıza Yapar, Muhammed Emin Karasu, and Betül Ergün Konukcu

Istanbul is located one of the most seismically active regions of the earth. For this reason the city has suffered damage due to earthquakes in its historical process. Three of them, occurring in 1509, 1766, 1894 respectively,    seriously affected Istanbul and caused great loses around the city during the Ottoman period. 1509 Earthquake caused extensive damage to many mosques, buildings and some part of the city walls in Istanbul. 1509 Earthquake caused extensive damage to many mosques, buildings and some part of the city walls in Istanbul. Another destructive earthquake occured in the east part of the Sea of Marmara in 1766. Not only many houses and public buildings collapsed but also The Ayvad Dam located north of the Istanbul were damaged in İstanbul because of the 1766 Earthquake. Third major earthquakes took place in the Gulf of Izmit in 1894 and had adverse impact on Istanbul. On Augsut 17, 1999 The Kocaeli Earthquake with a magnitude 7.6 was the not only devastating but also deadly earthquake for Istanbul in recent years. Despite the approximately 110 km epicenter distance, 3,073 buildings suffered extensive damage, 11,339 buildings had moderate damage and 454 people died and 1880 people injured in Istanbul. Damages in Istanbul especially Avcılar and Büyükçekmece during Kocaeli Earthquake in 1999 raised and improved the awareness on disaster risk management since then several scientific and institutional studies has been conducted for the potential earthquake of Istanbul. Istanbul Metropolitan Municipality (IMM) carried out two major geo-scientific studies called “microzonation studies” covering more than 700 km2 of Istanbul’s urbanized areas between 2006 and 2009.     And then IMM has just started new microzonation project in order to complete remainder urbanization area of Istanbul consists of districts of Büyükçekmece, Beylikdüzü, Çatalca, Esenyurt, Küçükçekmece, Beşiktaş, Şişli, Sarıyer covering approximately 257 km2. Esenyurt is the most populated district of Istanbul and the other districts host many Istanbulites. This project supports substantial hazard knowledges after the evaluation of geological, geotechnical and geophysical measurements in order comprehend these districts risk against the potential Istanbul earthquake,.  In the end “Land Suitability Maps” are derived from the combination of inputs using multi-hazard approach. Microzonation results could be used in land development/use plans, hazard identification in urban transformation, determination of the routes and characteristics of various types of engineering structures for making city resilient.

How to cite: Kara, S., Duran, K., Yılmaz, D., Yapar, E. R., Karasu, M. E., and Ergün Konukcu, B.: Multihazard Analysis: Istanbul Microzonation Projects, EGU General Assembly 2023, Vienna, Austria, 23–28 Apr 2023, EGU23-16226, https://doi.org/10.5194/egusphere-egu23-16226, 2023.

EGU23-16521 | ECS | Posters on site | NH10.1

Resilient Istanbul against the evolving challenges 

Betül Ergün Konukcu, Sema Kara, Deniz Yılmaz, and Kemal Duran

Cities are increasingly faced with the complexities, the uncertainties, local and global challenges. These problems make pressures on the life of cities and cause direct, indirect, tangible and intangible damages on physical structure, natural environment, social fabric, cultural heritage and economic situation of the cities. In order to make cities resilient against these pressures, it is substantial to improve skills to cope with these difficulties and strengthen coping capacity of urban elements. Istanbul is one of the oldest cities in the world. The city, hosted many civilizations with its 8500 year history, has dealt with the earthquakes, epidemics, floods, fires, water shortages, economic crises throughout its historical process. Istanbul with more than 16 million population is still trying to struggle against the challenges based on natural events and climate change, the consequences of irresponsible urbanization, socio-economic and cultural stresses and environmental problems. This study reveals Sustainable Resilence Strategy of Istanbul with Sustainable Development Goals against to current and evolving acute shocks and chronical stresses by taking lessons from the past, forecasting future challenges, risk reduction, supra disciplinary and interdisciplinary studies,  holistic approach, shared decision making with multiple criteria ,  competent planning, manageable systems, resource management, funding capability, alternative strategy formation capability, reserve capacity, ensuring coordination between systems, increasing adaptive, absorbing and transformation capacity, providing continuity, developing national and international cooperation.

How to cite: Ergün Konukcu, B., Kara, S., Yılmaz, D., and Duran, K.: Resilient Istanbul against the evolving challenges, EGU General Assembly 2023, Vienna, Austria, 23–28 Apr 2023, EGU23-16521, https://doi.org/10.5194/egusphere-egu23-16521, 2023.

EGU23-16828 | Posters on site | NH10.1

Modelling compound flooding events for multiple hazards mapping: an example from Sweden. 

Faisal Bin Ashraf, Marlon Vieira Passos, and Karina Barquet

Globally climate change has increased exposure to multiple hazards. In Sweden, 10-year events of precipitation and streamflow have started to cluster around the summer months for most of the country. However, Sweden's south and west coasts are especially vulnerable to river flooding events caused by extreme sea surges during the winter. This national-level analysis needs to be combined with detailed local assessments to quantify the hazard properly, its potential impacts and cascading effects. In response to this need, we explore the impacts of multiple hydrometeorological (i.e., weather and water) events that happen simultaneously or close together in Halmstad. Furthermore, we investigate the effects of climate change on the intensity and frequency of these hazards by focusing on extreme – low likelihood but high impact – events. Due to its geographical location, Halmstad is particularly vulnerable to flooding risks. Wind and waves combine to make the city vulnerable to flooding and storm surges. That confluence triggers extreme local sea level rise, resulting in high sea levels in Halmstad compared to nearby coastal towns. These compound flooding events in Halmstad are expected to increase in future climate scenarios. We will simulate multiple scenarios of compound flooding events with a two-dimensional hydrodynamic model. The model's values used as boundary conditions will be based on computed joint return intervals for fluvial flooding and extreme sea surge. This study can not only be used to support local adaptation strategies but will also contribute to the body of knowledge on the issue of compound flooding events in a changing climate. Local-scale assessments like this one are necessary for a nuanced understanding of the possible impacts of multiple hazards on society. At the same time, societies' dependency on critical infrastructure and vital societal services is increasing due to growing system complexity and interconnectedness. Together, these shifts will likely increase societal vulnerability and impact adaptive capacity.

How to cite: Ashraf, F. B., Passos, M. V., and Barquet, K.: Modelling compound flooding events for multiple hazards mapping: an example from Sweden., EGU General Assembly 2023, Vienna, Austria, 23–28 Apr 2023, EGU23-16828, https://doi.org/10.5194/egusphere-egu23-16828, 2023.

EGU23-16861 | Posters on site | NH10.1

A spatial analysis of the relevance of community organizations as an insurance against the economic and environmental vulnerability of Colombian cacao producers. 

Sonia Quiroga, Cristina Suárez, Virginia Hernanz, and Jose Evelio Aguiño

The future of replacing illicit crops with cocoa in the South-Pacific region of Colombia goes far beyond the economic viability of these plantations. The process of social and ecological restoration (SER) that this process implies is intrinsically linked to the role of local organisations and the support of international non-governmental organisations, which are introducing the main technical improvements conditional on the achievement of social improvements. Here we analyse the situation in the South-Pacific region of Colombia, a territory traditionally dominated by illicit crops, inhabited by vulnerable Afro-American communities, and where post-conflict agreements are having a special relevance due to the high level of violence. This paper analyses the determinants of differences in the selling price of cocoa, assuming that the decision to be able to sell cocoa dry and access international markets is directly related to the support received by farmers. To be able to obtain a sustainable production of quality dry cocoa, the main requirement for accessing international market prices, is conditioned by access to adequate infrastructures. And, without access to this higher quality production, the substitution of illicit crops does not seem viable, and with it the environmental sustainability and social cohesion of the territory. Therefore, we analyse the determinants of farmers' ability to sell dry cocoa: percentage of cocoa damaged by pests, the pressure of violence. To do so, we use spatial econometric models, as these have been found to be more appropriate than other types of models. And we show that increasing the participation of producers in community councils supported by international NGOs is fundamental to achieving a better cocoa price.

How to cite: Quiroga, S., Suárez, C., Hernanz, V., and Aguiño, J. E.: A spatial analysis of the relevance of community organizations as an insurance against the economic and environmental vulnerability of Colombian cacao producers., EGU General Assembly 2023, Vienna, Austria, 23–28 Apr 2023, EGU23-16861, https://doi.org/10.5194/egusphere-egu23-16861, 2023.

EGU23-17552 | Orals | NH10.1

Diagnosing multi-hazard risk research, practice, and policy in a European context - lessons learnt from the first year of research in MYRIAD-EU 

Roxana Liliana Ciurean, Melanie Duncan, Joel Gill, Lara Smale, Julia Crummy, Dana Stuparu, and Julius Schlumberger

The first priority of the Sendai Framework for Disaster Risk Reduction is Understanding Disaster Risk. To achieve this goal, it is essential that research and practice draw upon previous disaster risk work. What can the use of terminology and concepts tell us about the barriers and opportunities to further our understanding of disaster risks? How can we build more effectively upon existing tools, methods, and approaches to inform future multi-hazard risk solutions? And what is the current multi-risk governance landscape in Europe? To answer these questions, we present the results of the first work package (WP1) of MYRIAD-EU – a multi-disciplinary, multi-sector project on systemic risk assessment and management in the E.U., funded by the Horizon 2020 Programme. WP1 aimed at undertaking a common baseline development to ensure that all MYRIAD-EU work packages are underpinned by a common understanding of terminology, concepts, and current academic, policy, and industry perspectives on multi-hazard, multi-risk assessment and management.

In this presentation, we briefly introduce the methods, outputs, and outcomes of the first year of Diagnosis research in MYRIAD-EU. We look closer at two outputs, namely the Handbook of multi-hazard, multi-risk definitions and concepts, and the Disaster Risk Gateway wiki platform, aimed at promoting interdisciplinary research and engagement between different actors involved in disaster risk assessment and management. Finally, we reflect on lessons learnt and highlight upcoming work in this project.

How to cite: Ciurean, R. L., Duncan, M., Gill, J., Smale, L., Crummy, J., Stuparu, D., and Schlumberger, J.: Diagnosing multi-hazard risk research, practice, and policy in a European context - lessons learnt from the first year of research in MYRIAD-EU, EGU General Assembly 2023, Vienna, Austria, 23–28 Apr 2023, EGU23-17552, https://doi.org/10.5194/egusphere-egu23-17552, 2023.

CC BY 4.0