EGU23-1707 | ECS | Orals | MAL27 | PS Division Outstanding Early Career Scientist Award Lecture
Tectonics and magma oceanography of rocky exoplanetsEGU23-8554 | Orals | MAL27 | Runcorn-Florensky Medal Lecture
Fluid Planets: from Theory to Observations and BeyondPS1 – Multi-disciplinary applications to planetary and solar system science studies: spacecraft mission development and testing, planetary instrument testing, laboratory experiments and ground-truthing mission data with terrestrial analogues
EGU23-1437 | ECS | Posters on site | GM10.1
Investigating Crater Inlet Valley Formation: Field Study at Lonar Crater, IndiaEGU23-2626 | ECS | Posters on site | GM10.1
CO2-driven granular flows as erosional forces on present-day MarsEGU23-4080 | ECS | Orals | GM10.1
Geomorphic study of caldera features on Mars with the help of Earth analoguesEGU23-4549 | ECS | Posters on site | GM10.1
Evidence of late Mars geological activity on the floor of the Gusev and Jezero craters. Landing sites of NASA's Mars exploration missions.EGU23-5338 | ECS | Orals | GM10.1 | Highlight
Methane on Mars: Correlation of geomorphological features with current methane emissionsEGU23-8505 | ECS | Posters on site | GM10.1
What role did Tharsis formation during the Noachian/Hesperian period (3.8 – 3.5 Ga) have on the erosional history of Mars?EGU23-10690 | ECS | Posters on site | GM10.1
Slope Profile of Slope Streaks Indicate an Energetic Triggering MechanismEGU23-10961 | Orals | GM10.1 | Highlight
Exploring biosignatures and geomorphology of Mars with close-up images – preparatory activities for the ExoMars mission.EGU23-11911 | ECS | Posters on site | GM10.1
Landforms and chronologies in the southern branch of Kasei Valles, MARSEGU23-12945 | Posters virtual | GM10.1
Preliminary results of Tolstoj quadrangle (H08) geological mapping
EGU23-15877 | ECS | Posters on site | GM10.1
Large Area Glacier-Like Forms on Mars: Insights from Impact Crater Morphologies and Crater Retention AgesEGU23-542 | ECS | Posters on site | ESSI1.3
Electron Temperature Inference from Fixed Bias Langmuir Probes Set-Ups in Ionospheric Conditions
EGU23-3379 | ECS | Posters on site | ESSI1.3
Estimation and Prediction of Solar Wind Propagation from L1 Point to Earth’s Bow ShockEGU23-4069 | ECS | Posters on site | ESSI1.3
Plasma-Sheet Bubble Identification Using Muitivariate Time Series Classification
EGU23-6968 | ECS | Posters on site | ESSI1.3
Forecasting solar wind speed by machine learning based on coronal hole characteristicsEGU23-7529 | ECS | Posters on site | ESSI1.3
Landform detection on Mars using image segmentation with a u-net convolutional neural network architectureEGU23-7761 | ECS | Posters virtual | ESSI1.3
Comparison study on the deep-learning-based detection of Mars cratersEGU23-8676 | Posters on site | ESSI1.3
Software solution for detecting asteroids using machine learning techniquesEGU23-8946 | Posters on site | ESSI1.3
Using Artificial Intelligence/Computer Vision for Automated Plot ValidationEGU23-10654 | ECS | Orals | ESSI1.3
Predicting the 1 AU Arrival Time of Coronal Mass Ejections Based on Convolutional Neural NetworkEGU23-12354 | ECS | Posters on site | ESSI1.3
Key Signatures of Prominence Materials and Category of Unknown-origin Cold Materials identified by Machine Learning ClassifierEGU23-14927 | ECS | Orals | ESSI1.3
Automatically Calculating Depths of Martian and Lunar Pits with Satellite ImageryEGU23-15160 | ECS | Orals | ESSI1.3
Detecting the magnetopause of Mercury by neural network — using MESSENGER data to train for BepiColombo.EGU23-16941 | ECS | Orals | ESSI1.3
Mars Perseverance Panoramic Image for Self-Determination Mission AlgorithmEGU23-320 | ECS | Orals | GI3.1 | Highlight
A comparison of Perseverance rover and HiRISE data: siteinterpretations in Jezero Crater
EGU23-1679 | ECS | Posters virtual | GI3.1
Improving the Accessibility of Borehole Geophysics: A Cost-Efficient, Highly Modifiable Borehole Tilt SensorEGU23-7046 | ECS | Orals | GI3.1
Evolution of the oxygen escape from Earth over geological time scalesEGU23-7363 | Posters on site | GI3.1
On modeling of silicon detector for space applications using Geant4EGU23-7966 | ECS | Posters on site | GI3.1
Faraday cup instruments for solar wind and interplanetary dust monitoringEGU23-8161 | ECS | Posters on site | GI3.1
Formulation of spectral indexes from M3 cubes for lunar mineral exploration using pythonEGU23-10917 | Orals | GI3.1
The HyTI Mission: High Spatial and Spectral Sesolution Imaging from a 6U Cube SatelliteEGU23-11555 | Posters on site | GI3.1
BepiColombo: Operations and Data Analysis through the Quick-Look Analysis (QLA) toolEGU23-13233 | ECS | Orals | GI3.1
Near-Earth asteroids orbit determination by DRO space-based optical observationsEGU23-13996 | ECS | Posters on site | GI3.1
Simulation Study for Precise Orbit Determination of a Callisto Orbiter and Geodetic Parameter RecoveryEGU23-14760 | ECS | Posters on site | GI3.1
A novel user-friendly Jupyter-based tool for analysing orbital subsurface sounding radar data.
EGU23-14810 | ECS | Orals | GI3.1
Statistics of Alfvénic structures in the Solar Wind and their impact on Magnetometer CalibrationEGU23-2843 | ECS | PICO | ESSI1.1
Geography-Aware Masked Autoencoders for Change Detection in Remote SensingEGU23-6818 | ECS | PICO | ESSI1.1
Eddy identification from along-track altimeter data with multi-modal deep learningEGU23-8479 | ECS | PICO | ESSI1.1
Model evaluation strategy impacts the interpretation and performance of machine learning modelsEGU23-11601 | PICO | ESSI1.1
Clustering Geodata Cubes (CGC) and Its Application to Phenological DatasetsEGU23-12773 | PICO | ESSI1.1
Industrial Atmospheric Pollution Estimation Using Gaussian Process RegressionEGU23-12933 | ECS | PICO | ESSI1.1
Estimating vegetation carbon stock components by linking ground databases with Earth observationsEGU23-16768 | PICO | ESSI1.1
Knowledge Representation of Levee Systems - an Environmental Justice PerspectiveEGU23-1981 | ECS | Posters on site | GI3.3
Total stratospheric bromine inferred from balloon-borne solar occultation bromine oxide (BrO) measurements using the new TotalBrO instrumentEGU23-2923 | ECS | Posters on site | GI3.3
Total organic carbon measurements reveal large discrepancies in reported petrochemical emissionsEGU23-3473 | Posters on site | GI3.3 | Highlight
The FAAM large atmospheric research aircraft: a brief history and future upgradesEGU23-6620 | ECS | Posters on site | GI3.3
Airborne observations over the North Atlantic Ocean reveal the first gas-phase measurements of urea in the atmosphereEGU23-7804 | Posters virtual | GI3.3
In-situ trace-gas measurements from the ground to the stratosphere by an OF-CEAS balloon-borne instrumentEGU23-8329 | ECS | Posters on site | GI3.3 | Highlight
Airborne remote sensing research infrastructure for strengthening science, international collaboration and capacity building in the ArcticEGU23-13766 | ECS | Posters on site | GI3.3
How inlet tubing material affects the response time of water vapor concentration measurementsEGU23-15334 | ECS | Posters on site | GI3.3
Global measurements of cloud properties using commercial aircraftEGU23-3180 | ECS | Posters on site | ERE4.3
Radiogenic and stable Sr isotope geochemistry of regolith hosted REE deposits: a preliminary reportEGU23-4661 | Posters on site | ERE4.3
Gamma radiation for rare earth elements (REEs) in deep-sea sedimentsEGU23-10689 | Posters on site | ERE4.3
Investigations of Vanadiferous Titanomagnetite Deposit using Drone Magnetic and Electrical Resistivity Surveys in KoreaEGU23-12056 | ECS | Posters on site | ERE4.3
ROBOMINERS resilient reflectance/fluorescence spectrometersEGU23-13081 | Posters on site | ERE4.3
The surface chemistry of carbonatite soils: Implications for REE resources.EGU23-13899 | ECS | Posters on site | ERE4.3
Robot-aided autonomous hyperspectral mapping in mining environmentsEGU23-15445 | ECS | Posters virtual | ERE4.3
Re-evaluating Caledonian magmatism and associated base metal mineralisation: a case study of the Black Stockarton Moor porphyry copper systemEGU23-16567 | ECS | Posters on site | ERE4.3
Deep Electrical Resistivity Tomography as a mineral exploration tool: the Calamita distal Fe-skarn, Elba Island (Italy)EGU23-17279 | Orals | ERE4.3
Underwater measurements with UX robots; a new and available tool developed by UNEXUPPS2 – Space weather and space weathering: active and passive processes, observations and records from models, experiments and samples
EGU23-2887 | Posters on site | PS2.2
Long-Lasting Solar Coherent Radio Bursts and Implications for Solar–Stellar ConnectionEGU23-5988 | Posters on site | PS2.2
Characteristics of spectral fine structure in Auroral Kilometric Radiation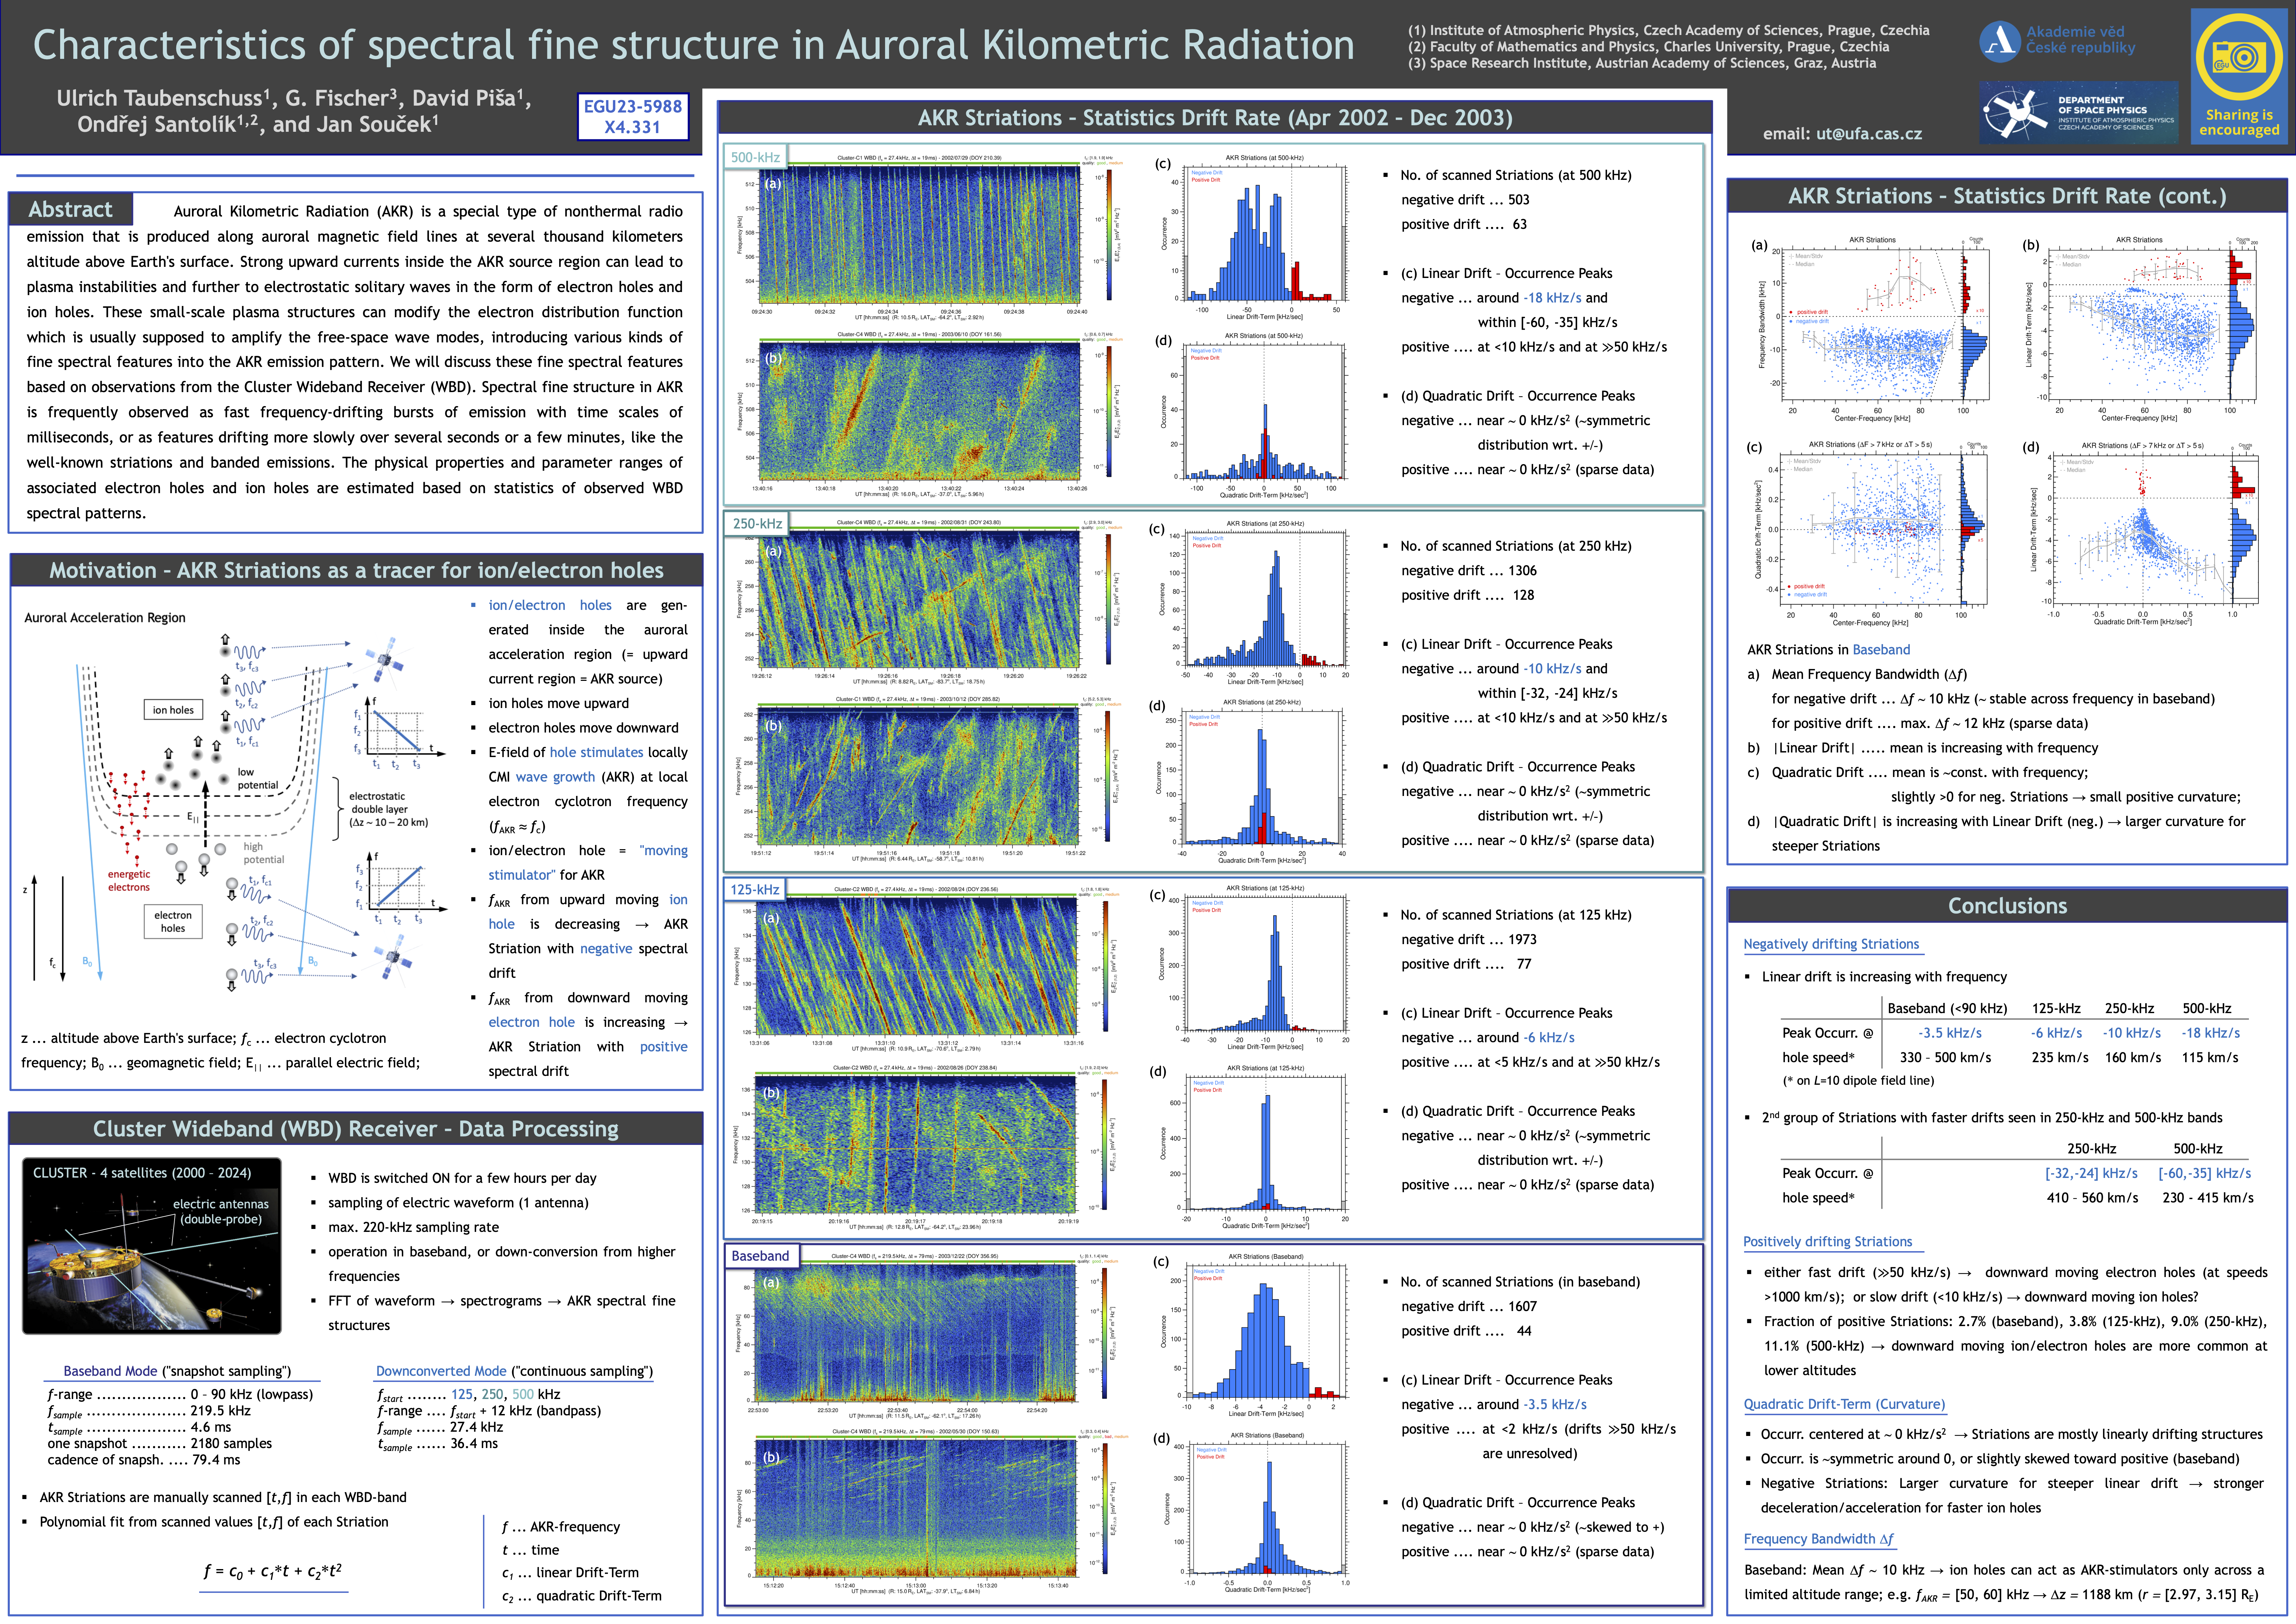
EGU23-8736 | ECS | Posters virtual | PS2.2
DLITE—An inexpensive, deployable interferometer for solar radio burst observationsEGU23-8808 | Posters on site | PS2.2
Observation of the Earth’s ionosphere variability by IONO/INSPIRE-SAT 7 experimentEGU23-12283 | Posters on site | PS2.2
Separating fundamental and harmonic sources in LOFAR solar type III radio burst imagesEGU23-13512 | Posters on site | PS2.2
Exploring Coronal Structures in Metric-Decametric Radio ImagingEGU23-3122 | ECS | Orals | PS2.3
Ionospheric Plasma Depletions at Mars: MAVEN Observations of In-situ Plasma and Wave propertiesEGU23-3369 | Orals | PS2.3 | Highlight
BepiColombo second Mercury flyby : Ion composition measurements from the Mass Spectrum Analyzer (MSA)EGU23-3699 | Posters on site | PS2.3
Mars pickup ion plume under different IMF conditions from MAVEN observationsEGU23-6512 | ECS | Posters on site | PS2.3
The influence of magnetic topology on ionospheric structure at Mars: Observations of localized “magnetic depletions”EGU23-7071 | ECS | Orals | PS2.3
Evidence of planetary Oxygen and Carbon ions in the outer flank of VenusmagnetosheathEGU23-8206 | ECS | Posters virtual | PS2.3
MVSE Mission Phase A/0 Study: A Proposal for Understanding the Dynamics of Induced Magnetospheres


EGU23-8912 | ECS | Orals | PS2.3
E-field at a low-activity comet derived from cometary ion velocity distributionsEGU23-9224 | ECS | Posters on site | PS2.3
Expectations of the Ion-Profile in Mercury’s Magnetosphere during BepiColombo's Flybys 2021-2025
EGU23-9448 | ECS | Posters on site | PS2.3
Determining the Relation Between Electron-Neutral Collisions and Thermal Electron Temperature Profiles in the Mars Ionosphere
EGU23-11568 | ECS | Posters on site | PS2.3
On the Response of the near-Mercury Environment to Different Interplanetary Conditions from full-scale 3D Hybrid SimulationsEGU23-12193 | Posters on site | PS2.3
Investigating the past atmospheric escape rate from Mars using a semi-empirical modelEGU23-12605 | ECS | Posters on site | PS2.3
Titan's tail structure: the multi-instrument study as observed by CassiniEGU23-12906 | ECS | Orals | PS2.3
Unexpected local magnetic depression around Mercury: BepiColombo flyby-2 discoveryEGU23-13641 | ECS | Posters on site | PS2.3
Plasma parameters inside the cometopause of comet 67P-Churyumov/GerasimenkoEGU23-287 | ECS | Orals | GI6.8
A New Open-Source Geomagnetosphere Propagation Tool (OTSO) and its ApplicationsEGU23-3095 | Posters on site | GI6.8
Effects of heterogeneous soil moisture distributions in cosmic-ray neutron sensing - the case of irrigation monitoringEGU23-6789 | Posters on site | GI6.8
Sensitivity of the Cosmic Ray Neutron Sensor (CRNS) to Seasonal Biomass Dynamics in Cherry and Olive OrchardsEGU23-11071 | ECS | Posters on site | GI6.8
Updated heliospheric modulation potential of cosmic rays and station-specific scaling factors for 1964-2021EGU23-11326 | ECS | Posters on site | GI6.8
Monitoring soil moisture in the deeper vadose zone: A new approach using groundwater observation wells and cosmic ray neutronsEGU23-11905 | Posters virtual | GI6.8
SEVAN European particle detector network for the atmospheric, solar and space weather studiesEGU23-12576 | ECS | Posters on site | GI6.8
Cosmic rays on snow: A combined analysis of fractional snow cover derived from Sentinel-2, MODIS and Cosmic Ray Neutron Sensors across Europe
EGU23-15343 | Posters on site | GI6.8
Measurements of cosmic rays by a mini neutron monitor aboard the German research vessel PolarsternEGU23-15523 | Posters on site | GI6.8
Buoy-based detection of low-energy cosmic-ray neutrons to monitor the influence of atmospheric effectsEGU23-15741 | ECS | Orals | GI6.8
Rigidity dependence of cosmic ray diurnal anisotropy using 22 years of GRAPES-3 muon telescope dataEGU23-15980 | ECS | Orals | GI6.8
Yield function of the DOSimetry TELescope (DOSTEL) count and dose rates aboard an aircraftEGU23-16004 | ECS | Posters on site | GI6.8
Impact and relevance of soil density changes on cosmic-ray neutron sensing for soil water estimationEGU23-17336 | ECS | Orals | GI6.8
Cosmic Ray Soil Moisture Sensors as an Asset to Space Weather Monitoring ActivitiesEGU23-17487 | ECS | Posters on site | GI6.8
Cosmic-ray neutron production and propagation inside snow packs characterized by multi-particle Monte Carlo simulationsEGU23-550 | ECS | Orals | ST2.2
Identifying the zoo of waves in Magnetosheathjets using MMS burst dataEGU23-929 | ECS | Posters on site | ST2.2
Velocity distribution functions and non‐Maxwellianity of magnetosheath jets using MMSEGU23-1222 | ECS | Posters on site | ST2.2
Study of the Local Bow Shock Environment during Magnetosheath Jet Formation: Vlasiator ResultsEGU23-1305 | Posters on site | ST2.2
Mirror mode-like structures around unmagnetised planets: 1. Mars as observed by the MAVEN spacecraftEGU23-1532 | Posters on site | ST2.2
Mirror mode-like structures around unmagnetised planets: 2. Venus as observed by the Venus Express spacecraftEGU23-2438 | ECS | Orals | ST2.2
The bow shock and magnetosheath responses to density depletion structuresEGU23-2702 | Posters on site | ST2.2
MESSENGER observations of short, large-amplitude magnetic structures (SLAMS) in the Mercury foreshockEGU23-2963 | ECS | Posters virtual | ST2.2
Electron acceleration by intense whistler-mode waves at foreshock transientsEGU23-3155 | ECS | Posters on site | ST2.2
Jet-like structures in different regions of the magnetosheathEGU23-3199 | ECS | Posters on site | ST2.2
Characteristics of foreshock subsolar compressive structures and their connection to magnetosheath jet-like phenomenaEGU23-4004 | ECS | Orals | ST2.2
Formation of Transient Foreshock Structures Upstream of Mars and Earth: A Comparative StudyEGU23-6972 | Posters on site | ST2.2
How do magnetic holes cross a bow shock? Results from the kinetic hybrid plasma model MenuraEGU23-8347 | Posters on site | ST2.2
A Statistical Study of Foreshock Environment under Radial IMF ConditionsEGU23-9082 | ECS | Orals | ST2.2
Observational Analysis of Small-scale Structures in the Earth's MagnetosheathEGU23-9423 | Orals | ST2.2
On the Speed of Interplanetary Shocks Propagating through the MagnetosheathEGU23-9495 | Orals | ST2.2
On the production of magnetosheath jets during a CME and SIR passage: A case studyEGU23-9960 | ECS | Orals | ST2.2
Solar wind parameters influencing magnetosheath jet formation: low and high IMF cone angle regimesEGU23-10536 | ECS | Orals | ST2.2 | Highlight
MAVEN Observations of Steepened Ultra-Low Frequency Waves in the Upstream Martian Foreshock RegionEGU23-10616 | ECS | Orals | ST2.2
Generation of sub-ion scale magnetic holes from electron shear flow instabilities in plasma turbulenceEGU23-10625 | ECS | Orals | ST2.2
Modification of magnetosheath jet occurrence and properties within CMEs and SIRsEGU23-12129 | ECS | Posters on site | ST2.2
Global 3D simulation of the interaction between a turbulent solar wind and a magnetic dipoleEGU23-12611 | Posters on site | ST2.2
Kinetic effects and their role on the entry and transport of finite-size plasma jets inside the Hermean magnetosphereEGU23-15140 | ECS | Posters on site | ST2.2
Morphology case study of magnetic holes in the pristine solar windEGU23-7 | ECS | Orals | ST1.10
Modeling the 2020 November 29 solar energetic particle event using EUHFORIA and iPATH modelsEGU23-1741 | ECS | Posters virtual | ST1.10
Energy Spectrum of Solar Energetic Electron Events Over 25 YearsEGU23-2518 | ECS | Orals | ST1.10
Solar activity relations in energetic electron events measured by the MESSENGER missionEGU23-4398 | ECS | Posters on site | ST1.10
Analysis of the Energetic Storm Particle events of 6-7 September 2017EGU23-7171 | Posters on site | ST1.10
Modelling of atmospheric transport of SEP-induced cosmogenic 10Be using CCM SOCOL-AER2-BEEGU23-7905 | ECS | Orals | ST1.10 | Highlight
Development of an In-Progress Forecasting Model to Forecast Radiation Dose Rates Once a Ground-Level Enchancement has BegunEGU23-8936 | ECS | Orals | ST1.10
Particle Energisation in a 3D Collapsing Magnetic Trap Model With a Braking JetEGU23-10509 | ECS | Posters on site | ST1.10
Radial Variation of Suprathermal Particles Associated with Corotating Interaction RegionsEGU23-12330 | ECS | Orals | ST1.10 | Highlight
When are energetic electrons producing NO directly in the upper stratosphere?EGU23-13801 | ECS | Posters virtual | ST1.10
Witnessing a Forbush Decrease with a Microscintillator Ionisation Detector over the Atlantic OceanEGU23-15621 | ECS | Posters on site | ST1.10
The effect of magnetic reconnection on ICME-related GCR modulationEGU23-16136 | Posters on site | ST1.10
Energetic Electron Precipitation during Slot Region Filling EventsPS4 – Interiors, crusts and atmospheres of the terrestrial planets: formation, evolution and fate (in partnership with GD)
EGU23-1163 | ECS | Posters on site | PS4.1
Effects of the Lunar Regolith Structure and of the Solar Wind Properties on the Backscattered Energetic Neutral Atoms FluxEGU23-1299 | ECS | Orals | PS4.1
A mineral sputter model in agreement with solar wind ion irradiation experiments

EGU23-2306 | ECS | Orals | PS4.1
Convection and Clouds under Different Planetary Gravities Simulated by a Small-domain Cloud-resolving ModelEGU23-2968 | Posters on site | PS4.1
New insights into the mesosphere of Venus from MERTIS measurements during the two BepiColombo flybysEGU23-4363 | ECS | Posters on site | PS4.1
A quantum-mechanical investigation of O(3P) + CO scattering cross sections at superthermal collision energiesEGU23-6979 | ECS | Posters on site | PS4.1
Weathering of airless body surfaces by the heavy minor ions of the solar wind: inputs from Wind ion observationsEGU23-8494 | Posters on site | PS4.1
Influence of radiative forcing on Titan’s lake energy balance and sea breeze circulationEGU23-8602 | ECS | Posters on site | PS4.1
Constraining the radiolytic production of Callisto’s O2 atmosphereEGU23-8619 | Posters on site | PS4.1
Planetary and synoptic-scale atmospheric disturbances from images of Mars during Martian Year 36EGU23-9581 | Orals | PS4.1
Evidence of Hot Hydrogen in the Exosphere of Mars Resulting in Enhanced Water LossEGU23-10653 | Posters on site | PS4.1
A preliminary investigation of the spectral signatures of excited electronic states of OH in the Martian atmosphereEGU23-11814 | Orals | PS4.1
Observational constraints on the water group torus in the orbit of Jupiter moon EuropaEGU23-12587 | ECS | Posters on site | PS4.1
How obliquity controls the surface appearance of Triton, Pluto and other volatile-rich Transneptunian objectsEGU23-13306 | Posters on site | PS4.1
Ephemeral carbon dioxide ice clouds in the upper mesosphere of Venus
EGU23-14084 | ECS | Orals | PS4.1
Aggregation and charging of mineral cloud particles underhigh-energy irradiation
EGU23-16730 | Posters on site | PS4.1
Mineralogical control of fracturing and micro-flaking due to thermal fatigueEGU23-17142 | Posters on site | PS4.1
Variation of the Moon’s Solar-Induced Hydrogen Cycle during a Solar StormEGU23-3592 | Posters on site | PS4.2
Magma oceanography of the dense, ultrashort-period sub-Earth GJ 367bEGU23-7619 | Posters on site | PS4.2
First long-term study of the Venus' Cloud Discontinuity with uninterrupted observationsEGU23-8312 | ECS | Posters on site | PS4.2
Characterisation of the sensitivity to bias using a gain matrix formulation for the VeSUV/VenSpec-U instrument onboard ESA’s EnVision missionEGU23-8703 * | Orals | PS4.2 | Highlight
Venus as a natural laboratory to infer observational prospects of close-in-orbit rocky exoplanets with a 3D modelEGU23-8806 | ECS | Posters on site | PS4.2
The effects of water and intrusive magmatism on the evolution and dynamics of Venus
EGU23-9112 | ECS | Posters virtual | PS4.2
The effect of a climatic thermal runaway on the tectonic regime of VenusEGU23-9783 | ECS | Posters virtual | PS4.2
Constraining Venus’ convection regime from Baltis Vallis topographyEGU23-9889 * | Orals | PS4.2 | Highlight
EnVision: a Nominal Science Phase Spanning Six Venus Sidereal DaysEGU23-12356 | Orals | PS4.2
Conditions for accretion and subduction initiation inside Venus Artemis CoronaeEGU23-12463 | Posters on site | PS4.2
Correlations between minor species in the Venus mesosphere from the SOIR/Venus Express spectrographEGU23-15108 | ECS | Posters on site | PS4.2
Evolution of Venusian rifts: Insights from Numerical ModelingEGU23-16340 | Posters on site | PS4.2
VERITAS gravity investigations: measuring Venus’ rotational state, moment of inertia, Love numbers, and atmospheric tides
EGU23-735 | ECS | Orals | PS4.3
The meteorology of Jezero crater (Mars) as determined from MEDA observations and numerical modeling
EGU23-985 | ECS | Orals | PS4.3
Influence of Magnetic Fields on Precipitating Solar Wind Hydrogen at MarsEGU23-2249 | ECS | Orals | PS4.3 | Highlight
Compositional stratigraphy on Mars as evidence of hundreds of millions of years of greenhouse conditions on MarsEGU23-2924 | ECS | Posters on site | PS4.3
Constraining the Chemistry of Sub-cm Diagenetic Features with Curiosity's Alpha Particle X-ray SpectrometerEGU23-4218 | ECS | Orals | PS4.3
Radar Sounding Waveform Fitting for Roughness parameters estimationEGU23-4484 | ECS | Posters on site | PS4.3 | Highlight
2D hydraulic modelling of the ancient paleolake in Gusev Crater, Mars.EGU23-4548 | Posters on site | PS4.3
Advanced Reconnaissance Missions Needed for Human Exploration of MarsEGU23-4896 | Orals | PS4.3 | Highlight
Observations of the Perseverance rover at the Jezero crater delta front using the SuperCam instrumentEGU23-6454 | ECS | Posters on site | PS4.3
Is the lithospheric flexure strong enough to hold up the Tharsis Rise? A re-analysis of flexure on Mars
EGU23-6646 | ECS | Posters on site | PS4.3
Revisit the solar wind deceleration upstream of the Martian bow shock based on MAVEN observationsEGU23-7173 | Orals | PS4.3
Daily and Seasonal Behaviour of Fast Pressure Fluctuations at Jezero CraterEGU23-7189 | ECS | Posters on site | PS4.3
Retrieval of the Vertical Profile of Atmospheric Optical Depth using Thermal Emission Spectrometer Visible and Infrared Bolometer observationsEGU23-8449 | Posters on site | PS4.3
Terrestrial analogues of the glaciers on Mars: possible test sites for FlyRadar surveyEGU23-8669 | Posters on site | PS4.3 | Highlight
Mars Express: Toward a 20-year scientific and technical success storyEGU23-9049 | ECS | Orals | PS4.3
The nighttime boundary layer of Mars as predicted by large-eddy simulationsEGU23-9961 | Posters on site | PS4.3
One Martian year of MEDA HS humidity sensor observations and comparisons with modelsEGU23-10117 | Orals | PS4.3
One Martian Year of MEDA/TIRS observations at the Mars 2020 landing siteEGU23-10369 | ECS | Posters on site | PS4.3
Martian interactive dust and water cycle GCM simulations as compared with TGO/NOMAD and MCS observationsEGU23-10757 | Orals | PS4.3 | Highlight
A varnish-like high-manganese rock coating in Jezero crater, MarsEGU23-11186 | ECS | Posters on site | PS4.3
Helicopter Magnetic Field Surveys for Future Mars MissionsEGU23-13871 | Posters on site | PS4.3
The changing gravity field due to a superplume under the Tharsis RegionEGU23-14114 | Orals | PS4.3 | Highlight
Comparison of orbital and Supercam in situ investigation of the floor Units of Jezero craterEGU23-14333 | Posters on site | PS4.3
Mars Sample Return Rock Sampling: Post-landing Extraction of Solid-core Samples.EGU23-14629 | ECS | Posters virtual | PS4.3
Experimental Measurements of Electric and Magnetic Fields in Simulated Martian Dust StormsEGU23-14721 | ECS | Posters on site | PS4.3
Synchrotron X-ray Diffraction for Early Characterisation of Sealed Mars2020 SamplesEGU23-15500 | ECS | Orals | PS4.3
Rock Properties of Shallow Martian Subsurface with the RIMFAX Ground Penetrating RadarEGU23-16154 | ECS | Orals | PS4.3
The chlorine cycle on Mars: What do we know after three Mars years of observation with ACS on TGO?EGU23-16376 | Posters on site | PS4.3
ExoMars – WISDOM Field-Test Data Processed with Automatic PipelineEGU23-16728 | ECS | Orals | PS4.3
Updated orbital perspective of the Mt. Sharp upper sulfates in preparation for in situ explorationEGU23-17025 | ECS | Posters on site | PS4.3
High-resolution nesting simulations for the EDL stage of China’s first Mars exploration mission (Tianwen-1)EGU23-17592 | ECS | Orals | PS4.3
Martian atmospheric chemistry of HCl: implications for the lifetime of atmospheric methaneEGU23-2640 | ECS | Orals | PS4.4
Dust storm statistics based on the EMM camera EXI for a complete Martian Year periodEGU23-3053 | Posters on site | PS4.4
The physics and dynamics of selected dust storms in the EMM primary missionEGU23-3162 | Posters virtual | PS4.4
Production and radiative transfert of the OI 130.4 and 135.6 nm emissions in the Mars auroraEGU23-3932 | ECS | Posters virtual | PS4.4
Seasonal and Diurnal Variations of Orographic Clouds on Mars with EMM/EXI observations and the Mars Planetary Climate ModelEGU23-4712 | Posters on site | PS4.4
Seasonal Variation of the Martian Inner Hot Oxygen Exosphere Observed by EMM/EMUSEGU23-4883 * | ECS | Orals | PS4.4 | Highlight
Emirates Mars Mission - Hope Probe - in a Martian YearEGU23-5359 | ECS | Posters on site | PS4.4
Diurnal and seasonal variations of clouds in the Tharsis Montes region of Mars using the Emirates eXploration Imager (EXI) observationsEGU23-8656 | Posters on site | PS4.4
Dayside auroral emission induced by proton deposition observed by EMM EMUSEGU23-9200 | Orals | PS4.4
Hydrogen Escape Rates 2021-2023 Retrieved from Emirates Mars Mission ObservationsEGU23-9313 | Posters on site | PS4.4
First observations of Deimos from the Emirates eXploration Imager (EXI)EGU23-9807 | Orals | PS4.4
The First Observations of Deimos from the Emirates Mars Mission (EMM) FlybysEGU23-10186 | Posters on site | PS4.4
The First Observations of Deimos by the Emirates Mars Ultraviolet Spectrometer (EMUS)EGU23-10291 | ECS | Posters on site | PS4.4
The Observations of Deimos from the Emirates Mars Infrared Spectrometer (EMIRS)EGU23-10341 | Posters on site | PS4.4
Reconstructing Martian Year 36 column dust optical depth maps using EMM/EMIRS and MRO/MCSEGU23-10766 | ECS | Posters on site | PS4.4
Automated Detection of Limb Clouds and Hazes by the Emirates Mars Mission (EMM) Emirates eXploration Imager (EXI)EGU23-11146 | ECS | Posters on site | PS4.4
Expanding the Emirates Mars Infrared Spectrometer (EMIRS) Science Dataset using EMIRS off-axis detectorsEGU23-11360 | ECS | Posters on site | PS4.4
Seasonal and Local Time Dependence of Martian FUV Discrete Aurora Observed by EMM EMUSEGU23-13029 | ECS | Posters on site | PS4.4
Comprehensive statistical analyses and data-driven modeling of electron and proton auroras on Mars using EMM and MAVEN observationsEGU23-13324 | Posters on site | PS4.4
Seasonal variability of atomic hydrogen and oxygen in the EMM/EMUS cross-exospheric observations during Mars year 36
EGU23-13860 | Posters on site | PS4.4
Scattering cross sections for O(3P), C(3P), and H colliding with a CO2 molecule for planetary aeronomyEGU23-15008 | ECS | Orals | PS4.4
Properties of Limb Clouds at Mars determined from the Emirates Mars Mission (EMM) eXploration Imager (EXI)EGU23-708 | ECS | Posters on site | TS13.1
Mapping linear surface features on Europa using a deep learning framework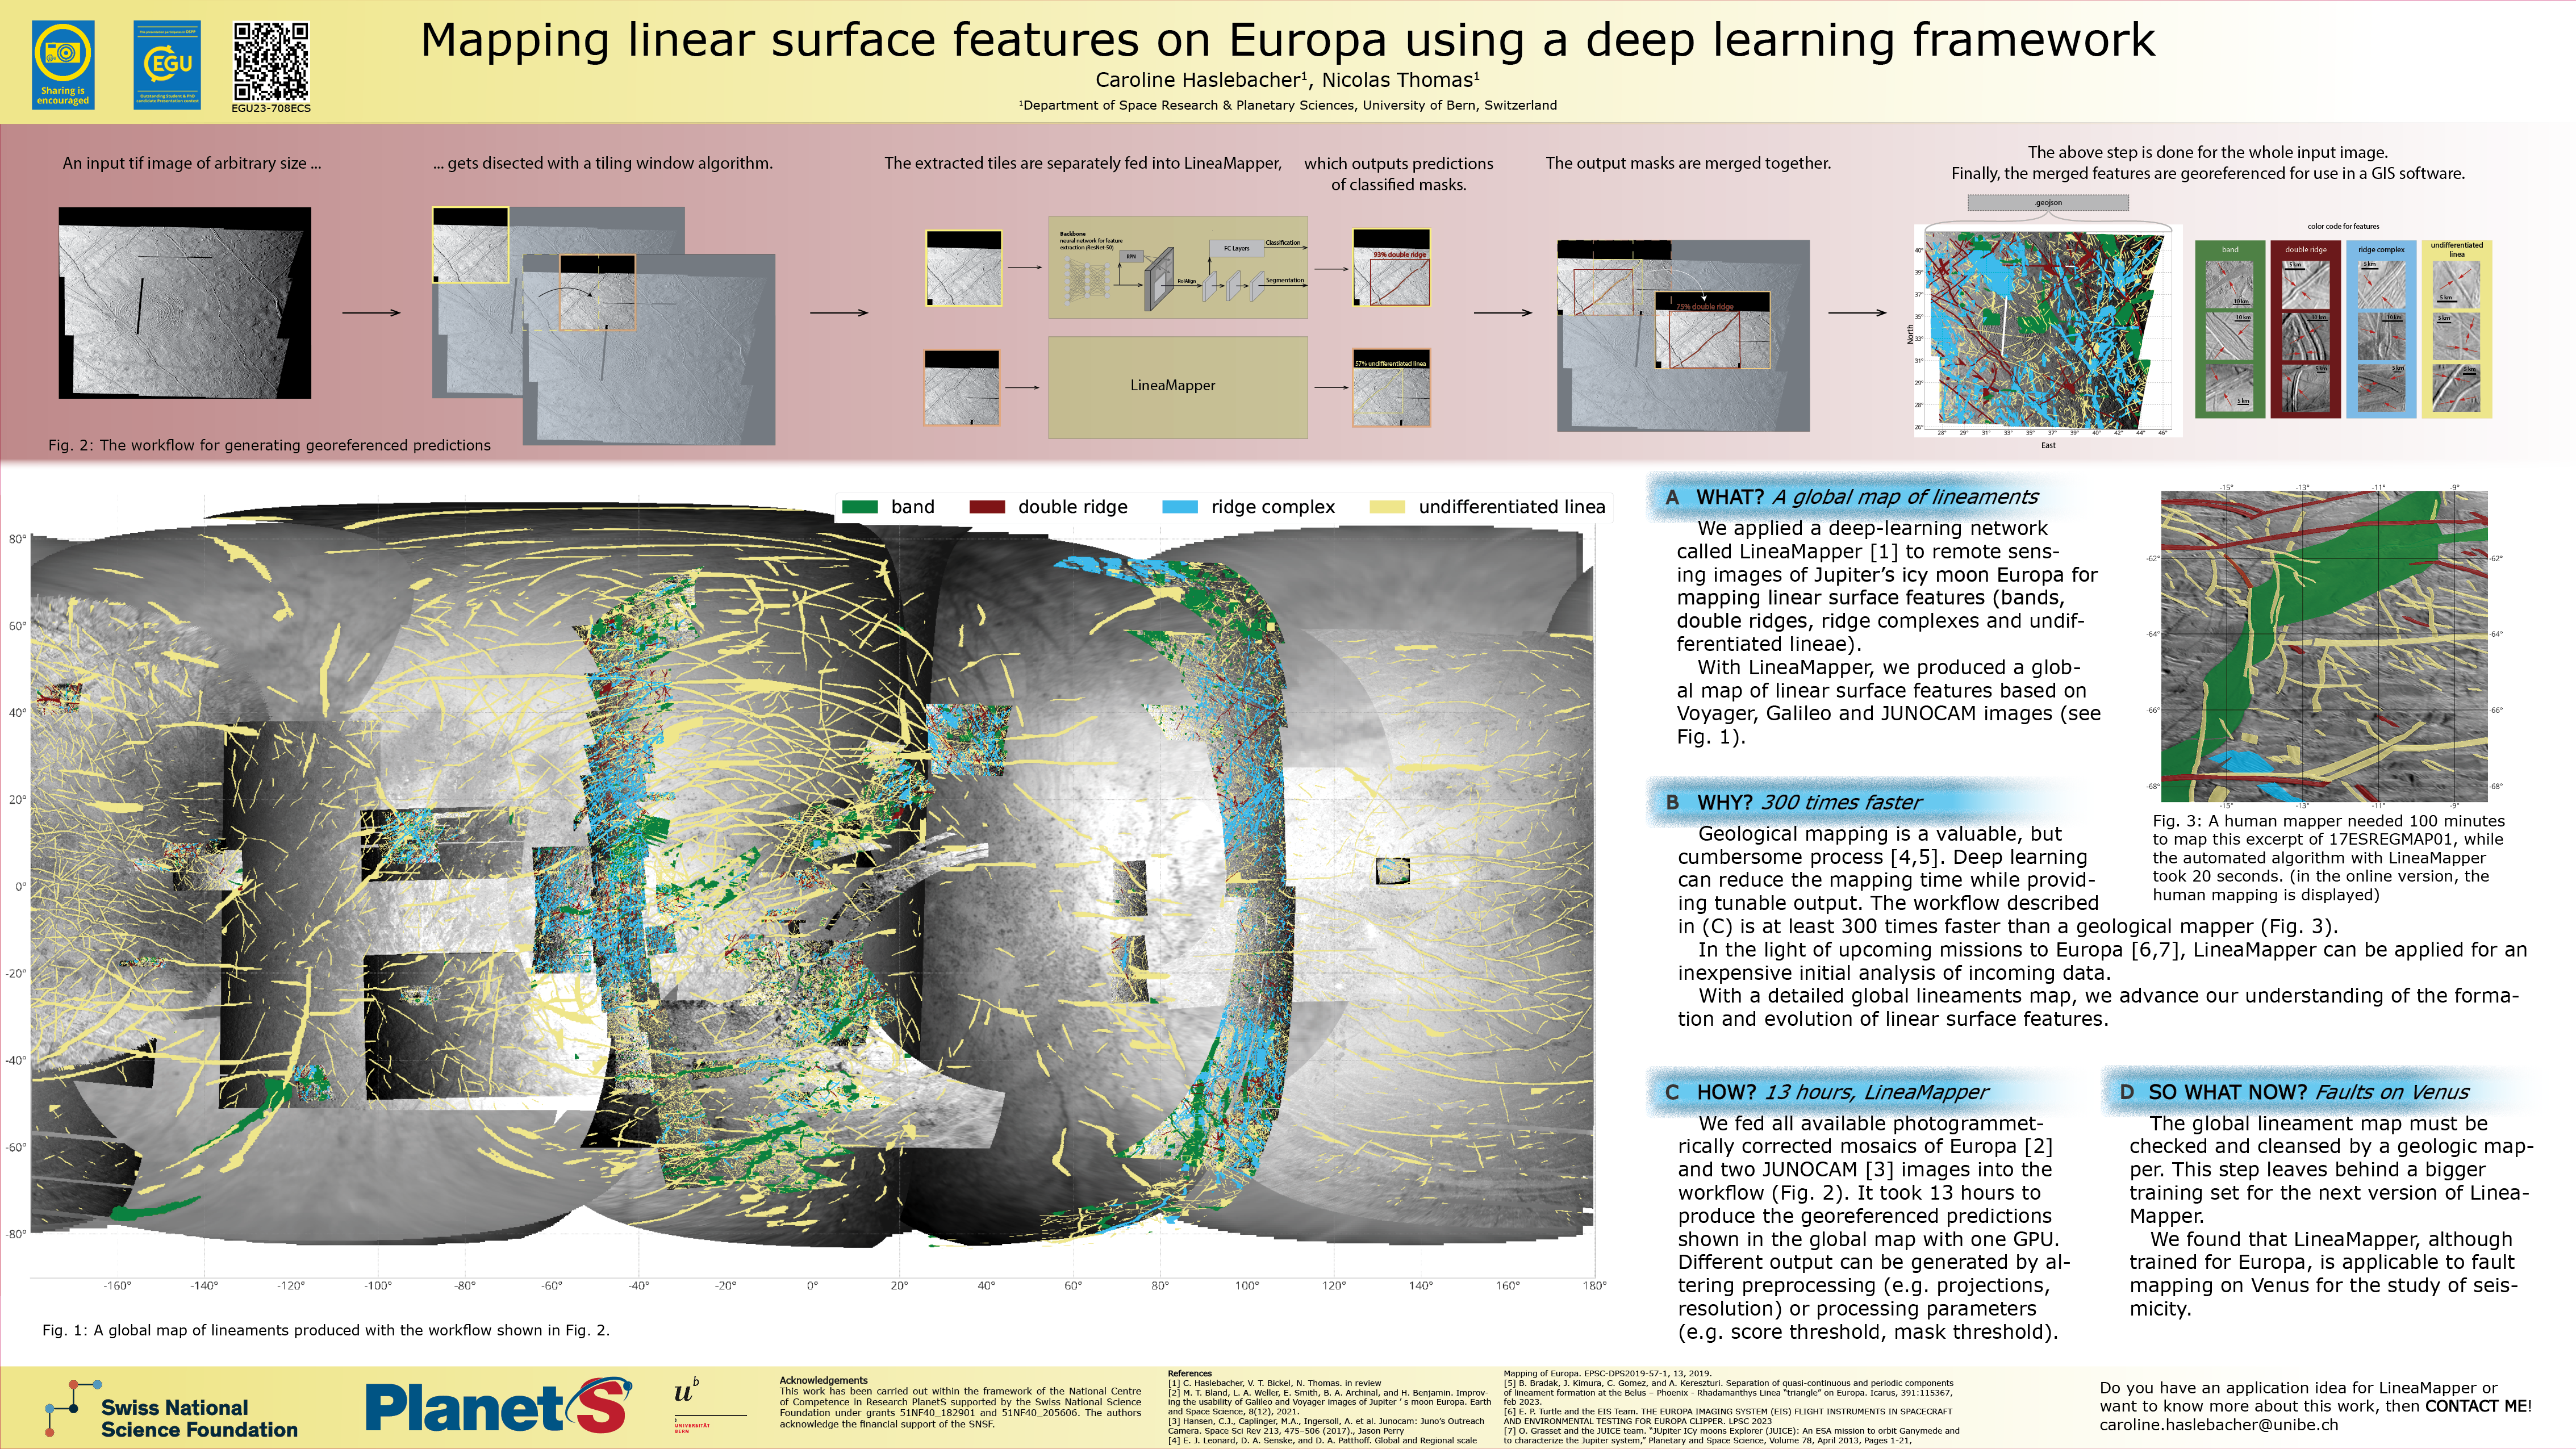
EGU23-3108 | ECS | Orals | TS13.1 | Highlight
A comparative study of magma ascent and storage below impact craters on terrestrial planetsEGU23-3719 | ECS | Posters on site | TS13.1
Newly discovered moonquakes from Apollo short-period seismometer dataEGU23-5378 | ECS | Orals | TS13.1
Geological mapping and structural analysis of the Michelangelo (H-12) quadrangle of Mercury

EGU23-11093 | ECS | Posters on site | TS13.1
Low-voluminous, mafic-dominated volcanism in Claritas Fossae, Thaumasia region on MarsEGU23-11631 | Orals | TS13.1 | Highlight
Planetary tectonics versus Earth tectonics: a comparative approach of working principlesEGU23-12423 | ECS | Posters on site | TS13.1
UPSIDES - Unravelling icy Planetary Surfaces: Insights on their tectonic DEformation from field SurveyEGU23-14136 | Posters on site | TS13.1
High-resolution magnetic investigation of hydrothermal circulation in the Danakil DepressionEGU23-14918 | ECS | Posters on site | TS13.1 | Highlight
The Marsquake Service since the InSight mission to MarsEGU23-15069 | Orals | TS13.1
Constraints on Martian Crustal Lithology from Seismic Velocities by InSightEGU23-3076 | ECS | PICO | GD3.2
Experimentally revisiting the REE partition coefficients between zircon and silicate meltEGU23-6480 | ECS | PICO | GD3.2
Melting relations for putative mantles of Mercury and the compositional diversity of the crustEGU23-7777 | ECS | PICO | GD3.2
Exploring the effects of terrestrial exoplanet bulk composition on long-term planetary evolution
EGU23-10101 | ECS | PICO | GD3.2
The Heterogeneous Earth Mantle: Numerical Models of Mantle Convection and their Synthetic Seismic SignatureEGU23-11284 | ECS | PICO | GD3.2
Basin evolution and crustal structure on Mercury from gravity and topography data


EGU23-11648 | ECS | PICO | GD3.2
Long-term effect of a basal magma ocean on Martian mantle convectionEGU23-12628 | ECS | PICO | GD3.2
The automatic detection of tectonic plates in 3D mantle convection models and plate motion changesEGU23-14366 | PICO | GD3.2
Exploration of the lunar deep interior through global deformation modeling.EGU23-14685 | ECS | PICO | GD3.2
Planet size controls the redistribution of heat producing elements and volatiles from mantle to crustEGU23-15144 | ECS | PICO | GD3.2
The behaviour of S in reduced systems and its application to MercuryPS5 – Physical, chemical and dynamical aspects of small bodies (dwarf planets, rocky & icy moons, asteroids, comets, KBOs, rings, meteors and interplanetary dust)
EGU23-3179 | ECS | Posters on site | PS5.1
Laboratory investigation of ion expansion produced by hypervelocity dust impactsEGU23-3325 | ECS | Posters on site | PS5.1
Bayesian inference of β-meteoroid parameters with Solar OrbiterEGU23-4008 | Posters on site | PS5.1
Measured mechanical, optical and electrical properties of dust partciles collected in the coma of comet 67/PEGU23-6180 | ECS | Orals | PS5.1
Machine learning detection of dust impact signals observed by the Solar OrbiterEGU23-6355 | ECS | Posters on site | PS5.1
Correlated Multi-Technique Characterisation of Sulfur-Bearing Serpentine in Carbonaceous Chondrites
EGU23-7896 | ECS | Posters on site | PS5.1
Comparison of Solitary waves and Dust Impact Signals Detected by Electric Field Instruments onboard MAVENEGU23-8212 | Posters on site | PS5.1
Generation and Expansion of the Impact Plasma Cloud after Dust Impacts on Solar Orbiter
EGU23-9586 | ECS | Orals | PS5.1
Covariance Analysis of Hera Radio Science Experiment including LIDAR Altimetric CrossoversEGU23-9801 | ECS | Orals | PS5.1
Contribution of multiple scattering to the distribution of Lyman alpha emission in comet comaeEGU23-11092 | ECS | Orals | PS5.1
O-bearing molecules in comet 67P revisited: evidence for abundant heterocyclesEGU23-11341 | Posters virtual | PS5.1
About the possibility of using AMATERAS data to check the detection of dangerous asteroidsEGU23-14828 | ECS | Posters on site | PS5.1
A Comparative Carbon XANES and EELS Study of Organic Matter in the Ivuna CI ChondriteEGU23-17070 | Posters on site | PS5.1
Wherever You Go, There You Are — Evolution of Cometary Dust Trails Produced by OutburstsEGU23-17435 | Posters on site | PS5.1
A discourse on the temperature measurement problem using meteor wind radarEGU23-969 | Posters on site | PS5.3
Lunar Mission Planning and Exploration using NASA’s Moon Trek PortalEGU23-3206 | Posters virtual | PS5.3
Exploration of Lunar magnetic fields with dynamo thermally and tidal heating-driven rheology model
EGU23-7979 | ECS | Posters on site | PS5.3
Estimation of the parameters of a lunar ellipsoid of revolution based on GRAIL selenoid data and Fibonacci meshEGU23-10526 | ECS | Orals | PS5.3
Lunar Vertex: A PRISM Science Investigation of the Reiner Gamma Lunar Magnetic Anomaly and SwirlEGU23-10755 | Posters on site | PS5.3
Radio Instrument Package for Lunar Ionospheric Observation: A Concept StudyEGU23-10887 | Orals | PS5.3
Are day-night heating cycles a trigger for launching the “stones” on tour?EGU23-11166 | ECS | Orals | PS5.3
Polar Ice Accumulation from Volcanically Induced Transient Atmospheres on the MoonEGU23-13387 | ECS | Orals | PS5.3
Instrumentation for laser ablation ionisation mass spectrometry on the lunar surfaceEGU23-13471 | ECS | Posters on site | PS5.3
Statistical Analysis of Lunar 1 Hz Waves Using ARTEMIS ObservationsEGU23-13668 | ECS | Posters on site | PS5.3
Urban seismic noise investigation at the site of ESA/DLR’s future LUNA facility at Cologne, Germany


EGU23-15933 | ECS | Orals | PS5.3
Orbit Determination and Time Transfer for a Lunar Radio Navigation SystemEGU23-16681 | Posters on site | PS5.3
Lunar plasma and electrostatic environment: numerical approach and its future prospectsEGU23-17528 | Posters on site | PS5.3
ILEWG/LUNEX EuroMoonMars & EuroSpaceHub Academy: Recent HighlightsEGU23-2134 | Orals | PS5.4
Deciphering the (Near-)Surface of Planets with Nadir-pointing Radar StatisticsEGU23-3916 | Posters on site | PS5.4 | Highlight
Moonquake-Triggered Mass Wasting Processes on Icy WorldsEGU23-4265 | ECS | Orals | PS5.4
Polar heat transport enhancement in sub-glacial oceans on icy moons
EGU23-4509 | Orals | PS5.4
The energetic ion environment around Ganymede to be investigated with JUICEEGU23-6132 | Posters virtual | PS5.4
Convection in Europa’s icy shell: the role of composite rheology and dynamic grain size evolutionEGU23-6345 | ECS | Posters on site | PS5.4
Ice Transit and Performance Analysis for Cryorobotic Subglacial Access Missions on Earth and Europa
EGU23-9149 | Posters on site | PS5.4
Airborne radar radiometry and coastline mapping of the highly-specular subglacial terrain on Devon islandEGU23-10554 | ECS | Posters on site | PS5.4
RIME-REASON synergistic opportunities for surface and near-surface investigations of icy moonsEGU23-11227 | ECS | Posters on site | PS5.4 | Highlight
Detecting Europa’s water plumes with the Particle Environment Package on JUICEEGU23-13378 | ECS | Posters on site | PS5.4
Modelling Europa’s collisional atmosphere using the DSMC methodEGU23-14516 | Orals | PS5.4 | Highlight
Molecular Biosignature Detection on Ocean Worlds using a Prototype Laser-Desorption Ionisation Mass SpectrometerEGU23-14989 | ECS | Posters on site | PS5.4
Hybrid concept for a forefield reconnaissance system for melting probes capable of moving through terrestrial and extraterrestrial cryospheresEGU23-16101 | ECS | Posters on site | PS5.4
Coupling of Induced Magnetic Fields of Local Asymmetric Features in Subsurface Ocean MoonsEGU23-16162 | ECS | Posters on site | PS5.4 | Highlight
Combining Earth cryosphere microwave radiometry and radar to understand the properties of planetary icesEGU23-17280 | ECS | Orals | PS5.4
Radar Interferometry and Tomography for the Exploration of Enceladus’ Surface and SubsurfaceEGU23-17371 | Orals | PS5.4
The TRIPLE project – Towards technology solutions for life detection missionsPS6 – Gas and ice giants: from sub-neptunes to super-jupiters, at home and abroad

EGU23-6543 | ECS | Orals | PS6.1
Coupling a photochemical model of Triton's atmosphere with an electron transport codeEGU23-7738 | ECS | Orals | PS6.1
Impact of methane abundance on storm formation on Uranus & Neptune, revealed by a cloud-resolving modelEGU23-9714 | ECS | Orals | PS6.1
Voyager 2 Radio Occultation of Triton revisited using modernized analysis toolsEGU23-10400 | Posters on site | PS6.1
Microphysical modeling of water ice aerosols in the ice giant atmospheresEGU23-12413 | Posters on site | PS6.1
Miniaturized Radiometer for an Ice Giants mission for haze and cloud characterizationEGU23-15111 | ECS | Posters on site | PS6.1
The Hydrogen Upper Atmosphere of Uranus Seen Through Lyman Alpha ObservationsEGU23-826 | ECS | PICO | PS6.2
Effect of Mushball on Jupiter's Ammonia Distribution: a General Circulation Model StudyEGU23-9404 | PICO | PS6.2 | Highlight
Water-group pickup ions from Europa: A window into surface ice evolutionEGU23-12293 | ECS | PICO | PS6.2
The effect of thermal non-equilibrium on aerosol formation in astrophysical environments
EGU23-1346 | ECS | Posters virtual | PS6.3
A Juno-era View of the Electric Currents in Jupiter's MagnetodiscEGU23-1511 | ECS | Orals | PS6.3
MHD simulations of Europa’s interaction with the jovian magnetosphere: insights from the Juno flybyEGU23-2468 * | Orals | PS6.3 | Highlight
High resolution imagery of Europa’s Surface by Juno’s Stellar Reference UnitEGU23-2727 | Posters on site | PS6.3
Jupiter’s hot spots as observed by JIRAM-Juno: limb-darkening in thermal infraredEGU23-4260 | Orals | PS6.3
Evidence of Fresh Injections Related to the Interchange Instability in the Io TorusEGU23-4314 | Posters on site | PS6.3
Exploring the Depth of Planetary-Scale Changes in Jupiter from Juno Microwave Radiometer ObservationsEGU23-6784 | Orals | PS6.3
Parallax measurements of Jupiter's cloud tops in JunoCam images, and applicationsEGU23-7025 | ECS | Posters virtual | PS6.3
Evidence for electrostatic and Alfvénic accelerations in the Europa footprint tail revealed by Juno in-situ measurementsEGU23-7806 | Posters on site | PS6.3
Juno Microwave Radiometer Observations of Europa’s Subsurface Ice ShellEGU23-9135 | Posters on site | PS6.3
Ionospheres of Ganymede and Europa Observed by Radio Occultation with JunoEGU23-9139 | Posters virtual | PS6.3
A public domain data-based modeling of long-term variability of Jupiter’s inner electron radiation beltEGU23-9336 | Orals | PS6.3
Global and Regional Numerical Modeling of Water and Ammonia Cycles on JupiterEGU23-9472 | ECS | Posters virtual | PS6.3
Spatial- and Temporal- Variations in Jupiter’s AtmosphereEGU23-9764 | ECS | Posters virtual | PS6.3
Plasma properties in Ganymede’s wake as observed by Juno/JADEEGU23-10194 | Orals | PS6.3
In situ ion composition observations of Ganymede’s outflowing ionosphereEGU23-10437 | Posters on site | PS6.3
Analysis of the Effect of Jupiter's Northern Aurora on Juno Microwave Radiometer ObservationsEGU23-11468 | Orals | PS6.3
µASC observations of Jovian energetic electrons interaction with Europa moonEGU23-11490 * | Orals | PS6.3 | Highlight
Comet dust tail detection by the Juno spacecraft’s magnetometer investigationEGU23-11952 | ECS | Orals | PS6.3
Jupiter and Saturn normal modes observed through Juno and Cassini gravity measurementsEGU23-12188 | Posters on site | PS6.3
Jovian synchrotron radiation multi-zonal parametric model: an update from Juno MWR observationsEGU23-12662 | ECS | Posters on site | PS6.3
The Jovian ionospheric conductivity derived from a broadband precipitated electron distributionEGU23-14420 | ECS | Orals | PS6.3
The Structure of the warped Io Plasma Torus constrained by the Io FootprintEGU23-14691 | Orals | PS6.3
Jupiter’s magnetodisc and magnetospheric currents during Juno’s prime mission.EGU23-14801 | ECS | Posters on site | PS6.3
The Role of Vortex Shielding on Polar Crystal Formation & Vortex Dynamics on JupiterEGU23-15308 | ECS | Orals | PS6.3
The Effects of a Stably Stratified Region on the Formation of Zonal Winds on Gas PlanetsEGU23-15858 | ECS | Posters on site | PS6.3
Response of the Jovian radio emission to magnetospheric disturbances inferred from in situ Juno observations.EGU23-16574 | Orals | PS6.3
Global Model of Chorus Waves and Electron Lifetime Derived From Juno ObservationsEGU23-17176 | ECS | Posters on site | PS6.3
Chandra Long-Exposure Observations of Jupiter’s X-ray Auroral Emissions Near Juno Apojove 2021EGU23-17178 | Orals | PS6.3
How high are Jupiter’s clouds? Analysis of JunoCam images of the “Nautilus”PS8 – Life in the cosmos
EGU23-663 | ECS | Orals | PS8.1
Stability of organic species in ocean world interiors with geochemical models
EGU23-2787 | ECS | Posters on site | PS8.1
Chemical identification of fossil filament entrapped in Messinian gypsum using space Laser Mass Spectrometry, application for Mars astrobiology.EGU23-5257 | Posters on site | PS8.1
Total stellar irradiance and lithophile element devolatilization trends for the terrestrial planetsEGU23-5425 | Orals | PS8.1 | Highlight
Detection of phosphate in Enceladus’ ocean with implications for geochemistry and habitability in the outer solar systemEGU23-5578 | Posters on site | PS8.1
Interior heating of rocky exoplanets from stellar flares with application to Trappist-1 and Proxima CentauriEGU23-6149 | ECS | Orals | PS8.1 | Highlight
Looking for biosignatures in a pristine Mars analogue environment on EarthEGU23-8065 | Posters on site | PS8.1
Temperate exoplanets observable with Ariel : an update with new targets from TESSEGU23-10768 | ECS | Orals | PS8.1
Four-phase modelling of metal-silicate differentiation in planetesimalsEGU23-11114 | ECS | Posters on site | PS8.1
Abiotic factors affecting the presence of airborne halophilic microorganisms in the extreme atmospheric conditions of an underground salt mineEGU23-11232 | ECS | Posters on site | PS8.1
The Effect of Nonlinear Viscoelasticity on Planetary Love NumbersEGU23-11789 | ECS | Orals | PS8.1 | Highlight
Investigation of the Influence of Stellar Particle Events and Galactic Cosmic Rays on the Atmosphere of TRAPPIST-1eEGU23-13456 | Orals | PS8.1 | Highlight
The LIFE initiative - establishing a space mission to search for biosignatures in exoplanet atmsopheres in the mid-infraredEGU23-13634 | ECS | Posters on site | PS8.1
Large Interferometer for Exoplanets (LIFE): characterizing the mid-infrared thermal emission of terrestrial exoplanet atmospheresEGU23-14069 | ECS | Posters on site | PS8.1
Exploring hemispheric tectonics on tidally locked super-EarthsEGU23-15078 | ECS | Posters on site | PS8.1
Space environment and Poynting fluxes around the Trappist-1 exoplanets and effects of coronal mass ejections on their habitabilityEGU23-15251 | Posters on site | PS8.1
Atmospheric lifetime from a hypothetical Mars-sized planet orbiting Barnard’s StarEGU23-15340 | Posters on site | PS8.1
The host star as a crucial factor for the prevalence of Earth-like HabitatsEGU23-16508 | Posters on site | PS8.1
A Comprehensive and Self-consistent Model of Terrestrial Planet FormationEGU23-16709 | Posters on site | PS8.1
Outgassing efficiency and atmopsheric composition should differ for mobile-lid and stagnant-lid planetsEGU23-16843 | ECS | Posters on site | PS8.1
Scattering of Giant Planets Around M-dwarf: The Implication for the Origin of the Hierarchical and Eccentric Two-planet System like GJ 1148EGU23-17476 | Posters on site | PS8.1
Effect of energetic particles on the atmosphere of terrestrial exoplanetsEGU23-17577 | ECS | Posters on site | PS8.1
N-body interactions in proto-planetary disks: A study of collision velocities and impact angles